2017 semi-annual report ishares msci india index etf ...2017 semi-annual report ishares msci india...
TRANSCRIPT

2017 Semi-annual ReportiShares MSCI India Index ETFiShares J.P. Morgan USD Asia Credit Bond Index ETFiShares Barclays USD Asia High Yield Bond Index ETF(Sub-funds of iShares Southeast Asia Trust)
30 June 2017

Manager’s Investment Report 1
Financial StatementsStatements of Total Return 22Statements of Financial Position 23Statements of Movements of Unitholders’ Funds 24Statements of Portfolio 25Supplementary Notes 56
Management and Administration 64
iShares Southeast Asia Trust
Contents

1 iShares Southeast Asia Trust
Manager’s Investment Report
iShares MSCI India Index ETF(a Sub-Fund of iShares Southeast Asia Trust)
IntroductioniShares MSCI India Index ETF (“MSCI India ETF”), a sub-fund of the iShares Southeast Asia Trust (the “Trust”), was launched and commenced trading on 15 June 2006 on the Singapore Exchange Securities Trading Limited (“SGX-ST”) under the trading name of “IS MS INDIA 100US$” and Exchange ticker of “I98”. Effective on 15 June 2012, other than the US dollar, the MSCI India ETF is also traded in Singapore dollars on SGX-ST. The Singapore dollar trading line of MSCI India ETF is under the trading name of “IS MS INDIA 100S$D” and Exchange ticker of “QK9”.
The MSCI India ETF was established as an authorised scheme under the Securities and Futures Act, Chapter 289 of Singapore and obtained designation of an exchange traded fund (“ETF”) from the SGX-ST. MSCI India ETF is benchmarked against the MSCI India Index. The Manager of MSCI India ETF is BlackRock (Singapore) Limited (the “Manager”). The Manager has appointed the Hong Kong domiciled BlackRock Asset Management North Asia Limited (the “Sub-Manager”) as the sub-manager of the MSCI India ETF under a sub-management agreement entered into between the Manager and the Sub-Manager (the “Sub-Management Agreement”). Under the Sub-Management Agreement, the Manager has discretion to delegate its investment management functions of MSCI India ETF to the Sub-Manager.
The MSCI India ETF invests in the Indian market via the Mauritius subsidiary. The Mauritius subsidiary is registered as a sub-account of the Manager, which is registered as a Foreign Portfolio Investor (“FPI”) with the Securities Exchange Board of India, allowing the Mauritius subsidiary to invest directly in Indian securities.
India Tax Law ChangesOn 10 May 2016, the Indian Tax Board announced a phased removal of the capital gains tax (“CGT”) exemption under the India-Mauritius Tax Treaty. The change, effective from 1 April 2017, resulted in India retaining taxation rights on capital gains arising from sales of shares of Indian resident companies acquired by a Mauritius entity on or after 1 April 2017. Shares acquired prior to 1 April 2017 would still be protected from taxing rights in India. There is a transition period from 1 April 2017 to 31 March 2019 where the tax rate will be limited to 50% of India’s domestic tax rate subject to a limitation of benefits clause. Taxation in India at the full domestic tax rate will apply from financial year 2019 - 2020 onwards.
The returns of the MSCI India ETF via its holdings in Indian investments may as a result be adversely impacted by India Tax Law Changes.
The Manager will continue monitor the impact of the India Tax Law Changes on the MSCI India ETF and the Mauritius subsidiary.

iShares Southeast Asia Trust 2
Manager’s Investment Report
iShares MSCI India Index ETF(a Sub-Fund of iShares Southeast Asia Trust)
A. Fund Performance1
MSCI India ETF seeks to provide investment results that closely correspond to the performance of the MSCI India Index before fees and expenses. MSCI India ETF invests into the Indian market through its wholly owned Mauritius Subsidiary which invests in Indian securities.
At the close of 30 June 2017, the NAV per unit (based on the last traded prices of the investments) of the MSCI India ETF was US$8.03 and 38,500,000 units were outstanding. The total size of the MSCI India ETF was approximately US$309.2 million.
A summary of the performance of MSCI India ETF is given below:
Total Return2 in US$as of 30 June 2017 1-Month 3-Month 6-Month 1-Year
3-Year (Annualised)
5-Year (Annualised)
SinceInception3
(Annualised)
Net DIV MSCI India Total Return Index in US$4
-0.78% 2.91% 20.53% 17.47% 4.27% 9.03% 8.36%
Fund NAV Return in US$5 -0.87% 2.62% 20.01% 16.32% 3.31% 8.13% 6.99%
Fund Price Return (MKT) in US$6
-1.47% 2.30% 19.70% 15.73% 3.52% 8.11% 7.00%
As of 30 June 2017, MSCI India Index consists of 77 constituents and 77 out of 77 are large capitalisation India companies. The difference in performance between the MSCI India Index and MSCI India ETF can be largely explained by the MSCI India ETF’s expenses.
1 PastperformancefiguresshownarenotindicativeofthefutureperformanceoftheFund.2Totalreturnsrepresenttheratethataninvestorwouldhaveearned(orlost)onaninvestment,assumingreinvestmentofalldividendsanddistributions.3Thisisannualisedreturnsincefundinceptionandfundinceptiondateis15June2006.4Aninvestorcannotinvestdirectlyinanindexandtheindexperformancereturnsdonotreflectmanagementfees,transactioncostsorotherexpenses,whichwould
reduceperformancereturns.5UnitsintheFundareissuedandredeemedattheirNAVinexchangeforabasketofsecuritiesrepresentingtheMSCIIndiaIndex.Therefore,theFunddoesnotpublish
abidpriceandtheFund’sreturnshavebeencalculatedfromNAVs;andassumingreinvestmentofalldividends.6Marketreturnsarecalculatedusinghistoricalmarketclosingprices(whenNAVisnormallydeterminedfortheFund),anddonotrepresentthereturnsyouwould
receiveifyoutradedsharesatothertimes.Source:BlackRockandMSCI

3 iShares Southeast Asia Trust
Manager’s Investment Report
iShares MSCI India Index ETF(a Sub-Fund of iShares Southeast Asia Trust)
Fund ActivitiesThe average daily trading volume for MSCI India ETF during the period was reported by Bloomberg to be approximately 253,367 units.
Index ActivitiesMSCI India Index underwent 2 regular reviews during the period from 1 January 2017 to 30 June 2017. As at 30 June 2017, MSCI India ETF had exposure to all index constituents in the MSCI India Index.
Sector WeightsAs of 30 June 2017, the index sector weights, as represented by holdings of the Mauritius Subsidiary, are listed below.
SectorIndex Weights
%Portfolio Weights
%
Consumer Discretionary 12.66 12.64
Consumer Staples 9.85 9.86
Energy 10.95 10.98
Financial 24.09 24.09
Health Care 7.39 7.39
Industrial 6.02 6.02
Information Technology 14.31 14.31
Materials 9.77 9.81
Telecommunication 2.95 2.89
Utilities 2.01 2.01

iShares Southeast Asia Trust 4
Manager’s Investment Report
iShares MSCI India Index ETF(a Sub-Fund of iShares Southeast Asia Trust)
B. Distribution of Investments of the MSCI India ETF as at 30 June 2017
Fair ValueUS$
Percentage of Total Net Assets
Attributable to Unitholders
%
1 By Asset Class
Listed Equities 308,860,761 99.88
OtherNetAssets7 385,738 0.12
NetAssetsAttributabletoUnitholders (AtLastTradedPrices) 309,246,499 100.00
2 By Credit Rating of Fixed Income Securities
Not Applicable
3 By Derivative Type
Not Applicable
7OthernetassetsincludethecashandbankbalancesofUS$894,760

5 iShares Southeast Asia Trust
Manager’s Investment Report
iShares MSCI India Index ETF(a Sub-Fund of iShares Southeast Asia Trust)
C. Top 10 Holdings1 largest holding as at 30 June 2017*
Fair Value as at30 June 2017
US$
Percentage of Total Net Assets
Attributable to Unitholders
as at 30 June 2017
%
iShares MSCI India Mauritius Co 308,860,761 99.88
*Therewasonly1holdingasat30June2017
1 largest holding as at 30 June 2016*
Fair Value as at30 June 2016
US$
Percentage of Total Net Assets
Attributable to Unitholders
as at 30 June 2016
%
iShares MSCI India Mauritius Co 475,917,375 99.87
*Therewasonly1holdingasat30June2016

iShares Southeast Asia Trust 6
Manager’s Investment Report
iShares MSCI India Index ETF(a Sub-Fund of iShares Southeast Asia Trust)
D. Global ExposureNot applicable.
E. CollateralNil.
F. Securities Lending or Repurchase TransactionsNil.
G. Investment in Other Unit Trusts, Mutual Funds and Collective Investment SchemesNil.
H. BorrowingsNil.
I. Soft Dollar Commission Received by the ManagersDuring the six month period ended 30 June 2017, the Manager confirmed that no soft dollar commission arrangements existed in relation to directing transactions of MSCI India ETF through a broker or dealer.
J. Other Material InformationThere is no other material information that will adversely impact the valuation of MSCI India ETF.

7 iShares Southeast Asia Trust
Manager’s Investment Report
iShares MSCI India Index ETF(a Sub-Fund of iShares Southeast Asia Trust)
K. Supplemental Information on Underlying Sub-FundsiShares MSCI India Mauritius Co
(i) 10 largest holdings
As at 30 June 2017
Fair Value as at30 June 2017
US$
Percentage of Total Net Assets
Attributable to Unitholders
as at 30 June 2017
%
Housing Development Finance 28,124,603 9.11
Reliance Industries Limited 20,697,662 6.70
Infosys Ltd 19,871,335 6.43
Tata Consultancy Services Ltd 12,899,756 4.18
I.T.C Limited 12,706,583 4.11
Axis Bank Limited 10,013,743 3.24
Maruti Suzuki India Limited 8,820,574 2.86
Hindustan Unilever Limited 8,102,441 2.62
ICICI Bank Limited 7,947,208 2.57
Tata Motors Limited 7,904,722 2.56

iShares Southeast Asia Trust 8
Manager’s Investment Report
iShares MSCI India Index ETF(a Sub-Fund of iShares Southeast Asia Trust)
As at 30 June 2016
Fair Value as at30 June 2016
US$
Percentage of Total Net Assets
Attributable to Unitholders
as at 30 June 2016
%
Infosys Ltd 48,196,335 10.13
Housing Development Finance 42,135,317 8.85
Reliance Industries Limited 28,134,484 5.91
Tata Consultancy Services Ltd 27,047,692 5.68
I.T.C Limited 18,580,733 3.90
Sun Pharmaceutical Industry Limited 16,456,922 3.46
Tata Motors Limited 16,265,656 3.42
Hindustan Unilever Limited 13,067,296 2.75
Mahindra & Mahindra Limited 11,937,662 2.51
Larsen & Toubro Limited 10,617,423 2.23
(ii) ExpenseRatio
As at 30 June 2017 0.16%
As at 30 June 2016 0.15%
The expense ratio has been computed based on the guidelines laid down by the Investment Management Association of Singapore (“IMAS”). The calculation of the expense ratio at 30 June 2017 and 30 June 2016 was based on total operating expenses divided by the average net asset value for the year. The total operating expenses do not include (where applicable) brokerage and other transactions costs, performance fee, interest expense, distribution paid out to unitholders, foreign exchange gains/losses, front or back end loads arising from the purchase or sale of other funds and tax deducted at source or arising out of income received. The Fund does not pay any performance fee. The average net asset value is based on the daily balances.

9 iShares Southeast Asia Trust
Manager’s Investment Report
iShares MSCI India Index ETF(a Sub-Fund of iShares Southeast Asia Trust)
(ii) TurnoverRatio(unaudited)
As at 30 June 2017 5.47%
As at 30 June 2016 8.73%
The portfolio turnover ratio is calculated in accordance with the formula stated in the Code on Collective Investment Schemes. The calculation of the portfolio turnover ratio was based on the lower of the total value of purchases or sales of the underlying investment divided by the average daily net asset value.

iShares Southeast Asia Trust 10
Manager’s Investment Report
iShares J.P. Morgan USD Asia Credit Bond Index ETF(a Sub-Fund of iShares Southeast Asia Trust)
IntroductioniShares J.P. Morgan USD Asia Credit Bond Index ETF (the “USD Asia Credit Bond ETF”), a sub-fund of the iShares Southeast Asia Trust (the “Trust”), was launched and commenced trading on 2 June 2011 on the Singapore Exchange Securities Trading Limited (“SGX-ST”) under the trading name of “IS ASIA BND 100US$” and Exchange ticker of “N6M”. Effective on 15 June 2012, other than the US dollar, the USD Asia Credit Bond ETF is also traded in Singapore dollars on SGX-ST. The Singapore dollar trading line of the USD Asia Credit Bond ETF is under the trading name of “IS ASIA BND 100S$D” and Exchange ticker of “QL2”.
The USD Asia Credit Bond ETF was established as an authorised scheme under the Securities and Futures Act, Chapter 289 of Singapore and obtained designation of an exchange traded fund (“ETF”) from the SGX-ST. The USD Asia Credit Bond ETF is benchmarked against the J.P. Morgan Asia Credit Index - Core (the “JACI Core”). The JACI Core consists of liquid US dollar denominated debt instruments issued out of Asia ex Japan by Asia-domiciled sovereigns, quasi-sovereigns and corporates. The Manager of the USD Asia Credit Bond ETF is BlackRock (Singapore) Limited.
A. Fund Performance1
The USD Asia Credit Bond ETF seeks to provide investment results that, before fees and expenses, closely correspond to the performance of the JACI Core in US dollar terms.
At the close of 30 June 2017, the NAV per unit (based on the bid prices of the investments) of the USD Asia Credit Bond ETF was US$10.72 and 3,624,754 units were outstanding. The total size of the USD Asia Credit Bond ETF was approximately US$38.8 million.
A summary of the performance of the USD Asia Credit Bond ETF is given below:
Total Return2 in US$ as of 30 June 2017 1-Month 3-Month 6-Month 1-Year
3-Year (Annualised)
5-Year (Annualised)
SinceInception3
(Annualised)
JACI Core Total Return Index in US$4
0.34% 1.46% 4.47% 3.09% 5.03% 5.32% 5.76%
Fund NAV Return in US$5 0.30% 1.40% 4.42% 3.06% 5.04% 5.21% 5.62%
Fund Price Return (MKT) in US$6
0.46% 1.21% 4.80% 3.40% 5.42% 5.26% 5.55%
1PastperformancefiguresshownarenotindicativeofthefutureperformanceoftheFund.2Totalreturnsrepresenttheratethataninvestorwouldhaveearned(orlost)onaninvestment,assumingreinvestmentofalldividendsanddistributions.3Thisisannualisedreturnsincefundinceptionandfundinceptiondateis27May2011.4Aninvestorcannotinvestdirectlyinanindexandtheindexperformancereturnsdonotreflectmanagementfees,transactioncostsorotherexpenses,whichwould
reduceperformancereturns.5UnitsintheFundareissuedandredeemedattheirNAV.Therefore,theFunddoesnotpublishabidpriceandtheFund’sreturnshavebeencalculatedfromNAVs.6Marketreturnsarecalculatedusinghistoricalmarketclosingprices(whenNAVisnormallydeterminedfortheFund),anddonotrepresentthereturnsyouwould
receiveifyoutradedsharesatothertimes.Intheeventthereisnotradinginthemarketonthelastdayoftheperiodthereturniscalculatedtothelasttradedpriceintheperiod.
Source:BlackRockandJ.P.Morgan

11 iShares Southeast Asia Trust
Manager’s Investment Report
iShares J.P. Morgan USD Asia Credit Bond Index ETF(a Sub-Fund of iShares Southeast Asia Trust)
As of 30 June 2017, the JACI Core consists of 787 bonds denominated in US dollars which are issued by Asia-domiciled sovereigns, quasi-sovereigns and corporates. The difference in performance between the USD Asia Credit Bond ETF and the JACI Core can be largely explained by the fees and expenses of the USD Asia Credit Bond ETF and security misweights due to the use of representative sampling.
Fund ActivitiesThe average daily trading volume for the USD Asia Credit Bond ETF during the period was reported by Bloomberg to be approximately 18,853 units.
Index ActivitiesThe JACI Core is rebalanced monthly. As at 30 June 2017, the USD Asia Credit Bond ETF held 174 bonds versus the 787 constituents in the JACI Core.
Sector WeightsAs of 30 June 2017, the index sector weights are listed below.
SectorIndex Weights
%Portfolio Weights
%
Consumer 2.84 2.68
Financial 17.57 16.55
Industrial 14.26 15.43
Media & Telecom 5.01 4.76
Oil & Gas 8.11 8.03
Government Related 48.44 45.56
Utilities 4.37 5.22

iShares Southeast Asia Trust 12
Manager’s Investment Report
iShares J.P. Morgan USD Asia Credit Bond Index ETF(a Sub-Fund of iShares Southeast Asia Trust)
B. Distribution of Investments of the USD Asia Credit Bond ETF as at 30 June 2017
Fair ValueUS$
Percentage of Total Net Assets
Attributable to Unitholders
%
1 By Asset Class
Debt Securities 38,624,091 99.42
OtherNetAssets7 223,649 0.58
NetAssetsAttributabletoUnitholders (AtBidMarketPrices)
38,847,740 100.00
Fair ValueUS$
Percentage of Total Assets
Attributable to Unitholders as at
30 June 2017%
2 By S&P, Moody’s or Fitch Credit Rating of Debt Securities
AAA 711,990 1.84
AA 3,204,092 8.24
AA- 993,670 2.56
A+ 1,621,228 4.18
A 1,354,995 3.49
A3 403,388 1.04
A- 4,244,115 10.92
BBB+ 4,039,035 10.39
Baa1 407,229 1.04
BBB 4,447,918 11.44
Baa2 190,188 0.49
BBB- 7,261,351 18.69
Baa3 543,194 1.40
BB+ 713,256 1.84
7OthernetassetsincludethecashandbankbalancesofUS$102,257

13 iShares Southeast Asia Trust
Manager’s Investment Report
iShares J.P. Morgan USD Asia Credit Bond Index ETF(a Sub-Fund of iShares Southeast Asia Trust)
Fair ValueUS$
Percentage of Total Assets
Attributable to Unitholders as at
30 June 2017%
2 By S&P, Moody’s or Fitch Credit Rating of Debt Securities (Continued)
Ba3 101,375 0.26
BB 854,566 2.21
BB- 639,004 1.64
B+ 2,442,242 6.28
B 952,844 2.46
B- 282,000 0.73
B3 90,550 0.23
CCC 76,300 0.20
Unrated 2,585,109 6.66
Accrued Interest Receivable on Debt Securities 464,452 1.19
3 By Derivative Type
Not Applicable
C. Top 10 Holdings10 largest holdings as at 30 June 2017
Fair Value at30 June 2017
US$
Percentage of Total Net Assets
Attributable to Unitholders
as at 30 June 2017
%
Republic of Philippines 3.7% Due 01/03/2041 783,719 2.02
Republic of Philippines 6.375% Due 23/10/2034 603,477 1.55
Singtel Group Treasury P Series Emtn 3.25% Due 30/06/2025 406,717 1.05
1MDB Global Investments Series 4.4% Due 09/03/2023 369,500 0.95
Republic of Korea 2.75% Due 19/01/2027 344,451 0.89
Pertamina 6.5% Due 27/05/2041 341,961 0.88

iShares Southeast Asia Trust 14
Manager’s Investment Report
iShares J.P. Morgan USD Asia Credit Bond Index ETF(a Sub-Fund of iShares Southeast Asia Trust)
Fair Value at30 June 2017
US$
Percentage of Total Net Assets
Attributable to Unitholders
as at 30 June 2017
%
Export-Import Bank of Korea 5% Due 11/04/2022 330,633 0.85
Republic of Philippines 4.2% Due 21/01/2024 328,212 0.84
Republic of Philippines 7.75% Due 14/01/2031 324,257 0.83
Republic of Indonesia 6.75% Due 15/01/2044 321,975 0.83
10 largest holdings as at 30 June 2016
Fair Value at30 June 2016
US$
Percentage of Total Net Assets
Attributable to Unitholders
as at 30 June 2016
%
Republic of Philippines 9.5% Due 02/02/2030 1,370,000 1.95
Republic of Philippines 7.75% Due 14/01/2031 1,085,343 1.55
Republic of Philippines 6.375% Due 15/01/2032 1,058,130 1.51
Republic of Indonesia 8.5% Due 12/10/2035 857,538 1.22
Republic of Indonesia 6.75% Due 15/01/2044 826,127 1.18
Republic of Indonesia 7.75% Due 17/01/2038 814,674 1.16
1MDB Global Investments Series 4.4% Due 09/03/2023 694,000 0.99
Republic of Sri Lanka 6.85% Due 03/11/2025 680,687 0.97
Hutchison Whampoa International 11 Limited 4.625% Due 13/01/2022
671,144 0.96
Republic of Philippines 6.375% Due 23/10/2034 653,679 0.93

15 iShares Southeast Asia Trust
Manager’s Investment Report
iShares J.P. Morgan USD Asia Credit Bond Index ETF(a Sub-Fund of iShares Southeast Asia Trust)
D. Global ExposureNot applicable.
E. CollateralNil.
F. Securities Lending or Repurchase TransactionsNil.
G. Investment in Other Unit Trusts, Mutual Funds and Collective Investment SchemesNil.
H. BorrowingsNil.
I. Soft Dollar Commission Received by the ManagersDuring the six month period ended 30 June 2017, the Manager confirmed that no soft dollar commission arrangements existed in relation to directing transactions of the USD Asia Credit Bond ETF through a broker or dealer.
J. Other Material InformationThere is no other material information that will adversely impact the valuation of the USD Asia Credit Bond ETF.
K. Supplemental Information on Underlying Sub-FundsNot applicable.

iShares Southeast Asia Trust 16
Manager’s Investment Report
iShares Barclays USD Asia High Yield Bond Index ETF(a Sub-Fund of iShares Southeast Asia Trust)
IntroductioniShares Barclays USD Asia High Yield Bond Index ETF (the “USD Asia High Yield Bond ETF”), a sub-fund of the iShares Southeast Asia Trust (the “Trust”), was launched and commenced trading on 8 December 2011 on the Singapore Exchange Securities Trading Limited (“SGX-ST”) under the trading name of “IS ASIA HYG100US$” and Exchange ticker of “O9P”. Effective on 15 June 2012, other than the US dollar, the USD Asia High Yield Bond ETF is also traded in Singapore dollars on SGX-ST. The Singapore dollar trading line of the USD Asia High Yield Bond ETF is under the trading name of “IS ASIA HYG100S$D” and Exchange ticker of “QL3”.
The USD Asia High Yield Bond ETF was established as an authorised scheme under the Securities and Futures Act, Chapter 289 of Singapore and obtained designation of an exchange traded fund (“ETF”) from the SGX-ST. The USD Asia High Yield Bond ETF is benchmarked against the Bloomberg Barclays Asia USD High Yield Diversified Credit Index (the “BAHY Index”). The BAHY Index consists of fixed-rate US dollar-denominated government-related and corporate high yield debt of the Asia ex-Japan region. Issuer exposures are capped at 4% of the overall index market value for diversification. The Manager of the USD Asia High Yield Bond ETF is BlackRock (Singapore) Limited.
A. Fund Performance1
The USD Asia High Yield Bond ETF seeks to provide investment results that, before fees and expenses, closely correspond to the performance of the BAHY Index in US dollar terms.
At the close of 30 June 2017, the NAV per unit (based on the bid prices of the investments) of the USD Asia High Yield Bond ETF was US$10.73 and 6,582,059 units were outstanding. The total size of the USD Asia High Yield Bond ETF was approximately US$70.7 million.
A summary of the performance of the USD Asia High Yield Bond ETF is given below:
Total Return2 in US$ as of 30 June 2017 1-Month 3-Month 6-Month 1-Year
3-Year (Annualised)
5-Year (Annualised)
SinceInception3
(Annualised)
BAHY Total Return Index in US$4
-0.01% -0.21% 3.40% 6.86% 6.30% 7.60% 8.79%
Fund NAV Return in US$5 -0.01% -0.20% 3.38% 6.58% 6.10% 7.34% 8.47%
Fund Price Return (MKT) in US$6
-0.83% -0.47% 3.44% 6.94% 6.68% 7.39% 8.37%
1 PastperformancefiguresshownarenotindicativeofthefutureperformanceoftheFund.2Totalreturnsrepresenttheratethataninvestorwouldhaveearned(orlost)onaninvestment,assumingreinvestmentofalldividendsanddistributions.3Thisisannualisedreturnsincefundinceptionandfundinceptiondateis5December2011.4Aninvestorcannotinvestdirectlyinanindexandtheindexperformancereturnsdonotreflectmanagementfees,transactioncostsorotherexpenses,whichwould
reduceperformancereturns.5UnitsintheFundareissuedandredeemedattheirNAV.Therefore,theFunddoesnotpublishabidpriceandtheFund’sreturnshavebeencalculatedfromNAVs.6Marketreturnsarecalculatedusinghistoricalmarketclosingprices(whenNAVisnormallydeterminedfortheFund),anddonotrepresentthereturnsyouwould
receiveifyoutradedsharesatothertimes.Intheeventthereisnotradinginthemarketonthelastdayoftheperiodthereturniscalculatedtothelasttradedpriceintheperiod.
Source:BlackRockandBarclays

17 iShares Southeast Asia Trust
Manager’s Investment Report
iShares Barclays USD Asia High Yield Bond Index ETF(a Sub-Fund of iShares Southeast Asia Trust)
As of 30 June 2017, the BAHY Index consists of 189 bonds denominated in US dollar which are issued by Asia-domiciled sovereigns, quasi-sovereigns and corporates. The difference in performance between the USD Asia High Yield Bond ETF and the BAHY Index can be largely explained by the fees and expenses of the USD Asia High Yield Bond ETF and security misweights due to the use of representative sampling.
Fund ActivitiesThe average daily trading volume for the USD Asia High Yield Bond ETF during the period was reported by Bloomberg to be approximately 19,642 units.
Index ActivitiesThe BAHY Index is rebalanced monthly. As at 30 June 2017, the USD Asia High Yield Bond ETF held 181 bonds versus the 189 constituents in the BAHY Index.
Sector WeightsAs of 30 June 2017, the index sector weights are listed below.
SectorIndex Weights
%Portfolio Weights
%
Financial 20.54 15.07
Industrial 63.36 65.28
Government Related 13.35 14.63
Utilities 2.76 3.42
B. Distribution of Investments of the USD Asia High Yield Bond ETF as at 30 June 2017
Fair ValueUS$
Percentage of Total Assets
Attributable to Unitholders
%
1 By Asset Class
Debt Securities 70,599,411 99.90
Other Net Assets7 68,283 0.10
Net Assets Attributable to Unitholders (At Bid Market Prices)
70,667,694 100.00
7OthernetassetsincludethecashandbankbalancesofUS$815,068.

iShares Southeast Asia Trust 18
Manager’s Investment Report
iShares Barclays USD Asia High Yield Bond Index ETF(a Sub-Fund of iShares Southeast Asia Trust)
Fair ValueUS$
Percentage of Total Assets
Attributable to Unitholders as at
30 June 2017%
2 By S&P, Moody’s or Fitch Credit Rating of Debt Securities
BBB 681,200 0.96
BBB- 706,587 1.00
BB+ 3,369,954 4.76
BB 8,602,120 12.17
BB- 5,478,798 7.74
Ba1 781,984 1.11
Ba2 870,430 1.23
Ba3 1,221,936 1.73
B+ 10,569,795 14.95
B 4,996,387 7.07
B- 4,861,289 6.88
B1 747,251 1.06
B2 673,958 0.96
B3 2,323,853 3.30
Caa1 286,146 0.40
CCC 421,500 0.59
CCC- 259,875 0.37
CC 175,125 0.25
Unrated 22,511,381 31.87
Accrued Interest Receivable on Debt Securities 1,059,842 1.50
3 By Derivative Type
Not Applicable

19 iShares Southeast Asia Trust
Manager’s Investment Report
iShares Barclays USD Asia High Yield Bond Index ETF(a Sub-Fund of iShares Southeast Asia Trust)
C. Top 10 Holdings10 largest holdings as at 30 June 2017
Fair Value at30 June 2017
US$
Percentage of Total Net Assets
Attributable to Unitholders
as at 30 June 2017
%
China Evergrande Group 8.75% Due 28/06/2025 1,631,197 2.31
Lenovo Group Limited 4.7% Due 08/05/2019 1,131,295 1.60
Proven Honour Capital 4.125% Due 06/05/2026 1,121,131 1.59
Shimao Property Holding Limited 8.375% Due 10/02/2022 992,529 1.40
Fortune Star BVI Limited 5.25% Due 23/03/2022 882,297 1.25
Vedanta Resources Public Limited Company 8.25% Due 07/06/2021
762,846 1.08
CITIC Pacific Limited Var Perp 752,465 1.06
ABJA Investment Company 5.95% Due 31/07/2024 739,459 1.05
Republic of Islamic Pakistan Series 7.25% Due 15/04/2019 737,961 1.04
Republic of Islamic Pakistan 8.25% Due 15/04/2024 737,588 1.04

iShares Southeast Asia Trust 20
Manager’s Investment Report
iShares Barclays USD Asia High Yield Bond Index ETF(a Sub-Fund of iShares Southeast Asia Trust)
10 largest holdings as at 30 June 2016
Fair Value at30 June 2016
US$
Percentage of Total Net Assets
Attributable to Unitholders
as at 30 June 2016
%
Proven Honour Capital 4.125% Due 06/05/2026 1,344,538 2.14
Evergrande Real Estate Group 8.75% Due 30/10/2018 995,100 1.58
Republic of Islamic Pakistan 8.25% Due 15/04/2024 952,875 1.51
Lenovo Group Limited 4.7% Due 08/05/2019 948,519 1.51
Shimao Property Holding Limited 8.375% Due 10/02/2022 903,000 1.44
Country Garden Holdings Company 7.5% Due 09/03/2020 862,000 1.37
Republic of Islamic Pakistan Series 7.25% Due 15/04/2019 842,000 1.34
Proven Honour Capital 4.125% Due 19/05/2025 831,896 1.32
Shui On Development Holdings Limited 8.7% Due 19/05/2018 747,250 1.19
Central Plaza Development Limited Var, Perp 745,125 1.19

21 iShares Southeast Asia Trust
Manager’s Investment Report
iShares Barclays USD Asia High Yield Bond Index ETF(a Sub-Fund of iShares Southeast Asia Trust)
D. Global ExposureNot applicable.
E. CollateralNil.
F. Securities Lending or Repurchase TransactionsNil.
G. Investment in Other Unit Trusts, Mutual Funds and Collective Investment SchemesNil.
H. BorrowingsNil.
I. Soft Dollar Commission Received by the ManagersDuring the six month period ended 30 June 2017, the Manager confirmed that no soft dollar commission arrangements existed in relation to directing transactions of the USD Asia High Yield Bond ETF through a broker or dealer.
J. Other Material InformationThere is no other material information that will adversely impact the valuation of the USD Asia High Yield Bond ETF.
K. Supplemental Information on Underlying Sub-FundsNot applicable.

iShares Southeast Asia Trust 22
iShares Southeast Asia Trust(Constituted under a Trust Deed in the Republic of Singapore)
Statements of Total Return (Unaudited)For the half year ended 30 June 2017
iShares MSCI India Index ETF
iShares J.P. Morgan USD Asia Credit Bond
Index ETF
iShares Barclays USD Asia High Yield Bond Index
ETF
30 June2017
US$
30 June2016US$
30 June2017
US$
30 June2016US$
30 June2017
US$
30 June2016US$
Income
Interest Income 551 – 119 – 313 –
Other Income – – – 850 10,375 15,475
551 – 119 850 10,688 15,475
Less: Expenses
Management Fees (948,854) (2,362,689) (62,581) (112,485) (159,756) (162,367)
Management Fee Rebate 242,758 309,199 – – – –
Other Expenses* – – 19,970 (6,350) 39,718 (10,375)
(706,096) (2,053,490) (42,611) (118,835) (120,038) (172,742)
Net Loss (705,545) (2,053,490) (42,492) (117,985) (109,350) (157,267)
Net Gains or Losses on Investments
Net Gains on Investments 64,730,819 565,018 1,878,346 5,376,964 2,070,290 4,627,793
Net Foreign Exchange Gains 802 – – – – –
Total Return/(Deficit) for the Financial Period Before Taxation 64,026,076 (1,488,472) 1,835,854 5,258,979 1,960,940 4,470,526
Taxation – – – – – –
Total Return/(Deficit) for the Financial Period 64,026,076 (1,488,472) 1,835,854 5,258,979 1,960,940 4,470,526
*OtherexpensesincludesGSTRefund.

23 iShares Southeast Asia Trust
iShares Southeast Asia Trust(Constituted under a Trust Deed in the Republic of Singapore)
Statements of Financial Position (Unaudited)As at 30 June 2017
iShares MSCI IndiaIndex ETF
iShares J.P. MorganUSD Asia Credit Bond
Index ETF
iShares BarclaysUSD Asia High Yield Bond Index
ETF
30 June2017
US$
31 December2016US$
30 June2017
US$
31 December2016US$
30 June2017
US$
31 December2016US$
Assets
PortfolioofInvestments 308,860,761 363,925,276 38,624,091 45,759,447 70,599,411 55,714,336
DuefromBroker - 3,290,729 1,113,590 655,345 2,190,969 199,346
CashandBankBalances 894,760 1,450,416 102,257 125,598 815,068 693,620
Receivables 78,880 94,980 - 19 3 53
Total Assets 309,834,401 368,761,401 39,839,938 46,540,409 73,605,451 56,607,355
Liabilities
DuetoUnitholder - 3,296,410 - - - -
Payables 587,902 695,568 20,327 23,514 61,828 44,735
DuetoBroker - - 971,871 623,844 2,875,929 715,043
Total Liabilities 587,902 3,991,978 992,198 647,358 2,937,757 759,778
Equity
Net Assets Attributable to Unitholders 309,246,499 364,769,423 38,847,740 45,893,051 70,667,694 55,847,577

iShares Southeast Asia Trust 24
iShares Southeast Asia Trust(Constituted under a Trust Deed in the Republic of Singapore)
Statements of Movements of Unitholders’ Funds (Unaudited)For the half year ended 30 June 2017
Notes
iShares MSCI IndiaIndex ETF
iShares J.P. Morgan USD Asia Credit Bond
Index ETF
iShares Barclays USD Asia High Yield Bond
Index ETF
30 June2017
US$
31 December2016US$
30 June2017
US$
31 December2016US$
30 June2017
US$
31 December2016US$
Net Assets Attributable to Unitholders at the Beginning of Financial Period/Year 364,769,423 511,758,132 45,893,051 68,883,991 55,847,577 65,511,545
Operations
ChangeinNetAssetsAttributabletoUnitholdersResultingfromOperations 64,026,076 (17,676,059) 1,835,854 4,890,031 1,960,940 6,406,046
Unitholders’ Contributions/(Withdrawals)
CreationofUnits – 13,371,000 2,411,103 18,073,284 15,278,430 25,737,082
CancellationofUnits (119,549,000) (142,683,650) (10,476,061) (43,179,901) (544,995) (37,771,108)
ChangeinNetAssetsAttributabletoUnitholdersResultingfromNetCreationandCancellationofUnits (119,549,000) (129,312,650) (8,064,958) (25,106,617) 14,733,435 (12,034,026)
Distributions 3 – – (816,207) (2,774,354) (1,874,258) (4,035,988)
Total(Decrease)/IncreaseinNetAssetsAttributabletoUnitholders (55,522,924) (146,988,709) (7,045,311) (22,990,940) 14,820,117 (9,663,968)
Net Assets Attributable to Unitholders at the End of Financial Period/Year 309,246,499 364,769,423 38,847,740 45,893,051 70,667,694 55,847,577

25 iShares Southeast Asia Trust
iShares Southeast Asia Trust(Constituted under a Trust Deed in the Republic of Singapore)
Statements of Portfolio (Unaudited)As at 30 June 2017
iShares MSCI India Index ETF
Primary – By Geography
Holdings at30 June 2017
Units
Fair Value at30 June 2017
US$
Percentage ofTotal Net Assets
Attributable toUnitholders at30 June 2017
%
EqUITIES
IndiaiShares MSCI India Mauritius Company 36,399,979 308,860,761 99.88
Portfolio of Investments 308,860,761 99.88Other Net Assets 385,738 0.12
Net Assets Attributable to Unitholders 309,246,499 100.00
Primary – By Geography (Summary)
Percentage ofTotal Net Assets
Attributable toUnitholders at30 June 2017
%
Percentage ofTotal Net Assets
Attributable toUnitholders at
31 December 2016%
India 99.88 99.77
Portfolio of Investments 99.88 99.77Other Net Assets 0.12 0.23
Net Assets Attributable To Unitholders 100.00 100.00

iShares Southeast Asia Trust 26
iShares Southeast Asia Trust(Constituted under a Trust Deed in the Republic of Singapore)
Statements of Portfolio (Unaudited)As at 30 June 2017
iShares MSCI India Index ETF
Secondary – By Industry
Fair value at30 June 2017
US$
Percentage ofTotal Net Assets
Attributable toUnitholders at30 June 2017
%
Percentage ofTotal Net Assets
Attributable toUnitholders at
31 December 2016%
EqUITIES
Miscellaneous 308,860,761 99.88 99.77
Portfolio of Investments 308,860,761 99.88 99.77Other Net Assets 385,738 0.12 0.23
Net Assets Attributable to Unitholders 309,246,499 100.00 100.00

27 iShares Southeast Asia Trust
iShares Southeast Asia Trust(Constituted under a Trust Deed in the Republic of Singapore)
Statements of Portfolio (Unaudited)As at 30 June 2017
iShares MSCI India Index ETF
Schedule of Securities for the iShares MSCI India Mauritius Company
Holdings at 30 June 2017
Units
Fair Value at 30 June 2017
US$
Percentage of Total Net Assets Attributable to
Unitholders at30 June 2017
%
qUOTED EqUITIES HELD BY THE SUBSIDIARY
Consumer DiscretionaryBajaj Auto Limited 62,699 2,707,491 0.88Bharat Forge Limited 79,130 1,337,635 0.43Bosch Limited 5,367 1,936,915 0.63Hero Motorcorp Limited 37,285 2,135,058 0.69Mahindra & Mahindra Limited 278,427 5,809,115 1.88Maruti Suzuki India Limited 78,993 8,820,574 2.85Motherson Sumi Systems Limited 305,411 2,182,942 0.71Tata Motors Limited 1,181,231 7,904,722 2.56Tata Motors Limited Class A 287,212 1,169,954 0.38Titan Company Limited 229,969 1,865,902 0.60Zee Telefilms Limited 394,674 3,000,164 0.97
38,870,472 12.58
Consumer StaplesDabur India Limited 390,512 1,764,743 0.57Godrej Consumer Products Limited 178,132 2,667,949 0.86Hindustan Unilever Limited 485,107 8,102,441 2.62I.T.C Limited 2,537,685 12,706,583 4.11Marico Limited 342,905 1,667,642 0.54Nestle India Limited 17,156 1,788,072 0.58United Spirits Limited 43,433 1,611,565 0.52
30,308,995 9.80
EnergyBharat Petroleum Corporation Limited 378,175 3,740,941 1.21Coal India Limited 524,362 1,981,442 0.64Hindustan Petroleum Corporation 303,603 2,397,119 0.78Indian Oil Corporation Limited 435,367 2,594,521 0.84Oil & Natural Gas Corporation Limited 958,828 2,333,377 0.75Reliance Industries Limited 969,453 20,697,662 6.69
33,745,062 10.91

iShares Southeast Asia Trust 28
iShares Southeast Asia Trust(Constituted under a Trust Deed in the Republic of Singapore)
Statements of Portfolio (Unaudited)As at 30 June 2017
iShares MSCI India Index ETF
Schedule of Securities for the iShares MSCI India Mauritius Company (Continued)
Holdings at 30 June 2017
Units
Fair Value at 30 June 2017
US$
Percentage of Total Net Assets Attributable to
Unitholders at30 June 2017
%
qUOTED EqUITIES HELD BY THE SUBSIDIARY (CONTINUED)
FinancialAxis Bank Limited 1,251,113 10,013,743 3.24Bajaj Finance Limited 121,730 2,585,921 0.84Bajaj Finserv Limited 28,292 1,802,765 0.58Housing Development Finance Corporation
Limited 1,125,672 28,124,603 9.09ICICI Bank Limited 1,770,421 7,947,208 2.57IDFC Bank Limited 1,058,761 895,985 0.29Indiabulls Housing Finance Limited 230,258 3,833,566 1.24LIC Housing Finance 222,463 2,554,431 0.83Mahindra & Mahindra Financial Services
Limited 217,275 1,159,528 0.38Power Finance Corporation 478,596 908,509 0.29Rural Electrification Corporation Limited 516,441 1,373,847 0.44Shriram Transport Finance 108,867 1,683,933 0.54State Bank of India Limited 1,290,844 5,464,931 1.77Yes Bank Limited 252,191 5,710,022 1.85
74,058,992 23.95
HealthcareApollo Hospitals Enterprise Limited 57,400 1,131,838 0.37Aurobindo Pharmaceuticals Limited 194,458 2,059,578 0.67Cadila Healthcare Limited 159,634 1,296,953 0.42Cipla Limited 258,374 2,220,887 0.72Dr Reddy’s Laboratory Limited 84,885 3,532,766 1.14Glenmark Pharmaceuticals Limited 105,376 1,031,629 0.33Lupin Limited 167,843 2,752,093 0.89Piramal Enterprises Limited 58,021 2,510,331 0.81Sun Pharmaceutical Industry Limited 717,021 6,164,356 1.99
22,700,431 7.34

29 iShares Southeast Asia Trust
iShares Southeast Asia Trust(Constituted under a Trust Deed in the Republic of Singapore)
Statements of Portfolio (Unaudited)As at 30 June 2017
iShares MSCI India Index ETF
Schedule of Securities for the iShares MSCI India Mauritius Company (Continued)
Holdings at 30 June 2017
Units
Fair Value at 30 June 2017
US$
Percentage of Total Net Assets Attributable to
Unitholders at30 June 2017
%
qUOTED EqUITIES HELD BY THE SUBSIDIARY (CONTINUED)
IndustrialAdani Port & Special Economic Zone Limited 541,555 3,041,756 0.98Ashok Leyland Limited 854,935 1,241,317 0.40Bharat Heavy Electricals Limited 436,511 913,710 0.30Container Corporation of India Limited 32,296 572,622 0.19Eicher Motors Limited 9,948 4,161,484 1.35Havells India Limited 181,797 1,293,779 0.42Larsen & Toubro Limited 237,000 6,187,758 2.00Siemens India Limited 53,081 1,096,645 0.35
18,509,071 5.99
Information TechnologyHCL Technologies Limited 421,748 5,551,969 1.80Infosys Ltd 1,372,918 19,871,335 6.43Tata Consultancy Services Ltd 352,957 12,899,756 4.17Tech Mahindra Limited 345,490 2,041,805 0.66Wipro Limited 908,108 3,629,622 1.17
43,994,487 14.23
MaterialsACC Limited 34,537 837,838 0.27Ambuja Cements Limited 455,724 1,738,291 0.56Asian Paints Limited 213,367 3,640,814 1.18Grasim Industries Limited 209,276 4,021,531 1.30Hindalco Industries 871,526 2,574,634 0.83JSW Steel Limited 629,209 1,979,982 0.64Shree Cements Limited 6,394 1,677,036 0.54Tata Steel Limited 231,011 1,950,482 0.63Ultratech Cement Limited 65,594 4,017,686 1.30UPL Limited 265,137 3,447,242 1.11Vedanta Limited 1,111,113 4,281,148 1.38
30,166,684 9.74

iShares Southeast Asia Trust 30
iShares Southeast Asia Trust(Constituted under a Trust Deed in the Republic of Singapore)
Statements of Portfolio (Unaudited)As at 30 June 2017
iShares MSCI India Index ETF
Schedule of Securities for the iShares MSCI India Mauritius Company (Continued)
Holdings at 30 June 2017
Units
Fair Value at 30 June 2017
US$
Percentage of Total Net Assets Attributable to
Unitholders at30 June 2017
%
qUOTED EqUITIES HELD BY THE SUBSIDIARY (CONTINUED)
TelecommunicationBharti Airtel Limited 895,990 5,263,313 1.70Bharti Infratel Limited 403,165 2,336,190 0.76Idea Cellular Limited 968,697 1,277,608 0.41
8,877,111 2.87
UtilitiesGail India Limited 379,095 2,119,882 0.69NTPC Limited 1,232,110 3,029,880 0.98Tata Power Company Limited 825,851 1,029,160 0.33
6,178,922 2.00
Total Value of Equities Held by the Subsidiary 307,410,227 99.41Other Net Assets of the Subsidiary 1,450,534 0.47
Net Assets Attributable to Unitholders of the Subsidiary 308,860,761 99.88

31 iShares Southeast Asia Trust
iShares Southeast Asia Trust(Constituted under a Trust Deed in the Republic of Singapore)
Statements of Portfolio (Unaudited)As at 30 June 2017
iShares J.P. Morgan USD Asia Credit Bond Index ETF
Primary – By Industry
Holdings at 30 June 2017
Units
Fair Value at 30 June 2017
US$
Percentage of Total Net Assets Attributable to
Unitholders at30 June 2017
%
BONDS – qUOTED
ConsumerCar Incorporation Series 6.125% Due
04/02/2020 100,000 103,250 0.27GOHL Capital Limited 4.25% Due
24/01/2027 200,000 207,283 0.53Li & Fung Limited 5.25% Due 13/05/2020 250,000 264,433 0.68Studio City Finance Limited 8.5% Due
01/12/2020 250,000 259,690 0.67Wynn Macau Limited Series 5.25% Due
15/10/2021 200,000 205,750 0.53
1,040,406 2.68
FinancialAIA Group Limited 3.125% Due 13/03/2023 200,000 201,602 0.52AIA Group Limited 3.2% Due 11/03/2025 200,000 198,407 0.51Axis Bank/Dubai 3.25% Due 21/05/2020 200,000 202,081 0.52Bangkok Bank Public Company Limited
3.875% Due 27/09/2022 200,000 209,579 0.54Bangkok Bank Public Company Limited 5%
Due 03/10/2023 200,000 221,401 0.57Bank of China Hong Kong 5.55% Due
11/02/2020 250,000 267,296 0.69Bank of East Asia Limited Series Var Due
20/11/2024 200,000 203,293 0.52Bank of India Jersey 3.125% Due
06/05/2020 200,000 199,056 0.51Cagamas Global Series Emtn 2.745% Due
10/12/2019 200,000 200,584 0.52CIMB Bank Berhad Series Emtn 3.263% Due
15/03/2022 200,000 202,804 0.52CITIC Bank International Limited Series Emtn
6.875% Due 24/06/2020 100,000 109,974 0.28DBS Group Holdings Limited Series Gmtn Var
Due Perp 200,000 199,946 0.51Huarong Finance II Co Limited Series Emtn
5.5% Due 16/01/2025 200,000 214,874 0.55

iShares Southeast Asia Trust 32
iShares Southeast Asia Trust(Constituted under a Trust Deed in the Republic of Singapore)
Statements of Portfolio (Unaudited)As at 30 June 2017
iShares J.P. Morgan USD Asia Credit Bond Index ETF
Primary – By Industry (Continued)
Holdings at 30 June 2017
Units
Fair Value at 30 June 2017
US$
Percentage of Total Net Assets Attributable to
Unitholders at30 June 2017
%
BONDS – qUOTED (CONTINUED)
Financial (Continued)Hyundai Capital Services Incorporation
2.625% Due 29/09/2020 200,000 198,557 0.51ICBCIL Finance Company Limited 3.2% Due
10/11/2020 200,000 201,197 0.52ICICI Bank Limited / Dubai Series 3.5% Due
18/03/2020 200,000 203,091 0.52ICICI Bank Limited 5.75% Due 16/11/2020 200,000 217,788 0.56IDBI Bank Limited Series Emtn 4.125% Due
23/04/2020 200,000 201,354 0.52Industrial & Commercial Bank of China
Limited Series 4.875% Due 21/09/2025 200,000 213,258 0.55Kasikornbank Public Company Limited Series
Emtn 3.5% Due 25/10/2019 200,000 204,495 0.53Krung Thai Bank Public Company Limited
Series Emtn Var Due 26/12/2024 200,000 208,042 0.54Malayan Banking Emtn Var 20/09/2022 200,000 200,294 0.52Oversea-Chinese Banking Corporation
Limited Series Var Due 15/10/2024 200,000 205,250 0.53Oversea-Chinese Banking Corporation Series
4.25% Due 19/06/2024 200,000 208,909 0.54Shinhan Bank 2.875% Due 28/03/2022 200,000 200,548 0.52Skysea International Cap Series Emtn
4.875% Due 07/12/2021 100,000 107,836 0.28Standard Chartered Bank Emtn 5.875% Due
24/06/2020 200,000 216,101 0.56State Bank India/London Series Emtn Frn
Due 06/04/2020 200,000 199,838 0.51United Overseas Bank Limited Emtn Var Due
19/09/2024 200,000 203,946 0.52United Overseas Bank Limited Series Emtn
Var Due 16/09/2026 200,000 203,590 0.52Woori Bank 5% Due Perpetual 200,000 206,800 0.53Woori Bank Series 2.625% Due 20/07/2021 200,000 199,046 0.51
6,430,837 16.55

33 iShares Southeast Asia Trust
iShares Southeast Asia Trust(Constituted under a Trust Deed in the Republic of Singapore)
Statements of Portfolio (Unaudited)As at 30 June 2017
iShares J.P. Morgan USD Asia Credit Bond Index ETF
Primary – By Industry (Continued)
Holdings at 30 June 2017
Units
Fair Value at 30 June 2017
US$
Percentage of Total Net Assets Attributable to
Unitholders at30 June 2017
%
BONDS – qUOTED (CONTINUED)
IndustrialABJA Investment Company 5.95% Due
31/07/2024 200,000 210,854 0.54Adani Ports and Special Series 3.5% Due
29/07/2020 200,000 201,912 0.52Agile Property Holdings Limited 9% Due
21/05/2020 100,000 107,000 0.28Capitaland Treasury Limited Emtn 4.076%
Due 20/09/2022 200,000 207,845 0.54CIFI Holdings Group 7.75% Due 05/06/2020 100,000 105,375 0.27CITIC Limited 6.625% Due 15/04/2021 100,000 112,810 0.29CK Bond Sec 03 Limited 5.375% Perp 250,000 253,125 0.65CK Hutchison International 17 Limited 3.5%
Due 05/04/2027 200,000 201,942 0.52Country Garden Holdings Company 7.5%
Due 09/03/2020 200,000 209,700 0.54Formosa Group Cayman Limited 3.375% Due
22/04/2025 200,000 197,469 0.51Franshion Development Limited 6.75% Due
15/04/2021 100,000 111,400 0.29GCX Limited Series 7% Due 01/08/2019 100,000 90,550 0.23Global Logistic Properties Ltd 3.875% Due
04/06/2025 200,000 190,188 0.49Henson Finance Limited 5.5% Due
17/09/2019 100,000 106,291 0.27HLP Finance Limited Series Emtn 4.45% Due
16/04/2021 200,000 210,062 0.54Hong Kong Land Finance 4.5% Due
07/10/2025 150,000 164,707 0.42Hutchison Whampoa International 11
Limited 4.625% Due 13/01/2022 200,000 215,919 0.56Hutchison Whampoa International Limited
7.45% Due 24/11/2033 100,000 140,796 0.36Hyundai Capital America 3% Due
30/10/2020 200,000 201,926 0.52

iShares Southeast Asia Trust 34
iShares Southeast Asia Trust(Constituted under a Trust Deed in the Republic of Singapore)
Statements of Portfolio (Unaudited)As at 30 June 2017
iShares J.P. Morgan USD Asia Credit Bond Index ETF
Primary – By Industry (Continued)
Holdings at 30 June 2017
Units
Fair Value at 30 June 2017
US$
Percentage of Total Net Assets Attributable to
Unitholders at30 June 2017
%
BONDS – qUOTED (CONTINUED)
Industrial (Continued)ICTSI Treasury 4.625% Due 16/01/2023 200,000 205,616 0.53JGSH Philippines Limited 4.375% Due
23/01/2023 200,000 205,800 0.53JSW Steel Limited 4.75% Due 12/11/2019 100,000 101,375 0.26New World Development Company 5.25%
Due 26/02/2021 200,000 213,268 0.55Noble Group Limited 6.75% Due
29/01/2020 200,000 76,300 0.20NWD Finance (BVI) Limited 5.75% Due Perp 200,000 200,500 0.52Olam International Limited Series Emtn Var
Due Perp 200,000 198,750 0.51POSCO 4.25% Due 28/10/2020 200,000 209,687 0.54POSCO 5.25% Due 14/04/2021 50,000 54,410 0.14Studio City Company Limited Series 7.25%
Due 30/11/2021 200,000 217,500 0.56Sun Hung Kai Properties Limited 3.375%
Due 25/02/2024 200,000 202,661 0.52Swire Pacific Mtn Financial Series Emtn
3.875% Due 21/09/2025 200,000 207,741 0.53Swire Propert Mtn Financial Series Emtn
3.625% Due 13/01/2026 200,000 203,871 0.52Theta Capital Pte Limited 7% Due
11/04/2022 200,000 208,000 0.54Vedanta Resources Public Limited Company
6.375% Due 30/07/2022 250,000 250,250 0.64
5,995,600 15.43
Media & TelecomAlibaba Group Holding 3.125% Due
28/11/2021 200,000 203,934 0.53Bharti Airtel International 5.35% Due
20/05/2024 200,000 211,738 0.55Bharti Airtel Limited Series 4.375% Due
10/06/2025 200,000 200,037 0.51

35 iShares Southeast Asia Trust
iShares Southeast Asia Trust(Constituted under a Trust Deed in the Republic of Singapore)
Statements of Portfolio (Unaudited)As at 30 June 2017
iShares J.P. Morgan USD Asia Credit Bond Index ETF
Primary – By Industry (Continued)
Holdings at 30 June 2017
Units
Fair Value at 30 June 2017
US$
Percentage of Total Net Assets Attributable to
Unitholders at30 June 2017
%
BONDS – qUOTED (CONTINUED)
Media & Telecom (Continued)Flextronics International Limited 4.75% Due
15/06/2025 200,000 213,991 0.55Foxconn Far East Limited Series Emtn 2.25%
Due 23/09/2021 200,000 196,116 0.50PCCW HKT Capital No.2 Limited 3.625%
Due 02/04/2025 200,000 201,515 0.52Singtel Group Treasury P Series Emtn 3.25%
Due 30/06/2025 400,000 406,717 1.05Stats Chippac Limited Series 8.5% Due
24/11/2020 200,000 212,950 0.55
1,846,998 4.76
Oil & GasBharat Petroleum Corporation Limited
4.625% Due 25/10/2022 200,000 212,989 0.55CNOOC Finance 2013 Limited 3% Due
09/05/2023 200,000 197,665 0.51CNOOC Finance 2013 Limited 4.25% Due
09/05/2043 200,000 199,844 0.51CNPC General Capital 3.95% Due
19/04/2022 200,000 209,859 0.54Indian Oil Corporation Limited 5.625% Due
02/08/2021 200,000 220,231 0.57ONGC Videsh Limited Series 4.625% Due
15/07/2024 200,000 212,349 0.55Petron Corporation Var Perpetual 200,000 209,212 0.54PTT Exploration and Production PCL Series
Var Perpetual 200,000 204,150 0.53PTT Global Chemical PCL 4.25% Due
19/09/2022 200,000 212,444 0.55PTT PCL 3.375% Due 25/10/2022 200,000 203,937 0.52PTTEP Canada International Finance 6.35%
Due 12/06/2042 200,000 257,793 0.66

iShares Southeast Asia Trust 36
iShares Southeast Asia Trust(Constituted under a Trust Deed in the Republic of Singapore)
Statements of Portfolio (Unaudited)As at 30 June 2017
iShares J.P. Morgan USD Asia Credit Bond Index ETF
Primary – By Industry (Continued)
Holdings at 30 June 2017
Units
Fair Value at 30 June 2017
US$
Percentage of Total Net Assets Attributable to
Unitholders at30 June 2017
%
BONDS – qUOTED (CONTINUED)
Oil & Gas (Continued)Reliance Holdings USA Incorporation 4.5%
Due 19/10/2020 250,000 263,167 0.68Reliance Holdings USA Incorporation 6.25%
Due 19/10/2040 250,000 307,539 0.79Thai Oil PCL 3.625% Due 23/01/2023 200,000 206,235 0.53
3,117,414 8.03
Government Related1MDB Global Investments Series 4.4% Due
09/03/2023 400,000 369,500 0.95China Development Bank Series Emtn 2.5%
Due 09/10/2020 200,000 199,563 0.51Export-Import Bank of India 3.375% Due
05/08/2026 200,000 195,901 0.50Export-Import Bank of India 3.875% Due
02/10/2019 200,000 206,786 0.53Export-Import Bank of Korea 2.25% Due
21/01/2020 200,000 199,510 0.51Export-Import Bank of Korea 2.375% Due
21/04/2027 200,000 187,478 0.48Export-Import Bank of Korea 3.25% Due
10/11/2025 200,000 201,865 0.52Export-Import Bank of Korea 4% Due
29/01/2021 300,000 314,200 0.81Export-Import Bank of Korea 5% Due
11/04/2022 300,000 330,633 0.85Hong Kong Sukuk 2017 Limited 3.132% Due
28/02/2027 200,000 200,827 0.52Korea Development Bank 1.502330% Due
27/02/2020 200,000 199,735 0.51Korea Development Bank 2.5% Due
13/01/2021 200,000 199,062 0.51Korea Finance Corporation 4.625% Due
16/11/2021 200,000 216,158 0.56

37 iShares Southeast Asia Trust
iShares Southeast Asia Trust(Constituted under a Trust Deed in the Republic of Singapore)
Statements of Portfolio (Unaudited)As at 30 June 2017
iShares J.P. Morgan USD Asia Credit Bond Index ETF
Primary – By Industry (Continued)
Holdings at 30 June 2017
Units
Fair Value at 30 June 2017
US$
Percentage of Total Net Assets Attributable to
Unitholders at30 June 2017
%
BONDS – qUOTED (CONTINUED)
Government Related (Continued)Korea National Oil Corporation Series 2%
Due 24/10/2021 200,000 194,346 0.50Korea National Oil Corporation Series 3.25%
Due 01/10/2025 200,000 201,553 0.52Majapahit Holding 7.75% Due 20/01/2020 150,000 168,719 0.44Majapahit Holding 7.875% Due 29/06/2037 125,000 163,212 0.42Majapahit Holding 8% Due 07/08/2019 100,000 111,581 0.29Malaysia Sovereign Sukuk 4.236% Due
22/04/2045 200,000 214,351 0.55Malaysia Sukuk Global 3.179% Due
27/04/2026 250,000 251,662 0.65Mongolia 5.125% Due 05/12/2022 300,000 282,000 0.73Pertamina 5.25% Due 23/05/2021 200,000 216,252 0.56Pertamina 6.5% Due 27/05/2041 300,000 341,961 0.88Pertamina Persero 6.45% Due 30/05/2044 200,000 227,142 0.59Perusahaan Penerbit SBSN 4.15% Due
29/03/2027 200,000 202,834 0.52Perusahaan Penerbit SBSN 4.35% Due
10/09/2024 300,000 312,777 0.81Perusahaan Penerbit SBSN 4.55% Due
29/03/2026 200,000 208,902 0.54Petroliam Nasional Berhad Series 7.625%
Due 15/10/2026 100,000 135,509 0.35Petronas Capital Limited 3.125% Due
18/03/2022 200,000 203,897 0.53Petronas Capital Limited 3.5% Due
18/03/2025 200,000 207,496 0.53Petronas Capital Limited 4.5% Due
18/03/2045 200,000 219,675 0.57Petronas Capital Limited 5.25% Due
12/08/2019 300,000 319,055 0.82Petronas Capital Limited 7.875% Due
22/05/2022 150,000 185,631 0.48

iShares Southeast Asia Trust 38
iShares Southeast Asia Trust(Constituted under a Trust Deed in the Republic of Singapore)
Statements of Portfolio (Unaudited)As at 30 June 2017
iShares J.P. Morgan USD Asia Credit Bond Index ETF
Primary – By Industry (Continued)
Holdings at 30 June 2017
Units
Fair Value at 30 June 2017
US$
Percentage of Total Net Assets Attributable to
Unitholders at30 June 2017
%
BONDS – qUOTED (CONTINUED)
Government Related (Continued)Power Sector Asset & Li 7.39% Due
02/12/2024 200,000 257,540 0.66PSA International Private Limited Gmtn
3.875% Due 11/02/2021 200,000 210,322 0.54PT Pelabuhan Indo II 4.25% Due 05/05/2025 200,000 202,726 0.52Republic of Indonesia 3.7% Due 08/01/2022 200,000 205,344 0.53Republic of Indonesia 3.75% Due
25/04/2022 300,000 307,716 0.79Republic of Indonesia 4.75% Due
08/01/2026 200,000 215,032 0.55Republic of Indonesia 5.125% Due
15/01/2045 200,000 213,880 0.55Republic of Indonesia 5.875% Due
13/03/2020 150,000 163,872 0.42Republic of Indonesia 5.875% Due
15/01/2024 200,000 228,048 0.59Republic of Indonesia 6.75% Due
15/01/2044 250,000 321,975 0.83Republic of Indonesia 7.75% Due
17/01/2038 200,000 276,412 0.71Republic of Indonesia 8.5% Due 12/10/2035 150,000 215,913 0.56Republic of Indonesia Series 5.95% Due
08/01/2046 250,000 296,338 0.76Republic of Islamic Pakistan 8.25% Due
15/04/2024 200,000 227,156 0.59Republic of Korea 2.75% Due 19/01/2027 350,000 344,451 0.89Republic of Philippines 10.625% Due
16/03/2025 200,000 307,898 0.79Republic of Philippines 3.7% Due
01/03/2041 775,000 783,719 2.02Republic of Philippines 4% Due 15/01/2021 250,000 266,208 0.69Republic of Philippines 4.2% Due
21/01/2024 300,000 328,212 0.84

39 iShares Southeast Asia Trust
iShares Southeast Asia Trust(Constituted under a Trust Deed in the Republic of Singapore)
Statements of Portfolio (Unaudited)As at 30 June 2017
iShares J.P. Morgan USD Asia Credit Bond Index ETF
Primary – By Industry (Continued)
Holdings at 30 June 2017
Units
Fair Value at 30 June 2017
US$
Percentage of Total Net Assets Attributable to
Unitholders at30 June 2017
%
BONDS – qUOTED (CONTINUED)
Government Related (Continued)Republic of Philippines 6.375% Due
15/01/2032 200,000 261,298 0.67Republic of Philippines 6.375% Due
23/10/2034 450,000 603,477 1.55Republic of Philippines 6.5% Due
20/01/2020 150,000 167,097 0.43Republic of Philippines 7.75% Due
14/01/2031 225,000 324,257 0.83Republic of Philippines 9.5% Due
02/02/2030 200,000 320,268 0.83Republic of Sri Lanka 5.75% Due
18/01/2022 200,000 206,750 0.53Republic of Sri Lanka 5.875% Due
25/07/2022 200,000 206,750 0.53Republic of Sri Lanka 6.2% Due 11/05/2027 200,000 199,750 0.51Republic of Sri Lanka 6.25% Due
04/10/2020 200,000 210,500 0.54Republic of Sri Lanka 6.825% Due
18/07/2026 200,000 210,750 0.54Republic of Sri Lanka 6.85% Due
03/11/2025 300,000 316,125 0.81Republic of Vietnam 4.8% Due 19/11/2024 200,000 210,650 0.54Sinopec Group Oversea 2012 3.9% Due
17/05/2022 300,000 312,812 0.81SP Powerassets Limited 3.25% Due
24/11/2025 200,000 203,057 0.52SSG Resources Limited 4.25% Due
04/10/2022 200,000 209,959 0.54State Grid Overseas Investment 3.125% Due
22/05/2023 200,000 201,545 0.52Temasek Financial I Limited 4.3% Due
25/10/2019 250,000 263,163 0.68Temasek Financial I Ltd 2.375% Due
23/01/2023 250,000 248,000 0.64
iShares Southeast Asia Trust 40
iShares Southeast Asia Trust(Constituted under a Trust Deed in the Republic of Singapore)
Statements of Portfolio (Unaudited)As at 30 June 2017
iShares J.P. Morgan USD Asia Credit Bond Index ETF
Primary – By Industry (Continued)
Holdings at 30 June 2017
Units
Fair Value at 30 June 2017
US$
Percentage of Total Net Assets Attributable to
Unitholders at30 June 2017
%
BONDS – qUOTED (CONTINUED)
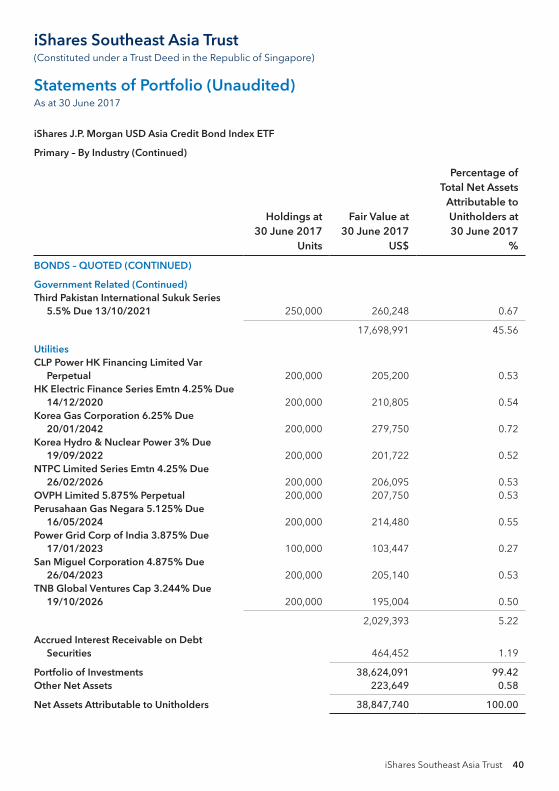
Government Related (Continued)Third Pakistan International Sukuk Series
5.5% Due 13/10/2021 250,000 260,248 0.67
17,698,991 45.56
UtilitiesCLP Power HK Financing Limited Var
Perpetual 200,000 205,200 0.53HK Electric Finance Series Emtn 4.25% Due
14/12/2020 200,000 210,805 0.54Korea Gas Corporation 6.25% Due
20/01/2042 200,000 279,750 0.72Korea Hydro & Nuclear Power 3% Due
19/09/2022 200,000 201,722 0.52NTPC Limited Series Emtn 4.25% Due
26/02/2026 200,000 206,095 0.53OVPH Limited 5.875% Perpetual 200,000 207,750 0.53Perusahaan Gas Negara 5.125% Due
16/05/2024 200,000 214,480 0.55Power Grid Corp of India 3.875% Due
17/01/2023 100,000 103,447 0.27San Miguel Corporation 4.875% Due
26/04/2023 200,000 205,140 0.53TNB Global Ventures Cap 3.244% Due
19/10/2026 200,000 195,004 0.50
2,029,393 5.22
Accrued Interest Receivable on Debt Securities 464,452 1.19
Portfolio of Investments 38,624,091 99.42Other Net Assets 223,649 0.58
Net Assets Attributable to Unitholders 38,847,740 100.00

41 iShares Southeast Asia Trust
iShares Southeast Asia Trust(Constituted under a Trust Deed in the Republic of Singapore)
Statements of Portfolio (Unaudited)As at 30 June 2017
iShares J.P. Morgan USD Asia Credit Bond Index ETF
Primary – By Industry (Summary)
Percentage ofTotal Net Assets Attributable to Unitholders at30 June 2017
%
Percentage ofTotal Net Assets Attributable to Unitholders at
31 December 2016 %
Consumer 2.68 2.26Financial 16.55 19.45Industrial 15.43 17.72Media & Telecom 4.76 5.54Oil & Gas 8.03 7.95Government Related 45.56 42.07Utilities 5.22 3.45
Accrued Interest Receivable on Debt Securities 1.19 1.27
Portfolio of Investments 99.42 99.71Other Net Assets 0.58 0.29
Net Assets Attributable to Unitholders 100.00 100.00

iShares Southeast Asia Trust 42
iShares Southeast Asia Trust(Constituted under a Trust Deed in the Republic of Singapore)
Statements of Portfolio (Unaudited)As at 30 June 2017
iShares J.P. Morgan USD Asia Credit Bond Index ETF
Secondary – By Geography
Fair Value at30 June 2017
US$
Percentage of Total Net Assets Attributable to Unitholders at 30 June 2017
%
Percentage of Total Net Assets Attributable to Unitholders at
31 December 2016%
BY COUNTRY OF RISK
Bermuda 354,983 0.91 0.79British Virgin Islands 538,665 1.38 0.91Canada 257,793 0.66 0.52Cayman Islands 196,116 0.50 0.91China 3,056,738 7.89 12.18Great Britain 416,601 1.08 1.58Hong Kong 4,097,061 10.53 10.38India 3,757,172 9.66 10.32Indonesia 4,748,323 12.24 11.05Macau 205,750 0.53 0.44Malaysia 3,322,704 8.56 6.40Mongolia 282,000 0.73 0.37Netherlands 274,793 0.71 0.52Pakistan 487,404 1.26 1.73Philippines 4,445,742 11.44 10.81Singapore 3,162,633 8.14 9.21South Korea 4,341,437 11.17 10.81Sri Lanka 1,350,625 3.46 3.04Taiwan 197,469 0.51 0.41Thailand 1,670,283 4.31 4.11USA 784,697 2.02 1.31Vietnam 210,650 0.54 0.64
Accrued Interest Receivable on Debt Securities 464,452 1.19 1.27
Portfolio of Investments 38,624,091 99.42 99.71Other Net Assets 223,649 0.58 0.29
Net Assets Attributable to Unitholders 38,847,740 100.00 100.00

43 iShares Southeast Asia Trust
iShares Southeast Asia Trust(Constituted under a Trust Deed in the Republic of Singapore)
Statements of Portfolio (Unaudited)As at 30 June 2017
iShares Barclays USD Asia High Yield Bond Index ETF
Primary – By Industry
Holdings at30 June 2017
Units
Fair Value at30 June 2017
US$
Percentage of Total Net Assets
Attributable to Unitholders at30 June 2017
%
BONDS – qUOTED
FinancialBank of East Asia Limited Series Var
20/11/2024 400,000 406,164 0.57Bank of East Asia Limited Var Due
03/11/2026 300,000 300,423 0.43Boom Up Investments Limited Series Emtn
3.8% Due 02/08/2019 300,000 292,521 0.41Champion Mtn Limited Series Emtn 3.75%
Due 17/01/2023 250,000 252,742 0.36China Reinsurance Finance Corporation
3.375% Due 09/03/2022 600,000 592,776 0.84Easy Tactic Limited 5.75% Due 13/01/2022 500,000 499,385 0.71FWD Group Limited Series Emtn Var Perp 300,000 219,600 0.31IDBI Bank Limited Series Emtn 3.75% Due
25/01/2019 300,000 300,987 0.43IDBI Bank Limited Series Emtn 4.125% Due
23/04/2020 200,000 201,610 0.29IDBI Bank Limited/DIFC Dubai 4.25% Due
30/11/2020 250,000 252,550 0.36Jingrui Holdings Limited 7.75% Due
12/04/2020 300,000 286,146 0.40Joyous Glory Group Gmtn 5.7% Due
07/03/2020 200,000 211,700 0.30New World China Land Limited 4.75% Due
23/01/2027 450,000 466,326 0.66New World China Land Limited Series Emtn
5.375% Due 06/11/2019 300,000 315,843 0.45Oceanwide Holdings International 15
9.625% Due 11/08/2020 400,000 427,560 0.61PCPD Capital Limited 4.75% Due
09/03/2022 350,000 356,129 0.50RKI Overseas Finance 2016 A 5% Due
09/08/2019 300,000 300,264 0.42RKI Overseas Finance 2016 B 4.7% Due
06/09/2021 300,000 293,142 0.41

iShares Southeast Asia Trust 44
iShares Southeast Asia Trust(Constituted under a Trust Deed in the Republic of Singapore)
Statements of Portfolio (Unaudited)As at 30 June 2017
iShares Barclays USD Asia High Yield Bond Index ETF
Primary – By Industry (Continued)
Holdings at30 June 2017
Units
Fair Value at30 June 2017
US$
Percentage of Total Net Assets
Attributable to Unitholders at30 June 2017
%
BONDS – qUOTED (CONTINUED)
Financial (Continued)Ronshine China Holdings Limited 6.95% Due
08/12/2019 250,000 241,875 0.34Sun Hung Kai & Company BVI Series Emtn
4.75% Due 31/05/2021 250,000 251,997 0.36Syndicate Bank/London Series Emtn 3.875%
Due 04/12/2019 250,000 253,928 0.36Times Property Holdings Limited 6.25% Due
23/01/2020 200,000 201,430 0.28Unigroup International 5.25% Due
10/12/2018 300,000 306,042 0.43Unigroup International 6% Due 10/12/2020 400,000 422,160 0.60Union Bank of India HK Series Emtn 3.625%
Due 25/10/2018 200,000 201,982 0.29Union Bank of India Series Emtn 4.5% Due
28/10/2019 200,000 205,872 0.29Vll International Incorporation Series Emtn
7.375% Due 18/06/2022 300,000 328,887 0.47Wanda Properties International 7.25% Due
29/01/2024 400,000 423,572 0.60Wanda Properties Overseas Limited 4.875%
Due 21/11/2018 400,000 398,848 0.56Woori Bank 5% Perpetual 300,000 310,332 0.44Woori Bank Series 4.75% Due 30/04/2024 650,000 681,200 0.96Xinhu Zhongbao 6% Due 01/03/2020 450,000 447,948 0.63
10,651,941 15.07
Industrial361 Degrees International 7.25% Due
03/06/2021 300,000 318,333 0.45ABJA Investment Company 4.85% Due
31/01/2020 300,000 308,598 0.44ABJA Investment Company 5.95% Due
31/07/2024 700,000 739,459 1.05

45 iShares Southeast Asia Trust
iShares Southeast Asia Trust(Constituted under a Trust Deed in the Republic of Singapore)
Statements of Portfolio (Unaudited)As at 30 June 2017
iShares Barclays USD Asia High Yield Bond Index ETF
Primary – By Industry (Continued)
Holdings at30 June 2017
Units
Fair Value at30 June 2017
US$
Percentage of Total Net Assets
Attributable to Unitholders at30 June 2017
%
BONDS – qUOTED (CONTINUED)
Industrial (Continued)Agile Property Holdings Limited 8.375% Due
18/02/2019 400,000 416,532 0.59Agile Property Holdings Limited 9% Due
21/05/2020 300,000 321,843 0.46Agile Property Holdings Limited Var Perp 400,000 404,336 0.57Baoxin Auto Finance I Limited Var
29/12/2049 300,000 314,160 0.44Biostime International Holdings Limited
7.25% Due 21/06/2021 400,000 420,128 0.59Blue Skyview Company Limited Var Perp 350,000 336,686 0.48Bukit Makmur Mandiri Utama 7.75% Due
13/02/2022 300,000 307,512 0.44Capitaland Treasury Limited Emtn 4.076%
Due 20/09/2022 300,000 311,682 0.44Car Incorporation Series 6.125% Due
04/02/2020 350,000 361,673 0.51Central Plaza Development Limited Var Perp 300,000 316,248 0.45Chalieco Hong Kong Corporation Frn Perp 200,000 206,540 0.29China Evergrande Group 7% Due
23/03/2020 505,000 510,005 0.72China Evergrande Group 8.25% Due
23/03/2022 600,000 613,602 0.87China Evergrande Group 8.75% Due
28/06/2025 1,669,000 1,631,197 2.31China Oil and Gas Group 4.625% Due
20/04/2022 200,000 200,448 0.28China SCE Property Holding 10% Due
02/07/2020 300,000 324,894 0.46China SCE Property Holdings 5.875% Due
10/03/2022 300,000 287,247 0.41China South City Holding 6.75% Due
13/09/2021 200,000 195,670 0.28CIFI Holdings Group Due 7.75% 05/06/2020 300,000 316,917 0.45CITIC Pacific Limited Var Perp 700,000 752,465 1.06

iShares Southeast Asia Trust 46
iShares Southeast Asia Trust(Constituted under a Trust Deed in the Republic of Singapore)
Statements of Portfolio (Unaudited)As at 30 June 2017
iShares Barclays USD Asia High Yield Bond Index ETF
Primary – By Industry (Continued)
Holdings at30 June 2017
Units
Fair Value at30 June 2017
US$
Percentage of Total Net Assets
Attributable to Unitholders at30 June 2017
%
BONDS – qUOTED (CONTINUED)
Industrial (Continued)CN Energy Reserve Chemicals 6.125% Due
15/01/2019 300,000 303,762 0.43Country Garden Holdings 4.75% Due
28/09/2023 600,000 577,752 0.82Country Garden Holdings 5.625% Due
15/12/2026 200,000 204,232 0.29Country Garden Holdings Company 7.5%
Due 09/03/2020 650,000 683,157 0.97Country Garden Holdings Company 7.5%
Due 10/01/2023 600,000 626,250 0.89Country Garden Holdings Company Limited
7.25% Due 04/04/2021 500,000 518,165 0.73Delhi International Airport Series 6.125%
Due 31/10/2026 350,000 374,850 0.53Dr Peng Holding Hongkong 5.05% Due
01/06/2020 200,000 200,235 0.28Fantasia Holdings Group 7.375% Due
04/10/2021 300,000 296,931 0.42Fita International Limited 7% Due
10/02/2020 500,000 548,075 0.78Fortune Star BVI Limited 5.25% Due
23/03/2022 900,000 882,297 1.25FPC Treasury Limited Series 4.5% Due
16/04/2023 400,000 408,076 0.58Franshion Brilliant Limited Var Perp 300,000 310,320 0.44Future Land Development 5% Due
16/02/2020 200,000 197,676 0.28Garuda ID Global Sukuk 5.95% Due
03/06/2020 400,000 417,348 0.59GCX Limited Series 7% Due 01/08/2019 200,000 180,142 0.26Global A&T Electronics 10% Due
01/02/2019 350,000 259,875 0.37Golden Eagle Retail Group 4.625% Due
21/05/2023 300,000 277,281 0.39

47 iShares Southeast Asia Trust
iShares Southeast Asia Trust(Constituted under a Trust Deed in the Republic of Singapore)
Statements of Portfolio (Unaudited)As at 30 June 2017
iShares Barclays USD Asia High Yield Bond Index ETF
Primary – By Industry (Continued)
Holdings at30 June 2017
Units
Fair Value at30 June 2017
US$
Percentage of Total Net Assets
Attributable to Unitholders at30 June 2017
%
BONDS – qUOTED (CONTINUED)
Industrial (Continued)Golden Legacy Private Limited Series 8.25%
Due 07/06/2021 250,000 266,827 0.38GOME Electrical Appliances 5% Due
10/03/2020 300,000 301,161 0.43Grand China Air (Hong Kong) Limited Series
Emtn 6.375% Due 07/03/2019 300,000 291,048 0.41Greenland Global Investment 4.375% Due
03/07/2019 300,000 298,821 0.42Greenland Global Investment 5.875% Due
03/07/2024 400,000 404,612 0.57Greenland Hong Kong Holding Limited
Series Emtn 3.875% Due 28/07/2019 350,000 343,077 0.49Greentown China Holdings 5.875% Due
11/08/2020 300,000 311,052 0.44Henson Finance Limited 5.5% Due
17/09/2019 300,000 319,038 0.45Hesteel Hong Kong Company Limited 4.25%
Due 07/04/2020 300,000 296,694 0.42HLP Finance Limited Series Emtn 4.45% Due
16/04/2021 250,000 262,365 0.37HLP Finance Limited Series Emtn 4.75% Due
25/06/2022 400,000 428,012 0.61HPCL-Mittal Energy Limited 5.25% Due
28/04/2027 250,000 257,485 0.36Huayi Finance I Limited Series 4% Due
02/12/2019 250,000 250,057 0.35ICTSI Treasury 4.625% Due 16/01/2023 300,000 308,862 0.44ICTSI Treasury Series Emtn 5.875% Due
17/09/2025 250,000 271,947 0.38Indo Energy Finance II 6.375% Due
24/01/2023 300,000 279,750 0.40JGSH Philippines Limited 4.375% Due
23/01/2023 500,000 514,115 0.73JSW Steel Limited 4.75% Due 12/11/2019 300,000 304,347 0.43

iShares Southeast Asia Trust 48
iShares Southeast Asia Trust(Constituted under a Trust Deed in the Republic of Singapore)
Statements of Portfolio (Unaudited)As at 30 June 2017
iShares Barclays USD Asia High Yield Bond Index ETF
Primary – By Industry (Continued)
Holdings at30 June 2017
Units
Fair Value at30 June 2017
US$
Percentage of Total Net Assets
Attributable to Unitholders at30 June 2017
%
BONDS – qUOTED (CONTINUED)
Industrial (Continued)JSW Steel Limited 5.25% Due 13/04/2022 300,000 303,531 0.43KWG Property Holding Limited 6% Due
15/09/2022 300,000 298,266 0.42KWG Property Holding Limited 8.25% Due
05/08/2019 400,000 415,840 0.59KWG Property Holding Limited 8.975% Due
14/01/2019 400,000 416,132 0.59Lenovo Group Limited 4.7% Due
08/05/2019 1,100,000 1,131,295 1.60Lenovo Group Limited Series Emtn 3.875%
Due 16/03/2022 200,000 200,642 0.28Lenovo Perpetual Securities Limited Series
Emtn Var Perp 650,000 661,895 0.94Logan Property Holdings 5.25% Due
23/02/2023 300,000 280,638 0.40Longfor Properties 6.75% Due 29/01/2023 300,000 313,779 0.44Marble II Pte Limited Sre 5.3% Due
20/06/2022 300,000 302,625 0.43Melco Resorts Finance 4.875% Due
06/06/2025 450,000 453,938 0.64MIE Holdings Corporation 7.5% Due
25/04/2019 300,000 175,125 0.25Moon Wise Global Var Perp 400,000 424,044 0.60New World Development Company 5.25%
Due 26/02/2021 550,000 586,828 0.83Noble Group Limited 6.75% Due
29/01/2020 800,000 306,000 0.43Noble Group Limited 8.75% Due
09/03/2022 300,000 115,500 0.16Noble Group Limited Var Due 24/06/2049 300,000 46,500 0.07NWD Mtn Limited Series Emtn 4.375% Due
30/11/2022 600,000 627,846 0.89Olam International Limited Series Emtn 4.5%
Due 12/04/2021 300,000 303,252 0.43

49 iShares Southeast Asia Trust
iShares Southeast Asia Trust(Constituted under a Trust Deed in the Republic of Singapore)
Statements of Portfolio (Unaudited)As at 30 June 2017
iShares Barclays USD Asia High Yield Bond Index ETF
Primary – By Industry (Continued)
Holdings at30 June 2017
Units
Fair Value at30 June 2017
US$
Percentage of Total Net Assets
Attributable to Unitholders at30 June 2017
%
BONDS – qUOTED (CONTINUED)
Industrial (Continued)Olam International Limited Series Emtn Var
Due Perp 350,000 347,462 0.49Petron Corporation Var Perp 400,000 418,716 0.59Proven Glory Capital Limited Series Emtn
3.25% Due 21/02/2022 650,000 652,919 0.92Proven Glory Capital Limited Series Emtn 4%
Due 21/02/2027 300,000 301,290 0.43Proven Honour Capital 4.125% Due
06/05/2026 1,100,000 1,121,131 1.59Proven Honour Capital 4.125% Due
19/05/2025 600,000 615,306 0.87PT Saka Energi Indonesia 4.45% Due
05/05/2024 400,000 402,052 0.57PTT Exploration and Production PCL Series
Var Perpetual 400,000 410,500 0.58RH International Finance Limited 3.875%
Due 20/07/2021 200,000 198,410 0.28Royal Capital Bv Var Due Perp 200,000 199,986 0.28San Miguel Corporation 4.875% Due
26/04/2023 300,000 307,422 0.44Shanxi Road & Bridge Construction 4.85%
Due 04/11/2019 250,000 253,172 0.36Shimao Property Holding Limited 8.125%
Due 22/01/2021 200,000 212,392 0.30Shimao Property Holding Limited 8.375%
Due 10/02/2022 900,000 992,529 1.40Shui On Development Holdings Limited
5.7% Due 06/02/2021 200,000 202,370 0.29Shui On Development Holdings Limited
9.625% Due 10/06/2019 500,000 524,265 0.74Shui On Development Holdings Limited Var
Perp 400,000 404,000 0.57SM Investments Corporation 4.25% Due
17/10/2019 300,000 309,948 0.44

iShares Southeast Asia Trust 50
iShares Southeast Asia Trust(Constituted under a Trust Deed in the Republic of Singapore)
Statements of Portfolio (Unaudited)As at 30 June 2017
iShares Barclays USD Asia High Yield Bond Index ETF
Primary – By Industry (Continued)
Holdings at30 June 2017
Units
Fair Value at30 June 2017
US$
Percentage of Total Net Assets
Attributable to Unitholders at30 June 2017
%
BONDS – qUOTED (CONTINUED)
Industrial (Continued)SM Investments Corporation 4.875% Due
10/06/2024 250,000 262,522 0.37Stats Chippac Limited Series 8.5% Due
24/11/2020 300,000 319,611 0.45Studio City Company Limited Series 5.875%
Due 30/11/2019 200,000 211,890 0.30Studio City Company Limited Series 7.25%
Due 30/11/2021 600,000 652,638 0.92Studio City Finance Limited 8.5% Due
01/12/2020 575,000 598,069 0.85Sunac China Holdings Limited 8.75% Due
05/12/2019 300,000 315,909 0.45Tata Motors Limited 4.625% Due
30/04/2020 300,000 310,626 0.44TBG Global Pte Limited Due 5.25%
10/02/2022 200,000 207,656 0.29Theta Capital Pte Limited 6.75% Due
31/10/2026 300,000 298,731 0.42Theta Capital Pte Limited 7% Due
11/04/2022 250,000 260,250 0.37Trafigura Group Pte Limited Var Perp 400,000 405,116 0.57Tunghsu Venus Holdings 7% Due
12/06/2020 200,000 198,559 0.28TVB Finance Limited 3.625% Due
11/10/2021 300,000 297,786 0.42Vedanta Resources Public Limited Company
6% Due 31/01/2019 500,000 518,565 0.73Vedanta Resources Public Limited Company
6.375% Due 30/07/2022 700,000 700,630 0.99Vedanta Resources Public Limited Company
7.125% Due 31/05/2023 200,000 205,916 0.29Vedanta Resources Public Limited Company
8.25% Due 07/06/2021 700,000 762,846 1.08

51 iShares Southeast Asia Trust
iShares Southeast Asia Trust(Constituted under a Trust Deed in the Republic of Singapore)
Statements of Portfolio (Unaudited)As at 30 June 2017
iShares Barclays USD Asia High Yield Bond Index ETF
Primary – By Industry (Continued)
Holdings at30 June 2017
Units
Fair Value at30 June 2017
US$
Percentage of Total Net Assets
Attributable to Unitholders at30 June 2017
%
BONDS – qUOTED (CONTINUED)
Industrial (Continued)West China Cement Limited 6.5% Due
11/09/2019 250,000 257,850 0.36Yancoal International Resources
Development Company Limited Stp Perpetual 300,000 304,326 0.43
Yanlord Land HK Co Limited5.875% Due 23/01/2022 350,000 361,148 0.51
Yuzhou Properties Company Limited 6% Due 25/02/2022 200,000 199,786 0.28
Zoomlion HK Spv Company Limited 6.125% Due 20/12/2022 350,000 352,142 0.50
46,131,987 65.28
Government RelatedChinalco Capital Holdings Limited 4% Due
25/08/2021 550,000 547,503 0.78Chinalco Capital Holdings Limited 4.25%
Due 21/04/2022 300,000 301,767 0.43Danga Capital 3.035% Due 01/03/2021 600,000 603,678 0.85Krung Thai Bank Public Company Limited
Series Emtn Var 26/12/2024 400,000 415,020 0.59Mongolia 5.125% Due 05/12/2022 550,000 518,012 0.73Mongolia 8.75% Due 09/03/2024 400,000 438,716 0.62Mongolia International Bond Series 10.875%
Due 06/04/2021 400,000 457,112 0.65National Savings Bank 8.875% Due
18/09/2018 200,000 211,788 0.30Republic of Islamic Pakistan 8.25% Due
15/04/2024 650,000 737,588 1.04Republic of Islamic Pakistan Series 7.25%
Due 15/04/2019 700,000 737,961 1.04Republic of Islamic Pakistan Series 8.25%
Due 30/09/2025 300,000 343,746 0.49

iShares Southeast Asia Trust 52
iShares Southeast Asia Trust(Constituted under a Trust Deed in the Republic of Singapore)
Statements of Portfolio (Unaudited)As at 30 June 2017
iShares Barclays USD Asia High Yield Bond Index ETF
Primary – By Industry (Continued)
Holdings at30 June 2017
Units
Fair Value at30 June 2017
US$
Percentage of Total Net Assets
Attributable to Unitholders at30 June 2017
%
BONDS – qUOTED (CONTINUED)
Government Related (Continued)Republic of Sri Lanka 5.125% Due
11/04/2019 250,000 255,882 0.36Republic of Sri Lanka 5.875% Due
25/07/2022 300,000 310,650 0.44Republic of Sri Lanka 6% Due 14/01/2019 200,000 206,760 0.29Republic of Sri Lanka 6.125% Due
03/06/2025 300,000 306,345 0.43Republic of Sri Lanka 6.2% Due 11/05/2027 350,000 349,181 0.49Republic of Sri Lanka 6.25% Due
04/10/2020 200,000 211,050 0.30Republic of Sri Lanka 6.25% Due
27/07/2021 450,000 477,990 0.68Republic of Sri Lanka 6.825% Due
18/07/2026 250,000 263,205 0.37Republic of Sri Lanka 6.85% Due
03/11/2025 400,000 421,708 0.60Republic of Vietnam 4.8% Due 19/11/2024 650,000 683,631 0.97Republic of Vietnam 6.75% Due 29/01/2020 500,000 545,145 0.77Third Pakistan International Sukuk Series
5.5% Due 13/10/2021 650,000 676,358 0.96Trade & Development Mongolia Due 9.375%
19/05/2020 300,000 318,618 0.45
10,339,414 14.63
UtilitiesFujian Zhanglong Group 4.5% Due
16/12/2019 350,000 349,153 0.49Greenko Group Public Limited Company
Series 8% Due 01/08/2019 400,000 416,784 0.59Greenko Investment Company Series 4.875%
Due 16/08/2023 300,000 293,025 0.42Huachen Energy 6.625% Due 18/05/2020 400,000 394,208 0.56Listrindo Capital 4.95% Due 14/09/2026 350,000 353,367 0.50Neerg Energy Limited 6% Due 13/02/2022 300,000 306,546 0.43

53 iShares Southeast Asia Trust
iShares Southeast Asia Trust(Constituted under a Trust Deed in the Republic of Singapore)
Statements of Portfolio (Unaudited)As at 30 June 2017
iShares Barclays USD Asia High Yield Bond Index ETF
Primary – By Industry (Continued)
Holdings at30 June 2017
Units
Fair Value at30 June 2017
US$
Percentage of Total Net Assets
Attributable to Unitholders at30 June 2017
%
BONDS – qUOTED (CONTINUED)
Utilities (Continued)United Photovoltaics Group 8.25% Due
25/01/2020 300,000 303,144 0.43
2,416,227 3.42
Accrued Interest Receivable on Debt Securities 1,059,842 1.50
Portfolio of Investments 70,599,411 99.90Other Net Assets 68,283 0.10
Net Assets Attributable to Unitholders 70,667,694 100.00

iShares Southeast Asia Trust 54
iShares Southeast Asia Trust(Constituted under a Trust Deed in the Republic of Singapore)
Statements of Portfolio (Unaudited)As at 30 June 2017
iShares Barclays USD Asia High Yield Bond Index ETF
Primary – By Industry (Summary)
Percentage ofTotal Net Assets Attributable to Unitholders at30 June 2017
%
Percentage ofTotal Net Assets Attributable to Unitholders at
31 December 2016%
Financial 15.07 12.30Industrial 65.28 67.24Government Related 14.63 16.76Utilities 3.42 1.80
Accrued Interest Receivable on Debt Securities 1.50 1.66
Portfolio of Investments 99.90 99.76Other Net Assets 0.10 0.24
Net Assets Attributable to Unitholders 100.00 100.00

55 iShares Southeast Asia Trust
iShares Southeast Asia Trust(Constituted under a Trust Deed in the Republic of Singapore)
Statements of Portfolio (Unaudited)As at 30 June 2017
iShares Barclays USD Asia High Yield Bond Index ETF
Secondary – By Geography
Fair Value at30 June 2017
US$
Percentage of Total Net Assets Attributable to Unitholders at 30 June 2017
%
Percentage of Total Net Assets Attributable to Unitholders at
31 December 2016%
BY COUNTRY OF RISK
Bermuda 180,142 0.26 0.35British Virgin Islands 2,952,841 4.18 4.99Cayman Islands 2,244,776 3.18 3.97China 28,089,924 39.74 34.61Great Britain 762,846 1.08 1.87Hong Kong 9,994,052 14.13 15.81India 6,466,891 9.16 8.30Indonesia 2,440,126 3.46 3.30Malaysia 603,678 0.85 0.71Mauritius 293,025 0.42 0.34Mongolia 1,732,458 2.45 2.46Netherlands 353,367 0.50 0.61Pakistan 2,495,653 3.53 3.98Philippines 2,922,405 4.14 4.46Singapore 1,946,998 2.75 2.54South Korea 991,532 1.40 1.72Sri Lanka 3,014,559 4.26 5.40Thailand 825,520 1.17 0.74Vietnam 1,228,776 1.74 1.94
Accrued Interest Receivable on Debt Securities 1,059,842 1.50 1.66
Portfolio of Investments 70,599,411 99.90 99.76Other Net Assets 68,283 0.10 0.24
Net Assets Attributable to Unitholders 70,667,694 100.00 100.00

iShares Southeast Asia Trust 56
iShares Southeast Asia Trust(Constituted under a Trust Deed in the Republic of Singapore)
Supplementary NotesFor the half year ended 30 June 2017
1. The TrustiShares Southeast Asia Trust (the “Trust”) is a Singapore-constituted umbrella unit trust created by a trust deed dated 31 May 2006 made under Singapore law between BlackRock (Singapore) Limited as Manager and HSBC Institutional Trust Services (Singapore) Limited as Trustee (the “Principal Deed”). The Principal Deed has been amended by a supplemental deed dated 15 June 2006, an amending and restating deed dated 24 June 2010, a second amending and restating deed dated 6 May 2011, a third amending and restating deed dated 11 November 2011, a fourth amending and restating deed dated 30 March 2012, a second supplemental deed dated 15 November 2012, a fifth amending and restating deed dated 1 July 2013 and a third supplemental deed dated 27 April 2015, each made between the Manager and the Trustee (as amended, the “Trust Deed”). The Trust is authorised under Section 286 of the Securities and Futures Act, Chapter 289 of Singapore.
As at 30 June 2017, there are three sub-funds (the “Sub-Funds”) established under the Trust:
Name of Sub-Fund Listing Date on the Singapore Exchange Securities Trading Limited (“SGX-ST”)
iShares MSCI India Index ETF 15 June 2006
iShares J.P. Morgan USD Asia Credit Bond Index ETF 2 June 2011
iShares Barclays USD Asia High Yield Bond Index ETF 8 December 2011
These financial statements relate to the three Sub-Funds.
iSharesMSCIIndiaIndexETF(“MSCIIndiaETF”)MSCI India ETF is the first Sub-Fund of the Trust and seeks to provide an investment return that corresponds generally to the performance of a diversified portfolio of Indian stocks as measured by the MSCI India Index.
All investments of MSCI India ETF are held through its investment in wholly-owned subsidiary, iShares MSCI India Mauritius Company (the ‘’Subsidiary’’).
iSharesJ.P.MorganUSDAsiaCreditBondIndexETF(“USDAsiaCreditBondETF”)The investment objective of USD Asia Credit Bond ETF is to provide investment results that, before fees and expenses, closely correspond to the performance of the J.P. Morgan Asia Credit Index - Core in US dollar terms.
iSharesBarclaysUSDAsiaHighYieldBondIndexETF(“USDAsiaHighYieldBondETF”)The investment objective of USD Asia High Yield Bond ETF is to provide investment results that, before fees and expenses, closely correspond to the performance of the Bloomberg Barclays Asia USD High Yield Diversified Credit Index in US dollar terms.

57 iShares Southeast Asia Trust
iShares Southeast Asia Trust(Constituted under a Trust Deed in the Republic of Singapore)
Supplementary NotesFor the half year ended 30 June 2017
2. Significant Accounting Policies(a) Basis of accounting
The financial statements have been prepared under the historical cost convention, modified by the revaluation of financial assets at fair value through profit or loss and in accordance with the recommendations of Statement of Recommended Accounting Practice 7 “Reporting Framework for Unit Trusts” issued by the Institute of Singapore Chartered Accountants. These interim financial statements comprise the Statements of Total Return, Statements of Financial Position, Statements of Movements in Unitholders’ Funds and Statements of Portfolio. Supplementary information on Distributions, Units in issue, Related Party Transactions and Financial Ratios are also presented.
The accounting policies and methods of computation adopted in the preparation of the half year financial report are consistent with those of the annual financial statements for the year ended 31 December 2016.
The financial statements are presented in US dollars, which is the functional currency of the Sub-Funds.
(b) Fair value estimationThe Sub-Funds classify fair value measurements using a fair value hierarchy that reflects the significance of the inputs used in making the measurements. The fair value hierarchy has the following levels:
• Quoted prices (unadjusted) in active markets for identical assets or liabilities (Level 1).
• Inputs other than quoted prices included within level 1 that are observable for the asset or liability, either directly (that is, as prices) or indirectly (that is, derived from prices) (Level 2).
• Inputs for the asset or liability that are not based on observable market data (that is, unobservable inputs) (Level 3).
The following table analyses within the fair value hierarchy the Sub-Funds’ financial assets and liabilities (by class) measured at fair value at 30 June 2017 and 31 December 2016:
MSCI India ETF
As at 30 June 2017Level 1
US$Level 2
US$Level 3
US$TotalUS$
Assets
Portfolio of InvestmentsFinancial Assets Designated at
Fair Value Through Profit or Loss – Equity Securities – 308,860,761 – 308,860,761
As at 31 December 2016Level 1
US$Level 2
US$Level 3
US$TotalUS$
Assets
Portfolio of InvestmentsFinancial Assets Designated at
Fair Value Through Profit or Loss – Equity Securities – 363,925,276 – 363,925,276

iShares Southeast Asia Trust 58
iShares Southeast Asia Trust(Constituted under a Trust Deed in the Republic of Singapore)
Supplementary NotesFor the half year ended 30 June 2017
2. Significant Accounting Policies (Continued)(b) Fair value estimation (Continued)
The Subsidiary’s investment in equity securities amounting to US$307,410,227 (2016: US$474,030,224) is classified as Level 1. Their values are based on quoted market prices in active markets.
USD Asia Credit Bond ETF
As at 30 June 2017Level 1
US$Level 2
US$Level 3
US$TotalUS$
Assets
Portfolio of InvestmentsFinancial Assets Designated at
Fair Value Through Profit or Loss – Quoted Debt Securities – 38,624,091 – 38,624,091
As at 31 December 2016Level 1
US$Level 2
US$Level 3
US$TotalUS$
Assets
Portfolio of InvestmentsFinancial Assets Designated at
Fair Value Through Profit or Loss – Quoted Debt Securities – 45,759,447 – 45,759,447
USD Asia High Yield Bond ETF
As at 30 June 2017Level 1
US$Level 2
US$Level 3
US$TotalUS$
Assets
Portfolio of InvestmentsFinancial Assets Designated at
Fair Value Through Profit or Loss – Quoted Debt Securities – 70,599,411 – 70,599,411
As at 31 December 2016Level 1
US$Level 2
US$Level 3
US$TotalUS$
Assets
Portfolio of InvestmentsFinancial Assets Designated at
Fair Value Through Profit or Loss – Quoted Debt Securities – 55,714,336 – 55,714,336

59 iShares Southeast Asia Trust
iShares Southeast Asia Trust(Constituted under a Trust Deed in the Republic of Singapore)
Supplementary NotesFor the half year ended 30 June 2017
3. Distributions
USD Asia Credit Bond ETF30 June 2017
US$
31 December2016US$
quarter 1 ($0.10 per unit based on 4,174,844 units, recorded as at 3 March 2017) 417,484 –
quarter 2 ($0.11 per unit based on 3,624,754 units, recorded as at 5 June 2017) 398,723 –
quarter 1 ($0.11 per unit based on 6,854,075 units, recorded as at 3 March 2016) – 753,948
quarter 2 ($0.11 per unit based on 6,575,138 units, recorded as at 3 June 2016) – 723,265
quarter 3 ($0.11 per unit based on 6,314,645 units, recorded as at 5 September 2016) – 694,611
quarter 4 ($0.13 per unit based on 4,634,844 units, recorded as at 5 December 2016) – 602,530
816,207 2,774,354

iShares Southeast Asia Trust 60
iShares Southeast Asia Trust(Constituted under a Trust Deed in the Republic of Singapore)
Supplementary NotesFor the half year ended 30 June 2017
3. Distributions (Continued)
USD Asia High Yield Bond ETF30 June 2017
US$
31 December2016US$
quarter 1 ($0.17 per unit based on 5,868,059 units, recorded as at 3 March 2017) 997,570 –
quarter 2 ($0.14 per unit based on 6,262,059 units, recorded as at 5 June 2017) 876,688 –
quarter 1 ($0.18 per unit based on 6,137,405 units, recorded as at 3 March 2016) – 1,104,733
quarter 2 ($0.21 per unit based on 4,871,085 units, recorded as at 3 June 2016) – 1,022,928
quarter 3 ($0.18 per unit based on 5,816,650 units, recorded as at 5 September 2016) – 1,046,997
quarter 4 ($0.17 per unit based on 5,066,650 units, recorded as at 5 December 2016) – 861,330
1,874,258 4,035,988
No distribution was made to the unitholders of MSCI India ETF for the half year ended 30 June 2017 (31 December 2016: Nil).

61 iShares Southeast Asia Trust
iShares Southeast Asia Trust(Constituted under a Trust Deed in the Republic of Singapore)
Supplementary NotesFor the half year ended 30 June 2017
4. Units in issue
MSCI India ETF30 June 2017
Units
31 December 2016Units
Beginning of Financial Period/Year 54,500,000 74,500,000
Created during Financial Period/Year - 2,000,000
Cancelled during Financial Period/Year (16,000,000) (22,000,000)
End of Financial Period/Year 38,500,000 54,500,000
USD Asia Credit Bond ETF30 June 2017
Units
31 December 2016Units
Beginning of Financial Period/Year 4,384,844 6,710,755
Created during Financial Period/Year 225,000 1,681,975
Cancelled during Financial Period/Year (985,090) (4,007,906)
End of Financial Period/Year 3,624,754 4,384,844
USD Asia High Yield Bond ETF30 June 2017
Units
31 December 2016Units
Beginning of Financial Period/Year 5,227,810 6,363,100
Created during Financial Period/Year 1,404,249 2,432,330
Cancelled during Financial Period/Year (50,000) (3,567,620)
End of Financial Period/Year 6,582,059 5,227,810
5. Related Party TransactionsThe Manager and the Trustee of the Sub-Funds are BlackRock (Singapore) Limited and HSBC Institutional Trust Services (Singapore) Limited respectively.
HSBC Institutional Trust Services (Singapore) Limited is a subsidiary of HSBC Holdings PLC.
Management fees are paid to the Manager. Trustee fees, registrar fees and custody fees are paid to the Trustee or its related company (as applicable) from the management fees based on terms set out in the Trust Deed.

iShares Southeast Asia Trust 62
iShares Southeast Asia Trust(Constituted under a Trust Deed in the Republic of Singapore)
Supplementary NotesFor the half year ended 30 June 2017
6. Financial Ratios
MSCI India ETF 30 June 2017 30 June 2016
Expense Ratio 0.87% 1.08%
Turnover Ratio – 2.98%
USD Asia Credit Bond ETF 30 June 2017 30 June 2016
Expense Ratio 0.27% 0.29%
Turnover Ratio 32.14% 35.66%
USD Asia High Yield Bond ETF 30 June 2017 30 June 2016
Expense Ratio 0.44% 0.54%
Turnover Ratio 50.02% 72.64%
The expense ratios have been computed based on the guidelines laid down by the Investment Management Association of Singapore (“IMAS”). MSCI India ETF’s expense ratio is the sum of the Sub-Fund’s expense ratio and the weighted average of the underlying fund’s expense ratio.
The calculation of the Sub-Funds’ expense ratios at 30 June 2017 was based on total operating expenses divided by the average net asset value for the year. The total operating expenses do not include (where applicable) brokerage and other transaction costs, performance fee, interest expense, distribution paid out to unitholders, foreign exchange gains/losses, front or back end loads arising from the purchase or sale of the other funds and tax deducted at source or arising out of income received. The Sub-Funds do not pay any performance fee. The average net asset value is based on the daily balances.
The following table presents the total operating expenses and average net asset values of the Sub-Funds for the period ended 30 June 2017:
MSCI India ETF30 June 2017
US$30 June 2016
US$
Total Operating Expenses 2,867,432 4,845,769
Average Net Asset Value 406,276,930 523,070,705
Weighted Average Expense Ratio of the Underlying Fund 0.16% 0.15%
USD Asia Credit Bond ETF30 June 2017
US$30 June 2016
US$
Total Operating Expenses 139,241 181,575
Average Net Asset Value 51,800,493 62,989,043

63 iShares Southeast Asia Trust
iShares Southeast Asia Trust(Constituted under a Trust Deed in the Republic of Singapore)
Supplementary NotesFor the half year ended 30 June 2017
6. Financial Ratios (Continued)
USD Asia High Yield Bond ETF30 June 2017
US$30 June 2016
US$
Total Operating Expenses 276,048 351,346
Average Net Asset Value 62,291,652 65,056,703
The portfolio turnover ratios are calculated in accordance with the formula stated in the Code on Collective Investment Schemes. The calculation of the portfolio turnover ratio was based on the lower of the total value of purchases or sales of the underlying investments divided by the average daily net asset value as below:
MSCI India ETF30 June 2017
US$30 June 2016
US$
Total Value of Purchases or Sales – 13,338,928
Average Daily Net Asset Value 340,714,841 447,324,660
USD Asia Credit Bond ETF30 June 2017
US$30 June 2016
US$
Total Value of Purchases or Sales 13,359,102 25,128,870
Average Daily Net Asset Value 41,559,812 70,471,171
USD Asia High Yield Bond ETF30 June 2017
US$30 June 2016
US$
Total Value of Purchases or Sales 31,932,020 43,982,996
Average Daily Net Asset Value 63,840,415 60,545,659
In accordance with the Sub-Funds’ Trust Deed, units of the MSCI India ETF are issued through a creation of an Index Basket for each creating unit (comprising 500,000 units), the MSCI India ETF receives an Index Basket consisting of constituent shares plus or minus a cash payment as determined by the Manager on a daily basis. For the purpose of computation of the portfolio turnover rate, the value of the Index Baskets received is not considered as part of purchases.

iShares Southeast Asia Trust 64
Directors of the ManagerKevin Shane Lee Hardy
Lynda HallMichael Timothy Marquardt (Resigned on 10 February 2017)
Shane Andrew FlatmanToby Cameron Robert Ritch (Appointed on 26 August 2016)
Robert William Lamb (Appointed on 26 August 2016)
Manager Trustee and RegistrarBlackRock (Singapore) Limited HSBC Institutional Trust Services
#18-01, Twenty Anson (Singapore) Limited20 Anson Road 21 Collyer Quay
Singapore 079912 #13-02 HSBC BuildingCompany Registration No. 200010143N Singapore 049320
Company Registration No. 194900022R
Sub-Manager Custodian(for iShares MSCI India Index ETF only) The Hongkong and Shanghai
BlackRock Asset Management North Asia Limited Banking Corporation Limited16/F Champion Tower 1 Queen’s Road Central3 Garden Road Central Hong Kong
Hong Kong
AuditorsPricewaterhouseCoopers LLP
8 Cross Street#17-00 PWC Building
Singapore 048424
iShares Southeast Asia Trust(Constituted under a Trust Deed in the Republic of Singapore)
Management and Administration

65 iShares Southeast Asia Trust
Any opinions expressed herein reflect the Manager’s view at this date and are subject to change. Investors should not rely on the information contained in this report for their final investment decisions. For more information about the Fund including the related risks and other important information, please refer to the prospectus of the Fund which is available by contacting the Manager or visiting the website www.iShares.com.sg.
MSCI and the MSCI Index names are service mark(s) of MSCI Inc. (“MSCI”) or its affiliates and have been licensed for certain purposes by BlackRock. The Fund is not sponsored, endorsed, sold or promoted by MSCI. Nor does MSCI make any representation or warranty, express or implied, regarding the index(es) or the advisability of investing in any fund. The iShares MSCI India Index ETF is not sponsored, endorsed, issued, sold or promoted by MSCI. Nor does this company make any representation regarding the advisability of investing in the iShares MSCI India Index ETF.
J.P. Morgan and the J.P. Morgan Index name are the service marks of JPMorgan Chase & Co. and its affiliates (“J.P. Morgan”) and have been licensed for certain uses by BlackRock Institutional Trust Company, N.A. This is not an offer by J.P. Morgan to sell or a solicitation of an offer to buy shares of the iShares Funds. The iShares Funds are not sponsored, endorsed, sold or promoted by J.P. Morgan. J.P. Morgan bears no liability and makes no representation regarding the iShares Funds or the advisability of investing in the iShares Funds. This is not intended to be and should not be regarded as tax, legal, accounting or other professional advice. The J.P. Morgan Index is the exclusive property of J.P. Morgan. J.P. Morgan does not warrant the completeness or accuracy of the J.P. Morgan Index. J.P. Morgan is not affiliated with BlackRock Institutional Trust Company, N.A. or any of its affiliates.
©2017 JPMorgan Chase & Co. All rights reserved.
The iShares Funds are not sponsored, endorsed or issued by Bloomberg Finance L.P. or Barclays, nor do these companies make any representation regarding the advisability of investing in the Funds. BlackRock is not affiliated with the companies listed above.
iShares® and BlackRock® are registered trademarks of BlackRock, Inc., or its subsidiaries in the United States and elsewhere. All other trademarks, servicemarks or registered trademarks are the property of their respective owners.
© 2017 BlackRock Inc. All rights reserved.
iShares Southeast Asia Trust(Constituted under a Trust Deed in the Republic of Singapore)

About us
BlackRock is a premier provider of asset management, risk management, and advisory services to institutional, intermediary, and individual clients worldwide. As of 31 December 2016, the firm manages £4.18 trillion across asset classes in separate accounts, mutual funds, other pooled investment vehicles, and the industry-leading iShares® exchange-traded funds.
Through BlackRock Solutions®, the firm offers risk management and advisory services that combine capital markets expertise with proprietarily-developed analytics, systems, and technology. Through BlackRock Solutions®, the Firm provides risk management and enterprise investment services for over 200 clients.
BlackRock serves clients in North and South America, Europe, Asia, Australia, Africa, and the Middle East. Headquartered in New York, the firm maintains offices in over 30 countries around the world.
Want to know more?
blackrock.com.sg [email protected] (65) 6411 3388