2017 second quarter results - · pdf filedisclaimer the financial information in this document...
TRANSCRIPT

LOTTE SHOPPING CO., LTD
INVESTOR RELATIONS
2017 Second Quarter Results
July, 2017

LOTTE SHOPPING CO., LTD
Disclaimer
The financial information in this document are consolidated earnings results based on K-IFRS. The previous earnings results have also been stated in compliance with K-IFRS.
This release includes preliminary figures that are still undergoing independent auditor review. The actual results may differ from those included in this release due to a variety of factors. Lotte Shopping Company undertakes no obligation to update or revise the preliminary provided in this release.

LOTTE SHOPPING CO., LTD
Highlights FY17Q2
2Q17 Revenue 7.4 trillion KRW(-1.4% YoY), 1H17 14.9 trillion KRW(-0.5% YoY)
– Domestic: Dept. stores indicated weak SSSG(same store sales growth) due to sluggish industry
condition and dramatic decline of inbound Chinese tourists
Hypermarkets indicated solid SSSG due to consumer sentiment improvement and
promotion effort
· SSSG: [Dept. store -5.2%(2Q), -5.0%(1H)] / [Hypermarket +4.2%(2Q), -0.7%(1H)]
– Overseas : Weak SSSG stretched in dept. stores/hypermarkets in China due to THAAD missile conflict
However, dept. stores/hypermarkets continued steady sales growth trend in Vietnam
and Indonesia
· SSSG: [Dept. store -18.5%(2Q), -11.1%(1H)] / [Hypermarket -38.0%(2Q), -24.5%(1H)]
2Q17 Operating profit 87 billion KRW(-49.0% YoY), 1H 295 billion KRW(-22.3% YoY)
– Domestic : Dept. store – Operating profit declined due to decreased sales revenue
Hypermarket – Improved operating loss driven by SSSG turnaround
– Overseas : Dept. store – Operating loss contained at YoY level through strict SG&A management
Hypermarket – Operating loss increased due to continuation of store shutdowns in China
※ Estimated real estate tax in 2017: 99 billion KRW(+4 billion KRW YoY) (domestic operations only, non-consolidated financial statement)
→ Department store: 63 billion KRW(+3 billion KRW YoY), hypermarket: 33 billion KRW(+1 billion KRW YoY)
2Q17 Profit before tax 56 billion KRW(-62.6% YOY), 1H17 246 billion KRW(-12.0% YoY)
3

LOTTE SHOPPING CO., LTD
Table of Contents
1. Q2 Consolidated Financial Results
2. Q2 Consolidated Financial Results by Division
3. Non-Operating Profit Analysis
4

LOTTE SHOPPING CO., LTD
1. Consolidated Financial Results
(Unit : billion KRW)
*Number of consolidated affiliates: 76
5
2Q 2016 2Q 2017 YoY 1H 2016 1H 2017 YoY
Gross Sales 7,504 7,401 -1.4% 14,965 14,893 -0.5%
OperatingProfit
171 87 -49.0% 379 295 -22.3%
EBITDA 371 283 -23.7% 780 690 -11.6%
Profit before tax
149 56 -62.6% 280 246 -12.0%
Net Profit 82 4 -95.0% 148 116 -22.0%

LOTTE SHOPPING CO., LTD
2. Financial Summary by Division
* includes consolidation adjustments
(Unit : billion KRW)
6
2Q 2016 2Q 2017 YoY 1H 2016 1H 2017 YoY
Revenue 7,504 (100.0%) 7,401 (100.0%) -1.4% 14,965 (100.0%) 14,893 (100%) -0.5%
Departmentstores
2,126 (28.2%) 2,008 (27.1%) -5.6% 4,293 (28.7%) 4,081 (27.3%) -4.9%
Hypermarkets 2,070 (27.6%) 1,906 (25.8%) -7.9% 4,261 (28.5%) 3,981 (26.7%) -6.6%
Electronics 951 (12.7%) 1,064 (14.3%) 11.9% 1,838 (12.3%) 1,961 (13.2%) 6.7%
Finance 450 (6.0%) 419 (5.7%) -6.8% 884 (5.9%) 980 (6.6%) 10.9%
CVS 942 (12.6%) 976 (13.2%) 3.6% 1,773 (11.8%) 1,841 (12.4%) 3.8%
Others* 965 (12.9%) 1,028 (13.9%) 6.5% 1,916 (12.8%) 2,049 (13.8%) 107.0%
OperatingProfit
171 2.3% 87 1.2% -49.0% 379 2.5% 295 2.0% -22.3%
DepartmentStores
90 4.2% 40 2.0% -55.6% 235 5.5% 154 3.8% -34.4%
Hypermarkets -63 - -77 - - -61 - -96 - -
Electronics 41 4.3% 61 5.8% 50.0% 69 3.7% 98 5.0% 42.0%
Finance 62 13.7% 28 6.8% -53.7% 94 10.6% 84 8.5% -10.9%
CVS 18 1.9% 21 2.1% 14.8% 20 1.1% 21 1.2% 8.7%
Others* 23 2.4% 14 1.3% -42.5% 22 2.3% 34 3.3% 153.1%
LOTTE SHOPPING CO., LTD
OverseasDomestic
Department Stores
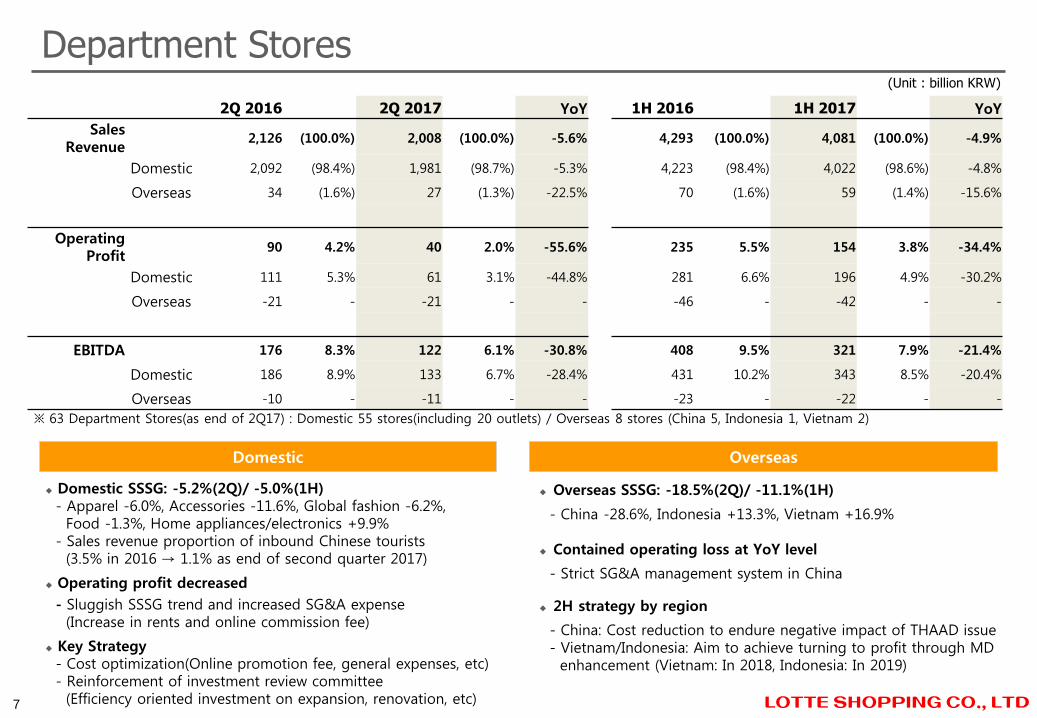
※ 63 Department Stores(as end of 2Q17) : Domestic 55 stores(including 20 outlets) / Overseas 8 stores (China 5, Indonesia 1, Vietnam 2)
Domestic SSSG: -5.2%(2Q)/ -5.0%(1H) - Apparel -6.0%, Accessories -11.6%, Global fashion -6.2%, Food -1.3%, Home appliances/electronics +9.9%
- Sales revenue proportion of inbound Chinese tourists (3.5% in 2016 → 1.1% as end of second quarter 2017)
Operating profit decreased
- Sluggish SSSG trend and increased SG&A expense (Increase in rents and online commission fee)
Key Strategy- Cost optimization(Online promotion fee, general expenses, etc)- Reinforcement of investment review committee (Efficiency oriented investment on expansion, renovation, etc)
Overseas SSSG: -18.5%(2Q)/ -11.1%(1H)
- China -28.6%, Indonesia +13.3%, Vietnam +16.9%
Contained operating loss at YoY level
- Strict SG&A management system in China
2H strategy by region
- China: Cost reduction to endure negative impact of THAAD issue - Vietnam/Indonesia: Aim to achieve turning to profit through MD enhancement (Vietnam: In 2018, Indonesia: In 2019)
(Unit : billion KRW)
7
2Q 2016 2Q 2017 YoY 1H 2016 1H 2017 YoY
SalesRevenue
2,126 (100.0%) 2,008 (100.0%) -5.6% 4,293 (100.0%) 4,081 (100.0%) -4.9%
Domestic 2,092 (98.4%) 1,981 (98.7%) -5.3% 4,223 (98.4%) 4,022 (98.6%) -4.8%
Overseas 34 (1.6%) 27 (1.3%) -22.5% 70 (1.6%) 59 (1.4%) -15.6%
OperatingProfit
90 4.2% 40 2.0% -55.6% 235 5.5% 154 3.8% -34.4%
Domestic 111 5.3% 61 3.1% -44.8% 281 6.6% 196 4.9% -30.2%
Overseas -21 - -21 - - -46 - -42 - -
EBITDA 176 8.3% 122 6.1% -30.8% 408 9.5% 321 7.9% -21.4%
Domestic 186 8.9% 133 6.7% -28.4% 431 10.2% 343 8.5% -20.4%
Overseas -10 - -11 - - -23 - -22 - -

LOTTE SHOPPING CO., LTD
Domestic SSSG: +4.2%(2Q)/ -0.7%(1H)- Fresh food +10.8%, Processed food +5.5%, Living +2.5%, Apparel & accessories -4.2%
- Sales Revenue increased driven by strong growth in fresh food salesthrough quality innovation effort and promotion effect
Operating loss improvement induced by solid SSSG trend
New store openings- Yangpyeong Seoul(April): The concept of, ‘healing in the city’- 2nd Half : Seocho(July), KimpoHangang(Sept), DaeguChilsung(Sept),
Yangpyeong Gyeonggi(Nov), PohangDooho(Dec)
OverseasDomestic
※ 291 Stores(as end of 2Q17): Domestic 121, Overseas 170(China 112 stores, Indonesia 45, Vietnam 13)
Hypermarkets
Overseas SSSG: -38.0%(2Q)/ -24.5%(1H)- China -94.9%, Indonesia +0.8%, Vietnam +1.0% - THAAD issue impact in China: forced closure: 74 stores
temporary closed: 13 stores (as of the end of June)
Operating loss increased in China due to store shutdowns Improved profitability continued in Vietnam/Indonesia operations
2H strategy by region
- China: Cost minimization(Labor cost and inventory reduction, etc)- Indonesia: Fresh food innovation(retail&wholesale joint sourcing),
Expansion of PB development - Vietnam: PB Global sourcing enhancement, sales channel diversification
(Unit : billion KRW)
8
2Q 2016 2Q 2017 YoY 1H 2016 1H 2017 YoYSales
Revenue 2,070 (100.0%) 1,906 (100.0%) -7.9% 4,261 (100.0%) 3,981 (100.0%) -6.6%
Domestic 1,398 (67.5%) 1,493 (78.3%) 6.8% 2,934 (68.9%) 3,006 (75.5%) 2.5%
*Overseas 672 (32.5%) 413 (21.7%) -38.5% 1,327 (31.1%) 975 (24.5%) -26.5%
Operating Profit -63 - -77 - - -61 - -96 - -
Domestic -30 - -22 - - 0 - -13 - -
*Overseas -33 - -55 - - -61 - -83 - -
EBITDA -7 - -20 - - 51 1.2% 15 0.4% -70.3%
Domestic 10 0.7% 20 1.3% 107.6% 79 2.7% 68 2.3% -13.3%
*Overseas -17 - -40 - - -28 - -53 - -

LOTTE SHOPPING CO., LTD
Key Factors
※ 458 stores (as end of 2Q17)
Electronics
Gross revenue growth: +11.9% YoY
- 458 stores in total (+16 new store openings YoY)
- Strong growth from online and omni-channel related sales channels
- Continuous growth in white appliances (Laundry drying machine)
- Strong sales growth of health related small electronic
home appliances (Air purifier, Vacuum, etc)
Operating profit growth: +50.0% (YoY)
- Gross profit margin improvement driven by higher margin product
sales growth (26.5% → 28.0%)
2H Outlook
- Sales growth expected from mobile categories through introduction
of Samsung Galaxy Note 8, Iphone 8
- Expected sales growth in seasonal products due to monsoon season
2017 Strategy
- Expansion of online business through effective investment
- Differentiation through expansion of PB and global brand offerings
- Customer relationship development to become “Home & Lifestyle Retailer”
(Unit : billion KRW)
9
2Q 2016 2Q 2017 YoY 1H 2016 1H 2017 YoY
Sales Revenue
951 100.0% 1,064 100.0% 11.9% 1,838 100.0% 1,961 100.0% 6.7%
OperatingProfit
41 4.3% 61 5.8% 50.0% 69 3.7% 98 5.0% 42.0%
EBITDA 53 5.5% 72 6.8% 36.7% 93 5.0% 120 6.1% 29.3%
Net Profit 29 3.0% 45 4.3% 57.2% 48 2.6% 71 3.6% 47.9%
LOTTE SHOPPING CO., LTD
Summary Income Statement Transaction Volume & Other Highlights
Earning Asset Portfolio
(Unit: %)
Key Factors
Finance
(Unit: billion, %)
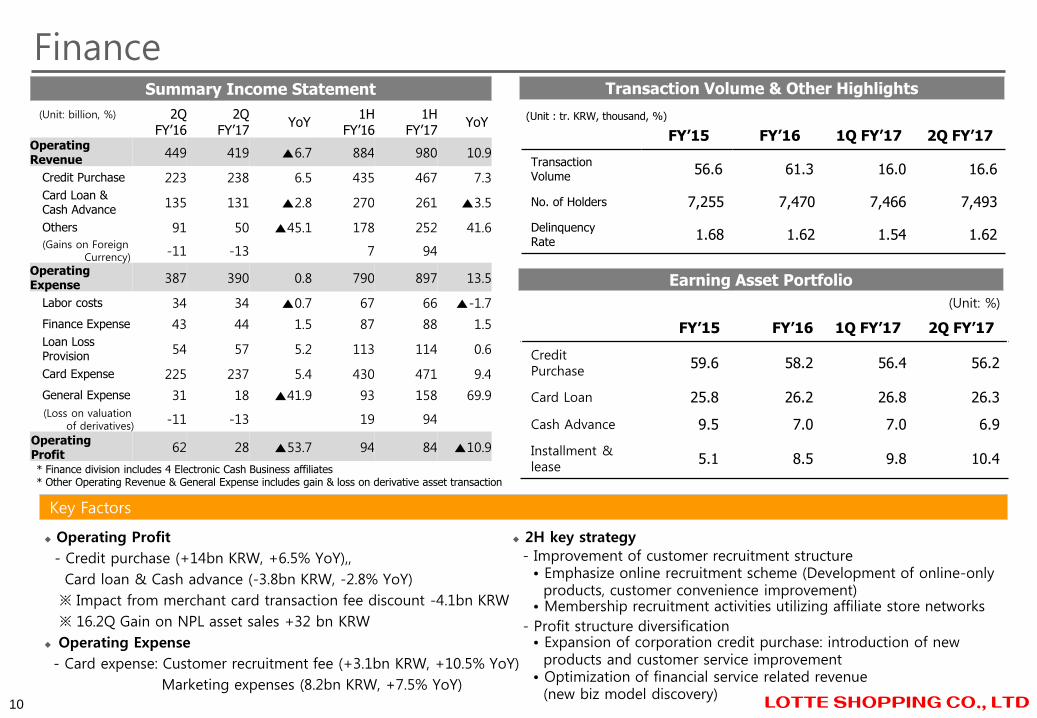
* Finance division includes 4 Electronic Cash Business affiliates* Other Operating Revenue & General Expense includes gain & loss on derivative asset transaction
2H key strategy
- Improvement of customer recruitment structure • Emphasize online recruitment scheme (Development of online-only
products, customer convenience improvement)• Membership recruitment activities utilizing affiliate store networks
- Profit structure diversification • Expansion of corporation credit purchase: introduction of new
products and customer service improvement• Optimization of financial service related revenue
(new biz model discovery)
Operating Profit
- Credit purchase (+14bn KRW, +6.5% YoY),,
Card loan & Cash advance (-3.8bn KRW, -2.8% YoY)
※ Impact from merchant card transaction fee discount -4.1bn KRW
※ 16.2Q Gain on NPL asset sales +32 bn KRW
Operating Expense
- Card expense: Customer recruitment fee (+3.1bn KRW, +10.5% YoY)
Marketing expenses (8.2bn KRW, +7.5% YoY)
(Unit : tr. KRW, thousand, %)
10
2QFY’16
2Q FY’17
YoY1H
FY’161H
FY’17YoY
Operating Revenue
449 419 ▲6.7 884 980 10.9
Credit Purchase 223 238 6.5 435 467 7.3
Card Loan & Cash Advance
135 131 ▲2.8 270 261 ▲3.5
Others 91 50 ▲45.1 178 252 41.6(Gains on Foreign
Currency) -11 -13 7 94
Operating Expense
387 390 0.8 790 897 13.5
Labor costs 34 34 ▲0.7 67 66 ▲-1.7
Finance Expense 43 44 1.5 87 88 1.5
Loan LossProvision
54 57 5.2 113 114 0.6
Card Expense 225 237 5.4 430 471 9.4
General Expense 31 18 ▲41.9 93 158 69.9
(Loss on valuationof derivatives)
-11 -13 19 94
Operating Profit
62 28 ▲53.7 94 84 ▲10.9
FY’15 FY’16 1Q FY’17 2Q FY’17
TransactionVolume
56.6 61.3 16.0 16.6
No. of Holders 7,255 7,470 7,466 7,493
DelinquencyRate
1.68 1.62 1.54 1.62
FY’15 FY’16 1Q FY’17 2Q FY’17
Credit Purchase
59.6 58.2 56.4 56.2
Card Loan 25.8 26.2 26.8 26.3
Cash Advance 9.5 7.0 7.0 6.9
Installment & lease
5.1 8.5 9.8 10.4

LOTTE SHOPPING CO., LTD
Key Factors
※ 8,943 stores (as end of 2Q17)
CVS
2Q Revenue: +3.6%(YoY)
- 8,943 stores in total (+716 new stores YoY)
- Decrease in average daily sales per store
: Decline in tobacco sales due to aversive graphic images placed
on the cigarette packets
2Q Operating profit: +14.8% (YoY)
- Increased operating profit driven by improvement in general
products margin and re-structuring underperforming stores
2H Strategy
- Process reengineeringㆍStore enhancement activities, closure of poor performing stores
- Store transformationㆍDifferentiated store openings depending on the
market environment(Ex: Café type, in-office type, complexed MD type)
- MD innovationㆍExpansion of small sized HMR items: produce portfolio diversificationㆍExpand collaboration with affiliates: Development of popular dessert
from department store
(Unit : billion KRW)
11
2Q 2016 2Q 2017 YoY 1H 2016 1H 2017 YoY
Revenue 942 100.0% 976 100.0% 3.6% 1,773 100.0% 1,841 100.0% 3.8%
OperatingProfit
18 1.9% 21 2.1% 14.8% 20 1.1% 21 1.2% 8.7%
EBITDA 32 3.4% 35 3.5% 7.8% 47 2.7% 49 2.7% 3.6%
LOTTE SHOPPING CO., LTD
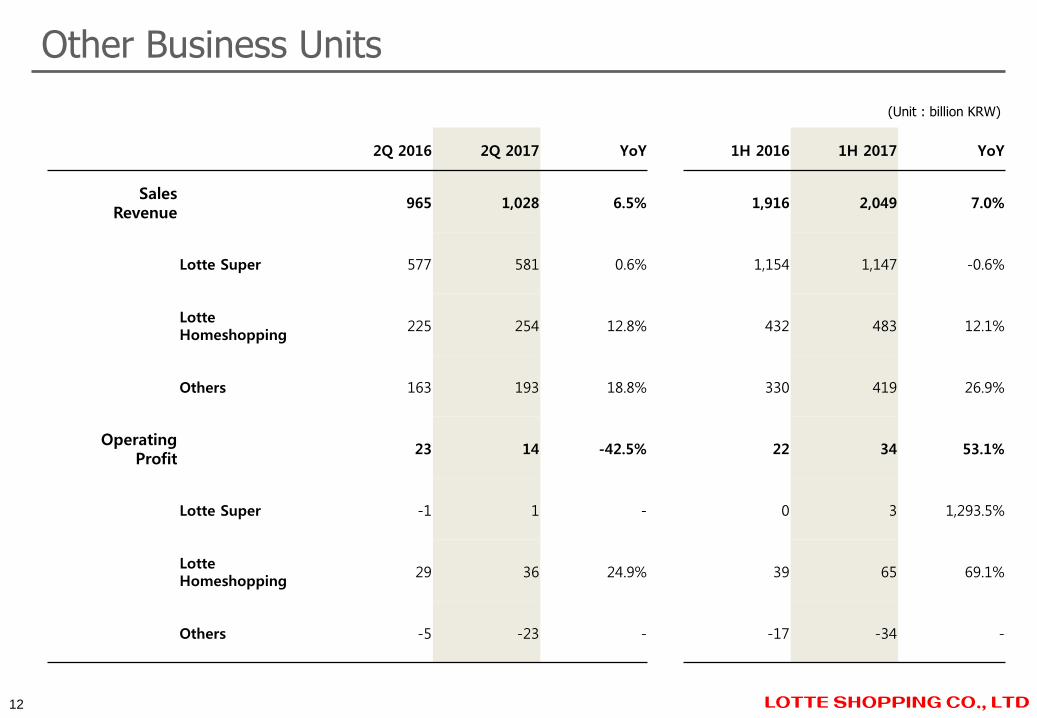
Other Business Units
(Unit : billion KRW)
12
2Q 2016 2Q 2017 YoY 1H 2016 1H 2017 YoY
SalesRevenue
965 1,028 6.5% 1,916 2,049 7.0%
Lotte Super 577 581 0.6% 1,154 1,147 -0.6%
LotteHomeshopping
225 254 12.8% 432 483 12.1%
Others 163 193 18.8% 330 419 26.9%
OperatingProfit
23 14 -42.5% 22 34 53.1%
Lotte Super -1 1 - 0 3 1,293.5%
LotteHomeshopping
29 36 24.9% 39 65 69.1%
Others -5 -23 - -17 -34 -

LOTTE SHOPPING CO., LTD
3. Non-Operating Profit Analysis(Unit : billion KRW)
13
2Q 2016 2Q 2017 YoY 1H 2016 1H 2017 YoY
Operating Profit 171 87 -49.0% 379 295 -22.3%
Net Interest Income/Expense
-36 -37 - -77 -75 -
Gains on Foreign Currency& Derivative Asset
15 -4 - 17 8 -36.3%
Other non-operating profit -10 -19 - -45 -31 -
Equity Method Gain & Loss
9 29 221.6% 6 49 749.0%
Profit Before Tax 149 56 -62.6% 280 246 -12.0%
Corporate tax 67 52 -22.9% 132 130 -0.6%
Net Profit 82 4 -95.0% 148 116 -22.0%

LOTTE SHOPPING CO., LTD
LOTTE SHOPPING CO., LTD Appendix
Income Statement
Balance Sheet
Lotte Marts in Overseas
Store Network

LOTTE SHOPPING CO., LTD
Income Statement (Consolidated K-IFRS)
(Unit : billion KRW)
15
2Q FY’16 2Q FY’17 YoY 1H FY’16 1H FY’17 YoY
Revenue 7,504 7,401 -1.4% 14,965 14,893 -0.5%
Gross Profit 2,280 (30.4%) 2,279 (30.8%) -0.1% 4,501 (30.1%) 4,561 (30.6%) 1.3%
SG&A 2,109 (28.1%) 2,192 (29.6%) 3.9% 4,122 (27.5%) 4,266 (28.6%) 3.5%
Operating Profit 171 (2.3%) 87 (1.2%) -49.0% 379 (2.5%) 295 (2.0%) -22.3%
EBITDA 371 (5.0%) 283 (3.8%) -23.7% 780 (5.2%) 690 (4.6%) -11.6%
Profit before tax 149 (2.0%) 56 (0.8%) -62.6% 280 (1.9%) 246 (1.7%) -12.0%
Net Profit 82 (1.1%) 4 (0.1%) -95.0% 148 (1.0%) 116 (0.8%) -22.0%
Net Income of Controlling Company
65 (0.9%) -33 - - 123 (0.8%) 57 (0.4%) -53.6%
Net income of minority interest equity
17 (0.2%) 37 (0.5%) 110.3% 25 (0.2%) 59 (0.4%) 129.8%

LOTTE SHOPPING CO., LTD
Balance Sheet (Consolidated K-IFRS)
(Unit : billion KRW)
2Q ’16 3Q ’16 4Q ’16 1Q ’17 2Q ’17
Total assets 40,350 40,992 41,914 42,045 41,867
Cash & Cash Equivalent 2,618 3,076 3,185 3,821 3,549
Inventories 3,289 3,414 3,324 3,221 3,124
Land & Buildings 13,041 13,124 13,115 13,092 13,150
Liabilities 23,252 23,843 24,652 24,786 24,575
Borrowings & Bonds 13,953 13,851 14,483 14,998 15,038
Equity 17,098 17,149 17,262 17,259 17,292
Share Capital 158 158 158 158 158
16

LOTTE SHOPPING CO., LTD
Regional Sales of Lotte Marts in Overseas
(Unit : billion KRW)
** Store level sales revenue in local currencies (Currency effect excluded)
* Includes 13 supermarkets in China
No. of Stores 2Q FY’16 2Q FY’17 YoY YoY**
China 112* 284 21 -92.6% -94.9%
Indonesia 45 325 329 1.1% 4.7%
Vietnam 13 64 64 -0.1% 9.6%
Total 170 673 414 -38.5% -34.6%
17
LOTTE SHOPPING CO., LTD
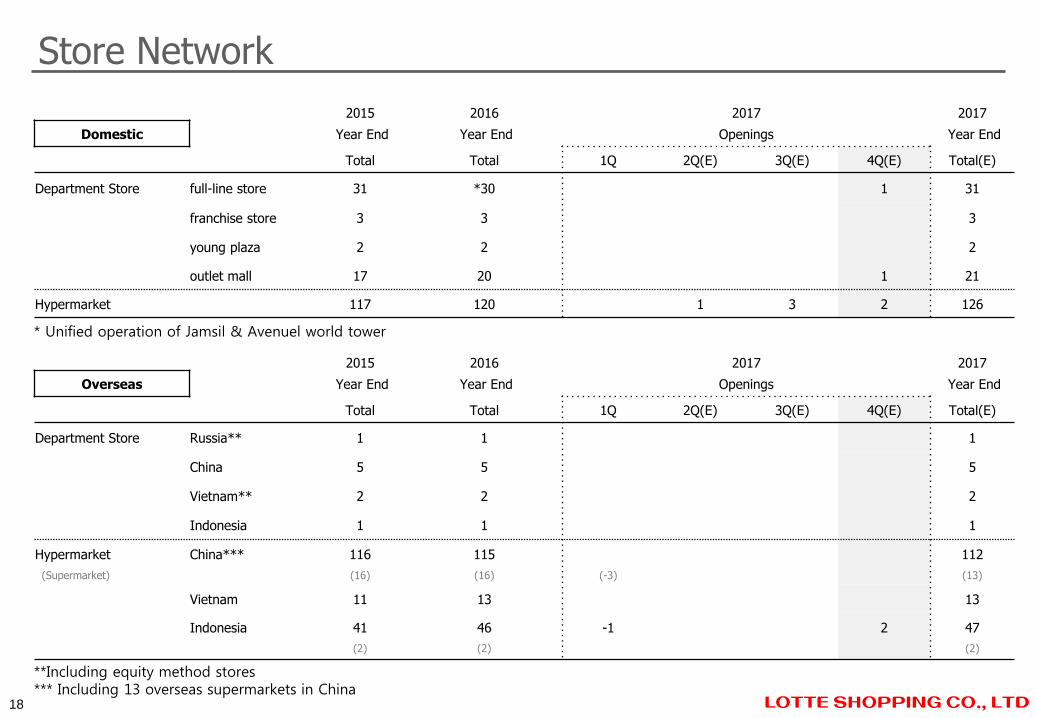
2015 2016 2017 2017
Domestic Year End Year End Openings Year End
Total Total 1Q 2Q(E) 3Q(E) 4Q(E) Total(E)
Department Store full-line store 31 *30 1 31
franchise store 3 3 3
young plaza 2 2 2
outlet mall 17 20 1 21
Hypermarket 117 120 1 3 2 126
2015 2016 2017 2017
Overseas Year End Year End Openings Year End
Total Total 1Q 2Q(E) 3Q(E) 4Q(E) Total(E)
Department Store Russia** 1 1 1
China 5 5 5
Vietnam** 2 2 2
Indonesia 1 1 1
Hypermarket China*** 116 115 112
(Supermarket) (16) (16) (-3) (13)
Vietnam 11 13 13
Indonesia 41 46 -1 2 47
(2) (2) (2)
Store Network
**Including equity method stores*** Including 13 overseas supermarkets in China
* Unified operation of Jamsil & Avenuel world tower
18

LOTTE SHOPPING CO., LTD
LOTTE SHOPPING CO., LTD
- Date of establishment: Sept, 9, 1999
- Business area
① Movie theater (Lotte Cinema) : 112 locations (domestic)
② Content investment and distribution(Lotte Entertainment)
→ Masterpiece: The Pirates('14), The Last Princess('16), etc
Lotte Shopping
Retail
Department store
Hypermarket
Supermarket
H&B
In-kind contribution to a 100% owned subsidiary
Lotte Shopping
Retail
Department store
Hypermarket
Supermarket
H&B
Service Cinema Lotte Cinema
Lotte Shopping to separate its cinema business as a 100% owned subsidiary (Announced on June, 8, 2017)
<Overview>
- To maximize its management effectiveness as an entertainment company
- Business diversification including content distribution and overseas business
Screen opening focused → qualitative growth focused
Expansion of online movie distribution platform
Entry into new countries (Indonesia)
Movie Theater
New Business
Overseas Business
Competitiveness enhancement of movie contentsContent
Distribution
LOTTE CINEMA
· Movie Theater
2014 2015 2016
Domestic 103 107 112
Direct-managed 75 81 89
Consignment 28 26 23
*Overseas(China/Vietnam) 11/16 10/22 11/29
* Includes subsidiaries and equity method
· Sales Revenue and Operating Profit (Domestic)
569 603 626
57 32 39
2014 2015 2016
(Unit: billion KRW)
Lotte Shopping: Separation of Lotte Cinema