2017 preliminary results presentation april 2018
TRANSCRIPT

2017 PRELIMINARY
RESULTS
PRESENTATION
APRIL 2018
DOWNTOWN HOSTEL, COPENHAGEN

DISCLAIMER
The information in this presentation has been prepared by Hostelworld Group Plc (the "Company").
No representation or warranty, express or implied, is made as to or in relation to, and no responsibility or liability is or will be accepted by the Company or any company within theCompany's group (the "Group"), or any of its affiliates, agents or advisers as to or in relation to, any of the statements or forecasts contained in this presentation, or the accuracy orcompleteness of this presentation or any other written or oral information made available to or publicly available to any interested party or its advisers and therefore any liability isexpressly disclaimed. Nothing in this paragraph shall exclude liability for any undertaking, representation, warranty or other assurance made fraudulently.
Information in this presentation relating to the price at which relevant investments have been bought or sold in the past or the yield on such investments cannot be relied upon as a guideto the future performance of such investments. This presentation does not constitute an offering of securities or otherwise constitute an invitation or inducement to any person tounderwrite, subscribe for or otherwise acquire or dispose of securities in the Company.
This presentation includes certain forward-looking statements, beliefs or opinions, including statements with respect to the Group's business, financial condition and results of operationsbased on the Company's current beliefs and expectations about future events and other matters which are not historical facts. These forward-looking statements can be identified by theuse of forward-looking terminology, including but not limited to, the terms "believes", "estimates", "plans", "anticipates", "targets", "aims", "continues", "expects", "intends", "hopes","may", "will", "would", "could" or "should" or, in each case, their negative or other various or comparable terminology. By their nature these statements involve risk and uncertaintybecause they relate to events and depend on circumstances that may or may not occur in the future. A number of factors could cause actual results and developments to differ materiallyfrom those expressed or implied by the forward-looking statements, including, without limitation, developments in the global economy; changes in the legal, regulatory and competitionframeworks in which the Group operates; the impact of legal or other proceedings against or which affect the Group; changes in accounting practices and interpretation of accountingstandards under IFRS; and changes in our principal risks and uncertainties.
Forward-looking statements speak only as at the date of the results announcement in respect of the 2017 financial period and the Group, its affiliates, agents and advisers expresslydisclaim any obligations or undertaking to release any update of, or revisions to, any forward-looking statements in this presentation. No statement in the presentation is intended to be,or intended to be construed as, a profit forecast or profit estimate or to be interpreted to mean that earnings per Company share for the current or future financial years will necessarilymatch or exceed the historical earnings per Company share. As a result, you are cautioned not to place any undue reliance on such forward-looking statements.
2

HOSTELWORLD AT A GLANCE
GLOBAL, HOSTEL-FOCUSED, MARKET-LEADING ONLINE BOOKING PLATFORM
▸ Head Office in Dublin with offices in London, Porto, Shanghai, Sydney & Seoul; average 254
employees during 2017 (2016: 241)
▸ 36,000 properties globally including 16,000 hostels as at December 2017
▸ Focused on hostels and other budget accommodation with hostels representing 93% of 2017
bookings (2016: 92%)
▸ Hostelworld, the Group’s primary brand, contributed 93% of total 2017 bookings (2016: 87%)
CONSUMER BRAND - PRIMARY
CONSUMER BRAND - SUPPORTING
B2B BRAND
BOOKINGS BY BRAND1 BOOKINGS BY DEVICE2
BOOKINGS BY NATIONALITY3 BOOKINGS BY DESTINATION3
EFFICIENT BUSINESS MODEL MAXIMISES CASH CONVERSION
1
Customer searches and
books accommodationHostelworld collects
depositCustomer pays
balance to hostel
2017 KEY FINANCIALS (€M)4
1Hostelworld Group (“HWG”), 2017. Supporting brands refers to Hostelbookers, Hostels.com, (hostel & affiliate) booking engines. 2 HWG, 2017. Note: Mobile includes site and app bookings via phone and tablets. Source: Omniture. 3HWG, 2017 4Adjusted EBITDA represents EBITDA excluding exceptional items; Adjusted free cash flow defined as free cash flow before financing activities adjusted for financial expenses and M&A costs.
2 3
3
Hostelworld brand, 93%
Supporting brands, 7%
Desktop, 46%
Mobile, 54%
UK14%
Rest of Europe
36%
North America
25%
Asia8%
Oceania9%
South America
7%
Africa1% UK, 7%
Rest of Europe,
43%
North America,
11%
Asia, 21%
Oceania, 7%
South America,
9%
Africa, 2%
€80.5
€23.9 €21.5
€86.7
€26.4€21.5
€0
€20
€40
€60
€80
€100
Net Revenue Adjusted EBITDA Adj Free Cash Flow
FY 2016 FY 2017

AGENDA
4
OPERATIONAL PERFORMANCE 2017
STRATEGY AND OUTLOOK
Q&A
FINANCIAL PERFORMANCE 2017
Q&A

FINANCIAL
PERFORMANCE
LUB D PHUKET, PATONG

FINANCIAL
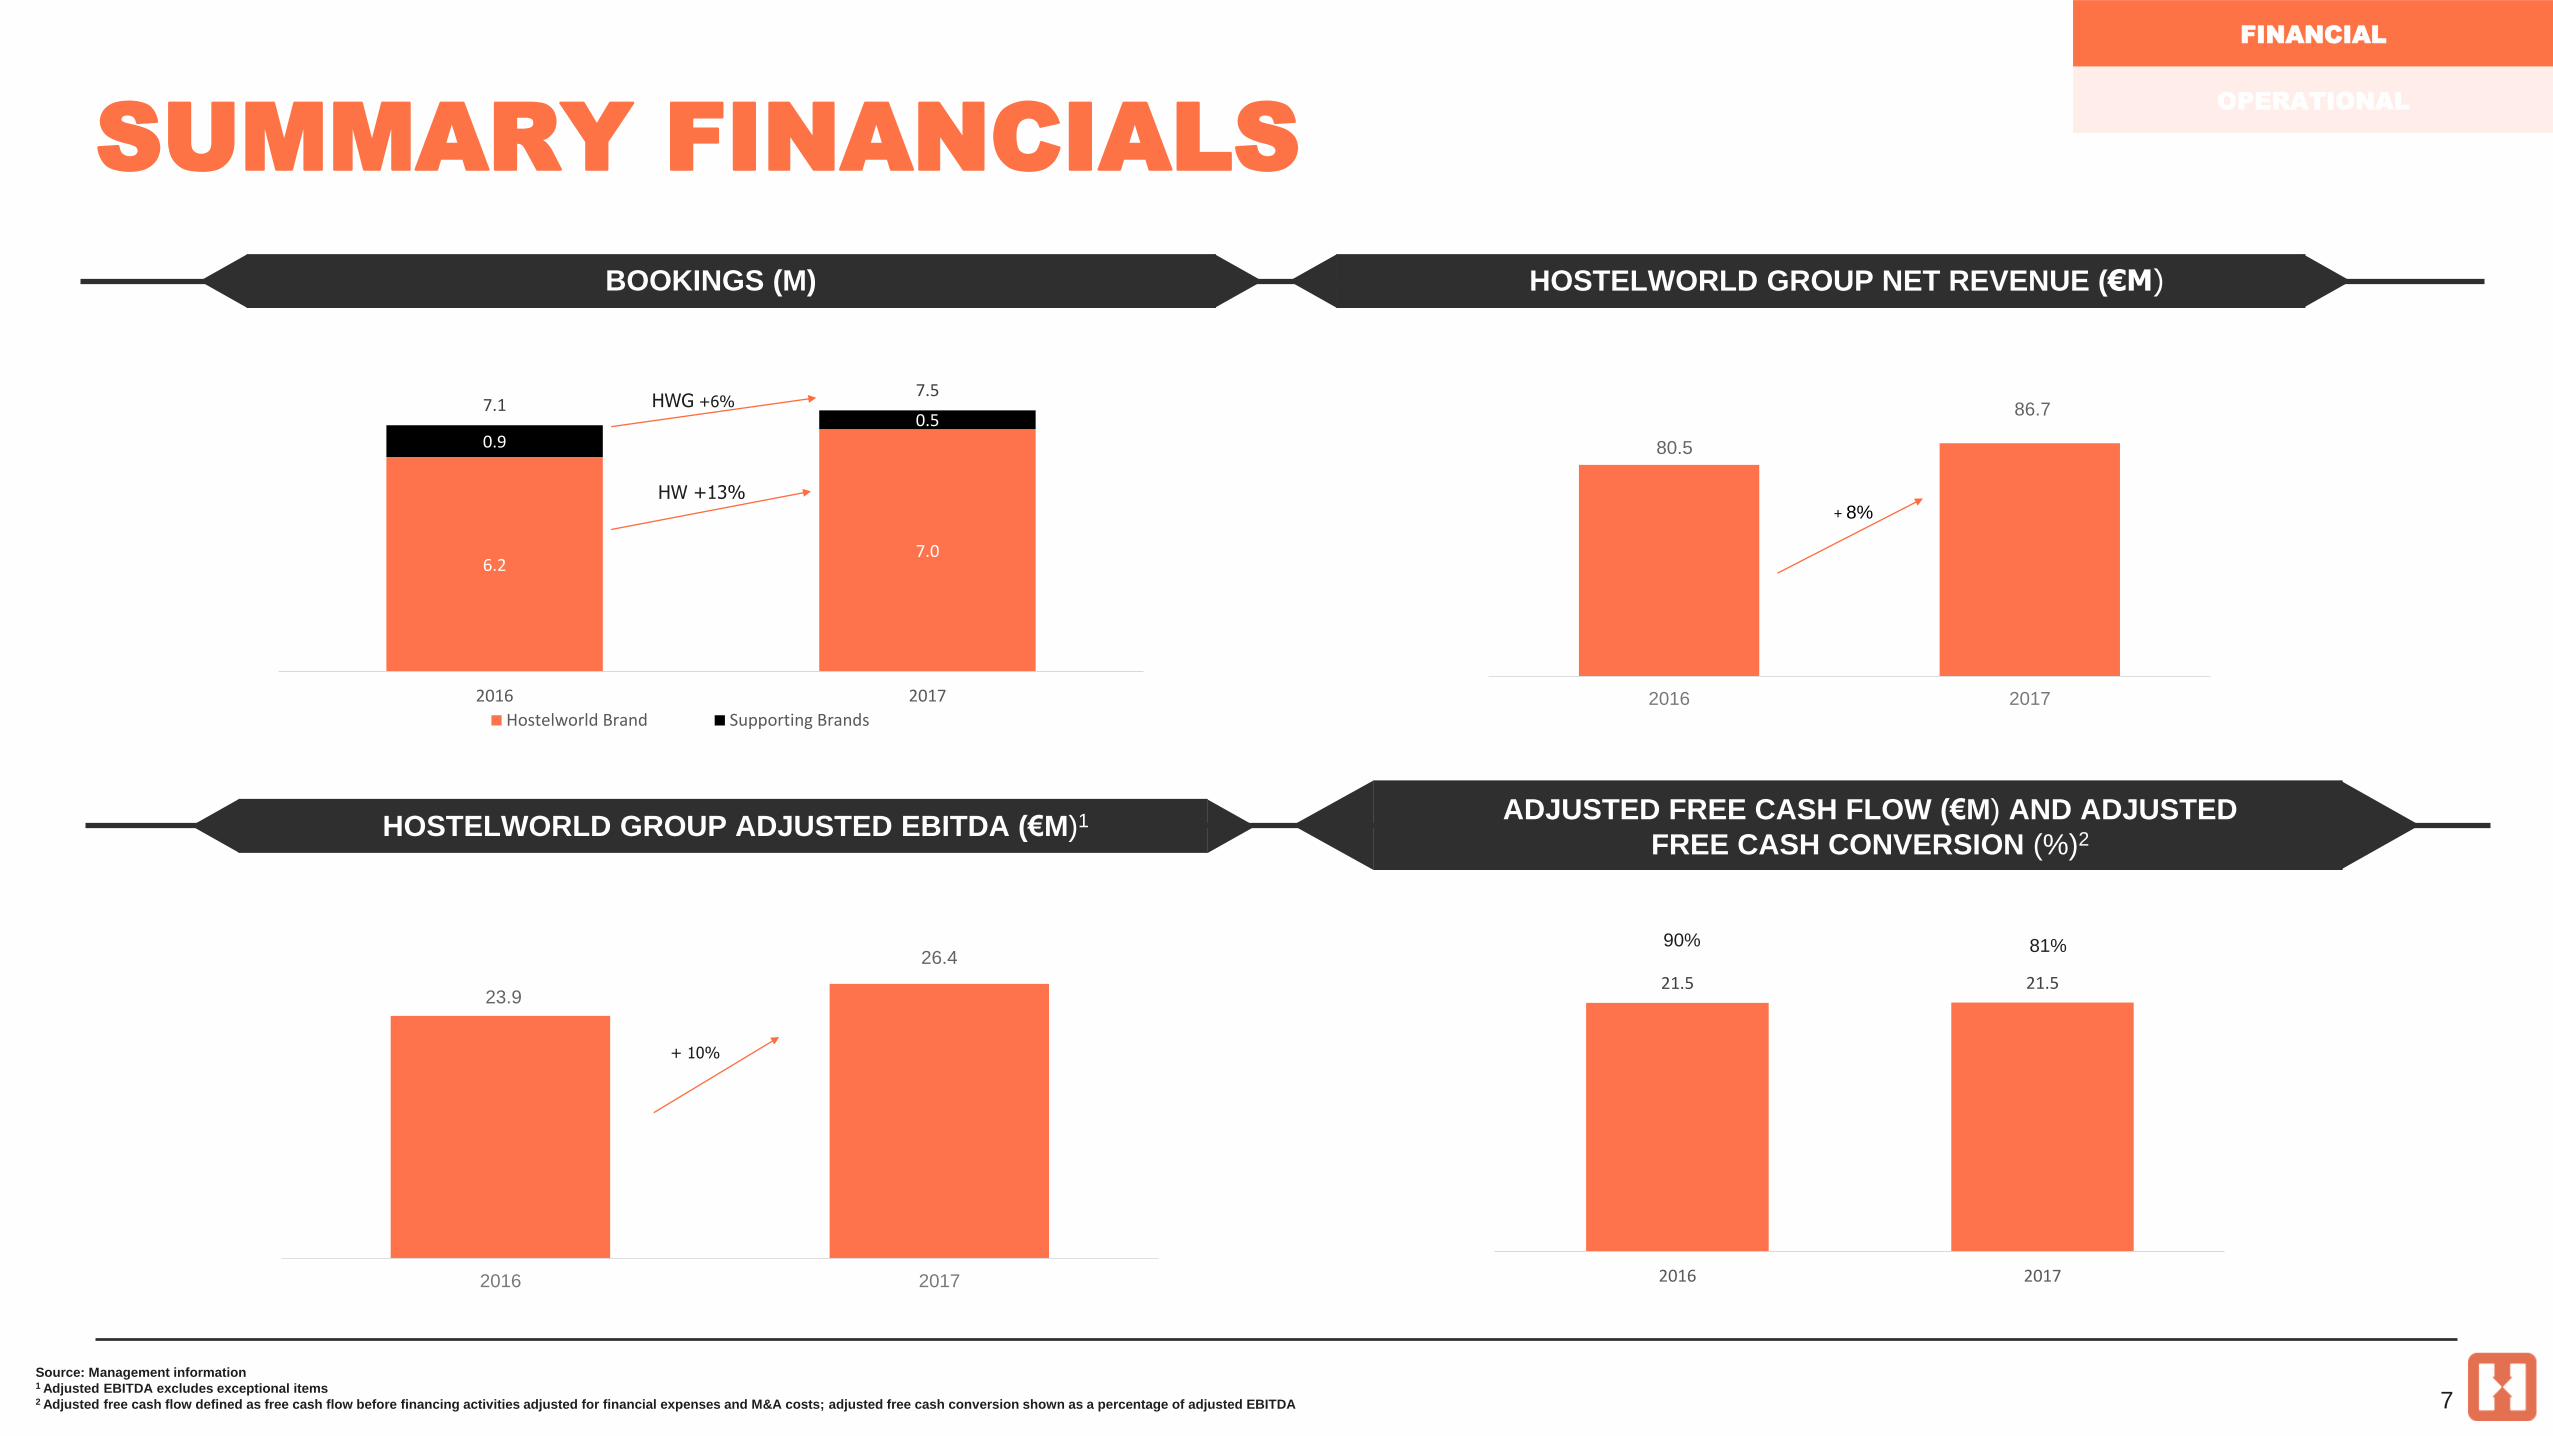
▸ 6% increase in Group bookings (to 7.5m bookings); HW Brand bookings up 13%
▸ Average Booking Value “ABV” at €11.6 remained flat (2% increase on a constant
currency basis)
▸ 8% increase in Net Revenue to €86.7m (10% increase on constant currency basis)
▸ Marketing Costs as a % of Net Revenue reduced to 38% (2016: 41%)
▸ Adjusted EBITDA margin of 30% (2016: 30%)
▸ €26.4m Adjusted EBITDA, up 10% (2016: €23.9m) (13% increase on constant currency
basis)
▸ €21.7m Adjusted PAT, up 12% (2016: €19.4m)
▸ Strong underlying adjusted free cash conversion of 81% (2016: 90%)
▸ Strong balance sheet: Cash of €21.3m at 31 December 2017 (31 December 2016:
€24.6m)
▸ Proposed final dividend of 12.0 euro cent per share (2016: 10.4 euro cent per share)
▸ Total full year dividend of 17.1 euro cent per share (2016: 15.2 euro cent per share)
6
2017 PERFORMANCE
FINANCIAL
OPERATIONAL
BOOKINGS (M) HOSTELWORLD GROUP NET REVENUE (€M)
HOSTELWORLD GROUP ADJUSTED EBITDA (€M)1 ADJUSTED FREE CASH FLOW (€M) AND ADJUSTED
FREE CASH CONVERSION (%)2
90% 81%
FINANCIAL
OPERATIONAL
Source: Management information1 Adjusted EBITDA excludes exceptional items2 Adjusted free cash flow defined as free cash flow before financing activities adjusted for financial expenses and M&A costs; adjusted free cash conversion shown as a percentage of adjusted EBITDA 7
80.5
86.7
2016 2017
+ 8%
21.5 21.5
2016 2017
6.27.0
0.90.5
7.17.5
2016 2017
Hostelworld Brand Supporting Brands
HWG +6%
HW +13%
+ 10%
23.9
26.4
2016 2017
SUMMARY FINANCIALS
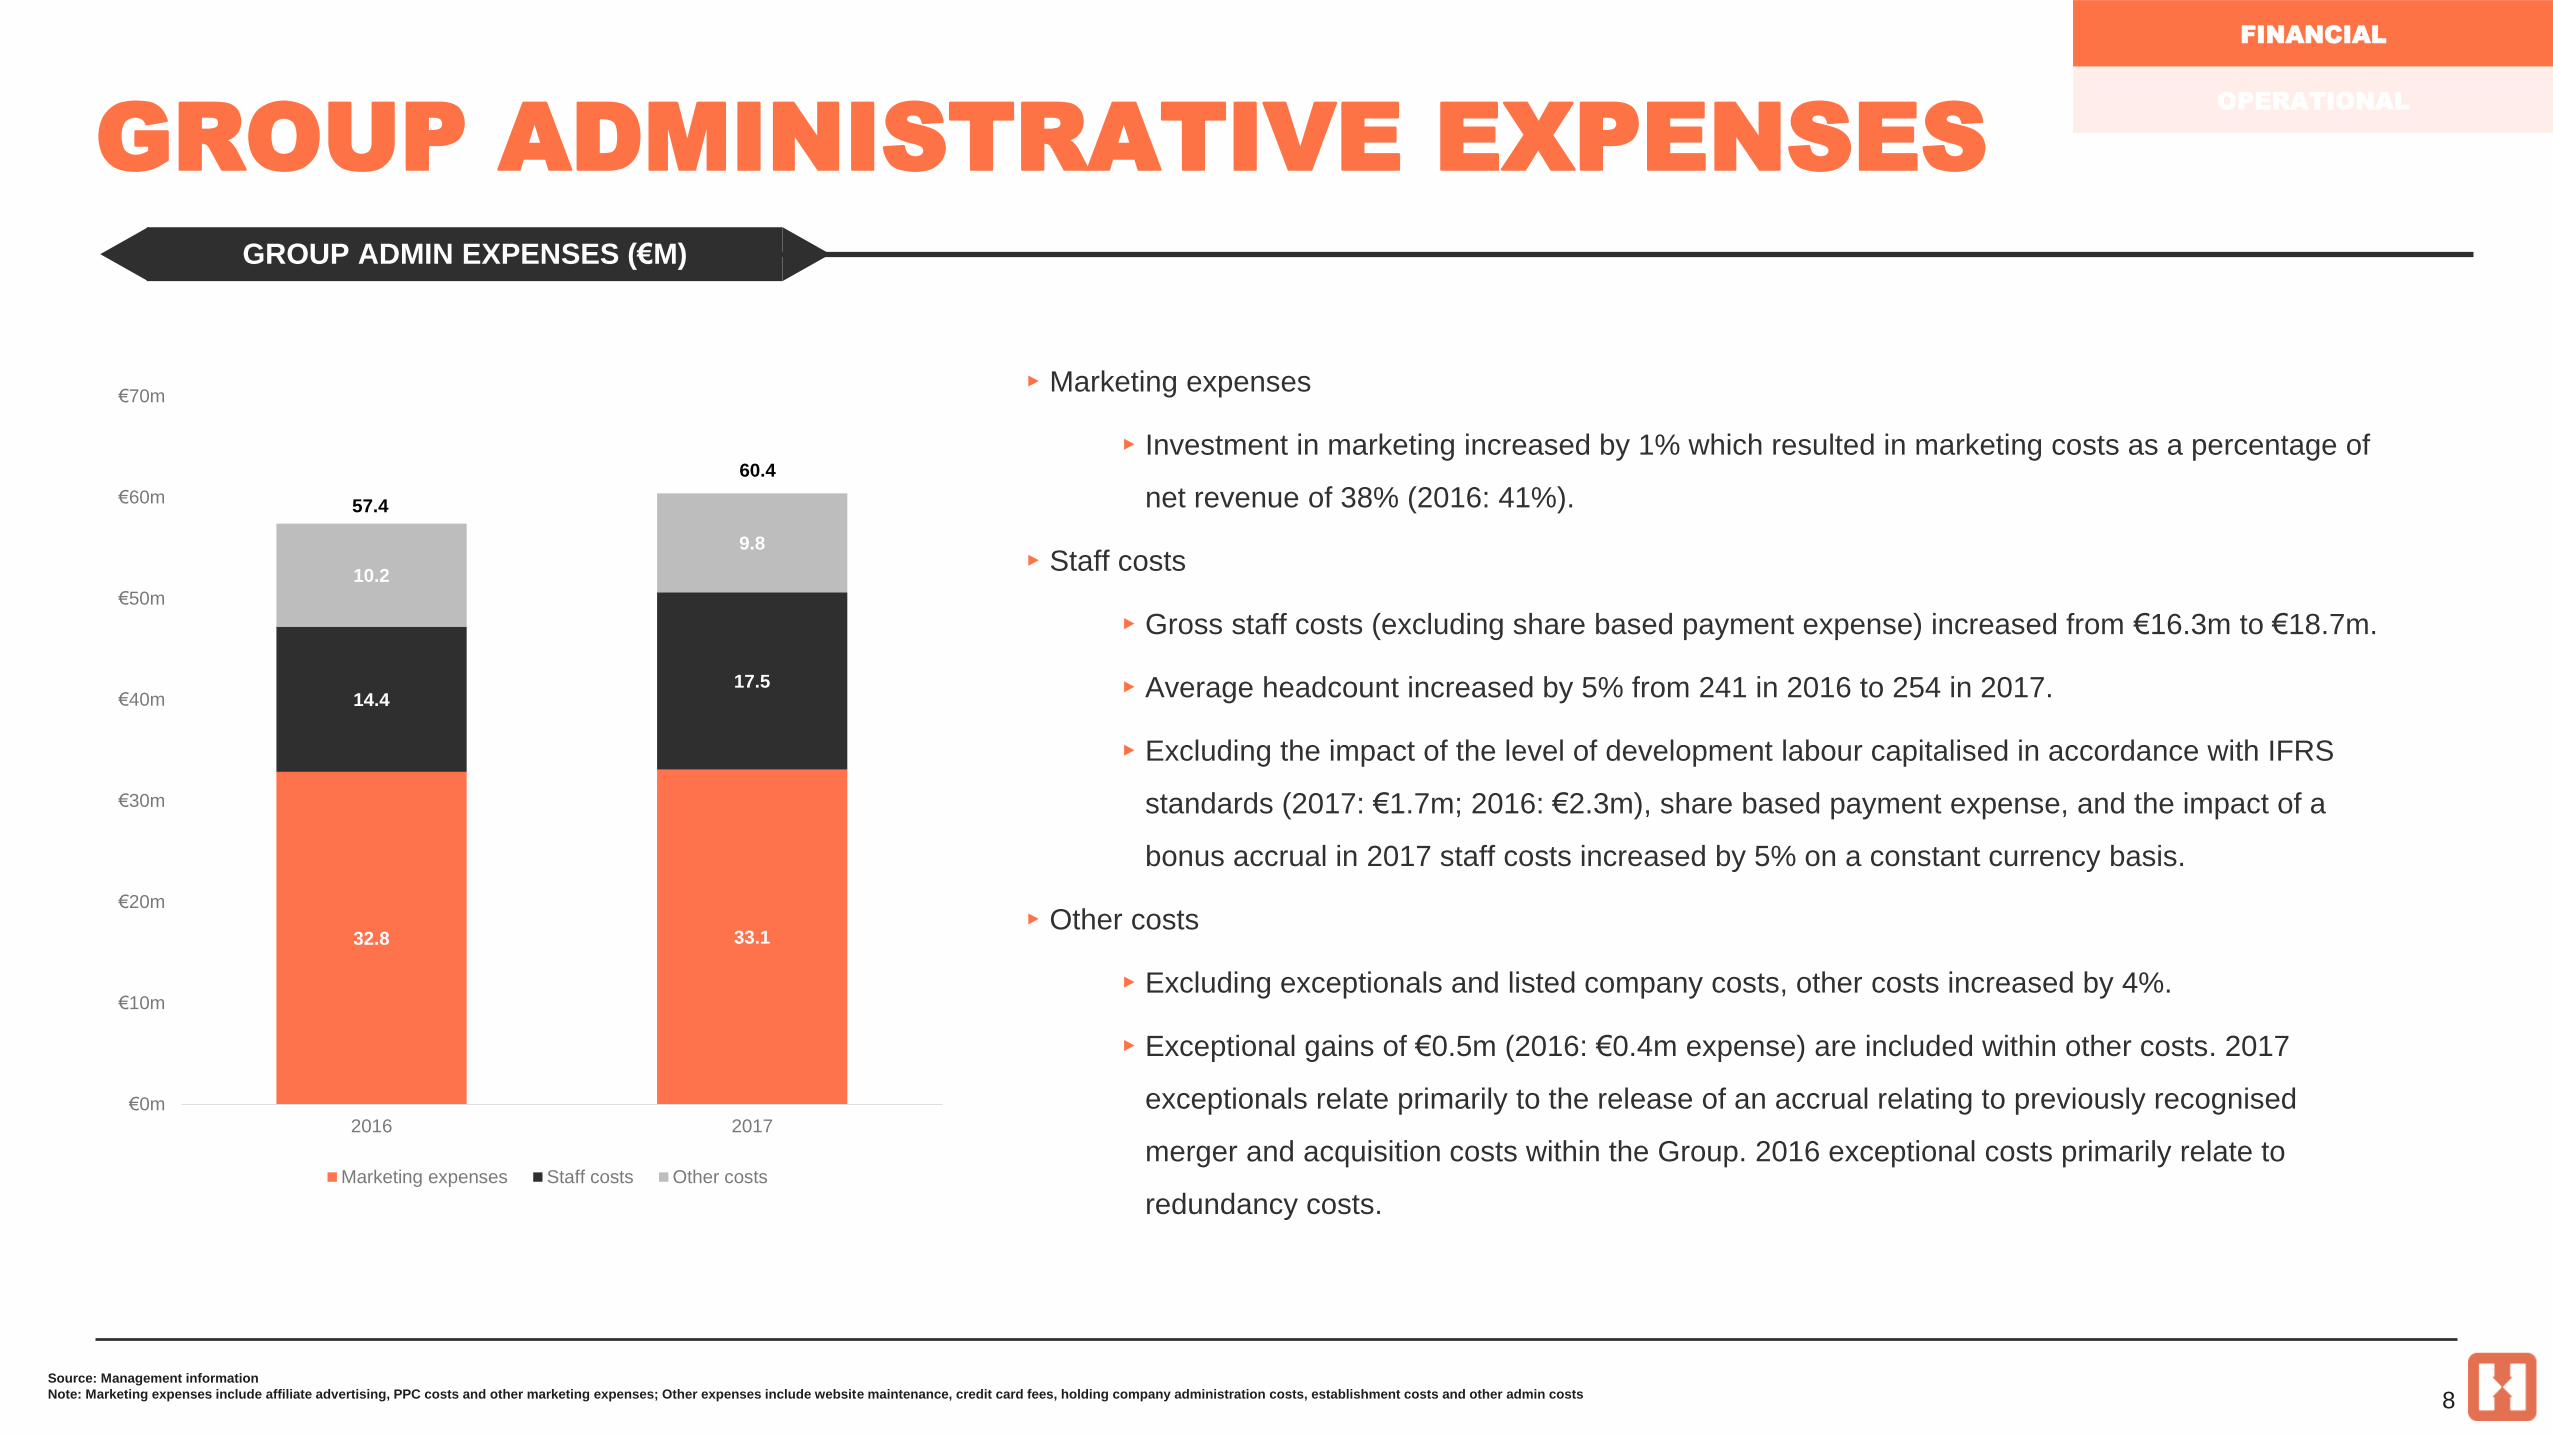
▸ Marketing expenses
▸ Investment in marketing increased by 1% which resulted in marketing costs as a percentage of
net revenue of 38% (2016: 41%).
▸ Staff costs
▸ Gross staff costs (excluding share based payment expense) increased from €16.3m to €18.7m.
▸ Average headcount increased by 5% from 241 in 2016 to 254 in 2017.
▸ Excluding the impact of the level of development labour capitalised in accordance with IFRS
standards (2017: €1.7m; 2016: €2.3m), share based payment expense, and the impact of a
bonus accrual in 2017 staff costs increased by 5% on a constant currency basis.
▸ Other costs
▸ Excluding exceptionals and listed company costs, other costs increased by 4%.
▸ Exceptional gains of €0.5m (2016: €0.4m expense) are included within other costs. 2017
exceptionals relate primarily to the release of an accrual relating to previously recognised
merger and acquisition costs within the Group. 2016 exceptional costs primarily relate to
redundancy costs.
FINANCIAL
OPERATIONAL
Source: Management information
Note: Marketing expenses include affiliate advertising, PPC costs and other marketing expenses; Other expenses include website maintenance, credit card fees, holding company administration costs, establishment costs and other admin costs 8
32.8 33.1
14.417.5
10.2
9.8
57.4
60.4
€0m
€10m
€20m
€30m
€40m
€50m
€60m
€70m
2016 2017
Marketing expenses Staff costs Other costs
GROUP ADMINISTRATIVE EXPENSES
GROUP ADMIN EXPENSES (€M)

▸ Marketing investment increased by €0.3m in 2017 and represented 38% of net revenue (41% in 2016). This reflects a 5% decrease in marketing cost per
booking to €4.39 (2016: €4.62)
▸ Increased proportion of bookings from non-paid channels to 63% in 20171 (2016: 61%) mainly driven by increased investment in brand, mobile and social
channels
▸ Continued focus on marketing innovation and efficiencies, with investment in new digital channels (e.g. Snapchat. Hostelworld partnered with Snapchat to be
the first advertiser to test their self-service platform with our Speak the World campaign)
FINANCIAL
OPERATIONAL
Source: Management information
Note: Marketing investment includes affiliate advertising, PPC costs and other marketing expenses; Marketing investment shown as a percentage of net revenue.1 HWG 9
% of Group Net
Revenue
Marketing
Investment
€37.4m€32.8m €33.1m
45%
41%38%
0%
10%
20%
30%
40%
€0m
€5m
€10m
€15m
€20m
€25m
€30m
€35m
€40m
2015 2016 2017
% of net revenue
MARKETING INVESTMENT
MARKETING INVESTMENT AS A % OF GROUP NET REVENUE

EUR/USD FX RATE MOVEMENT 2017 YOY NET REVENUE: CONSTANT CURRENCY
COMPARISON
ADJ. EBITDA: CONSTANT CURRENCY
COMPARISON
▸ The Group’s primary operating currency is Euro, but it also has significant sterling (GBP) and US dollar cash flows
▸ On a constant currency basis, Net Revenue has increased by 10% and Adjusted EBITDA has increased by 13%
▸ A 1% movement in USD had 0.53% impact on 2017 Adjusted EBITDA and a 1% movement in GBP had 0.22% impact on 2017 Adjusted EBITDA based on the FY
2017 currency profile
▸ The Group manages FX translation risk through matching foreign currency cash outflows and foreign currency cash inflows and by minimising holdings of excess
non-Euro currency above anticipated outflow requirements
FINANCIAL
OPERATIONAL
Source: Management information
10
-7%
1.02
1.04
1.06
1.08
1.10
1.12
1.14
1.16
1.18
1.20
1.22
USD 2016 USD 2017
0.70
0.75
0.80
0.85
0.90
0.95
GBP 2016 GBP 2017
-2%
EUR/GBP FX RATE MOVEMENT 2017 YOY
€80.5m €78.7m
€86.7m
2016reported
2016 Constant Currency 2017
€23.9m
€23.3m
€26.4m
2016reported
2016 Constant Currency 2017
FOREIGN EXCHANGE RISK
NET REVENUE INCREASED BY 10% IN CONSTANT CURRENCY
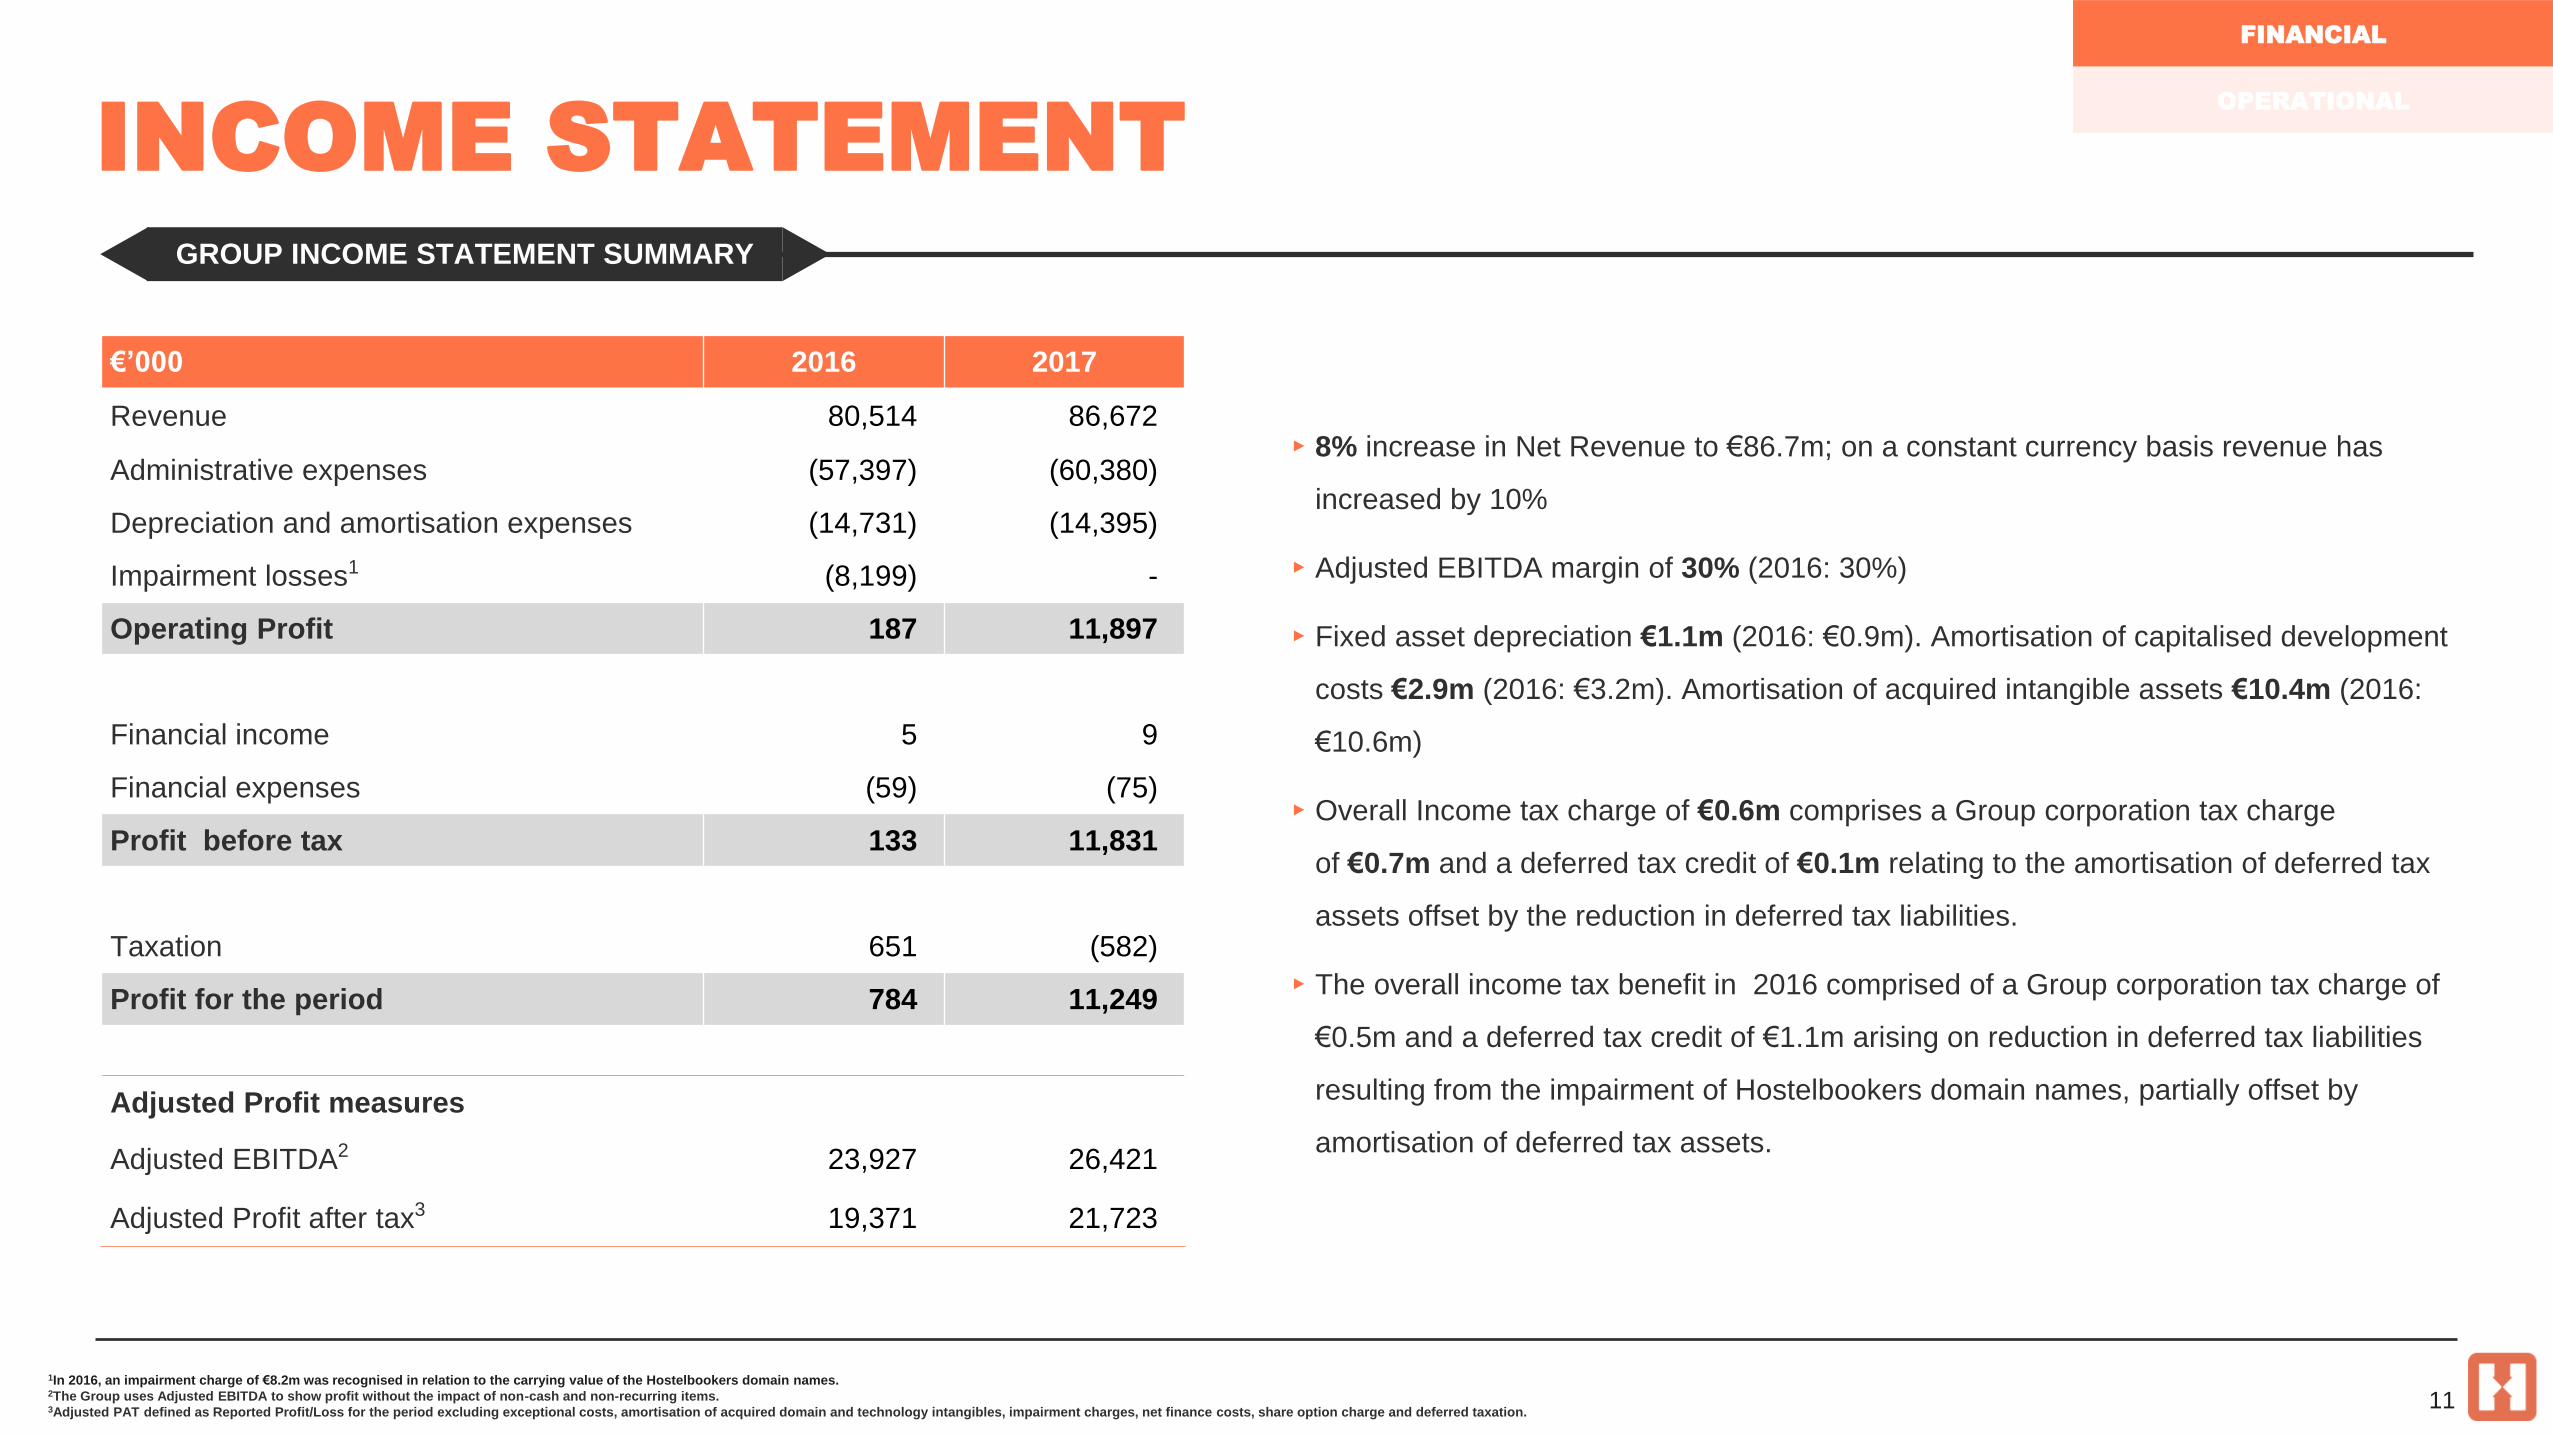
▸ 8% increase in Net Revenue to €86.7m; on a constant currency basis revenue has
increased by 10%
▸ Adjusted EBITDA margin of 30% (2016: 30%)
▸ Fixed asset depreciation €1.1m (2016: €0.9m). Amortisation of capitalised development
costs €2.9m (2016: €3.2m). Amortisation of acquired intangible assets €10.4m (2016:
€10.6m)
▸ Overall Income tax charge of €0.6m comprises a Group corporation tax charge
of €0.7m and a deferred tax credit of €0.1m relating to the amortisation of deferred tax
assets offset by the reduction in deferred tax liabilities.
▸ The overall income tax benefit in 2016 comprised of a Group corporation tax charge of
€0.5m and a deferred tax credit of €1.1m arising on reduction in deferred tax liabilities
resulting from the impairment of Hostelbookers domain names, partially offset by
amortisation of deferred tax assets.
FINANCIAL
OPERATIONAL
1In 2016, an impairment charge of €8.2m was recognised in relation to the carrying value of the Hostelbookers domain names.2The Group uses Adjusted EBITDA to show profit without the impact of non-cash and non-recurring items.3Adjusted PAT defined as Reported Profit/Loss for the period excluding exceptional costs, amortisation of acquired domain and technology intangibles, impairment charges, net finance costs, share option charge and deferred taxation.
11
€’000 2016 2017
Revenue 80,514 86,672
Administrative expenses (57,397) (60,380)
Depreciation and amortisation expenses (14,731) (14,395)
Impairment losses1 (8,199) -
Operating Profit 187 11,897
Financial income 5 9
Financial expenses (59) (75)
Profit before tax 133 11,831
Taxation 651 (582)
Profit for the period 784 11,249
Adjusted Profit measures
Adjusted EBITDA2 23,927 26,421
Adjusted Profit after tax3 19,371 21,723
INCOME STATEMENT
GROUP INCOME STATEMENT SUMMARY

FINANCIAL
OPERATIONAL
12
€’000 2016 2017
Profit before tax 133 11,831
Working capital movement (1,577) (1,191)
Non cash adjustments (incl. impairment
charge)23,311 15,018
Net finance costs 54 66
Cashflows from operating activities 21,921 25,724
Net interest paid (54) (66)
Income tax paid (280) (551)
Net Cashflows from operating activities 21,587 25,107
Capitalisation and acquisition of intangible
assets (2,500) (1,820)
Purchase of property, plant and equipment (746) (1,780)
Net cash used in investing activities (3,246) (3,601)
Dividends paid (7,216) (24,848)
Net cash used in financing activities (7,216) (24,848)
Net increase/(decrease) in cash and cash
equivalents11,125 (3,341)
Opening cash and cash equivalents 13,620 24,632
Effect of exchange rate gains and losses (113) 3
Closing cash and cash equivalents 24,632 21,294
CASHFLOW STATEMENT
GROUP CASHFLOW STATEMENT
▸ Non-cash adjustments primarily relate to depreciation and amortisation
▸ Capitalisation of intangible assets vary depending on technology projects meeting the
criteria of IAS 38
▸ The increase in property, plant and equipment is due to the opening of the Porto office
▸ 2017 dividend paid includes €10.0m supplementary dividend
GROUP CASH CONVERSION
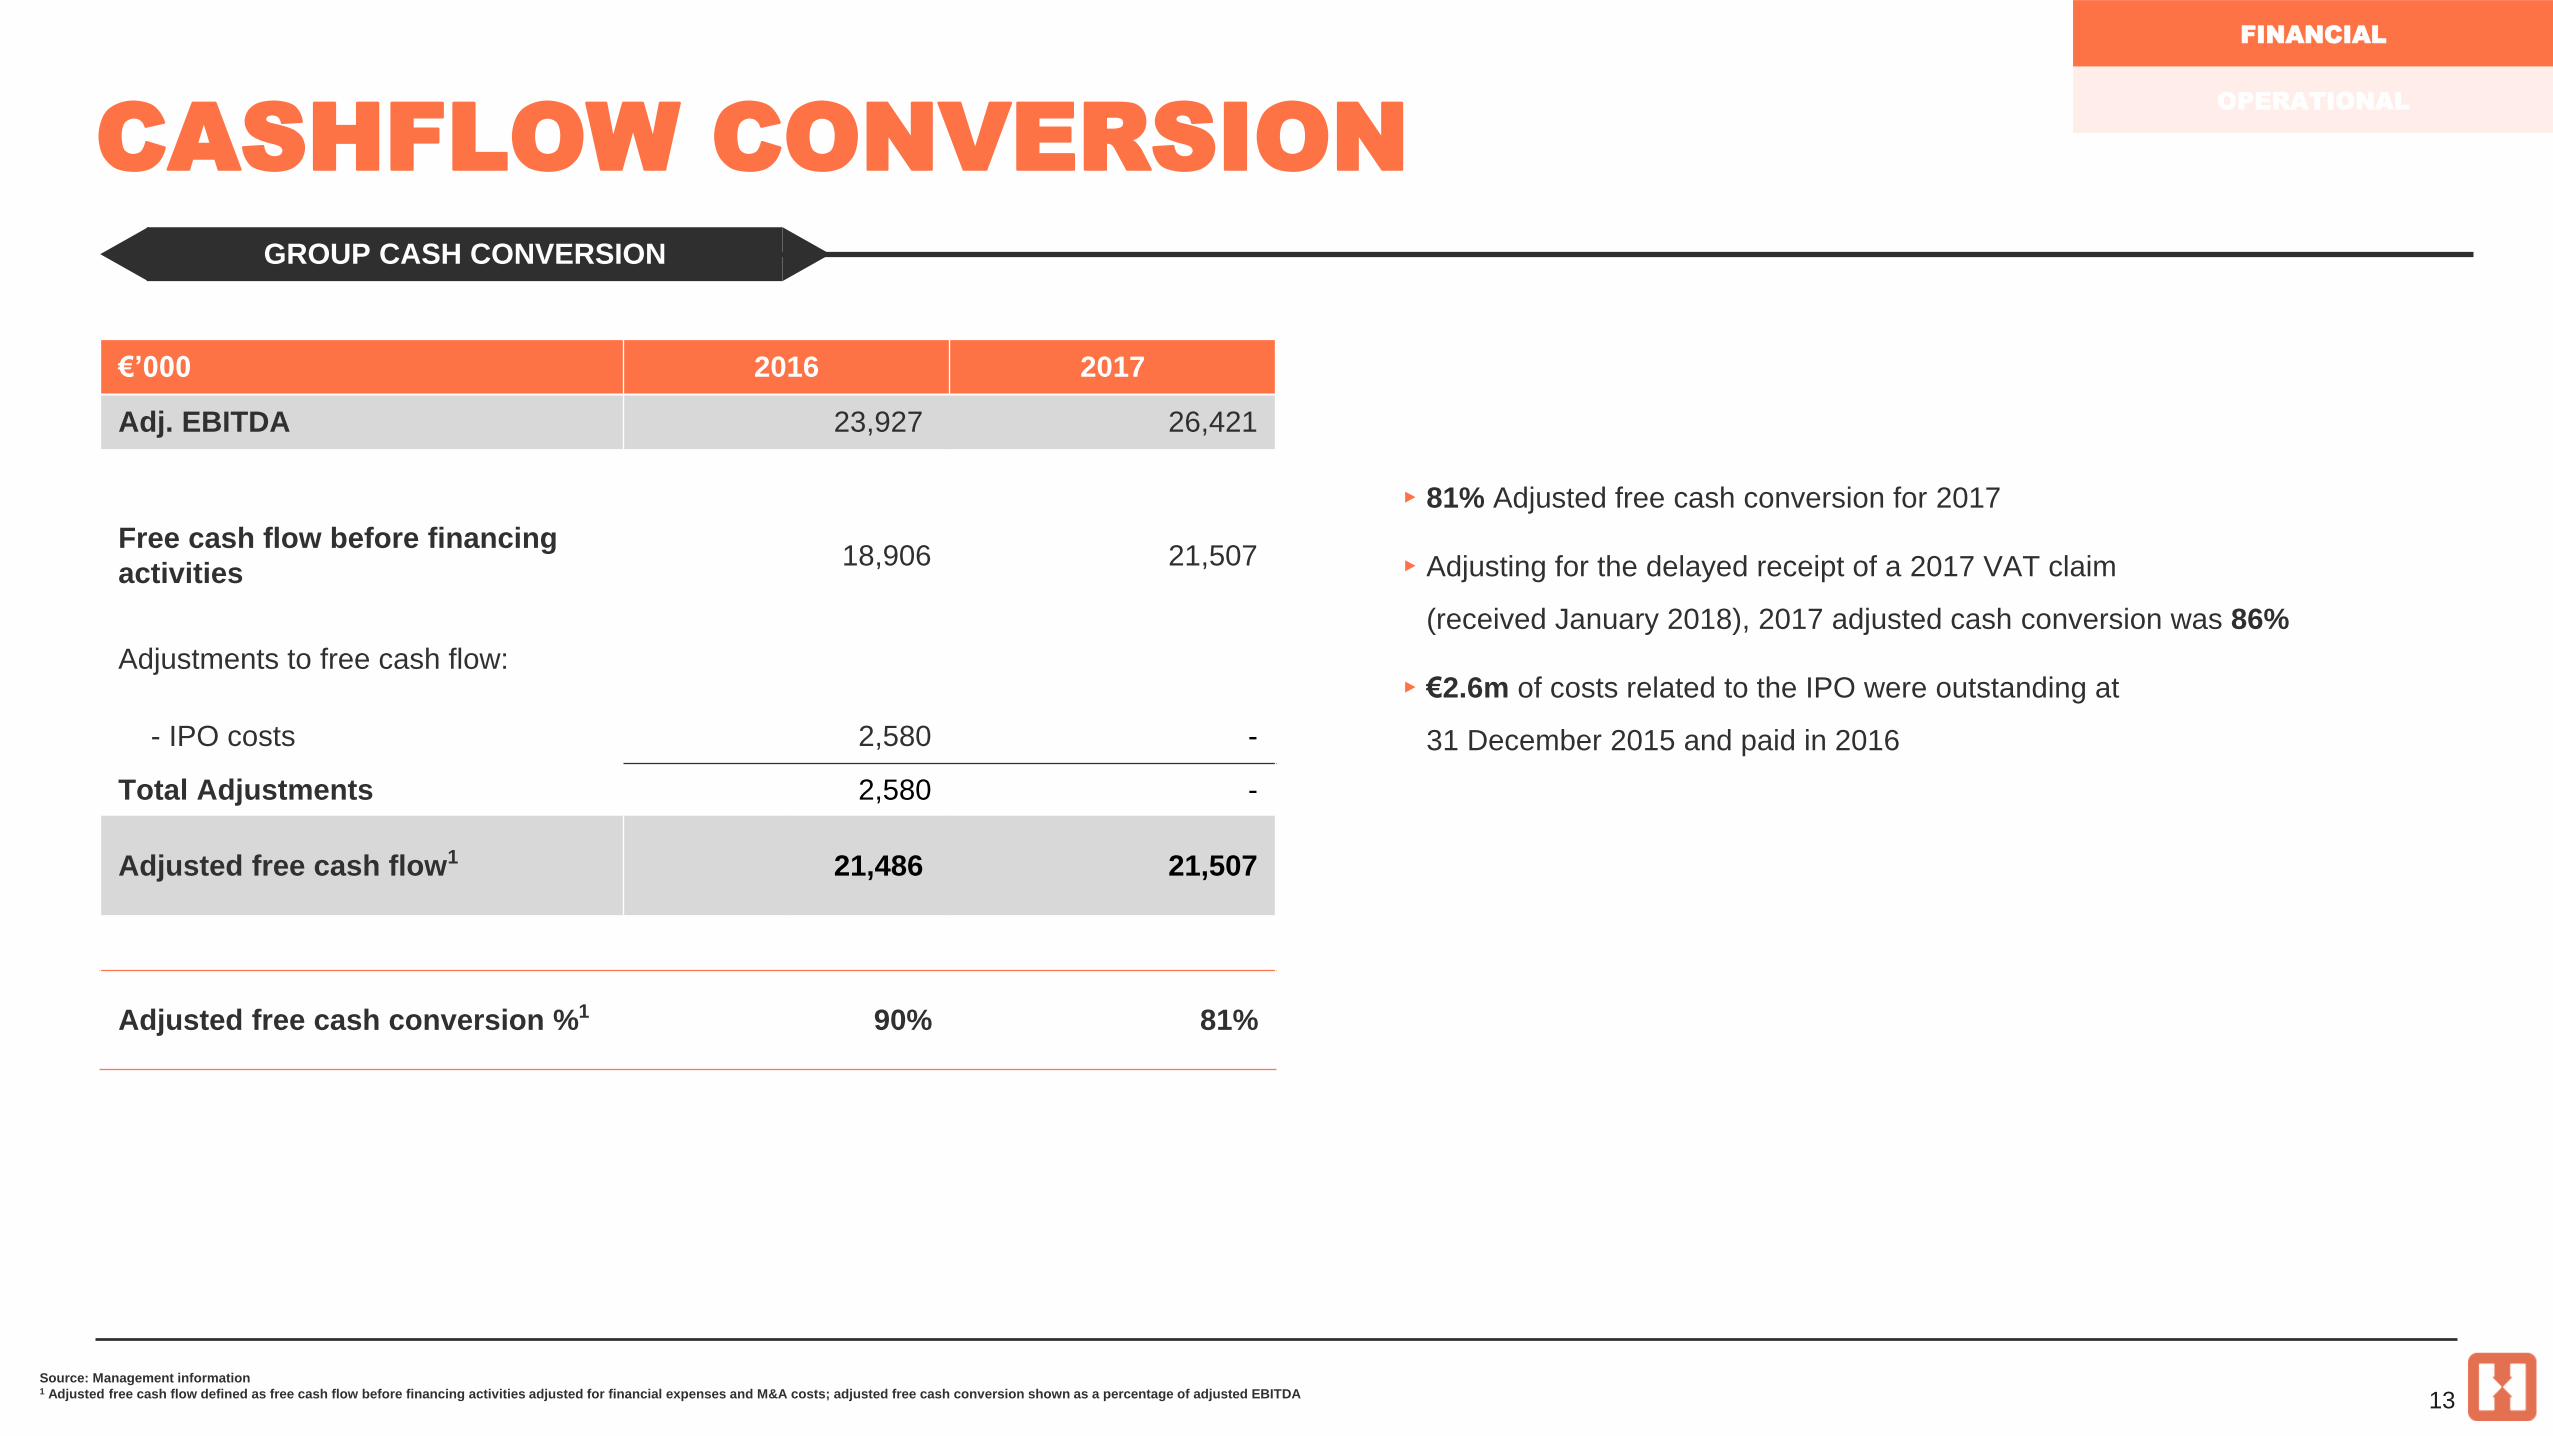
▸ 81% Adjusted free cash conversion for 2017
▸ Adjusting for the delayed receipt of a 2017 VAT claim
(received January 2018), 2017 adjusted cash conversion was 86%
▸ €2.6m of costs related to the IPO were outstanding at
31 December 2015 and paid in 2016
FINANCIAL
OPERATIONAL
Source: Management information1 Adjusted free cash flow defined as free cash flow before financing activities adjusted for financial expenses and M&A costs; adjusted free cash conversion shown as a percentage of adjusted EBITDA 13
€’000 2016 2017
Adj. EBITDA 23,927 26,421
Free cash flow before financing
activities18,906 21,507
Adjustments to free cash flow:
- IPO costs 2,580 -
Total Adjustments 2,580 -
Adjusted free cash flow1 21,486 21,507
Adjusted free cash conversion %1 90% 81%
CASHFLOW CONVERSION
GROUP CASH CONVERSION

▸ Strong Group balance sheet at 31 Dec 2017 with negative working
capital of €6.2m (31 Dec 2016: €7.3m)
▸ Cash balances of €21.3m
▸ Net decrease in intangible assets driven by amortisation
FINANCIAL
OPERATIONAL
Source: Management information
14
€’000 31 Dec 2016 31 Dec 2017
Intangible assets 139,619 128,108
Other non-current assets 3,717 4,254
Trade and other receivables 2,627 3,996
Cash and cash equivalents 24,632 21,294
Total assets 170,595 157,622
Total equity 159,936 146,949
Deferred tax liabilities 764 457
Creditors, accruals and other liabilities 9,895 10,216
Total equity and liabilities 170,595 157,622
BALANCE SHEET
GROUP BALANCE SHEET SUMMARY

Dividend Profile FY15 FY16 FY 17
Interim dividend per share - 4.8c 5.1c
Final dividend per share 2.75c 10.4c 12.0c
Full year dividend per share 2.75c 15.2c 17.1c
Supplementary dividend per
share- 10.5c -
Total dividend per share 2.75c 25.7c 17.1c
Dividend payout:
Interim - €4.6m €4.9m
Final €2.6m €9.9m €11.5m
Supplementary - €10.0m -
Total Dividend payout €2.6m €24.6m €16.3m
▸ A proposed final dividend of 12.0 euro cent per share (2016: 10.4
euro cent per share), 15% growth in final dividend year on year
▸ Total full year dividend of 17.1 euro cent per share (2016: 15.2
euro cent per share), 13% growth in full year dividend year on year
▸ Including proposed final dividend FY17 (€11.5m), €43.5m returned
to shareholders since IPO in 2015
FINANCIAL
OPERATIONAL
Source: Management information
15
DIVIDENDS
STRONG DIVIDEND PAYOUT TO SHAREHOLDERS

FINANCIAL
OPERATIONAL
Source: Management information1 Adjusted PAT is defined as Reported Profit/Loss for the period excluding exceptional costs, amortisation of acquired domain and technology intangibles, impairment charges, net finance costs and deferred taxation.2 Adjusted free cash flow defined as free cash flow before financing activities adjusted for financial expenses, M&A costs and impairment costs; adjusted free cash conversion shown as a percentage of adjusted EBITDA 16
KPI metric 2015 2016 2017
Bookings:HW Brand 5.2m 6.2m 7.0m
Other 2.0m 0.9m 0.5m
Total 7.2m 7.1m 7.5m
Average Booking Value (ABV) € 12.09 € 11.55 € 11.55
Net revenue €83.5m €80.5m €86.7m
Marketing investment (% of net revenue) 45% 41% 38%
Adjusted EBITDA €23.6m €23.9m €26.4m
Adjusted Profit after tax1 €21.0m €19.4m €21.7m
Adjusted free cash flow2 €15.3m €21.5m €21.5m
Adjusted free cash conversion2 65% 90% 81%
SUMMARY KPIS
OVERVIEW OF TRACK RECORD OF KPIs
OPERATIONAL
PERFORMANCE
FREEHAND, MIAMI

4 PILLARS ARE NOW INHERENT
GREAT PROGRESS AND EXECUTION
BRAND MOBILE PRICING ASIA
▸ Meet the World
brand campaigns
▸ 63% bookings from
non-paid channels
▸ Marketing investment
in new digital channels
supporting a more
efficient marketing mix
▸ 54% of bookings 2017
▸ My Trips live in 50
cities
▸ Hostel Noticeboard
launched in December
2016
▸ Speak the World app
launched in May 2017
▸ Elevate now on 34% of
Bookings
▸ Increased Base
Commission Rate
▸ Featured Listings
revenue €1.9m FY 17
▸ 21% of Group bookings
▸ Offices in Shanghai
& Seoul
▸ Continued strong
growth destination
18
FINANCIAL
OPERATIONAL

BOOKINGS OVERVIEW
CONTINUED GROWTH IN HOSTELWORLD BRAND BOOKINGS INCREASED PROPORTION OF BOOKINGS FROM NON-PAID CHANNELS
STRENGTHENED MOBILE OFFERINGS AND PENETRATION
19
INBOUND BOOKINGS : YOY GROWTH
FINANCIAL
OPERATIONAL
5.26.2
7.0
2.00.9
0.5
0.0
1.0
2.0
3.0
4.0
5.0
6.0
7.0
8.0
FY 2015 FY 2016 FY 2017
Bo
oki
ngs
(m
illio
ns)
Hostelworld Supporting brands
-53%-41%
18%13%
58%61% 63%
0%
10%
20%
30%
40%
50%
60%
70%
2015 2016 2017
26%33%
21%
21%
0%
10%
20%
30%
40%
50%
60%
2016 2017
App and Site (Mobile/Tablet) as % HWG Bookings
App Mobile/Tablet Site
54%
47%
(9%)
12%
6%
1%
11% 11%
(10%)
(5%)
0%
5%
10%
15%
EMEA ASPAC Americas
2016 2017

HIGHLY ATTRACTIVE CUSTOMER
DEMOGRAPHICS
UNDER 35, SOLO, AND BOOKING ‘ON-THE-GO’
1 Source: Customer Net Promoter Score (NPS) Survey (Hostelworld brand only): Jan-Dec 2017 / N = 25.7K2 Source: HWG bookings data (Hostelworld brand only) FY 2017 20
58% BOOK WITHIN ONE WEEK OF ARRIVAL2
FINANCIAL
OPERATIONAL

MARKETING MARGIN1 CONTINUING TO INCREASE DURING 2017
Growth 2017 vs. 2016 HostelworldSupporting
brandsTotal
Bookings 13% -41% 6%
ABV 1% 1% 0%
Marketing cost per booking -7% -6% -5%
▸ Continuation of efficiencies in cost per booking for paid channels
▸ Increased proportion of bookings from non-paid channels
▸ Flagship Hostelworld brand accounted for 93% of bookings in 2017 (2016: 87%)
▸ 91% of Group marketing margin1 is derived from Hostelworld brand
MARKETING MARGIN1 % BY BRAND
MARKETING MARGIN2
CONTRIBUTION BY BRAND
1 Gross Booking Revenue less all marketing costs as a percentage of Gross Booking Revenue net of rebates on hostel booking engine bookings. Comparatives
have been updated for revised methodology2 Calculated as Gross Booking Revenue less all marketing costs.
21
FINANCIAL
OPERATIONAL
83% 91%
17% 9%
2016 2017
HW Brand Supporting Brands
56%
76%
59%60%
77%
62%
HW Brand Supporting Brands Total
2016 2017
93%
7%
2017 YTD Bookings by Brand
HW Brand Bookings Supporting Brand Bookings
87%
13%
2016 YTD Bookings by Brand
HW Brand Bookings Supporting Brand Bookings
MARKETING MARGIN BY BRAND

BRAND – FULL FUNNEL ACTIVITY
DRIVING BOOKINGS GROWTH
AWARENESS / CONSIDERATION / CONVERSION ACTIVITY
Data source: Snapchat internal data, management information
CPM: Cost per 1000 impressions
CPI: Cost per install 22
▸ 2017 saw Hostelworld invest in bigger, full-funnel marketing campaigns,
increasing awareness, driving consideration and improving marketing
efficiencies further down the funnel.
▸ Awareness: Continued investment behind the ‘unexpected guest’ strategy,
launching a provocative campaign using Charlie Sheen to help consumers
to change their perceptions of hostels
▸ Consideration: Reinforcement of our strong strategic brand platform Meet
The World with the launch of the Speak The World campaign which drove
substantial uplift in app downloads with over 2m+.
▸ Conversion: Strong hostel-showcasing activity throughout the year,
supporting hostel openings (e.g. Freehand LA) and local markets (e.g. Gold
Coast, Australia) via hard-working social activity and PR stunts. Sand Hostel
biggest PR stunt to date, generating global cut-through.
FINANCIAL
OPERATIONAL

MyTrips launched in 2016 to engage customers in trip with recommendations on places to visit
& places to eat. It expanded in 2017 to include Hostel Noticeboard, a feature which provides
unique content for customers on things to do in the hostel.
▸ Live in 50 cities, representing 40% of Hostelworld app bookings in H1 & H2 2017 combined1
▸ 3 new languages added in 2017, French, German & Spanish
▸ 69% of MyTrips bookers accessed MyTrips content in-app2
▸ 15% of Hostels in 50 cities had noticeboard events published in app from Jun – Dec 2017 3
23
Speak the World provides a new and innovative way for customers who speak different languages to
interact with one another using the power of the award winning Hostelworld app and Google cloud
translate technology.
▸ 14% of total unique App visitors used Speak the World May-Dec 2017 (12% of total iPhone visitors,
16% of total Android visitors)4
▸ 3.2 million translations were generated since launch (May-Dec 2017)4
PILOTING HOSTEL CHAT AND EXTEND YOUR STAY
SPEAK THE WORLD & MY TRIPS/HOSTEL NOTICEBOARD
Data sources: 1 Omniture – Jan – Dec 17 | 2 Omniture – Interacted with My Trips / My Trips Bookers Jan – Dec 17 | 3
HBO – June 2017 | 4
Omniture – Jun-Dec 2017 |
Hostel Chat, allows customers to get to know fellow travellers staying in their hostel. Customers
are notified via push notification 48 hours before check-in and is open until check-out. The
chatroom is available to all customers who have made a booking for a specific hostel through the
Hostelworld app. Hostel chat has been piloted in 50 hostels worldwide.
The new extend your stay feature enables your customers to quickly check to see if they can stay
in the property for another night and book it through their mobile device. This has been piloted in 22
hostels.
ENGAGING CUSTOMERS BEYOND
THE BOOKING
FINANCIAL
OPERATIONAL
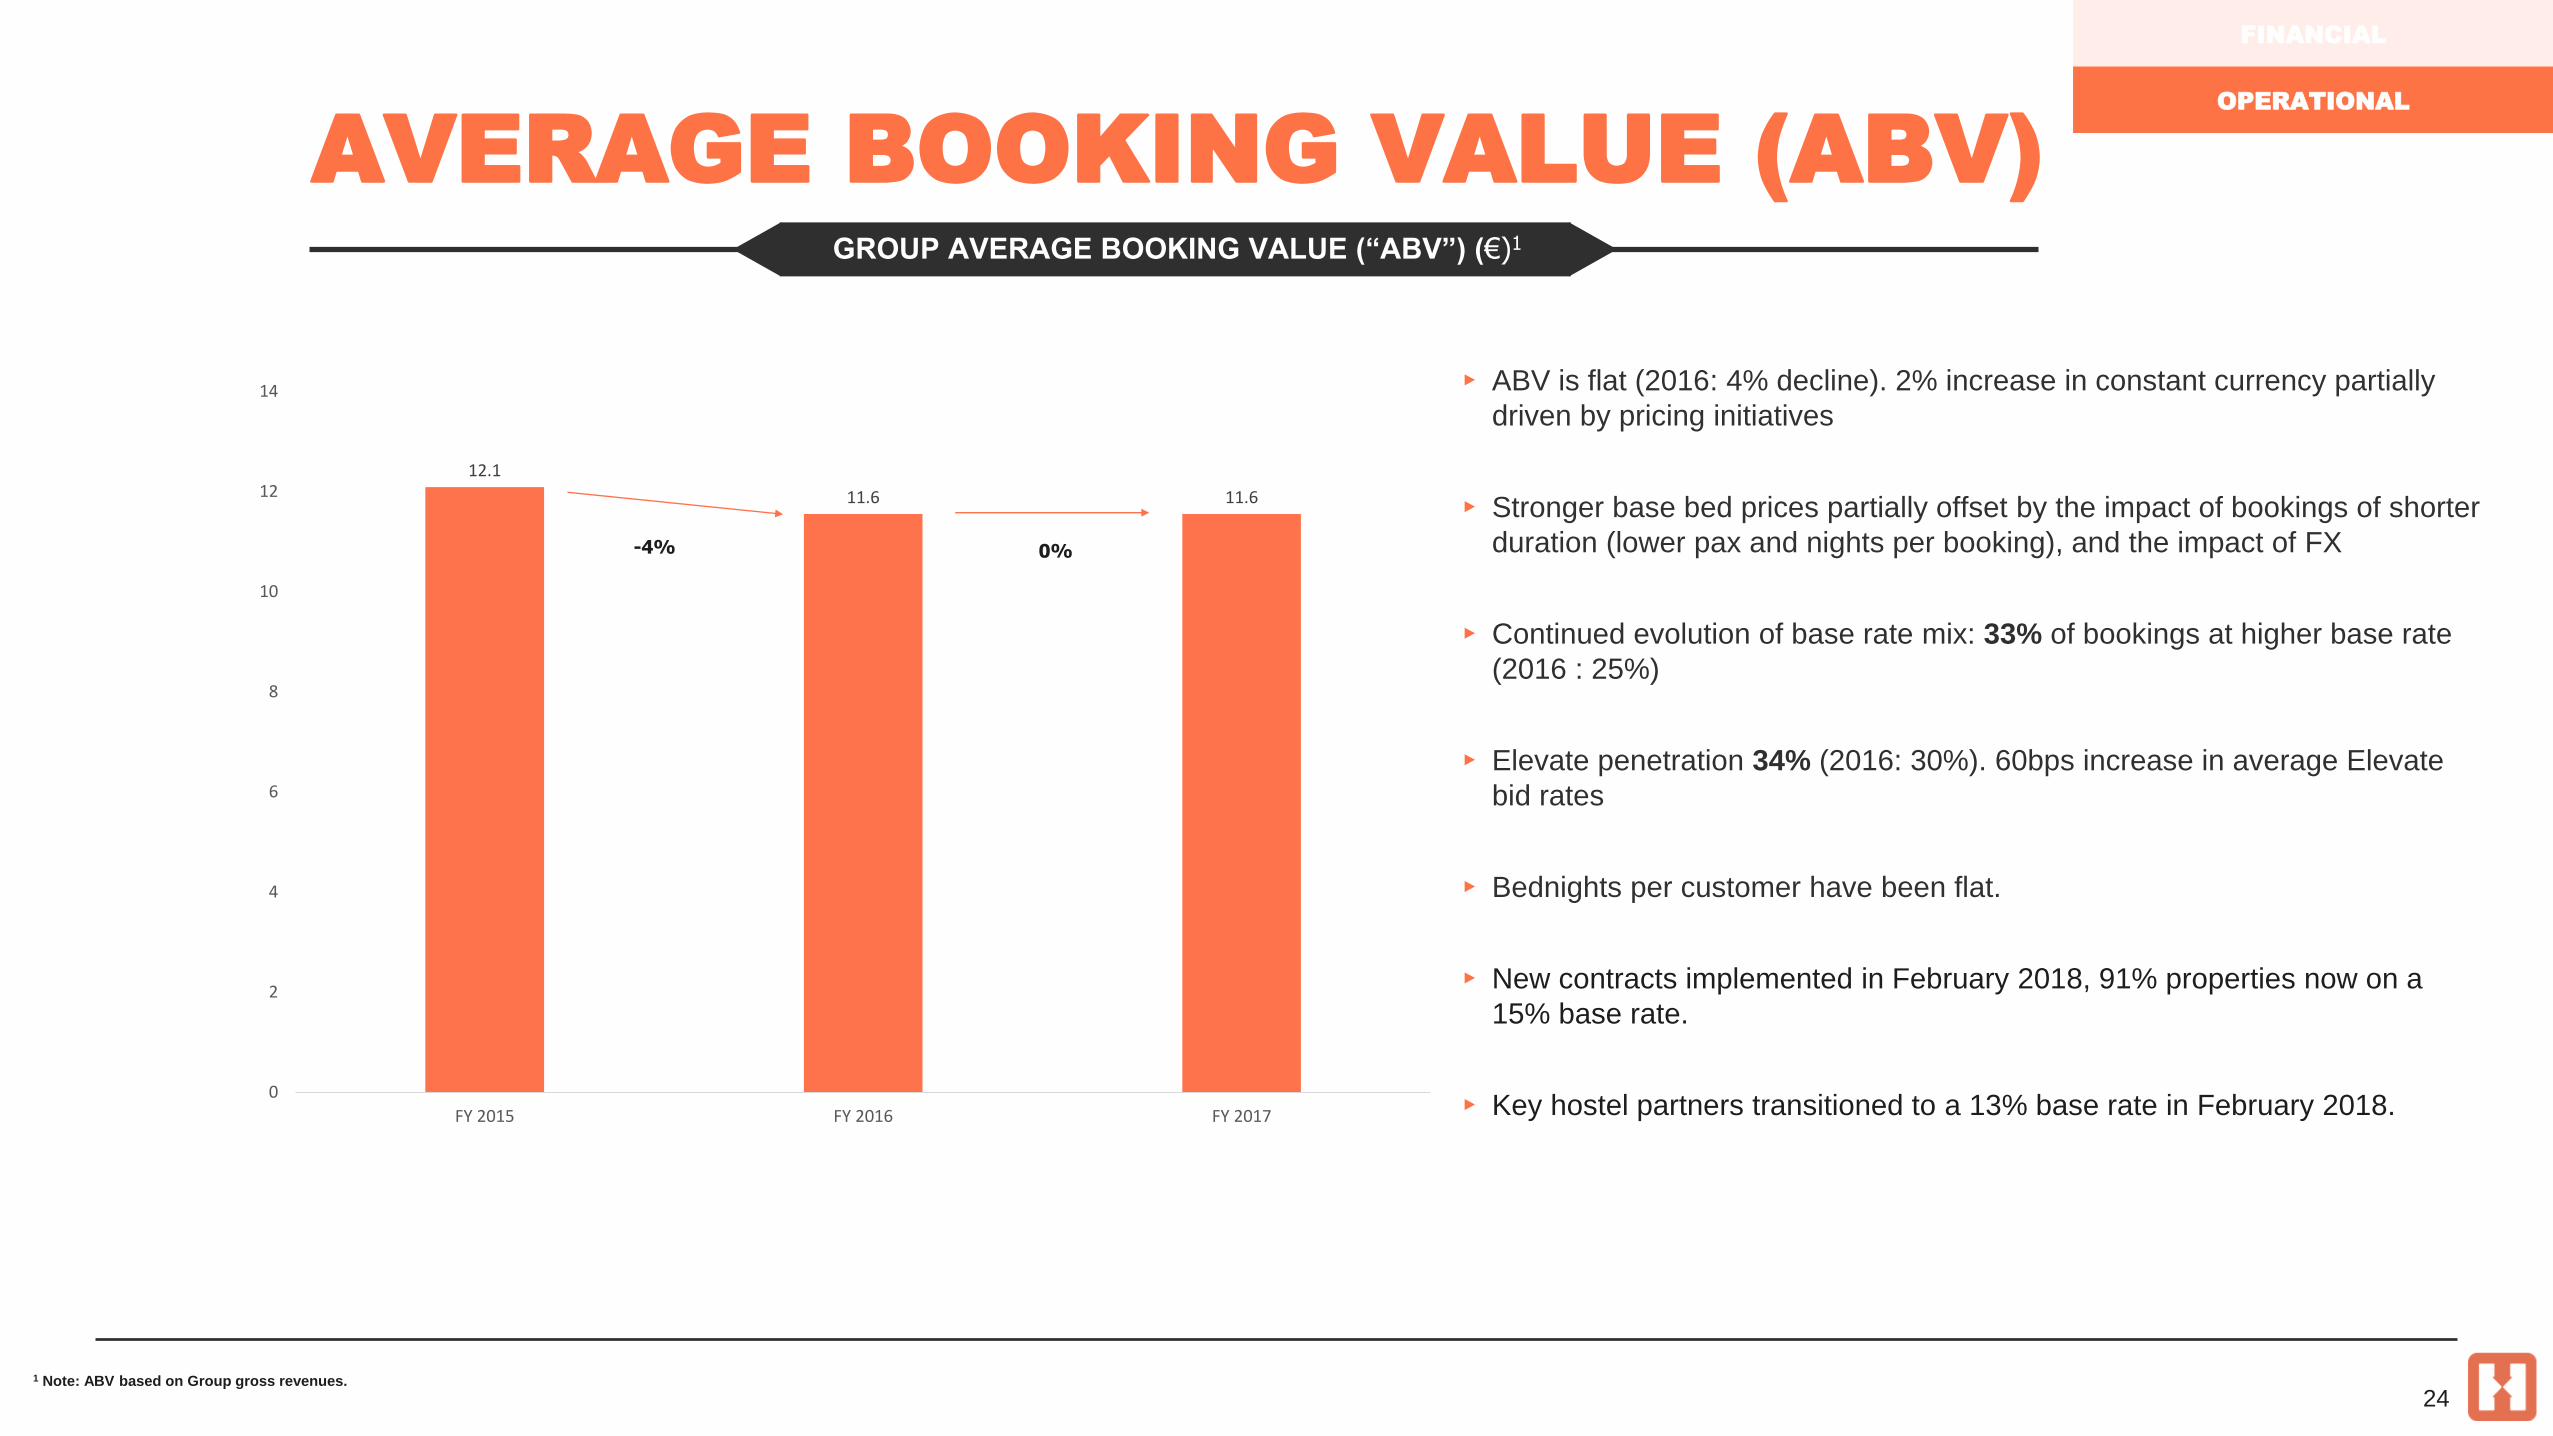
GROUP AVERAGE BOOKING VALUE (“ABV”) (€)1
▸ ABV is flat (2016: 4% decline). 2% increase in constant currency partially
driven by pricing initiatives
▸ Stronger base bed prices partially offset by the impact of bookings of shorter
duration (lower pax and nights per booking), and the impact of FX
▸ Continued evolution of base rate mix: 33% of bookings at higher base rate
(2016 : 25%)
▸ Elevate penetration 34% (2016: 30%). 60bps increase in average Elevate
bid rates
▸ Bednights per customer have been flat.
▸ New contracts implemented in February 2018, 91% properties now on a
15% base rate.
▸ Key hostel partners transitioned to a 13% base rate in February 2018.
1 Note: ABV based on Group gross revenues.
24
FINANCIAL
OPERATIONAL
12.1
11.6 11.6
0
2
4
6
8
10
12
14
FY 2015 FY 2016 FY 2017
0%-4%
AVERAGE BOOKING VALUE (ABV)

GREAT PROGRESS & EXECUTION
COMPETE ON
CORE PRODUCT
• Non refundable rates piloted
25
YOU’D BE
MAD TO BOOK
A HOSTEL
ANYWHERE
ELSE
NEW
DEVELOPMENTS
▸ LOV Hostels – rebranding as Cat
Madrid & Mad Hostels. Excem Capital
Partner -15 properties over /three years
▸ Selina - 25 properties (100 new
openings by 2020). South American
focus, new European office for
expansion in Europe
▸ Astors York – March 2018, 70 beds
(increasing to 120 beds Jan 2019) New
London opening TBC
▸ Safestay expansion –acquisition of U
Hostels & Equity Point Hostels
▸ Grand Hostel Berlin – Opening 2nd
hostel in the city ‘Urban Grand Hostel’
– Apr 2018, 320 beds)
▸ Hilton’s stated intention to enter the
hostel market.
▸ Generator – Madrid, April 2018
(440 beds) & Miami (Beds &
opening date TBC)
▸ HI USA - New Orleans, May 2018
(260 beds)
▸ Jo & Joe Paris Gentilly – Paris,
Nov 2018 (569 beds)
▸ Meininger - 9 new openings
Amsterdam (2017: 806 beds),
Berlin x 2 ( 2017: 835 beds & 848
beds),
Budapest (2017: 751 beds),
Milan x 2 ( 2017: 491 & 268 beds)
Rome (2017: 376 beds),
St Petersburg (2017: 548 beds)
Munich (2019, 822 beds),
TOP 10 KEY ACCOUNT
NEW OPENINGS
(17/18)
▸ Hostels overall estimated bed
capacity increased by 5% in
the period January -
December 2017
▸ Asia bed capacity increased by
14% in the period January-
December 2017
▸ The first Accor Group Jo&Joe
Hostel opened in Hossegor,
France (40 hostels planned)
SUPPLY GROWTHNEW OPENINGS
2017
▸ A&O Bremen Hauptbahnhof,
Bremen, Germany (402
beds)
▸ A&O Copenhagen Norrebro,
Denmark (738 beds)
▸ FieldHouse Jones (250
beds), Chicago, USA
▸ Freehand Los Angeles, USA
(635 beds)
▸ Steel House Copenhagen
(1150 beds), Denmark
▸ Via Amsterdam (750 beds)
STRONG GROWTH IN HOSTEL SUPPLY
5% GROWTH IN ESTIMATED HOSTEL BED CAPACITY
FINANCIAL
OPERATIONAL

GREAT PROGRESS & EXECUTION
BUILD THE HOSTELWORLD
COMMUNITY
• Enable social interaction with
other travellers and with hostels
throughout the journey
• Enhanced blog features
encouraging community
engagement
DELIVER THE BEST PROPOSITION FOR OUR CUSTOMERS AND OUR SUPPLIERS
COMPETING ON
CORE PRODUCT
FUNCTIONALITY AND
DIFFERENTIATING USPS
• Non refundable rates rolled out
• Free cancellation product in
staged rollout
• Piloting Extend Your Stay
product
• Piloting Hostel Chat
• Further Innovation for Mobile
App planned
• Supply side suite of tools in
progress
INCREASE REVENUE PER
CUSTOMER
AND LOYALTY
• Targeted approach to new offers
and product features to drive
customer loyalty backed by data
science
26
HOSTELWORLD IS
THE ONLY PLACE TO
BOOK AND SELL
YOUR BED
FINANCIAL
OPERATIONAL
STRATEGY AND OUTLOOK

27
▸ Now available at more than 3,700 properties
▸ Representing over 50% of bookings into these properties
NON-REFUNDABLE RATES
SPEAK THE WORLD & MY TRIPS/HOSTEL NOTICEBOARD
FINANCIAL
OPERATIONAL
FREE CANCELLATION MODEL
▸ Pilot testing in Q1 2018, phased rollout planned
▸ Higher conversion; longer lead time bookings
▸ Higher value beds; offsetting the loss of cancellation protection revenue
▸ Cancellation rates are being monitored
▸ Deferral of revenue recognition
STRONG CUSTOMER TRACTION WITH NEW PAYMENT MODELS.
NEW PAYMENT MODELS

Focus Areas
CUSTOMER
Drive exceptional customer
experience through core
competency development.
Deliver competitive products
resonating with customer & hostels
alike.
Better merchandising of hostel
product.
Focus on driving increased
conversion through CRO capability.
MOBILE
Lead through expansion of our
innovative mobile products focused
on delivering experiences relevant
to hostel life.
• My Trips
• Hostel Noticeboard
• Speak the world
• Hostel Chat
DATA SCIENCE
Data science at the core of our
investment & at the heart of our
products.
Build personalisation capability.
Leverage the power of data science
throughout technology and product
development.
COMMUNITY
Develop a vibrant hostel community
celebrating hostel life.
Inspire a global audience of
travellers to contribute and interact
on a platform unique to the hostel
community.
28
TECHNOLOGY INVESTMENT

IN CONCLUSION
Significant marketing efficiencies maintained
Proposed final dividend of 12.0 euro cent per share
Continued confidence in long-term strategy and ability to execute,
supported by increased technology investment
Year to date performance on track to meet Board’s expectation for 2018
Successfully executing on operational capabilities,
driving consistently strong Hostelworld Brand growth
29
Strong customer traction with new payment models

Q&A
MADAMA, MILAN