2017 outlook - s3.amazonaws.com€¦ · understand to project the end of this sequence. in elliott...
TRANSCRIPT

2017 OUTLOOK
2016 was an amazing year as it began with the worst start to a year in the history the
markets and ended in historic territory. The year was marked with several turning
points. The first was experienced in March after a 9% decline in January and February as
the Federal Reserve was able to intervene, causing asset prices to rise. After
meandering for most of 2016, we saw yet another upward reversal that began the day
after Election Day as the election of Donald Trump surprised market participants. While
his victory was deemed to be negative, it turned out to be just the opposite as markets
rallied into year-end to set a record high.
Never before have we
seen the worry of
politics, economics,
and finance combine in
ways to create
massive volatility and
threaten a 30-year-
old globalization
effort.
The first major step
towards the collapse of
globalization was the
vote in the UK to leave the
European Union. This sent
shockwaves through Europe and all
Western nations as it was not expected that the vote to leave would win. When Donald Trump was subsequently
elected as president of the United States, this sent yet another shockwave through society as it was obvious that
many cultures were switching from globalization to a populist, nationalist movement.
The key element in causing the shifts was that world economies had been growing less than half of what was
experienced between 1985 through 2003. Since the great the recession of 2008, we saw an anemic 1.2% GDP growth.
This was all that the central banks quantitative easing intervention was able to achieve over an eight-year period.
Contents:
Overview
US Market
Treasuries
VPM Partners Annual Market Outlook 2017
By Robert Kendall,
Deglobalization The Final Countdown!

20 71 Outlook 2
Much of the appreciation in asset prices were
generated through an artificially inflated strategy by
the central banks. However, there was very little real
economic gain made during this period. While
globalization was promoted as a solution for the planet
to maintain growth, it was obvious now that it had
completely failed!
During the election, Trump had several initiatives on
his agenda. They included the lowering of corporate
taxes from 36% to the 15-20% levels, infrastructure
rebuilding, and a new energy policy to make America
self-sufficient. The mantra of “Make America Great
Again”, resonated with the disenfranchised
manufacturing workers and others who had not made
any significant gains in income over the past 20 years.
On the corporate side, proposals to lower taxes are
likely to increase corporate earnings from 6 to 8%
while increasing overall revenues as much as 12%.
While most Trump proposals seem positive, they may
not equate into sustained long-term growth in the
economy or stock prices. The key factor that has not
changed is the national debt, which is now approaching
$20 trillion. The fiscal spending proposals by the Trump
administration will cause the debt to accelerate rather
than too slow. This is likely to be the case for the next
several years before the economy can be restructured
to achieve substantial gains in GDP growth.
I have discussed many times in the past that one day
the national debt would become a major factor. I
believe market participants will realize that the debt is
unsustainable and many of the new policies will cause
an acceleration of the debt. Ultimately, this will end
the bull market.
20 71 Outlook 3
US Market
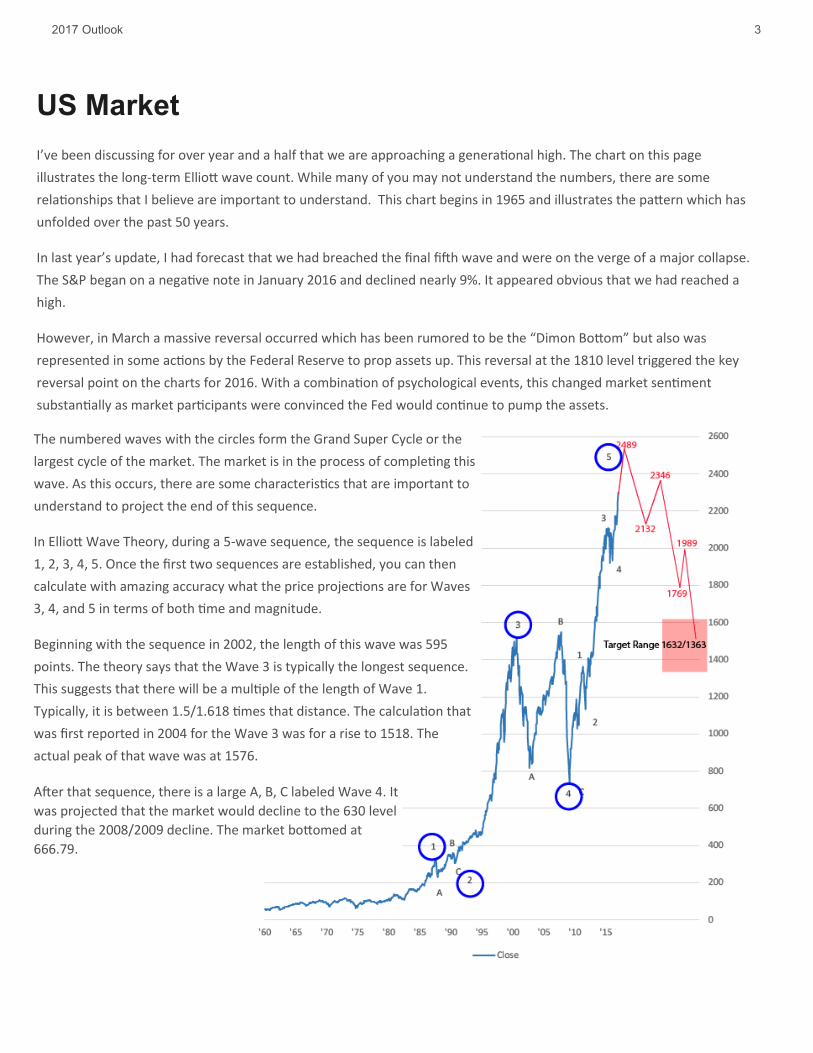
I’ve been discussing for over year and a half that we are approaching a generational high. The chart on this page
illustrates the long-term Elliott wave count. While many of you may not understand the numbers, there are some
relationships that I believe are important to understand. This chart begins in 1965 and illustrates the pattern which has
unfolded over the past 50 years.
In last year’s update, I had forecast that we had breached the final fifth wave and were on the verge of a major collapse.
The S&P began on a negative note in January 2016 and declined nearly 9%. It appeared obvious that we had reached a
high.
However, in March a massive reversal occurred which has been rumored to be the “Dimon Bottom” but also was
represented in some actions by the Federal Reserve to prop assets up. This reversal at the 1810 level triggered the key
reversal point on the charts for 2016. With a combination of psychological events, this changed market sentiment
substantially as market participants were convinced the Fed would continue to pump the assets.
The numbered waves with the circles form the Grand Super Cycle or the
largest cycle of the market. The market is in the process of completing this
wave. As this occurs, there are some characteristics that are important to
understand to project the end of this sequence.
In Elliott Wave Theory, during a 5-wave sequence, the sequence is labeled
1, 2, 3, 4, 5. Once the first two sequences are established, you can then
calculate with amazing accuracy what the price projections are for Waves
3, 4, and 5 in terms of both time and magnitude.
Beginning with the sequence in 2002, the length of this wave was 595
points. The theory says that the Wave 3 is typically the longest sequence.
This suggests that there will be a multiple of the length of Wave 1.
Typically, it is between 1.5/1.618 times that distance. The calculation that
was first reported in 2004 for the Wave 3 was for a rise to 1518. The
actual peak of that wave was at 1576.
After that sequence, there is a large A, B, C labeled Wave 4. It
was projected that the market would decline to the 630 level
during the 2008/2009 decline. The market bottomed at
666.79.

20 71 Outlook 4
The current sequence began in 2009. Wave 1’s high was 1219. Wave 2’s low was 1074 on 10/31/11 with a length of 679
points. The projection for Wave 3 indicated a rally to 2172. The actual high was 2134 on 5/29/15.
The bottom of the 4th wave was completed at 1810 on 2/29/16. This led to the final calculation of the final Wave 5.
Since Wave 3 was the longest wave, the expectation for the length of Wave 5 would be somewhat equal to Wave 1,
which was 679 points. The projection suggests a move to 2489.
The current Fibonacci objectives indicate a rally to 2407/2490 which coincides with this projection. If this is correct, a
market top will be formed and begin a multi-year decline which will retrace at least 40 to 60% of the previous rally up.
This suggests that the market will decline towards the 1632/1363 levels over the following 12 to 18 months. The
possibility of a secular bear market will begin lasting over the next 3 to 4 years. This top will form between Q2 and Q3 of
2017.
The initial fundamental trigger will be a combination of the national debt
exceeding $21 trillion, overall unrest in the world, or fall out from trade deals
or a geopolitical event with unintended consequences. There’s also the fact
that much of the rally that we have experienced over the last nine years has
been due to a monetary stimulus strategy by the central banks representing a
bubble. The buildup of debt and other excesses that have been experienced
during this time will catch up with the markets.
$19,890,330,215,216.52 Total Public Debt Outstanding as of 2/6/2017

20 71 Outlook 5
The interest rate complex has been at the center of attention for the past 11 years. With the implementation
of the QE programs, the Federal Reserve has been dictating the direction and the magnitude of the decline of
interest rates. Not only did they use policies to keep rates artificially low’s but also used mortgage and
treasury purchases to help maintain their strategy. The effect of all this had the Federal Reserve’s balance
sheet expand from 800 billion to 4.7 trillion during this period.
Market participants have remained optimistic on bonds coming into mid-2016, despite the rate increase that
we saw in December 2015. But midyear 2016 there was a complete paradigm shift. Participants became
negative on the interest rate outlook as we entered into the August to September period. The municipal bond
market led the way in the beginning of this phase of rising interest rates. As a result, the VPM models
liquidated municipal bond holdings during this period and then later we saw corporate, treasuries, and high-
yield bonds also be sold.
As 2017 unfolds, we are likely to see new stressors in the public pensions as they are under massive pressure
from underfunded liabilities. A key pension fund in Dallas has seen assets frozen from any withdraws due to
this illiquidity. This is potentially the Bear Stearns moment for the public pensions system. Major cities such as
Los Angeles, Houston, Chicago, and New York, to mention a few are also under extreme stress. Virtually all
public retirement systems are underfunded which is causing market participants to question the viability of
the systems.
Should these funds experience further compromises, this could trigger a loss of confidence in not only the
pension funds but the bond market and other financial sectors. Looking back at 2000, an asset bubble was
created by the mispricing of assets in the Internet sector before triggering more than a 40% decline. In
2006/2007, it was a mispricing of real estate and abuse in mortgage securitization combined with excessive
leverage forming yet a second bubble. As we know, this took a massive bailout to keep the system afloat
combined with a huge asset purchasing program by the central banks across the planet. This, in my opinion,
sets the tone for the public retirement system to be a potential failure point for the next crisis.
.

20 71 Outlook 6
The chart below illustrates the past 80 years of interest rate movement. There was a 26-year cycle beginning in 1954
where interest rates rose steadily throughout the 50s, 60s, and 70s. There was a spike in 1980 at the end of the Carter
administration when interest rates reached 15.75%. Paul Volker lead the way to crush inflation and other liquidity
issues to begin the major bull market in bonds.
The market finds itself 26 years later at a bottom having dropped from 15.75% down to 1.31%. This cycle is reversing,
beginning the formation of the next major trend that will likely last for 20+ years.
While bonds have begun to trend higher, it won’t be a straight line up but a steady increase over the next couple
decades, making the management of the debt much more difficult.
The policies of Donald Trump are going to trigger an acceleration of debt. Even with the tax cuts and other incentives,
including the deregulation of many industries, this process will take 2 to 3 years before it will get any real traction and
change the trajectory of debt. Market participants, being as intuitive as they are, will anticipate this trend once it
begins but there is likely to be substantial pressure in the bond market over the next 12 to 18 months as the trend
unfolds.
U.S. 10-Year Treasury Note

20 71 Outlook 7
The 10-year treasuries illustrate that there are several key levels to watch. The first level is the 2.62% level. A move
above this level will suggest that we will challenge the key pivot number at the 3.03% level. A close above this level will
set the tone for a multi-year rise in interest rates, initially moving to the 3.80/4.20 levels, before finally finding some
stability. From this point, a stabilization is likely before resuming the higher rate environment towards the 5.15%+ level
in 2018 and beyond
The reason why this section was titled “60/40 is Dead” is because it is unlikely that these types of strategies will be
effective as rates began to increase. Not only are rates going to be increasing, but there is even a stronger chance, as I
mentioned earlier in this report, that we will see a major top form in equities. These asset classes will be declining at
the same time. This being the case, it will be necessary to have some substantial protective strategies or a form of
portfolio insurance.
Antiquated “Risk Management”
Perceived greater risk resides predominately in equities
Cash is only held for fees and minor needs
“Safe” bonds instead of cash
“Riskier” bonds are always held but given less exposure