2017 north american staffing & recruiting trends...
TRANSCRIPT

1
2017 North American Staffing & RecruitingTrends Report:Above and Beyond
Business as Usual

© Bullhorn 2017. All Rights Reserved. 2
An in-depth look into the complex world
of staffing and recruiting firms, this report
analyzes the state of the industry in 2017 and
covers a wide range of topics—from the recent
election to KPIs to revenue projection and
best practices.
It’s based upon a global survey of more than
1,400 staffing and recruiting professionals at firms
of all sizes operating in all sectors. We tapped the
industry’s movers and shakers to find out how
they’re planning to tackle challenges, overcome
uncertainty, and build sustainable profitability.
The most innovative and aggressive firms
stride towards success through greater
operational efficiency, client retention, candidate
engagement, and pure hard work and grit. In
other words, they’re going above and beyond
business as usual, and the findings of this report
highlight exactly how they’re doing it.

© Bullhorn 2017. All Rights Reserved. 3
Table of Contents
Executive Summary
The Staffing Landscape
Top Priorities
Top Challenges
Talent Shortages
Economic & Political Outlook
2017 Performance Outlook
Revenue Expectations
Hiring Outlook
Revenue Sources
Areas of Investment
Key Performance Metrics
Ramp-up Time
Corporate Structure
Recruiting Metrics
Sales Metrics
Employee Perceptions
Staffing Industry Best Practices
Operational Efficiency through Technology
Best Talent Sources
Evaluating Client and Candidate Engagement
Measuring Client Engagement
Boosting the Candidate Experience
Key Takeaways: Opportunities to Excel
About Bullhorn
Appendix: Survey Demographics
4
10
11
14
15
16
19
20
22
26
28
32
33
34
36
38
39
40
42
43
45
46
47
48
57
58

© Bullhorn 2017. All Rights Reserved. 4
ExecutiveSummary

5
Bullhorn is pleased to share the opinions,
outlooks, and concerns of more than 800 North
American staffing professionals in its 2017 North
American Staffing & Recruiting Trends Report:
Above and Beyond Business as Usual.
Opportunities abound for most staffing
firms in 2017, but achieving success requires
going above and beyond a business as usual
mindset. Sustaining profitable growth—a top
priority among respondents—takes a clear
focus on operational efficiency, as well as an
understanding of the increasingly complex
challenges presented by a shifting economic
and political environment. Moving beyond the
status quo also takes a multifaceted approach,
anchored by strong performance metrics and a
commitment to client and candidate engagement.
The 2017 Staffing & Recruiting Opportunity: Sustaining Growth
TOP PRIORITIES
56% Increasing profitability
47% Driving revenue growth
35% Candidate acquisition
TOP CHALLENGES
61% Talent shortages
53% Pricing pressure/margin compression
37% Global economic uncertainty
ECONOMIC CONCERNS
35% Cost of healthcare
23% Economic growth
21% Trump administration
POLITICAL SENTIMENT
38% More confident about future
21% Less confident about future
NEW VS. EXISTING BUSINESS
78% Expect to generate a majority of revenues (51%+) from existing clients
10% Expect to generate a majority of revenues (51%+) from new business
Here’s an at-a-glance look at how staffing & recruitment pros feel about the year ahead.
REVENUE OUTLOOK
37% Expect revenue to increase by up to 10%
26% Expect revenue to increase by 11-25%
17% Expect revenue to increase by 25%+
BUSINESS INVESTMENT
43% Predict an increase in operating budget
40% Predict an increase in tech investment
38% Predict an increase in branch network
HIRING OUTLOOK
69% Expect hiring needs to increase
67% Expect billable hours to increase
48% Expect temp placements to increase
SERVING CLIENTS AND ENGAGING CANDIDATES
92% Rate their firm’s client service good or excellent
86% Rate their firm’s candidate service good or excellent

6
Because we surveyed firms across a range of
sizes and industry sectors, the results shouldn’t
be interpreted as one-size-fits-all. Rather, we
encourage you to take a closer look to determine
what findings might be appropriate for your
unique environment. The report uncovers some
powerful strategies to capitalize on industry best
practices, as well as some interesting insights
from survey respondents.
A Strong Outlook for 2017
2017 looks like a banner year for the staffing
industry in comparison to last year. Surveyed at
the very end of 2016, more than 75 percent of
respondents predicted they’d meet or exceed
their revenue goals: 42 percent expected to
exceed them, 36 percent hoped to meet them,
and 22 percent prepared for a shortfall.
of staffing firms expect some
revenue growth in 2017
By comparison, staffing firms are widely—and
some might say wildly—optimistic in 2017. Eighty
percent expect some revenue growth and 17
percent expect revenue growth of more than 25
percent. Hiring needs, billable hours, and reliance
on contingent labor are expected to increase
(according to 69 percent, 67 percent, and 48
percent of respondents respectively).
Close to 80 percent of firms expect to generate
a majority of revenue from existing clients,
leveraging internal contacts to penetrate across
functions and departments. Revenue from
Vendor Management System (VMS) business is
expected to remain largely consistent in 2017, with
anticipated decreases occurring primarily in firms
that only have a small percentage of job orders
driven through a VMS.

© Bullhorn 2017. All Rights Reserved. 7
The Search for Sustainable Profitability
Increasing profitability and driving revenue top
the list of staffing priorities for 2017, ranked by 56
percent and 47 percent respectively as a primary
goal. The lowest priority across the board is
moving to VMS, with 36 percent ranking it in the
bottom three. Achieving financial stability takes
precedence over expansion plans, as firms also
ranked acquisitions and offshore partnerships
among lower priorities.
Overcoming Obstacles
Keeping one eye on the bottom line, respondents
must necessarily scan the horizon for potential
disruptions—and there are plenty. It’s no surprise
that a shortage of qualified talent represents
the biggest expected challenge of the year (and
likely far into the future). More than 60 percent of
all respondents rank it as a top three challenge,
followed by pricing pressures (53 percent) and
economic uncertainty (37 percent).
Despite strong domestic and international
challenges, a resilient spirit emerges intact. Even
with the political upheaval of 2016 and volatility
surrounding healthcare and labor policies, 38
percent believe their firm will be better off in 2017
under President Trump’s administration. More
than half of respondents aren’t actively concerned
about the new administration.

© Bullhorn 2017. All Rights Reserved. 8
Metrics Matter
Staffing firms recognize the importance
of tracking key metrics, even if they don’t
consistently do it. Almost two-fifths (37 percent)
of respondents use gross margin as the prime
indicator of sales effectiveness, followed by total
placements. For recruiting delivery, customer
satisfaction ratings take precedence (63 percent
rank as the top metric), followed by fill rate and
submittal-to-hire.
To ensure the fastest ramp-up time for new
employees (the usual timeframe is 1-3 months),
transparency of results through metrics remains
critical. With a majority of staffing employees
finding it harder to deliver consistent results,
retention requires a commitment to performance
feedback, constant training, and support.
The Value of Technology Investments
Investments in technology play an important role
in driving operational efficiency and improving
margins. Technology adoption is high: 64 percent
of North American staffing firms use an Applicant
Tracking System (ATS) to track candidate activity
and 60 percent use a Customer Relationship
Management (CRM) system for business
development.
However, firms aren’t taking full advantage of
one of the best sources of qualified talent—their
existing candidate database. More than a third of
North American firms (34 percent) make fewer
than 25 percent of their total placements from
candidates already in their ATS or CRM.
respondents who use gross
margin as the prime indicator
of sales effectiveness
37%

© Bullhorn 2017. All Rights Reserved. 9
Engaging Clients and (Especially) Candidates
Advancing the client and candidate experience
to add value and build loyalty offers one of the
clearest ways to stand out from the crowd. But
when it comes to engagement and satisfaction,
it’s a case of “do as I say, not as I do.”
Large portions of staffing firms rank themselves
highly on delivery; 92 percent say they provide
good or excellent service to clients and 86
percent say the same about the service they
provide to candidates. However, many admit to
not tracking client and candidate satisfaction at
all, while others do so inconsistently. In light of
persistent talent shortages, firms would be
well-served to implement a comprehensive
approach to engaging clients and candidates
across multiple channels.
Further Trend Analysis
At the end of this report, we’ve provided
additional insights into key opportunities
uncovered by the survey responses. We’ve
outlined some takeaways and practical paths you
can take advantage of in 2017 to tackle tough
challenges and create a thriving, profitable, and
sustainable business model.

© Bullhorn 2017. All Rights Reserved. 10
The Staffing Landscape

© Bullhorn 2017. All Rights Reserved. 11
To kick off this year’s report, we’re taking a
30,000 foot perspective on the state of the
industry. Broadly speaking, what opportunities
and challenges lie ahead, and how are firms
responding? Which factors—both positive and
negative—impact the outlook for 2017?
Top 3 Priorities
Increasing profitability (56%)
Driving top-line revenue growth (47%)
Candidate acquisition and sourcing (35%)
Lowest 3 Priorities
Moving to VMS (36%)
Expanding through acquisition (29%)
Leveraging secondary sourcingpartners and offshore recruitment
resources (28%)
Top Priorities: Show Me the Money
No doubt about it, staffing firms have a lot on
their plates. With the ongoing talent shortage,
social engagement, offshore competition, process
automation, and other pressures, going about
business the same old way just won’t cut it. With
all these competing priorities, where are staffing
firms planning to spend their time and energy
in 2017? Take a look at the list of top and lowest
priorities, which are ranked by percentage of all
respondents who included each among their top
or bottom three.
Every dollar invested to boost profitability and
productivity requires a tradeoff. A low priority
on acquisitions and third-party partnerships
suggests that firms plan to focus on organic
growth, a strategy which will be well-served
by other high-ranking priorities such as new
market expansion, improved client and candidate
relationships, and improvements in automation.

© Bullhorn 2017. All Rights Reserved. 12
of respondents rank
increasing profitability as
a top priority for 2017
56%
“Oftentimes, it’s difficult to
find an expert in a very specific
realm who has the licensures
and degrees the client is requiring.
For example, finding a nurse
who has experience auditing a
specific type of Medicare Code
with clinical coding credentials
AND managed care experience.
It’s easy to find a nurse and
easy to find a coder, but
when it comes to licensure
plus experience narrow down
the candidate pool so
significantly that a
recruiter is very limited.”
– Survey respondent

© Bullhorn 2017. All Rights Reserved. 13
We see remarkable consistency in the top and lowest priorities across
job role and firm revenue, although a few notable trends emerge:
As you might expect, top executives were more
insistent on the importance of profitability and revenue
than production personnel. For example, 54 percent
of the C-suite ranked revenue growth as a top
priority, compared to 44 percent of non-executive
staff members.
Increasing profitability is the top-ranked priority for staffing firms of
every size, although those in the $10-25 million revenue range rank
profitability and top-line revenue as nearly equal in importance (52
vs. 51 percent respectively).
Firms in the $25-50 million revenue range give the
highest priority ranking for profitability, with 74 percent
placing it in their top three list. The very largest firms
(over $250 million in revenue) were less likely to place
revenue growth in their top priorities than smaller firms.
The very largest firms (over $250 million in revenue) were less likely to
place revenue growth in their top three priorities. Instead, employment
brand development and marketing rose as a top ranking, along with
profitability and candidate acquisition.
SPOTLIGHT:
Demographic Differences

© Bullhorn 2017. All Rights Reserved. 14
Top Challenges:
What Keeps You Up at Night?
There’s no shortage of pressure on staffing
industry leaders, although there’s definitely a
shortage of qualified candidates. So, it’s not
surprising that the number one challenge facing
the industry is a talent shortage, far and away.
Sixty-one percent of respondents include it in
their top three challenges and 38 percent list it as
their single biggest challenge. Pricing pressure/
margin compression emerges as a close second,
indicating that commoditization will continue as a
force to be reckoned with in 2017.
Top Industry ChallengesPercentage Ranking Item as a Top Three Challenge
“There are myriad skill
shortages in technology,
but the greatest is a
combination of great
communications skills
plus technology skills.”
– Survey respondent
61%
53%
37%
26%
23%
19%
17%
16%
11%
Talent Shortage
Pricing pressure/margin compression
Uncertainty over economicand future growth
Leveraging technology to improvebusiness operations
Expanding VMS model
Regulatory concerns, includingovertime law impact
Outcome of the U.S. election andchanges in regulations/policies
Growth of freelance economy
Increasing demand for Statement of Work (SOW) and outcome-based models

© Bullhorn 2017. All Rights Reserved. 15
Talent Shortages Threaten Growth
When it comes to the talent shortage, employers
and staffing firms share the same pain. In fact,
the extreme difficulty in sourcing skilled labor is
one of the primary reasons clients turn to staffing
firms in the first place. Persistent shortages
provide yet another impetus to engage passive
candidates and cultivate a strong internal
database, not only for hard-to-find IT and
engineering roles, but also for professional and
industrial positions.
IT skills dominate the list of skill shortages most
reported by recruiters. Engineers and developers,
particularly Java, top the list of hardest-to-find
skills.
Spotlight on Skill ShortagesBased on Hardest-to-find Skills
“DEFINITELY – the
hardest part now is to
find talent; talent willing
to work hard; intelligence
to handle the job;
management level
candidates that can
manage people.”
– Survey respondent
© Bullhorn 2017. All Rights Reserved. 16
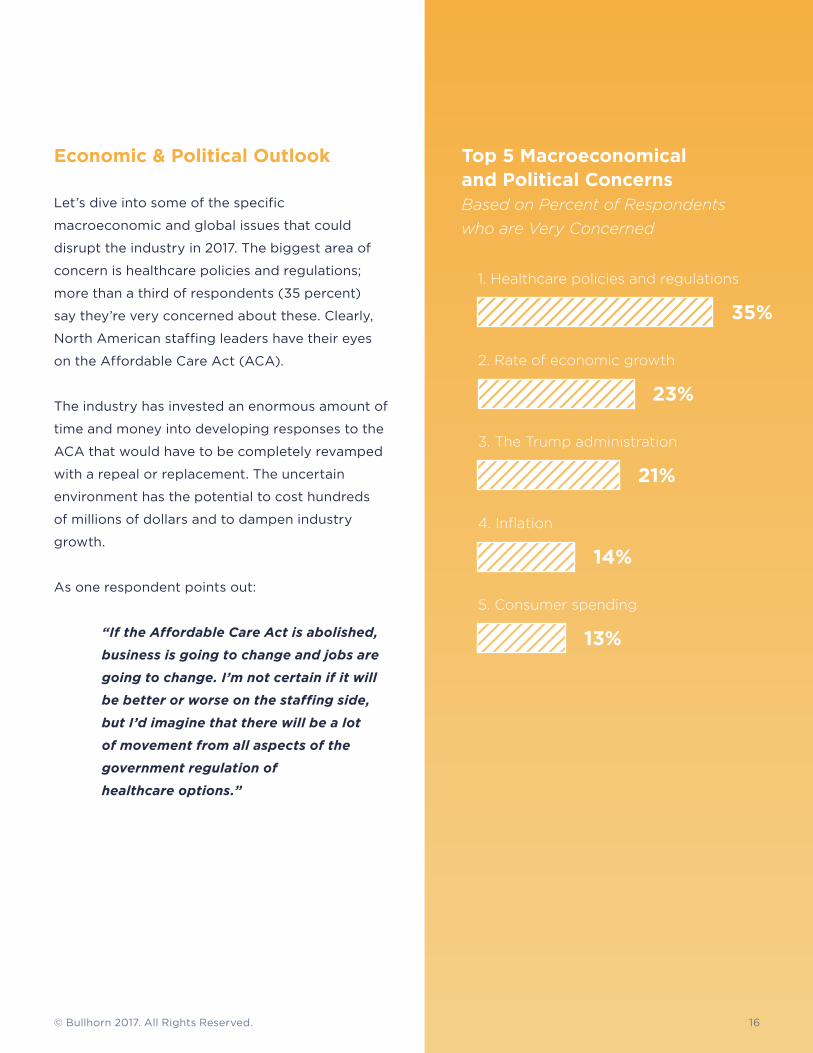
Economic & Political Outlook
Let’s dive into some of the specific
macroeconomic and global issues that could
disrupt the industry in 2017. The biggest area of
concern is healthcare policies and regulations;
more than a third of respondents (35 percent)
say they’re very concerned about these. Clearly,
North American staffing leaders have their eyes
on the Affordable Care Act (ACA).
The industry has invested an enormous amount of
time and money into developing responses to the
ACA that would have to be completely revamped
with a repeal or replacement. The uncertain
environment has the potential to cost hundreds
of millions of dollars and to dampen industry
growth.
As one respondent points out:
“If the Affordable Care Act is abolished,
business is going to change and jobs are
going to change. I’m not certain if it will
be better or worse on the staffing side,
but I’d imagine that there will be a lot
of movement from all aspects of the
government regulation of
healthcare options.”
Top 5 Macroeconomicaland Political ConcernsBased on Percent of Respondents
who are Very Concerned
35%
1. Healthcare policies and regulations
23%
2. Rate of economic growth
21%
3. The Trump administration
14%
4. Inflation
13%
5. Consumer spending

© Bullhorn 2017. All Rights Reserved. 17
The rate of economic growth emerges as a
distant second on the list of concerns. And
despite reporting more confidence post-
election, many respondents still view the Trump
administration as a wild card. Nearly half (48
percent) are very or somewhat concerned about
the new executive branch, while similar numbers
are indifferent or not concerned (51 percent).
Despite the contentious nature of the 2016 U.S. Presidential election and
concerns about the new administration’s policies, significantly more North
American staffing leaders (38 percent) are more confident about the future
outlook for the staffing industry after the election of Donald Trump than those
who are less confident (21 percent).
SPOTLIGHT: The U.S. Election
71% of staffing firms are very
or somewhat concerned about
the potential disruption to their
business caused by healthcare
policies and regulations, and 35%
are very concerned.
U.S. Election InfluenceImpact of the Presidential
Election on Industry Outlook
29%
Unchanged
38%
More
Confident
12%
Not Sure
21%
Less
Confident

© Bullhorn 2017. All Rights Reserved. 18
Strong Domestic Focus
Domestic issues outweigh global concerns.
Overall, the lowest ranked areas of concern
link to international issues, including: currency
fluctuation, international trade, refugee
displacement, and Brexit. For example, three
quarters say they’re indifferent or not concerned
about Brexit or refugee displacement (75 percent
and 72 percent respectively), and more than
half (55 percent) express low concern over
international trade.
We also explored the business implications of
increased restrictions on the movement of labor,
a policy under considerable discussion in the U.S.
and other regions.
More than a quarter (27 percent) anticipate
negative impact if world leaders increase
restrictions on the movement of labor in some of
the biggest economies in the world, and another
third were unsure (32 percent). The availability
and ability of talent to migrate globally has long
been an advocacy issue for staffing firms, so it’s
interesting that 21 percent say that further labor
restrictions would carry a positive impact.
Business Implications ofLabor Movement Restrictions
27%
Negative
21%
Positive32%
Unsure
19%
None

© Bullhorn 2017. All Rights Reserved. 19
2017 Performance Outlook

© Bullhorn 2017. All Rights Reserved. 20
In this section, we explore the outlook for
revenue, hiring, and key operational investments.
All indications point to another year of strong
growth, bolstered by demand from existing
client relationships.
Revenue Expectations:
Full Steam Ahead in 2017
Surveyed at the very tail end of 2016, more than
three quarters of respondents predicted they’d
exceed revenue goals for 2016: 42 percent
expected to exceed them and 36 percent
expected to meet them. Still, more than one
in five (22 percent) anticipated a revenue
shortfall for 2016.

© Bullhorn 2017. All Rights Reserved. 21
A Rosy Outlook on RevenuesHow do you expect revenue to
change in 2017 compared to 2016?
Despite some laggards, the future looks
positively rosy for 2017. There’s no shortage
of confidence in the industry: a full 80 percent
foresee an increase in revenues in 2017, and
almost one in five (17 percent) expect revenue
growth of more than 25 percent. What accounts
for this optimism? Stellar growth from temporary
placements, driven by repeat clients facing talent
shortages in key sectors.
of staffing firms expect
revenue growth in 2017
of staffing firms
expect revenue growth
of more than 25%
80%
17%
17%
Increase more than 25%
26%
Increase between 11% and 25%
37%
Increase up to 10%
8%
Stay the same
2%
Decrease up to 10%
1%
Decrease between 11% and 25%
1%
Decrease more than 25%
8%
Don’t know/unsure

© Bullhorn 2017. All Rights Reserved. 22
Hiring Outlook:
Signs Point to Growth
To get a closer look at growth trends for 2017,
we explored several leading indicators in more
detail. Positive signals abound. More than
two-thirds of companies anticipate hiring
needs will increase (69 percent), as well as
billable hours (67 percent). Close to half (48
percent) say their temporary placements
will rise.
More and more workers identify themselves as
contingent; according to a U.S. Government
Accountability Office report, between 30 and
40 percent of the workforce can be classified
that way. The upticks in our data mirror
workforce trends and indicate significant
positive change, both in terms of orders filled
and resulting revenue.
69% expect hiringneeds to increase
67% expect billablehours to increase
48% expecttemporary
placements toincrease
PositiveIndicators:
© Bullhorn 2017. All Rights Reserved. 23
To take a closer look at where 2017 growth may be strongest, we broke
down the responses for three indicators—hiring needs, billable hours,
and temporary placements—by revenue, area of job specialization, and
industry served. The good news? Overall, firms are extremely bullish; the
vast majority expect either an increase or no change in these parameters.
Firm Revenue
• Generally speaking, the larger the firm’s revenue, the more they expect
hiring needs to increase in 2017. The smallest firms (less than $1 million
in revenue) are decidedly less optimistic. Only 41 percent expect hiring
needs to increase, compared to 75 percent of larger firms (more than
$10 million in revenue).
• More than 80 percent of firms in the $25-50 million and $100-250
million revenue range expect an increase in billable hours this year.
• The $50-100 million category contains the highest proportion of
respondents expecting a decrease in hiring and billable hours, although
that figure is only seven percent in both cases.
• Between 43 and 58 percent of firms of all sizes expect an increase in
temporary placements in 2017, with small firms once again serving as
an outlier. Only 33 percent of firms making less than $1 million in
revenue expect temp hiring growth.
SPOTLIGHT:
Demographic Difference

© Bullhorn 2017. All Rights Reserved. 24
Job Specialization
• Sorted by placement specialty, we find optimism across all functions
and disciplines. Firms placing sales professionals are the least bullish,
but more than half (57 percent) still expect an increase in hiring needs.
• Light industrial/mechanical specialists have the highest proportion of
expected hiring increases at 75 percent. Those firms also have high
expectations for billable hours (71 percent), although office/clerical/
admin represents the strongest sector for an expected rise in hours
(76 percent).
• Temporary placement penetration again dips in the sales arena (only
27 percent expect an increase). At the top of the demand cycle, more
than half of finance and accounting, IT/technical, and office/clerical/
admin firms expect increased temporary placements (55, 54, and 53
percent respectively).

Industry Served
• At least two-thirds (67 percent) of respondents in every industry sector
expect an increase in billable hours.
• Hiring needs are expected to be highest in the industrial sector (78
percent expect an increase) and lowest in the pharma/biotech/medical
equipment industry (55 percent). The business services segment tops
the list for expected increase in billable hours (73 percent), followed
closely by manufacturing and industrial sectors.
• Despite expected strength in hours and hiring needs, temporary
placement penetration is expected to be less strong in industrial and
manufacturing business sectors. Only 42 percent of respondents in
those areas expect an increase in temporary placements.
© Bullhorn 2017. All Rights Reserved. 25
Spotlight on Hiring Needs
The most optimistic firms:
• Revenue Size: those earning more than $500 million in revenue
• Industry: those operating in the pharma/biotech/medical equipment sector
• Job Specialization: those placing light industrial and mechanical workers
The least optimistic firms:
• Revenue Size: those earning less than $1 million in revenue
• Industry: those operating in the industrial sector
• Job Specialization: those placing sales professionals

© Bullhorn 2017. All Rights Reserved. 26
Revenue Sources:
Growth Driven By Existing Accounts
So where’s all this booming business going to
come from? The short answer, from existing
clients. Close to 80 percent of firms say more
than half their revenue will come from current
accounts. For the majority of North American
staffing firms (57 percent), anticipated revenue
from new clients will only account for less than
a quarter of total revenues.
The old saying “a bird in the hand is worth two
in the bush” applies here. Driving more revenue
from existing clients delivers a strong profitability
boost, as business development and sourcing
expenses drop.
Of course, building a healthy pipeline of new
business protects firms from becoming too reliant
on too few accounts. Diversifying the business
portfolio may take firms outside of their comfort
zone, but it serves to reduce risks. Interestingly,
the bigger the company, the less likely new
business is to fuel top line growth.
New vs. Existing BusinessPercentage of Revenue by Type of Business
3%4%
15%
42%
31%
5%12%
46%
1%2%
7%
32%Existing
AccountsNew
Business

© Bullhorn 2017. All Rights Reserved. 27
VMS Contributions
Staffing firms expect only moderate changes in
the percentage of total job orders driven through
VMS in 2017 compared to 2016, ranging from an
expected year-over-year decline of about three
percent to an increase of about four percent.
Generally speaking, smaller firms are less likely to
drive a large portion of their revenue through a
VMS. About 50 percent of larger firms (over $100
million in revenue) get jobs from a VMS to drive
at least 25 percent of their revenue. In contrast,
only 23 percent of small firms with less than $5
million in revenue drive a quarter or more of their
revenue through a VMS.
Decreases in VMS job order ratios are expected
by staffing firms of all sizes at either end of the
utilization scale—those filling up to 10 percent of
jobs through VMS and those filling more than 91
To extract the greatest value out of low-margin
VMS engagement, and to increase the number of
orders filled, firms should closely examine
technology-driven operational improvements.
percent of jobs that way. In both those categories,
businesses of all size expect VMS penetration
to decline or, at best, stay flat. The story in the
middle is muddier; pockets of expected growth
pop up at different penetration rates and among
firms of different revenue sizes.
To extract the greatest value out of low-margin
VMS engagements, as well as to increase the
number of orders filled, staffing firms should
closely examine technology-driven operational
improvements. These could include automating
the processes of routing job requirements from
the VMS to the ATS, entering job order details
into the ATS, submitting candidates to the VMS,
and tracking VMS-related metrics. Effective use of
an ATS and/or CRM can also pay off by allowing
firms to connect with potential candidates faster
and improve submittal times.

© Bullhorn 2017. All Rights Reserved. 28
Organizational Investments
Despite the robust hiring outlook in 2017,
many firms hedge their bets when it comes to
cash outlays. Most firms say their operating
budget, technology investments, and branch
infrastructure will either increase or stay at
similar levels to 2016 (88 percent, 85 percent,
and 84 percent respectively). Only a very small
percentage expect decreases in these areas.
Expected Change in Investment for 2017
43%Operating
Budget
Tech
Investments
Branch
Expansion
45%
7%
40%
45%
7%
38%
46%
5%
Increase Same Decrease

© Bullhorn 2017. All Rights Reserved. 29
A few notable data points stand out when we examine investment areas by
firm revenue, area of job specialty, and industry served.
Firm Revenue
• Firms that earn between $50-100 million are the most bullish in terms of
expected increases in tech investments.
• The largest proportions of individuals expecting an operating budget
increase are at mid-size firms (revenue between $25 and 100 million),
at close to 60 percent.
• The biggest firms (over $250 million in revenue) expect to get bigger:
88 percent expect more branch expansion, whereas the vast majority of
firms making $50 million or less expect no change.
SPOTLIGHT:
Demographic Difference

© Bullhorn 2017. All Rights Reserved. 30
Job Specialization
• For all firms in the largest specialty areas we surveyed, the percentage
of individuals expecting an increase in operating budget ranges from 34
to 48 percent. Finance and accounting comes in at the top of that scale
and light industrial at the bottom.
• Firms specializing in finance and accounting placements expect the
highest increases in tech investments (45 percent). Engineering and
light industrial bring up the rear at only 28 percent.
• Which firms expect to physically expand in 2017? Likely not those
placing professional and specialty candidates; only 31 percent expect
branch expansion, compared to 46 percent of light industrial firms.
Industry Served
• Nearly half of respondents expect increases in their operating budgets,
and those serving business services sectors are the most positive.
Pharma/biotech/medical equipment staffing firms fall at the end of
the list, with 37 percent expecting an increase.
• A similar dynamic exists for tech investments, with technology and
business services staffing firms putting the most into their business, and
pharma/biotech/medical equipment at the lower end of the spectrum.
• Industrial firms have the highest expectation of branch expansion
(43 percent) and, once again, pharma/biotech/medical equipment
the lowest.

© Bullhorn 2017. All Rights Reserved. 31
Compensation Holding Steady
Staff compensation typically accounts for the
largest line item expense. Two-thirds (68 percent)
of staffing employees say they expect their total
compensation (salary and bonus) to increase from
2016 to 2017. That anticipated figure represents
a modest improvement over the 63 percent who
reported an actual increase from 2015 to 2016.
Only 6 percent expect their compensation to fall
in 2017.
The most progressive firms will consider the
anticipated “revenue rich” environment as an
optimal time to bump up investments in key areas
in order to build infrastructure and processes
necessary to outpace the competition and
prepare for when the next inevitable business
downturn occurs.
Spotlight Operating Budget
The firms with the highest expectation of an increase by:
• Revenue Size: those earning between $25-50 million in revenue
• Industry: those operating in the business services sector
• Job Specialization: those placing finance and accounting professionals
The firms with the lowest expectation of an increase by:
• Revenue Size: those earning less than $1 million in revenue
• Industry: those operating in the pharma/biotech/medical equipment sector
• Job Specialization: those placing light industrial and mechanical workers

© Bullhorn 2017. All Rights Reserved. 32
Key Performance Metrics

© Bullhorn 2017. All Rights Reserved. 33
In this section, we explore how staffing
companies measure up in terms of productivity
and performance. Why is this important? The
industry has historically tracked metrics in order
to engineer results through a mix of targets for
calls, visits, interviews, submittals, and wins. In
an increasingly commoditized environment with
low-touch client accounts, clear metrics uncover
strategies to outperform the competition.
Ramp-up Time
When new staffing hires come on board, they’re
expected to get up to speed quickly. Most
firms (37 percent) say it takes one to three
months before a new salesperson or recruiter
is productive, followed by another 24 percent
reporting a four to six month ramp-up period.
Some firms (24 percent) measure ramp-up time in
weeks rather than months.
Ramp-up TimeAverage Time to Become Productive
7%
16%
37%
24%
6%
3%
7%
Less than 2 weeks
2 weeks – 4 weeks
1 month – 3 months
4 months – 6 months
7 months – 9 months
More than 9 months
Not sure

© Bullhorn 2017. All Rights Reserved. 34
Corporate Structure:
Split-Desk vs. Full-Desk
To explore the impact of corporate structuring,
we asked about split- vs. full-desk business
models. More than 60 percent of all firms run a
split-desk model, where recruiting and sales roles
are separated, compared to 36 percent that run
a full-desk, where individuals are responsible for
both functions.
When you go from 1-25 total recruiters and
salespeople to 26-50 production staff, you see a
significant jump in the percentage of firms that
run a split-desk, from 57 percent to 74 percent.
A similar pattern exists for firms when they cross
the $1 million revenue threshold. Anecdotally,
those that have transitioned from a full-desk
to a split-desk cite a desire for specialization and
better client and candidate engagement. On the
other hand, those that have moved from a split-
to full-desk in recent years feel it streamlines
operations and drives new business.
To increase alignment between recruiters and
salespeople in a split-desk model, companies use
compensation structure, daily check-in meetings,
and accountability metrics. Interestingly, some
firms have opted to forego salespeople by relying
solely on marketing to generate leads, while
others have added interim personnel to serve
as a liaison between sales and recruiting.

© Bullhorn 2017. All Rights Reserved. 35
Recruiting Structure by Type of Business
76%Contract
22%
Split-desk Full-desk
43%Perm Placement
(Non-Executive 55%
29%Executive Search
(Contingent) 71%
24%Executive Search
(Retained) 71%
57%
1-25
Split-desk Full-desk
26-50 50-100 101-150 151-200 201-250 250+
Number of Recruiters and Salespeople
41%
74%
26%
72%
21%
75%
25%
67%
33%
60%
40%
81%
19%

© Bullhorn 2017. All Rights Reserved. 36
Recruiting Metrics
When a recruiting team fires on all cylinders,
performance metrics should show it. But many
staffing companies only use informal feedback or
a few key metrics to back up their assumptions.
To measure how well recruitment delivery
processes are working, three indicators stand out.
Those most frequently cited as the three most
important metrics are:
All the remaining metrics—including time-to-fill,
interview-to-hire and hit rate—come in lower as
measures of recruitment delivery. Additionally,
candidate satisfaction falls near the bottom of
the list—a potentially troubling result that we’ll
explore further in the section on engagement
best practices.
Key Delivery Metrics Top Rankings for Recruitment
Delivery Metrics
Three most important metrics:
Customer satisfaction
Fill rate
Submittal-to-hire ratio
63%
56%
46%
38%35%
32%
17%
CustomerSatisfaction
FillRate
Submittal-to-Hire
Interview-to-Hire
Time-to-Fill
Candidate Satisfaction
Hit Rate

© Bullhorn 2017. All Rights Reserved. 37
More About Submittal to Hire
The submittal-to-hire ratio combines elements
of both quantity and quality, so it’s particularly
useful to explore productivity. If your firm has
a high ratio, more qualification may be needed
prior to client submittal. A low ratio? That’s not
necessarily a bad thing, but it may point to a weak
pipeline.
Among North American staffing firms, the sweet
spot appears to be submitting three to four
candidates for every hire made. Forty percent
fall into that bucket, compared to 24 percent that
submit four to five candidates and the highly-
effective firms (14 percent) that only submit one
to two candidates per hire.
of firms average three to four
candidates submitted for every hire
40%
Submittal-to-Hire RatioNumber of Candidates Submitted per Hire
Contract firms were significantly more likely to
submit only one to two candidates than their
counterparts in the permanent world (18 percent
vs. 8 percent respectively). On the other end of
the spectrum, retained executive search firms
were most likely to submit six or more candidates.
40%
3-4 candidates
submitted for
every hire
6%
Not sure
24%
4-5 candidates submitted
for every hire
15%
6 or more candidates
submitted for every hire
14%
1-2 candidates
submitted for
every hire

© Bullhorn 2017. All Rights Reserved. 38
Sales Metrics
When we talk about the most important metrics
for business development, the bottom line is that
it’s, well, the bottom line. Almost two-fifths (37
percent) of respondents use gross margin as the
prime indicator of sales effectiveness, followed
by total number of placements (29 percent)
and placements per salesperson/recruiter
(15 percent).
Key Sales MetricsTop Rankings for Revenue-
Driving Results
37%
Gross Margin
29%
Total Number of Placements
15%
Placements per Salesperson/Recruiter
12%
Average Placement Fee/Average Bill Rate
6%
Total Number of Job Orders
Gross margin (37%)
and total placements
(29%) dominate the list
of sales performance
metrics

© Bullhorn 2017. All Rights Reserved. 39
Employee Perceptions:
Working Smarter or Just Harder?
Although respondents anticipate strong industry
growth, when you dive down into personal
experiences, they appear to be working harder for
the same level of achievement. We asked, “Over
the past few years, have you found your job to be
getting easier or harder?”
A large majority (64 percent) find it harder to
deliver results day-in and day-out (17 percent
much harder plus 47 percent somewhat harder).
Only 16 percent say their job has been getting
easier. A few themes illustrating the challenges
emerged from survey respondents’ comments:
Competitive pressure:
“Increased competition in the market
resulting in needing to present
candidates faster on positions
with no exclusivity or solid client
relationship.”
Client expectations:
“Client expectations of staff
augmentation have become ‘try
before you buy’ vs. ‘specific
project need.’”
Candidate engagement:
“Keeping up with rapid social
media and technology changes…
difficulty in finding and engaging top
candidates who clients feel are
also a good cultural fit.”
Always on call:
“Expected to respond 24/7; there
is no disconnect time—even while
on vacation you need to check
emails.”
Vendor Management System (VMS) and Managed
Staffing Provider (MSP) impact:
“More competition, VMS services underperform, and
more MSPs making the industry more commoditized.”

© Bullhorn 2017. All Rights Reserved. 40
StaffingIndustry Best Practices

© Bullhorn 2017. All Rights Reserved. 41
To gauge best practices with the highest
potential impact on financial performance and
operational efficiency, survey respondents
ranked a list that includes both technology-
driven and relationship-driven processes.
Standout best practices represent a cross-
functional variety of initiatives, from ATS
adoption to better candidate and client
engagement.
Expanding into existing accounts is important
to your firm.1
2
3
4
5
By far the best practice that resonates most
strongly is account penetration. More people
agreed with the statement “Expanding into
existing accounts is important to your firm” than
any other presented. To hone in on actionable
best practices, we’ll take a deeper dive into a
couple areas:
• Technology Best Practices:
Documenting and analyzing activities to
drive operational efficiency
• Engagement Best Practices:
Improving the client and candidate
experience
Most Highly Ranked Best Practice Statements
On average, your firm does a good job at
creating a great candidate experience.
The majority of recruiters cannot do their job
effectively without an ATS.
Improving management of client/candidate
relationships is a top priority for 2017.
You anticipate the percentage of revenue from
repeat client business to increase in 2017.

© Bullhorn 2017. All Rights Reserved. 42
Operational Efficiency through
Technology
While 10 percent of staffing firms still use a home-
grown system to track candidate activity, the
majority (64 percent) have transitioned to ATS
technology, either standalone or in combination
with other tools. With few exceptions, the size of
the firm doesn’t affect rates of ATS adoption.
On the sales side, 60 percent of surveyed
firms use a CRM system to manage their sales
processes (lead, opportunity, and pipeline
management). Generally speaking, the larger
the firm, the more likely they are to use a CRM
system, with a utilization rate of 88 percent for
the biggest companies (more than $500 million)
compared to 50 percent for the smallest (under
$1 million). The majority access core technology
via the cloud (82 percent for ATS and 78 percent
for CRM).
Companies that don’t use an ATS or CRM rely on
some combination of other systems, including
email (41 percent) and spreadsheets (30 percent).
Cobbling together systems to manage client
and candidate activity may work for some firms,
but ATS and CRM systems are must-haves for
firms who want to improve visibility into their
performance across the full sales and recruiting
lifecycles.
of North American
staffing firms use
an ATS to track
candidate activity
67%
use a CRM for
business development
60%

Existing candidates from your recruitmentATS and/or CRM
Most Effective Sources to Identify the Most Qualified Candidates Social media (LinkedIn, Twitter, Facebook,
Google+, Instagram)
Referrals from successful placements
Job boards (Monster, CareerBuilder, Dice)
Aggregator sites (SimplyHired, Indeed)
© Bullhorn 2017. All Rights Reserved. 43
Best Talent Sources
What do staffing companies consider to be the
best source of talent? Existing internal candidates
in your database prove to be the favored source,
followed by a wide range of other options.
Variation in responses indicates no one method
should be considered exclusively “best practice,”
although the lowest rankings point to the need for
further optimization of advertising budgets and
partner networks.
Candidate cold calling
Job advertising
Secondary sourcing/staffing partners
Existing internal
candidates are ranked as
the best source of quality
candidates, but account for
less than half of placements
for 59% of staffing companies

© Bullhorn 2017. All Rights Reserved. 44
Use It or Lose It
Developing proprietary lists of potential qualified
candidates has long been considered a best
practice for successful candidate conversion.
Ironically, staffing companies fail to capitalize on
internal databases, even as they recognize their
value as a highly effective source.
Candidates Hidden in Plain SightPercentage of Total Placements Made from Candidates in Database or ATS/CRM.
More than a third of North American firms (34
percent) make fewer than 25 percent of their
total placements from candidates already in
their ATS or CRM. Further, a quarter make
between 26 and 50 percent of placements
from existing candidates. We either have a case
of outdated and inappropriate resumes, or an
untapped goldmine of candidates—or perhaps a
combination of both.
23%
11-25%
11%
Less than 10%
25%
26-50%
1%
Don’t use an ATS/CRM
or other database
9%
Not Sure
5%
91-100%
17%
51-75%
9%
76-90%

© Bullhorn 2017. All Rights Reserved. 45
Evaluating Client and Candidate
Engagement
Staffing firms send mixed messages about
candidate and client engagement. Note the
differences in the corresponding graphic. Even
though firms think they’re delivering a great
experience and staying in contact, let’s just say
there’s always room for improvement (especially
with candidates). Some interesting observations:
• Clients fare better overall than candidates; that
makes perfect sense, since they’re the ones
paying the bills.
• Firms that actually do measure client and
candidate satisfaction rate themselves higher
in service delivery and anticipating needs than
those that don’t. The difference is particularly
prominent in ratings for anticipating candidate
needs; 42 percent that do track satisfaction say
they’re doing an excellent job, compared to
20 percent of those without formal metrics
in place.
• Salespeople (not surprisingly) and CFOs give
their firms the highest ratings on customer
service delivery, while CTOs and sourcers give
the lowest ratings.
• For candidate service delivery, CFOs and IT
managers think their firms are doing a
particularly good job, but CTOs and CMOs
come in on the lower end of the scale.
Client ServiceDelivery
CandidateService Delivery
75%
50%
25%
0%
100%
Self-Rating % who actually measure
Client Service and Candidate Service DeliveryGap between self-rating and
measurement
High Self-ratings on EngagementPercentage of Firms Rating
Themselves Excellent or Good
92%Service Delivery
80%Anticipating Needs
86%Service Delivery
77%Anticipating Needs
For Clients For Candidates
Staffing Firms’ Self-ratings

© Bullhorn 2017. All Rights Reserved. 46
Measuring Client Engagement
Only 54 percent of companies acknowledge
measuring client satisfaction on a regular basis,
primarily through regular meetings (such as
Quarterly Business Reviews) and online surveys.
That over a third (35 percent) don’t measure
client satisfaction at all seems particularly
surprising, given the lip service about the
importance of the client experience to future
success.
Companies that don’t ask for client input—or
only do so selectively—risk getting surprised
by negative feedback and lost business. As one
respondent put it, “You can’t improve what you
don’t measure.” Another highlights the value
of measuring client satisfaction, “We use this
information to make a plan and execute new
policies, and we use technology to be more
efficient and to stay on top of client priorities
on a regular basis.”

© Bullhorn 2017. All Rights Reserved. 47
Boosting the Candidate
Experience: A Competitive Edge
Less than half (48 percent) consistently record
candidate satisfaction, and those that do rely
heavily on phone interviews and social media
monitoring, which may be anecdotal rather
than quantitative in nature. Firms that do solicit
candidate feedback do so for a number of
reasons, including (in their own words):
“It allows us to know if they [candidates] feel
valued and appreciated during the process.”
“To improve recruiting processes and
communication with candidates.”
“To better prepare future candidates for
client interviews.”
Talent acquisition news source ERE Media
ranks lack of feedback and non-returned calls
among “The 4 Biggest Complaints Candidates
Have About Recruiters,”1 leading to frustration
and dissatisfaction. Increased frequency and
consistency of communication with an existing
candidate pipeline can dramatically improve
engagement, and it’s simple with an ATS
and/or CRM.
Staffing firms that actively solicit candidate
feedback—the good, the bad, and the ugly—are
better positioned to generate positive word-
of-mouth referrals and to build loyalty among
talented professionals.
“Our biggest challenge
[when it comes to creating
a positive candidate
experience] is not having
enough jobs available for
all the amazing candidates
we work with, so some get
frustrated that we’re not able
to find them a challenging
project within their
timeframe.”
– Survey respondent
1 Source: Wheatman, Debra. “The 4 Biggest Complaints Candidates Have About
Recruiters.” ERE Media. 2015.

© Bullhorn 2017. All Rights Reserved. 48
Key Takeaways: Opportunities to Excel

© Bullhorn 2017. All Rights Reserved. 49
By all indications, 2017 looks to be a banner
year for the staffing industry. The vast majority
eagerly anticipate more client demand and
more placements, despite talent shortages and
economic uncertainty.
While the industry is strong and the outlook is
good, now’s not the time to settle into the status
quo if sustainable profitability is a top priority. It’s
a time to think creatively, set aggressive goals,
and face your challenges head on.
We’ve compiled seven key trends that peers
in your industry will be addressing in 2017 and
beyond. These observations and opportunities are
intended to generate tactical strategies to sustain
your firm’s productivity and profitability.

© Bullhorn 2017. All Rights Reserved. 50
Find Balance between
Existing and New Clients
Money talks: profitability and revenues top the list
of staffing priorities for 2017. To make progress,
most staffing firms are putting their energy into
retaining and expanding existing client accounts;
close to 80 percent of firms expect to generate a
majority of revenue from current clients.
Leveraging existing relationships opens
avenues into different functional areas of
your clients without the expense of new
business development.
Consider how your success in one area can
demonstrate competency in another. Effective
use of a CRM and lead nurturing go a long way in
networking.
While the majority of firms recognize the
importance of engaging existing clients, many
do so at the expense of developing new client
relationships. Case in point, new client revenue
will account for less than a quarter of total
revenues for 57 percent of North American
staffing firms. Don’t become complacent with
business development. In a year when the
projected performance outlook is so strong,
this may be the time to invest in expanding
your footprint.
1

© Bullhorn 2017. All Rights Reserved. 51
Talent Shortages
Loom Large
Without a doubt, talent shortages represent the
biggest perceived challenge to staffing firms; 38
percent list it as their single biggest challenge.
That’s a double-edged sword; the same difficulty
in sourcing quality talent is what’s driving clients
to greater staffing utilization.
North American staffing leaders tend to focus
more on domestic concerns and less on global
issues such labor market restrictions and
international trade negotiations.
Even if those don’t impact your business on a
daily basis, global market shifts can (and will)
affect your clients’ hiring plans as well as the
market supply of talent.
Global commerce will continue and forward-
looking businesses who seek to expand their
relationships with talent, whether directly or
through suppliers, will benefit in the long term.
2

© Bullhorn 2017. All Rights Reserved. 52
Politics and
Profitability
North American staffing leaders are divided on
the impact of the Trump administration. About
half express increased confidence about the
future of their business following the election,
while nearly another half list his administration
as a major area of business concern.
Political conflicts exacerbate the volatility
surrounding healthcare regulations, which have a
direct impact on staffing firms’ bottom line. The
potential repeal and/or replacement of the ACA
represents a clear source of anxiety for many
staffing firms that ranked healthcare policies at
the top of their list of economic concerns.
3
© Bullhorn 2017. All Rights Reserved. 53
VMS is Not a
Priority
Staffing firms don’t expect to move into VMS at a
rapid rate, perhaps indicating those that want to
play in that space have already made a bid to do
so. A third of companies with under $5 million in
revenues don’t get jobs from VMS at all.
For those already operating in the VMS
environment, automated processes are critical
to squeezing out operational efficiencies and
profits.
Although not investing heavily in VMS, staffing
firms are on board with the value provided by
ATS and CRM systems. While firms are rapidly
adopting ATS and/or CRM systems, keep in
mind that technology improvements don’t
always require investment in complex and costly
approaches. Often, simple and straightforward
options get overlooked in the pursuit of the
next big thing. Excellence in execution can be
a tremendous lever in creating positive impact
to operating profits. We encourage you to look
at all the tools available at your disposal and to
maximize how they’re incorporated into your
strategic plan.
4

© Bullhorn 2017. All Rights Reserved. 54
Internal Candidates
are Underutilized.
WAY Underutilized.
Most firms spend countless hours and hundreds
of thousands of dollars collecting candidate
resumes into their database, only to have them sit
there unused.
Your internal database represents a huge
opportunity, as well as a sunk cost, when it
comes to filling orders.
Once you’ve got them in your system, look to
your candidate pipeline as your primary resource
for filling orders.
Social media comes in as the second source of
best candidates, so make sure you’re keeping
up your connections and engagement. If you’re
focusing your online presence only on prospective
clients, you’re missing an opportunity to attract
passive candidates. Rankings of other candidate
acquisition sources also call into question the
value of job advertising (outside of job boards)
and third-party partners.
5

© Bullhorn 2017. All Rights Reserved. 55
Performance
Measurement Matters
Increased competition, candidate shortages
and pricing pressures play havoc on your
results, but you need to know how your team is
rising to the challenge. Sales and recruiting say
they’re working harder, but can you tell? Over a
third of firms don’t measure client satisfaction
at all, and less than half measure candidate
satisfaction. Since onboarding time is usually
measured in months, you need to make sure your
hiring investments pay off—both literally and
figuratively—with satisfied stakeholders.
The use of an ATS is particularly valuable in
measuring the performance of recruiters.
By providing visibility into your pipeline of
candidates; performance metrics (hit rate, fill rate,
margin and revenue); candidate engagement,
retention, and other key indicators; leadership
receives more accurate information on the state
of the recruiting team.
6

© Bullhorn 2017. All Rights Reserved. 56
Don’t Overlook the
Candidate Experience
Staffing firms do a much better job keeping their
clients happy than their candidates. Maybe it’s the
nature of the beast—there are simply not enough
jobs for every candidate—but improvements here
can boost your reputation and your apply rates.
Since talent shortages ranks as the number one
industry challenge staffing firms face, you owe it
to yourself to explore how your firm stacks up on
engaging candidates.
Remember, communication goes a long way.
Candidates want to know where they stand in
the process, where their next job is coming from,
and that you’re there for them. Don’t lose sight of
the fact that they’ve come to you to find a job—
they’ve placed their livelihoods in your hands.
7

© Bullhorn 2017. All Rights Reserved. 57
About Bullhorn
Bullhorn is the global leader in CRM and
operations software for the staffing industry.
More than 7,000 staffing companies rely on
Bullhorn’s cloud-based platform to drive sales,
build relationships, and power their recruitment
processes from end to end. Headquartered in
Boston, with offices around the world, Bullhorn
employs more than 600 people globally.
The company is founder-led and backed by
Vista Equity Partners. To learn more, visit
www.bullhorn.com or follow @Bullhorn
on Twitter.
Twitter.com/Bullhorn Linkedin.com/company/Bullhorn Facebook.com/BullhornBullhorn.com

© Bullhorn 2017. All Rights Reserved. 58
Appendix: Survey Demographics
Bullhorn’s 2017 North American Staffing &
Recruiting Trends Report: Above and Beyond
Business as Usual utilizes data from an online
survey of staffing firm employees. A total of
1,440 responses were received globally, and this
report is based on 806 responses from individuals
working for companies with U.S. or Canadian
headquarters. The survey was fielded from
December 16, 2016 to January 25, 2017.
Most of our respondents skew towards the
contract and consulting marketplace (57
percent), followed by permanent placement (27
percent), executive search (12 percent) and less
than one percent each for Recruitment Process
Outsourcing, Professional Employer Organizations
and other formats.
The majority of North American companies run
a split-desk model rather than a full-desk model
(62 percent to 36 percent respectively). Most
employ fewer than 25 recruiters and salespeople
(74 percent). About a quarter (23 percent) of
participating firms generate more than $25 million
in revenue.
Participants reflect a wide variety of placement
disciplines and industries served, from packaging
to pharma and everything in between.
Top 5 Types of Positions Placed
• Technology (45%)
• Professional (24%)
• Finance/accounting (22%)
• Engineering/design (18%)
• Office/clerical/admin (18%)
Top 5 Industries Served
• Technology (37%)
• Healthcare (28%)
• Finance/insurance (27%)
• Manufacturing (21%)
• Business Services (20%)
Please note, some of the figures mentioned in
the report may not add up to 100 percent due
to rounding or question design, e.g. the ability
to provide multiple answers. Some participant
quotes were edited for clarity and length.