2017 european semester: assessment of progress on ... · pdf filegdp per capita in pps in 2015...
TRANSCRIPT
EN EN
EUROPEAN COMMISSION
Brussels, 22.2.2017
SWD(2017) 88 final
COMMISSION STAFF WORKING DOCUMENT
Country Report Romania 2017
Accompanying the document
COMMUNICATION FROM THE COMMISSION TO THE EUROPEAN
PARLIAMENT, THE COUNCIL, THE EUROPEAN CENTRAL BANK AND THE
EUROGROUP
2017 European Semester: Assessment of progress on structural reforms, prevention and
correction of macroeconomic imbalances, and results of in-depth reviews
under Regulation (EU) No 1176/2011
{COM(2017) 90 final}
{SWD(2017) 67 final to SWD(2017) 93 final}

Executive summary 1
1. Economic situation and outlook 3
2. Progress with country-specific recommendations 10
3. Reform priorities 14
3.1. Public finances and taxation 14
3.2. Financial sector 17
3.3. Labour market, education and social policies 20
3.4. Investment 27
3.5. Sectoral policies 34
3.6. Public administration 37
A. Overview Table 39
B. MIP scoreboard indicators 51
C. Standard Tables 52
References 57
LIST OF TABLES
1.1. Key macroeconomic, financial and social indicators 9
2.1. Summary table on 2016 CSR assessment 12
B.1. The MIP scoreboard for Romania 51
C.1. Financial market indicators 52
C.2. Labour market and social indicators 53
C.3. Labour market and social indicators (continued) 54
C.4. Product market performance and policy indicators 55
C.5. Green growth 56
LIST OF GRAPHS
1.1. GDP and components and output gap 3
1.2. Gross value added distribution (current prices) 4
1.3. Gross fixed capital formation (2005-2018) 4
1.4. Consumption of fixed capital by sector and gross value added (2006-2015) 4
CONTENTS

1.5. Net international investment position 5
1.6. Harmonised index of consumer prices inflation in constant taxes 6
1.7. Population, natural increase and net migration 6
1.8. Nominal compensation per employee 7
1.9. GDP per capita in PPS in 2015 vs income quintile ratio (S80/S20) for the EU-countries. 7
1.10. Fiscal balance and output gap 8
1.11. Loans to households and non-financial corporations 8
3.1.1. Income inequality (2015) 14
3.1.2. VAT gap 15
3.1.3. Public debt sustainability 16
3.1.4. Annual rate of change in gross debt ratio, baseline scenario 16
3.2.1. Return on equity 17
3.2.2. Non-performing loans 17
3.3.1. Employment by sector 20
3.3.2. Activation potential* 21
3.3.3. AROPE for selected groups 22
3.3.4. Proportion of low achievers among 15-year-olds in PISA 2015 24
3.4.1. Geographical specialisation in the 10 largest export destinations in 2015 27
3.4.2. Breakdown of export performance 28
3.4.3. Labour cost index 28
3.4.4. Minimum and public wage growth vs inflation and productivity developments (2009-2016) 28
3.4.5. Global Competitiveness Index 29
3.4.6. Public investment spending and quality of infrastructure 29
3.4.7. Financial execution of Structural and Cohesion funds 2007-2013 30
3.4.8. Global Competitiveness Indicator 31
3.5.1. Innovation performance of EU Member States in 2015 34
3.5.2. Evolution of business R&D intensity and public R&D intensity in Romania, 2000-2015 34
3.5.3. Quality of scientific output and public R&D investment levels 35
3.5.4. Digital intensity score for enterprises 35
3.6.1. Executive capacity, 2016 (1) 37
LIST OF BOXES
2.1. Contribution of the EU budget to structural change in Romania 13
3.4.1. Investment challenges and reforms in Romania 33

1
This report assesses Romania's economy in the
light of the European Commission's Annual
Growth Survey published on 16 November 2016.
In the survey the Commission calls on EU Member
States to double their efforts on the three elements
of the virtuous triangle of economic policy –
boosting investment, pursuing structural reforms
and ensuring responsible fiscal policies. In doing
so, Member States should focus on enhancing
social fairness to deliver more inclusive growth.
The Romanian economy has been on a cyclical
upswing for the past two years. Growth hit a
post-crisis peak in 2016 (at 4.9 %), fuelled by
strong domestic demand on the back of pro-
cyclical fiscal policies. Growth is set to remain
robust over the forecast horizon at 4.4 % in 2017
and 3.7 % in 2018. The current account deficit
deteriorated in 2016 and is expected to widen
further driven by import growth due to strong
domestic demand. Private consumption continued
expanding, boosted by wage hikes and indirect tax
cuts. While private investment was supported by
low interest rates and stable investor confidence,
public investment declined in 2016 due to a low
implementation of EU funds.
The labour market strengthened further driven
by robust economic growth. The tightening of the
labour market has been associated with robust
wage growth. Unemployment is approaching its
pre-crisis low and is forecast to decline further in
2017-2018. Employment decreased slightly in
2016 and is expected to grow at a moderate pace.
Reversing past consolidation, fiscal policy
turned pro-cyclical in 2016 and the deficit is
widening. Driven by significant tax cuts and
expenditure hikes, the general government deficit
increased to 2.8 % of GDP in 2016 and is
projected to increase further to 3.6 % in 2017 and
3.9 % in 2018. The structural deficit is projected to
widen from below 1 % in 2015 to around 4 % in
2017, above its medium-term objective. The public
debt ratio is expected to deteriorate but to remain
below 60 % of GDP.
Financial stability has improved but some
challenges remain in the sector. The overall
health of the banking sector continued to improve
in 2016 with comfortable levels of capital and
rising profitability. Non-performing loans have
come down markedly and credit is beginning to
pick up again. However, the high level of non-
performing loans is a challenge and recurrent
legislative initiatives could undermine stability,
legal predictability, and investor sentiment.
Structural challenges may dampen the medium-
term outlook. For the first time since 2008, actual
output was above potential and is expected to
remain so in 2017-2018. Expansionary fiscal
policy is boosting domestic demand. Although
Romania made progress, particularly in
governance, employment policies and poverty
reduction, these reforms are not yet anchored in a
sustainable manner. While some of these structural
reforms are at risk of being reversed, others have
stalled and the irreversibility of progress in the
fight against corruption was recently put at risk. In
the absence of an impetus in Romania's structural
reform agenda, non-price competitiveness and
potential growth will be constrained.
Romania has made some progress in addressing
the 2016 country-specific recommendations. No
progress was made in ensuring that the national
fiscal framework is implemented and there was
limited progress in strengthening tax compliance
and collection. There was some progress in
ensuring that legislative initiatives do not
undermine legal certainty and do not put at risk
financial stability. Substantial progress was made
in strengthening the National Employment
Agency's services and limited progress was made
in minimum wage setting. Some progress was
made in tackling early school leaving and
increasing the provision of quality education,
including for Roma, whilst this still needs to bear
fruits on the ground. No progress was made on
equalising the pensionable age for men and
women. Some progress was made in curbing
informal payments in the healthcare system and
there was limited progress in increasing the
availability of outpatient care. There was some
progress in simplifying administrative procedures
for businesses and the public and limited progress
in strengthening the independence and
transparency of human resources management in
the public administration. There was substantial
progress in strengthening the corporate governance
of state-owned enterprises. Some progress was
made in improving access to integrated services in
rural areas and fostering economic diversification,
and some progress was made with the transport
master plan, which was adopted in
EXECUTIVE SUMMARY

Executive summary
2
September 2016. Finally, limited progress was
made in prioritising public investment.
Regarding progress in reaching the national targets
under the national Europe 2020 strategy, Romania
is performing well in the areas of national
greenhouse gas emission, renewable energy,
energy efficiency, tertiary education and reducing
the number of people at risk of poverty or social
exclusion. However, employment rates, research
and development intensity, and early school
leaving remain some distance away from their
respective targets.
The main findings of the analysis in this report,
and the related policy challenges, are as follows:
Comprehensive reforms were started in 2016,
but unused labour potential is limiting growth.
The public employment service was reinforced and
active labour market policies are now substantially
better targeted to inactive groups. However,
employment and activity rates for women, the low-
skilled, young people, people with disabilities and
Roma remain below the EU average. Low
unemployment is thus matched by one of the
highest inactivity rates in the EU. The provision of
active labour market policies and their link to
social services is not yet sufficient to reverse this
trend. Despite reinforced joint controls, undeclared
work remains prevalent, also reducing both labour
supply and fiscal revenue. Full equalisation of the
retirement age for women and men remains to be
adopted. Work on a minimum wage setting
mechanism is underway, but minimum wages were
already raised in February 2017.
Poverty is declining, but high income inequality
persists. Romania has one of the highest levels of
income inequality in the EU and rising, partially
driven by decreasing redistributive effects of the
tax and transfer system. Although poverty rates are
declining, poverty and social exclusion persist for
young people, families with children, people with
disabilities, Roma, the rural population and
inactive people. A change towards more integrated
services targeted to disadvantaged groups is
planned, as the provision of these services is low.
Measures to improve healthcare are in place,
but the system suffers from inefficiencies,
limited accessibility and corruption. New
initiatives to improve cost effectiveness and
integrity of healthcare were launched in 2016. In
the absence of a national strategy on the workforce
in healthcare, however, access to healthcare
remains limited due to shortages of health
professionals, affecting mainly rural areas.
Persistently low funding and over-reliance on
hospital-based healthcare limit access to universal
quality care and impair the efficiency of the health
system. Recent policy action notwithstanding,
corruption remains prevalent, impacting on the
quality of public health services.
The unequal provision of quality education
weakens human capital potential.
Underachievement in basic skills and the provision
of quality education to disadvantaged groups, in
particular students in rural areas and Roma,
remains problematic. Persistently high early school
leaving and low tertiary attainment do not meet the
increasing need for a skilled labour supply against
the background of persistent emigration. Measures
to prevent drop-out are being implemented, but the
availability of second chance programmes is not
yet sufficient to reduce early school leaving.
Public investment spending is high, but low
infrastructure efficiency is constraining growth.
Public investment spending has been among the
highest in the EU in the last decade but the
perceived quality of infrastructure ranks among the
lowest in the EU. Inefficient public investment and
public procurement, high administrative burdens
and low provision of e-government services are
major obstacles to boosting growth and
productivity.
Public administration reform accelerated in
2016, but is not yet complete. The Government
adopted a renewed national anti-corruption
strategy for effectively tackling corruption
prevention in public administration. Measures to
strengthen transparency and take proper account of
consultations with the relevant authorities and
stakeholders in decision-making and legislative
activities were put in place. Civil service and staff
training strategies were adopted, but the draft
legislation does not yet fully incorporate their
principles and objectives. Regulatory impact
assessment instruments, strategic planning of
policy, legislative and investment initiatives, and
court decisions have not been systematically
implemented. Delays and potential reversals of
recent reforms are holding back investment.

3
GDP and potential growth
Growth edged up in 2016 driven by domestic
demand boosted by expansionary fiscal policies.
Following 3.9 % in 2015, real GDP growth is
estimated to have reached 4.9 % in 2016, a new
post-crisis peak. Growth was driven mainly by
private consumption supported by wage increases,
indirect tax cuts, and low interest rates.
The robust rates of economic growth are
forecast to moderate towards potential growth.
A strong fiscal impulse in the short run, alongside
relatively favourable financing conditions, is
expected to continue to support domestic demand.
Economic growth is projected to moderate and
return to potential as consumer prices pick up and
as the additional fiscal stimulus in 2017 is of
smaller magnitude than in 2016. Accordingly, real
GDP is forecast (European Commission winter
2017 forecast) to expand by 4.4 % in 2017 and by
3.7 % in 2018.
Graph 1.1: GDP and components and output gap
Source: European Commission
The boost from the fiscal stimulus is likely to be
short-lived in the absence of reforms to enhance
potential growth. The fiscal impulse and strong
domestic consumption lifted cyclical growth in
2016, closing the output gap. However, in the
longer run, structural growth will remain
constrained in the absence of sufficient progress on
implementing structural reforms, including
structural fiscal reforms (see Section 3).
Household consumption will remain a main
driver of growth. Private consumption rose to a
nine-year high, contributing estimated 5.6
percentage points (pps.) to growth in 2016. Stable
employment growth, wage increases in 2017 and
moderate inflation are expected to support real
disposable incomes. Consequently, consumption is
set to continue growing steadily in 2017 and
somewhat slower in 2018 with the rise in
consumer prices (Graph 1.1).
On the supply side, services are increasingly
contributing to growth. The value added of
services in the business sector has been
continuously increasing since the crisis (Graph
1.2). Among services, ICT and scientific and
administrative support activities are expanding the
fastest. The ICT sector's share of GDP is one of the
highest in the EU (5.6 % compared to an EU
average of 4.2 %) (1). At the same time, the
contribution to growth of agriculture, construction,
and most recently industry has been shrinking. The
higher weight of services in the gross value added
of the total economy is mirrored by the dynamic
job creation in this sector (see Section 3.3).
(1) PREDICT project. See
http://is.jrc.ec.europa.eu/pages/ISG/PREDICT.html
-25
-20
-15
-10
-5
0
5
10
15
20
08 10 12 14 16 18
HH cons. Gov. consGFCF Net exportsOther GDPOutput gap
forecast
1. ECONOMIC SITUATION AND OUTLOOK
1. Economic situation and outlook
4
Graph 1.2: Gross value added distribution (current prices)
Source: European Commission
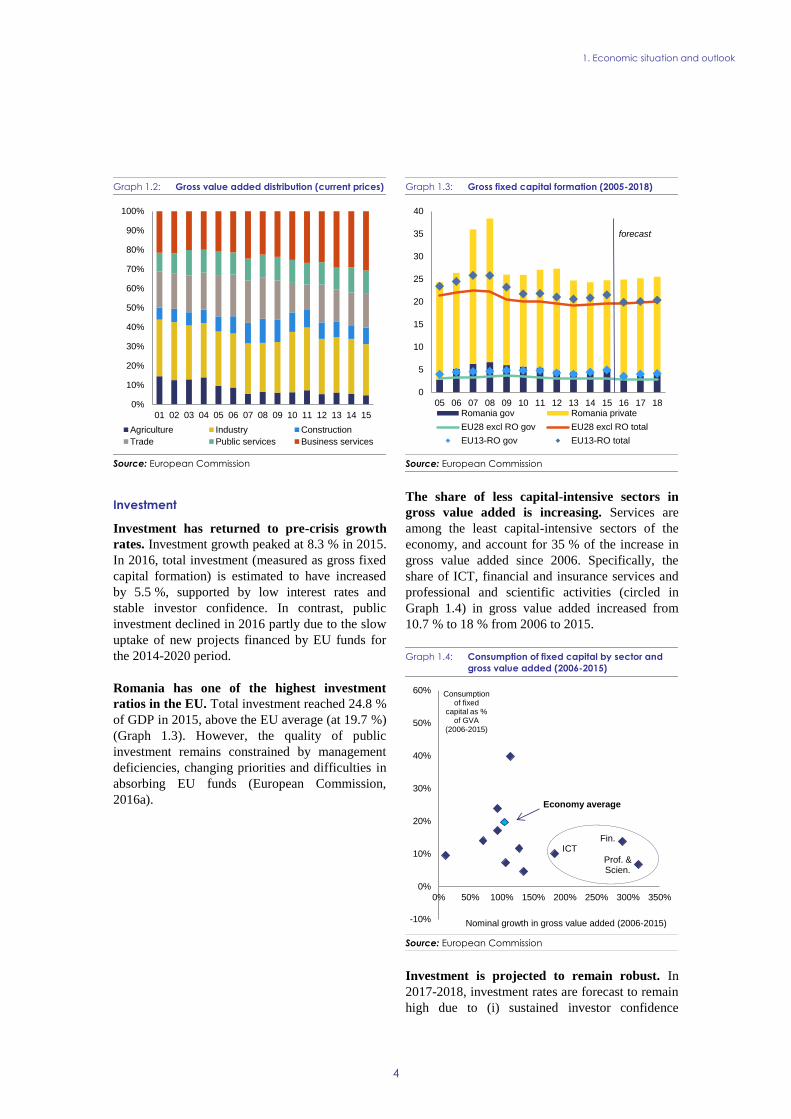
Investment
Investment has returned to pre-crisis growth
rates. Investment growth peaked at 8.3 % in 2015.
In 2016, total investment (measured as gross fixed
capital formation) is estimated to have increased
by 5.5 %, supported by low interest rates and
stable investor confidence. In contrast, public
investment declined in 2016 partly due to the slow
uptake of new projects financed by EU funds for
the 2014-2020 period.
Romania has one of the highest investment
ratios in the EU. Total investment reached 24.8 %
of GDP in 2015, above the EU average (at 19.7 %)
(Graph 1.3). However, the quality of public
investment remains constrained by management
deficiencies, changing priorities and difficulties in
absorbing EU funds (European Commission,
2016a).
Graph 1.3: Gross fixed capital formation (2005-2018)
Source: European Commission
The share of less capital-intensive sectors in
gross value added is increasing. Services are
among the least capital-intensive sectors of the
economy, and account for 35 % of the increase in
gross value added since 2006. Specifically, the
share of ICT, financial and insurance services and
professional and scientific activities (circled in
Graph 1.4) in gross value added increased from
10.7 % to 18 % from 2006 to 2015.
Graph 1.4: Consumption of fixed capital by sector and
gross value added (2006-2015)
Source: European Commission
Investment is projected to remain robust. In
2017-2018, investment rates are forecast to remain
high due to (i) sustained investor confidence
0%
10%
20%
30%
40%
50%
60%
70%
80%
90%
100%
01 02 03 04 05 06 07 08 09 10 11 12 13 14 15
Agriculture Industry Construction
Trade Public services Business services
0
5
10
15
20
25
30
35
40
05 06 07 08 09 10 11 12 13 14 15 16 17 18Romania gov Romania private
EU28 excl RO gov EU28 excl RO total
EU13-RO gov EU13-RO total
forecast
ICTFin.
Prof. & Scien.
-10%
0%
10%
20%
30%
40%
50%
60%
0% 50% 100% 150% 200% 250% 300% 350%
Consumptionof fixed
capital as % of GVA
(2006-2015)
Nominal growth in gross value added (2006-2015)
Economy average

1. Economic situation and outlook
5
supported by tax incentives (the abolition of the
special construction tax from January) and positive
economic growth prospects, and (ii) the gradual
implementation of projects financed from EU
funds in the 2014-2020 financing period. Some
uncertainties remain, related mostly to the
predictability of the legal and business
environment (see Box 3.4.1).
External position
As domestic demand grows, the current account
deficit is set to widen through import growth.
The current account deficit significantly
deteriorated in 2016 (2.2 % of GDP), as domestic
demand surged. The deficit is expected to widen
further on the back of import growth due to strong
domestic demand and is forecast to reach 3.1 % of
GDP in 2018. Additionally, export growth is
expected to slow down in line with slow growth in
main trading partners and a potential erosion of
cost competitiveness.
The sustainability of Romania's external
position improved in 2015. The net international
investment position (NIIP) markedly improved in
2015, reaching -51.9 % of GDP, a 5.4 percentage
point decrease on 2014. This decrease reflects a
shrinking current account deficit and strong GDP
growth. The share of foreign direct investment
remained broadly stable while other foreign
liabilities declined as Romania is repaying external
debt, a trend which is expected to continue (Graph
1.5).
Graph 1.5: Net international investment position
Source: European Commission
Inflation
Inflation fell to a record low in 2016, markedly
influenced by fiscal measures. Average
harmonised index of consumer prices inflation
moved into negative territory with the cut in the
VAT rate for food products in June 2015, followed
in January 2016 by a 4 pps. reduction in the
standard VAT rate. Combined with persistently
low international oil prices, inflation plunged even
deeper to an all-time low of -3.0 % in May 2016
before it started a mild recovery. A further cut in
the standard VAT rate by 1 pp. was implemented
from January 2017. The impact of these successive
VAT reductions on headline inflation has so far
outweighed the upward pressures on prices
stemming from the surge in domestic demand and
higher wages.
Risks to the inflation outlook are tilted to the
upside (Graph 1.6). As the effect of the
implemented tax cuts fades out, inflation is set to
pick up swiftly in 2017. Additional factors exerting
upside pressures on prices in 2017-2018 include
further wage increases, accelerating credit growth,
fiscal loosening, and the positive output gap.
-100
-80
-60
-40
-20
0
20
99' 00' 01' 02' 03' 04' 05' 06' 07' 08' 09' 10' 11' 12' 13 14 15 16*
% of GDP
Net portfolio invest., equity and investment fund shares/units
Net portfolio invest., debt securities
Other invest. (net)
Net direct invest.
Net financial derivatives
Net int'l investment position
Marketable debt (portfolio debt instr., other invest. and res. assets, net)

1. Economic situation and outlook
6
Graph 1.6: Harmonised index of consumer prices inflation
in constant taxes
(1) HICP in constant taxes assumes a full pass-through of VAT
changes
Source: European Commission
Labour market
Labour market conditions are improving. The
labour market continued to improve in 2015 and
2016 on the back of strong GDP growth.
Unemployment dropped from 6.8 % in 2015 to
6.0 % in 2016 and is approaching pre-crisis lows.
Total employment decreased slightly in 2016 by
estimated 0.6 % and is set to grow at a modest
pace in 2017-2018 (see Section 3.3). Jobs were lost
in agriculture and industry, but gained in services,
reflecting the changing structure of the economy.
Jobs were created in construction as economic
growth has been picking up.
The labour force continues to shrink. Since
2007 the population has shrunk by 6 %, the third
highest decrease in the EU. The population is
ageing and by 2020 the working-age population
(20-64) is expected to have declined further by
around 4 %, while the number of elderly people is
likely to have increased by 13 % by 2060 (Graph
1.7). With the projected continued emigration of
predominantly young people, coupled with limited
return migration, the country risks losing further
labour resources. This, in turn, may slow down
productivity growth and income convergence and
have a downward impact on potential growth.
Graph 1.7: Population, natural increase and net migration
Source: European Commission based on national data
At the same time, some potential labour supply
remains largely untapped. Inactivity remains one
of the highest in the EU and the share of young
people neither in education, employment or
training has increased. Other groups, such as
Roma, women and the rural population continue to
face challenges on the labour market (see Section
3.3.1).
Recently, labour compensation accelerated
reflecting a tightening labour market. Since
2012, nominal compensation per employee growth
has been in line with developments in inflation,
productivity and unemployment developments.
However, in 2016, compensation per employee
growth picked up, reflecting a tightening labour
market and ahead of the rate suggested by
fundamentals (Graph 1.8).
-4
-2
0
2
4
6
8
10
12
Feb 11 Feb 12 Feb 13 Feb 14 Feb 15 Feb 16 Feb 17
% National Bank of Romania inflationtargets (Dec/Dec, CPI)
HICP
HICP in constant taxes
19.2
19.4
19.6
19.8
20
20.2
20.4
20.6
20.8
21
-600
-500
-400
-300
-200
-100
0
07 08 09 10 11 12 13 14 15
mln*1000
Net migration(lhs)
Natural increase(lhs)
Population(rhs)

1. Economic situation and outlook
7
Graph 1.8: Nominal compensation per employee
For methodology see Arpaia et al (2015)
Source: European Commission
Social developments
Poverty levels remain among the highest in the
EU. The poverty situation has improved and
severe material deprivation dropped significantly
during the last years. However, Roma and children
remain particularly affected by poverty or social
exclusion. The risk is also high for inactive people.
Education and health outcomes remain
unsatisfactory, especially for the most affected by
poverty and social exclusion. Poor education and
health outcomes in turn hinder employability.
Income inequality has been increasing and is
one of the highest in the EU. Disposable income
inequality has been gradually increasing since
2012, with a particularly strong push in 2015. The
richest 20 % of the population have an income
more than eight times higher than the income of
the poorest 20 %, a ratio significantly higher than
the EU average. The fact that lower income
Member States appear to show higher income
inequalities (Graph 1.9) only partially explains the
figures for Romania. There is also a large
difference between regions and a deep urban-rural
divide (2). Market income inequality (i.e. income
inequality before taxes and transfers, including
pensions) has been stable. Thus, the rise in
disposable income inequality has been partially
(2) In Romania, the average income in rural areas is only 67 %
of that in urban areas, against an EU average of 80 %. This
is the second lowest in the EU.
driven by decreasing redistributive effects of the
tax and transfer system (see also Section 3.1.1).
Graph 1.9: GDP per capita in PPS in 2015 vs income
quintile ratio (S80/S20) for the EU-countries.
Source: European Commission
Public finances
Fiscal policy turned pro-cyclical in 2016 and the
general government deficit is expected to widen.
The authorities have enacted a series of tax cuts,
including to VAT rates, excise duties and an
abolition of the special construction tax. On the
expenditure side, public wages have been
significantly increased over 2016-2017. The new
government also enacted a significant additional
increase of old-age pensions which will enter into
force in July 2017. As a consequence, the
structural deficit widened from under 1 % in 2015
to around 2½ % of GDP in 2016 and is forecast to
reach around 4 % in 2017 (Graph 1.10). The
general government deficit is estimated to have
increased from 0.8 % of GDP in 2015 to 2.8 % of
GDP in 2016 and is expected to widen further to
3.6 % in 2017.
The public debt ratio is expected to increase
moderately. Because of the widening of the public
deficit, the general government debt is projected to
increase from 38 % of GDP in 2015 to 42.3 % of
GDP in 2018. Sovereign financing conditions have
been favourable but have recently deteriorated. In
the event of an adverse shock to the exchange rate,
the 60 % of GDP threshold would be breached by
2026 (see Section 3.1.3).
-10
-5
0
5
10
15
20
25
30
35
04 05 06 07 08 09 10 11 12 13 14 15 16
Prediction based on inflation,productivity andunemploymentActual nominal wage growth
BE
BG
CZ
DK
DE
EE
EL
ES
FR
HR
IT
CY
LV
LT
HU MT
NL
AT
PL
PT
RO
SLSKFI
SE
UK
R² = 0.36
3.0
4.0
5.0
6.0
7.0
8.0
9.0
40 60 80 100 120 140
Income quintile share ratio S80/S20
GDP per capita in PPS

1. Economic situation and outlook
8
Graph 1.10: Fiscal balance and output gap
Source: European Commission
Financial sector
Banks' balance sheets improved further but the
sector continues to face challenges. Banks capital
positions and profitability continued to improve.
The stock of non-performing loans remains
elevated but has continued to decline markedly.
However, recurrent legislative initiatives with
retroactive application undermine legal
predictability and investor sentiment (Section 3.2).
The accommodative monetary policy stance
provided stimulus to the economy. In addition to
improvements in banks' balance sheets, easy
monetary conditions and pro-cyclical policies
contributed to a pick-up of credit to the economy
in recent years. The central bank reduced the key
policy rate gradually from 6 % in December 2011
to the current 1.75 % which was reached in May
2015. Liquidity conditions improved as the
minimum reserve requirements ratios were cut.
Given improved monetary transmission, interest
rates declined in line with changes in the monetary
policy rate.
Domestic currency lending is increasing. The
share of loans to the private sector in domestic
currency continued to increase and reached 57.2 %
of the total loan stock in December 2016, more
than offsetting the decrease in foreign currency
lending.
Banks continue to focus on household lending.
Domestic credit to households in lei increased
rapidly in 2016 (by 25 % in December for the year
in nominal terms), supported by falling interest
rates. Over half of the loans to households are for
house purchases and are increasingly denominated
in domestic currency (+54 % year-on-year in
December 2016). However, overall household
balance sheets improved. At 17.5 % of GDP,
household debt remains one of the lowest among
EU countries. After falling in the last 6 years, both
in nominal and real terms, housing prices picked
up in 2015-2016.
Graph 1.11: Loans to households and non-financial
corporations
Source: National Bank of Romania
Credit growth to non-financial corporations
remained negative. Corporate lending continued
to lose ground (-3.1 % year-on-year in December
2016). The increase in the stock of local currency-
denominated loans (+4 %) did not compensate for
the decline in foreign currency-denominated loans
(-11.0 %). Credit demand remained subdued due to
balance sheet adjustments of resident corporates
with a preference for reinvested profits.
2009
2010
2011
2012
2013
2014
2015
2016
2017
-5
-4
-3
-2
-1
0
1
2
3
4
5
-5 -3 -1 1 3 5
change in c
yclic
ally
adju
ste
d b
ala
nce
output gap
pro-cyclical tigthening
counter-cyclical tigthening
counter-cyclical loosening
pro-cyclical loosening
-25
-20
-15
-10
-5
0
5
10
15
20
25
Feb 11 Feb 12 Feb 13 Feb 14 Feb 15 Feb 16 Feb 17
y-o-y % ch
Loans to households (HH), total
Loans to households for housing
Loans to HH for consumption and other purposes
Loans to non-financial corporations

1. Economic situation and outlook
9
Table 1.1: Key macroeconomic, financial and social indicators
(1) Sum of portfolio debt instruments, other investment and reserve assets
(2,3) Domestic banking groups and stand-alone banks
(4) Domestic banking groups and stand alone banks, foreign (EU and non-EU) controlled subsidiaries and foreign (EU and
non-EU) controlled branches.
Source: European Commission, ECB
2004-2008 2009 2010 2011 2012 2013 2014 2015 2016 2017 2018
Real GDP (y-o-y) 7.2 -7.1 -0.8 1.1 0.6 3.5 3.1 3.9 4.9 4.4 3.7
Private consumption (y-o-y) 15.4 -10.1 1.0 0.8 1.2 0.7 4.7 6.0 9.0 6.7 4.2
Public consumption (y-o-y) -0.5 3.7 -4.9 0.6 0.4 -4.6 0.8 0.1 4.5 3.5 3.0
Gross fixed capital formation (y-o-y) 22.8 -36.6 -2.4 2.9 0.1 -5.4 3.2 8.3 5.5 6.2 6.3
Exports of goods and services (y-o-y) 7.4 -5.3 15.2 11.9 1.0 19.7 8.0 5.4 4.7 5.0 5.4
Imports of goods and services (y-o-y) 17.9 -20.7 12.6 10.2 -1.8 8.8 8.7 9.2 10.9 9.2 7.3
Output gap 5.7 -1.9 -3.9 -3.9 -4.9 -3.2 -2.2 -1.2 0.0 0.6 0.4
Potential growth (y-o-y) 6.0 1.8 1.3 1.0 1.8 1.7 2.1 2.9 3.6 3.8 3.9
Contribution to GDP growth:
Domestic demand (y-o-y) 14.0 -19.9 -0.9 1.4 0.9 -1.7 3.8 5.7 7.5 6.3 4.7
Inventories (y-o-y) -1.6 5.9 0.2 -0.2 -1.4 1.6 -0.3 -0.2 0.0 0.0 0.0
Net exports (y-o-y) -5.3 6.9 -0.1 -0.1 1.1 3.6 -0.3 -1.6 -2.6 -1.9 -1.0
Contribution to potential GDP growth:
Total Labour (hours) (y-o-y) -0.5 -0.8 -1.0 -1.1 -1.3 -1.3 -1.0 -0.6 -0.1 0.0 0.0
Capital accumulation (y-o-y) 2.9 1.6 1.5 1.4 1.4 1.0 1.0 1.1 1.2 1.3 1.4
Total factor productivity (y-o-y) 3.6 1.0 0.7 0.7 1.7 2.0 2.1 2.4 2.5 2.5 2.4
Current account balance (% of GDP), balance of payments -10.6 -4.8 -5.1 -4.9 -4.8 -1.1 -0.7 -1.2 . . .
Trade balance (% of GDP), balance of payments -11.8 -6.7 -6.4 -5.8 -5.1 -0.8 -0.4 -0.6 . . .
Terms of trade of goods and services (y-o-y) 5.2 1.2 1.3 1.8 -1.2 1.0 1.5 3.2 3.0 1.8 1.5
Capital account balance (% of GDP) 0.5 0.5 0.2 0.5 1.4 2.1 2.6 2.4 . . .
Net international investment position (% of GDP) -41.2 -62.0 -63.4 -65.4 -67.4 -62.6 -57.3 -52.0 . . .
Net marketable external debt (% of GDP) (1) -6.0* -19.7* -20.5* -22.7* -22.2* -19.8 -15.7 -10.1 . . .
Gross marketable external debt (% of GDP) (1) 38.5 57.0 62.3 63.8 61.0 54.7 50.6 43.5 . . .
Export performance vs. advanced countries (% change over 5 years) 89.9 83.7 65.9 63.7 25.8 24.7 29.9 23.69 . . .
Export market share, goods and services (y-o-y) 14.1 0.7 -0.3 6.2 -6.9 15.5 6.2 -0.1 . . .
Net FDI flows (% of GDP) -6.9 -2.8 -1.8 -1.3 -1.9 -2.0 -1.8 -1.8 . . .
Savings rate of households (net saving as percentage of net disposable income) -20.7 -10.0 -13.6 -20.1 -26.7 6.7 8.4 . . . .
Private credit flow, consolidated (% of GDP) 13.8 -1.7 0.8 2.8 0.3 -1.4 -2.4 0.1 . . .
Private sector debt, consolidated (% of GDP) 48.0 71.9 73.9 72.9 71.9 66.7 62.1 59.3 . . .
of which household debt, consolidated (% of GDP) 13.8 22.2 22.5 21.5 20.6 19.2 18.0 17.5 . . .
of which non-financial corporate debt, consolidated (% of GDP) 34.2 49.7 51.4 51.4 51.3 47.5 44.1 41.8 . . .
Corporations, net lending (+) or net borrowing (-) (% of GDP) -3.2 5.7 8.7 9.3 11.7 -1.5 15.3 13.6 10.6 10.2 8.7
Corporations, gross operating surplus (% of GDP) 26.0 28.7 27.1 29.3 31.8 31.1 32.6 32.7 32.7 32.3 31.2
Households, net lending (+) or net borrowing (-) (% of GDP) -4.1 -0.5 -6.4 -7.7 -11.7 5.2 -11.1 -10.7 -8.6 -7.4 -6.2
Deflated house price index (y-o-y) . -27.1 -13.8 -15.8 -9.1 -2.8 -3.2 1.9 . . .
Residential investment (% of GDP) 2.2 2.9 2.9 2.7 3.1 2.4 2.4 . . . .
GDP deflator (y-o-y) 13.3 4.8 5.4 4.7 4.7 3.4 1.7 2.4 1.7 2.3 2.5
Harmonised index of consumer prices (HICP, y-o-y) 8.1 5.6 6.1 5.8 3.4 3.2 1.4 -0.4 -1.1 1.6 2.9
Nominal compensation per employee (y-o-y) 20.7 -2.2 1.9 -4.1 9.4 3.8 6.7 0.9 8.4 7.8 6.0
Labour productivity (real, person employed, y-o-y) 7.6 -5.2 -0.5 1.9 5.7 4.4 2.3 4.9 . . .
Unit labour costs (ULC, whole economy, y-o-y) 12.2 3.2 2.4 -5.8 3.5 -0.6 4.3 -3.8 2.9 3.6 2.6
Real unit labour costs (y-o-y) -1.0 -1.5 -2.9 -10.1 -1.2 -3.9 2.6 -6.0 1.3 1.2 0.1
Real effective exchange rate (ULC, y-o-y) 11.1 -13.0 1.0 -6.5 -5.2 0.9 3.4 -6.4 1.1 3.0 0.6
Real effective exchange rate (HICP, y-o-y) 5.9 -7.3 1.6 2.8 -6.1 3.9 1.3 -2.4 -1.3 -1.0 .
Tax rate for a single person earning the average wage (%) 27.2 28.4 28.7 29.0 28.9 25.7 25.9 25.3 . . .
Tax rate for a single person earning 50% of the average wage (%) 23.0* 25.3 25.7 26.1 26.0 22.8 23.2 22.9 . . .
Total Financial sector liabilities, non-consolidated (y-o-y) 39.0 15.6 5.4 4.9 4.8 -0.1 1.3 4.8 . . .
Tier 1 ratio (%) (2) . 17.1 17.3 15.8 18.5 18.0 19.2 19.6 . . .
Return on equity (%) (3) . 5.1 3.2 6.4 1.5 -4.5 -3.8 -1.2 . . .
Gross non-performing debt (% of total debt instruments and total loans and
advances) (4) . 5.8 8.7 11.4 . 17.9 15.8 10.7 . . .
Unemployment rate 6.9 6.5 7.0 7.2 6.8 7.1 6.8 6.8 6.0 5.7 5.6
Long-term unemployment rate (% of active population) 3.7 2.2 2.4 2.9 3.0 3.2 2.8 3.0 . . .
Youth unemployment rate (% of active population in the same age group) 19.3 20.0 22.1 23.9 22.6 23.7 24.0 21.7 20.5 . .
Activity rate (15-64 year-olds) 63.1 63.1 64.9 64.1 64.8 64.9 65.7 66.1 . . .
People at risk of poverty or social exclusion (% total population) 45.6 43.0 41.5 40.9 43.2 41.9 40.3 37.4 . . .
Persons living in households with very low work intensity (% of total
population aged below 60) 9.2 8.1 7.7 7.3 7.9 7.6 7.2 7.9 . . .
General government balance (% of GDP) -2.5 -9.5 -6.9 -5.4 -3.7 -2.1 -0.8 -0.8 -2.8 -3.6 -3.9
Tax-to-GDP ratio (%) 28.6 27.0 26.9 28.0 27.8 27.3 27.4 28.1 26.1 25.4 25.4
Structural budget balance (% of GDP) . . -5.6 -3.0 -2.5 -1.0 -0.6 -0.6 -2.5 -3.9 -4.0
General government gross debt (% of GDP) 14.5 23.2 29.9 34.2 37.3 37.8 39.4 38.0 39.1 40.5 42.3
forecast

10
Progress with implementing the
recommendations addressed to Romania in
2016 (3) has to be seen in a longer term
perspective since the introduction of the
European Semester in 2011. Hard-won fiscal
consolidation gains are at risk of being reversed,
and progress on the structural reform agenda has
been uneven.
On fiscal adjustment progress is at risk of being
undone. Since 2009, Romania pursued a
significant fiscal consolidation which led to
achieving its medium-term objective in 2014 and
2015. However, the authorities are pursuing an
expansionary fiscal policy that led to a substantial
departure from the objective.
Romania’s track record on labour market,
education and social reforms is mixed. Progress
in reforming public employment services was
initially slow, but accelerated substantially in 2016
supported by the country’s efforts to meet pre-
conditions for obtaining EU funds. Repeated calls
to extend the coverage and effectiveness of active
labour market policies were significantly
addressed in 2016, through changes in legislation,
integration of national and European Social Funds
budgets, and better coordination between
employment and social services. Successive
country-specific recommendations (CSRs) to
address youth employment challenges and the high
percentage of young people not in employment,
education or training have triggered a more
integrated approach, which was proposed in 2016,
including a pivotal role for the National
Employment Agency. These reforms have the
potential for tangible and lasting effects, but only
if implemented and sustained over the longer term.
Labour taxation was reduced, but in an untargeted
way. Repeated calls to fight undeclared work saw
limited progress with some joint inspections by the
tax administration and the Labour Inspectorate’ in
2016. There has been limited progress to date on
setting-up a minimum wage setting mechanism
was made so far with decisions being taken
without objective criteria. On social inclusion, the
minimum inclusion income law was adopted in
2016 as a response to successive CSRs. The law
will be enacted in 2018. A change towards
(3) For assessment of other reforms implemented in the past,
see in particular section 3.
integrated services for disadvantaged groups has
started in 2016 and could produce a substantial
impact when fully implemented and scaled up at
national level. Some progress has been made in
increasing the provision and quality of early
childhood education and care, with the
introduction of social vouchers to poor families,
including for the Roma. The early school leaving
Strategy was adopted in response to repeated
CSRs. There was some progress on this in 2016,
but speeding up implementation on the ground will
be instrumental to reduce the rate of school drop-
outs. Some progress was made in vocational
education and training (VET) by adoption of a
VET Strategy, and by reinstating the professional
schools, but with insufficient links to the labour
market.
Healthcare reforms have advanced in 2016 The
Ministry of Health has revamped a patient
feedback mechanism for reporting informal
payments, with new legislative measures to
empower patients, enforced role of ethics councils
in public health units, and sanctions. Some
measures have been taken to increase the
availability of outpatient care, but are still at a very
early stage.
Efforts to strengthen the capacity of public
administration were stepped up in 2016. They
covered in particular: (i) transparency, strategic
orientation and coherence of public policies; (ii)
decision-making tools; (iii) coordination within
and between different levels of government. New
civil service and training strategies were adopted,
setting the reform lines for human resources
management, but implementation has not started.
These reforms could be reversed if they are not
followed through and sustained over time.
Progress was made in the simplifying
administrative procedures. After no progress in
2011-2013, progress in 2013-2015 was significant
with the adoption of two dedicated strategies and
an action plan for entrepreneurship, business
environment and SMEs, and the adoption of the
2013-2016 government programme. The
establishment of a dedicated department for SMEs,
business environment and tourism further
consolidated progress. As a result, in the past 3
years Romania has performed above the EU
average on the ease of setting up new businesses.
2. PROGRESS WITH COUNTRY-SPECIFIC RECOMMENDATIONS
2. Progress with country-specific recommendations
11
The analysis of progress of judicial reform and
fight against corruption concluded that
Romania has made substantial progress on
much of the reform of the judicial system (4)
and the investigation of high-level corruption.
Efforts are still required as regards judicial
independence in Romania's public life, finalising
reforms of the criminal and civil codes and
ensuring efficiency in the implementation of court
decisions. Romania has made some progress
towards further measures to prevent and fight
against corruption, in particular within local
government. Important challenges remain in the
effective implementation of the preventive policies
that have been defined in 2016 (5). Romania has
made substantial progress on the investigation of
high-level corruption.
Overall, Romania made some (6) progress in
addressing the 2016 country-specific
recommendations. There was overall limited
progress on credibility of fiscal institutions, on tax
compliance and collection and financial stability.
In contrast there was overall some progress on
employment, minimum wage setting, education
and pensions. There was overall some progress on
health, public administration, and state-owned
enterprises. There was overall some progress on
rural areas, transport and investments.
(4) European Commission (2017c) (5) National Anti-Corruption Strategy 2016-2020
(6) Information on the progress and action taken to address the
policy advice in each respective subpart of a CSR is presented in the overview table in the Annex. This overall
assessment does not include an assessment of compliance
with the Stability and Growth Pact.

2. Progress with country-specific recommendations
12
Table 2.1: Summary table on 2016 CSR assessment
(1) This overall assessment of CSR1 does not include an assessment of compliance with the Stability and Growth Pact.
Source: European Commission
Romania Overall progress with 2016 CSRs: Some
progress
CSRs in full version Assessment of progress:
CSR 1: Limit the deviation from the medium-
term budgetary objective in 2016 and achieve an
annual fiscal adjustment of 0.5 % of GDP in
2017 unless the medium-term budgetary
objective is respected with a lower effort. Ensure
the application of the fiscal framework and
strengthen further tax compliance and collection.
Ensure that legislative initiatives do not
undermine legal certainty and do not put at risk
financial stability. If necessary, adopt measures
that mitigate such risks.
Limited progress *
No progress was made in ensuring that the
national fiscal framework is implemented
and limited progress in strengthening tax
compliance and collection.
Some progress was made on ensuring financial
stability.
CSR 2: Strengthen the National Employment
Agency's services to employers and jobseekers, in
particular by tailoring services to jobseeker
profiles, better linking them with social
assistance, including social services, and
reaching out to unregistered young people.
Establish, in consultation with social partners,
objective criteria for setting the minimum wage.
Take action to prevent early school leaving and
increase the provision of quality education, in
particular among Roma. Adopt the equalisation
of the pension age for men and women.
Some progress
Substantial progress was made in
strengthening the National Employment
Agency's services.
Some progress was made in linking
employment with social services: a pilot
project will be rolled out.
Limited progress on minimum wage setting.
Some progress was made on tackling early
school leaving and increasing the provision of
quality education.
No progress was made on equalising of the
pensionable age for men and women.
CSR 3: Curb informal payments in the
healthcare system and increase the availability of
outpatient care. Strengthen the independence and
transparency of human resources management in
the public administration. Simplify administrative
procedures for business and the public.
Strengthen corporate governance of state-owned
enterprises.
Some progress
Some progress was made in curbing informal
payments in the healthcare system. Limited
progress in increasing the availability of
outpatient care.
Limited progress in human resources
management in the public administration.-
Some progress on simplifying administrative
procedures for businesses and the public.
Substantial progress was made to strengthen
SOEs corporate governance.
CSR 4: Improve access to integrated public
services, extend basic infrastructure and foster
economic diversification, in particular in rural
areas. Adopt and implement the transport master
plan. Strengthen public investment project
prioritisation and preparation.
Some progress
Some progress was made on improving access
to integrated services, extending basic
infrastructure and foster economic
diversification in particular in rural areas.
Some progress. The adoption of the transport
master plan in September 2016 provides the
necessary strategic framework for investments,
but implementation remains slow.
Limited progress was made on prioritising and
preparing projects.

2. Progress with country-specific recommendations
13
Box 2.1: Contribution of the EU budget to structural change in Romania
Romania has a total allocation of EUR 30.8 billion from European Structural and Investment Funds (ESI
Funds) for 2014-2020) equivalent to 2.6 % of GDP annually and 44 % of the expected national public
investment (1). By 31 December 2016, an estimated EUR 3.5 billion, which represents about 11 % of the
total allocation for ESI Funds, have already been allocated to projects.
Financing under the European Fund for Strategic Investments, Horizon 2020, the Connecting Europe
Facility and other directly managed EU funds is additional to the ESI Funds. By end 2016, Romania has
signed agreements for EUR 1.2 billion (from the Cohesion Fund) for projects under the Connecting Europe
Facility. The EIB Group approved financing under EFSI amounts to EUR 148 million, which is expected to
trigger nearly EUR 417 million in total investments (as of end 2016).
In 2015 and 2016 ESI Funds were instrumental in helping Romania implement structural reforms
through ex-ante conditionalities (EACs) (2) and targeted investment. Examples include development of
RD&I through updating the National Register for Research Infrastructures and strengthening the governance
of the sector, and development of healthcare and transport infrastructure, and water and waste management.
The National Transport Master Plan adopted in 2016 and the accompanying railway reform aim to provide a
stable and sustainable roadmap for future investments, and strengthen the administrative capacity of state‐owned enterprises in the sector. The EACs on waste management, public procurement and transport (road
and railway reform) are still pending and efforts are made to complete them in order to avoid a possible
suspension of interim payments for the programmes concerned. The reform of the National Employment
Agency has been initiated, with a national strategy, a catalogue of services and new mechanisms of outreach
already in place. These reforms have prepared the ground for better implementation of public investment
projects, including those financed from national sources and from the other EU instruments mentioned
above. Administrative reforms support is available through targeted financing under the European Social
Fund, advice from the Structural Reform Support Service and, indirectly, through technical assistance. The
fulfilment of ex-ante conditionalities is on track, except in the area of waste.
The relevant CSRs focusing on structural issues were taken into account when designing the 2014-
2020 programmes. These include strengthening active labour‐market measures by designing a personalized
approach to jobseekers and reinforcing the capacity of the public employment service by improving its
working methods (better targeting of youth not in employment, education or training). Planned activities
supporting CSR implementation aim to increase school attendance while reducing early school leaving
through remedial measures such as after school and second chance programmes. The reform of the public
procurement system is supported via the recent establishment of the National Agency for Public
Procurement, the transposition of all public procurement directives and the adoption of secondary
legislation.
In addition, the ESI Funds address other structural barriers to growth and competitiveness. ESI Funds
investments support the reform of the waste sector, e.g. by reducing landfilled biodegradable waste and
increasing the recycling rate of household and similar waste, based on the National Waste Management Plan
adopted in 2016. ESI Funds contribute to increasing agricultural competitiveness and creating new job
opportunities through diversification of the rural economy, e.g. through support for the development and
restructuring of 30 000 small farms, facilitating start-up for 9 400 young farmers, and support for 3 000 non-
agricultural SMEs.
https://cohesiondata.ec.europa.eu/countries/RO
(1) National public investment is defined as gross capital formation + investment grants + national expenditure on
agriculture and fisheries.
(2) Before programmes are adopted, Member States are required to comply with a number of ex-ante conditionalities,
which aim at improving framework and conditions for the majority of public investments areas. For Members States that did not fulfil all the ex-ante conditionalities by the end 2016, the Commission has the possibility to propose the
temporary suspension of all or part of interim payments.

14
Fiscal policy turned pro-cyclical in 2016 and the
deficit is expected to widen, in breach of the
fiscal framework. As a consequence of significant
tax cuts and expenditure increases, the general
government deficit widened in 2016 and is
projected to further widen in 2017. This increase
breaches the country's fiscal framework, the
provisions of which are sound in theory but lack
enforcement. With a worse fiscal balance, the
public debt ratio is expected to deteriorate
gradually but remain below 60 % of GDP. High
tax evasion and low tax compliance remain a
challenge.
3.1.1. TAXATION
The overall structure of the tax system is
favourable to economic growth. Compared with
the EU average, tax revenues depend to a larger
extent on consumption taxes and to a lesser extent
on taxes on corporate income and on labour (7)
(European Commission 2016f).
The impact of the tax and benefit system on
reducing income inequality is relatively low.
The difference between market income inequality
(i.e. before taxes and benefits) and disposable
income inequality (i.e. after taxes and benefits) is
relatively low (Graph 4.1.1). The degree of
progressivity in labour tax system is relatively low,
contributing to this outcome. Nevertheless, the
government has removed the cap of 5 average
gross salaries, so that from 2017 the social security
contribution and the health contribution apply to
the entire income earned. Health contributions for
pensioners have been eliminated, as well as
personal income taxes for pensions below RON
2 000 (EUR 440). Since 2015 the government has
reduced in several steps the standard VAT rate and
the VAT rate on food and other products.
However, reduced VAT rates are not the most
efficient instrument for decreasing income
inequalities, since they are not specifically targeted
at vulnerable households.
(7) Property taxes followed by consumption taxes are the least
detrimental to growth, while corporate income taxes appear
to have the most negative effect. See Arnold, 2008.
Graph 3.1.1: Income inequality (2015)
2015 data partially available for IE.
Source: European Commission, 2016b
The incidence of undeclared work continues to
be high, weighing on tax revenue. Undeclared
work represents approximately 15 %-20 % of
GDP (8). Despite increased number of joint
controls of labour and tax authorities, their impact
remains limited, partly because preventive
measures are not yet sufficiently developed (9).
This was because resources are not always focused
on sectors with highest risks, while preventative
measures, including information campaigns, are
insufficient. At the beginning of 2017, in an
attempt to reduce the size of the informal sector, in
particular in agriculture, the government
introduced an exemption from income tax for
individuals earning income from carrying out
seasonal activities based on 12-month employment
contracts.
(8) In addition, the discrepancy between the relatively high tax
wedge on labour (calculated on the basis of the legal tax
obligation) and the low implicit tax rate on labour (derived
from actual tax receipts) suggests a high amount of concealed earnings. The tax wedge on labour was 42.1 %
in 2014 (slightly above the EU-28 average of 41.8 %). The
tax wedge data are for single earners with no children, on an average wage. The implicit tax rate on labour of 32.8 %
in 2014 was significantly below the EU-28 average of
36.4 % (European Commission, 2016g). (9) Similarly to previous years, less than 40 % of employment
relations found to be undeclared were formalised as a result
of inspections in 2016.
0
5
10
15
20
25
30
0
10
20
30
40
50
60 % of total population
Gini Index
Market income Gini coefficient (income inequalities before tax and transfers) - LHS
Disposable income Gini coefficient (income inequalities after tax and transfers) - LHS
At-risk-of-poverty (AROP) rate - RHS
3. REFORM PRIORITIES
3.1. PUBLIC FINANCES AND TAXATION

3.1. Public finances and taxation
15
Tax compliance remains low as evidenced by
Romania having the largest VAT gap in the EU.
The VAT gap, i.e. the difference between
theoretically expected VAT revenues and
effectively collected VAT, increased by 3.4 pps. in
2014 (Graph 3.1.2) despite a good economic
environment and the introduction of anti-fraud
measures. To tackle VAT evasion and fraud, the
legislation for the registration and deregistration
for VAT purposes was amended and clarified,
while the procedures for VAT reimbursement were
adjusted in 2016 (10
).
More measures to fight tax avoidance were
adopted in 2016. A mandatory but progressive
introduction (11
) of electronic cash registers
connected to the National Agency for Fiscal
Administration IT system is being pursued. A
special annual income tax replaced the corporate
income tax for taxpayers operating in specific
business areas such as hospitality services and
bars/restaurants. The tax is based on coefficients,
such as the surface area of premises, irrespective
of business's sales or net profits. However, from
2017 the turnover threshold for the application of
the micro-enterprise tax regime has been increased
fivefold and the tax rate was cut, therefore
extending this departure from the standard tax
regime and possibly contributing to further tax
avoidance.
(10) Orders of the President of the National Agency for Fiscal
Administration 1503/2016 and 1559/2016, respectively.
(11) The introduction of such cash registers is currently planned
for 2018, after series of delays.
Graph 3.1.2: VAT gap
Source: CASE et al. (2016)
3.1.2. FISCAL FRAMEWORK
The fiscal framework is sound, but lacks
enforcement. The fiscal rules, which are contained
in the fiscal responsibility law (12
), are well
designed (13
). However, the 2016 budget law was
non-compliant as the deficit ceiling of
RON 20.9 billion breached the medium-term
budgetary objective of a structural deficit of 1 % of
GDP (14
). The Romanian Fiscal Council had
assessed the draft 2016 budget as "a deliberate and
large deviation from all fiscal rules". Additionally,
the first budget amendment (from August) broke
the rule prohibiting increases in personnel
expenditure during the fiscal year, while the
second amendment (from November) broke the
rule prohibiting increases of the primary deficit
during the fiscal year.
(12) See European Commission, 2016a, for description of the
fiscal framework. For the fiscal governance reform which
laid the basis of the current framework see European
Commission 2012. (13) Captured by the Numerical Fiscal Rule Index that reflects
the strength of the design of all fiscal rules in place in a
country. Romania registered a steep jump in the index value in 2014 (latest year available). See:
http://ec.europa.eu/economy_finance/db_indicators/fiscal_governance/fiscal_rules/index_en.htm.
(14) The deficit rule requires compliance with or convergence to the medium-term budgetary objective of a deficit
of -1 % of GDP (or -0.5 %, if the debt is above 60 % of
GDP).
41.3
37.2 36.734.5
37.9
0
5
10
15
20
25
30
35
40
45
50
2010 2011 2012 2013 2014
%
Romania EU-27

3.1. Public finances and taxation
16
The medium-term fiscal strategy does not guide
the annual budget process. Under the fiscal
responsibility law, the fiscal strategy sets out the
macroeconomic assumptions, medium-term budget
planning and expenditure ceilings that should
guide the annual budget process. However, in
2016, as in previous years, the authorities did not
send an update of the fiscal strategy to the
Parliament by 15 August, the statutory deadline.
Instead the government sent it to the Parliament
simultaneously with the 2017 budget law in
December.
3.1.3. LONG-TERM SUSTAINABILITY
With a worse fiscal balance, the public debt
ratio is expected to deteriorate gradually.
Assuming no changes in fiscal policy (baseline
scenario (15
)), public debt would steadily increase
from just below 38 % of GDP in 2015 to 61 % of
GDP in 2027 (Graph 3.1.3). As the primary deficit
is projected to deteriorate, interest expenditures
will gradually increase.
Without pension reform, aging costs would
deteriorate debt dynamics. The retirement age is
not equal among genders (see Section 3.3.1)
Moreover, implementation of the second pension
pillar consisting of privately managed pension
savings has been delayed. The original plan
envisaged that contributions to the second pillar
would be raised to 6 percentage points of the
employees' contribution to the pension system.
However, the 2016 budget provided for transfers
corresponding to 5.1 pps. of contributions and the
2017 budget maintained this share. Over the long
run, aging costs related to health care and long-
term care will also negatively impact debt-to-GDP
ratios (16
).
(15) This scenario assumes a constant structural primary deficit
of 2.3 % of GDP from 2018 to 2027. This is the value in
2018, in accordance with the European Commission winter 2017 forecast.
(16) The total costs of aging are projected to increase from
15.6 % of GDP in 2016 to 16.2 % of GDP in 2030.
Graph 3.1.3: Public debt sustainability
Source: European Commission
Graph 3.1.4: Annual rate of change in gross debt ratio,
baseline scenario
Source: European Commission
Public debt is sensitive to exchange rate risk.
With over half of debt denominated in foreign
currency, public debt is sensitive to exchange rate
shocks. In a stress test scenario involving a 30 %
depreciation of the lei in 2017 and 2018, general
government debt would quickly increase to almost
51 % of GDP in 2018 and would breach the 60 %
of GDP threshold by 2024 (17
).
(17) Hedging of foreign currency positions may mitigate this
risk, but this is not considered here.
30
35
40
45
50
55
60
65
12 13 14 15 16 17 18 19 20 21 22 23 24 25 26 27
Baseline no-policy change scenario
No-policy change scenario without ageing costs
Stability and Growth Pact (SGP) institutional scenario
Stability and Convergence Programme (SCP) scenario
-4
-3
-2
-1
0
1
2
3
4
5
6
14 15 16 17 18 19 20 21 22 23 24 25 26 27
Stock flow adjustmentsInflation effectGrowth effect (real)
% of GDP

17
Financial stability improved in 2016, but
legislative initiatives tend to undermine legal
predictability and investor's confidence. In the
context of strong economic growth and a rebound
in credit activity, bank balance sheets have
continued to strengthen, while profitability
recovered. Following the 2015 balance sheet
review and stress test, further efforts have been
made to ensure adequate capitalisation in the
insurance sector. However, recurrent legislative
initiatives could undermine the stability of the
financial sector, and undermine investor sentiment
by making the legal framework less predictable.
The banking sector remains well capitalised
and liquid, and profitability recovered in 2016.
In particular, capital adequacy at system level has
remained roughly flat since end-2015 and stood at
18.7 % at the end of September 2016. Liquidity
remained at comfortable levels, while the loan-to-
deposit ratio fell to 87 % at end-March 2016.
Following the balance sheet clean-up in 2014,
banking sector profitability rebounded to positive
territory in 2015 and further improved in 2016
despite compressed interest margins (Graph 3.2.1).
Graph 3.2.1: Return on equity
Source: European Commission
On the back of write-offs and sales of impaired
assets, non-performing loans (NPLs) declined.
Due to the 2014 NPL resolution plan by the
National Bank of Romania (NBR) and additional
measures adopted in April 2016 (18
), NPLs
(18) Following the measures adopted in 2014, the NBR required
in April 2016 credit institutions to make an additional
dropped sharply by roughly 12 pps. to 10.02 % in
October 2016, down from the peak registered in
February 2014(19
). However, banks continue to be
burdened by the quality of corporate exposures and
consumer loans, which are the loan portfolios with
the highest level of delinquency (Graph 3.2.2).
Graph 3.2.2: Non-performing loans
Source: National Bank of Romania.
The 2015 asset quality review (AQR) and stress
test of the banking sector has been delayed. The
NBR decided to delay the start of the exercise to
capture the impact of the law on debt discharge
('datio in solutum') on banks’ balance sheet data at
end-2016. Regarding the governance of the
exercise, the asset quality review and stress test
will be overseen by a steering committee with
international participation and will be conducted
with the support of independent and reputable third
parties (including auditors, real estate appraisal
companies). The exercise, which the NBR
committed itself to starting at the beginning of
2017, will include all credit institutions of systemic
relevance. The asset quality review methodology
effort to fully provision non-performing loans (more than 180 days past due, unsecured, or with a very low
probability to recover the collateral), to facilitate their write
off. (19) The NPL definition used by the NBR is fully in line with
the European Banking Authority's (EBA) definition. In
accordance with the EBA, non-performing exposures are those that satisfy any of the following criteria: i) material
exposures which are more than 90 days past due; and ii) the
debtor is assessed as unlikely to pay its credit obligations in full without realisation of the collateral, regardless of the
existence of any past due amount or of the number of days
past due.
-10
-5
0
5
10
15
20
25
07 08 09 10 11 12 13 14 15 16
%
Return on Equity (%)
EU (changing composition)
Euro Area (changing composition)
0
5
10
15
20
25
30
35
Sep 09 Sep 10 Sep 11 Sep 12 Sep 13 Sep 14 Sep 15
Non-performing loans to total loans (NPL)
o/w non-financial companies NPL
o/w household NPL
o/w household NPL consumer loans
o/w household NPL for house purchase
3.2. FINANCIAL SECTOR

3.2. Financial sector
18
will be based on the 2014 ECB comprehensive
assessment. The stress test will be broadly based
on the methodology developed by the European
Banking Authority for the 2016 EU-wide stress
test.
Following European Systemic Risk Board
recommendations, Romania is setting up a
macro-prudential authority. To strengthen their
powers in the area on macro-prudential policies,
the authorities plan to establish a National
Committee for Macro-prudential Oversight, which
will replace the current National Committee for
Financial Stability (20
). However, the law to set up
this committee has yet to be adopted.
The authorities introduced several macro-
prudential measures in 2016. In particular, the
NBR identified nine banks as other systemically
important credit institutions (O-SIIs) with an O-SII
buffer of 1 % since 2016. In March 2016 the NBR
adopted a systemic risk buffer of 1 %, applicable
to banks whose parent institutions are domiciled in
countries with a 'non-investment' long-term
sovereign debt rating. However, this decision has
been suspended until an impact study of recent
legislative developments has been conducted.
From 1 March 2017 the macroprudential measures
adopted by the NBR following the
recommendations of the National Committee for
Financial Stability will refer to: (i) an O-SII buffer
of 1 % of the total risk exposure amount applied to
11 banks identified by the NBR as O-SIIs based on
data available as of June 2016; and (ii)
deactivation of the Systemic Risk Buffer.
The debt discharge law has to be amended to
reflect the Constitutional Court decision. The
law (European Commission, 2016a), in force since
May 2016 and retroactively applicable also to
existing loan contracts, applies to loans with a
value below the threshold of EUR 250 000 and
covers loans granted for buying, building,
renovating a property for living, or loans
(irrespective of the scope) which are guaranteed
with at least one dwelling as collateral. However,
mortgage loans under the state sponsored "First
House" programme were excluded from the scope
(20) Macro-prudential instruments under the CRR/CRDIV are
currently activated upon recommendation from the National Committee for Financial Stability. They are
implemented by the NBR for credit institutions and by the
Financial Supervisory Authority for investment firms.
of the law. Following a referral by credit
institutions, the Constitutional Court ruled on 25
October 2016 that judges will assess whether
borrowers comply with the legal provisions on
hardship (21
) under the 2011 Civil Code. The
ruling of the Constitutional Court minimizes the
unwarranted adverse impact of this law on the
banking sector and reduces moral hazard by
focusing the applicability of the law on borrowers
in difficulty.
The full impact of the debt discharge law
remains difficult to assess. Although originally
intended for borrowers in financial distress,,
experience so far shows that borrowers without
financial difficulties and delays in the servicing of
loans have also made use of the law. At the time of
adoption, banks increased the down-payment for
mortgage loans, but they subsequently lowered it
for certain categories of borrowers. In prudential
terms, the law initially triggered the upward
revision of banks’ risks weights of the loan
portfolio falling under the scope of the law. (22
)
However, after reassessment which took also on
board the ruling of the Constitutional Court, this
loan portfolio is no longer being treated as being
impacted by a default event and therefore no
longer subject to higher capital requirements.
The Constitutional Court declared as
unconstitutional the law on the conversion of
Swiss franc-denominated loans. In contrast to
countries that adopted similar laws (such as Poland
and Croatia), Romania has a limited exposure to
Swiss franc-denominated loans with an
outstanding stock amounting to 0.8 % of GDP (at
end June-2016) and 3 % of the total loans to
households. The total stock of Swiss franc loans
has continued to fall in the first half of 2016
compared to 2015 on the back of voluntary
negotiations between banks and clients on the
conversion of loans in Swiss francs into lei. The
law on the conversion of the Swiss franc loans into
RON loans at historic exchange rates (i.e. at the
moment when the loan contract was signed)
adopted by Parliament in October 2016 was
referred by the previous government to the
(21) Hardship refers to exceptional circumstances which could
not have been foreseen by the contractual parties when they
agreed upon the loan contract. (22) In line with the provisions of EU Regulation 575/2013 on
prudential requirements for credit institutions and
investment firms (capital requirements regulation – CRR).

3.2. Financial sector
19
Constitutional Court for a constitutionality check.
In its decision of 7 February, the Constitutional
Court rejected the conversion of Swiss franc-
denominated loans into RON loans at historic
exchange rates and held that the conversion should
be done in line with the conditions at the
conversion date (23
). Furthermore, the
Constitutional Court declared the law as
unconstitutional based on procedural grounds, as it
did not respect the principle of bicameralism.
Another legislative initiative, currently before
Parliament, could be harmful for the banking
sector. A draft law on the National Agency for
Consumer Protection may affect the mandate of
the NBR and its prudential supervisory powers on
credit institutions. The draft law includes several
provisions which aim to increase the supervisory
powers of the agency on financial intermediaries
operating in Romania, including credit institutions.
An adequate balance between consumer protection
and prudential supervision is important in this
context.
The independence of financial sector regulators
may be weakened by further initiatives. A draft
legislative proposal before Parliament aims to
restrict the independence of the NBR, lift the legal
protection of NBR staff members for actions taken
in good faith and place the NBR under tighter
parliamentary control. The Chamber of Deputies
initiated a proposal to amend the legal framework
of the Financial Supervisory Authority. The
proposal includes new provisions on revoking the
mandate of the Authority's board members, which
is not in line with international good practices and
have implications for supervisory independence. In
addition, Parliament launched the procedure to
revoke the mandate of the President of the
Financial Supervisory Authority following
measures taken after the 2015 balance sheet review
and stress test of the insurance sector to address
shortcomings related to compulsory car insurance.
This is an indication of political pressure brought
(23) Conversion at historic exchange rates was expected to
generate losses for the banking sector. The NBR
preliminarily estimated that converting the Swiss franc-
denominated loans into lei-denominated loans at historic rates would have generated a total loss for banks of RON
2.4 billion (EUR 530 million), causing a 1.8 pps fall in the
capital adequacy ratio at system level. Some banks would have been more severely hit, while some exchange rate
volatility could have occurred, as banks would have needed
to buy foreign exchange to close their open positions.
in response to supervisory actions and limits the
independence of supervisors.
Shortcomings in several insurance
undertakings are being addressed (European
Commission, 2016a). Astra Asigurari was put into
insolvency in August 2015, and the decision was
declared irrevocable in April 2016. Following the
court decision, the Insurance Guarantee Fund
started paying of compensation to Romanian and
foreign policyholders. Several follow-up measures
(including capital increases) were taken to restore
the financial situation of insurers in distress, based
on the results of the 2015 balance sheet review and
stress test, and of a second exercise performed on
insurance companies not included in the first
exercise. Such measures were taken in particular
for Euroins, which was placed under financial
recovery in October 2015, and City Insurance,
which was under a financial recovery plan until the
end of 2016. As the efforts since 2014 to restore
the viability of Carpatica have been unsuccessful,
the Financial Supervisory Authority withdrew
Carpatica's licence in July 2016 and requested the
opening of insolvency proceedings. The measures
adopted so far have contributed to addressing the
shortcomings identified during the 2015 balance
sheet review and stress test, but several pockets of
vulnerability, including thin solvency buffers for
some insurers, still remain.
The government introduced a cap on insurance
premiums for compulsory car insurance. The
cap on insurance premiums, which became
effective on 17 November 2016, was triggered by
the increase in these premiums inter alia due to
measures taken to address shortcomings identified
during the 2015 balance sheet review and stress
test. The government argues that the increase is the
corollary of a distortion in competition as two
main insures exited the market and passed an
emergency ordinance to cap the insurance
premiums for 6 months. The maximum caps on the
premiums were calibrated by the Financial
Supervisory Authority and adopted by government
decision in November 2016. This intervention in
the price setting of insurance premiums in the
absence of a general system of price control does
not appear to be in line with EU law, in particular
with the provisions of the Solvency II directive.
The measure is also likely to aggravate current
distortions and put further pressure, in the short
term, on the profit generation capacity of insurers.

20
3.3.1. LABOUR MARKET
Overview and challenges
The labour market situation is improving, while
also presenting structural challenges. The
employment rate increased (67.7 % in Q3 2016),
still at some distance from both EU and national
targets while unemployment is falling. However,
Romania still faces negative demographics,
(ageing and emigration), while the level of
inactivity one of the highest in the EU. Large
socio-economic disparities exist between fast-
growing urban areas and poorer less developed
rural areas and areas in the urban fringe.
Differences in access to healthcare and quality
education exacerbate these inequalities. Structural
reforms that should help to tap the employment
potential and address disparities have been
initiated, but are yet to be fully implemented.
A sectoral shift, typical of a transition economy,
is under way. As the economy is transforming,
low-skilled manual jobs (in agriculture and
industry) are being lost and job creation is taking
place in services (both tradable and non-tradable)
and in the public sector (Graph 3.3.1). At the same
time, on the back of sustained economic growth,
construction is picking up. Services are expected to
be the net job creator in the next decade (24
). The
transition of the labour force between sectors
brings with it challenges.
Difficulties with recruiting and retaining
higher-skilled employees in fast-growing sectors
are a challenge to growth. Skills shortages exist
particularly in the ICT sector, but also among
health and services professionals and teachers
(CEDEFOP, 2016a). Additionally, occupations
such as skilled trades, engineering, transport and
distribution (Manpower Group, 2015) are in short
supply. Poor performance of education, vocational
training and lifelong learning systems, unattractive
working conditions and higher wages abroad
(European Commission 2015c), contribute to
labour shortages. Finally, internal labour mobility,
which could balance some of the skills shortages,
(24) Distribution and transport are one of the most dynamic
sectors, followed by business and other services (including
ICT) and non-marketed services such as education and
health (CEDEFOP 2016b).
remains limited (25
). In order to increase the
attractiveness of education and health sectors,
wages in these areas have been increased, but their
impact remains to be seen.
Graph 3.3.1: Employment by sector
Source: European Commission
Sustained reform momentum is essential for
boosting welfare and long-term growth.
Ensuring the continued implementation and
sustainability of the ambitious reform measures
taken in 2016 is essential to produce tangible
effects with an impact on future economic growth,
on the reduction of poverty and on the country's
development potential. Successful implementation
of reforms also hinges on having an effective
social dialogue. The latter remains characterised
by low collective bargaining at sectoral level and
by institutional weaknesses (European
Commission, 2016a).
Untapped labour force
In this context, tapping into the unused labour
potential is paramount for boosting growth.
Low levels of unemployment are matched by one
of the highest inactivity rates of the working-age
population in the EU (Graph 3.3.2) and a large
informal sector (26
). Employment and activity rates
(25) Recently, public wages in the education and healthcare
sectors have been increased, however in an ad hoc manner,
without applying a comprehensive policy based on qualifications and performance of workforce.
(26) National data estimate people in the informal economy at
around 1.2 million, representing 0.6 pp. of total population.
-500
-400
-300
-200
-100
0
100
200
300
400
07 08 09 10 11 12 13 14 15
*1000
Agriculture IndustryConstruction Tradable servicesNon-tradable services Public sectorTotal
3.3. LABOUR MARKET, EDUCATION AND SOCIAL POLICIES

3.3. Labour market, education and social policies
21
remain below the EU average for women, the low-
skilled, young people, people with disabilities and
Roma.
The share of young people neither in education,
employment or training (NEET) remains high.
This situation further worsened in 2015, increasing
by 1.1 pps. and driven mainly by the increasing
early school leaving rate (see Section 3.3.2). Two
thirds of NEETs remain inactive and include a
relatively high share of Roma and women living in
rural areas (Eurostat, 2016 and FRA, 2016).
Graph 3.3.2: Activation potential*
* People from 25 to 54 years as percentage of total
population in Q2 2016
** Part-time workers who would like to work additional hours
and are available to do so
*** People available to work but not seeking
**** Inactive people on top of discouraged workers
Source: European Commission
A new approach towards targeting young
NEETs aims to offer better employment
services. The National Employment Agency plans
to deploy integrated teams to identify and register
NEETs. The teams will offer an integration
pathway supported by more attractive active labour
market policies. Since 2016 all NEETs can benefit
for the first time from employment subsidies. The
Youth Guarantee has so far only partially reached
young NEETs (European Commission, 2016i).
Roma are one of the most disadvantaged groups
on the labour market. Only one in three Roma
aged 20-64 report having engaged in 'paid work'.
This is roughly the same as for peer countries, with
a high discrepancy between men and
women (27
).In a context of labour force shortages
and with 20 % of new labour market entrants being
Roma (World Bank, 2014b), better employment
prospects of Roma are essential for potential
growth and the shock-absorbing capacity of the
economy.
Women's labour participation remains low. The
employment rate of women has not improved since
2008 and remains below the EU average (28
),
partly due to the lack of affordable child and long-
term care and afterschool facilities. Recent
measures adopted by the Parliament to support
extended (up to two years) (29
) and parental leaves,
which are almost exclusively taken by women,
may further deteriorate their employment situation.
Full equalisation of the retirement age for women
and men (65) has been pending before Parliament
for several years.
Labour market policies
Comprehensive measures were adopted in 2016
to improve active labour market participation.
The Ministry of Labour has for the first time an
integrated overview of the European Social Fund
and national budgets for active labour market
policies. Take-up is expected to improve thanks to
a mix of more attractive demand- and supply-side
activation measures (including support for
entrepreneurship and employment subsidies),
tailor-made to groups furthest from the labour
market. Financial incentives covering relocation
and transport costs were increased to improve
internal labour mobility in line with the national
mobility plan. Measures to encourage the return of
Romanians from the diaspora were launched with
EU funding support.
The National Employment Agency is set to have
a pivotal role in activation policies. In 2016, the
Agency implemented a thorough reform of service
delivery and developed a profiling procedure for
jobseekers, subsequently enshrined in legislation.
The Agency plans to take tailor-made action in
(27) 17 % Roma women and 49 % men reported to have
engaged in 'paid work' when surveyed or in the four weeks
prior to the survey. The discrepancy is more pronounced in Romania than in peer countries on average (FRA, 2016).
(28) The gender employment gap is even more acute for older
women as compared to the EU average (19.1 % v 13.2 %). (29) Increase of parental leave from one to two years,
remunerated at 85 % of the previous salary and with no
upper ceiling.
0
5
10
15
20
25
30
35
40
RO EU RO EU RO EU RO EU
Underemployedpart-timeworkers**
Unemployed Discouragedworkers***
Other inactivepeople****
%
Increasing distance from the labour market

3.3. Labour market, education and social policies
22
close collaboration with social assistance and
education counsellors. The Agency started training
its counsellors in case management and intends to
hire professionals oriented towards NEETs, the
long-term unemployed and inactive groups.
Minimum wage increases are still adopted
without objective criteria. Ad hoc minimum
wage increases have significantly raised the share
of workers earning the minimum wage and led to
strong compression at the bottom of the wage
distribution (European Commission, 2016a). In
January 2016, the Government set up a tripartite
working group to establish an indexation
mechanism for future minimum wage adjustments.
An impact study was conducted to evaluate the
economic and social effects of the changes in the
minimum wage and a group of experts was
approved by the tripartite group to set up the
mechanism based on the findings of the study.
Despite these developments, in January 2017 the
Government decided ad hoc to increase the
minimum wage to RON 1 450 (EUR 322) from 1
February 2017 and to RON 1 750 (EUR 390) by
2020. These increases are not based on objective
criteria, despite the work of the tripartite group.
Challenges in rural areas
Urban-rural disparities are holding back
economic and social development. Over 45 % of
the population lives in rural areas which remain far
behind urban areas in terms of poverty reduction,
employment and education, access to services and
infrastructure (European Commission, 2016a).
This urban-rural divide is holding back economic
growth and income convergence.
Recently adopted measures aim to tackle these
socio-economic development challenges. In
2016, the Government adopted a comprehensive
set of measures to improve living standards and
stimulate productivity and economic
diversification. Measures include modernising and
restructuring small farms, setting-up non-
agricultural SMEs in rural areas, investments in
rural infrastructure, including social and education
infrastructure, and measures to formalise
employment. Successful implementation will
hinge on the capacity to effectively target and
absorb available EU funding.
3.3.2. POVERTY AND SOCIAL EXCLUSION
Poverty and social exclusion remain high.
Although declining (Graph 3.3.3), a high risk of
poverty or social exclusion persists for young
NEETs, families with children and people with
disabilities. Compared with urban areas, twice as
many people in rural areas live in marginalised
communities confronted with housing,
employment and social challenges (World Bank,
2014a). The share of poor people who live in very
bad quality housing and spend over 40 % of their
incomes on housing is one of the highest in the
EU. In-work poverty (with a rate double the EU
average) stems from the high share of
unremunerated family workers in rural areas.
Finally, Romania has one of the highest levels of
income inequality in the EU and rising (Section 2).
Graph 3.3.3: AROPE for selected groups
At-risk-of-poverty or social exclusion rate (% of total
population). People who are at-risk-of poverty (AROP)
and/or suffering from severe material deprivation and/or
living in household with zero or very low work intensity.
2007-2009 EU27, 2010-2015 EU28
Source: European Commission
Poverty and social exclusion are particularly
high among the Roma. The risk of poverty for
Roma is almost three times as high as for the
general population. It is high in comparison with
other Member States with a sizable Roma minority
(BG, CZ, HU, SK including RO), where the rate of
poverty for Roma is estimated to be between
three to more than six times higher than for the
0
10
20
30
40
50
60
70
07 08 09 10 11 12 13 14 15
% of population
RO <18y RO 18-64y RO 65+
EU <18y EU 18-64y EU 65+

3.3. Labour market, education and social policies
23
general population (FRA, 2016) (30
). Roma are
concentrated in marginalised communities and
about two thirds live in housing lacking basic
sanitation (FRA, 2016, p. 19). The increased use
of dissuasive sanctions, such as fines, by the
National Council on Combatting Discrimination is
a promising development for the effective
enforcement of anti-discrimination rules.
High poverty incidence is associated with high
inactivity levels. The absence of any or recent
work experience, a low level of skills and
education and scarce employment opportunities
are the main barriers preventing the poor from
finding employment (World Bank, 2017,
forthcoming, p. 4). The issue is acute in rural and
marginalised areas, where employment
opportunities outside (semi-) subsistence
agriculture are rather limited (for policy response,
see challenges in rural areas).
The minimum inclusion income aims to tackle
poverty and promote activation measures.
Adopted in 2016, the minimum inclusion income
(MII) law, due to enter into force on 1 April
2018 (31
), consolidates three means-tested
programmes (European Commission, 2016a).
While almost doubling the current budget (32
), it
increases the adequacy and coverage of the
benefits, aiming to lift 10 % of the population out
of extreme poverty. Moreover, the MII includes
provisions to strengthen inspections and coercive
measures. The MII will combine passive support
with more attractive active labour market measures
by maintaining a part of the benefits for those
taking up work and introducing compulsory active
labour market measures for this group. The
activation potential of these compulsory measures,
however, remains modest with a target to reach
only 25 % of MII beneficiaries by 2021.
(30) The 2016 survey by the Fundamental Rights Agency
improved the sampling and weighting methods developed
for the 2011 Roma survey, thus the results are a more accurate representation of the situation of Roma in the
countries covered. Indicators used are a close
approximation to those applied in standard European surveys (EU SILC, EU LFS), but full comparability was
not intended. For more details see FRA, 2016.
(31) See European Commission, 2016a, for background on existing social benefits.
(32) The budget for the scheme will increase from RON 1.4 to
2.4 billion (EUR 310 to 530 million).
However, social benefits are not yet revised in a
fully predictable manner. The level of the main
social benefits, including unemployment benefits,
is determined on the basis of the social reference
index which has not been updated since its
introduction in 2008 (European Commission,
2016a). A regular revision of the social reference
index would help preserve the adequacy of social
benefits over time while avoiding large
unbudgeted ad hoc revisions.
For the first time, a comprehensive anti-poverty
package was adopted in 2016. The package
integrates EU and national funds and provides for
a safety net for people at risk of poverty. It moves
away from a benefit-driven policy towards
providing more social services catered to each age
group, such as access to early education and care,
prevention of early school leaving, transition from
school to work, and improved social and medical
services for the elderly. Official accreditation of
social services has been simplified. However, the
lack of integration and overview of services
provided with national and EU funds make the
referral process difficult.
The anti-poverty package includes integrated
services targeted at marginalised communities.
A pilot project of integrated teams is planned to be
rolled out in 2017 in 100 marginalised
communities (out of over 500), mostly in rural
areas. The teams comprise social assistants,
community health assistants, or mediators and
educational counsellors or mediators to provide
services tailored to the specific needs of the most
disadvantaged groups, working closely with public
employment services. When scaled up to cover the
whole country, the project is expected to have a
significant impact on the currently low provision
of integrated services.
3.3.3. EDUCATION
Unequal provision of quality education is
undermining human capital potential. High
underachievement in basic skills, the high and
rising early school leaving and low tertiary
attainment do not meet the increasing needs for
skilled labour supply in the context of persistent
emigration. The labour market relevance of
education remains a challenge, while participation
in lifelong learning is very low. Romania's public

3.3. Labour market, education and social policies
24
expenditure on education is one of the lowest in
the EU (European Commission, 2016a). If
unchanged, these factors will continue
undermining human capital potential and
economic growth.
A high share of students do not possess an
adequate level of basic skills. The 2015 OECD
Programme for International Student Assessment
(PISA) found high levels of low achievement in
basic skills (Graph 3.3.4). More than half of
students from the lower socio-economic quarter
are underachievers, indicating that socio-economic
status has a large impact on student performance.
Underachievement is also high in all other socio-
economic quarters and the share of top performers
in science is low. This risks hindering the country's
future innovation potential and affect its long-term
competitiveness. Efforts were made to revise the
curricula towards competence-based learning, but
results will take a long time to become visible (33
).
Graph 3.3.4: Proportion of low achievers among 15-year-
olds in PISA 2015
Source: OECD
Access to quality education is limited in rural
areas and for the Roma. Rural schools, which
provide education to almost half of primary and
lower secondary students, score below urban
schools. Roma educational achievement is
negatively affected by the lower teaching quality
(33) Following the revision of the curricula for primary
education (grades 1-4), a new curriculum for grades 5-8 is
set to be phased in from September 2017. Plans to reform
the curricula for high-school education have been delayed.
in Roma-predominant schools. Educational
segregation (34
), partly stemming from uneven
distribution of Roma in the country and from
discriminatory attitudes, hinders inclusive
education. Only 38 % of Roma children aged 4 to
compulsory school age participate in early
education and care. Social coupons have been
introduced to support the participation of poor
children in kindergarten.
The rising share of early school leavers poses an
additional challenge. In 2015 the proportion of
early school leavers rose to 19.1 %, the third
highest in the EU, and is particularly high in rural
areas, for Roma (35
) and for people with
disabilities. This trend is driven by poverty and
insufficient provision of quality education
(European Commission, 2016a, pp. 64-65).
National scale European Social Fund projects were
launched to reduce early school leaving. The
availability of second-chance programmes has
increased, but remains insufficient (European
Commission 2016h).
The quality and relevance of tertiary education
for the labour market remains a challenge.
Tertiary attainment is the one of the lowest in the
EU (25.6 % in 2015, compared to 38.7 % EU28)
and unlikely to improve significantly due to low
passing rates at the baccalaureate (68.1 % in 2016)
and high early school leaving. Despite some
progress (European Commission, 2016h), labour
market relevance remains a challenge as shown by
the employment rate of graduates (77 % in 2015 vs
93 % in 2008).
Progress in vocational education and training
(VET) is insufficient to meet labour market
needs. Dual learning was recently introduced to
support the reform of the VET system by offering
private companies fiscal incentives for providing
student training. A VET strategy was adopted as ex
ante conditionality for EU funds and a reform of
the apprenticeship system was initiated. However,
VET qualifications and curricula continue to be
insufficiently aligned with labour market needs.
(34) About 29 % of Roma children receive education in schools
where all or most students are Roma (FRA, 2016). (35) The Fundamental Rights Agency estimates the share of
Roma early school leavers at 77 %.
0
5
10
15
20
25
30
35
40
45
RO BG IT EU-28 ES PL
%
Science
Readings
Maths

3.3. Labour market, education and social policies
25
Participation in lifelong learning is one of the
lowest in the EU. There is limited cooperation
between the ministries and institutions carrying out
educational activities for adults. A national
strategy to address the shortcomings of the VET
and lifelong learning systems is in place, but its
implementation is slow and ESF-funded action is
still to be launched on the ground.
3.3.4. HEALTH AND LONG-TERM CARE
The healthcare system faces structural and
financing challenges. The healthcare system is
characterised by unequal access and inefficient
spending as well as the lack of a long-term
sustainable funding structure. The system remains
hospital-centred, with few primary and outpatient
care services, resulting in outdated and ineffective
care (European Commission, 2016c). In addition,
continuous overspending of the budget on
pharmaceuticals constrains the introduction of
innovative medicines. E-health systems which
could improve efficiency and lower the incidence
of corruption are not fully functional. Weak
governance and the lack of comprehensive public
health policies add to these challenges.
Health outcomes are weak, negatively affecting
workforce employability. Due to the high
mortality rate, 2 203 potentially productive life
years are lost per 100 000 population (against an
EU average of 1 236; data from 2013 (OECD/EU,
2016). Moreover, while decreasing over time,
infant mortality, perinatal mortality, amenable and
preventable mortality and mortality from diseases
of the circulatory systems are among the highest in
EU, although they are decreasing over time.
Access to healthcare is limited and unequal.
Access to good quality care is hindered by the low
density of general practitioners, specialist
physicians (36
) and nurses, while medical staff
migration to EU countries has not abated. Low
levels of public funding contribute to informal
payments, which is one of the main financial
barriers to accessing health care. As the sector
remains underfunded, in 2014 11 % of the
population declared having offered money or gifts
to doctors and 8 % to nurses (Ministry of Health of
(36) 236.3 physicians per 100 000 residents while EU average is
349.6.
Romania et al., 2015). The gap in unmet needs for
medical examination between the richest and the
poorest is the fourth highest in the EU and double
the EU average. Access to selected highly cost-
effective essential medicines is limited. Primary
healthcare and integrated community teams are not
sufficiently deployed.
New initiatives will improve the cost
effectiveness of and access to healthcare. New
medicines have been introduced and a new
pharmaceutical pricing scheme is supposed to
improve access to cost-effective medicines. A new
law on community care setting up health centres
and teams adopted in October 2016 is expected to
improve access to healthcare including for
vulnerable groups in rural areas. In addition, ESIF
investments for 2014-2020 focus on measures to
improve healthcare access for vulnerable and
marginalised groups. Already adopted measures
include the development and approval of regional
health care plans, and salary increases for medical
staff.
The reform agenda is incomplete. Although the
national health strategy 2014-2020 includes
specific measures to address poor health outcomes,
with some positive results, it will depend on long-
term implementation to sustain these
developments. A comprehensive approach on
performance information systems and workforce
strategy is not yet developed.
Corruption in the healthcare system has been
recognised as a particular problem (European
Commission, 2017c). The main issues relate to
public procurement in hospitals, insurance fraud
and false reimbursements, bribery for issuance of
medical certificates giving access to special
benefits and the widespread practice of informal
payments to medical professionals.
Strengthening integrity and reducing
corruption risks became a priority in 2016. The
national anti-corruption strategy 2016-2020 from
August 2016 puts forward a comprehensive set of
measures to fight corruption in healthcare. A
revamped electronic reporting system aims at
reducing informal payments. The Health Minister
launched in December 2016 a special telephone
line where patients, doctors or witnesses of
corruption cases in any medical unit can report
potential breaches. Other measures include

3.3. Labour market, education and social policies
26
changes to the hospital ethics councils' law, as well
as increasing the accountability of hospital
managers, ensuring they are recruited through
open competition (37
). On the latter, there are signs
of backtracking in 2017 (38
). Given the
multifaceted issue of corruption in healthcare, the
main challenge will be to effectively implement all
the measures planned in the national anti-
corruption strategy 2016-2020.
(37) Including special commissions selected according to
objective criteria.
(38) The Government had adopted an emergency ordinance in
November (79/2016) which modified the selection of hospital managers to ensure they are selected by open
competition and extended the coverage of conflict of
interest provisions for a wider category of hospital management staff. This ordinance was rejected in the
Senate in January 2017, but still needs to pass through the
Chamber of Deputies.

27
3.4.1. EXTERNAL COMPETITIVENESS
Current account
Current account developments have been
largely driven by the trade balance. The current
account markedly improved following the crisis
and was close to balance in 2014. This correction
was driven by improvements in the trade balance,
especially in services (European Commission,
2016a). However, the current account went into a
moderate deficit in 2015, which expanded further
in 2016 due to a widening of the trade balance on
the back of strong import growth.
The current account deficit is expected to
deteriorate as import growth strengthens.
Robust domestic demand is boosting import
growth in Romania. European Commission staff
suggest that imports of goods and services grew by
0.6 % in response to a 1 % increase in domestic
demand (39
)(40
). With consumption growth forecast
to remain buoyant (see Section 1.1), imports are
expected to continue to grow strongly in 2017-
2018, with the current account deficit widening to
3.1 % of GDP by 2018.
Export performance
Competitiveness has been the main contributor
to a strong export performance, albeit at
declining pace. Between 2000 and 2015,
Romania's share in the global trade market more
than doubled from 0.18 % to 0.39 %. Much of this
improvement is explained by domestic 'push
factors', such as labour costs, a proxy for the
economy's competitiveness (41
). Competitiveness
(39) Research by the National Bank of Romania (monthly
bulletin, June 2016) also concluded that strong domestic
demand had a relatively high impact on import growth, as
domestic supply was slow to react to increased consumer demand following lower indirect taxes and rising wages.
(40) European Commission staff also estimated the export-
import elasticity to be 0.4, which is consistent with the relatively low import intensity of exports. The domestic
value added share of exports was 73 % in Romania in
2014, above the EU average of 63 % (Source: www.wiod.org).
(41) The conclusion is based on a shift-share analysis. Export
market share changes are broken down into 'pull' factors, which capture the impact from changes in external demand
or sectoral shifts in global markets, and 'push' factors,
which reveal how different structures of individual countries’ exports affect their relative performance. The
'push' factors can be interpreted as a broad measure of an
economy’s 'competitiveness'.
gains were especially strong in the crisis period but
slowed in 2011-2015.
External demand negatively contributed to
export performance. Changes in external demand
had a positive impact before 2007, but became
unfavourable with the start of the crisis. This was
partially due to a concentration of exports towards
the EU market, but also to a significant economic
slowdown in the Romania's non-EU main trading
partners, Russia and Turkey. The former even
dropped out of the top-10 destinations for
Romania's exports (Graph 3.4.1) (42
).
Graph 3.4.1: Geographical specialisation in the 10 largest
export destinations in 2015
The size of the bubbles indicates the weight of Romania’s
exports in total imports of the destination country.
'Market dynamism' stands for the difference between the
annualized growth rates of world imports per geographical
market and global world imports.
'Competitiveness' stands for the difference between the
annualized growth rates of Romania’s exports per market
and world imports per market.
Source: European Commission
Traditional export sectors lost market share in
2015, reversing recent gains. Breaking down
recent export developments by product
specialisation categories illustrates that Romania
lost competitiveness in 2015 in its most important
sectors: vehicles and machinery. These losses were
compensated in part but not fully by the dynamism
of these sectors (Graph 3.4.2).
(42) Commission staff estimates suggest that Romania's exports
of goods would fall by 2.4 % in response to a 1 % decrease
in external demand.
Germany
Italy
France
Hungary
UK
Turkey
BulgariaSpain
Poland
Netherlands
-10
-8
-6
-4
-2
0
2
4
6
-15 -10 -5 0 5 10 15
Mark
et D
ynam
ism
(pp)
Competitiveness (pp)
3.4. INVESTMENT

3.4. Investment
28
Graph 3.4.2: Breakdown of export performance
Note: IS stands for Romania’s initial sectoral specialisation,
while MSG captures how successful Romania has been in
gaining market shares on average across export products.
Source: European Commission
Wage dynamism
Public-sector wage adjustments are leading
changes in wages in the tradable sector.
Specifically, public-sector wages were leading the
wage-setting process in the run-up to the crisis and
shortly thereafter. In the wake of the crisis, the
non-tradable sector joined forces with the public
sector as the prime movers in the wage-setting
process.
Economy-wide wages grew swiftly in 2016,
driven by public wage growth. In recent years,
wage growth in the public sector has been more
volatile than in the private sector (Graph 3.4.3).
Periods of public wage decreases and stagnation
were followed by rapid increases. Overall, public
wages have grown faster since 2010 than those in
the private sector. Instances of large minimum
wage increases have also driven wage growth (43
).
Consequently, nominal compensation per
employee accelerated in 2016 (see Section 1.5)
after some years of moderate growth (44
).
(43) See Box 2.1.1 in European Commission, 2016a, pp. 10-11.
(44) Compensation of employees consists of wages and salaries,
and of employers' social contributions.
Graph 3.4.3: Labour cost index
Source: European Commission
Spillovers from the non-tradable to the tradable
sector may weaken external competitiveness in
the future. With the tradable sector in all cases the
follower in wage determination, it is likely that
wage growth will catch up with higher wages in
the public and the non-tradable sectors over the
medium-term. Unpredictable changes in public
wage policy may therefore divert economy-wide
wage developments away from economic
fundamentals.
Graph 3.4.4: Minimum and public wage growth vs inflation
and productivity developments (2009-2016)
Source: European Commission
-10
-5
0
5
10
15
11 12 13 14 15
% of total market share
MSG-Machinery & Electrical IS-Machinery & Electrical
MSG-Vehicl, Aircr, Vessels IS-Vehicles, Aircraft, Vessels
MSG-other sectors IS-other sectors
Total Market Share (% ch.)
80
90
100
110
120
130
140
150
160
170
09Q4 10Q4 11Q4 12Q4 13Q4 14Q4 15Q4 16Q4
2012=100
Manufacturing(Nace C)
Business services(G_N)
Public and other services(O_S)
75
100
125
150
175
200
225
09 10 11 12 13 14 15 16
2009S1=100
Min. wageHICPLabour productivity (hours worked)public wages

3.4. Investment
29
A more predictable wage-setting process for
public and minimum wages would help avoid
adverse effects on competitiveness. Commission
staff estimates suggest that a 1 % increase in the
unit labour cost-based real effective exchange rate
would reduce exports by 0.7 %. This implies that
export performance is highly affected by changes
in labour costs and the exchange rate. Given
productivity developments, income convergence
and the competitiveness position of Romania,
increases in public wages and their potential
impact deserve special attention (Graph 3.4.4).
3.4.2. PUBLIC INVESTMENT AND
INFRASTRUCTURE
Romania's infrastructure is a key factor
limiting competitiveness. Quality investment
would boost growth in the long run, including in
the process of catching-up and convergence with
the EU. However, the poor shape of infrastructure
is a key obstacle to doing business. In addition, the
poor quality of infrastructure exacerbates regional
disparities and inclusion problems (Section 3.3.1).
Despite high public spending, the quality of
infrastructure remains low. Romania has the
highest rate of public investment in the EU in the
last decade. At the same time, although overall
performance improved, the country ranks last in
the EU in the perceived quality of infrastructure
(Graph 3.4.6). This is particularly the case in the
transport sector where Romania ranks 128 (out of
138 countries) for the quality of roads and 79 for
the quality of railroad infrastructure (Graph 3.4.5).
The transport sector remains dominated by loss-
making state-owned enterprises (see Section
3.4.3), while the necessary institutional and
legislative reform of the sector is delayed.
The authorities adopted measures to improve
investments in the transport sector. The 2014-
2030 general transport master plan was adopted in
September 2016 with targets, strategic objectives
and priority projects for the medium to long term.
Additionally, to speed up investments in road
infrastructure, the government split the national
authority in charge of road construction into two
bodies, one for infrastructure investments and one
for infrastructure administration. The impact of
these measures will depend on whether they are
implemented effectively.
Graph 3.4.5: Global Competitiveness Index
Note: Respondents rate 1 (worse) to 7 (best)
Source: World Economic Forum, 2016-2017.
Graph 3.4.6: Public investment spending and quality of
infrastructure
Note: Respondents rate 1 (worse) to 7 (best)
Source: European Commission and World Economic Forum:
the Global Competitiveness Index 2015-2016
Stronger absorption of EU funding could play a
key role in improving infrastructure spending.
Romania had one of the lowest financial execution
rates for the 2007-2013 Structural and Cohesion
Funds in the EU (Graph 3.4.7). Payment claims
generated by projects cover only 77 % of the 2007-
2013 budget allocation for transport. Improved
absorption for the 2014-2020 period will depend
on improved governance, removing public
procurement delays and bureaucratic obstacles
(e.g. obtaining building permits), and on
0
1
2
3
4
5Roads
Airtransportinfrastruc
ture
Electricitysupply
Portinfrastruc
ture
Railroadinfrastruc
ture
Overallinfrastruc
ture
2016-17
2010-11
AUT
BEL
BGR HRV
CYP
CZE
DNK
EST
FINFRA
DEU
GRC
HUN
IRL
ITA
LVA
LTU
LUX
MLT
NLD
POL
PRT
RO
SVK
SVN
ESP
SWE
GBR
1
2
3
4
5
6
3 4 5 6 7
Pu
blic
GF
CF
spendin
g,
2006-2
015 a
vera
ge,
% o
f G
DP
Quality of infrastructure

3.4. Investment
30
improving beneficiaries' capacity to prepare high-
quality projects and deliver them on time.
Graph 3.4.7: Financial execution of Structural and Cohesion
funds 2007-2013
Data include advanced payments. Excluding advanced
payments, Romania managed to claim 77 % of its 2007-2013
budget allocation.
Source: European Commission
3.4.3. STATE-OWNED ENTERPRISES (SOE)
SOEs play an important role in the economy,
but are not on as firm a financial footing as
their private-sector counterparts. SOEs
dominate critical infrastructure sectors such as
energy and rail transport that are essential for
sustainable growth. However, SOEs have higher
debt ratios and lower profitability than their private
sector counterparts (European Commission, 2016a;
Marrez, 2015). Arrears to the state, to other SOEs
and to private suppliers are a pervasive problem
and represent contingent liabilities. Despite
negative operational results in 2015 and 2016, the
restructuring of loss-making SOEs has not
advanced. Moreover, the privatization agenda has
not yet started moving forward.
Legislation on improving corporate governance
was adopted (45
). The law and its implementing
legislation follow good international practices in
ensuring transparency in the appointment of board
members and the management of SOEs. Moreover,
(45) Law 111/2016 on the corporate governance of state-owned
enterprises approved by Parliament in May 2016. It
replaced government emergency ordinance 109/2011.
the Ministry of Finance has greater powers to
monitor how legislation is being implemented and
companies' performance. This strengthened role is
based on harmonised mandatory reporting of
financial and operational performance and on the
Ministry having the power to apply financial
penalties for the failure to meet deadlines and
procedures.
3.4.4. BUSINESS ENVIRONMENT
The business environment has improved but
some weaknesses remain. Romania's
competitiveness significantly improved in 2011-
2016 but it ranks 36th in the World Bank's Doing
Business 2017 Report and dropped from rank 53 to
62 in the Global Competitiveness Report (Graph
3.4.8). Weaknesses persist in infrastructure
(roads), administrative burden, labour market,
efficiency, health and education (see Sections 3.3,
3.5, 3.6). Corruption and governance issues in the
public sector are among the main challenges for
the business environment.
Administrative procedures for business and the
public are being simplified. During 2016 the
Government adopted several emergency
ordinances to simplify administrative procedures
and facilitate relations between citizens and the
public administration. This new legislation
streamlines the process of submitting forms and
promotes widespread use of email. In addition, in
January 2017 the new government passed
measures in support of entrepreneurship and
simplification such as an increase of the threshold
for micro-enterprises, an exemption of profit tax
for R&D companies, and the elimination of 102
fees and duties.
However, modern e-government solutions
remain largely untapped. Romania's use of
e-government is one of the lowest in the EU
(European Commission, 2016a, p. 47). Measures
taken by the authorities target: (i) the
reinforcement of governance; (ii) coordination of
the implementation of e-government solutions; (iii)
adoption and implementation of a national
interoperability framework. However, the national
administration IT system is fragmented, adding to
the administrative burden for the public and
businesses.
50
55
60
65
70
75
80
85
90
95
100
Croatia Romania Hungary Czechrepublic
Bulgaria Poland
%
2016 2015
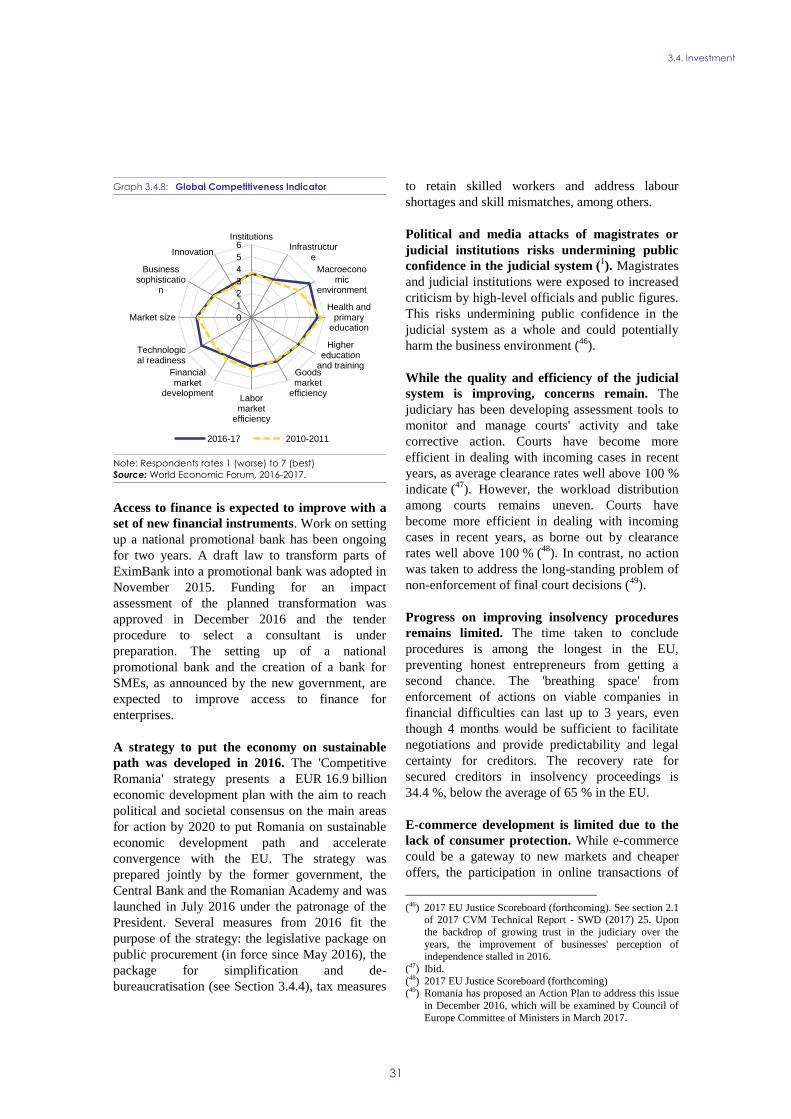
3.4. Investment
31
Graph 3.4.8: Global Competitiveness Indicator
Note: Respondents rates 1 (worse) to 7 (best)
Source: World Economic Forum, 2016-2017.
Access to finance is expected to improve with a
set of new financial instruments. Work on setting
up a national promotional bank has been ongoing
for two years. A draft law to transform parts of
EximBank into a promotional bank was adopted in
November 2015. Funding for an impact
assessment of the planned transformation was
approved in December 2016 and the tender
procedure to select a consultant is under
preparation. The setting up of a national
promotional bank and the creation of a bank for
SMEs, as announced by the new government, are
expected to improve access to finance for
enterprises.
A strategy to put the economy on sustainable
path was developed in 2016. The 'Competitive
Romania' strategy presents a EUR 16.9 billion
economic development plan with the aim to reach
political and societal consensus on the main areas
for action by 2020 to put Romania on sustainable
economic development path and accelerate
convergence with the EU. The strategy was
prepared jointly by the former government, the
Central Bank and the Romanian Academy and was
launched in July 2016 under the patronage of the
President. Several measures from 2016 fit the
purpose of the strategy: the legislative package on
public procurement (in force since May 2016), the
package for simplification and de-
bureaucratisation (see Section 3.4.4), tax measures
to retain skilled workers and address labour
shortages and skill mismatches, among others.
Political and media attacks of magistrates or
judicial institutions risks undermining public
confidence in the judicial system (1). Magistrates
and judicial institutions were exposed to increased
criticism by high-level officials and public figures.
This risks undermining public confidence in the
judicial system as a whole and could potentially
harm the business environment (46
).
While the quality and efficiency of the judicial
system is improving, concerns remain. The
judiciary has been developing assessment tools to
monitor and manage courts' activity and take
corrective action. Courts have become more
efficient in dealing with incoming cases in recent
years, as average clearance rates well above 100 %
indicate (47
). However, the workload distribution
among courts remains uneven. Courts have
become more efficient in dealing with incoming
cases in recent years, as borne out by clearance
rates well above 100 % (48
). In contrast, no action
was taken to address the long-standing problem of
non-enforcement of final court decisions (49
).
Progress on improving insolvency procedures
remains limited. The time taken to conclude
procedures is among the longest in the EU,
preventing honest entrepreneurs from getting a
second chance. The 'breathing space' from
enforcement of actions on viable companies in
financial difficulties can last up to 3 years, even
though 4 months would be sufficient to facilitate
negotiations and provide predictability and legal
certainty for creditors. The recovery rate for
secured creditors in insolvency proceedings is
34.4 %, below the average of 65 % in the EU.
E-commerce development is limited due to the
lack of consumer protection. While e-commerce
could be a gateway to new markets and cheaper
offers, the participation in online transactions of
(46) 2017 EU Justice Scoreboard (forthcoming). See section 2.1
of 2017 CVM Technical Report - SWD (2017) 25. Upon
the backdrop of growing trust in the judiciary over the
years, the improvement of businesses' perception of independence stalled in 2016.
(47) Ibid.
(48) 2017 EU Justice Scoreboard (forthcoming) (49) Romania has proposed an Action Plan to address this issue
in December 2016, which will be examined by Council of
Europe Committee of Ministers in March 2017.
0
1
2
3
4
5
6Institutions
Infrastructure
Macroeconomic
environment
Health andprimary
education
Highereducation
and trainingGoodsmarket
efficiencyLabormarket
efficiency
Financialmarket
development
Technological readiness
Market size
Businesssophisticatio
n
Innovation
2016-17 2010-2011

3.4. Investment
32
Romanian consumers (12 % vs 55 % EU) and
SMEs (7 % vs 17 % EU) remains one of the lowest
in the EU. Despite improvements in the last 2
years, unfavourable consumer conditions (50
)
remain an obstacle to consumer confidence in
online shopping (51
). The effective enforcement of
rules in the digital environment remains limited
due to weak enforcement capacity. An IT
coordinator was appointed at secretary of state
level, in line with Decisions 464/2016 and
21/2017.
Corruption
Corruption persists at all levels and remains an
obstacle for doing business. Corruption is widely
acknowledged as a major issue in Romania, as
shown regularly in perception surveys (52
) and
most recently in a Eurobarometer on the
Cooperation and Verification Mechanism (53
).
Corruption and governance issues in the public
sector are among the top challenges for the
business environment, holding back growth
(World Economic Forum, 2017).
Romania stepped up efforts to fight corruption
over the past years. Romania has a solid anti-
corruption legal framework and the track record of
the judicial institutions fighting corruption has
been strong. Romania has a comprehensive
framework for the integrity of public officials and
an independent institution with a good track record
(National Integrity Agency). The national anti-
corruption strategy 2016-2020 from August 2016
aims to create a better corruption prevention policy
(50) Twice as many Romanians compared to other Europeans
report unfair contract terms and unanticipated charges by retailers and a higher than EU average prevalence of unfair
commercial practices. Awareness of alternative dispute
resolution amongst Romanian retailers’ is among the lowest in the EU (44 % vs 55 % EU-28), with decreasing
participation in such mechanisms (21 % vs 32 % EU-28),
upcoming Consumer Conditions Scoreboard (2017). (51) Despite an increase of 7 pps. in the last 2 years, Romanian
consumers’ confidence in online shopping is still below the
EU average (57 % vs 72 % EU28). In addition, retailers' confidence in online selling in Romania decreased and is
below the EU average (47 % vs 57 % EU28) (upcoming
Consumer Conditions Scoreboard 2017). (52) Flash Eurobarometer 428: Businesses’ attitudes towards
corruption in the EU, available at
http://ec.europa.eu/COMMFrontOffice/PublicOpinion/index.cfm/Survey/getSurveyDetail/instruments/FLASH/surveyKy/2084 ;
(53) Flash Eurobarometer 445: The Cooperation and
Verification Mechanism for Bulgaria and Romania,
published on 25 January 2017.
and to promote integrity in the public sector. The
strategy includes measures to improve
transparency of the decision-making process and
of budget allocation, while maintaining a culture of
integrity within public organisations by enforcing
managerial accountability.
The irreversibility of progress in the fight
against corruption was recently put at risk.
Romania's track record has pointed toward the
growing irreversibility of reforms, as a number of
internal safeguards have been put in place against
abrupt reversal. However, in an emergency
procedure on 31 January 2017, the Government
introduced amendments to the Criminal Code,
affecting the fight against corruption (54
).While a
subsequent government emergency ordinance
issued on 5 February (55
) abrogated these
amendments, the parliamentary scrutiny of both
ordinances is pending. Such initiatives risk
challenging the progress already made over the
past 10 years in this field.
(54) Emergency Government Ordinance no.13 of 31.01.2017
for the modification of Law no. 286/2009 regarding the
Criminal Code and Law no. 135/2010 regarding Criminal procedure code. Official Journal of Romania, Part II, No. 9
of 1 February 2017.
(55) Emergency Ordinance no. 14 from 05.02.2017 for the abrogation of the Government Emergency Ordinance no.
13/2017 amending and supplementing Law no. 286/2009
regarding the Criminal Code, Law no. 135/2010 regarding the Criminal Procedure Code and amending Law no.
135/2010 regarding the Criminal Procedure Code. Official
Gazette no. 101 from 05.02.2017.

3.4. Investment
33
Box 3.4.1: Investment challenges and reforms in Romania
Section 1. Macroeconomic perspective
Total investment in Romania (gross fixed capital formation) has weathered the crisis well. After a sharp
correction in 2010, investment has been on an upward trend since 2011. It accelerated sharply in 2015 and
returned to almost pre-crisis growth rates (8.3 % year-on-year), driven mainly by investment in equipment
and supported also by civil engineering with the end of the implementation period for projects financed by
EU funds from the 2007-2013 financing period. Both private and public investment are above the EU
average (see Section 1). Looking forward, good economic growth prospects are expected to support
investment activity and investor confidence. All investment components are expected to contribute to
investment growth in 2017 and 2018, with a slightly stronger role played by investment in equipment.
Section 2. Assessment of barriers to investment and ongoing reforms
The overall business environment presents challenges hampering investment (European Commission,
2015a). These include continued political uncertainty and unpredictability of new policies. Some appropriate
measures have been taken, but many barriers remain to be addressed to lift growth and accelerate
convergence (see Sections 3.3-3.6).
Main barriers to investment and priority actions underway
1. Despite high public investment spending, the quality and efficiency of infrastructure are low, holding
back investment. Comparatively low absorption of EU funds, inefficient project preparation, prioritisation
and implementation, and limited efficiency and non-transparent governance of state-owned enterprises
constrain the development of quality infrastructure. Romania took action in 2016 to improve strategic
investment in road infrastructure with the adoption of the transport master plan, which remains to be
implemented.
2. Inadequate labour supply weighs on investment. Unfavourable demographics and emigration, untapped
labour force, low knowledge and innovation capacity and the lack of basic digital skills in large parts of the
population reduce the supply of skilled workers, which affects investment decisions. Romania adopted
ambitious labour market reforms in 2016. These could have a long-lasting effect on potential growth,
poverty reduction and the country's development potential, if fully implemented.
3. Widespread corruption and inefficient public administration continue to hamper the business
environment. Investment can be held back by the remaining regulatory and administrative burden,
inefficiencies in public administration, lack of predictability of legislation and poor enforcement of legal and
technical regulations and of final court decisions.
Regulatory/ administrative burden CSRGROW
EPL & framework for labour contracts EMPL?
Business services / Regulated
professions
Public administration CSREMPL
Wages & wage setting CSREMPL
Retail
Public procurement /PPPsEMPL
Education CSREAC/EMPL
Construction
Judicial systemJUST
Taxation CSRECFIN
Digital Economy / Telecom
Insolvency frameworkJUST
Access to financeECFIN/FISMA
Energy
Competition and regulatory framework CSRGROW
Cooperation btw academia, research
and business RTDTransport CSR
Financing of R&D&IRTD
No barrier to investment identified No progress Some progress
CSR Investment barriers that are also subject to a CSR Limited progress Substantial progress
Fully addressed
Pu
blic
ad
min
istr
atio
n/
Bu
sin
ess
envi
ron
men
t
Lab
ou
r m
arke
t/
Edu
cati
on
Sect
or
spec
ific
reg
ula
tio
n
Fin
anci
al
Sect
or
/
Taxa
tio
n
R&
D&
I

34
3.5.1. RESEARCH AND INNOVATION (R&I)
Structural shortcomings in the R&I system are
holding back its growth contribution. Structural
challenges to R&I remain unchanged (European
Commission, 2016a). These include insufficient
funding, institutional fragmentation, low quality of
the public science base, and weak public-private
collaboration. In 2015, the European Innovation
Scoreboard (European Commission, 2016j) placed
Romania in the lowest country category ('modest
innovator'), with scores well below the EU average
on all dimensions and indicators (Graph 3.5.1).
The lack of dynamism in R&I has implications for
long-term competitiveness and growth prospects.
Graph 3.5.1: Innovation performance of EU Member States
in 2015
Source: European Commission EIS2016
R&D intensity improved but the lack of
investment impedes R&I capacities take-off.
Although R&D intensity (56
) improved in 2015
(Graph 3.5.2), Romania still has one of the lowest
levels among EU Member States. Out of the total
2014-2020 structural funds allocated only 3.4 %
were allocated for R&I, far from the EU average of
10.6 % for the same period. The 2016 budget
provided for a slight increase in public R&D
expenditure up to 0.29 % of GDP, largely
(56) Research and development (R&D) is the statistical proxy
for expenditure in the R&I system (Eurostat). Intensity is
measured as R&D expenditure in percent of GDP.
insufficient to reach the 1 % of GDP target of
public investments in R&D (57
) by 2020.
Recently adopted measures to stimulate
business investment have yet to gain traction. In
2015, less than 200 business entities applied for
the 50 % supplementary corporate tax deduction
for R&D expenditure, even fewer than the 223
entities in 2014. Despite the slight increase in
business R&D intensity in 2015, at 0.21 % of GDP
it is still one of the lowest in the EU. To stimulate
business R&D activities, the government
introduced in August 2016 an exemption from
paying the salary income tax for all R&D
activities. Also, to stimulate the activity of
computer programmes development, a measure of
payroll taxes exemption was set up and is in place
starting with 2017, for employees in start-ups with
main activity in this area.
Graph 3.5.2: Evolution of business R&D intensity and public
R&D intensity in Romania, 2000-2015
Source: European Commission
Pervasive bottlenecks obstruct SMEs'
investment in innovation. SMEs have a low level
of innovation and knowledge flows between public
R&D and the business sector (Graph 3.5.3) are
weak, as borne out by Romania ranking at the
bottom of the 'Linkages & Entrepreneurship'
dimension of the Scoreboard (58
). Red tape, poor
(57) Romania's Europe 2020 target is 2 % of GDP investments
in R&D, with 1 % from the public sector and 1 % from the
private sector. (58) It covers performance indicators on SMEs innovating in-
house, innovative SMEs collaborating with others and
public-private scientific co-publications.
0.00
0.10
0.20
0.30
0.40
0.50
0.60
0.70
0.80
RO
BG
HR
LV
LT
PL
SK
HU
ES
EL
PT IT CZ
MT
EE
CY SI
EU
FR
AT
LU
UK
BE IE NL
DE FI
DK
SE
Innovation leaders Strong innovators
Moderate innovators Modest innovators
0.0
0.1
0.2
0.3
0.4
0.5
00 01 02 03 04 05 06 07 08 09 10 11 12 13 14 15
%GDP
Public R&D intensity
Business R&D intensity
3.5. SECTORAL POLICIES

3.5. Sectoral policies
35
infrastructure and the low level of entrepreneurial
education hamper innovative entrepreneurship and
the development and growth of technological start-
ups.
Graph 3.5.3: Quality of scientific output and public R&D
investment levels
Source: European Commission
Key steps have been undertaken to improve
governance and reduce fragmentation.
Developing and implementing effective smart
specialisation strategies requires: (i) building on
the strengths of clusters of entrepreneurial
knowledge and resources, and (ii) involving all
regional and national players. In this context, the
establishment of the National Council for Science,
Technology and Innovation Policy (59
) may be an
important step towards improving the still weak
coordination between the national and the regional
levels in a coherent innovation system. High
fragmentation in public research performance, with
more than 150 public institutions undertaking
R&D, and inefficient technological transfer policy
remain issues to be tackled.
The government is taking steps to improve the
R&I environment. Under 'specific support'
provided under the European Commission's
Horizon 2020 Policy Support Facility (60
)
recommendations began to be drawn up in 2016 to
(59) The National RDI Strategy 2014-2020, provides for the
creation of a consultative body responsible for coordination
and harmonization of R&I policy, under the coordination
of the prime-minister.
(60) https://rio.jrc.ec.europa.eu/en/policy-support-
facility
create an environment conducive to the growth of
technological start-ups. In September 2016, the
European Investment Fund and the Romanian
Ministry of European Funds launched a EUR 59.3
million (61
) Competiveness fund-of-funds to
finance SMEs via several financial intermediaries.
3.5.2. DIGITAL ECONOMY
Companies' low level of digitisation is
constraining productivity improvements
(European Commission 2016d). Measured against
the 12 key digital technologies covered by the
Digital Intensity Index (62
), Romania ranks among
the three EU Member States with one of the lowest
share of enterprises with high digital intensity. On
the positive side, the share of companies with very
high digital intensity exceeds that of peers and is
close to the EU average (Graph 3.5.4).
Graph 3.5.4: Digital intensity score for enterprises
Source: European Commission
The workforce's digital skills are one of the
lowest in the EU. Despite the existence of many
skilled ICT specialists, the general workforce lacks
(61) Funded by the European Regional Development Fund.
(62) The indicators are: internet access for at least 50 % of
employed people; recourse to ICT specialists; fast
broadband (30 Mbps or above); mobile internet devices for at least 20 % of employed people; a website with
sophisticated functions; social media; ERP; CRM;
electronic sharing of supply chain management information; e-commerce turnover accounting for over 1 %
of total turnover; business-to-consumer web sales of over
10 % of total web sales.
EU
BE
BG
CZ
DK
DE
EE
IE
EL ES
FR
HR
ITCY
LV
LT
LU
HU
MT
NL
AT
PL
PT
RO
SI
SK
FI
SE
UK
y = 7.7498x + 4.1712
4
6
8
10
12
14
16
0.2 0.4 0.6 0.8 1.0 1.2
Hig
hly
-cited p
ublic
atio
ns(1
) (
%),
2013
Public R&D intensity, 2013
0
10
20
30
40
50
60
70
80
90
100
RO BG PL HU CZ HR EU28
Very Low (0-3) Low (4-6) High (7-9) Very High (10-12)

3.5. Sectoral policies
36
digital skills with negative implications for
increased labour participation. In 2016, only one
third of the workforce possessed basic or above
digital skills compared to two thirds in the EU.
Moreover, in the overall population, only 28 % of
Romanians possessed basic or above basic level of
digital skills compared to 56 % in the EU.
Broadband networks are underdeveloped in
rural areas, with risk of digital exclusion.
Romania is one of the world's leading countries in
terms of internet speed. Nevertheless, there are still
rural areas with no access to the Internet. Barriers
that jeopardise the successful completion of
broadband projects include low implementation
capacity, cumbersome administrative procedures
for obtaining the building permits for broadband
deployment and bureaucratic procedures for
commissioning sites. To bridge the urban-rural
digital divide and ensure a viable connection rate,
investments in broadband networks could be
complemented by demand stimulation measures.
3.5.3. ENERGY
Recent reforms have improved energy
efficiency but progress is slow in key areas.
Increased energy efficiency investment will keep
production costs low, thus improving
competitiveness and growth prospects. While
energy efficiency is improving overall, progress
remains slow in key areas, such as the renovation
of the district heating infrastructure. With the EU's
highest final energy consumption per square meter
of dwelling in the residential sector, an energy
inefficient building stock exacerbates the problem
for many Romanian households This is mainly due
to insufficient local financing and low absorption
of EU and national funds (63
).
Romania has made significant progress in
liberalising the gas market (64
). Market reforms
adopted in 2016 require gas producers to sell and
suppliers to purchase gas via trading platforms.
These reforms, along with the abolition of fixed
prices paid to gas producers, will improve market
liquidity and strengthen price signals. Further
(63) Funds allocated to cogeneration/district heating were
underused. From the total amount initially programmed, 15.9 % have actually been used.
(64) See European Commission, 2016a, Section 2.3 for
background.
stimulus could come from the full implementation
of EU-level market rules on gas trading and from
increased cross-border interconnectivity, in order
to secure more liquidity on the wholesale market.
However, competition in gas supply still faces
hurdles. While price regulation for business
customers was successfully phased out by 2015,
regulated gas retail prices for household customers
will be phased out by 2021. In addition, the gas
wholesale market remains very concentrated, with
more than 75 % of the market held by the three
largest companies.
Romania is not yet fully integrated into the EU
energy market. In 2016, the interconnection
capacity for electricity was 7 %, below the 2020
target of 10 %. The upgrading of internal lines and
aged network assets is slow. To reach the 10 %
target by 2020, Romania will have to implement
new Projects of Common Interest and upgrade six
internal lines. Gas network development through
the Bulgaria–Romania–Hungary–Austria trans-
mission corridor would give access to the Caspian
gas coming to Greece through the planned Trans-
Adriatic pipeline. This would increase security of
supply and gas source diversification in the EU's
south-eastern region.
3.5.4. RESOURCE EFFICIENCY
The economy is not resource efficient,
considerably less so than the EU average, with
implications for competitiveness (World Economic
Forum, 2014) and for the country's sustainable
development (Eco-Innovation Observatory, 2015).
Its recycling rate is one of the lowest in the EU
(5 %), while the landfilling rate is one of the
highest (82 % in 2013), with illegal landfill sites
reappearing.
Waste management reform is significantly
delayed. The national waste management plan and
the waste prevention programme, due since 2014,
were not finalised. The plan would channel
national and EU investments to achieve the EU
environmental standards. Specifically, an effective
economic and legislative framework for waste
recycling is lacking. Drawing up the waste
management plan is a mandatory requirement for
accessing EU funding for the 2014-2020 period.

37
Slow progress in public administration reform
hinders the delivery of structural reforms.
Romania adopted new civil service strategies
improving governance and transparency. However,
the organisational structures remain unstable and
vulnerable to political changes. Incomplete human
resources reforms limit public institutions' capacity
to develop and implement policies in a strategic
and coordinated manner. Moreover, the low
accountability of the public administration
negatively impacts the quantity and efficiency of
public services.
Several measures strengthened transparency
and accountability of public administration.
Two government ordinances simplified procedures
for business and citizens (see Section 3.4.4). A
transparency register for lobbying entities was
opened. New tools and standards for public
debates were incorporated in the process of policy
and law formulation (65
). However, transparent
practices are not yet firmly established and public
consultation on draft legislation is insufficient.
Romania ranks 110th
(out of 138) in the global
competitiveness index when it comes to
transparency of policymaking.
Policy and legislation lack systematic strategic
planning. Steps were taken in 2016 to strengthen
strategic policy making by reinforcing the
Chancellery of the Prime Minister to ensure
coherence across departments, oversee
implementation and integrate cross-sectoral
measures combining national and EU funding. In
2017, the Government General Secretariat took
over its strategic and coordination competences,
but its capacity and leverage to steer policy design
by sectoral departments remains to be
strengthened. Moreover, mandatory strategic
planning and regulatory impact assessment
instruments are not systematically used and
parliamentary legislative initiatives are not subject
to budgetary impact analysis. Overall, Romania is
one of the lowest ranked of OECD and EU
countries on its executive capacity (Bertelsmann
Stiftung, 2016, p. 17) (Graph 3.6.1).
(65) In 2016, consultations and public debates were carried out
systematically on the basis of templates and standard
procedures developed by the Ministry of Civic Dialogue
and Public Consultation to be followed by ministries at all stages – launching of debates, consolidating proposals,
incorporating them in draft texts, and explaining rejections,
if necessary.
Graph 3.6.1: Executive capacity, 2016 (1)
1) The graph shows 5 lowest and 5 highest ranked countries
Source: Bertelsmann Stiftung, 2016
3.6.1. HUMAN RESOURCES
Recently adopted strategies could ensure
consistency and common standards across the
public service. Strategies for the civil service and
staff training, adopted in 2016, provide for a
comprehensive approach to human resources
management in the public administration and an
improvement in workforce planning and
performance. The envisaged measures would
clarify roles, functions and mandates for each staff
category, review performance management
systems, increase transparency and neutrality in
recruitment, and coordinate and prioritize
employee training.
However, implementation hinges on legislative
amendments and a proper institutional set-up.
The objectives of the new civil service strategies
are not fully reflected in the civil service law and
draft administrative code. The Civil Service
Agency has neither the capacity nor the authority
to implement effectively the new civil service
strategies. The Agency has not standardised data
for public administration employees (66
). Training
is now mandatory in public institutions, but the
(66) Romania performs worse than all but one OECD countries
in terms of administrative data collection of number of
staff, pay levels, functions, skills, mobility and turnover
(OECD, 2016, p. 11).
0 1 2 3 4 5 6 7 8 9
Finland
Denmark
New Zealand
Sweden
Norway
OECD
EU
Bulgaria
Slovenia
Croatia
Romania
Greece
Cyprus
3.6. PUBLIC ADMINISTRATION

3.6. Public administration
38
sources of funding are unidentified and the
selection of training providers is not transparent.
Recruitment criteria and pay levels are not
harmonized across public institutions. The civil
service strategy plans to introduce transparent
criteria for staff selection and recruitment and
mechanisms to reduce political interference in
appointments by 2020. Some pay level
harmonization has been introduced across staff
categories within institutions, but substantial gaps
persist between public institutions.
3.6.2. PUBLIC PROCUREMENT
Romania made progress in public procurement
reform, but corruption remains a challenge (67
).
The implementation of the public procurement
strategy and action plan progressed in 2016 (68
). In
May 2016 the new public procurement laws
transposing the EU directives entered into force
and all necessary secondary legislation was
adopted by the end of 2016. The law for the
PREVENT system for systematic ex-ante checks
of conflicts of interests was adopted. The National
Agency for Public Procurement (ANAP) was set
up in 2015 as single institution responsible for
public procurement providing more robust and
efficient corruption control and preventive
institutional mechanisms. ANAP is responsible for
the ex ante check of the public procurement
procedures and is currently implementing a
sample-based, more thorough, ex ante checks
system, as opposed to the previous systematic
controls. An inter-ministerial committee for public
procurement was established in October 2015
aiming at ensuring the overall coherence of the
public procurement system.
Several measures are still outstanding. The web-
based guidelines which should help the contracting
authorities step by step during the procurement
process are still under development and should be
fully completed by 2019. Other measures still
(67) "There are sectors in public procurement where corruption
is generalized. Many times, the awarding of contracts or
the payments related to contracts are conditioned by receiving different sums of money disguised by fraudulent
deals or fictitious agreements", DNA (2016).
(68) The analysis of the progress in the implementation of the public procurement Strategy is part of a wider Commission
exercise in relation to ex-ante conditions for the
implementation of EFSI funds in the 2014-2020 period.
pending will re-enforce the ex-ante and internal
controls of the National Agency for Public
Procurement and the contracting authorities,
operationalization of anticorruption measures, e-
procurement, and training of public procurement
officers.
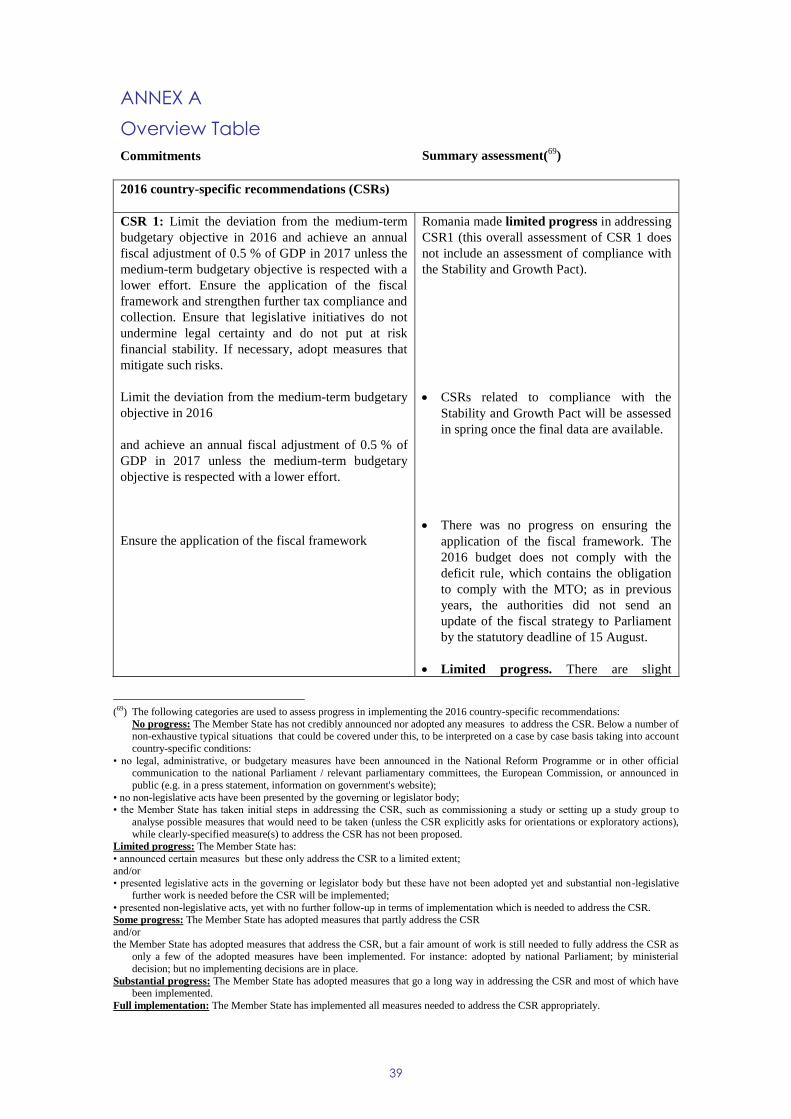
39
2016 country-specific recommendations (CSRs)
CSR 1: Limit the deviation from the medium-term
budgetary objective in 2016 and achieve an annual
fiscal adjustment of 0.5 % of GDP in 2017 unless the
medium-term budgetary objective is respected with a
lower effort. Ensure the application of the fiscal
framework and strengthen further tax compliance and
collection. Ensure that legislative initiatives do not
undermine legal certainty and do not put at risk
financial stability. If necessary, adopt measures that
mitigate such risks.
Limit the deviation from the medium-term budgetary
objective in 2016
and achieve an annual fiscal adjustment of 0.5 % of
GDP in 2017 unless the medium-term budgetary
objective is respected with a lower effort.
Ensure the application of the fiscal framework
Romania made limited progress in addressing
CSR1 (this overall assessment of CSR 1 does
not include an assessment of compliance with
the Stability and Growth Pact).
CSRs related to compliance with the
Stability and Growth Pact will be assessed
in spring once the final data are available.
There was no progress on ensuring the
application of the fiscal framework. The
2016 budget does not comply with the
deficit rule, which contains the obligation
to comply with the MTO; as in previous
years, the authorities did not send an
update of the fiscal strategy to Parliament
by the statutory deadline of 15 August.
Limited progress. There are slight
(69) The following categories are used to assess progress in implementing the 2016 country-specific recommendations:
No progress: The Member State has not credibly announced nor adopted any measures to address the CSR. Below a number of non-exhaustive typical situations that could be covered under this, to be interpreted on a case by case basis taking into account
country-specific conditions:
• no legal, administrative, or budgetary measures have been announced in the National Reform Programme or in other official communication to the national Parliament / relevant parliamentary committees, the European Commission, or announced in
public (e.g. in a press statement, information on government's website);
• no non-legislative acts have been presented by the governing or legislator body; • the Member State has taken initial steps in addressing the CSR, such as commissioning a study or setting up a study group to
analyse possible measures that would need to be taken (unless the CSR explicitly asks for orientations or exploratory actions),
while clearly-specified measure(s) to address the CSR has not been proposed. Limited progress: The Member State has:
• announced certain measures but these only address the CSR to a limited extent;
and/or • presented legislative acts in the governing or legislator body but these have not been adopted yet and substantial non-legislative
further work is needed before the CSR will be implemented;
• presented non-legislative acts, yet with no further follow-up in terms of implementation which is needed to address the CSR. Some progress: The Member State has adopted measures that partly address the CSR
and/or
the Member State has adopted measures that address the CSR, but a fair amount of work is still needed to fully address the CSR as only a few of the adopted measures have been implemented. For instance: adopted by national Parliament; by ministerial
decision; but no implementing decisions are in place.
Substantial progress: The Member State has adopted measures that go a long way in addressing the CSR and most of which have been implemented.
Full implementation: The Member State has implemented all measures needed to address the CSR appropriately.
ANNEX A
Overview Table
Commitments Summary assessment(69
)

A. Overview Table
40
…and strengthen further tax compliance and
collection.
Ensure that legislative initiatives do not undermine
legal certainty and do not put at risk financial
stability. If necessary, adopt measures that mitigate
such risks.
improvements with regard to the
compliance ratios for tax declarations and
payments for both natural persons and
companies compared to the previous year.
The tax administration (ANAF) and
Labour inspection maintained their efforts
in terms of inspections and audits, yet the
results are not better compared to last year.
ANAF introduced also an audience with
the applicant as an additional step before
issuing the final decision with regard to the
VAT registration. The legislation for the
registration and deregistration for VAT
purposes has been modified and clarified
again and the procedures for VAT
reimbursement were adapted, respectively,
in the course of 2016. The mandatory but
progressive introduction of electronic
cash-register connected to the National
Agency for Fiscal Administration (ANAF)
IT system is pursued, but further delays to
the official deadlines were introduced. To
tackle sectorial tax evasion, a special
annual income tax will replace corporate
income tax in specific business areas, such
as accommodation services and bars/
restaurants, from 2017. Irrespective of the
sales or the net profits of the business, the
tax to be paid will be computed based on
coefficients, such as the surface of
premises, the seasonality or the location of
the business. Moreover, as of 2017, self-
employed and family businesses will be
limited to the number of business activities
they can perform and in the number of
persons they can employ.
Some progress was made on safeguarding
financial stability. The law on debt
discharge ("datio in solutum") was
promulgated with retroactive application,
but a recent decision of the Constitutional
Court has mitigated some of the potential
risks on financial stability. The CHF-
denominated loan conversion law adopted
by Parliament may put strain on several
banks. However, before its enactment, the
law was sent to the Constitutional Court
for a constitutional heck.
CSR 2: Strengthen the National Employment
Agency's services to employers and jobseekers, in
Romania has made some progress in

A. Overview Table
41
particular by tailoring services to jobseeker profiles,
better linking them with social assistance, including
social services, and reaching out to unregistered
young people. Establish, in consultation with social
partners, objective criteria for setting the minimum
wage. Take action to prevent early school leaving and
increase the provision of quality education, in
particular among Roma. Adopt the equalisation of the
pension age for men and women.
Strengthen the National Employment Agency's
services to employers and jobseekers, in particular by
tailoring services to jobseeker profiles, better linking
them with social assistance, including social services,
and reaching out to unregistered young people.
addressing CSR2.
Substantial progress was made in
strengthening the National Employment
Agency's (NEA) services. The NEA is
undergoing a major change process
reflected in a strategy and including 1)
establishing for the first time an initial
profiling and segmentation process, which
became a working procedure and
legislation in October 2016 (most of the
people in NEA database have already been
profiled); 2) Adoption of a catalogue of
services, for the first time bringing
together the service offer of the
organisation towards jobseekers and
towards employers; 3) Reinforcement of
case management capacity - pilot project
developed in October/November; to be up-
scaled through the ESF; 4) Setting up an
integrated approach to NEETs outreach,
including a substantial increase in agency
staff for the delivery of the Youth
Guarantee- to be rolled out. The Youth
Guarantee has so far only partially reached
young NEETs. The NEA also plans to
reinforce its capacity to strengthen its
services for employers. The active labour
market policies have been revised to
provide more incentives for take up and
several disadvantaged groups benefit for
the first time from some ALMPs. A
national mobility plan aims to improve the
internal mobility. As regards linking
employment with social services, a pilot
project, financed with EU funds, will be
rolled out. This would target 100 deprived
communities and would set up integrated
teams that include social assistants,
community health assistants/mediators and
education counsellors/mediators. In the
long run, these integrated teams are
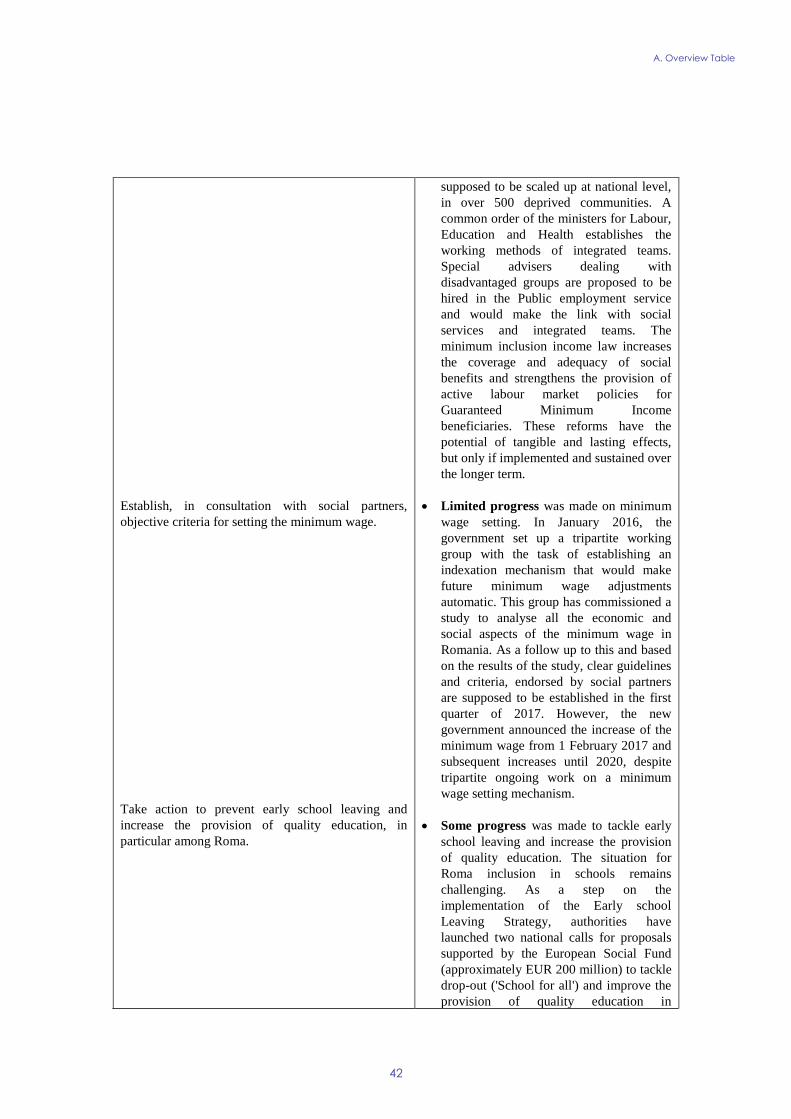
A. Overview Table
42
Establish, in consultation with social partners,
objective criteria for setting the minimum wage.
Take action to prevent early school leaving and
increase the provision of quality education, in
particular among Roma.
supposed to be scaled up at national level,
in over 500 deprived communities. A
common order of the ministers for Labour,
Education and Health establishes the
working methods of integrated teams.
Special advisers dealing with
disadvantaged groups are proposed to be
hired in the Public employment service
and would make the link with social
services and integrated teams. The
minimum inclusion income law increases
the coverage and adequacy of social
benefits and strengthens the provision of
active labour market policies for
Guaranteed Minimum Income
beneficiaries. These reforms have the
potential of tangible and lasting effects,
but only if implemented and sustained over
the longer term.
Limited progress was made on minimum
wage setting. In January 2016, the
government set up a tripartite working
group with the task of establishing an
indexation mechanism that would make
future minimum wage adjustments
automatic. This group has commissioned a
study to analyse all the economic and
social aspects of the minimum wage in
Romania. As a follow up to this and based
on the results of the study, clear guidelines
and criteria, endorsed by social partners
are supposed to be established in the first
quarter of 2017. However, the new
government announced the increase of the
minimum wage from 1 February 2017 and
subsequent increases until 2020, despite
tripartite ongoing work on a minimum
wage setting mechanism.
Some progress was made to tackle early
school leaving and increase the provision
of quality education. The situation for
Roma inclusion in schools remains
challenging. As a step on the
implementation of the Early school
Leaving Strategy, authorities have
launched two national calls for proposals
supported by the European Social Fund
(approximately EUR 200 million) to tackle
drop-out ('School for all') and improve the
provision of quality education in

A. Overview Table
43
disadvantaged schools ('Motivated
teachers in disadvantaged schools'). These
projects aim to address two of the main
drivers of early school leaving, namely
insufficient prevention measures and
insufficient provision of quality education.
'School for All' seeks to finance a wide
range of activities, including integrated
interventions for students and their parents,
after-school programmes, and
scholarships. The second call specifically
aims to increase teaching quality in
disadvantaged schools, in particular for
Roma and schools in rural areas. The
projects are now in the evaluation phase,
with implementation expected to start the
latest in September 2017. Therefore, the
impact on reducing drop-outs or increasing
teaching quality in disadvantaged school is
yet to be seen. Other recent measures to
tackle early school leaving include a warm
meal pilot programme running in 50
schools, and full reimbursement of
commuting costs for students from rural
areas. The methodology for teachers'
allowances was changed to include criteria
on working with children at risk of drop-
out (ministerial order from 22 December).
To support the participation of poor
children in pre-school education
(empirically shown to prevent early school
leaving) authorities are implementing the
programme 'Every child in kindergarten'
providing social vouchers on condition of
attendance. To improve take-up, the
application procedures were simplified.
Although the number of beneficiary
children who had not gone to kindergarten
before is increasing, it remains relatively
low (2 700 out of 67 000). Modernisation
of the curricula for pre-school education is
underway.
To increase quality in education,
authorities have also approved the
curricular frameworks for lower secondary
education (grades 5-8). The new
curriculum is expected to enter into force
in September for 5th
graders. However,
plans to reform the curricula high school

A. Overview Table
44
Adopt the equalisation of the pension age for men
and women.
education have been delayed.
To increase managerial capacities in
schools, a competition for school
principals was organized, albeit allowing
for some exceptions.
Anti-segregation legislation was improved
by expanding the criteria and
strengthening the responsibilities of school
inspectorates which is expected to lead to a
more inclusive education in schools for
Roma and other disadvantaged groups.
However, in the absence of monitoring
criteria progress has yet to be seen. While
a number of positive measures have been
initiated, these are unlikely to be sufficient
to address the challenge.
No progress was made on the
equalisation of the pensionable age for
men and women. The draft law submitted
to Parliament in 2013 has been adopted by
the Senate, but not by the lower Chamber.
CSR 3: Curb informal payments in the healthcare
system and increase the availability of outpatient
care. Strengthen the independence and transparency
of human resources management in the public
administration. Simplify administrative procedures
for business and the public. Strengthen corporate
governance of state-owned enterprises.
Curb informal payments in the healthcare system
Romania has made some progress addressing
CSR3.
Some progress was made with curbing
informal payments in the healthcare
system. In line with the new National Anti-
corruption Strategy for 2016-2020,
legislation was adopted in November 2016
to revamp the existing patient feedback
mechanism. In 2014, the Ministry of
Health put in place a patient feedback form
mechanism for reporting informal
payments. Reporting under the mechanism
was not reliable and is now being
revamped. The National Anti-corruption
Strategy for 2016-2020 adopted in August
planned to revise the existing patient
feedback mechanism to eliminate the
involvement of medical units in the
collection of information on patients'
experience. Consequently, new legislative
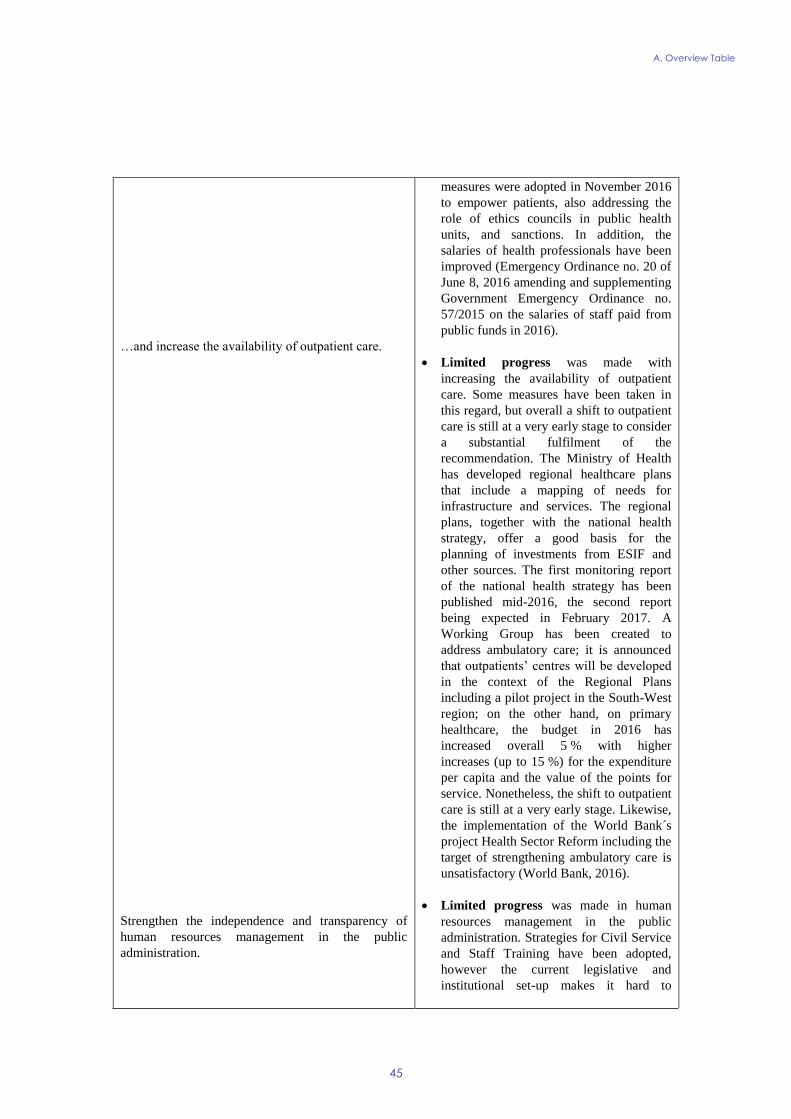
A. Overview Table
45
…and increase the availability of outpatient care.
Strengthen the independence and transparency of
human resources management in the public
administration.
measures were adopted in November 2016
to empower patients, also addressing the
role of ethics councils in public health
units, and sanctions. In addition, the
salaries of health professionals have been
improved (Emergency Ordinance no. 20 of
June 8, 2016 amending and supplementing
Government Emergency Ordinance no.
57/2015 on the salaries of staff paid from
public funds in 2016).
Limited progress was made with
increasing the availability of outpatient
care. Some measures have been taken in
this regard, but overall a shift to outpatient
care is still at a very early stage to consider
a substantial fulfilment of the
recommendation. The Ministry of Health
has developed regional healthcare plans
that include a mapping of needs for
infrastructure and services. The regional
plans, together with the national health
strategy, offer a good basis for the
planning of investments from ESIF and
other sources. The first monitoring report
of the national health strategy has been
published mid-2016, the second report
being expected in February 2017. A
Working Group has been created to
address ambulatory care; it is announced
that outpatients’ centres will be developed
in the context of the Regional Plans
including a pilot project in the South-West
region; on the other hand, on primary
healthcare, the budget in 2016 has
increased overall 5 % with higher
increases (up to 15 %) for the expenditure
per capita and the value of the points for
service. Nonetheless, the shift to outpatient
care is still at a very early stage. Likewise,
the implementation of the World Bank´s
project Health Sector Reform including the
target of strengthening ambulatory care is
unsatisfactory (World Bank, 2016).
Limited progress was made in human
resources management in the public
administration. Strategies for Civil Service
and Staff Training have been adopted,
however the current legislative and
institutional set-up makes it hard to

A. Overview Table
46
Simplify administrative procedures for business and
the public.
Strengthen corporate governance of state-owned
enterprises.
effectively implement.
Some progress was made on the
simplification of administrative procedures
for business and the public. Measures
taken in 2016 include emergency
ordinance n. 41/2016 to simplify
administrative procedures and facilitate
relations between citizens and the public
administration; and the adoption in
November 2016 of first elements of a
second legislative package, including
emergency ordinance 84/2016 amending
the Fiscal Procedure Code contains also
measures to simplify administrative
procedures for businesses, including e.g.
procedures to obtain a fiscal code, for the
reactivation of inactive taxpayers,
widening the use of remote means of
payment (e.g. home banking, mobile
banking) to pay taxes, wider provision of
e-tools to pay taxes and some specific fee
reductions; further development of the
RIA framework; introduction of income
tax exemptions for R&D tasks and
activities, and clarification of tasks and
activities exempt from income taxation for
IT professionals; adoption of OUG
35/2016 for the modification and
completion of the land registry law 7/1996,
important both for agriculture and for
infrastructure projects. The substantial
measures taken in 2016 to increase
transparency (public consultation and
debates on draft legislation etc), are being
reversed in 2017.
Substantial progress was made in SOEs
corporate governance. The bylaws
supporting Law 111/2016 on SOEs
corporate governance were adopted within
the deadline, in October 2016. As Law
111/2016 applies to all SOEs, the Ministry
of Finance started contacts with the larger
local authorities to improve awareness of
the new rules. The H1 2016 budget
execution of SOEs under the central
government was made public. However,
the hiring of professional managers has not
yet started raising concerns on the
implementation of law 111/2016.

A. Overview Table
47
CSR 4: Improve access to integrated public services,
extend basic infrastructure and foster economic
diversification, in particular in rural areas. Adopt and
implement the transport master plan. Strengthen
public investment project prioritisation and
preparation.
Improve access to integrated public services, extend
basic infrastructure and foster economic
diversification, in particular in rural areas.
Romania has made some progress addressing
CSR 4.
Despite delays, in 2016 there was some
progress with the completion of action
plans for ex-ante conditionality on health,
transport, public procurement and RD&I.
This has created a basis for strategic
planning of future ESIF investments in
infrastructure for public services and
SMEs. However, the institutional and
operational setup of ESIF programmes is
still not completed and a few key ex-ante
conditionality items are not yet fulfilled,
creating a risk of further delays in
implementation. 348 projects of a value of
252 million EUR (19% of allocation) for
investments in rural infrastructure (roads,
water supply/waste water systems,
education and social infrastructure) have
been contracted. In August 2016 the
government further launched a
comprehensive IT programme, developed
jointly with the private sector, to increase
the inter-operability across different levels
of administration and the quality of public
services (GovITHub). Some progress was
made on improving access to integrated
services in rural areas, marking a shift
from benefits towards service provision.
As part of a pilot project, integrated
services will be introduced in around 100
most marginalised communities, through
teams at community level, mostly in rural
areas. When scaled up, it can produce
substantial progress concerning the
provision of integrated services. ESF calls
at national level have been launched,
covering disadvantaged communities,
including in disadvantaged areas. A
comprehensive set of measures was
adopted in early 2016 aimed at improving
living standards, stimulating productivity
and economic diversification in the rural
areas. A set of measures was adopted in
2016 aimed at increasing the wealth in
rural areas and developing the rural middle
class. The Rural Development Programme

A. Overview Table
48
Adopt and implement the transport master plan.
Strengthen public investment project prioritisation
and preparation.
has started to be implemented. Additional
533 projects of a value of 49 MEUR (16%
of allocation) for investments in
diversification of economic activities and
setting-up of non-agricultural activities in
rural areas have been contracted. While
there is progress on contracting,
implementation of the projects on the
ground is just starting. Romania still has to
spend by 2023 around 1.2 BEUR for
investments in rural infrastructure and 275
MEUR for diversification of rural
economy.
Some progress. The Transport Master
Plan was adopted in September 2016. The
Railway Reform Authority, set-up in
October 2016 and expected to become
fully operational by mid-2017, should take
the necessary measures to make the
operation of railway transport more
efficient. To speed up of investments in
road infrastructure, the government has
also split the national authority in charge
of road construction into two bodies, one
for infrastructure investments (CNIR) and
one for infrastructure administration
(CNAIR). Performance contracts between
the national companies and the Ministry of
Transport are currently developed.
Limited progress was made with
strengthening public investment project
prioritisation and preparation. In August, a
change to the ordinance 88 obliged the line
ministries to take into account the public
investment priority list in the budget
preparation. However, no other steps have
been made to enhance the role of the
existing public investment prioritisation
unit in the Ministry of Finance and to
improve the prioritisation and preparation
of all public investment projects.
Europe 2020 (national targets and progress)
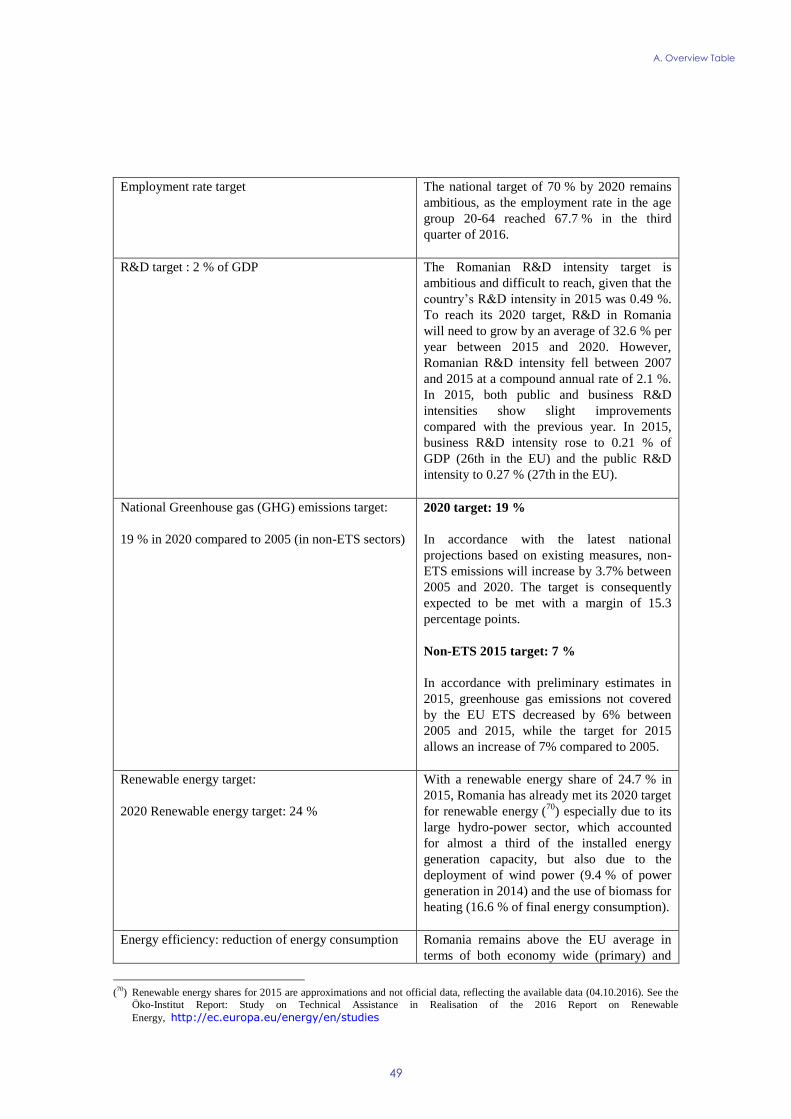
A. Overview Table
49
Employment rate target The national target of 70 % by 2020 remains
ambitious, as the employment rate in the age
group 20-64 reached 67.7 % in the third
quarter of 2016.
R&D target : 2 % of GDP The Romanian R&D intensity target is
ambitious and difficult to reach, given that the
country’s R&D intensity in 2015 was 0.49 %.
To reach its 2020 target, R&D in Romania
will need to grow by an average of 32.6 % per
year between 2015 and 2020. However,
Romanian R&D intensity fell between 2007
and 2015 at a compound annual rate of 2.1 %.
In 2015, both public and business R&D
intensities show slight improvements
compared with the previous year. In 2015,
business R&D intensity rose to 0.21 % of
GDP (26th in the EU) and the public R&D
intensity to 0.27 % (27th in the EU).
National Greenhouse gas (GHG) emissions target:
19 % in 2020 compared to 2005 (in non-ETS sectors)
2020 target: 19 %
In accordance with the latest national
projections based on existing measures, non-
ETS emissions will increase by 3.7% between
2005 and 2020. The target is consequently
expected to be met with a margin of 15.3
percentage points.
Non-ETS 2015 target: 7 %
In accordance with preliminary estimates in
2015, greenhouse gas emissions not covered
by the EU ETS decreased by 6% between
2005 and 2015, while the target for 2015
allows an increase of 7% compared to 2005.
Renewable energy target:
2020 Renewable energy target: 24 %
With a renewable energy share of 24.7 % in
2015, Romania has already met its 2020 target
for renewable energy (70
) especially due to its
large hydro-power sector, which accounted
for almost a third of the installed energy
generation capacity, but also due to the
deployment of wind power (9.4 % of power
generation in 2014) and the use of biomass for
heating (16.6 % of final energy consumption).
Energy efficiency: reduction of energy consumption Romania remains above the EU average in
terms of both economy wide (primary) and
(70) Renewable energy shares for 2015 are approximations and not official data, reflecting the available data (04.10.2016). See the
Öko-Institut Report: Study on Technical Assistance in Realisation of the 2016 Report on Renewable
Energy, http://ec.europa.eu/energy/en/studies

A. Overview Table
50
Romania's 2020 energy efficiency target is 43 Mtoe
expressed in primary energy consumption (30.3 Mtoe
expressed in final energy consumption.)
industrial energy intensity but has improved
more than most other Member States since
2005. Final energy consumption per capita in
households is below the EU average. In terms
of implementation of the Energy Efficiency
Directive Romania, the latter started with
some delay but made progress both in 2015
and 2016.
Romania increased its primary energy
consumption by 2.1 % from 30.64 Mtoe in
2014 to 31.29 Mtoe in 2015. Final energy
consumption increased by 1 % from 21.72
Mtoe in 2014 to 21.89 Mtoe in 2015. Even if
Romania has already achieved levels of
primary and final energy consumption which
are below the indicative national 2020 targets,
it would need to make an effort to keep these
levels until 2020.
Early school leaving target Romania made no progress on meeting the
target. Its early school leaving rate increased
further to 19.1 % in 2015. Romania has
among the highest early school leaving rates
in the EU and is getting further away from its
national Europe 2020 target.
Tertiary education target Romania made some progress on meeting the
target. Its tertiary attainment rate improved,
reaching 25.6 % in 2015, and is on track to
reach the Europe 2020 national target of
26.7 %.
Target on the reduction of population at risk of
poverty or social exclusion in number of persons:
Substantial progress was made in reducing the
population at risk of poverty or social
exclusion as compared with the national target
of 580 000 people. In absolute terms
1 680 000 people were lifted out of the risk of
poverty or social exclusion between 2008 and
2015.

51
Table B.1: The MIP scoreboard for Romania
Flags: p: provisional.
Notes: (1) Figures highlighted are those falling outside the threshold established in the European Commission's Alert
Mechanism Report. For REER and ULC, the first threshold applies to euro area Member States.
Source: European Commission
Thresholds 2010 2011 2012 2013 2014 2015
Current account balance,
(% of GDP) 3 year average -4%/6% -7.2 -4.9 -4.9 -3.6 -2.2 -1.0
-35% -63.4 -65.4 -67.4 -62.6 -57.3 -51.9
Real effective exchange
rate - 42 trading partners,
HICP deflator
3 years % change ±5% & ±11% -10.8 -3.3 -1.9 0.3 -1.1 2.7
Export market share - %
of world exports5 years % change -6% 53.8 50.6 13.1 14.6 20.8 21.1
Nominal unit labour cost
index (2010=100)3 years % change 9% & 12% 28.8 -0.5 -0.2b -3.2 7.3 0.5p
6% -13.8 -15.8 -9.1 -2.8 -3.2 1.7
14% 0.9 2.8 0.3 -1.4 -2.4 0.2
133% 73.9 72.9 71.9 66.6 62.1 59.1
60% 29.9 34.2 37.3 37.8 39.4 37.9
Unemployment rate 3 year average 10% 6.4 6.9 7.0 7.0 6.9 6.9
16.5% 5.0 4.6 4.4 0.8 1.2 4.1
-0.2% 1.9b 1.2 1.7 0.0 1.6 1.3
0.5% -0.8 0.5 0.8 0.8 -0.1 0.0
2% 2.8 6.3 2.6 1.6 0.1 -0.9
Activity rate - % of total population aged 15-64 (3 years
change in p.p)
Long-term unemployment rate - % of active population
aged 15-74 (3 years change in p.p)
Youth unemployment rate - % of active population aged
15-24 (3 years change in p.p)
External imbalances
and competitiveness
New employment
indicators
Net international investment position (% of GDP)
Deflated house prices (% y-o-y change)
Total financial sector liabilities (% y-o-y change)
Private sector credit flow as % of GDP, consolidated
Private sector debt as % of GDP, consolidated
General government sector debt as % of GDP
Internal imbalances
ANNEX B
MIP scoreboard indicators

52
ANNEX C
Standard Tables
Table C.1: Financial market indicators
1) Latest data Q2 2016.
2) Quarterly values are not annualised
* Measured in basis points.
Source: European Commission (long-term interest rates); World Bank (gross external debt); Eurostat (private debt); ECB (all
other indicators
2011 2012 2013 2014 2015 2016
Total assets of the banking sector (% of GDP) 68.9 68.3 63.4 60.2 57.6 54.8
Share of assets of the five largest banks (% of total assets) 54.6 54.7 54.4 54.2 57.4 -
Foreign ownership of banking system (% of total assets) 71.2 69.9 69.2 69.4 67.8 -
Financial soundness indicators:1)
- non-performing loans (% of total loans) 11.4 - 17.9 15.8 10.7 9.0
- capital adequacy ratio (%) 16.8 17.2 18.8 17.7 18.9 18.5
- return on equity (%)2) 0.2 -7.1 0.0 -15.2 11.3 6.0
Bank loans to the private sector (year-on-year % change) 7.6 -0.7 -3.5 -1.3 4.5 2.9
Lending for house purchase (year-on-year % change) 13.0 7.7 9.7 9.2 15.5 14.1
Loan to deposit ratio 118.6 113.9 100.8 90.0 85.3 83.3
Central Bank liquidity as % of liabilities 2.0 3.9 0.3 0.0 0.0 0.0
Private debt (% of GDP) 72.9 71.9 66.6 62.1 59.3 -
Gross external debt (% of GDP)1)
- public 16.7 19.1 20.7 21.8 19.6 18.3
- private 32.4 33.5 30.1 28.9 26.8 26.2
Long-term interest rate spread versus Bund (basis points)* 468.4 518.4 384.4 333.1 297.8 321.2
Credit default swap spreads for sovereign securities (5-year)* 279.8 310.5 180.4 137.4 110.0 105.9

C. Standard Tables
53
Table C.2: Labour market and social indicators
1 The unemployed persons are all those who were not employed but had actively sought work and were ready to begin
working immediately or within 2 weeks.
2 Long-term unemployed are those who have been unemployed for at least 12 months.
3 Not in education employment or training.
4 Average of first three quarters of 2016. Data for total unemployment and youth unemployment rates are seasonally
adjusted.
Source: European Commission
2011 2012 2013 2014 2015 2016 4
Employment rate
(% of population aged 20-64)63.8 64.8 64.7 65.7 66.0 66.3
Employment growth
(% change from previous year)-0.8 -4.8 -0.9 0.8 -0.9 -0.9
Employment rate of women
(% of female population aged 20-64)56.2 56.7 56.5 57.3 57.2 57.5
Employment rate of men
(% of male population aged 20-64)71.5 72.8 72.8 74.0 74.7 74.9
Employment rate of older workers
(% of population aged 55-64)39.9 41.6 41.8 43.1 41.1 42.8
Part-time employment (% of total employment,
aged 15-64)9.5 9.3 9.0 8.7 8.8 7.7
Fixed-term employment (% of employees with a fixed term
contract, aged 15-64)1.4 1.5 1.4 1.5 1.4 1.4
Transitions from temporary to permanent employment 58.2 55.8 59.2 58.3 51.9 :
Unemployment rate1 (% active population,
age group 15-74)7.2 6.8 7.1 6.8 6.8 6.1
Long-term unemployment rate2 (% of labour force) 2.9 3.0 3.2 2.8 3.0 3.1
Youth unemployment rate
(% active population aged 15-24)23.9 22.6 23.7 24.0 21.7 :
Youth NEET3 rate (% of population aged 15-24) 17.5 16.8 17.0 17.0 18.1 :
Early leavers from education and training (% of pop. aged 18-24
with at most lower sec. educ. and not in further education or
training)
18.1 17.8 17.3 18.1 19.1 :
Tertiary educational attainment (% of population aged 30-34
having successfully completed tertiary education)20.3 21.7 22.9 25.0 25.6 :
Formal childcare (30 hours or over; % of population aged less
than 3 years)1.0 4.0 1.0 1.0 : :

C. Standard Tables
54
Table C.3: Labour market and social indicators (continued)
1 People at risk of poverty or social exclusion : individuals who are at risk of poverty and/or suffering from severe material
deprivation and/or living in households with zero or very low work intensity.
2 At-risk-of-poverty rate : proportion of people with an equivalised disposable income below 60 % of the national equivalised
median income.
3 Proportion of people who experience at least four of the following forms of deprivation: not being able to afford to i) pay
their rent or utility bills, ii) keep their home adequately warm, iii) face unexpected expenses, iv) eat meat, fish or a protein
equivalent every second day, v) enjoy a week of holiday away from home once a year, vi) have a car, vii) have a washing
machine, viii) have a colour TV, or ix) have a telephone.
4 People living in households with very low work intensity: proportion of people aged 0-59 living in households where the
adults (excluding dependent children) worked less than 20 % of their total work-time potential in the previous 12 months.
5 For EE, CY, MT, SI and SK, thresholds in nominal values in euros; harmonised index of consumer prices = 100 in 2006 (2007
survey refers to 2006 incomes)
Source: For expenditure for social protection benefits ESSPROS; for social inclusion EU-SILC.
Expenditure on social protection benefits (% of GDP) 2010 2011 2012 2013 2014 2015
Sickness/healthcare 4.3 4.0 4.0 3.9 3.9 :
Disability 1.6 1.4 1.2 1.1 1.1 :
Old age and survivors 8.7 8.6 8.2 8.0 8.0 :
Family/children 1.7 1.7 1.3 1.2 1.2 :
Unemployment 0.6 0.3 0.2 0.2 0.1 :
Housing 0.0 0.0 0.0 0.0 0.0 :
Social exclusion n.e.c. 0.3 0.2 0.2 0.2 0.2 :
Total 17.1 16.2 15.2 14.6 14.4 :
of which: means-tested benefits 1.2 0.8 0.6 0.6 0.6 :
Social inclusion indicators 2010 2011 2012 2013 2014 2015
People at risk of poverty or social exclusion1
(% of total population)41.5 40.9 43.2 41.9 40.3 37.4
Children at risk of poverty or social exclusion
(% of people aged 0-17) 48.1 49.2 52.5 51.4 50.7 46.8
At-risk-of-poverty rate2 (% of total population) 21.6 22.3 22.9 23.0 25.1 25.4
Severe material deprivation rate3 (% of total population) 30.5 29.5 31.1 29.8 25.9 22.7
Proportion of people living in low work intensity households4 (% of
people aged 0-59)7.7 7.3 7.9 7.6 7.2 7.9
In-work at-risk-of-poverty rate (% of persons employed) 17.9 19.1 19.0 18.4 19.8 18.8
Impact of social transfers (excluding pensions) on reducing poverty 22.3 23.6 20.5 18.4 12.8 13.3
Poverty thresholds, expressed in national currency at constant prices5 4334 4167 3884 3888 3991 4253
Gross disposable income (households; growth %) 3.9 0.9 1.2 36.5 -20.6 8.6
Inequality of income distribution (S80/S20 income quintile share ratio) 6.1 6.2 6.6 6.8 7.2 8.3
GINI coefficient before taxes and transfers 51.9 52.1 53.2 51.8 52.1 :
GINI coefficient after taxes and transfers 33.4 33.3 33.2 34.0 34.7 :
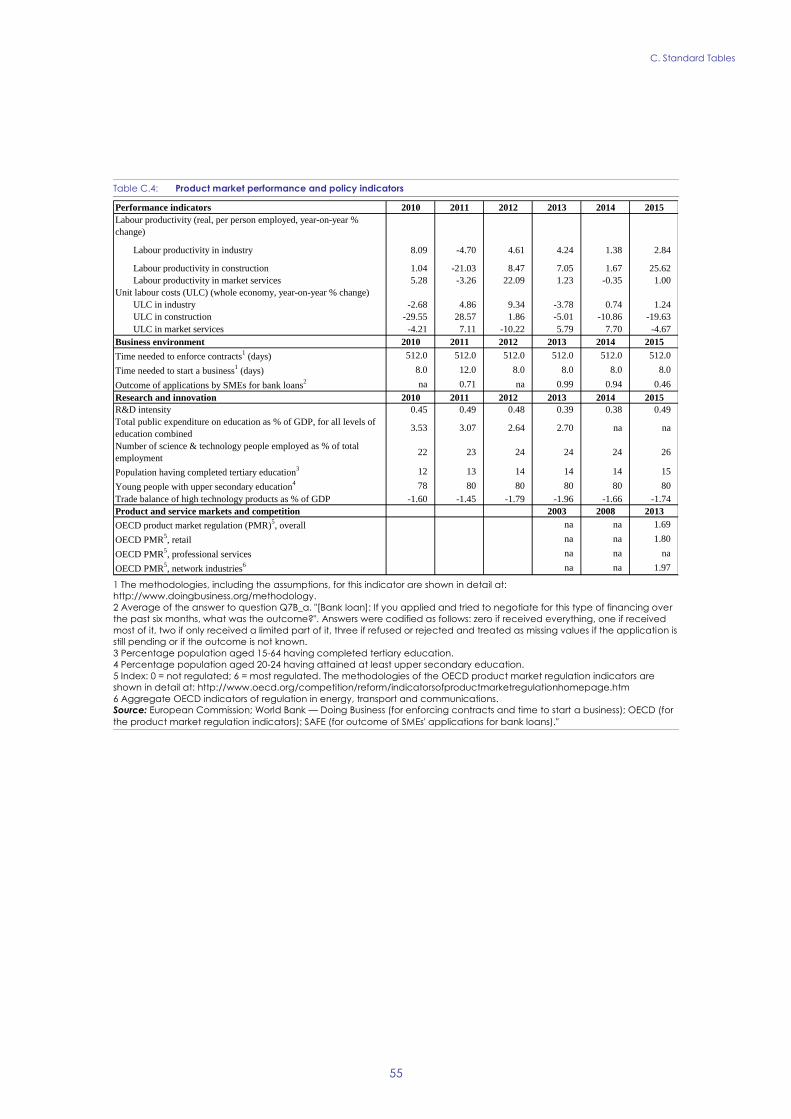
C. Standard Tables
55
Table C.4: Product market performance and policy indicators
1 The methodologies, including the assumptions, for this indicator are shown in detail at:
http://www.doingbusiness.org/methodology.
2 Average of the answer to question Q7B_a. "[Bank loan]: If you applied and tried to negotiate for this type of financing over
the past six months, what was the outcome?". Answers were codified as follows: zero if received everything, one if received
most of it, two if only received a limited part of it, three if refused or rejected and treated as missing values if the application is
still pending or if the outcome is not known.
3 Percentage population aged 15-64 having completed tertiary education.
4 Percentage population aged 20-24 having attained at least upper secondary education.
5 Index: 0 = not regulated; 6 = most regulated. The methodologies of the OECD product market regulation indicators are
shown in detail at: http://www.oecd.org/competition/reform/indicatorsofproductmarketregulationhomepage.htm
6 Aggregate OECD indicators of regulation in energy, transport and communications.
Source: European Commission; World Bank — Doing Business (for enforcing contracts and time to start a business); OECD (for
the product market regulation indicators); SAFE (for outcome of SMEs' applications for bank loans)."
Performance indicators 2010 2011 2012 2013 2014 2015
Labour productivity (real, per person employed, year-on-year %
change)
Labour productivity in industry 8.09 -4.70 4.61 4.24 1.38 2.84
Labour productivity in construction 1.04 -21.03 8.47 7.05 1.67 25.62
Labour productivity in market services 5.28 -3.26 22.09 1.23 -0.35 1.00
Unit labour costs (ULC) (whole economy, year-on-year % change)
ULC in industry -2.68 4.86 9.34 -3.78 0.74 1.24
ULC in construction -29.55 28.57 1.86 -5.01 -10.86 -19.63
ULC in market services -4.21 7.11 -10.22 5.79 7.70 -4.67
Business environment 2010 2011 2012 2013 2014 2015
Time needed to enforce contracts1 (days) 512.0 512.0 512.0 512.0 512.0 512.0
Time needed to start a business1 (days) 8.0 12.0 8.0 8.0 8.0 8.0
Outcome of applications by SMEs for bank loans2 na 0.71 na 0.99 0.94 0.46
Research and innovation 2010 2011 2012 2013 2014 2015
R&D intensity 0.45 0.49 0.48 0.39 0.38 0.49
Total public expenditure on education as % of GDP, for all levels of
education combined3.53 3.07 2.64 2.70 na na
Number of science & technology people employed as % of total
employment22 23 24 24 24 26
Population having completed tertiary education3 12 13 14 14 14 15
Young people with upper secondary education4 78 80 80 80 80 80
Trade balance of high technology products as % of GDP -1.60 -1.45 -1.79 -1.96 -1.66 -1.74
Product and service markets and competition 2003 2008 2013
OECD product market regulation (PMR)5, overall na na 1.69
OECD PMR5, retail na na 1.80
OECD PMR5, professional services na na na
OECD PMR5, network industries
6 na na 1.97

C. Standard Tables
56
Table C.5: Green growth
All macro intensity indicators are expressed as a ratio of a physical quantity to GDP (in 2005 prices).
Energy intensity: gross inland energy consumption (in kgoe) divided by GDP (in EUR).
Carbon intensity: greenhouse gas emissions (in kg CO2 equivalents) divided by GDP (in EUR).
Resource intensity: domestic material consumption (in kg) divided by GDP (in EUR).
Waste intensity: waste (in kg) divided by GDP (in EUR).
Energy balance of trade: the balance of energy exports and imports, expressed as % of GDP.
Weighting of energy in HICP: the proportion of "energy" items in the consumption basket used for the construction of the HICP
Difference between energy price change and inflation: energy component of HICP, and total HICP inflation (annual % ch.).
Real unit energy cost: real energy costs as a percentage of total value added for the economy.
Environmental taxes over labour taxes and GDP: from European Commission's database, ‘Taxation trends in the EU’.
Industry energy intensity: final energy consumption of industry (in kgoe) divided by gross value added of industry (in 2005 EUR)
Real unit energy costs for manufacturing industry excluding refining : real costs as a percentage of value added for
manufacturing sectors.
Share of energy-intensive industries in the economy: share of gross value added of the energy-intensive industries in GDP.
Electricity and gas prices for medium-sized industrial users: consumption band 500–20 00MWh and 10 000–100 000 GJ; figures
excl. VAT.
Recycling rate of municipal waste: ratio of recycled and composted municipal waste to total municipal waste.
Public R&D for energy or for the environment: government spending on R&D for these categories as % of GDP.
Proportion of greenhouse gas (GHG) emissions covered by EU Emissions Trading System (ETS) (excluding aviation): based on
greenhouse gas emissions (excl land use, land use change and forestry) as reported by Member States to the European
Environment Agency.
Transport energy intensity: final energy consumption of transport activity (kgoe) divided by transport industry gross value
added (in 2005 EUR).
Transport carbon intensity: GHG emissions in transport activity divided by gross value added of the transport sector.
Energy import dependency: net energy imports divided by gross inland energy consumption incl. consumption of
international bunker fuels.
Aggregated supplier concentration index: covers oil, gas and coal. Smaller values indicate larger diversification and hence
lower risk.
Diversification of the energy mix: Herfindahl index over natural gas, total petrol products, nuclear heat, renewable energies
and solid fuels.
Source: European Commission; * European Commission and European Environment Agency
Green growth performance 2010 2011 2012 2013 2014 2015
Macroeconomic
Energy intensity kgoe / € 0.28 0.29 0.27 0.24 0.23 0.23
Carbon intensity kg / € 1.29 1.33 1.30 1.15 1.11 -
Resource intensity (reciprocal of resource productivity) kg / € 4.32 4.81 4.65 4.52 4.18 4.42
Waste intensity kg / € 2.37 - 2.83 - - -
Energy balance of trade % GDP -2.2 -2.7 -3.0 -1.9 -1.4 -
Weighting of energy in HICP % 16.88 17.77 12.52 12.44 12.21 12.25
Difference between energy price change and inflation % -2.0 1.0 1.3 5.0 0.1 2.8
Real unit of energy cost% of value
added19.4 24.9 25.6 23.6 22.6 -
Ratio of environmental taxes to labour taxes ratio 0.19 0.18 0.18 0.19 0.22 -
Environmental taxes % GDP 2.1 1.9 2.0 2.0 2.4 -
Sectoral
Industry energy intensity kgoe / € 0.28 0.29 0.30 0.27 0.29 0.27
Real unit energy cost for manufacturing industry excl.
refining
% of value
added19.3 21.0 22.7 21.7 21.4 -
Share of energy-intensive industries in the economy % GDP 10.92 10.67 9.83 9.39 8.99 9.38
Electricity prices for medium-sized industrial users € / kWh 0.08 0.08 0.08 0.09 0.08 0.08
Gas prices for medium-sized industrial users € / kWh 0.02 0.02 0.03 0.03 0.03 0.03
Public R&D for energy % GDP 0.01 0.02 0.01 0.01 0.02 0.01
Public R&D for environmental protection % GDP 0.03 0.02 0.02 0.02 0.01 0.01
Municipal waste recycling rate % 12.8 11.7 14.8 13.2 13.0 -
Share of GHG emissions covered by ETS* % 45.9 47.0 44.6 38.0 38.2 37.7
Transport energy intensity kgoe / € 0.92 1.08 0.98 0.90 0.94 0.83
Transport carbon intensity kg / € 2.56 2.91 2.73 2.55 2.67 -
Security of energy supply
Energy import dependency % 21.9 21.6 22.7 18.5 17.1 17.1
Aggregated supplier concentration index HHI 20.5 16.7 12.4 12.8 14.1 -
Diversification of energy mix HHI 0.23 0.23 0.23 0.23 0.23 -

57
Arnold, J. (2008), Do Tax Structures Affect Aggregate Economic Growth? Empirical Evidence from a
Panel of OECD Countries, OECD Economics Department Working Papers 643, OECD Publishing
Arpaia, A. and A. Kiss (2015), Benchmarks for the assessment of wage developments. Spring 2015, DG
Employment, Social Affairs and Inclusion, Analytical Web Notes 2/2015
Bertelsmann Stiftung (2016), Policy Performance and Governance Capacities in the OECD and EU,
Sustainable Governance Indicators
CASE et al. (2016), Study and Reports on the VAT Gap in the EU-28 Member States: 2016 Final Report,
TAXUD/2015/CC/131
CEDEFOP (2016a), Skills shortages and surplus occupations in Europe, available at:
http://www.cedefop.europa.eu/en/publications-and-resources/publications/9115
CEDEFOP (2016b), EU Skills panorama, available at:
http://skillspanorama.cedefop.europa.eu/en/countries/romania
DNA (National Anticorruption Directorate) (2016), Annual Report, available at:
http://www.pna.ro/faces/comunicat.xhtml?id=7128
European Commission (2017a), EU Justice Scoreboard, Communication from the Commission to the
European Parliament, the Council, the European Central Bank, the European Economic and Social
Committee and the Committee of the Regions (forthcoming)
European Commission (2017b), Consumer Conditions Scoreboard, 2017 edition (forthcoming)
European Commission (2017c), Report on progress in Romania under the Cooperation and Verification
Mechanism – COM(2017) 44 and SWD(2017) 25, available at :
https://ec.europa.eu/info/effective-justice/rule-law/assistance-bulgaria-and-
romania-under-cvm/reports-progress-bulgaria-and-romania_en
European Commission (2016a), Country Report Romania 2016 SWD (2016) 91 final
European Commission (2016b), EU Tax Policies: 2016 Scoreboard, Publications Office of the European
Union, Luxembourg
European Commission (2016c), Joint Report on Health Care and Long-Term Care Systems & Fiscal
Sustainability, Country Document Romania, available at:
http://ec.europa.eu/economy_finance/publications/eeip/pdf/ip037bycountry/joint-
report_ro_en.pdf
European Commission (2016d), Open data maturity in Europe, available at:
https://www.europeandataportal.eu/sites/default/files/edp_landscaping_insight_rep
ort_n2_2016.pdf
European Commission (2016e), Report from the Commission to the European Parliament and the
Council on Progress in Romania under the Co-operation and Verification Mechanism, COM (2016) 41
final
European Commission (2016f), Taxation trends in the European Union, Publications Office of the
European Union, Luxembourg
REFERENCES

References
58
European Commission (2016g), Tax Policies in the European Union 2016 Survey, Publications Office of
the European Union, Luxembourg
European Commission (2016h), Education and Training Monitor, available at:
https://ec.europa.eu/education/sites/education/files/monitor2016-ro_en.pdf
European Commission (2016i), The Youth Guarantee and Youth Employment Initiative three years on,
Staff Working Document, available at http://eur-
lex.europa.eu/resource.html?uri=cellar:73591c12-8afc-11e6-b955-01aa75ed71a1.0001.02/DOC_2&format=PDF and http://eur-
lex.europa.eu/resource.html?uri=cellar:73591c12-8afc-11e6-b955-
01aa75ed71a1.0001.02/DOC_1&format=PDF
European Commission (2016j), European Innovation Scoreboard 2016, Publications Office of the
European Union, Luxembourg
European Commission (2015a), Challenges to Member States’ Investment Environments, Staff working
document, available at:
http://ec.europa.eu/europe2020/pdf/2016/ags2016_challenges_romania_en.pdf
http://ec.europa.eu/europe2020/pdf/csr2016/cr2016_romania_en.pdf
Eco-Innovation Observatory (2015b), Country Brief 2015 Romania, available at: http://www.eco-
innovation.eu/images/stories/2015_country_reports/romania_eco-
innovation_2015.pdf
European Commission (2015c), Employment and Social Developments in Europe, available at:
http://ec.europa.eu/social/main.jsp?catId=738&langId=en&pubId=7859&furtherPu
bs=yes
European Commission (2012), Fiscal frameworks across Member States: Commission services country
fiches from the 2011 EPC peer review, Romania country fiche, Occasional paper 91, February2012
European Union Agency for Fundamental Rights (FRA) (2016), Second European Union Minorities and
Discrimination Survey: Roma – Selected findings
Eurostat (2016), Statistics on young people neither in employment nor in education or training, available
at: http://ec.europa.eu/eurostat/statistics-
explained/index.php/Statistics_on_young_people_neither_in_employment_nor_in_e
ducation_or_training
OECD (2016), Public Governance Reviews, Romania Scan
OECD/EU (2016), Health at a Glance: Europe 2016: State of Health in the EU Cycle, OECD Publishing,
Paris, available at: http://dx.doi.org/10.1787/9789264265592-en
Manpower Group (2015), Talent Shortage Survey, available at:
http://www.manpowergroup.com/wps/wcm/connect/db23c560-08b6-485f-9bf6-
f5f38a43c76a/2015_Talent_Shortage_Survey_US-lo_res.pdf?MOD=AJPERES
Marrez, H. (2015), The role of state-owned enterprises in Romania, ECFIN Country Focus
References
59
Ministry of Health of Romania and AID ROMANIA (2015), Cercetare Națională Partea a II-a Percepţii
Asupra Corupţiei Din Sănătate, available at: http://www.aid-romania.org/wp-
content/uploads/2015/02/RAPORT-SONDAJ-SANATATEA-PARTEA-2-2015-02-11-PT-
COMUNICAT1.pdf
World Bank (2014a), Atlas marginalized rural areas and local human development in Romania, available
at: http://documents.worldbank.org/curated/en/847151467202306122/Atlas-
marginalized-rural-areas-and-local-human-development-in-Romania
World Bank (2014b), Diagnostics and policy advice for supporting Roma inclusion in Romania, available
at:http://documents.worldbank.org/curated/en/599081468094457693/pdf/896210
WP0OutputEN0Box0385289B00PUBLIC0.pdf
World Bank (2017), Portraits of Labour Market Exclusion 2.0 (forthcoming)
World Economic Forum (2017), Global Competitiveness Index 2016-2017, available at:
https://www.weforum.org/reports/the-global-competitiveness-report-2016-2017-1
World Economic Forum (2014), The Global Competitiveness Report 2014-2015, available at:
http://www3.weforum.org/docs/WEF_GlobalCompetitivenessReport_2014-15.pdf