2017 employee survey state of michigan€¦ · pwc | 2017 employee survey table of contents...
TRANSCRIPT
2017 Employee Survey
State of Michigan
www.pwc.com/peopleanalytics

PwC | 2017 Employee Survey
Table of contents
Overview 3-6
State of Michigan 2017 Employee Survey 3
Employee engagement 4
Methodology 5
Response rates 6
Summary and results 7-27
Highlights and key findings 7
Employee landscape 15
Driver matrix 18
Barriers to productivity 24
Comment overview 27
Next steps 28
Appendix 29-49
Survey results by theme 30
Long-term trends 38
Intent to stay 42
Response profile and demographics 44
Heat Map 47
2

PwC | 2017 Employee Survey
Overview | State of Michigan 2017 Employee Survey
Survey objectives
The State of Michigan 2017 Employee Survey is an important part of the Governor’s reinvention of state government. The surveyhelps ensure a customer-focused government and a work culture in which employees are highly engaged, respected, and valued; and have the opportunity to express and explore views on issues related to their jobs.
The survey was first administered in 2012 and again in 2013, 2015, and 2017. The 2012 survey provided a baseline; the 2013 survey allowed us to see what impact the action plans had on employees’ views of leadership, communication and engagement; and the 2015survey provided evidence that together we are positively changing the culture in the State of Michigan. It is now time to assess how well we have maintained that momentum and where we need to make further improvements.
Specific objectives for the 2017 survey are:
• Measure employee perceptions of their job, leadership, communications, colleagues, inclusion, and their engagement across the State of Michigan (SoM)
• Identify and evaluate areas where there have been changes from 2015 to 2017 in key measures within the state as a whole, individual agencies, or various organizational or demographic groups
• For those agencies who have demonstrated the greatest improvement in their measures, review their change management activities for best practices that can be leveraged by others
• Determine areas where employees still indicate the greatest need for change, and use that information to accelerate corrective actions
• Validate for employees that their views are heard, acted upon, and that leadership is held accountable for addressing those issues that are important to employees
• Utilize industry benchmark data for comparison purposes and for establishing new goals
• Determine follow-up actions to increase engagement, further an environment of inclusion, and support the goals of Good Government
3

PwC | 2017 Employee Survey
Overview | Employee engagement
Advocacy Commitment Discretionary effort
Pride Achievement Alignment
• I would recommend the State of Michigan to friends and family as a great place to work.
• I intend to stay with the State of Michigan for at least another 12 months.
• My colleagues go beyond what is expected for the success of the State of Michigan.
• I am proud to work for the State of Michigan.
• My colleagues are passionate about providing exceptional customer service.
• I understand how my job contributes to the mission of the State of Michigan.
Engagement
4
What is employee engagement?
Employee engagement is the strong and positive connection between a person and his or her job. It inspires significant outcomes of real value. When our employees are truly engaged, the State of Michigan reaches its full potential.
Specifically, employee engagement encompasses:
• The extent to which employees have a desire to act and apply discretionary effort to drive business outcomes
• More than satisfaction, includes involvement or “buy-in”
• Employees that are more likely to want to stay with the organization and invest discretionary effort
• Better outcomes, such as higher levels of customer satisfaction

PwC | 2017 Employee Survey
Overview | Methodology
5
Survey methodology
• One questionnaire was deployed via the web to 45,504 State of Michigan (SoM) and MEDC employees:
- Survey Administration: from February 6 to February 28, 2017
• Survey items are on a 5-point scale (1 = Strongly Disagree, 2 = Disagree, 3 = Neutral, 4 = Agree, 5 = Strongly Agree)
- Agree score is the percentage of responses that are a 4 or 5 (Agree or Strongly Agree)
- The higher the reported Agree score, the more favorable the result
- 57 core items were included along with one barriers to productivity question, and 7 open-ended questions
• Minimum of 10 respondents required for each group to be reported separately
• All survey responses are anonymous
• Results in this report are shown for 2017 compared to 2015, where possible. In some cases, a comparison to 2013 & 2012 is shown
• In this report, benchmarks cover organizations that are customer focused and high performing, both of which are tenets of reinvention:
- The Services Industry benchmark, representing a variety of services organizations, such as professional and travel/hospitality
- The High Performing benchmark, representing leading organizations in their respective industries (Manufacturing, Services, Healthcare/Hospital, Retail, Telecommunications, and Utilities) that have shown sustained financial success/growth
• Survey questionnaire included standard demographic questions and questions measuring:
- Employee Engagement
- Diversity & Inclusion
- Department Communications
- Department Leadership
- My Immediate Supervisor
- My Workgroup/Colleagues
- My Job

PwC | 2017 Employee Survey
Overview | Response rates
Note: Demographics including Agency and organizational levels were self-selected by survey participants
* Rates include UIA respondents
Invited 2017# of Surveys
completed 2017Response rate 2017
Response rate 2015
Response rate 2013
Response rate 2012
State of Michigan Overall SoM 45,504 34,385 76% 71% 68% 58%
Governor's Office GOV 75 75 100% 100% 99% 98%
Agriculture & Rural Development MDARD 436 428 98% 92% 88% 81%
Gaming Control Board MGCB 143 135 94% 94% 74% 91%
State Police MSP 2,854 2,656 93% 95% 88% 68%
Technology, Management, and Budget DTMB 3,011 2,727 91% 88% 72% 66%
Insurance and Financial Services DIFS 304 267 88% 94% 78% N/A
Natural Resources DNR 1,487 1,286 86% 86% 84% 69%
Licensing & Regulatory Affairs LARA 1,996 1,692 85% 87% 72%* 63%*
Civil Rights MDCR 86 72 84% 90% 71% 62%
Education MDE 520 419 81% 85% 86% 79%
Transportation MDOT 2,813 2,238 80% 75% 67% 60%
Civil Service Commission CSC 430 340 79% 78% 72% 68%
Treasury TREAS 1,353 1,069 79% 74% 82% 78%
Environmental Quality DEQ 1,140 892 78% 83% 81% 81%
Talent and Economic Development TED 1,394 1,086 78% 72% N/A N/A
Lottery LOTT 205 153 75% 82% 84% 68%
Michigan Veterans Affairs Agency MVAA 441 323 73% 57% 61% N/A
Corrections MDOC 12,325 8,850 72% 71% 56% 48%
Talent Investment Agency TIA 823 582 71% 59% N/A N/A
Health and Human Services DHHS 14,163 9,458 67% 56% 60% 51%
Military & Veterans Affairs DMVA 328 219 67% 61% 69% 30%
6
Note: Table is sorted by 2017 response rate

PwC | 2017 Employee Survey
Summary | Highlights
Employee engagement continues to improve year over year and the percent of Champions have notably increased as well. These gains are a testament to the hard work and deliberate actions that have taken place across the State of Michigan.
7
Measure State of Michigan 2017
State of Michigan 2015
State of Michigan 2013
State of Michigan 2012
Services benchmark
High performing benchmark
Employee engagement score% Agree
76% 72% 70% 69% 76% 80%
Employee engagement index 4.01 3.91 3.83 3.79 3.92 3.97
Champions 54% 48% 42% 40% 53% 52%
Agree score 65% 61% 60% 58% 72% 74%
Tenants: 3%
(N = 1,081)
2015: 3%
2013: 2%
2012: 2%
Champions: 54%
(N = 18,463)
2015: 48%
2013: 42%
2012: 40%
Captives: 34%
(N = 11,753)
2015: 39%
2013: 45%
2012: 48%
Disconnected: 9%
(N = 3,084)
2015: 10%
2013: 11%
2012: 10%
Likelihood of Staying
Low High
Low
High
Le
ve
l o
f E
ng
ag
em
en
t
Note: Reference page 15 for more detail

PwC | 2017 Employee Survey
Summary | Findings
Improvement
• At an overall level 55 survey items improved in favorability, while 1 declined, and 1 item remained the same
• 15 Agencies saw an increase in engagement, while 3 agencies declined (DEQ, MVAA, TIA), and 3 remained the same (MDE, LOTT, TED)
• 16 Agencies improved in percent of Champions, while 4 declined (DEQ, MDE, MVAA, LOTT) and 1 remained the same (GOV)
• 7 Agencies increased their Champions percentage by 7% or more (CSC, DHHS, DIFS, DMVA, LARA, MDCR, MDOC)
• 17 Agencies decreased their Captive population, while 3 increased (DEQ, GOV, LOTT), and 1 remained the same (MDE)
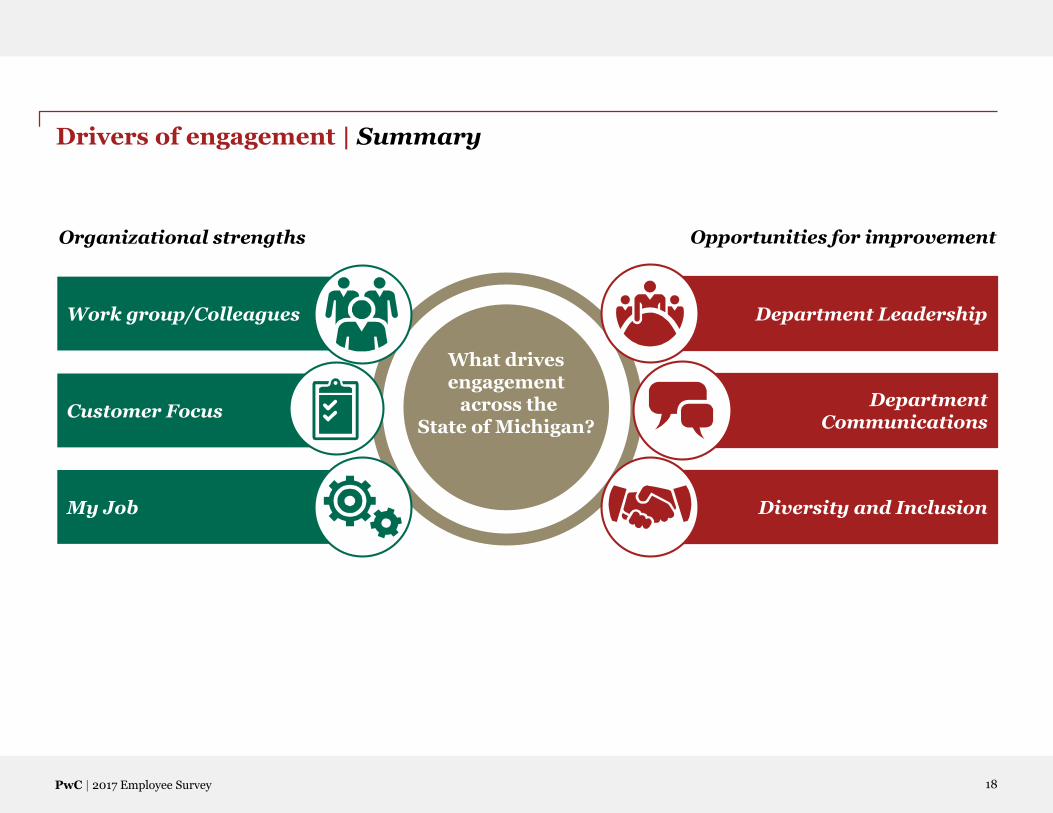
Drivers of engagement
• Workgroup/colleagues, customer service, and the job itself are consistently positive drivers of engagement
• Department leadership, department communications, and diversity & inclusion remain very important to overall employee engagement. Improvement has been made across these areas, however a sustained focus on these areas will foster greater improvement
Impact of action
• Continue to take advantage of opportunities to connect action planning efforts with survey feedback to increase employee awareness of these efforts as 33% of employees are currently making the connection between survey feedback and action
Barriers to productivity
• Although there has been an improvement in scores, employees across the State of Michigan continue to feel that a lack of sufficient staff to complete the work is the primary barrier to productivity (42% selected vs 46% in 2015). Unnecessary paperwork is the second barrier most frequently cited (29% selected vs 28% in 2015)
8

PwC | 2017 Employee Survey
Summary | Findings
15 of 21 agencies have improved their engagement scores compared to 2015, with Civil Rights, LARA, MDOC and DHHS experiencingthe greatest increases.
60% 70% 80% 90%
TIA, 71%(-1.39%, change)
2017 Engagement Score
% C
ha
ng
e f
ro
m 2
015
-6%
LARA, 80%(9.59% change)
MDOC, 65%(8.33% change)
DTMB, 83%(5.06% change)
MSP, 90%(1.12% change)
MDOT, 78%(4.00% change) DNR, 85%
(2.41% change)
TED, 76%(0.00%, change)
TREAS, 77%(2.67% change)
DEQ, 78%(-2.50%, change)
MDARD, 81%(2.53%, change)
MDE, 81%(0.00%, change)
CSC, 86%(6.17% change)
MVAA, 73%(-5.19% change)
DIFS, 82%(5.13% change)
DHHS, 76%(7.04% change)
DMVA, 77%(5.48% change)
LOTT, 83%(0.00%, change)
MGCB, 84%(1.20% change)
GOV, 93%(4.49% change)
MDCR, 72%(14.29% change)
The graph above shows the percent change in engagement from 2017 to 2015 for each Agency, plotted against its 2017 Engagement Score. The size of the circles represents the size of each Agency’s response population from the 2017 survey
+15%
9
PwC | 2017 Employee Survey
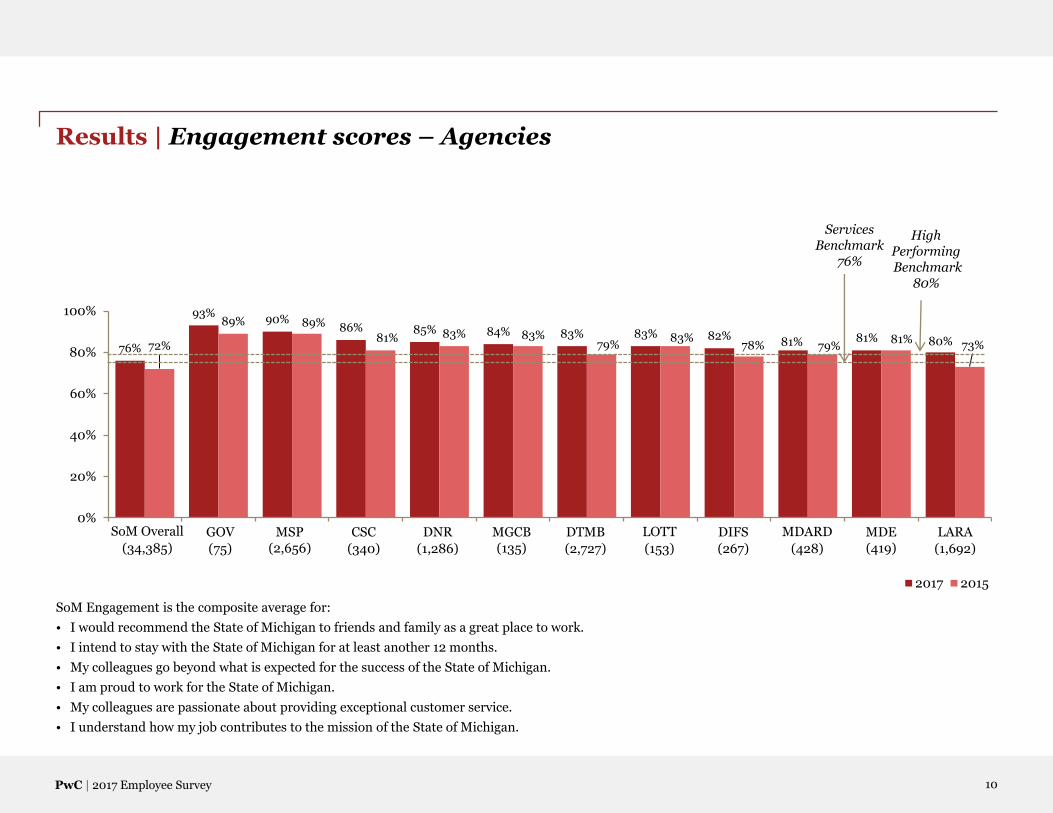
Results | Engagement scores – Agencies
76%
93%90%
86% 85% 84% 83% 83% 82%81% 81% 80%72%
89% 89%
81% 83% 83%79%
83%78% 79%
81%73%
0%
20%
40%
60%
80%
100%
2017 2015
Services Benchmark
76%
High PerformingBenchmark
80%
SoM Engagement is the composite average for:
• I would recommend the State of Michigan to friends and family as a great place to work.
• I intend to stay with the State of Michigan for at least another 12 months.
• My colleagues go beyond what is expected for the success of the State of Michigan.
• I am proud to work for the State of Michigan.
• My colleagues are passionate about providing exceptional customer service.
• I understand how my job contributes to the mission of the State of Michigan.
SoM Overall GOV MSP CSC DNR MGCB DTMB LOTT DIFS MDARD MDE LARA
(34,385) (75) (2,656) (340) (1,286) (135) (2,727) (153) (267) (428) (419) (1,692)
10

PwC | 2017 Employee Survey
Results | Engagement scores – Agencies (continued)
76% 78% 78% 77% 77% 76% 76%73%
72%71%
65%
72%80% 75% 73% 75% 71% 76% 77%
63%
72%
60%
0%
20%
40%
60%
80%
100%
2017 2015
SoM Overall DEQ MDOT DMVA TREAS DHHS TED MVAA MDCR TIA MDOC
(34,385) (892) (2,238) (219) (1,069) (9,458) (1,086) (323) (72) (582) (8,850)
11
High PerformingBenchmark
80%
Services Benchmark
76%
SoM Engagement is the composite average for:
• I would recommend the State of Michigan to friends and family as a great place to work.
• I intend to stay with the State of Michigan for at least another 12 months.
• My colleagues go beyond what is expected for the success of the State of Michigan.
• I am proud to work for the State of Michigan.
• My colleagues are passionate about providing exceptional customer service.
• I understand how my job contributes to the mission of the State of Michigan.

PwC | 2017 Employee Survey
65%
86%
80%77% 76% 75% 74% 73% 72% 71% 70% 69%
61%
82%79% 77%
73% 69% 73% 69% 69%
66% 67%61%
0%
20%
40%
60%
80%
100%
2017 2015
Results | Agree scores – Agencies
SoM Overall GOV MSP MGCB CSC DTMB LOTT DIFS DNR MDOT MDARD LARA
(34,385) (75) (2,656) (135) (340) (2,727) (153) (267) (1,286) (2,238) (428) (1,692)
The agree score is the percent of responses that are a 4 or 5 (Agree or Strongly Agree)
12
Services Benchmark
72%
High PerformingBenchmark
74%

PwC | 2017 Employee Survey
65%
69%
67% 66% 65% 64% 63% 62% 62%58%
55%
61%
70%
64% 64%
72%
63%58%
54%
66%59%
50%
0%
20%
40%
60%
80%
100%
2017 2015
Results | Agree scores – Agencies (continued)
SoM Overall MDE TREAS TED DEQ DMVA DHHS MDCR MVAA TIA MDOC
(34,385) (419) (1,069) (1,086) (892) (219) (9,458) (72) (323) (582) (8,850)
13
Services Benchmark
72%
High PerformingBenchmark
74%
The agree score is the percent of responses that are a 4 or 5 (Agree or Strongly Agree)

PwC | 2017 Employee Survey
Results | Greatest change
1See Driver Matrix pages. Items with “N/A” are engagement items and were not included in the Driver Matrix
Note: The agree score is the percent of responses that are a 4 or 5 (Agree or Strongly Agree)
2017 2015 Percentage point difference
2017/2015 Engagement driver matrix description1
Agree Score
Greatest increase
I understand what is expected of me in order for my department to achieve its strategic objectives.
76% 66% +10 Preserve
The State of Michigan's benefit plans (i.e., health insurance, vacation, etc.) meet my needs.
71% 63% +8 Pass
I would recommend the State of Michigan to friends and family as a great place to work.
68% 61% +7 N/A
My department keeps employees informed about matters affecting us.
53% 47% +6 Priority/Priority
I am confident department leadership is leading us in the right direction for success.
45% 39% +6 Priority/Priority
Greatest decrease
I have a clear understanding of my department's strategic objectives.
55% 59% -4 Priority/Enhance
14

PwC | 2017 Employee Survey
Employee landscape | Overall
Employee Landscape provides a way to categorize and assess various employee types. This technique segments respondents into fourdifferent characteristics based on their responses to the SoM engagement questions and their likelihood of leaving the organization.
Profile Characteristics
Champions • Higher level of engagement and high likelihood of staying
• Strong identification with organization objectives
• High level of loyalty to the organization
• High level of willingness to cooperate and motivate colleagues
Tenants • Higher level of engagement and low likelihood of staying
• Very satisfied/“Free Agents”/Lower loyalty
• Have a stabilizing effect on the organization
• Straightforward, however, need to be directed
Disconnected • Lower level of engagement and low likelihood of staying
• Dissatisfied and disengaged
• More frustrated than dedicated
• Under-utilized resources of the organization
• Ready to change jobs when opportunities become available
Captives • Lower level of engagement and high likelihood of staying
• Greatest opportunity to convert to Champions
• Often complete their work but rarely go “above and beyond”
1 Based on the average of Employee Engagement Index questions not including “I intend to stay with the State of Michigan for at least another 12 months” question (High >= 4.0, Low < 4.0)2 Based on “I intend to stay with the State of Michigan for at least another 12 months.”
Note: Percentages may not equal 100% due to rounding. Landscape was calculated only for employees who answered all six Engagement Index items
15
Tenants: 3%
(N = 1,081)
2015: 3%
2013: 2%
2012: 2%
Services Benchmark: 3%
HiPo Benchmark: 3%
Champions: 54%
(N = 18,463)
2015: 48%
2013: 42%
2012: 40%
Services Benchmark: 53%
HiPo Benchmark: 52%
Captives: 34%
(N = 11,753)
2015: 39%
2013: 45%
2012: 48%
Services Benchmark: 26%
HiPo Benchmark: 27%
Disconnected: 9%
(N = 3,084)
2015: 10%
2013: 11%
2012: 10%
Services Benchmark: 18%
HiPo Benchmark: 18%
Likelihood of Staying2
Low High
Low
High
Le
ve
l o
f E
ng
ag
em
en
t1

PwC | 2017 Employee Survey
Employee landscape | Agencies
Champions Tenants Disconnected Captives
2017 2015 2017 2015 2017 2015 2017 2015
SoM State of Michigan Overall 54% 48% 3% 3% 9% 10% 34% 39%
MSP State Police 78% 77% 3% 2% 4% 3% 15% 17%
GOV Governor's Office 76% 76% 13% 13% 4% 7% 7% 3%
MGCB Gaming Control Board 70% 69% 7% 0% 7% 12% 17% 19%
CSC Civil Service Commission 69% 62% 3% 3% 3% 7% 25% 28%
DNR Natural Resources 68% 63% 3% 3% 4% 6% 25% 28%
LOTT Lottery 67% 71% 3% 3% 7% 6% 22% 21%
MDARD Agriculture & Rural Development 64% 61% 5% 4% 11% 10% 20% 25%
DTMB Technology, Management, and Budget 64% 59% 5% 4% 8% 10% 23% 27%
DIFS Insurance and Financial Services 64% 56% 4% 4% 10% 10% 22% 31%
LARA Licensing & Regulatory Affairs 61% 49% 4% 4% 7% 12% 28% 35%
MDE Education 60% 61% 6% 5% 9% 9% 25% 25%
DMVA Military & Veterans Affairs 56% 49% 2% 2% 10% 12% 32% 37%
MDOT Transportation 55% 51% 5% 4% 9% 10% 31% 35%
TED Talent and Economic Development 54% 52% 5% 5% 11% 11% 30% 32%
TREAS Treasury 54% 49% 3% 2% 9% 8% 35% 40%
DEQ Environmental Quality 53% 58% 5% 3% 9% 7% 34% 32%
DHHS Health and Human Services 53% 44% 3% 3% 9% 12% 35% 41%
MVAA Michigan Veterans Affairs Agency 52% 59% 5% 3% 15% 9% 28% 29%
MDCR Civil Rights 50% 36% 1% 8% 22% 28% 26% 28%
TIA Talent Investment Agency 47% 46% 4% 4% 13% 11% 36% 38%
MDOC Corrections 38% 31% 2% 1% 11% 13% 49% 55%
16
Above SoM Overall

PwC | 2017 Employee Survey
Employee landscape | Demographics
Champions Tenants Disconnected Captives
2017 2015 2017 2015 2017 2015 2017 2015
State of Michigan Overall 54% 48% 3% 3% 9% 10% 34% 39%
Race
American Indian/Alaskan Native 47% 45% 2% 2% 10% 9% 41% 44%
Asian 67% 66% 3% 3% 7% 8% 23% 23%
Black 55% 48% 3% 3% 10% 12% 33% 37%
Hispanic/Latino 59% 51% 2% 3% 9% 9% 31% 38%
White 55% 49% 3% 3% 8% 10% 34% 39%
Other 43% 35% 3% 3% 16% 19% 38% 43%
Native Hawaiian or Other Pacific Islander 38% N/A 0% N/A 3% N/A 59% N/A
Two or more races 47% N/A 4% N/A 14% N/A 35% N/A
Gender
Female 55% 48% 3% 3% 8% 10% 34% 39%
Male 53% 48% 3% 3% 9% 11% 35% 38%
Age Range
Under 25 58% 53% 7% 7% 10% 13% 25% 27%
25-34 55% 48% 3% 3% 10% 12% 31% 36%
35-44 55% 48% 2% 2% 8% 9% 35% 41%
45-54 54% 48% 2% 2% 7% 9% 37% 42%
55 and Over 52% 49% 6% 5% 10% 12% 31% 34%
Tenure
Less than 3 years 63% 59% 4% 3% 8% 9% 25% 29%
3 years to less than 10 years 54% 47% 3% 3% 10% 12% 34% 38%
10 years to less than 20 years 52% 45% 2% 2% 8% 10% 38% 44%
20 years to less than 30 years 51% 46% 3% 3% 8% 9% 38% 42%
30 years or more 50% 49% 11% 8% 13% 13% 25% 30%
Employment Group
Group 1: Non-degreed, non-supervisory classifications 50% 43% 2% 2% 9% 11% 39% 44%
Group 2: Degreed, non-supervisory classifications 54% 48% 3% 3% 9% 11% 33% 38%
Group 3: Managers and supervisors 59% 53% 3% 3% 7% 8% 31% 36%
Group 4/SES: Executives and administrators 78% 74% 7% 5% 3% 4% 12% 17%
Unclassified/Special appointees 61% 64% 7% 6% 10% 8% 22% 22%
MEDC - Corporate 70% 69% 9% 3% 8% 12% 13% 15%
Other 45% 39% 3% 3% 15% 16% 37% 41%
17
PwC | 2017 Employee Survey
Organizational strengths Opportunities for improvement
What drives engagement
across the State of Michigan?
Department Communications
Work group/Colleagues
Diversity and InclusionMy Job
Customer Focus
Department Leadership
Drivers of engagement | Summary
18

PwC | 2017 Employee Survey
Driver matrix | Description
What is the Driver Matrix?
• The Driver Matrix identifies items and themes that drive engagement, enabling more focused action planning.
• The Driver Matrix categorizes each item based on its correlation with the engagement index as well as its need for improvement, as measured by the Agree Score.
Priority
• High correlation to engagement index and low agree score. The greatest opportunities to increase engagement are identified in the Priority box.
Enhance
• High correlation to engagement index and medium agree score. Opportunity exists to move these items to the Preserve box by increasing their agree scores.
Preserve
• High correlation to engagement index and high agree score. Organizations should be conscious of maintaining its Preserve items.
Monitor
• Low agree score but low correlation to engagement index. Items in the Monitor section may not be high pay-off investments.
Pass
• High agree score and low correlation to engagement index. Maintain current levels of focus on these items.
1 Based on correlation with Engagement Index
19
High
Low
StrongModerate
Drivers of Engagement1
Ag
re
e S
co
re
Priority
Preserve
Monitor
Pass
Enhance

PwC | 2017 Employee Survey
Driver matrix | By survey theme
1 Based on correlation with Engagement Index
Note: Numbers in parentheses represent the agree score for each item
High
Low
StrongModerate
Drivers of Engagement1
Ag
re
e S
co
re
Priority
Preserve
Monitor
Pass
Enhance
My Workgroup / Colleagues (75%)
Diversity and Inclusion (60%)My Job (69%)
20
Department Leadership (46%)Department Leadership
2015 Priority
Diversity and Inclusion
2015 Enhance
2015 Preserve
My Job

PwC | 2017 Employee Survey
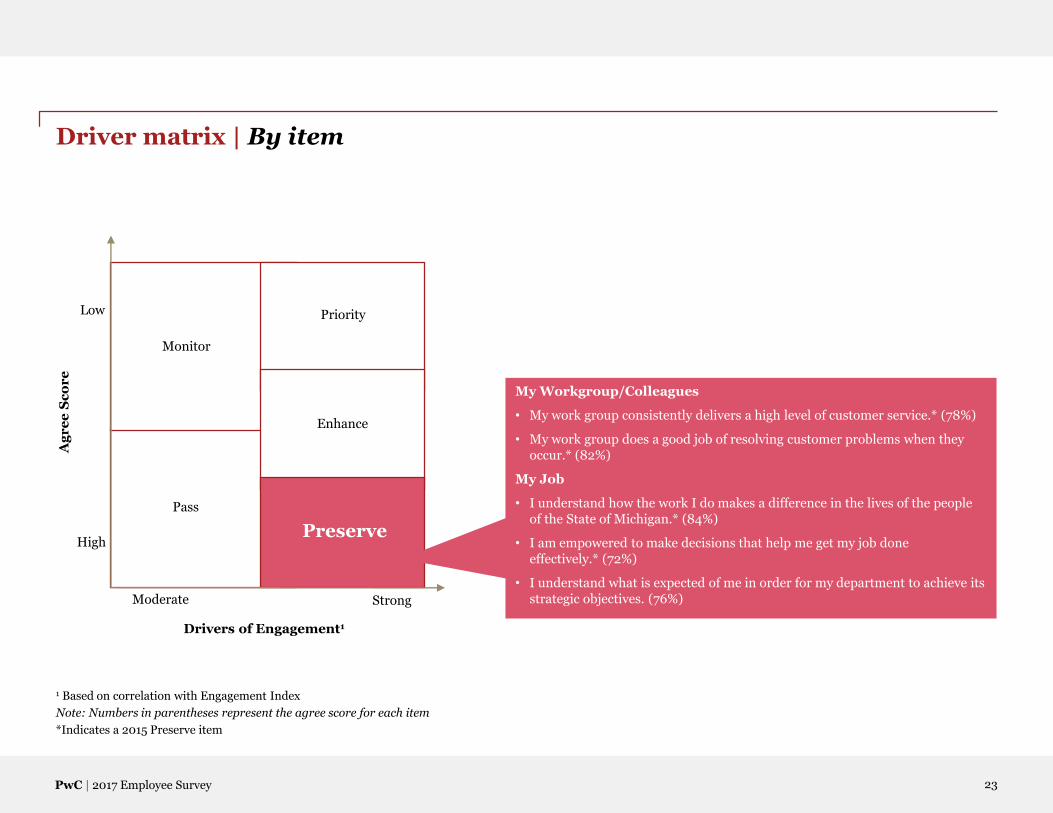
Driver matrix | By item
1 Based on correlation with Engagement Index
Note: Numbers in parentheses represent the agree score for each item
*Indicates a 2015 Priority item
21
High
Low
StrongModerate
Drivers of Engagement1
Ag
re
e S
co
re
Priority
Preserve
Monitor
Pass
Enhance
Diversity and Inclusion
• The State of Michigan has an inclusive work environment where individual differences are respected.* (55%)
• Sufficient effort is made to get the opinions of people who work here.* (47%)
Department Communications
• Department leadership gives employees a clear picture of the direction my department is headed.* (49%)
• My department leadership communicates openly and honestly with employees.* (51%)
• My department keeps employees informed about mattersaffecting us.* (53%)
Department Leadership
• Department leadership is creating a culture of continuous improvement.* (47%)
• I am confident department leadership is leading us in the right direction for success.* (45%)
• My department is serious about change and reinvention to achieve good government.* (53%)
• Department leadership is interested in the well-being of employees.* (48%)
• Department leadership is trustworthy.* (47%)
• I have seen meaningful action taken in my department as a result of the last employee engagement survey.* (33%)
• I have a clear understanding of my department's strategic objectives. (55%)

PwC | 2017 Employee Survey
Driver matrix | By item
1 Based on correlation with Engagement Index
Note: Numbers in parentheses represent the agree score for each item
*Indicates a 2015 Enhance item
22
High
Low
StrongModerate
Drivers of Engagement1
Ag
re
e S
co
re
Priority
Preserve
Monitor
Pass
Enhance
Diversity and Inclusion
• My work group has a climate in which diverse perspectives are encouraged and valued. (57%)
• Employees at the State of Michigan are able to contribute to their fullest potential (without regard to such characteristics as age, race, ethnicity, disability, etc.).* (66%)
Department Communications
• I get the information I need to be productive in my job.* (60%)
My Workgroup/Colleagues
• My work group constantly looks for better ways to serve our customers.* (70%)
• Within my department, there is effective teamwork between my work group and other work groups.* (68%)
My Job
• My job gives me a feeling of personal accomplishment.* (67%)
• My career goals can be met at the State of Michigan. (60%)
• My job makes good use of my skills and abilities. (71%)
• I am encouraged to come up with new and better ways of doing things.* (65%)
PwC | 2017 Employee Survey
Driver matrix | By item
1 Based on correlation with Engagement Index
Note: Numbers in parentheses represent the agree score for each item
*Indicates a 2015 Preserve item
23
High
Low
StrongModerate
Drivers of Engagement1
Ag
re
e S
co
re
Priority
Preserve
Monitor
Pass
Enhance
My Workgroup/Colleagues
• My work group consistently delivers a high level of customer service.* (78%)
• My work group does a good job of resolving customer problems when they occur.* (82%)
My Job
• I understand how the work I do makes a difference in the lives of the people of the State of Michigan.* (84%)
• I am empowered to make decisions that help me get my job done effectively.* (72%)
• I understand what is expected of me in order for my department to achieve its strategic objectives. (76%)

PwC | 2017 Employee Survey
Barriers to productivity | Top ten items
Employees were asked to select up to five issues that commonly prevent them from being fully productive at work:
Top ten most selected issues Percent of respondents mentioning
Not enough staff to help get work done 42%
Unnecessary paperwork 29%
Outdated technology or lack of technology 26%
Too many procedures and policies 21%
Too many emails 16%
Inadequate training 15%
There are no issues preventing me from being fully productive at work 15%
Teammates whose skill levels are not suited for the job 14%
Doing work beyond the scope of my job 13%
Responding to unanticipated issues, beyond my job requirements 12%
24

PwC | 2017 Employee Survey
Barriers to productivity | By agency
Employees were asked to select up to five issues that commonly prevent them from being fully productive at work:
Items shown below are based on the top 10 most selected issues for State of Michigan Overall
Percent of respondents mentioning
SoM Overall CSC DEQ DHHS DIFS DMVA DNR DTMB GOV LARA LOTT MDARD
Not enough staff to help get work done
42% 23% 49% 47% 27% 34% 49% 32% 7% 28% 22% 40%
Unnecessary paperwork 29% 11% 23% 30% 17% 16% 29% 22% 0% 21% 18% 24%
Outdated technology or lack of technology
26% 21% 32% 35% 18% 25% 31% 17% 8% 26% 20% 32%
Too many proceduresand policies
21% 6% 18% 24% 13% 10% 24% 22% 1% 14% 8% 21%
Too many emails 16% 13% 17% 17% 9% 6% 22% 15% 17% 13% 13% 11%
Inadequate training 15% 11% 16% 20% 19% 14% 9% 15% 3% 19% 7% 14%
There are no issues preventing me from being fully productive at work
15% 34% 12% 10% 24% 24% 12% 20% 53% 23% 28% 14%
Teammates whose skill levels are not suited forthe job
14% 7% 8% 15% 14% 15% 12% 13% 7% 12% 9% 12%
Doing work beyond the scope of my job
13% 8% 12% 14% 6% 11% 16% 14% 7% 11% 10% 15%
Responding to unanticipated issues, beyond my job requirements
12% 10% 16% 12% 6% 16% 17% 13% 8% 9% 11% 10%
25

PwC | 2017 Employee Survey
Barriers to productivity | By agency
Employees were asked to select up to five issues that commonly prevent them from being fully productive at work:
Items shown below are based on the top 10 most selected issues for State of Michigan Overall
Percent of respondents mentioning
SoM Overall MDCR MDE MDOC MDOT MGCB MSP MVAA TED TIA TREAS
Not enough staff to help get work done
42% 38% 32% 48% 36% 16% 46% 57% 39% 47% 22%
Unnecessary paperwork 29% 15% 13% 35% 26% 20% 40% 22% 13% 13% 18%
Outdated technology or lack of technology
26% 38% 15% 23% 19% 24% 24% 32% 21% 22% 27%
Too many procedures and policies
21% 14% 13% 22% 22% 7% 20% 9% 15% 16% 16%
Too many emails 16% 10% 16% 13% 15% 8% 22% 12% 15% 15% 13%
Inadequate training 15% 10% 11% 16% 10% 9% 5% 27% 16% 19% 18%
There are no issues preventing me from being fully productive at work
15% 18% 20% 14% 21% 36% 20% 11% 17% 11% 18%
Teammates whose skill levels are not suited for the job
14% 14% 13% 18% 12% 12% 8% 11% 15% 18% 13%
Doing work beyond the scope of my job
13% 11% 10% 14% 12% 10% 10% 14% 12% 13% 14%
Responding to unanticipated issues, beyond my job requirements
12% 7% 14% 11% 12% 2% 9% 15% 12% 11% 11%
26
PwC | 2017 Employee Survey
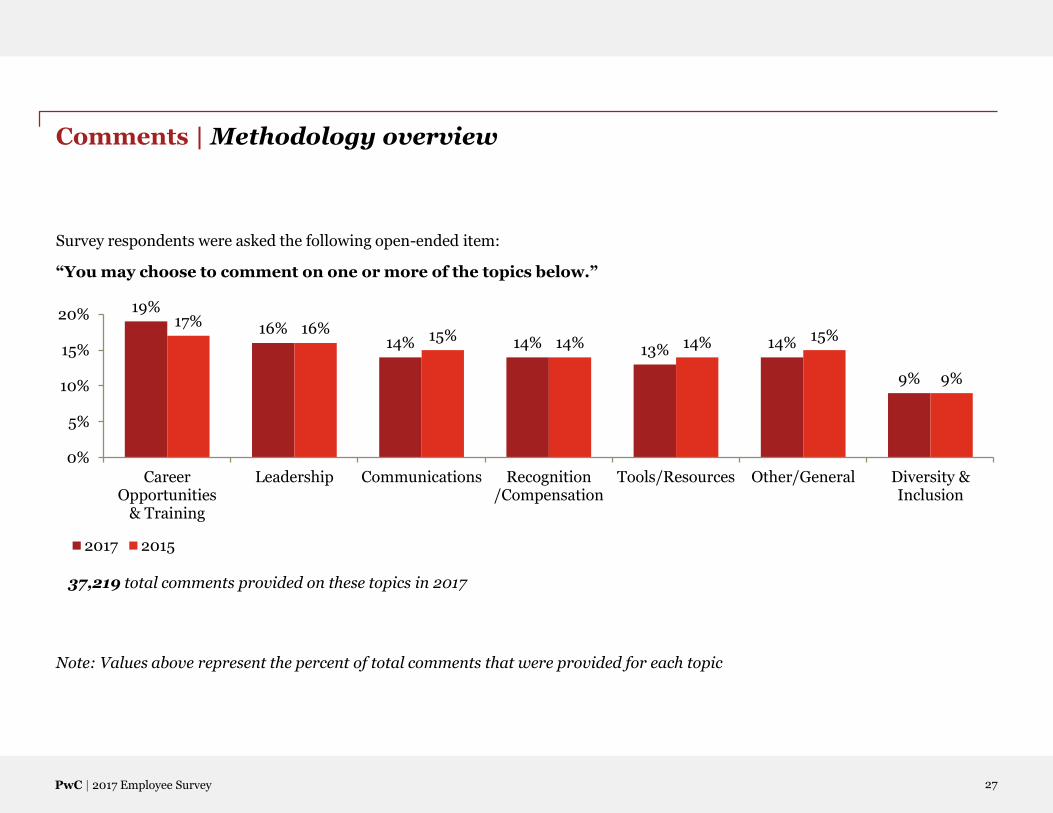
Comments | Methodology overview
Survey respondents were asked the following open-ended item:
“You may choose to comment on one or more of the topics below.”
19%
16%14% 14% 13% 14%
9%
17% 16% 15% 14% 14% 15%
9%
0%
5%
10%
15%
20%
CareerOpportunities
& Training
Leadership Communications Recognition/Compensation
Tools/Resources Other/General Diversity &Inclusion
2017 2015
Note: Values above represent the percent of total comments that were provided for each topic
37,219 total comments provided on these topics in 2017
27

PwC | 2017 Employee Survey
Next steps | Results roll out timeline
Presentation of Statewide
Results
Dissemination of AgencyReports
Communication of Results to employees
Action Planning
ImplementAction Plans And Develop
Metrics Next
Survey
April 2017 April - May 2017 June 2017 June 2017 - Ongoing Summer/Fall2018
• Review results
• Share survey results and deliver key messages for agencies
• Develop state-wide communication plan
• Review agency results/Assess changes
• Identify strengths and opportunities on which to focus improvement efforts
• Implement employee communication plans
• Form teams for action planning
• Generate 2-3 action steps for each priority item selected
• Determine best practices, identify resources
• Implement
• Assess and document accountability around the action planning process
• Communicate plans and progress
• Continue to measure and monitor progress
• Launch the fifth Employee Survey
• Develop communication plans
• Set new participation goals
28

PwC | 2017 Employee Survey
Appendix
Appendix
• Survey results by theme:
- SoM Employee Engagement
- Diversity & Inclusion
- Department Communications
- Department Leadership
• Long-term trends
• Intent to stay
• Response profile
• Heat map
29
- My Immediate Supervisor
- My Workgroup/Colleagues
- My Job

PwC | 2017 Employee Survey
Employee engagement
Note: Percentages may not equal 100% due to rounding.
61% 60% 53% 73% 74%
87% 87% 88% 75% 83%
64% 60% 61% 69% 75%
73% 74% 70% 77% 79%
63% 59% 61% 76% 80%
85% 79% 78% 83% 86%
2015 % Agree
2013 % Agree
2012% Agree
Services Benchmark
High Performing Benchmark
88%
66%
78%
67%
88%
68%
9%
23%
17%
21%
8%
20%
4%
11%
6%
11%
4%
12%
0% 10% 20% 30% 40% 50% 60% 70% 80% 90% 100%
% Agree %Neutral % Disagree
I would recommend the State of Michigan to friends and family as a great place to work.
I intend to stay with the State of Michigan for at least another 12 months.
My colleagues go beyond what is expected for the success of the State of Michigan.
I am proud to work for the State of Michigan.
My colleagues are passionate about providing exceptional customer service.
I understand how my job contributes to the mission of the State of Michigan.
30
PwC | 2017 Employee Survey
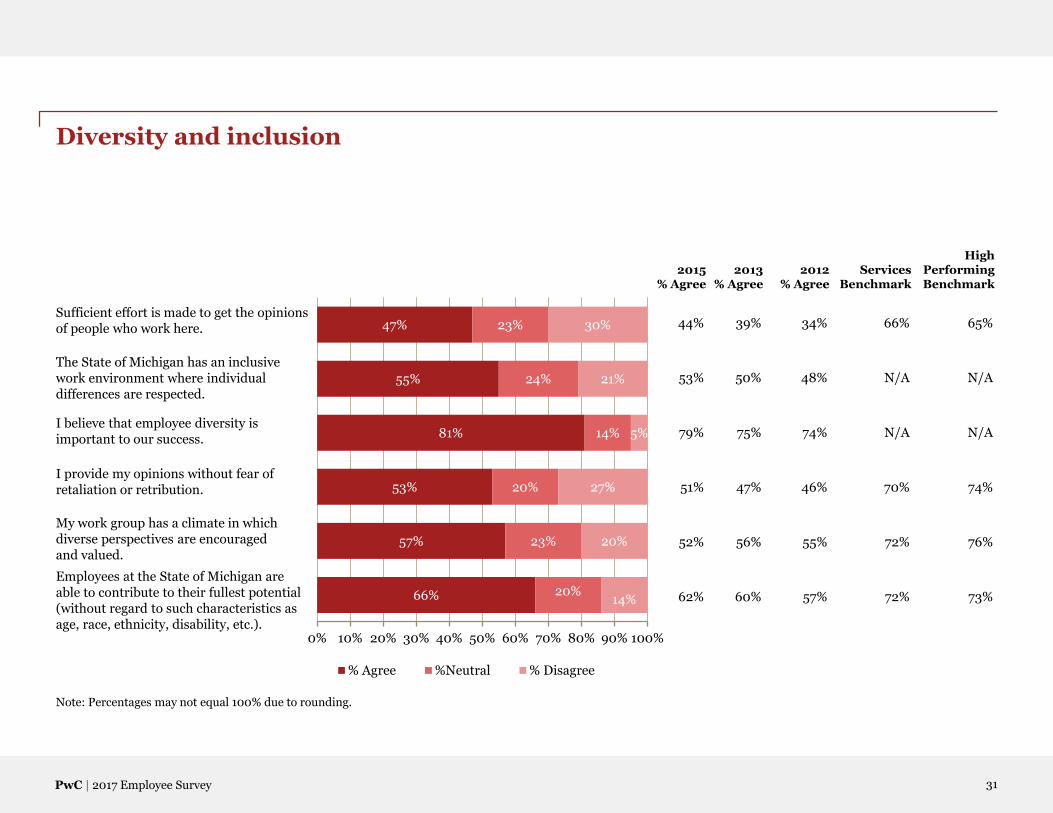
Diversity and inclusion
Note: Percentages may not equal 100% due to rounding.
66%
57%
53%
81%
55%
47%
20%
23%
20%
14%
24%
23%
14%
20%
27%
5%
21%
30%
0% 10% 20% 30% 40% 50% 60% 70% 80% 90% 100%
% Agree %Neutral % Disagree
Sufficient effort is made to get the opinions of people who work here.
The State of Michigan has an inclusive work environment where individual differences are respected.
I believe that employee diversity is important to our success.
I provide my opinions without fear of retaliation or retribution.
My work group has a climate in which diverse perspectives are encouraged and valued.
Employees at the State of Michigan are able to contribute to their fullest potential (without regard to such characteristics as age, race, ethnicity, disability, etc.).
44% 39% 34% 66% 65%
53% 50% 48% N/A N/A
79% 75% 74% N/A N/A
51% 47% 46% 70% 74%
52% 56% 55% 72% 76%
62% 60% 57% 72% 73%
2015 % Agree
2013 % Agree
2012% Agree
Services Benchmark
High Performing Benchmark
31

PwC | 2017 Employee Survey
Department communications
My department leadership communicates openly and honestly with employees.
My department keeps employees informed about matters affecting us.
I get the information I need to be productive in my job.
Department leadership gives employees a clear picture of the direction my department is headed.
Note: Percentages may not equal 100% due to rounding.
46% 41% 37% N/A N/A
47% 45% 42% 70% 67%
55% 55% 54% 72% 72%
44% 42% 37% 72% 70%49%
60%
53%
51%
26%
22%
22%
22%
25%
18%
25%
27%
0% 10% 20% 30% 40% 50% 60% 70% 80% 90% 100%
% Agree %Neutral % Disagree
2015 % Agree
2013 % Agree
2012% Agree
Services Benchmark
High Performing Benchmark
32

PwC | 2017 Employee Survey
Department leadership
Note: Percentages may not equal 100% due to rounding.
44% 43% 39% 61% 61%
44% 41% 36% 63% 61%
49% 48% 45% N/A N/A
39% 39% 33% 67% 69%
36% 35% 44% N/A N/A
42% 40% 39% N/A N/A
59% N/A N/A N/A N/A
42% 43% N/A N/A N/A
31% N/A N/A 67% 61%33%
46%
55%
47%
41%
45%
53%
48%
47%
38%
30%
26%
29%
31%
32%
29%
25%
26%
29%
24%
19%
23%
28%
23%
19%
27%
27%
0% 10% 20% 30% 40% 50% 60% 70% 80% 90% 100%
% Agree %Neutral % Disagree
Department leadership is trustworthy.
Department leadership is interested in the well-being of employees.
My department is serious about change and reinvention to achieve good government.
I am confident department leadership is leading us in the right direction for success.
Department leadership makes decisions in a timely fashion.
Department leadership is creating a culture of continuous improvement.
I have a clear understanding of my department's strategic objectives.
I am aware of Good Government initiatives taking place in my department.
I have seen meaningful action taken in my department as a result of the last employee engagement survey.
2015 % Agree
2013 % Agree
2012% Agree
Services Benchmark
High Performing Benchmark
33

PwC | 2017 Employee Survey
My immediate supervisor
Note: Percentages may not equal 100% due to rounding.
61%
69%
74%
58%
72%
86%
72%
71%
18%
15%
14%
21%
15%
10%
14%
15%
20%
16%
12%
21%
13%
5%
14%
14%
0% 10% 20% 30% 40% 50% 60% 70% 80% 90% 100%
% Agree %Neutral % Disagree
My supervisor gives me feedback that helps me improve my performance.
My supervisor recognizes me when I do a good job.
My supervisor holds me accountable for the quality of my work.
My supervisor clearly communicates his/her expectations of me.
I feel my supervisor takes an active interest in my career development.
I have effective two-way communication with my supervisor.
My supervisor's actions are consistent with what he/she says.
My supervisor effectively balances the workload across our work group or team.
67% 64% 63% 67% 73%
69% 67% 66% 79% 75%
84% 85% 85% N/A N/A
68% 68% 67% 72% 71%
53% 50% 47% 62% 65%
71% 71% 72% N/A N/A
65% 63% 63% N/A N/A
57% 55% 54% N/A N/A
2015 % Agree
2013 % Agree
2012% Agree
Services Benchmark
High Performing Benchmark
34

PwC | 2017 Employee Survey
My workgroup/colleagues
Note: Percentages may not equal 100% due to rounding.
79%
73%
78%
70%
82%
68%
78%
13%
16%
16%
22%
14%
19%
13%
7%
11%
6%
8%
4%
13%
9%
0% 10% 20% 30% 40% 50% 60% 70% 80% 90% 100%
% Agree %Neutral % Disagree
The people I work with cooperate well together to get the job done.
Within my department, there is effective teamwork between my work group and other work groups.
My work group does a good job of resolving customer problems when they occur.
My work group constantly looks for better ways to serve our customers.
My work group consistently delivers a high level of customer service.
My colleagues treat co-workers with dignity and respect.
I am treated with dignity and respect by my colleagues.
76% 73% 74% 76% 81%
63% 58% 58% 70% 72%
77% 79% 80% N/A N/A
65% 66% 66% N/A N/A
73% 75% 76% N/A N/A
68% 64% 66% 75% 75%
74% 74% 75% 75% 75%
2015 % Agree
2013 % Agree
2012% Agree
Services Benchmark
High Performing Benchmark
35

PwC | 2017 Employee Survey
My job
Note: Percentages may not equal 100% due to rounding.
63%
49%
84%
65%
67%
71%
65%
89%
21%
21%
11%
18%
18%
15%
18%
7%
16%
30%
5%
18%
15%
14%
16%
4%
0% 10% 20% 30% 40% 50% 60% 70% 80% 90% 100%
% Agree %Neutral % Disagree
I have a clear idea of my job responsibilities.
I am encouraged to come up with new and better ways of doing things.
My job makes good use of my skills and abilities.
My job gives me a feeling of personal accomplishment.
I have the materials/tools/equipment I need to do my job well.
I understand how the work I do makes a difference in the lives of the people of the State of Michigan.
I believe I have the opportunity for growth in my current job.
I receive the training I need to do a quality job.
87% 85% 83% 89% 91%
62% 55% 53% 72% 76%
67% 68% 68% 82% 85%
64% 64% 63% 77% 82%
60% 59% 58% 77% 80%
82% 83% 84% N/A N/A
43% 40% 39% 69% 72%
58% 57% 56% 74% 79%
2015 % Agree
2013 % Agree
2012% Agree
Services Benchmark
High Performing Benchmark
36

PwC | 2017 Employee Survey
My job (continued)
Note: Percentages may not equal 100% due to rounding.
76%
55%
80%
72%
71%
77%
62%
71%
60%
17%
23%
12%
16%
18%
14%
18%
16%
25%
7%
22%
9%
12%
12%
9%
20%
13%
15%
0% 10% 20% 30% 40% 50% 60% 70% 80% 90% 100%
% Agree %Neutral % Disagree
My career goals can be met at the State of Michigan.
The State of Michigan's benefit plans (i.e., health insurance, vacation, etc.) meet my needs.
I am paid fairly for the work I do.
I understand how my performance on the job is evaluated.
I think my job performance is evaluated fairly.
I am empowered to make decisions that help me get my job done effectively.
I am generally able to balance my job and personal/family life.
At work, I am free of obstacles that prevent me from accomplishing the goals of my position.
I understand what is expected of me in order for my department to achieve its strategic objectives.
54% 53% 51% N/A N/A
63% N/A N/A 72% 72%
59% 56% 54% 58% 59%
74% 73% 74% N/A N/A
67% 65% 67% N/A N/A
70% N/A N/A 78% 75%
80% 79% 79% 73% 74%
51% N/A N/A N/A N/A
66% N/A N/A 76% 75%
2015 % Agree
2013 % Agree
2012% Agree
Services Benchmark
High Performing Benchmark
37
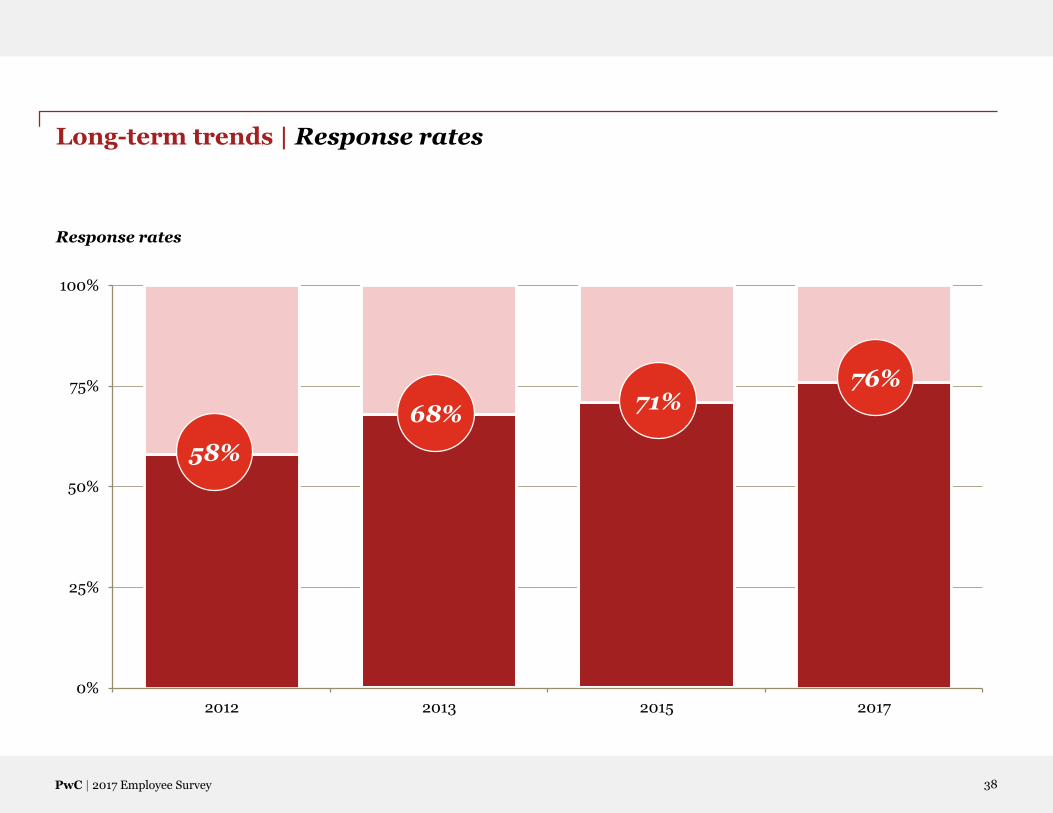
PwC | 2017 Employee Survey
Long-term trends | Response rates
0%
25%
50%
75%
100%
2012 2013 2015 2017
68%
58%
76%71%
Response rates
38

PwC | 2017 Employee Survey
Long-term trends | Engagement scores
Engagement scores
69% 70%72%
76%79%
77%
74%
76%
80%
86%
80% 80%
50%
100%
2012 2013 2015 2017
State of Michigan Services Benchmark High Performing Benchmark
39
2017201520132012

PwC | 2017 Employee Survey
Long-term trends | Engagement scores by item
Engagement scores – % Agree
88%87% 87%
88%
78%
79%
85%
88%
70%
74%73%
78%
61%60%
64%67%
61%59%
63% 66%
53%
60%
61%
68%
50%
55%
60%
65%
70%
75%
80%
85%
90%
2012 2013 2015 2017
I intend to stay with the State of Michigan for atleast another 12 months.
I understand how my job contributes to themission of the State of Michigan.
I am proud to work for the State of Michigan.
My colleagues go beyond what is expected forthe success of the State of Michigan.
My colleagues are passionate about providingexceptional customer service.
I would recommend the State of Michigan tofriends and family as a great place to work.
40

PwC | 2017 Employee Survey
Long-term trends | Employee landscape
Champions Tenants Disconnected Captives
2017 2015 2013 2012 2017 2015 2013 2012 2017 2015 2013 2012 2017 2015 2013 2012
SoM 54% 48% 42% 40% 3% 3% 2% 2% 9% 10% 11% 10% 34% 39% 45% 48%
MSP 78% 77% 68% 55% 3% 2% 2% 3% 4% 3% 4% 6% 15% 17% 26% 37%
GOV 76% 76% 66% 81% 13% 13% 14% 5% 4% 7% 12% 5% 7% 3% 8% 8%
MGCB 70% 69% 71% 59% 7% 0% 2% 3% 7% 12% 9% 13% 17% 19% 18% 26%
CSC 69% 62% 61% 53% 3% 3% 2% 2% 3% 7% 5% 7% 25% 28% 32% 38%
DNR 68% 63% 58% 54% 3% 3% 3% 2% 4% 6% 6% 6% 25% 28% 33% 37%
LOTT 67% 71% 61% 62% 3% 3% 6% 3% 7% 6% 7% 4% 22% 21% 26% 31%
DIFS 64% 56% 54% N/A 4% 4% 2% N/A 10% 10% 9% N/A 22% 31% 36% N/A
DTMB 64% 59% 52% 47% 5% 4% 4% 3% 8% 10% 10% 10% 23% 27% 34% 40%
MDARD 64% 61% 57% 56% 5% 4% 3% 2% 11% 10% 9% 6% 20% 25% 31% 36%
LARA 61% 49% 47% 51% 4% 4% 3% 2% 7% 12% 13% 8% 28% 35% 38% 38%
MDE 60% 61% 59% 53% 6% 5% 5% 4% 9% 9% 8% 12% 25% 25% 27% 30%
DMVA 56% 49% 43% 52% 2% 2% 2% 2% 10% 12% 13% 9% 32% 37% 42% 37%
MDOT 55% 51% 43% 43% 5% 4% 3% 2% 9% 10% 10% 10% 31% 35% 44% 44%
TED 54% 52% 48% 50% 5% 5% 4% 3% 11% 11% 11% 9% 30% 32% 38% 38%
TREAS 54% 49% 49% 43% 3% 2% 2% 2% 9% 8% 8% 8% 35% 40% 41% 47%
DEQ 53% 58% 48% 41% 5% 3% 3% 2% 9% 7% 9% 9% 34% 32% 40% 48%
DHHS 53% 44% 43% 42% 3% 3% 2% 2% 9% 12% 10% 10% 35% 41% 45% 45%
MVAA 52% 59% 53% N/A 5% 3% 2% N/A 15% 9% 10% N/A 28% 29% 35% N/A
MDCR 50% 36% 34% 49% 1% 8% 7% 0% 22% 28% 13% 15% 26% 28% 45% 36%
TIA 47% 46% 43% 49% 4% 4% 3% 2% 13% 11% 13% 9% 36% 38% 42% 40%
MDOC 38% 31% 21% 18% 2% 1% 1% 1% 11% 13% 15% 14% 49% 55% 63% 68%
Consistent improvement in Champions over the four-year period
41

PwC | 2017 Employee Survey
Results | Intent to stay – Agencies
88%94% 94% 93%
90% 89% 88% 88% 88% 87% 87% 87%87%
95%90% 91% 91%
84%89%
86% 85% 86% 88% 90%
0%
20%
40%
60%
80%
100%
2017 2015
The intent to stay score is the percent of responses that are a 4 or 5 (Agree or Strongly Agree) for the question, “I intend to stay with the State of Michigan for at least another 12 months.” This measure is a leading indicator of turnover.
Services Benchmark
75%
High PerformingBenchmark
83%
SoM Overall MSP CSC DNR LOTT LARA TREAS DMVA DHHS DTMB MGCB DEQ
(34,385) (2,656) (340) (1,286) (153) (1,692) (1,069) (219) (9,458) (2,727) (135) (892)
42

PwC | 2017 Employee Survey
Results | Intent to stay – Agencies (continued)
88% 87% 86% 86% 85% 84% 83% 83% 83%80%
76%
87% 86% 86% 87% 86% 86%83% 84% 79%
88%
64%
0%
20%
40%
60%
80%
100%
2017 2015
SoM Overall MDOC MDOT DIFS MDE MDARD TED TIA GOV MVAA MDCR
(34,385) (8,850) (2,238) (267) (419) (428) (1,086) (582) (75) (323) (72)
43
Services Benchmark
75%
High PerformingBenchmark
83%
The intent to stay score is the percent of responses that are a 4 or 5 (Agree or Strongly Agree) for the question, “I intend to stay with the State of Michigan for at least another 12 months.” This measure is a leading indicator of turnover.

PwC | 2017 Employee Survey
Demographics | Respondents
Education Employment Group
2%
16%
43%
18%
20%
0%
PhD, JD, MD, other profssnldegree
Masters Degree
Bachelors Degree
Associates Degree
High School Graduate/GED
Some High School
0%
1%
3%
3%
15%
42%
36%
Corporate Group (MEDC)
Unclassified/Special appointees
Other
Group 4/SES: Executivesand administrators
Group 3: Managers andsupervisors
Group 2: Degreed, non-supervisory classifications
Group 1: Non-degreed, non-supervisory classifications
Age
Gender
49%
51%
Male
Female
Race
0%
1%
1%
2%
3%
4%
13%
76%
Native Hawaiian or OtherPacific Islander
Asian
American Indian or AlaskanNative
Hispanic or Latino
Two or more races
Other
Black or African American
White
Tenure
6%
19%
30%
29%
17%
30 years or more
20 years to less than30 years
10 years to less than 20 years
3 years to less than 10 years
Less than 3 years
21%
31%
27%
18%
3%
55 and over
45-54
35-44
25-34
Under 25
44

PwC | 2017 Employee Survey
Response profile| By demographic
The response profile allows for comparisons between the response distributions for SoM and various demographic groups (e.g., Under 25, Females, etc.).
Statewide demographics1 Survey responses
State of Michigan Overall 45,504* 34,385
Gender
Female 25,191 53% 14,661 51%
Male 22,312 47% 13,862 49%
Age Range
Under 25 1,600 3% 906 3%
25-34 8,591 18% 5,944 18%
35-44 12,144 26% 8,847 27%
45-54 14,672 31% 10,269 31%
55 and Over 10,496 22% 6,759 21%
Racial/Ethnic Group
American Indian/Alaskan Native 514 1% 395 1%
Asian 786 2% 428 1%
Black or African American 8,524 18% 4,174 13%
Hispanic/Latino 1,411 3% 783 2%
Native Hawaiian or Other Pacific Islander 0 0% 34 0%
White 36,264 76% 24,970 76%
Two or more races 4 0% 902 3%
Other 0 0% 1,249 4%
1Source: CSC Annual Workforce Report, First Quarter Fiscal Year 2016-17 (MEDC Corporate not represented in these counts)
*This number refers to the total number of employees invited to take the Employee Survey and is not from the CSC Annual Workforce Report
Note: Demographics were self-reported by survey respondents
45

PwC | 2017 Employee Survey
Response profile| By demographic
Statewide demographics1 Survey responses
State of Michigan Overall 45,504* 34,385
Total Length of Service with the State of Michigan
Less than 3 years 14,963 31% 5,644 17%
3 years to less than 10 years 8,574 18% 9,712 29%
10 years to less than 20 years 13,311 28% 9,992 30%
20 years to less than 30 years 8,237 17% 6,452 19%
30 years or more 2,418 5% 1,959 6%
Employment Group
Group 1: Non-degreed, non-supervisory classifications 22,942 50% 12,078 36%
Group 2: Degreed, non-supervisory classifications 16,185 35% 14,098 42%
Group 3: Managers and supervisors 4,654 10% 4,877 15%
Group 4/SES: Executives and administrators 1,711 4% 1,119 3%
Other 558 1% 1,081 3%
Unclassified/Special appointees 134 0% 218 1%
1Source: CSC Annual Workforce Report, First Quarter Fiscal Year 2016-17 (MEDC Corporate not represented in these counts)
*This number refers to the total number of employees invited to take the Employee Survey and is not from the CSC Annual Workforce Report
Note: Demographics were self-reported by survey respondents
46

PwC | 2017 Employee Survey
Heat map | Handout
What is a Heat Map?
PwC Saratoga’s Heat Map sorts average agree scores from high to low by each question and by each demographic segment. Agree scores represent the percent of participants who selected Agree or Strongly Agree as the answer to each question.
Purpose/objective of a Heat Map:
PwC Saratoga’s Heat Map highlights high and low performance scores by key demographics and displays systemic and isolated issues. The Heat Map provides a consistent comparison of organizational strengths and vulnerabilities by selected demographic segments.
How to use a Heat Map:
• Systemic issues existent throughout the organization can be found in the bottommost rows.
• Isolated issues pertaining to specific demographic groups can be found in the rightmost columns.
• The bottom ninth of all scores overall are highlighted in red; the remaining bottom third of all scores overall are highlightedin yellow.
• Red cells represent very unfavorable scores; yellow cells represent unfavorable scores.
• The correlation is a measure of the relation between each survey item and the employee engagement index. The correlation can range from -1.00 to +1.00. Correlations greater than 0.45 are generally considered strong. Items with a stronger relationship/impact on engagement have a higher correlation coefficient. The higher the positive correlation, the greater the likelihood that an item and engagement will increase or decrease together. The strongest correlations are highlighted in green in the Heat Map.
47

PwC | 2017 Employee Survey
Most favorable question scores
Least favorable question scores
Correlation with Engagement
Isolated issues
Sy
stemic issu
es
Higher agree scores Demographics Lower agree scores
Note: This heat map is for illustrative purposes only and is not readable within this report. A viewable heat map will be provided separately.
State of Michigan legend
Very Unfavorable 0%-47%
Unfavorable 48%-58%
Strong Correlation 0.56 & Above
How to read a heat map
48

PwC | 2017 Employee Survey
PwC contacts and company information
For over two decades, PwC has been a global leader in survey design, administration and analysis for some of the world’s largest organizations. We have provided a transparent and reliable process for employees to voice their concerns and share experiences.
We recognize the importance of managing and reporting the voice of the workforce in safe and secure manner. As a result, employees feel part of the operational and work environment improvements that are driven by their feedback.
PwC has administered the State of Michigan survey dating back to 2012.
Todd [email protected] T: 713.356.8440
Robert [email protected] T: 408.817.5896
Elizabeth [email protected] T: 703.918.2802
JoiAnda [email protected] T: 703.918.1562
49

© 2017 PwC. All rights reserved. PwC refers to the US member firm or one of its
subsidiaries or affiliates, and may sometimes refer to the PwC network. Each member firm
is a separate legal entity. Please see www.pwc.com/structure for further details.