2017 compensation report - century-group.com · level and management-level employees across...
TRANSCRIPT

FOR FINANCIAL PROFESSIONS
2017COMPENSATION REPORT
WITH CANDIDATE RECRUITMENT INSIGHTS
TABLE OF CONTENTS
Letter from the CEO
Using the Report
High-Demand Professionals & Qualifications
Top Reasons for Choosing a New Position
Accounting & Finance Salary Survey Report
Adjusting Salaries by Location
Bonus Report
Century Group: Identify. Evaluate. Deliver.TM
3
4
8
12
16
24
30
26

2017 COMPENSATION REPORT | 3
DEAR COLLEAGUES,
Century Group has provided compensation
information directly to our clients, candidates
and professional associations for more
than 25 years. For the past few years, we
have shared this information more broadly
by publishing Century Group’s Compensation
Report for Financial Professions – a
comprehensive resource with the latest
data on salaries, bonus compensation
and the differences between markets
to the entire profession.
This has been an interesting time to
research salary details. After producing our
Compensation Report in 2014, salaries went
through a period of growth to catch up with
the economy, following the big post-recession
recovery. However, as with last year, we are
once again seeing more consistent numbers –
more indicative of steady economic conditions
– with an average variance of 2.5 percent.
Even with economic improvement over the
last several years, our research continues
to show that numerous variables remain
more important than compensation when it
comes to career selection. We had previously
seen that growth/opportunity and company
culture went head-to-head as the first and
second factors ahead of compensation. This
year, the opportunity for challenge and growth
has skyrocketed ahead as the top priority
LETTER FROM THE CEO
THIS YEAR, THE OPPORTUNITY
FOR CHALLENGE AND GROWTH
HAS SKYROCKETED AHEAD AS
THE TOP PRIORITY IN TODAY’S
CAREER LANDSCAPE.
“
”
in today’s career landscape. Our respondents
similarly reported the opportunity for growth
and company culture as the top two reasons
for staying with their current company rather
than seeking a new opportunity (see page 15).
Year-after-year, our respondents report that
careers are built on learning, opportunity,
responsibility, visibility, mentors and quality
companies. Weigh these factors as heavily as
compensation and you’ll enjoy greater success
and greater job satisfaction. Investing in
experience will pay greater dividends throughout
your career.
We hope you find the latest edition of Century
Group’s Compensation Report for Financial
Professions useful in salary decisions. We
also invite you to view the details about current
career opportunities, networking events
and career research at century-group.com.
We look forward to working together.
Sincerely,
Ron Proul
Chief Executive Officer
Century Group

2017 COMPENSATION REPORT | 5
USING THE REPORT
Our report was compiled using data
collected from our constituents
and other data sources available to our
wage and compensation analyst.
Our methodology thereby gives the most
current evaluation of the data available.
Along with the salaries, you will find other data in this guide to help you evaluate current and prospective opportunities, including why individuals choose opportunities or stay with their current company, and the bonuses and benefits companies are currently providing.
Accounting and finance departments are
organized in pyramids; this pyramid
serves as the framework for compensating
individuals by title and size of company.
Our report includes the salary ranges for
40 core accounting, finance, tax and audit
positions – from accounting operations
and professional level to senior executive –
covering the 25th to 75th percentile, based
on company size.
Along with the salaries, you will find other
data in this guide to help you evaluate current
and prospective opportunities, including why
individuals choose opportunities or stay
with their current company, and the bonuses
and benefits companies are currently
providing. Other qualitative considerations,
such as service time, work ethic, qualifications,
skills and the quality of employers, will impact
individual compensation decisions, as will
other factors not included in this report, such
as years of experience, size of the organization
and complexity of the work.
Please note that while this compensation report provides
current data to assist you with compensation decisions,
it cannot anticipate the effects that market forces will have
in the coming year.
We’ve provided a separate section covering
cash bonus compensation for various
professional levels in the accounting and
finance function. Other forms of compensation
– stock options, benefits and retirement
programs – are not considered in this report.
Tapping the depth of industry knowledge of our team of Executive Recruiters
and Interim Staffing professionals who are experts in accounting and
finance, and who’ve executed nearly 20,000 recruiting and interim assignments
over the last decade
Century Group’s analysis of workplace trends and hiring forecasts
Proprietary research and surveys of CFOs and accounting, finance, tax and
audit professionals and executives from 1,000+ organizations
OUR REPORT WAS DEVELOPED BY
3
2
1
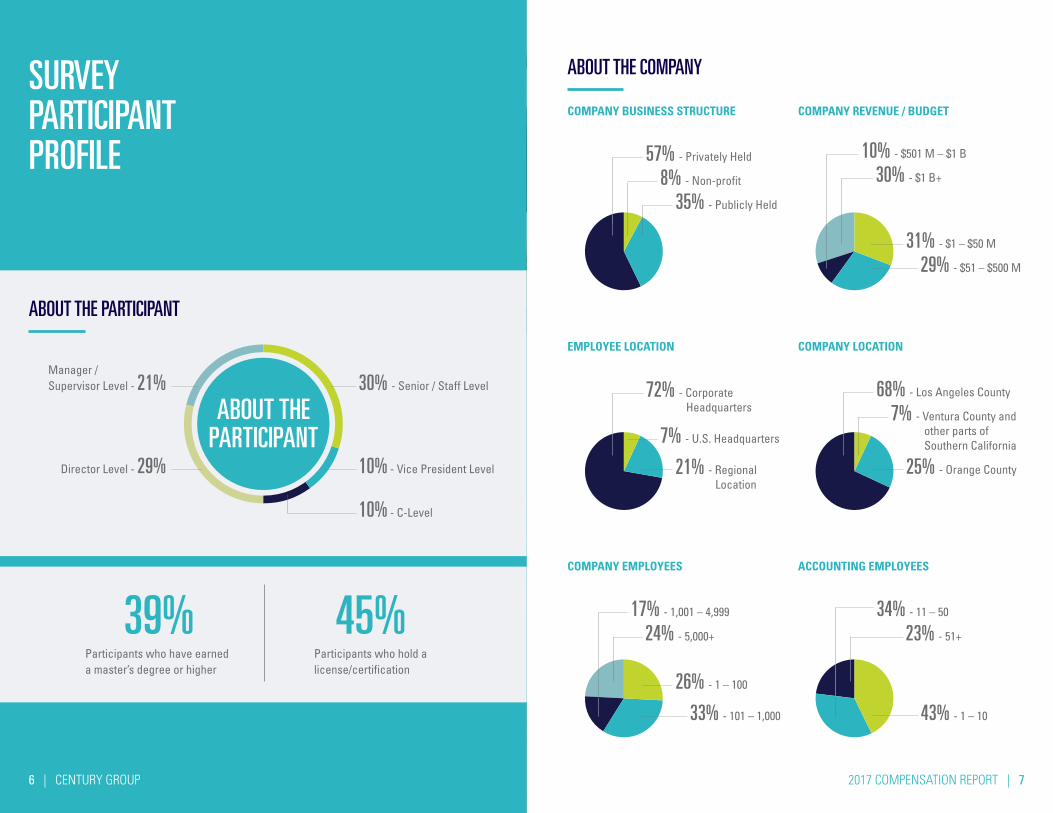
ABOUT THE COMPANY
2017 COMPENSATION REPORT | 76 | CENTURY GROUP
Manager /
Supervisor Level - 21%
Participants who hold a
license/certification
45%Participants who have earned
a master’s degree or higher
39%
ABOUT THEPARTICIPANT
ABOUT THE PARTICIPANT
30% - Senior / Staff Level
10% - Vice President Level
10% - C-Level
Director Level - 29%
COMPANY BUSINESS STRUCTURE
57% - Privately Held
8% - Non-profit
35% - Publicly Held
COMPANY REVENUE / BUDGET
10% - $501 M – $1 B
30% - $1 B+
29% - $51 – $500 M
31% - $1 – $50 M
EMPLOYEE LOCATION
7% - U.S. Headquarters
21% - Regional
Location
COMPANY LOCATION
68% - Los Angeles County
7% - Ventura County and
other parts of
Southern California
72% - Corporate
Headquarters
25% - Orange County
COMPANY EMPLOYEES ACCOUNTING EMPLOYEES
34% - 11 – 50
23% - 51+
43% - 1 – 10
17% - 1,001 – 4,999
24% - 5,000+
33% - 101 – 1,000
26% - 1 – 100
SURVEY PARTICIPANT PROFILE

HIGH-DEMANDPROFESSIONALS & QUALIFICATIONS
Since 2010, we’ve witnessed a significant
increase in the hiring of professional-
level and management-level employees
across multiple disciplines in accounting,
finance, tax and audit.
The surge in hiring for professionals,
particularly for those with specific skills,
continued to drive down the unemployment
rate nationwide. According to some economists,
we’ve essentially reached full-employment,
particularly for those with college degrees.
The unemployment rate for college graduates
remained at 2.5%, down from 2.9% in 2014,
representing a nearly 14% decline. On top
of that, unemployment is estimated at
1.6% for those with in-demand advanced
credentials, such as CPAs and MBAs.
We see these trends in our daily work with
clients as they seek in-demand qualified
professionals for their teams to execute
growth strategies and take advantage of new
opportunities. We also continue to see a
demand for advanced degrees and credentials,
as well as Big 4 and Fortune 500 experience.
2017 COMPENSATION REPORT | 9
HIGH-DEMAND ROLES IN ACCOUNTING & FINANCE
ACCOUNTANTS
We are seeing the highest demand for
accountants at the senior level. Demand is
especially high for professionals with
a CPA license and 2+ years of experience.
CONTROLLERS AND ACCOUNTING MANAGERS
These continue to be the crucial roles for
expanding companies. The increase in scrutiny
and compliance requirements make these key
management roles.
AUDITORS
Demand for internal auditors remains strong
in private industry as companies deal with
increased regulatory and compliance
requirements. The demand for auditors at CPA
firms has expanded dramatically as these firms
respond to increased client activity. The CPA
designation remains the most in-demand in the
audit profession.

2017 COMPENSATION REPORT | 1110 | CENTURY GROUP
HIGH-DEMAND CREDENTIALS
CPA
We are seeing particularly high demand for
accounting professionals that are also Certified
Public Accountants (CPAs). Achieving a CPA
credential is critical for career advancement
in the accounting, finance, tax and audit
functions. The CPA designation is the most
frequently required credential. CPAs with
Big 4 accounting firm experience are seeing
even higher demand.
MBA
A master’s degree in business administration
(MBA) continues to be the credential most
sought after for senior-level executive and
mid-management roles in corporate finance.
FINANCIAL ANALYSTS
As with the other roles on this list, the demand
for senior financial analysts is greater than the
supply at present. The most in-demand position
is the Senior Financial Analyst with an MBA
and 5+ years’ experience in private industry or
leading management consultancies.
FINANCE MANAGEMENT
As the economy has improved, we’ve noted an
increase in demand for financial management.
Emerging and growing companies are seeking
experienced managers to build out the finance
function and develop the corporate infrastructure.

2017 COMPENSATION REPORT | 13
TOP REASONS FORCHOOSING A NEW POSITION
The hiring environment for accounting
and finance professionals has continued
to improve over the past few years,
and this change is no longer a surprise
to most companies. The general public is largely unaware of the
talent shortage facing certain professions. The
national unemployment rate remains below
5.0% – a nine-year low – and as noted earlier,
the national unemployment rate for college
graduates is 2.5%.
The low unemployment rate for accounting
and finance professionals has left companies
struggling to find the right talent with
the credentials and experience to meet the
challenges of an expanding economy.
Companies often turn to us for insights
on how top talent makes career decisions.
As companies compete for highly sought
after accounting and finance talent, they are
revisiting how they attract key professionals.
As you will see on the next page,
Growth/Challenge/Role became the top
priority for professionals choosing a new
position, followed by compensation and
company culture. To attract the best talent,
employers need to present opportunities in
terms of GROWTH potential, the CHALLENGE
of assignments and the contribution of an
individual ROLE.
They also need to be ready to compensate
professionals at a market rate. The market for
talent is tightening and it’s leading to multiple
competitive offers for leading professionals.
A great company culture, challenging
assignment or interesting role won’t make
up for a lower than market offer.
Even though compensation edged ahead of
culture to the number two spot this year, when
top performers have multiple offers providing
growth and challenge, we consistently
see them consider the company’s culture as
a reason to accept the role. This is also the
main reason these professionals choose to
remain at their current company. Competitive
compensation still remains a powerful tool for
attracting and rewarding top performers, but
fit with the culture and management is critical
for these professionals.
The market for talent is tightening and it’s leading to multiple competitive offers for leading professionals. A great company culture, challenging assignment or interesting role won’t make up for a lower than market offer.

2017 COMPENSATION REPORT | 1514 | CENTURY GROUP
► PROMOTION OPPORTUNITIES
AND CLEARLY DEFINED CAREER PATHS
► CONTINUING PROFESSIONAL
DEVELOPMENT AND TRAINING
► PERFORMANCE BONUSES
► FLEXIBLE SCHEDULES
► LOCATION / COMMUTE
40%
9%
19%
7%
2%
16%
5%
In addition to offering competitive compensation,
the most effective tools for attracting top
accounting and finance talent are:
Not only are these tools effective in attracting
top talent, they also help companies guard
against the departure of high performers.
Although the average variance in data for
this past year was 2.5%, 73% of those surveyed
earned an increase with their last review,
promotion or job change.
Average variance in data from 2016 to 2017
Average percentage increase reported from
a promotion or job change last year
2.5%
12.25%30%
13%
27%
5%
2%
15%
4%
Our annual survey has revealed the top reasons accounting and finance
professionals give for selecting their current company.
TOP REASONS FOR CHOOSING A NEW POSITION
GROWTH OPPORTUNITY / CAREER
CHALLENGE / POSITION OR ROLE
COMPENSATION & BENEFITS PACKAGE
COMPANY CULTURE / FIT WITH
MANAGEMENT & TEAM
WORK / LIFE BALANCE & FLEXIBILITY
COMMUTE / LOCATION
COMPANY STABILITY
JOB STABILITY
1.
4.
2.
5.
7.
3.
6.
Our annual survey has revealed the top reasons accounting and finance
professionals give for staying at their current company.
TOP REASONS FOR STAYING AT A COMPANY
COMPANY CULTURE / FIT WITH
MANAGEMENT & TEAM
GROWTH OPPORTUNITY / CAREER
CHALLENGE / POSITION OR ROLE
COMPENSATION & BENEFITS PACKAGE
WORK / LIFE BALANCE & FLEXIBILITY
COMPANY STABILITY
JOB STABILITY
COMMUTE / LOCATION
1.
4.
2.
5.
7.
3.
6.

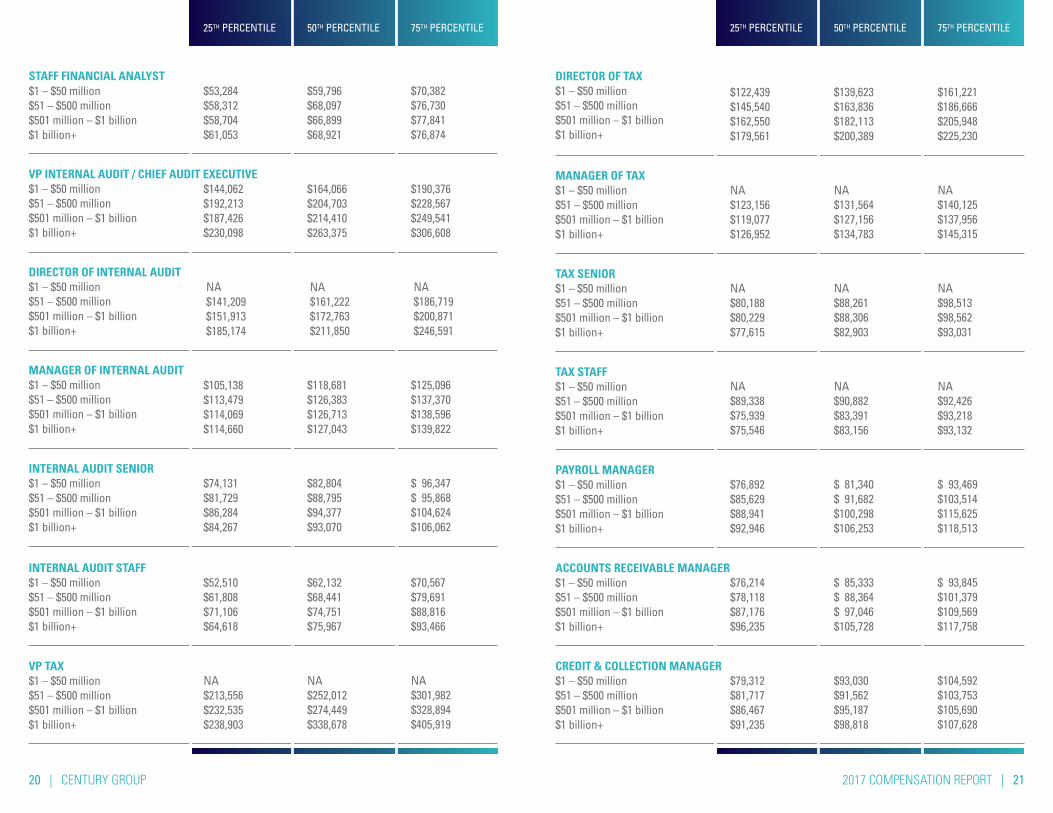
ACCOUNTING & FINANCESALARY SURVEY REPORT
Divided into two categories –
Corporate Finance & Accounting and
Public Accounting – our report covers
salary ranges for 40 positions, from
accounting operations and professional
level to senior executive.
2017 COMPENSATION REPORT | 17

2017 COMPENSATION REPORT | 19
25TH PERCENTILE 50TH PERCENTILE 75TH PERCENTILE25TH PERCENTILE 50TH PERCENTILE 75TH PERCENTILE
18 | CENTURY GROUP
CORPORATE FINANCE & ACCOUNTING
ASSISTANT CONTROLLER / ACCOUNTING MANAGER
$1 – $50 million
$51 – $500 million
$501 million – $1 billion
$1 billion+
CONTROLLER (CORPORATE & REGIONAL)
$1 – $50 million
$51 – $500 million
$501 million – $1 billion
$1 billion+
SENIOR ACCOUNTANT
$1 – $50 million
$51 – $500 million
$501 million – $1 billion
$1 billion+
CHIEF ACCOUNTING OFFICER
$1 – $50 million
$51 – $500 million
$501 million – $1 billion
$1 billion+
STAFF ACCOUNTANT
$1 – $50 million
$51 – $500 million
$501 million – $1 billion
$1 billion+
CHIEF FINANCIAL OFFICER
$1 – $50 million
$51 – $500 million
$501 million – $1 billion
$1 billion+
$155,462
$237,343
$305,054
$372,765
$47,402
$56,292
$57,561
$57,044
$101,479
$154,239
$144,763
$176,859
$ 96,274
$103,808
$108,183
$107,558
$63,636
$65,591
$65,916
$67,100
$204,110
$310,178
$395,063
$479,948
$54,273
$59,555
$59,329
$61,599
$137,261
$184,940
$192,173
$236,413
$145,643
$183,301
$206,473
$233,862
$107,862
$114,399
$118,149
$118,399
$72,259
$73,052
$75,391
$76,215
$257,369
$384,509
$490,313
$596,117
$61,288
$64,765
$64,445
$67,399
$180,827
$216,119
$255,029
$313,950
$184,752
$225,870
$258,645
$303,469
$119,321
$126,486
$132,111
$135,486
$81,400
$82,228
$83,381
$83,284
$112,688
$144,318
$164,569
$184,433
DIRECTOR OF FINANCIAL REPORTING
$1 – $50 million
$51 – $500 million
$501 million – $1 billion
$1 billion+
MANAGER OF FINANCIAL REPORTING
$1 – $50 million
$51 – $500 million
$501 million – $1 billion
$1 billion+
FINANCE MANAGER
$1 – $50 million
$51 – $500 million
$501 million – $1 billion
$1 billion+
DIRECTOR OF FINANCE
$1 – $50 million
$51 – $500 million
$501 million – $1 billion
$1 billion+
SENIOR FINANCIAL ANALYST
$1 – $50 million
$51 – $500 million
$501 million – $1 billion
$1 billion+
VP FINANCE
$1 – $50 million
$51 – $500 million
$501 million – $1 billion
$1 billion+
TREASURER
$1 – $50 million
$51 – $500 million
$501 million – $1 billion
$1 billion+
$161,026
$219,489
$243,508
$302,658
$75,394
$79,006
$82,241
$79,738
$151,512
$171,209
$184,792
$222,496
$128,813
$137,416
$148,876
$154,237
$ 99,244
$110,774
$115,185
$112,657
$102,585
$111,996
$118,033
$115,121
$186,567
$255,844
$283,881
$352,890
$85,488
$88,314
$89,218
$88,956
$166,476
$200,415
$212,433
$253,405
$149,108
$157,370
$164,562
$171,143
$ 94,468
$140,481
$151,294
$165,573
$113,618
$124,531
$131,185
$128,246
$113,450
$120,989
$125,989
$128,489
$220,847
$303,082
$336,324
$418,130
$97,063
$96,516
$97,152
$97,847
$189,943
$230,463
$239,495
$293,527
$182,379
$177,860
$183,676
$187,147
$ 98,992
$167,522
$175,568
$185,662
$123,501
$136,124
$142,218
$138,842
$130,901
$137,693
$142,568
$140,943
$ 91,286
$132,534
$135,139
$138,482
2017 COMPENSATION REPORT | 21
25TH PERCENTILE 50TH PERCENTILE 75TH PERCENTILE25TH PERCENTILE 50TH PERCENTILE 75TH PERCENTILE
20 | CENTURY GROUP
TAX STAFF
$1 – $50 million
$51 – $500 million
$501 million – $1 billion
$1 billion+
PAYROLL MANAGER
$1 – $50 million
$51 – $500 million
$501 million – $1 billion
$1 billion+
ACCOUNTS RECEIVABLE MANAGER
$1 – $50 million
$51 – $500 million
$501 million – $1 billion
$1 billion+
TAX SENIOR
$1 – $50 million
$51 – $500 million
$501 million – $1 billion
$1 billion+
CREDIT & COLLECTION MANAGER
$1 – $50 million
$51 – $500 million
$501 million – $1 billion
$1 billion+
VP TAX
$1 – $50 million
$51 – $500 million
$501 million – $1 billion
$1 billion+
DIRECTOR OF TAX
$1 – $50 million
$51 – $500 million
$501 million – $1 billion
$1 billion+
MANAGER OF TAX
$1 – $50 million
$51 – $500 million
$501 million – $1 billion
$1 billion+
NA
$123,156
$119,077
$126,952
$79,312
$81,717
$86,467
$91,235
NA
$213,556
$232,535
$238,903
$122,439
$145,540
$162,550
$179,561
NA
$80,188
$80,229
$77,615
$76,892
$85,629
$88,941
$92,946
$76,214
$78,118
$87,176
$96,235
NA
$131,564
$127,156
$134,783
$93,030
$91,562
$95,187
$98,818
NA
$252,012
$274,449
$338,678
$139,623
$163,836
$182,113
$200,389
NA
$88,261
$88,306
$82,903
NA
$90,882
$83,391
$83,156
$ 81,340
$ 91,682
$100,298
$106,253
$ 85,333
$ 88,364
$ 97,046
$105,728
NA
$140,125
$137,956
$145,315
$104,592
$103,753
$105,690
$107,628
NA
$301,982
$328,894
$405,919
VP INTERNAL AUDIT / CHIEF AUDIT EXECUTIVE
$1 – $50 million
$51 – $500 million
$501 million – $1 billion
$1 billion+
DIRECTOR OF INTERNAL AUDIT
$1 – $50 million
$51 – $500 million
$501 million – $1 billion
$1 billion+
MANAGER OF INTERNAL AUDIT
$1 – $50 million
$51 – $500 million
$501 million – $1 billion
$1 billion+
STAFF FINANCIAL ANALYST
$1 – $50 million
$51 – $500 million
$501 million – $1 billion
$1 billion+
INTERNAL AUDIT SENIOR
$1 – $50 million
$51 – $500 million
$501 million – $1 billion
$1 billion+
$74,131
$81,729
$86,284
$84,267
$53,284
$58,312
$58,704
$61,053
NA
$141,209
$151,913
$185,174
$105,138
$113,479
$114,069
$114,660
$82,804
$88,795
$94,377
$93,070
$59,796
$68,097
$66,899
$68,921
$164,066
$204,703
$214,410
$263,375
NA
$161,222
$172,763
$211,850
$118,681
$126,383
$126,713
$127,043
$ 96,347
$ 95,868
$104,624
$106,062
$70,382
$76,730
$77,841
$76,874
$190,376
$228,567
$249,541
$306,608
NA
$186,719
$200,871
$246,591
$125,096
$137,370
$138,596
$139,822
$144,062
$192,213
$187,426
$230,098
INTERNAL AUDIT STAFF
$1 – $50 million
$51 – $500 million
$501 million – $1 billion
$1 billion+
$52,510
$61,808
$71,106
$64,618
$62,132
$68,441
$74,751
$75,967
$70,567
$79,691
$88,816
$93,466
$161,221
$186,666
$205,948
$225,230
NA
$98,513
$98,562
$93,031
NA
$92,426
$93,218
$93,132
$ 93,469
$103,514
$115,625
$118,513
$ 93,845
$101,379
$109,569
$117,758
NA
$89,338
$75,939
$75,546

2017 COMPENSATION REPORT | 23
25TH PERCENTILE 50TH PERCENTILE 75TH PERCENTILE25TH PERCENTILE 50TH PERCENTILE 75TH PERCENTILE
22 | CENTURY GROUP
BILLING SPECIALIST
$1 – $50 million
$51 – $500 million
$501 million – $1 billion
$1 billion+
ACCOUNTS PAYABLE SPECIALIST
$1 – $50 million
$51 – $500 million
$501 million – $1 billion
$1 billion+
ACCOUNTS RECEIVABLE SPECIALIST
$1 – $50 million
$51 – $500 million
$501 million – $1 billion
$1 billion+
ACCOUNTS PAYABLE MANAGER
$1 – $50 million
$51 – $500 million
$501 million – $1 billion
$1 billion+
PAYROLL SPECIALIST
$1 – $50 million
$51 – $500 million
$501 million – $1 billion
$1 billion+
$48,563
$51,287
$50,846
$52,309
$73,339
$72,118
$84,176
$96,235
$36,085
$37,245
$37,560
$37,198
$36,201
$37,278
$37,638
$37,255
$55,644
$57,638
$56,192
$59,747
$ 81,083
$ 84,714
$ 95,221
$105,728
$40,455
$41,867
$41,630
$41,857
$36,000
$43,600
$41,105
$42,412
$40,628
$41,875
$41,646
$42,175
$64,660
$64,417
$65,934
$68,222
$ 94,720
$ 96,692
$107,225
$117,758
$46,166
$46,649
$46,875
$47,402
$39,500
$51,013
$49,658
$45,144
$46,407
$46,506
$46,988
$47,649
$31,500
$40,630
$39,679
$38,491
PUBLIC ACCOUNTING
TAX PARTNER
Small Firm
Mid-Size Firm
Large Firm
Total Compensation*
AUDIT PARTNER
Small Firm
Mid-Size Firm
Large Firm
Total Compensation*
AUDIT SENIOR
Small Firm
Mid-Size Firm
Large Firm
AUDIT MANAGER
Small Firm
Mid-Size Firm
Large Firm
TAX SENIOR
Small Firm
Mid-Size Firm
Large Firm
TAX MANAGER
Small Firm
Mid-Size Firm
Large Firm
TAX SENIOR MANAGER
All Firms
AUDIT SENIOR MANAGER
All Firms
$69,379
$73,418
$78,126
$117,270
$141,917
$149,958
$110,000
$138,600
$69,379
$72,610
$78,087
$117,292
$120,132
$143,460
$76,745
$85,061
$87,038
$130,332
$158,033
$166,620
$116,000
$175,200
$76,745
$83,551
$87,037
$130,368
$133,689
$158,787
$218,238
$227,875
$242,961
$650,363
$215,978
$225,007
$239,738
$588,862
$85,655
$92,070
$95,706
$148,522
$179,220
$189,947
$191,000
$177,600
$85,655
$90,138
$95,534
$148,629
$152,339
$180,001
$ 244,468
$ 247,835
$ 251,886
$1,398,462
$ 240,689
$ 244,134
$ 243,540
$1,437,556
$198,565
$192,877
$216,126
$249,232
$192,694
$216,810
$223,225
$245,476
*The total compensation line reflects
the average all cash compensation for
the Partner level
95.3%PHILADELPHIA
101.4%WASHINGTON DC
& SURROUNDINGME TRO ARE A
87.1%CHARLOTTE88.0%
ATLANTA
90.6%DALLAS
92.1%HOUSTON
99.6%SEATTLE
83.5%SALT LAKE
111.4%SAN FRANCISCO
111.4%SAN JOSE
100.0%LOS ANGELES
96.7%SAN DIEGO
85.2%PHOENIX
92.6%DENVER
96.7%CHICAGO
88.0%ST LOUIS
103.7%BOSTON
108.2%NEW YORK
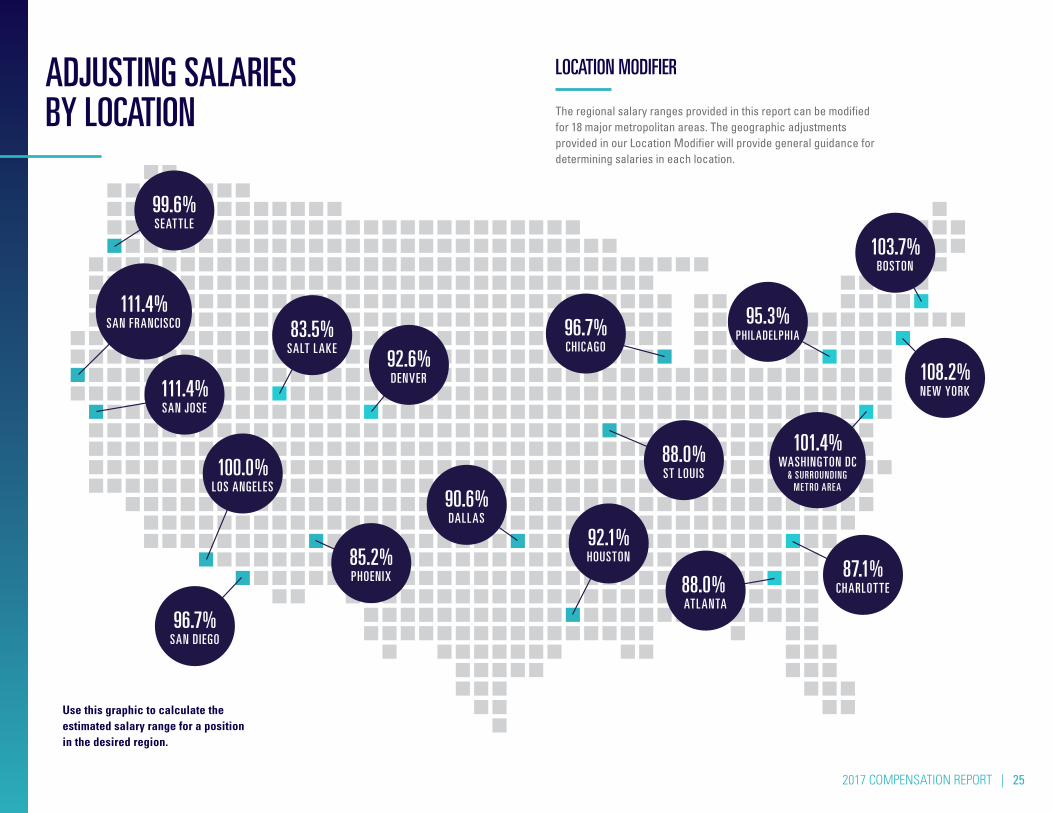
Use this graphic to calculate the
estimated salary range for a position
in the desired region.
2017 COMPENSATION REPORT | 25
ADJUSTING SALARIES BY LOCATION The regional salary ranges provided in this report can be modified
for 18 major metropolitan areas. The geographic adjustments
provided in our Location Modifier will provide general guidance for
determining salaries in each location.
LOCATION MODIFIER

2017 COMPENSATION REPORT | 27
BONUS REPORT
Bonuses have become an increasing
part of the overall compensation
offer. Positioned as incentives for
performance, they also include other
factors such as company performance,
individual performance and overall
market conditions.
Our research shows that bonus compensation
is currently the second most common form of
non-salary compensation, behind only Medical,
Dental, Life and Vision Insurance.
Once again, company size played a significant
role in bonus structures, as the more
aggressive bonus rates were used by mid-
market companies to beat out Fortune 1000
companies in the competition for top talent.
The more aggressive bonus rates were used by mid-market companies to beat out Fortune 1000 companies in the competition for top talent.
OTHER FORMS OF COMPENSATION
401(k) with Company Match71%
Wellness Benefits35%
Tuition Reimbursement41%
Flextime21%
Pension11%
Disability65%
Stock Options / ESPP22%
Profit Sharing13%
Employee Assistance Program38%
Exercise Facilities19%
Day Care4%

2017 COMPENSATION REPORT | 29
25TH PERCENTILE 50TH PERCENTILE 75TH PERCENTILE
28 | CENTURY GROUP
ACCOUNTING & FINANCE CASH BONUS SURVEY REPORT
CONTROLLER LEVEL
$1 – $50 million
$51 – $500 million
$501 million – $1 billion
$1 billion+
DIRECTOR LEVEL
$1 – $50 million
$51 – $500 million
$501 million – $1 billion
$1 billion+
MANAGER / SUPERVISOR LEVEL
$1 – $50 million
$51 – $500 million
$501 million – $1 billion
$1 billion+
VICE PRESIDENT LEVEL
$1 – $50 million
$51 – $500 million
$501 million – $1 billion
$1 billion+
SENIOR / STAFF LEVEL
$1 – $50 million
$51 – $500 million
$501 million – $1 billion
$1 billion+
C-LEVEL
$1 – $50 million
$51 – $500 million
$501 million – $1 billion
$1 billion+
20.0%
25.0%
45.0%
35.0%
19.8%
22.5%
21.3%
25.0%
10.0%
17.0%
20.0%
20.0%
20.0%
15.0%
22.5%
15.8%
10.0%
10.0%
10.0%
10.0%
10.0%
5.8%
8.0%
7.5%
27.5%
35.0%
50.0%
40.0%
27.5%
25.0%
27.5%
35.0%
20.0%
20.0%
20.0%
25.0%
25.0%
16.0%
25.0%
20.0%
10.0%
10.0%
10.0%
15.0%
10.0%
9.0%
8.0%
10.0%
50.0%
42.5%
57.5%
45.0%
33.8%
37.5%
45.0%
50.0%
20.0%
20.0%
25.0%
25.0%
30.0%
20.0%
27.5%
25.0%
25.0%
12.3%
20.0%
20.0%
20.0%
10.0%
10.0%
10.0%
IN OUR INDEPENDENT RESEARCH, WE NOTED THAT:
Of the companies surveyed had a bonus compensation program
Of those surveyed at these companies were awarded bonuses
Of the bonus target was awarded on average
72%
90%
47%

Our clients are leading private and public
organizations – ranging from start-up to emerging
mid-market to global Fortune 1000 enterprises.
IDENTIFY. EVALUATE. DELIVER.TM
CENTURY GROUP:
Century Group connects top tier finance
and accounting professionals to the
companies that need them. That’s it.
No operations directors or marketing
VPs or CIOs. Just finance and
accounting, professional to executive
level, on a project, interim or direct
placement basis. It’s what we know.
And what we’re known for.
Our scale and expertise enable us to identify, evaluate and deliver professional and executive talent that no one else can.

32 | CENTURY GROUP
1 PROCESS3 PHASESEVERY BOX TICKED
Learn more at www.century-group.com
IDENTIFY EVALUATE DELIVER
1PHASE
3PHASE
2PHASE
From on-demand project staffing to time-sensitive executive searches, our solutions
are individually designed to meet each company’s specific needs and goals. All by way
of the same process:
Our scale and expertise enable us to identify,
evaluate and deliver professional and executive
talent that no one else can. Over the years, we
have developed extensive functional and industry
expertise and an unrivaled external network.
EXECUTIVE SEARCH
& PROFESSIONAL RECRUITMENT
Unlike other recruitment firms, we don’t
specialize in finance and accounting.
We’re experts in it. So we have an intimate
understanding of the level of insight, expertise
and finely honed talent companies need to
mitigate risk, boost performance and drive
growth. We’ve been developing relationships
with candidates who bring precisely that
for more than 25 years. With our dedicated
focus and insider access to prime candidates,
Century Group delivers the best of the best.
More swiftly and surely than the rest.
INTERIM & PROJECT SERVICES
Whether you’ve suddenly lost your CFO or a
new project demands more expertise than you
have in-house, our senior-level professionals
are ready and able to bridge the gap. Using
our proven executive search methodology,
we’ve hired some of the field’s leading talent
as our own. Their sophisticated skill sets and
seasoned business acumen make these Big 4
and Fortune 500 veterans an asset to your team
and ours. With Century Group, when the need
is immediate, so is the solution.
POSITIONS FILLED
In the last decade, we’ve conducted nearly
20,000 search and interim assignments for
leading Southern California-based companies
in a growing range of industries, successfully
filling positions such as:
ACCOUNTING
FINANCE
AUDIT & TAX
Chief Accounting Officer
Vice President, Accounting
Controller
Assistant Controller
Director of Accounting
Accounting Manager
Senior Accountant
Chief Financial Officer
Treasurer
Vice President, Finance
Director of Finance
Finance Manager
Senior Analyst
Partner (CPA Firm)
Vice President, Tax
Director of Internal Audit / Risk
Tax Manager
Audit Manager
Senior Professional, Tax or Audit

EL SEGUNDO COSTA MESA GLENDALE WESTLAKE VILLAGE
www.century-group.com800.337.9675