2017 colorado political climate report · state firmly disapprove of trump, overwhelmingly dislike...
TRANSCRIPT

Colorado Political Climate Survey
January 2018
Carey E. Stapleton Graduate Fellow
E. Scott Adler Director
Anand E. Sokhey Associate Director

1
Updated 1/28/18
[Corrections: Headers for current state of race relations (Table A38) by race of respondent were flipped but have been updated to reflect the accurate headers. Observations for the generic congressional ballot (Table A46) by Urban/Rural/Suburban were updated to the correct count.]
About the Study:
American Politics Research Lab The American Politics Research Lab (APRL) is housed in the Department of Political Science at the University of Colorado Boulder. APRL is a non-partisan academic unit that supports basic research, educational activities, and public engagement on issues related to American politics. Lab faculty, student fellows, and affiliates pursue scholarly activities over a broad range of topics, utilizing a wide variety of research methodologies and analysis. Current lab projects include research on political behavior, state and local politics, and political agendas and recurring legislation in the U.S. Congress. The Lab is also home to the annual Colorado Political Climate survey. APRL hosts a seminar series that includes talks by lab associates as well as distinguished scholars doing work related to the study of American politics.
Colorado Political Climate Survey In November 2017, the American Politics Research Lab (APRL) conducted the second annual Colorado Political Climate (CPC) survey. The CPC is a survey of the political and policy attitudes of Coloradans. The study is designed to gauge the public’s political and partisan leanings, their opinions on a number of key issues facing the state, their attitudes toward major statewide and national political figures, and the outlook for the coming 2018 election season.
Methodology The sample is representative of the Colorado population. It consists of 800 individual responses and has an overall margin of error of +/- 3.5%. The margin of error for subgroups is larger due to smaller sample sizes.

2
The survey instrument was developed by APRL in the fall of 2017; it was administered online to a panel of Coloradans by the company YouGov between November 9-15, 2017. To generalize to the state of Colorado, YouGov employed a matching weighting procedure – 950 panelists initially completed the online survey. These 950 individuals were then weighted to match Colorado on demographic characteristics, leaving a slightly smaller sample of 800 (weighted) responses for analysis. We use YouGov’s weights for all analysis. The average time it took a respondent to complete the survey was 10 minutes, 11 seconds. The sampling methodology employed by YouGov for the 2017 CPC survey can be found: https://www.colorado.edu/lab/aprl/sites/default/files/attached-files/2017_cpc_yougov_samplingmethodology.pdf In the sections that follow, we report some basic analysis, comparing responses to questions repeated across 2016 and 2017. Please note that some caution is warranted in making comparisons between the 2016 and 2017 studies due to differences in sampling/survey methodology. More information on the 2016 study can be found at: https://www.colorado.edu/lab/aprl/sites/default/files/attached-files/colorado_political_climate_topline_report_2016.pdf Acknowledgements: We would like to acknowledge the undergraduate students in the Survey Design and Analysis class at the University of Colorado Boulder who provided valuable assistance in the development and execution of this survey. We also wish to thank the CU Boulder College of Arts and Sciences, Undergraduate Education Development Program for its financial support.
American Politics Research Lab Department of Political Science University of Colorado Boulder 382 Ketchum Hall, UCB 333
Boulder, CO 80309 https://www.colorado.edu/lab/aprl/

3
Table of Contents
Summary: Partisan Politics as Usual 4
Colorado Political Landscape 4 1. General Impressions and National Political Figures 4 2. Colorado Political Figures 5 3. Approval of State Government and Trust in Government 6 4. Policy Issues 6 5. Elections 9
Appendix: Responses to Individual Survey Questions by Year 11 Partisan Identification 11 Statewide Elected Official Approval Ratings 11 Political Institutions Approval Ratings 15 Trust in Government 17 Most Important Problem 19 State of Economy 22 Individual Policy Questions 23 General Political Questions 31 Election Questions 32

4
Summary: Partisan Politics as Usual At the end of 2017 we saw a Colorado largely in-line with national opinion, and with familiar narratives concerning division and partisanship. Residents of the Centennial State firmly disapprove of Trump, overwhelmingly dislike Congress, and give a sizable edge to Democrats in a generic congressional election ballot as we look to November 2018. At the same time, whether examining state-specific or national matters, on everything from approval of elected officials to opinions on marijuana policy and climate change, we see substantial differences between Democrats and Republicans. A notable exception is belief in the integrity of elections, where a majority of Democrats and Republicans both report confidence that votes are counted fairly.
Colorado Political Landscape
1. General Impressions and National Political Figures In both years of the survey, the number of Coloradans identifying as Democrats outpaced the number identifying as Republicans (Table A1). While it remains to be seen whether Colorado is truly shifting from “purple” to “blue” in the longer term, our numbers from the past two years would seem to be consistent with such a trend.
Approval of the U.S. Congress by Coloradans is quite low and reflects similar national sentiment (Table A11). Only 14% of respondents approved of the job performance of Congress, and this is down from what was already a low approval rating for the U.S. Congress among Coloradans in 2016. We see few differences by partisanship when it comes to disapproval of the legislative body on Capitol Hill (Table A12).
There was a much more dramatic shift in Coloradans’ assessment of presidential job performance (Table A2). Whereas a majority (57%) of state residents either approved or strongly approved of Obama’s job performance in 2016, that number dropped to 34% approval for Trump in our 2017 study. Those strongly disapproving nearly doubled from 26% to 51%. As we might expect, large differences emerge if we break this out by partisanship – almost every Democrat disapproved of Trump’s job performance (95%), while a strong majority of Colorado Republicans approved of Trump’s first year in office (79%; Table A3). There is some suggestion of a gender gap in support for Trump, with more men expressing approval or strong approval than women (38% vs. 32%; Table A4).

5
Despite 2016’s narratives concerning voting fraud and election tampering, a clear majority (59%) of Coloradans feel their votes are counted fairly always or most of the time, and there is no discernable difference in this opinion between Democrats and Republicans (Table A9). Interestingly, those Coloradans most approving of Trump’s presidential performance are also very confident that their votes are counted correctly (Table A10).
2. Colorado Political Figures Governor John Hickenlooper saw a small dip in his job approval from 2016, but a majority of Coloradans (53%) still approve or strongly approve of his work in office (Table A5). Senator Michael Bennet also saw a drop in his job performance rating from 2016, with less than a majority of his constituents (44%) approving of his work for them (Figure 1; tables A6 & A7).
Figure 1: Approval of United State Senators from Colorado
Senator Cory Gardner, however, saw the biggest change in job approval among statewide elected officials. Only a quarter of Coloradans approve of his job performance in 2017, a sizable drop from his 43% approval rating in 2016. Not only is Gardner’s overall approval ratings very low among Democrats (12%) -- as we might expect -- but he scores quite poorly among Independents (23%) and even lacks majority approval among Republicans (46%; Figures 1 and 2; Table A8).

6
Figure 2: Approval of Senator Gardner by Political Identification
3. Approval of State Government and Trust in Government Approval of the job performance by the state legislature has fallen somewhat from 2016 (Table A14). Whereas a slim majority (51%) of Coloradans previously approved or strongly approved of the work of state lawmakers, that approval has dropped to 43%. Approval of the state legislature is far greater among Democrats (60%) than it is among Republicans (27%; Table A15).
As gauged by whether people trust government to do what is right “most of the time” or “always,” trust in local and state government saw little change across years (Table A17). Mirroring patterns found elsewhere, Coloradans express the least trust towards the federal government and the most trust towards local government, with support for state government sitting in-between (Table A16). A plurality in 2017 report trusting the state government “most of the time.” Interestingly, trust in the federal government seems to have diminished sizably since 2016. Those who said they trust the federal government always or most of the time dropped from 1-in-4 to 1-in-10.
4. Policy Issues For the second year, Coloradans in 2017 viewed the economy and health care as the most important issues facing the nation, though in a switch from 2016 a quarter saw health care as most important (Table A20). Rounding out the top four named issues are national defense and immigration. Respondents in more rural areas of Colorado named crime an important national issue at higher rates than did suburban and urban respondents (Table A21).

7
When asked about the most important issue facing the state of Colorado, crime gets added to the mix of familiar issues by respondents (Table A22). Health care, while still a top issue, does not have the same prominence at the state level as it does when respondents report on national priorities. Looking at responses by location, rural residents see health care as far and away the most important issue facing the state, while in a switch, Coloradans in urban areas see crime as the greatest concern for the state (Table A23).
We also asked Coloradans their specific opinions on a wide array of state and national issues. Here’s what they said:
Marijuana The recent announcement by the Justice Department regarding its approach to state marijuana laws puts Colorado’s legalization of recreational pot front and center in coming elections. Notably, for the second year in a row two-thirds of Coloradans favor the current approach to legal marijuana (Table A26). Democrats heavily favor the current pot law, with a notable increase in Democrats who strongly favor the statute (Figure 3; Table A27). Opinion among Republicans remains largely unchanged from 2016. Figure 3: Support for Colorado’s Recreational Marijuana Law by Partisanship
Taxpayer’s Bill of Rights (TABOR) On TABOR, support among Coloradans outpaces opposition (45% to 26%; Table A28). Supporters are down about 8% from 2016, though in both years a substantial portion of the public expresses uncertainty about a position (nearly 30% of respondents in 2017). Despite its notoriety, TABOR would appear to remain a “hard” issue for which many are hesitant to offer an opinion.

8
Health Care Half of Coloradans support a single payer health care system, which is slightly below the national average (Table A29).1 Not surprisingly, this gets far more support among Democrats than Republicans (Table A30).
Gun Control Over 60% of Coloradans favor increased federal gun control measures, which is nearly identical to the national average (Table A31).2 As we might expect, there is much higher support for stepped-up regulation among Democrats than Republicans (Table A32).
Immigration Overall, just under three-quarters of Coloradans (71%) favor allowing “Dreamers” to stay in the country (Table A33). Broken out by partisanship (Figure 4; Table A34), the issue gets sizable support from Democrats and independents. Moreover, even a majority of Republicans (52%) express support for a DACA-type policy, which coincides with the overall popularity of the program.
Figure 4: Support for Dreamers by Partisanship
Climate Change Half of Coloradans reported being concerned or very concerned about climate change – a percentage that is comparable to 2016 (Table A35). As we might expect, the numbers break out quite a bit differently by partisanship, with most Democrats
1 http://www.pollingreport.com/health.htm 2 http://www.pollingreport.com/guns.htm
9
expressing concern (72%), but only a minority of Republicans (20%) reporting the same (Table A36). Race Relations Three-quarters of Coloradans see race relations being somewhat or really bad (Table A37). Interestingly, the percentage of whites that think its bad (74%) is nearly identical and maybe even higher than the same percentage of minorities (72%; Table A38). Corporate Tax Incentives A majority of respondents (56%) express support for tax incentives to entice large companies like Amazon to locate their business in Colorado (Table A39).
5. Elections Looking toward the 2018 midterm elections, our survey corresponds with other
polls in providing Democrats with reason for optimism.
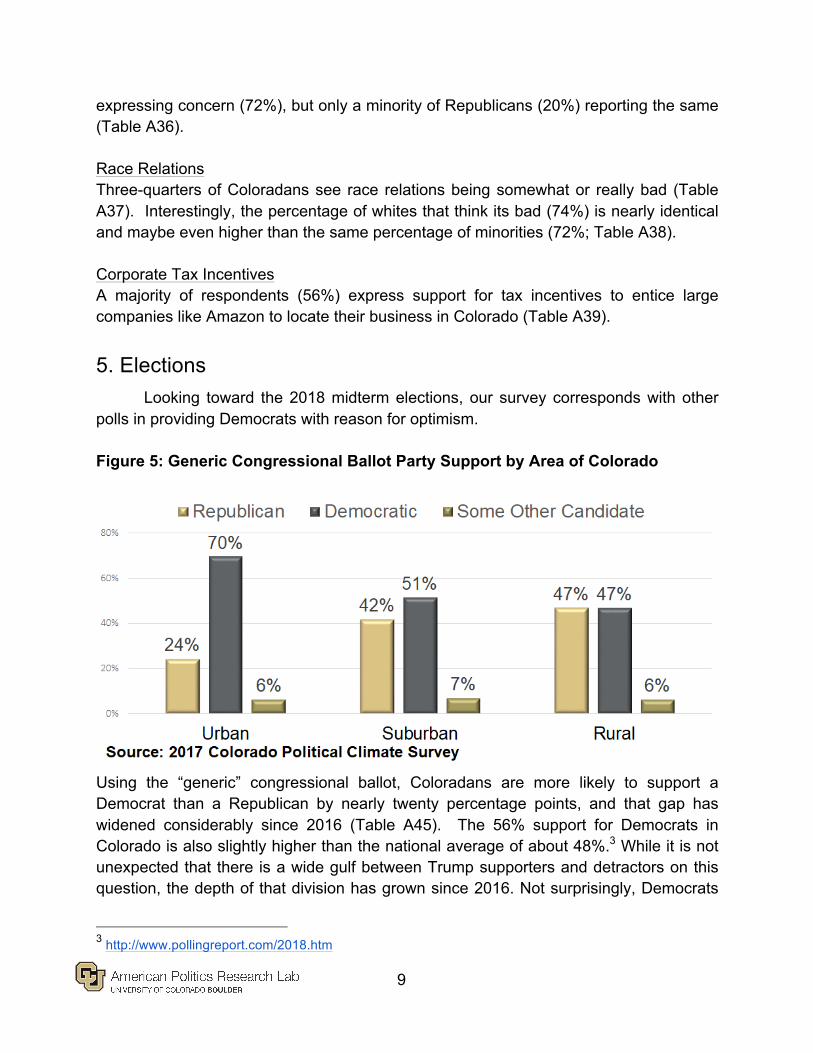
Figure 5: Generic Congressional Ballot Party Support by Area of Colorado
Using the “generic” congressional ballot, Coloradans are more likely to support a Democrat than a Republican by nearly twenty percentage points, and that gap has widened considerably since 2016 (Table A45). The 56% support for Democrats in Colorado is also slightly higher than the national average of about 48%.3 While it is not unexpected that there is a wide gulf between Trump supporters and detractors on this question, the depth of that division has grown since 2016. Not surprisingly, Democrats
3 http://www.pollingreport.com/2018.htm

10
fare better in urban and suburban areas of the state, while as of now it’s dead-even between the two parties on the generic ballot in rural sections of Colorado (Figure 5; Table A46).
It is still very early, possibly too early, to tell how the gubernatorial primaries will shake out. “Undecided” is clearly the leading candidate, registering majorities in both parties (Table 1). Beyond that, the only candidates receiving even double-digit support are the two with the greatest name recognition in the state: Rep. Jared Polis (24% among those saying they would vote in the Democratic primary), and Former Rep. Tom Tancredo (25% among Republicans). Table 1: Gubernatorial Primary Results by Party
Democratic Primary Republican Primary
Undecided 58% Undecided 54%
Jared Polis 24% Tom Tancredo 25%
Cary Kennedy 6% Walker Stapleton 8%
Donna Lynne 4% Cynthia Coffman 6%
Mike Johnston 4% George Brauchler 4%
Noel Ginsburg 2% Lew Gaiter 1%
Doug Robinson 1%
Victor Mitchell 1%
Greg Lopez 0%
Steve Barlock 0%
Observations 357 Observations 250

11
Appendix: Responses to Individual Survey Questions by Year
Partisan Identification Question: In general, do you usually think of yourself as a...
Table A1: Partisanship by Year
2016 2017 Democrat 42% 47% Independent 28% 20% Republican 30% 33% Observations 973 790
Statewide Elected Official Approval Ratings Question: How much do you approve or disapprove of the way that each of the following is handling their job?
Table A2: Presidential Approval Ratings by Year
2016 2017 Strongly Approve 28% 15% Approve 29% 19% Disapprove 13% 12% Strongly Disapprove 26% 51% Not Sure 4% 2% Approval Combined 57% 35% Disapproval Combined 39% 63% Observations 1004 797

12
Table A3: Presidential Approval Ratings by Partisanship
Democrat Independent Republican Strongly Approve 1% 11% 40% Approve 3% 24% 39% Disapprove 11% 12% 14% Strongly Disapprove 84% 48% 4% Not Sure 2% 4% 3% Approval Combined 4% 35% 79% Disapproval Combined 95% 60% 18% Observations 377 143 262
Table A4: Presidential Approval Ratings by Gender
Male Female Strongly Approve 18% 13% Approve 20% 19% Disapprove 10% 13% Strongly Disapprove 50% 51% Not Sure 1% 4%
Approval Combined 38% 32% Disapproval Combined 60% 64% Observations 392 406

13
Table A5: Colorado Gubernatorial Approval Ratings by Year
2016 2017 Strongly Approve 15% 16% Approve 42% 37% Disapprove 16% 17% Strongly Disapprove 10% 15% Not Sure 16% 16% Approval Combined 57% 53% Disapproval Combined 26% 31% Observations 1004 798
Table A6: Senator Bennet Approval Ratings by Year
2016 2017 Strongly Approve 12% 10% Approve 41% 34% Disapprove 12% 17% Strongly Disapprove 10% 13% Not Sure 26% 26% Approval Combined 53% 44% Disapproval Combined 21% 30% Observations 1004 799
Table A7: Senator Gardner Approval Ratings by Year
2016 2017 Strongly Approve 7% 4% Approve 35% 21% Disapprove 16% 25% Strongly Disapprove 8% 23% Not Sure 33% 27% Approval Combined 43% 25% Disapproval Combined 24% 48% Observations 1004 796

14
Table A8: Senator Gardner Approval Ratings by Partisanship
Democrat Independent Republican Strongly Approve 2% 1% 8% Approve 10% 22% 38% Disapprove 27% 28% 21% Strongly Disapprove 37% 25% 4% Not Sure 23% 24% 29% Approval Combined 12% 23% 46% Disapproval Combined 64% 53% 25% Observations 375 143 262
Votes Counted Fairly Question: From your perspective, how often do you think votes are counted fairly during elections?
Table A9: How Often are Votes Counted Fairly During Elections by Year
2016 2017 Always 12% Most of the Time 47% About Half of the Time 16% Some of the Time 17% Never 8% Observations NOT ASKED 798
Table A10: Trust that Votes are Counted Fairly by Partisanship
Democrat Independent Republican Always 18% 8% 5% Most of the time 44% 44% 58% About half the time 14% 13% 17% Sometimes 12% 27% 18% Never 12% 8% 3% Observations 377 143 262

15
Political Institutions Approval Ratings Questions: How much do you approve or disapprove of the way that each of the following is handling their job?
Table A11: US Congress Approval Ratings by Year
2016 2017 Strongly Approve 6% 2% Approve 20% 12% Disapprove 34% 39% Strongly Disapprove 28% 36% Not Sure 12% 11% Approval Combined 26% 14% Disapproval Combined 62% 75% Observations 1004 794
Table A12: US Congress Approval Ratings by Partisanship
Democrat Independent Republican Strongly Approve 0% 2% 4% Approve 13% 7% 14% Disapprove 36% 36% 45% Strongly Disapprove 42% 44% 25% Not Sure 8% 11% 12% Approval Combined 13% 9% 18% Disapproval Combined 78% 80% 70% Observations 374 143 261

16
Table A13: Supreme Court of the United States Approval Ratings by Year
2016 2017 Strongly Approve 10% 6% Approve 40% 43% Disapprove 25% 27% Strongly Disapprove 10% 6% Not Sure 15% 18% Approval Combined 50% 49% Disapproval Combined 35% 33% Observations 1003 784
Table A14: Colorado State Legislature Approval Ratings by Year
2016 2017 Strongly Approve 7% 3% Approve 44% 40% Disapprove 19% 24% Strongly Disapprove 6% 7% Not Sure 23% 26% Approval Combined 51% 43% Disapproval Combined 26% 31% Observations 1004 793

17
Table A15: Colorado State Legislature Approval Ratings by Partisanship
Democrat Independent Republican Strongly Approve 4% 2% 2% Approve 56% 31% 25% Disapprove 13% 27% 38% Strongly Disapprove 3% 13% 11% Not Sure 24% 27% 24% Approval Combined 60% 33% 27% Disapproval Combined 16% 40% 49% Observations 374 143 261
Trust in Government Questions: How often do you trust each of the following levels of government to do what is in the public’s interest?
Table A16: Trust in Federal Government Ratings by Year
2016 2017 Always 6% 2% Most of the Time 19% 8% About Half of the Time 23% 25% Some of the Time 33% 41% Never 20% 23% Observations 1004 790

18
Table A17: Trust in Colorado State Government Ratings by Year
2016 2017 Always 7% 4% Most of the Time 35% 32% About Half of the Time 27% 31% Some of the Time 24% 25% Never 7% 9% Observations 1004 791
Table A18: Trust in Local Government Ratings by Year
2016 2017 Always 6% 2% Most of the Time 36% 36% About Half of the Time 26% 26% Some of the Time 24% 27% Never 7% 9% Observations 1004 793
Table A19: Trust News Media to Report on President Trump
2016 2017 Always 9% Most of the Time 32% About Half of the Time 12% Some of the Time 20% Never 28% Observations NOT ASKED 799

19
Most Important Problem Question: Which of the following do you think is the most important problem facing the United States today?
Table A20: United States Most Important Issue
2016 2017 Healthcare 12% 24% Economy 24% 13% National defense 10% 12% Immigration 11% 10% Crime 6% 9% Environment 7% 8% Civil rights 7% 7% Social welfare 6% 5% International affairs 5% 4% Education 6% 3% Energy 1% 1% Community development 1% 1% Banking/finance 2% 1% Agriculture 0% 0% Transportation 0% 0% Technology 1% 0% Observations 1003 800

20
Table A21: United States Most Important Issue by Area of Colorado
Urban Suburban Rura
l Economy 12% 13% 16% Civil Rights 10% 8% 3% Healthcare 21% 27% 20% Agriculture 0% 0% 0% Education 3% 3% 4% Environment 8% 9% 4% Energy 0% 3% 0% Immigration 11% 10% 13% Transportation 0% 0% 0% Crime 6% 8% 16% Social Welfare 7% 4% 7% Community Development 1% 0% 0% Banking/Finance 1% 0% 3% National Defense 15% 11% 9% Technology 0% 1% 0% International Affairs 5% 3% 5% Observations 215 443 134

21
Question: Which of the following do you think is the most important problem facing the Colorado today? Table A22: Colorado Most Important Issue
2016 2017 Crime 8% 14% Healthcare 12% 14% Economy 23% 13% Immigration 7% 12% Education 11% 10% Environment 6% 9% Transportation 5% 7% Social Welfare 8% 6% Community Development 6% 5% Energy 4% 2% Agriculture 1% 2% Civil Rights 2% 2% Public Lands 2% 2% Banking/Finance 1% 1% National Defense 1% 1% Technology 1% 0% Foreign Trade 1% 0% International Affairs 1% 0% Observations 1003 790

22
Table A23: Colorado Most Important Issue by Area of Colorado
Urban Suburban Rura
l Economy 13% 14% 11% Civil Rights 3% 2% 1% Healthcare 8% 14% 21% Agriculture 0% 2% 4% Education 11% 11% 10% Environment 8% 9% 5% Energy 2% 3% 2% Immigration 9% 14% 11% Transportation 7% 9% 4% Crime 20% 13% 11% Social Welfare 9% 4% 8% Community Development 9% 3% 4% Banking/finance 0% 1% 1% National Defense 0% 0% 4% Technology 0% 0% 0% Public Lands 1% 2% 2% Observations 212 435 134
State of Economy Questions: How would you rate the economic conditions in the [United States/Colorado] as of today?
Table A24: State of National Economy by Year
2016 2017 Excellent 7% 5% Good 23% 39% Average 29% 32% Fair 21% 14% Poor 20% 10% Observations 1004 799

23
Table A25: State of Colorado Economy by Year
2016 2017 Excellent 13% 15% Good 34% 45% Average 26% 22% Fair 17% 11% Poor 10% 6% Observations 1004 790
Individual Policy Questions Marijuana Law Question: The ability of individuals 21 years of age and older to buy marijuana for recreational use is currently legal under Colorado law. How much do you favor or oppose the law that made recreational marijuana legal in Colorado?
Table A26: Support/Opposition to Recreational Marijuana Law by Year
2016 2017 Strongly Favor 40% 43% Favor 24% 22% Oppose 11% 10% Strongly Oppose 22% 21% Not Sure 4% 3% Favor Combined 63% 65% Oppose Combined 33% 31% Observations 1004 794

24
Table A27: Support/Opposition to Recreational Marijuana Law by Partisanship
Democrat Independent Republican Strongly Favor 59% 38% 21% Favor 21% 26% 18% Oppose 8% 13% 16% Strongly Oppose 11% 20% 41% Not Sure 2% 3% 4% Approval Combined 80% 64% 39% Disapproval Combined 19% 33% 57% Observations 379 143 262
TABOR Question: The Colorado Taxpayer Bill of Rights (also known as TABOR) limits the annual growth in state government spending based on the amount of population growth and inflation in the state. Some advocate keeping TABOR as the law of Colorado while others advocate repealing it. How much do you favor or oppose TABOR remaining the law in Colorado?
Table A28: Support/Opposition to TABOR by Year
2016 2017 Strongly Favor 22% 20% Favor 31% 25% Oppose 12% 14% Strongly Oppose 10% 12% Not Sure 25% 30% Favor Combined 53% 45% Oppose Combined 22% 26% Observations 1004 799

25
Single Payer Healthcare Question: How much do you favor or oppose a single-payer health care system in which all Americans would get their health insurance from one government plan that is financed by taxes?
Table A29: Support/Opposition to Single Payer Healthcare for all Americans by Year
2016 2017 Strongly Favor 30% Favor 20% Oppose 8% Strongly Oppose 28% Not Sure 13% Favor Combined 50% Oppose Combined 37% Observations NOT ASKED 799
Table A30: Support/Opposition to Single Payer Healthcare by Partisanship
Democrat Independent Republican Strongly Approve 46% 26% 10% Approve 30% 14% 10% Disapprove 9% 11% 6% Strongly Disapprove 5% 30% 62% Not Sure 10% 20% 13% Approval Combined 76% 40% 20% Disapproval Combined 14% 41% 68% Observations 379 143 262

26
Gun Control Question: How much do you favor or oppose the federal government making it more difficult for individuals to purchase a gun?
Table A31: Support/Opposition to Making It More Difficult to Purchase a Gun by Year
2016 2017 Strongly Favor 42% Favor 17% Oppose 12% Strongly Oppose 25% Not Sure 5% Favor Combined 59% Oppose Combined 37% Observations NOT ASKED 800
Table A32: Support/Opposition to Increased Gun Control by Partisanship
Democrat Independent Republican Strongly Approve 65% 29% 16% Approve 17% 20% 15% Disapprove 7% 10% 18% Strongly Disapprove 9% 29% 46% Not Sure 2% 12% 4% Approval Combined 82% 49% 31% Disapproval Combined 16% 39% 64% Observations 379 143 262

27
Dreamers Question: How much do you favor or oppose allowing young immigrants who were brought to the United States illegally as children to remain in the country if they meet certain requirements such as getting an education, serving in the military and not having a criminal record?
Table A33: Support/Opposition to Allowing Dreamers to Remain in the USA by Year
2016 2017 Strongly Favor 45% Favor 26% Oppose 8% Strongly Oppose 15% Not Sure 6% Favor Combined 71% Oppose Combined 23% Observations NOT ASKED 800
Table A34: Support/Opposition to Allowing Dreamers to Remain in the USA by Partisanship
Democrat Independent Republican Strongly Approve 70% 38% 12% Approve 15% 31% 40% Disapprove 3% 9% 16% Strongly Disapprove 7% 15% 27% Not Sure 4% 7% 5% Approval Combined 85% 69% 52% Disapproval Combined 10% 24% 43% Observations 379 143 262
Climate Change Question: How concerned are you personally about climate change?

28
Table A35: Personal Concern About Climate Change by Year
2016 2017 Very Concerned 27% 29% Concerned 25% 21% Somewhat Concerned 24% 20% Not Very Concerned 14% 16% Not At All Concerned 11% 14% Observations 1004 800
Table A36: Personal Concern About Climate Change by Partisanship
Democrat Independent Republican Very Concerned 49% 21% 8% Concerned 23% 33% 12% Somewhat Concerned 20% 20% 17% Not Very Concerned 8% 13% 31% Not At All Concerned 1% 13% 33% Observations 379 142 262
Race Relations Question: How would you describe the current state of race relations in the United States?
Table A37: Current State of Race Relations in the USA by Year
2016 2017 Really Good 7% 3% Somewhat Good 22% 24% Somewhat Bad 49% 47% Really Bad 22% 27% Not Sure 0% 0% Good Combined 29% 26% Bad Combined 72% 74% Observations 1004 799

29
Table A38: Current State of Race Relations in the USA by Race
Minorities Whites Really Good 2% 3% Somewhat Good 25% 23% Somewhat Bad 36% 50% Really Bad 36% 24% Not Sure 0% 0% Good Combined 27% 26% Bad Combined 72% 74% Observations 213 586 Tax Incentive Question: How much do you favor or oppose the state of Colorado providing tax incentives to bring large companies, like Amazon, to the state?
Table A39: Support/Opposition to Providing Tax Incentives to Large Companies by Year
2016 2017 Strongly Favor 18% Favor 38% Oppose 20% Strongly Oppose 12% Not Sure 11% Favor Combined 56% Oppose Combined 33% Observations NOT ASKED 793

30
North Korea Military Action Question: How much would you favor or oppose the United States taking preemptive military action against North Korea to prevent them from threatening the United States?
Table A40: Support/Opposition to Preemptive Military Action against North Korea by Year
2016 2017 Strongly Favor 11% Favor 18% Oppose 16% Strongly Oppose 40% Not Sure 14% Favor Combined 29% Oppose Combined 56% Observations NOT ASKED 799 Legal Immigration Question: How do you think the number of immigrants who are legally permitted to come to the United States to live should change?
Table A41: How Number of Legal Immigrants Allowed in USA Should Change by Year
2016 2017 Increase a Lot 13% 11% Increase a Little 18% 14% Keep the Same 35% 40% Decrease a Little 16% 14% Decrease a Lot 18% 21% Observations 1004 796

31
Criminal Justice Fairness Question: How confident are you that the criminal justice system treats all people equally regardless of their background?
Table A42: How Confident Criminal Justice Systems Treats Everyone the Same by Year
2016 2017 Very Confident 8% 4% Confident 13% 10% Somewhat Confident 23% 20% Not Very Confident 36% 35% Not At All Confident 20% 31% Observations 1004 799
General Political Questions Political Interest Question: In general, how interested are you in what's going on in government and public affairs?
Table A43: How Interested are You in Politics by Year
2016 2017 Very Interested 40% 49% Interested 31% 28% Somewhat Interested 21% 17% Not Very Interested 5% 4% Not At All Interested 3% 1% Observations 1004 799

32
Political Ideology Question: There is a lot of talk these days about liberals and conservatives. When it comes to politics, do you usually think of yourself as...
Table A44: Political Ideology by Year
2016 2017 Liberal 39% 39% Moderate 32% 30% Conservative 29% 31% Observations 1003 799
Election Questions Generic Congressional Election Question: If the 2018 election for the U.S. House of Representatives in your congressional district were held today, would you vote for the... Table A45: Generic Congressional Ballot by Year
2016 2017 Republican Candidate 40% 37% Democratic Candidate 51% 56% Some Other Candidate 8% 6% Observations 1002 796
Table A46: Generic Congressional Ballot by Urban Area
Urban Suburban Rural Republican 24% 42% 47% Democratic 70% 51% 47% Some other 6% 7% 6% Observations 215 439 135

33
Primary Election Question: As you may know, current Colorado Governor John Hickenlooper will not be running for re-election because he has already served two terms in office and is prohibited by law from running again. Before the general election in November 2018, the Democratic and Republican Parties will hold a primary election to select their candidate for governor. If the gubernatorial primaries were held today, would you vote in the Democratic or Republican primaries, or would you not vote at all?
Table A47: What Primary Election Would You Vote In by Year
2016 2017 Democratic 45% Republican 34% Would Not Vote in Either 21% Observations NOT ASKED 797