2017 annual report - anz shareholder centre · 5. this is the estimat ed number of people who have...
TRANSCRIPT

2017ANNUAL REPORT

2
ANZ 2017 ANNUAL REPORT
CONTENTSOur 2017 Reporting Suite 32017 Highlights 4Chairman's Message 6CEO's Message 8About our Business 10Our Strategy 12Our Performance 14Governance 24
Our Approach to Risk Management 34Remuneration Report 36Directors' Report 62Auditor’s Independence Declaration 64Financial Report 65Shareholder Information 161Glossary 169Contacts 171
Cover story — Latrobe Valley Bus Lines
Rhonda Renwick and her dedicated team at Latrobe Valley Bus Lines are rolling out new buses that are at the leading edge of transport technology in Australia.
Since 2015 Latrobe Valley Bus Lines has been investing in low emission technologies which improve the efficiency and environmental impact of its buses.
The newest vehicles in the fleet have been designed to dramatically reduce particulate emissions in the atmosphere. Latrobe Valley Bus Lines has been trialling new hybrid technology and will introduce eight new hybrid vehicles into the fleet over the next three years.
As the company focuses on its mission of helping the community, and providing the highest quality and safest service for its customers and employees, it has benefitted from its long-term relationship with ANZ.
“ANZ’s proactive team has a genuine understanding of our business goals, providing flexibility along with competitive banking options,” Rhonda explains.
Rhonda Renwick, Managing Director
WE WANT OUR CUSTOMERS TO VALUE US AND THE COMMUNITY TO TRUST US. FOR THIS TO HAPPEN WE KNOW THAT THINGS NEED TO CHANGE AT ANZ.
We are proud to be supporting a business like Latrobe Valley Bus Lines — a Certified B Corporation — which shares our commitment to helping communities thrive. It supports local manufacturing, is dedicated to fostering an inclusive and safe workplace and promotes a number of grassroots community organisations.

3
OUR 2017 REPORTING SUITE
OUR 2017REPORTING SUITE
ANZ's 2017 reporting suite also includes the following documents available at shareholder.anz.com:
• News Release
• Results Presentation and Investor Discussion Pack
• Results Announcement
• The Company 2017 Financial Report
• UK DTR Submission – Principal Risks and Uncertainties
• APS 330 Pillar III Disclosure at 30 September 2017
1. 2017 Annual Review anz.com/annualreport2. 2017 Corporate Governance Statement anz.com/corporategovernance3. 2017 ANZ Corporate Sustainability Review anz.com/cs
2.
1. 3.
Stakeholder expectations of corporate reporting are changing and we need to respond. We recognise that stakeholders want a more holistic understanding of how we are creating value over time — beyond the short or medium-term — and the opportunities and challenges impacting our future. A strong financial performance each year, while critical to the success of the bank, is not of itself the whole story and reflects little about who we are as an organisation and the role we play in society.
Our core reporting suite includes:
This report, our 2017 Annual Report, which describes our strategy, our performance against that strategy and in light of that performance how we remunerated our Senior Executives.
Our 2017 Annual Review which concisely describes how we manage our business, including the way in which we incorporate social and environmental considerations into our decision- making. It draws on aspects of the International Integrated Reporting Framework.
Our Corporate Governance Statement which discloses the extent to which ANZ has complied with the ASX Corporate Governance Council’s ‘Corporate Governance Principles & Recommendations — 3rd edition’. We also provide our Principal Risks and Uncertainties. Both are available at anz.com/corporategovernance.
Our 2017 ANZ Corporate Sustainability Review which informs stakeholders about our performance against our material social, environmental and economic opportunities and challenges.
We will continue to evolve and improve our reporting suite over the coming years and therefore welcome feedback on this report. Please address any questions, comments or suggestions to [email protected].

4
1. Cash profit excludes non-core items included in statutory profit and is provided to assist readers in understanding the result of the ongoing business activities of the Group.2. Total taxes borne by the Group, includes unrecovered GST/VAT, employee related taxes and other taxes.3. Figure includes foregone revenue of $107 million, being the cost of providing low or fee-free accounts to a range of customers such as government benefit recipients,
not-for-profit organisations and students.4. From premises energy against a 2013 baseline.5. This is the estimated number of people who have benefited from ANZ’s MoneyMinded financial education program since 2003.
ANZ 2017 ANNUAL REPORT
$6.9BN
cash profit1
11.9%cash return on equity1
in community investment (includes foregone revenue)3
$131M496,900+
reduction in Greenhouse Gas emissions4
20%
$3,415Mtaxes paid2
2017 HIGHLIGHTS
people reached through our financial education program MoneyMinded5
5
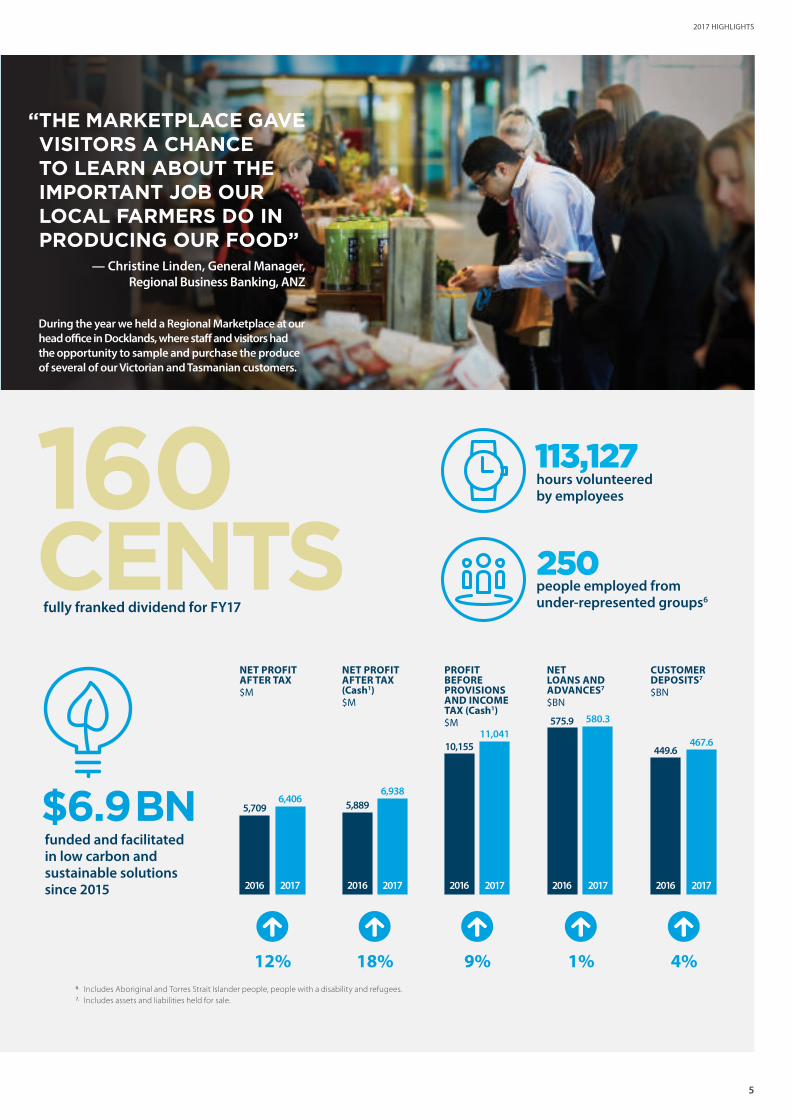
6. Includes Aboriginal and Torres Strait Islander people, people with a disability and refugees.7. Includes assets and liabilities held for sale.
2017 HIGHLIGHTS
11.9 160CENTS
fully franked dividend for FY17
$6.9 BNfunded and facilitated in low carbon and sustainable solutions since 2015
hours volunteered by employees
113,127
people employed from under-represented groups6
250
“ THE MARKETPLACE GAVE VISITORS A CHANCE TO LEARN ABOUT THE IMPORTANT JOB OUR LOCAL FARMERS DO IN PRODUCING OUR FOOD”
— Christine Linden, General Manager, Regional Business Banking, ANZ
During the year we held a Regional Marketplace at our head office in Docklands, where staff and visitors had the opportunity to sample and purchase the produce of several of our Victorian and Tasmanian customers.
NET PROFIT AFTER TAX$M
2017
6,4065,709
2016
12%
NET PROFIT AFTER TAX (Cash1)$M
5,8896,938
20172016
18%
NET LOANS AND ADVANCES7
$BN
PROFIT BEFORE PROVISIONSAND INCOME TAX (Cash1)$M
10,15511,041
20172016
9%
CUSTOMER DEPOSITS7
$BN
2016
1%
575.9
2017
580.3
4%
2016
449.6
2017
467.6

ANZ 2017 ANNUAL REPORT
6
CHAIRMAN’S MESSAGEDAVID GONSKI, AC
In 2017 ANZ produced good results for shareholders, our customers and the communities in which we operate.
Financial Outcomes
Our statutory profit was $6.4 billion, up 12%. Cash profit (which excludes non-core items from statutory profit) was $6.9 billion, up 18%. The final dividend of 80 cents per share brought the total dividend for the year to 160 cents per share fully franked, unchanged compared to 2016. This reflects a dividend payout ratio of 68% of Cash Profit with $4.6 billion in dividends paid to shareholders, moving ANZ closer to our target fully franked payout ratio of 60-65% of cash profit.
Rapid economic, technological and social changes are a hallmark of the world we live in. As one of the region’s major banks, we have a clear strategy, which is being supported by bold action, to make sure ANZ is fit and ready for this future.
In 2017 we made good progress to becoming a better balanced, better capitalised and more efficient bank. This has seen the new shape of ANZ emerge. Our retail and commercial businesses in Australia and New Zealand now account for 53% of our capital, up from 44% at the end of 2015. Our Common Equity Tier One capital ratio reached 10.6% at the end of the year and our cost base has reduced in absolute terms with annual costs down for the first time since 1999.
Community Engagement
Banks are facing significant challenges to re-establish the trust of the community. We need to own up to our mistakes and swiftly make things right. We have been slower than the community expects to be more transparent, to listen and to treat our customers fairly and responsibly.
What is particularly pleasing about 2017 is we have not only delivered better outcomes for shareholders, we are also making genuine progress in delivering better outcomes for customers and in rebuilding community trust.
This has been supported by the establishment of the Responsible Business Committee, led by the Chief Executive Shayne Elliott, and the revision of the charter for the Environment, Sustainability and Governance Board Committee (ESG). The aim of both Committees is to advance ANZ’s core purpose and increase focus on ESG issues.
We have committed to support the Australian Bankers’ Association Better Banking initiatives and to implementing the 21 recommendations from Stephen Sedgwick’s independent review of product sales commissions and product-based payments in Australian retail banking. The Board and the CEO are overseeing the implementation of the recommendations, with management providing regular program updates to the Board Human Resources Committee.

CHAIRMAN’S MESSAGE
7
“ IN 2017 WE MADE GOOD PROGRESS TO BECOMING A BETTER BALANCED, BETTER CAPITALISED AND MORE EFFICIENT BANK. WE PAID OUT $4.6 BILLION IN DIVIDENDS.”
All recommendations are expected to be met within intended timeframes, with progress this year including; Branch and Contact Centre staff incentive plans being changed to balanced scorecard plans, creating a strong alignment between performance management and incentive rewards. All roles in the scope of the Sedgwick review are on track to have the financial objective weighting in scorecards at less than 33% for FY18 and staff recognition programs that were focused on recognising and rewarding sales outcomes have also been changed or closed. We are also working actively with the industry as part of the Combined Industry Forum in relation to responding to the Sedgwick recommendations for third parties and ASIC’s proposals for mortgage broking.
We have also delivered a range of initiatives for customers to make banking fairer and simpler. For example, in Australia we have introduced a lower interest rate credit card and removed ATM fees.
We still have much to do to rebuild community trust, however we know we need to change and we are changing.
The Board is pleased with what has been achieved in 2017 and take this opportunity of thanking all of the employees of ANZ for their hard work and dedication.
Outlook
We expect the revenue growth environment for banking will continue to be constrained as a result of intense competition and the effect of regulation, including the full impact of the major bank levy in Australia.
This environment is not new to us and our strategy is ensuring we focus only on those areas where we can deliver exceptional customer outcomes, solve real customer needs and, in doing so, make a decent return for our shareholders.
As a result, ANZ’s capital position has improved significantly and we already meet APRA’s ‘unquestionably strong’ 2020 capital target. In 2018, as we receive the proceeds from the already announced divestment of non-core businesses, we will have the flexibility to consider capital management initiatives.
As we continue to deliver the benefits of our strategy, we are well positioned to create value for our shareholders, customers, employees and the community in 2018 and beyond.
David Gonski, AC Chairman

CEO’S MESSAGESHAYNE ELLIOTT
ANZ 2017 ANNUAL REPORT
8
Two years ago it was clear that we needed to reshape ANZ’s future. We had a strong and successful business, however in recent times the external environment was changing faster than we were and our customers, the community and our shareholders expected much more from us.
Our strategy
To ensure ANZ adapted more quickly, we simplified our strategy to focus on being the best bank for people who want to buy and own a home, and for people who want to start, run and grow a business. In Institutional Banking, we want to be the best bank in the world for customers who move goods and money around the Asia-Pacific region.
This allowed us to focus our resources on opportunities where we have a competitive advantage and can win. However, we have also made some difficult calls. Some say the essence of strategy is choosing what not to do. We have chosen to sell businesses or investments where we were not in a winning position or developing our ANZ brand, or where they added unnecessary complexity and risk.
This has included the divestment of our pensions and investments business in Australia, our retail and wealth businesses in six Asian countries, UDC asset finance in New Zealand, and our minority investments in China’s Shanghai Rural Commercial Bank and Metrobank Card Corporation in the Philippines.
These choices have also involved a significant reshaping of our Institutional Banking business as part of improving the capital allocation and improving returns. This year it has involved a further $18 billion reduction in Credit Risk Weighted Assets, bringing the total reduction since September 2015 to $46 billion or 27%. We are also focusing on a smaller number of customers who most value our capabilities and our network, including our presence in Asia.
Today, we are at the mid-point of executing a multi-year transformation of ANZ and I am pleased to report that 2017 has seen better outcomes for shareholders and genuine progress in delivering better outcomes for customers and in rebuilding community trust.
Customers and the Community
For customers our progress includes initiatives to make banking fairer and simpler supported by an increased emphasis on innovation. For example, we extended our mobile payments leadership, established with Apple PayTM and Android PayTM, with the launch of Samsung Pay and FitBitTM Pay. Mobile payments are also important for small business and we introduced BladePayTM to support this growing opportunity.
We also believe in the value of voice-activated transactions and launched MyVoice identity and security solutions in Australia and New Zealand.

CEO’S MESSAGE
9
“ I WANT US TO BE KNOWN AS A COMPANY THAT’S RESPECTED FOR BEING FAIR AND BALANCED IN THE WAY WE THINK ABOUT ISSUES AND FOR TAKING ACTION TO MEET THE EXPECTATIONS OF OUR CUSTOMERS, EMPLOYEES AND SOCIETY.”
We are also rebuilding trust through a focus on our core purpose: to help shape a world where people and communities thrive. We invested more than $131 million in the communities in which we operate and I am particularly proud of the impact our financial education and employment programs are having in terms of creating opportunities for more people to participate socially and economically.
We are focused on creating the right culture to support our strategy. The way in which we treat our stakeholders is reinforced by our values. Our values – the behaviours expected of our people – are not just words on a page. They are embedded in how we do things like how we manage and reward our people’s performance. They are also used as a foundation for good decision making and embedded in our operating rhythm, for example, across our Australian Branch Network.
We took a positive and proactive stance at our appearances before the Australian Parliament. We have made product, fee and rate changes to benefit customers and the community and everyone in the senior management team has spent more time in branches, call centres and regional and rural areas talking to our customers and the community. Looking ahead, we are seeking to deliver value to all our stakeholders through four factors:
• Simplicity and focus. Choosing a few things to do, doing them extremely well and stopping everything else.
• Speed to market. Listening to customers, testing, developing and launching solutions quickly and repeating at pace.
• Increase digitisation. Focusing on mobile and voice solutions for customers.
• Culture. Building a stronger sense of core purpose, ethics and fairness, and investing in people who can sense and navigate the rapidly changing world.
ANZ today is leaner, stronger and fitter; better placed to manage the changing environment while still investing in new capabilities to deliver long-term sustainable earnings growth.
We could not have achieved so much in 2017 without the sustained effort and dedication of our people, and I thank them all for their contribution.
Shayne ElliottCEO

ANZ 2017 ANNUAL REPORT
1010
OUR CULTURE AND VALUESOur values are the foundation of how we work and how we bank. We recognise that we must live our values every day if we are to execute our strategy successfully and earn back the community’s trust.
To support our strategic priority to drive a purpose and values-led transformation of the bank, this year we refreshed our values with input from more than 1,000 employees. Our values, which include a strong focus on speaking up and respectfully disagreeing, are supported by our Code of Conduct and Ethics. It is a requirement that all employees comply with the Code, which contains eight guiding principles and sets the standards for the way we do business at ANZ.
We care about:
INTEGRITY
COLLABORATION
ACCOUNTABILITY
RESPECT
EXCELLENCE
SUSTAINABLEGROWTH
FAIR AND RESPONSIBLE
BANKING
SOCIALAND ECONOMICPARTICIPATION
SHAPE AWORLD WHERE
PEOPLE ANDCOMMUNITIES
THRIVE
OUR CORPORATE SUSTAINABILITY FRAMEWORKOur Corporate Sustainability Framework supports our business strategy and is aligned with the bank’s purpose. The Framework has three key areas of focus:
• Sustainable Growth
• Social and Economic Participation
• Fair and Responsible Banking
ABOUT OUR BUSINESS
10
OUR PURPOSEOur purpose is to help shape a world in which people and communities thrive. That means striving to create a balanced, sustainable society in which everyone can take part and build a better life.
11
ABOUT OUR BUSINESS
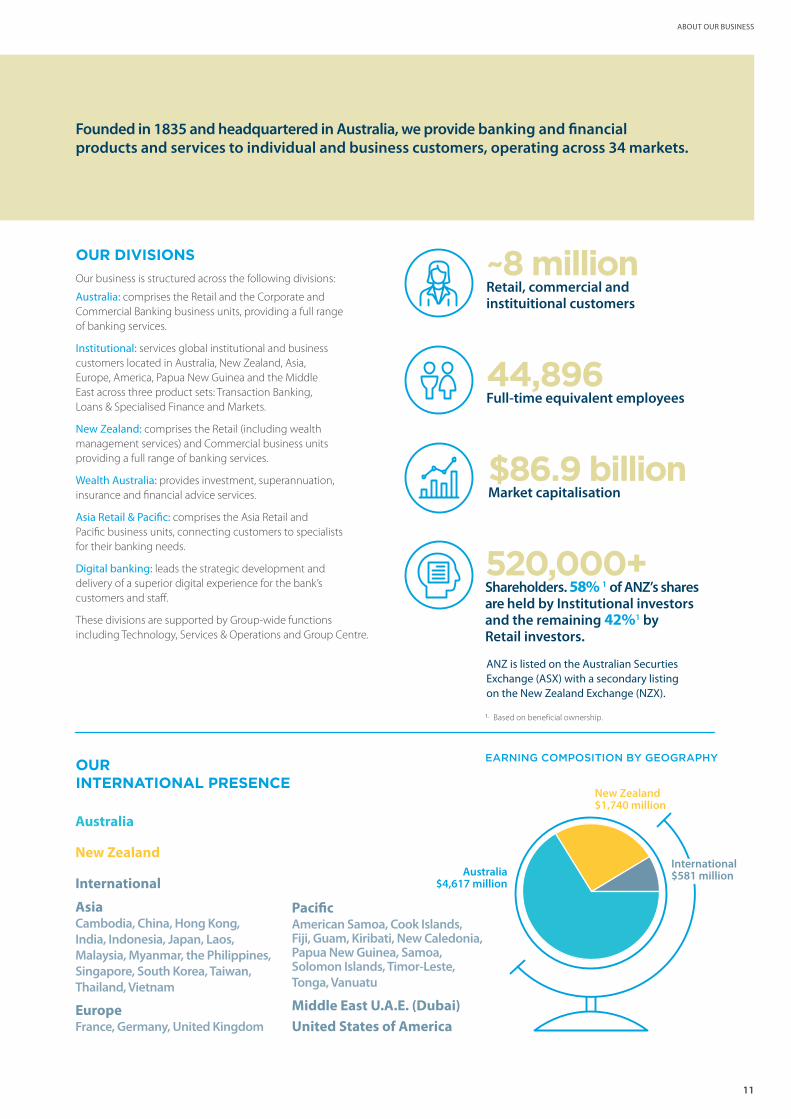
OUR DIVISIONSOur business is structured across the following divisions:
Australia: comprises the Retail and the Corporate and Commercial Banking business units, providing a full range of banking services.
Institutional: services global institutional and business customers located in Australia, New Zealand, Asia, Europe, America, Papua New Guinea and the Middle East across three product sets: Transaction Banking, Loans & Specialised Finance and Markets.
New Zealand: comprises the Retail (including wealth management services) and Commercial business units providing a full range of banking services.
Wealth Australia: provides investment, superannuation, insurance and financial advice services.
Asia Retail & Pacific: comprises the Asia Retail and Pacific business units, connecting customers to specialists for their banking needs.
Digital banking: leads the strategic development and delivery of a superior digital experience for the bank’s customers and staff.
These divisions are supported by Group-wide functions including Technology, Services & Operations and Group Centre.
OUR INTERNATIONAL PRESENCE
Founded in 1835 and headquartered in Australia, we provide banking and financial products and services to individual and business customers, operating across 34 markets.
ANZ is listed on the Australian Securties Exchange (ASX) with a secondary listing on the New Zealand Exchange (NZX).
~8 millionRetail, commercial and instituitional customers
520,000+Shareholders. 58% 1 of ANZ’s shares are held by Institutional investors and the remaining 42%1 by Retail investors.
44,896Full-time equivalent employees
$86.9 billionMarket capitalisation
Australia
New Zealand
International
Asia Cambodia, China, Hong Kong, India, Indonesia, Japan, Laos, Malaysia, Myanmar, the Philippines, Singapore, South Korea, Taiwan, Thailand, Vietnam
Europe France, Germany, United Kingdom
Pacific American Samoa, Cook Islands, Fiji, Guam, Kiribati, New Caledonia, Papua New Guinea, Samoa, Solomon Islands, Timor-Leste, Tonga, Vanuatu
Middle East U.A.E. (Dubai)United States of America
1. Based on beneficial ownership.
EARNING COMPOSITION BY GEOGRAPHY
Australia $4,617 million
New Zealand $1,740 million
International $581 million
12
ANZ 2017 ANNUAL REPORT
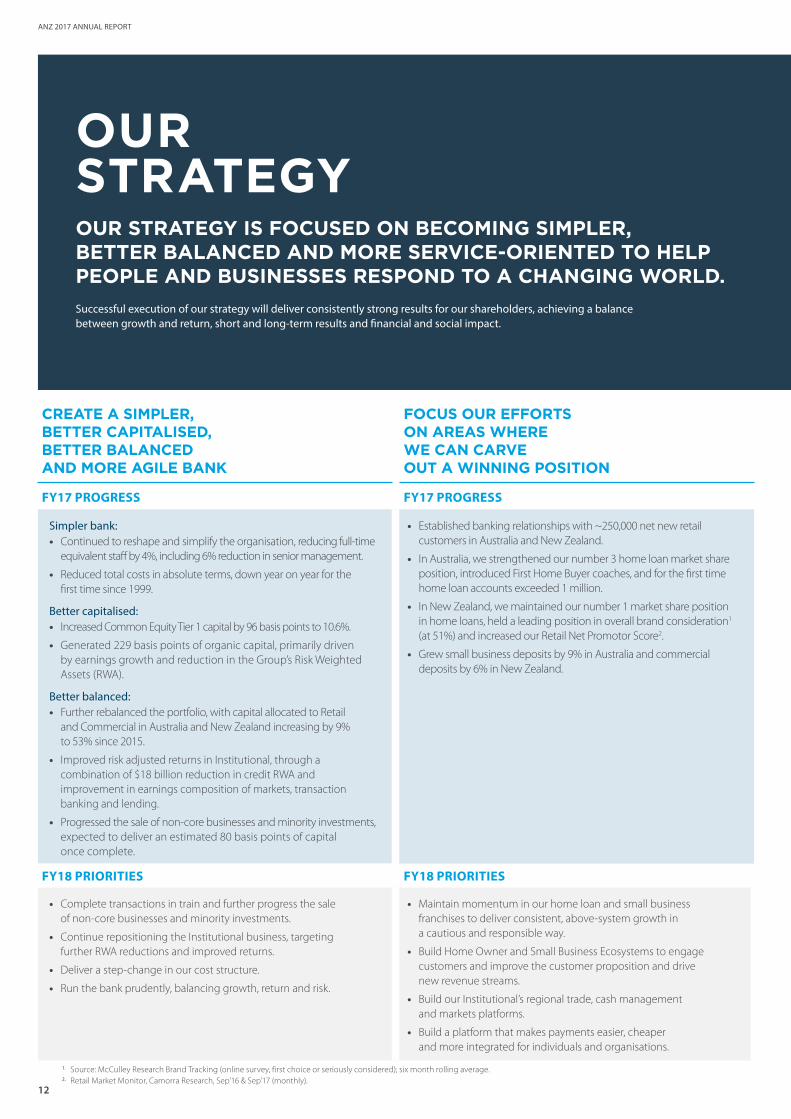
OUR STRATEGYOUR STRATEGY IS FOCUSED ON BECOMING SIMPLER, BETTER BALANCED AND MORE SERVICE-ORIENTED TO HELP PEOPLE AND BUSINESSES RESPOND TO A CHANGING WORLD.Successful execution of our strategy will deliver consistently strong results for our shareholders, achieving a balance between growth and return, short and long-term results and financial and social impact.
CREATE A SIMPLER, BETTER CAPITALISED, BETTER BALANCED AND MORE AGILE BANK
FOCUS OUR EFFORTS ON AREAS WHERE WE CAN CARVE OUT A WINNING POSITION
FY17 PROGRESS FY17 PROGRESS
Simpler bank: • Continued to reshape and simplify the organisation, reducing full-time
equivalent staff by 4%, including 6% reduction in senior management.
• Reduced total costs in absolute terms, down year on year for the first time since 1999.
Better capitalised: • Increased Common Equity Tier 1 capital by 96 basis points to 10.6%.
• Generated 229 basis points of organic capital, primarily driven by earnings growth and reduction in the Group’s Risk Weighted Assets (RWA).
Better balanced: • Further rebalanced the portfolio, with capital allocated to Retail
and Commercial in Australia and New Zealand increasing by 9% to 53% since 2015.
• Improved risk adjusted returns in Institutional, through a combination of $18 billion reduction in credit RWA and improvement in earnings composition of markets, transaction banking and lending.
• Progressed the sale of non-core businesses and minority investments, expected to deliver an estimated 80 basis points of capital once complete.
• Established banking relationships with ~250,000 net new retail customers in Australia and New Zealand.
• In Australia, we strengthened our number 3 home loan market share position, introduced First Home Buyer coaches, and for the first time home loan accounts exceeded 1 million.
• In New Zealand, we maintained our number 1 market share position in home loans, held a leading position in overall brand consideration1 (at 51%) and increased our Retail Net Promotor Score2.
• Grew small business deposits by 9% in Australia and commercial deposits by 6% in New Zealand.
FY18 PRIORITIES FY18 PRIORITIES
• Complete transactions in train and further progress the sale of non-core businesses and minority investments.
• Continue repositioning the Institutional business, targeting further RWA reductions and improved returns.
• Deliver a step-change in our cost structure.
• Run the bank prudently, balancing growth, return and risk.
• Maintain momentum in our home loan and small business franchises to deliver consistent, above-system growth in a cautious and responsible way.
• Build Home Owner and Small Business Ecosystems to engage customers and improve the customer proposition and drive new revenue streams.
• Build our Institutional’s regional trade, cash management and markets platforms.
• Build a platform that makes payments easier, cheaper and more integrated for individuals and organisations.
1. Source: McCulley Research Brand Tracking (online survey, first choice or seriously considered); six month rolling average.2. Retail Market Monitor, Camorra Research, Sep'16 & Sep'17 (monthly).

13
OUR STRATEGY
DRIVE A PURPOSE AND VALUES-LED TRANSFORMATION OF THE BANK
BUILD A SUPERIOR EVERYDAY EXPERIENCE FOR CUSTOMERS AND OUR PEOPLE TO COMPETE IN THE DIGITAL AGE
FY17 PROGRESS FY17 PROGRESS
• Established CEO-led Responsible Business Committee and revised Charter of Environment, Sustainability and Governance Board Committee to advance ANZ’s purpose and increase focus on ESG issues.
• Contributed $131 million in community investment supported by 113,127 community volunteering hours by employees.
• Engaged our people and continued to build positive advocacy for ANZ and the industry through ‘The ANZ Way’, focusing on ANZ’s purpose, strategy, refreshed values and Code of Conduct.
• Introduced a new ‘balanced scorecard’ incentive plan in our branches and retail banking contact centres, increasing the weighting to good customer outcomes, and established a new role of Customer Fairness Advisor.
• Implemented key priorities of our revised Human Rights Standards, including strengthened customer due diligence and employee training.
• The only Australian major bank to offer payment options across Apple PayTM, Apple Watch Pay, Android PayTM, Samsung Pay and FitBitTM Pay — backed by the ability to make high-value transactions easier with the introduction of voice biometrics.
• Expanded accessibility features for ANZ Visa Debit cards including features to assist customers with visual impairment and reading difficulties.
• Acquired online property site RealAs to bolster our digital offering in Australia’s property market.
• Added to small business product offerings through our Employment Hero partnership while adding payments capability with BladePayTM and FastPay® Next Generation.
FY18 PRIORITIES FY18 PRIORITIES
• Act boldly and aligned with our purpose to re-engage with the community, regain trust and differentiate ANZ.
• Embed our values and 'New Ways of Leading' with all leaders across the bank.
• Continue to change the way we communicate internally to create a more transparent, open culture.
• Simplify and standardise our technology landscape in support of our ambitions.
• Introduce 'New Ways of Working', to more rapidly deliver valuable new features and services to our customers, engage our people and attract new talent.
• Build the skills required to develop compelling customer propositions, unlock the value of data and optimise our core processes.
• Better utilise data to strengthen relationships, grow revenue and improve risk management.
Kathy Grant and Justin Davenport, Lux Design Group — clothing designers,
wholesalers, importers and manufacturers.
“ WITH ANZ, WE’VE FOUND A MORE PERSONALISED APPROACH. THEY’RE INTERESTED IN US BOTH AS PEOPLE, AND AS A GROWING BUSINESS.”
— Kathy Grant
14
ANZ 2017 ANNUAL REPORT
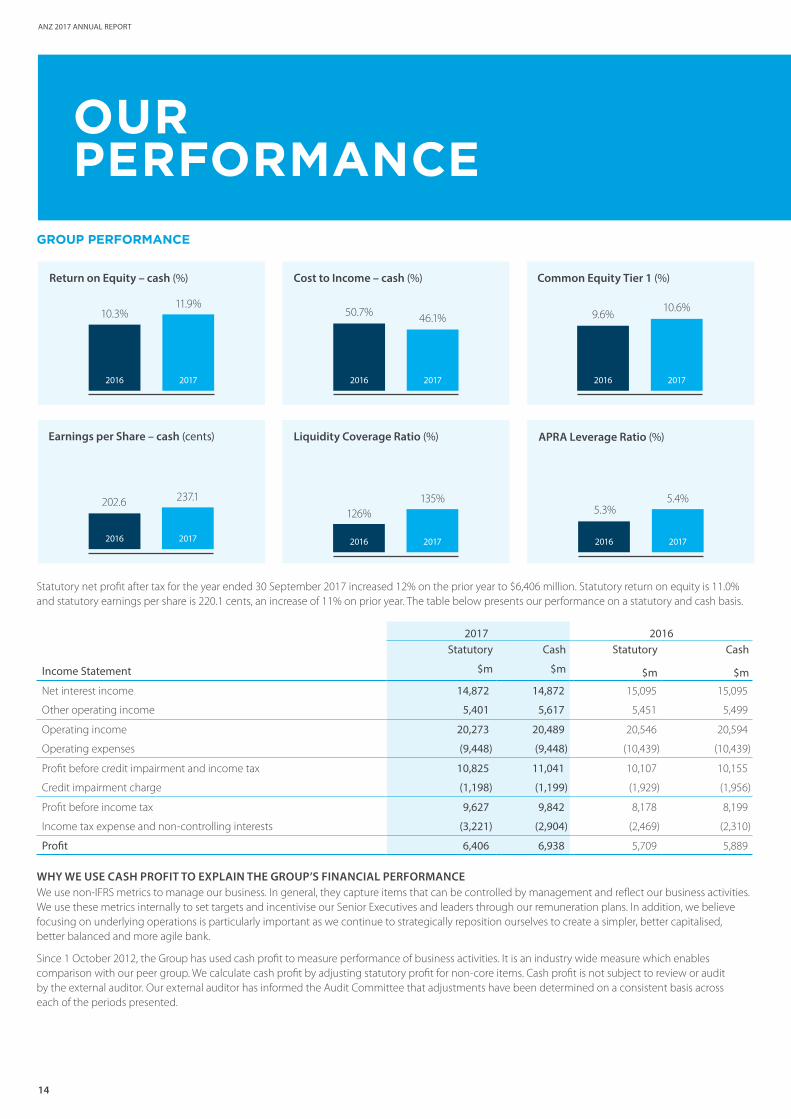
Earnings per Share – cash (cents)
237.1
2017
202.6
2016
Return on Equity – cash (%)
10.3%
2016 2017
11.9%
APRA Leverage Ratio (%)
2016
5.3%
2017
5.4%
Cost to Income – cash (%)
2016
50.7%
2017
46.1%
Liquidity Coverage Ratio (%)
2017
135%
2016
126%
Common Equity Tier 1 (%)
9.6%
2016 2017
10.6%
GROUP PERFORMANCE
Statutory net profit after tax for the year ended 30 September 2017 increased 12% on the prior year to $6,406 million. Statutory return on equity is 11.0% and statutory earnings per share is 220.1 cents, an increase of 11% on prior year. The table below presents our performance on a statutory and cash basis.
2017 2016
Income Statement
Statutory Cash Statutory Cash
$m $m $m $m
Net interest income 14,872 14,872 15,095 15,095
Other operating income 5,401 5,617 5,451 5,499
Operating income 20,273 20,489 20,546 20,594
Operating expenses (9,448) (9,448) (10,439) (10,439)
Profit before credit impairment and income tax 10,825 11,041 10,107 10,155
Credit impairment charge (1,198) (1,199) (1,929) (1,956)
Profit before income tax 9,627 9,842 8,178 8,199
Income tax expense and non-controlling interests (3,221) (2,904) (2,469) (2,310)
Profit 6,406 6,938 5,709 5,889
WHY WE USE CASH PROFIT TO EXPLAIN THE GROUP’S FINANCIAL PERFORMANCEWe use non-IFRS metrics to manage our business. In general, they capture items that can be controlled by management and reflect our business activities. We use these metrics internally to set targets and incentivise our Senior Executives and leaders through our remuneration plans. In addition, we believe focusing on underlying operations is particularly important as we continue to strategically reposition ourselves to create a simpler, better capitalised, better balanced and more agile bank.
Since 1 October 2012, the Group has used cash profit to measure performance of business activities. It is an industry wide measure which enables comparison with our peer group. We calculate cash profit by adjusting statutory profit for non-core items. Cash profit is not subject to review or audit by the external auditor. Our external auditor has informed the Audit Committee that adjustments have been determined on a consistent basis across each of the periods presented.
OUR PERFORMANCE

15
OUR PERFORMANCE
ADJUSTMENTS BETWEEN STATUTORY PROFIT AND CASH PROFIT
Description of adjustments between statutory profit and cash profit:
Adjustment Reason for the adjustment
Treasury shares adjustment
Wealth Australia holds ANZ shares as investments backing policy liabilities which are revalued through the Income Statement. These shares are deemed to be Treasury shares and all dividends and realised and unrealised gains and losses associated with the shares are eliminated for statutory purposes. From a cash profit perspective, earnings on these shares are included to ensure there is no asymmetrical impact between policy liabilities and the assets held to support such liabilities.
Revaluation of policy liabilities
To calculate certain policy liabilities, projected future cash flows on insurance contracts are discounted at a market discount rate to the present value of the obligation. Any change is reflected in the Income Statement each period. The volatility from changes in market discount rates is removed from cash profit each year as the impact reverts to zero over the life of the insurance contract.
Economic hedges and revenue hedges
Fair value gains and losses are recognised in the Income Statement on economic and revenue hedges used to manage interest rate and foreign exchange risk. The mark to market adjustments on these derivatives, not designated in an accounting hedge, are removed from cash profit as the fair value gains or losses will reverse over time to match the profit or loss on the hedged item. Included in economic hedges are funding related swaps, select structured finance and specialised leasing transactions.
Structured credit intermediation trades
ANZ entered into a series of structured credit intermediation trades with US financial guarantors from 2004 to 2007. The underlying structures involve credit default swaps (CDSs) over synthetic collateralised debt obligations (CDOs), portfolios of external collateralised loan obligations (CLOs) or specific bonds/floating rate notes (FRNs). ANZ sold protection using CDSs over these structures and then to mitigate risk, purchased protection via CDSs over the same structures from eight US financial guarantors. Being derivatives, both the sold protection and the purchased protection are measured at fair value and marked to model. The gains or losses on structured intermediation trades is an adjustment to cash profit as it relates to a legacy business and, unless terminated early, fair value movements are expected to reverse to zero in future periods.
Reclassification of SRCB to held for sale
Represents the impact of reclassifying Shanghai Rural Commercial Bank (SRCB) to an asset held for sale in 2017. This will be materially offset by a release of the foreign currency translation and available-for-sale reserves upon transaction completion in late 2017.
Credit risk on impaired derivatives
Nil profit after tax impact. The charge to income for derivative credit valuation adjustments on defaulted and impaired derivative exposures has been reclassified to cash credit impairment charges to reflect the manner in which the defaulted and impaired derivatives are managed.
Policyholders tax gross up
Nil profit after tax impact. For statutory reporting purposes, policyholder income tax and other related taxes paid on behalf of policyholders are included in net funds management and insurance income and income tax expense. The gross up has been excluded from cash profit as it does not reflect the underlying performance of the business which is assessed net of policyholder tax.
6,406
FY17 Statutory profit
Economic and revenue hedges
Revaluation of policy liabilities
Reclassification of SRCB to
held for sale
FY17 Cash profit
Treasury shares
adjustment
Structured credit intermediation
trades
110
34
6,938
58
333
(3)
$m
16
ANZ 2017 ANNUAL REPORT
OUR PERFORMANCE (continued)
CASH PROFIT PERFORMANCE
Income Statement
2017 2016
$m $m Movt
Net interest income 14,872 15,095 -1%
Other operating income 5,617 5,499 2%
Operating income 20,489 20,594 -1%
Operating expenses (9,448) (10,439) -9%
Profit before credit impairment and income tax 11,041 10,155 9%
Credit impairment charge (1,199) (1,956) -39%
Profit before income tax 9,842 8,199 20%
Income tax expense and non-controlling interests (2,904) (2,310) 26%
Cash profit 6,938 5,889 18%
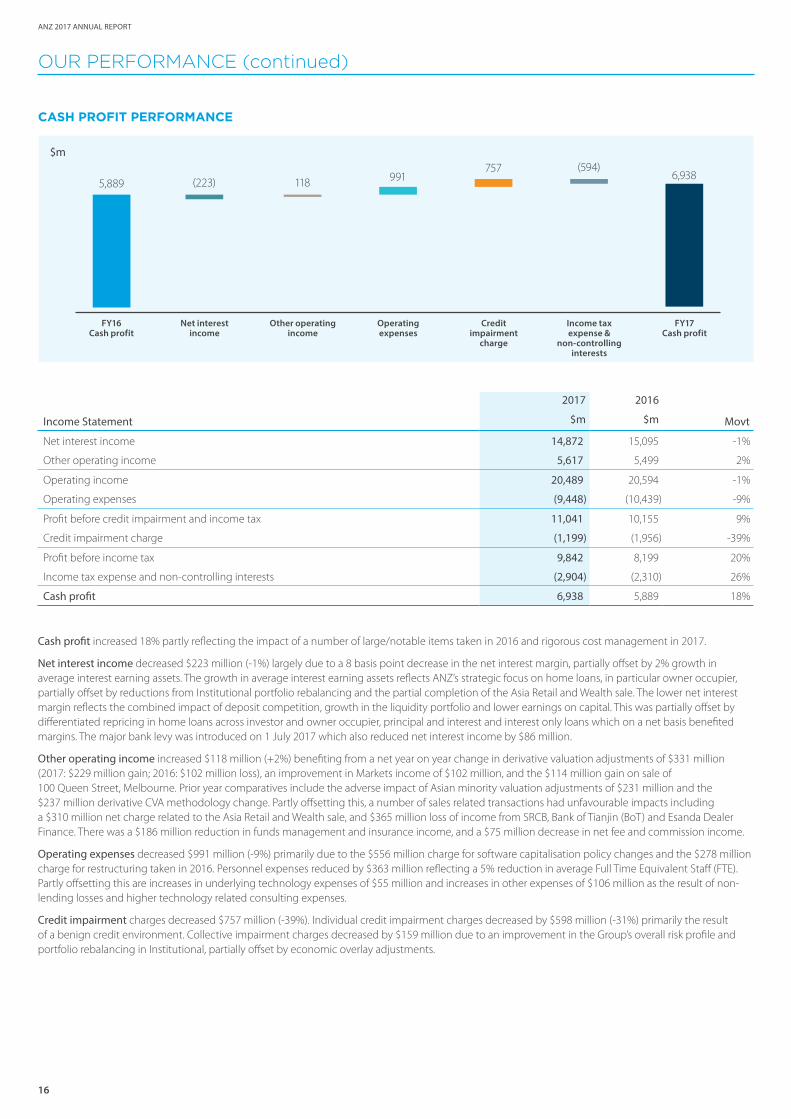
Cash profit increased 18% partly reflecting the impact of a number of large/notable items taken in 2016 and rigorous cost management in 2017.
Net interest income decreased $223 million (-1%) largely due to a 8 basis point decrease in the net interest margin, partially offset by 2% growth in average interest earning assets. The growth in average interest earning assets reflects ANZ’s strategic focus on home loans, in particular owner occupier, partially offset by reductions from Institutional portfolio rebalancing and the partial completion of the Asia Retail and Wealth sale. The lower net interest margin reflects the combined impact of deposit competition, growth in the liquidity portfolio and lower earnings on capital. This was partially offset by differentiated repricing in home loans across investor and owner occupier, principal and interest and interest only loans which on a net basis benefited margins. The major bank levy was introduced on 1 July 2017 which also reduced net interest income by $86 million.
Other operating income increased $118 million (+2%) benefiting from a net year on year change in derivative valuation adjustments of $331 million (2017: $229 million gain; 2016: $102 million loss), an improvement in Markets income of $102 million, and the $114 million gain on sale of 100 Queen Street, Melbourne. Prior year comparatives include the adverse impact of Asian minority valuation adjustments of $231 million and the $237 million derivative CVA methodology change. Partly offsetting this, a number of sales related transactions had unfavourable impacts including a $310 million net charge related to the Asia Retail and Wealth sale, and $365 million loss of income from SRCB, Bank of Tianjin (BoT) and Esanda Dealer Finance. There was a $186 million reduction in funds management and insurance income, and a $75 million decrease in net fee and commission income.
Operating expenses decreased $991 million (-9%) primarily due to the $556 million charge for software capitalisation policy changes and the $278 million charge for restructuring taken in 2016. Personnel expenses reduced by $363 million reflecting a 5% reduction in average Full Time Equivalent Staff (FTE). Partly offsetting this are increases in underlying technology expenses of $55 million and increases in other expenses of $106 million as the result of non-lending losses and higher technology related consulting expenses.
Credit impairment charges decreased $757 million (-39%). Individual credit impairment charges decreased by $598 million (-31%) primarily the result of a benign credit environment. Collective impairment charges decreased by $159 million due to an improvement in the Group’s overall risk profile and portfolio rebalancing in Institutional, partially offset by economic overlay adjustments.
5,889
FY16 Cash profit
Operating expenses
Other operating income
Income tax expense &
non-controlling interests
FY17 Cash profit
Net interest income
Credit impairment
charge
9911186,938
(223)(594)757
$m
17
OUR PERFORMANCE
DIVIDENDSThis performance allowed us to propose that a final dividend of 80 cents be paid on each eligible fully paid ANZ ordinary share, bringing the total dividend for the year ended 30 September 2017 to $1.60 per share. This represents a dividend payout ratio (cash basis) of 67.7%.
The proposed 2017 final dividend will be fully franked for Australian taxation purposes, and New Zealand (NZ) imputation credits of NZ 10 cents per ordinary share will also be attached. It will be paid on 18 December 2017 to owners of ordinary shares at close of business on 14 November 2017 (record date).
ANZ has a Dividend Reinvestment Plan (DRP) and a Bonus Option Plan (BOP) that will operate in respect of the proposed 2017 final dividend. For the 2017 final dividend, ANZ intends to provide shares under the DRP through an on-market purchase (as approved by APRA) and BOP through the issue of new shares.
Further details on dividends provided for or paid during the year ended 30 September 2017 are set out in Note 5 in the Financial Report.
ANALYSIS OF CASH PROFIT PERFORMANCE
NET INTEREST INCOME
2017 2016 Movt
Net interest income ($m) 14,872 15,095 -1%
Net interest margin (%) 1.99% 2.07% -8 bps
Average interest earnings assets ($m) 748,000 730,835 2%
Average deposits and other borrowings ($m) 600,186 586,453 2%
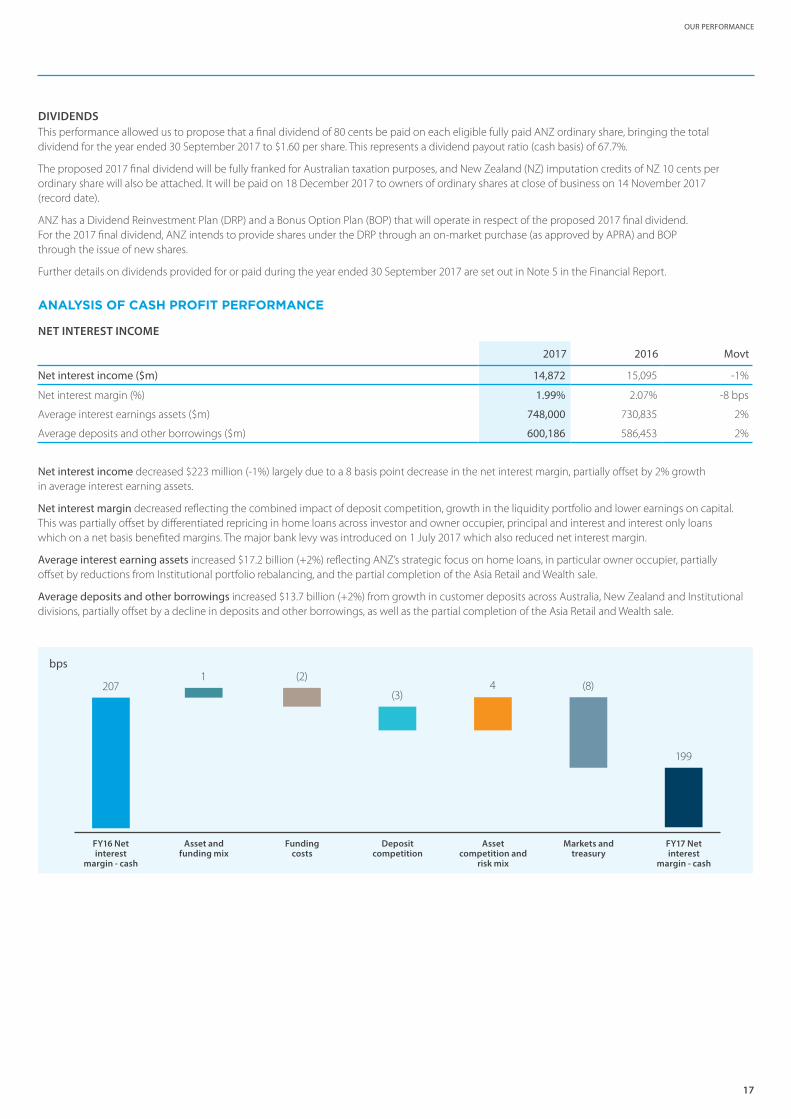
Net interest income decreased $223 million (-1%) largely due to a 8 basis point decrease in the net interest margin, partially offset by 2% growth in average interest earning assets.
Net interest margin decreased reflecting the combined impact of deposit competition, growth in the liquidity portfolio and lower earnings on capital. This was partially offset by differentiated repricing in home loans across investor and owner occupier, principal and interest and interest only loans which on a net basis benefited margins. The major bank levy was introduced on 1 July 2017 which also reduced net interest margin.
Average interest earning assets increased $17.2 billion (+2%) reflecting ANZ’s strategic focus on home loans, in particular owner occupier, partially offset by reductions from Institutional portfolio rebalancing, and the partial completion of the Asia Retail and Wealth sale.
Average deposits and other borrowings increased $13.7 billion (+2%) from growth in customer deposits across Australia, New Zealand and Institutional divisions, partially offset by a decline in deposits and other borrowings, as well as the partial completion of the Asia Retail and Wealth sale.
207
FY16 Net interest
margin - cash
Deposit competition
Funding costs
Markets and treasury
FY17 Net interest
margin - cash
Asset and funding mix
Asset competition and
risk mix
(3)
(2)
199
1(8)4
bps
18
ANZ 2017 ANNUAL REPORT
OUR PERFORMANCE (continued)
OTHER OPERATING INCOME
20172017 2016$m$m $m Movt
Other operating income 5,6175,617 5,499 2%
Total increase/ (decrease) $m Movt Explanation
Net fee and commission income1
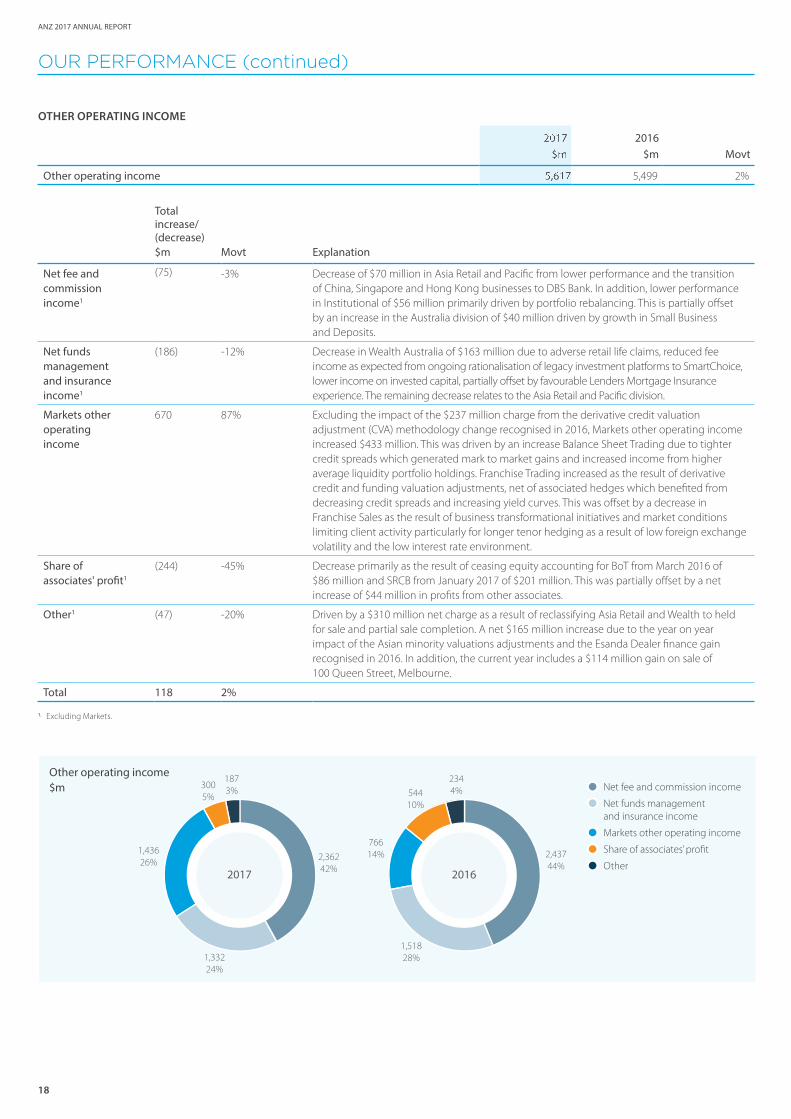
(75) -3% Decrease of $70 million in Asia Retail and Pacific from lower performance and the transition of China, Singapore and Hong Kong businesses to DBS Bank. In addition, lower performance in Institutional of $56 million primarily driven by portfolio rebalancing. This is partially offset by an increase in the Australia division of $40 million driven by growth in Small Business and Deposits.
Net funds management and insurance income1
(186) -12% Decrease in Wealth Australia of $163 million due to adverse retail life claims, reduced fee income as expected from ongoing rationalisation of legacy investment platforms to SmartChoice, lower income on invested capital, partially offset by favourable Lenders Mortgage Insurance experience. The remaining decrease relates to the Asia Retail and Pacific division.
Markets other operating income
670 87% Excluding the impact of the $237 million charge from the derivative credit valuation adjustment (CVA) methodology change recognised in 2016, Markets other operating income increased $433 million. This was driven by an increase Balance Sheet Trading due to tighter credit spreads which generated mark to market gains and increased income from higher average liquidity portfolio holdings. Franchise Trading increased as the result of derivative credit and funding valuation adjustments, net of associated hedges which benefited from decreasing credit spreads and increasing yield curves. This was offset by a decrease in Franchise Sales as the result of business transformational initiatives and market conditions limiting client activity particularly for longer tenor hedging as a result of low foreign exchange volatility and the low interest rate environment.
Share of associates' profit1
(244) -45% Decrease primarily as the result of ceasing equity accounting for BoT from March 2016 of $86 million and SRCB from January 2017 of $201 million. This was partially offset by a net increase of $44 million in profits from other associates.
Other1 (47) -20% Driven by a $310 million net charge as a result of reclassifying Asia Retail and Wealth to held for sale and partial sale completion. A net $165 million increase due to the year on year impact of the Asian minority valuations adjustments and the Esanda Dealer finance gain recognised in 2016. In addition, the current year includes a $114 million gain on sale of 100 Queen Street, Melbourne.
Total 118 2%
● Net fee and commission income
● Net funds management and insurance income
● Markets other operating income
● Share of associates’ profit
● Other2,36242%
1,33224%
1,43626%
3005%
1873%
2017
2,43744%
1,51828%
76614%
54410%
2344%
2016
Other operating income$m
1. Excluding Markets.
19
OUR PERFORMANCE
OPERATING EXPENSES
2017 2016Movt
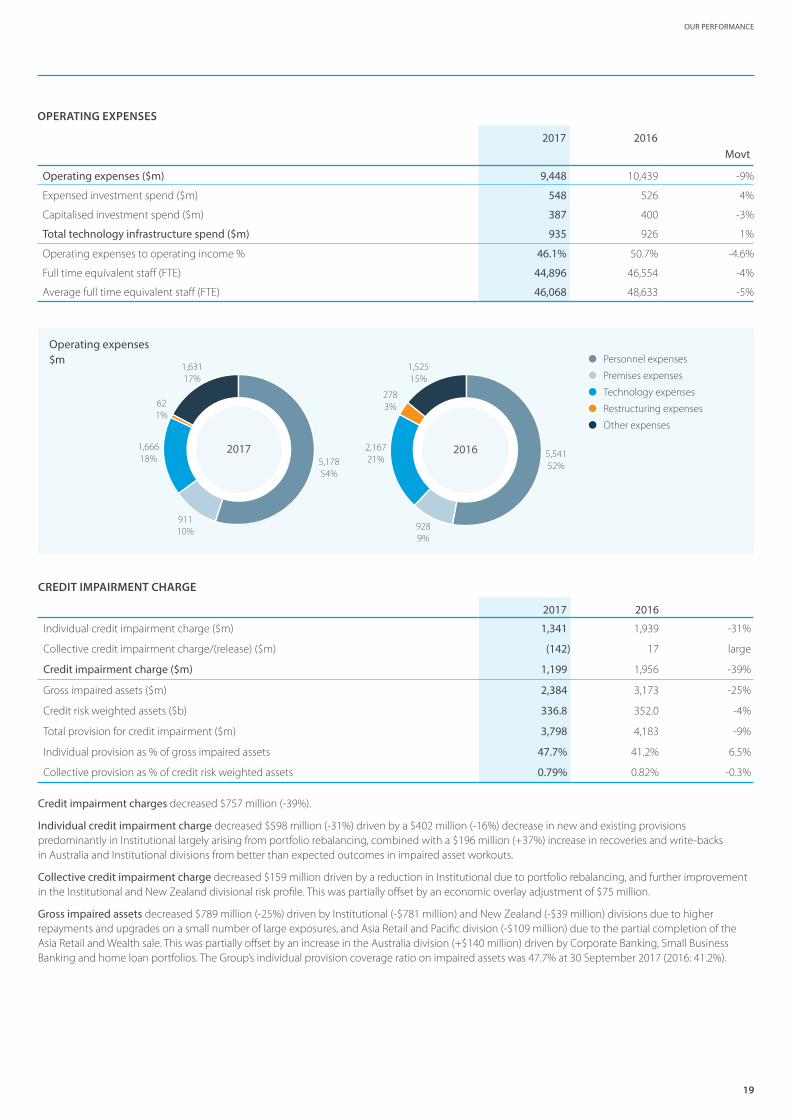
Operating expenses ($m) 9,448 10,439 -9%
Expensed investment spend ($m) 548 526 4%
Capitalised investment spend ($m) 387 400 -3%
Total technology infrastructure spend ($m) 935 926 1%
Operating expenses to operating income % 46.1% 50.7% -4.6%
Full time equivalent staff (FTE) 44,896 46,554 -4%
Average full time equivalent staff (FTE) 46,068 48,633 -5%
● Personnel expenses
● Premises expenses
● Technology expenses
● Restructuring expenses
● Other expenses
5,17854%
91110%
1,66618%
621%
1,63117%
2017 5,54152%
9289%
2,16721%
2783%
1,52515%
2016
Operating expenses $m
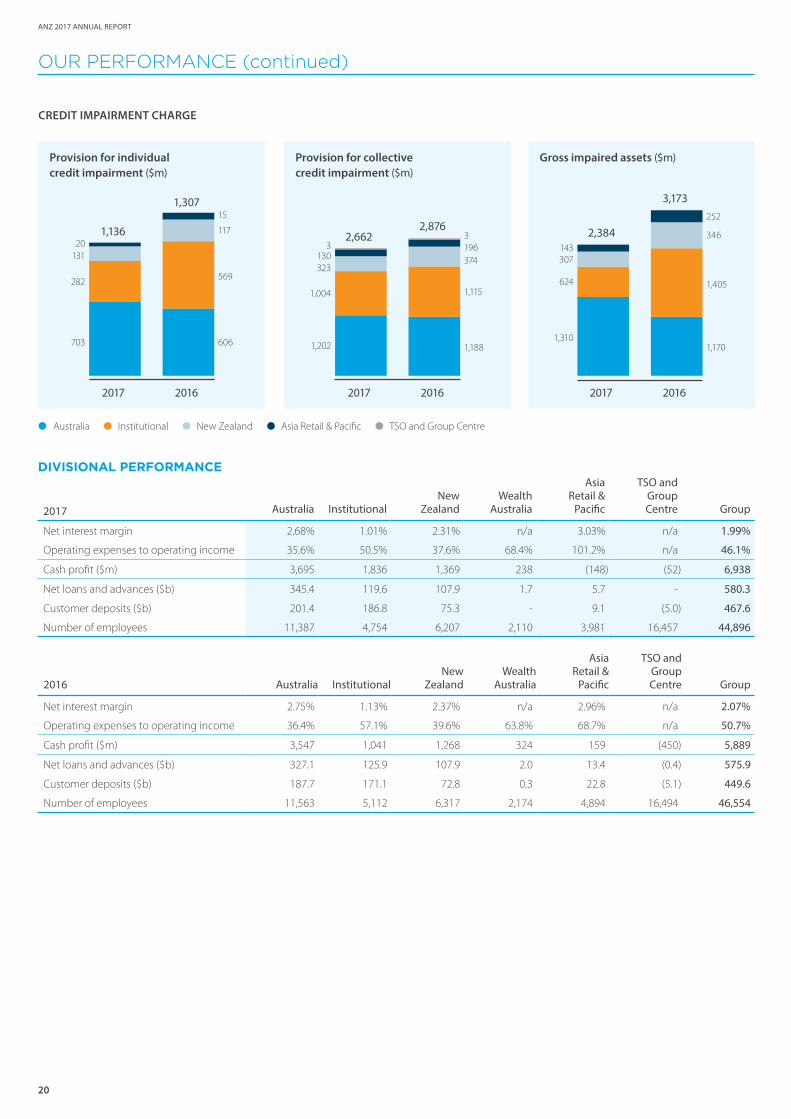
CREDIT IMPAIRMENT CHARGE
2017 2016
Individual credit impairment charge ($m) 1,341 1,939 -31%
Collective credit impairment charge/(release) ($m) (142) 17 large
Credit impairment charge ($m) 1,199 1,956 -39%
Gross impaired assets ($m) 2,384 3,173 -25%
Credit risk weighted assets ($b) 336.8 352.0 -4%
Total provision for credit impairment ($m) 3,798 4,183 -9%
Individual provision as % of gross impaired assets 47.7% 41.2% 6.5%
Collective provision as % of credit risk weighted assets 0.79% 0.82% -0.3%
Credit impairment charges decreased $757 million (-39%).
Individual credit impairment charge decreased $598 million (-31%) driven by a $402 million (-16%) decrease in new and existing provisions predominantly in Institutional largely arising from portfolio rebalancing, combined with a $196 million (+37%) increase in recoveries and write-backs in Australia and Institutional divisions from better than expected outcomes in impaired asset workouts.
Collective credit impairment charge decreased $159 million driven by a reduction in Institutional due to portfolio rebalancing, and further improvement in the Institutional and New Zealand divisional risk profile. This was partially offset by an economic overlay adjustment of $75 million.
Gross impaired assets decreased $789 million (-25%) driven by Institutional (-$781 million) and New Zealand (-$39 million) divisions due to higher repayments and upgrades on a small number of large exposures, and Asia Retail and Pacific division (-$109 million) due to the partial completion of the Asia Retail and Wealth sale. This was partially offset by an increase in the Australia division (+$140 million) driven by Corporate Banking, Small Business Banking and home loan portfolios. The Group’s individual provision coverage ratio on impaired assets was 47.7% at 30 September 2017 (2016: 41.2%).
20
ANZ 2017 ANNUAL REPORT
Provision for collective credit impairment ($m)
1,1881,202
1,004
323130
3
1,115
37419632,662
2,876
Gross impaired assets ($m)
1,1701,310
624
307143
1,405
346
252
2,384
3,173
606703
282
13120
569
117
15
1,136
1,307
Provision for individual credit impairment ($m)
OUR PERFORMANCE (continued)
DIVISIONAL PERFORMANCE
2017 Australia InstitutionalNew
ZealandWealth
Australia
Asia Retail &
Pacific
TSO and Group Centre Group
Net interest margin 2.68% 1.01% 2.31% n/a 3.03% n/a 1.99%
Operating expenses to operating income 35.6% 50.5% 37.6% 68.4% 101.2% n/a 46.1%
Cash profit ($m) 3,695 1,836 1,369 238 (148) (52) 6,938
Net loans and advances ($b) 345.4 119.6 107.9 1.7 5.7 - 580.3
Customer deposits ($b) 201.4 186.8 75.3 - 9.1 (5.0) 467.6
Number of employees 11,387 4,754 6,207 2,110 3,981 16,457 44,896
2016 Australia InstitutionalNew
ZealandWealth
Australia
Asia Retail &
Pacific
TSO and Group Centre Group
Net interest margin 2.75% 1.13% 2.37% n/a 2.96% n/a 2.07%
Operating expenses to operating income 36.4% 57.1% 39.6% 63.8% 68.7% n/a 50.7%
Cash profit ($m) 3,547 1,041 1,268 324 159 (450) 5,889
Net loans and advances ($b) 327.1 125.9 107.9 2.0 13.4 (0.4) 575.9
Customer deposits ($b) 187.7 171.1 72.8 0.3 22.8 (5.1) 449.6
Number of employees 11,563 5,112 6,317 2,174 4,894 16,494 46,554
● Australia ●Institutional ●New Zealand ●Asia Retail & Pacific ●TSO and Group Centre
CREDIT IMPAIRMENT CHARGE
2017 2016 2017 2016 2017 2016

21
OUR PERFORMANCE
DIVISIONAL PERFORMANCE
Australia
Net interest margin declined as the result of higher average funding costs, lower earnings on deposits due to the lower interest rate environment and the introduction of the major bank levy. Net loans and advances grew in home loans particularly in New South Wales, and Corporate Banking. Customer deposits grew across all portfolios. Operating expenses were broadly flat due to a reduction in FTE driven by productivity efforts focused on simplifying the business, partially offset by inflation and increased investment in the business. Credit impairment charges decreased primarily due to lower single name charges in Corporate and Commercial Banking, partially offset by volume growth and higher delinquency rates for home loans in Western Australia. This led to a $148 million (+4%) increase in cash profit from prior year.
Institutional
Net interest margin ex-Markets decreased due to asset pricing competition, the introduction of the major bank levy and the mix impact of lower lending volumes and higher deposit volumes, partially offset by margin improvements in Payments and Cash Management. Net loans and advances were down due to portfolio rebalancing mainly in Loans & Specialised Finance and Transaction Banking. Customer deposits grew in Markets and Transaction Banking. Other operating income increased significantly due to positive derivative valuation adjustments and higher Markets Balance Sheet income as a result of tightening credit spreads. Operating expenses decreased due to a reduction in FTE as a result of ongoing simplification of the business, partially offset by higher non-lending losses, regulatory and compliance spend. Credit impairment charges decreased significantly due to a benign credit environment, higher write-backs and an overall reduction in lending assets driven by portfolio rebalancing. This led to a $795 million (+76%) increase in cash profit from prior year.
New Zealand
Net interest margin declined as the result of a higher proportion of lower margin fixed rate lending and term deposits, pricing competition and higher average funding costs. Net loans and advances grew in home loans (excluding foreign currency impacts) in addition to higher balances in funds under management. Customer deposits grew across all portfolios. Other operating income decreased, more than offset by an increase in net funds management and insurance income as the result of higher funds under management balances. Operating expenses decreased from a reduction in FTE driven by automation and transaction migration to lower cost channels, partially offset by inflation. Credit impairment charges decreased due to an increase in write-backs and credit quality improvements across the Retail and Commercial and Agri portfolios, partially offset by increases in new and existing provisions. This led to a $101 million (+8%) increase in cash profit from prior year.
Wealth Australia
Insurance income decreased as the result of adverse retail life claims experience, a one-off experience loss due to the exit of a Group Life insurance plan, partially offset by reinsurance profit share and favourable claims experience in Lenders Mortgage Insurance. Funds Management income decreased in line with the planned strategy to rationalise the legacy portfolio to SmartChoice, a simpler and lower risk model, which is now complete. Corporate and Other income decreased due to realised gains in 2016 which was not repeated and investment market volatility on the guaranteed business. Operating expenses decreased due to productivity initiatives that resulted in a reduction in FTE, partially offset by inflation and higher regulatory compliance and remediation spend. This led to an $86 million (-27%) decrease in cash profit from prior year.
Asia Retail & Pacific
Asia Retail and Pacific results for 2017 were impacted by the reclassification of Asia Retail and Wealth business to held for sale and the transition of China, Singapore and Hong Kong businesses to DBS Bank, which resulted in a $310 million net charge (pre-tax). This led to a $307 million decrease in cash profit from prior year.
TSO and Group Centre
TSO and Group Centre divisional results for 2016 and 2017 were impacted by a number of large/notable items outlined on page 22. This includes Asian minority valuation adjustments in 2016, loss of equity accounted earnings in 2016 and 2017, Esanda Dealer Finance divestment gain on sale in 2016, software capitalisation changes in 2016, and the gain on sale of 100 Queen Street, Melbourne in 2017. This led to a $398 million (+88%) increase in cash profit from prior year.
22
ANZ 2017 ANNUAL REPORT
OUR PERFORMANCE (continued)
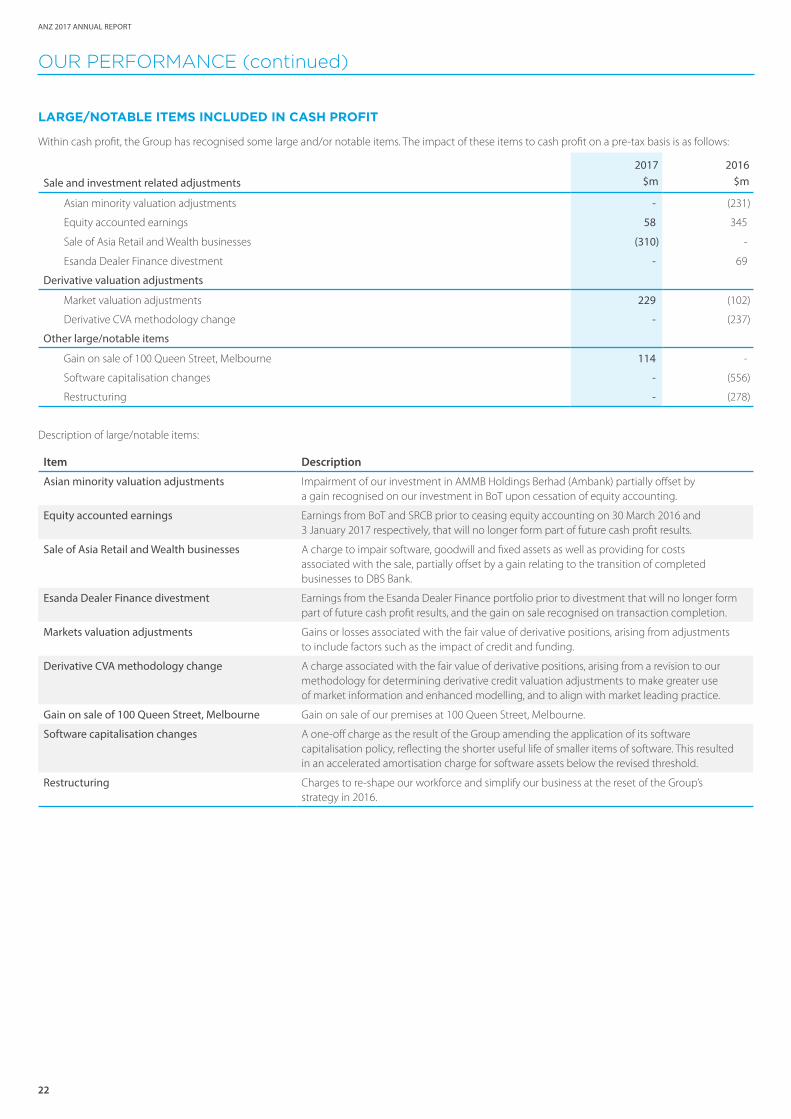
LARGE/NOTABLE ITEMS INCLUDED IN CASH PROFIT
Within cash profit, the Group has recognised some large and/or notable items. The impact of these items to cash profit on a pre-tax basis is as follows:
2017 2016
Sale and investment related adjustments $m $m
Asian minority valuation adjustments - (231)
Equity accounted earnings 58 345
Sale of Asia Retail and Wealth businesses (310) -
Esanda Dealer Finance divestment - 69
Derivative valuation adjustments
Market valuation adjustments 229 (102)
Derivative CVA methodology change - (237)
Other large/notable items
Gain on sale of 100 Queen Street, Melbourne 114 -
Software capitalisation changes - (556)
Restructuring - (278)
Description of large/notable items:
Item Description
Asian minority valuation adjustments Impairment of our investment in AMMB Holdings Berhad (Ambank) partially offset by a gain recognised on our investment in BoT upon cessation of equity accounting.
Equity accounted earnings Earnings from BoT and SRCB prior to ceasing equity accounting on 30 March 2016 and 3 January 2017 respectively, that will no longer form part of future cash profit results.
Sale of Asia Retail and Wealth businesses A charge to impair software, goodwill and fixed assets as well as providing for costs associated with the sale, partially offset by a gain relating to the transition of completed businesses to DBS Bank.
Esanda Dealer Finance divestment Earnings from the Esanda Dealer Finance portfolio prior to divestment that will no longer form part of future cash profit results, and the gain on sale recognised on transaction completion.
Markets valuation adjustments Gains or losses associated with the fair value of derivative positions, arising from adjustments to include factors such as the impact of credit and funding.
Derivative CVA methodology change A charge associated with the fair value of derivative positions, arising from a revision to our methodology for determining derivative credit valuation adjustments to make greater use of market information and enhanced modelling, and to align with market leading practice.
Gain on sale of 100 Queen Street, Melbourne Gain on sale of our premises at 100 Queen Street, Melbourne.
Software capitalisation changes A one-off charge as the result of the Group amending the application of its software capitalisation policy, reflecting the shorter useful life of smaller items of software. This resulted in an accelerated amortisation charge for software assets below the revised threshold.
Restructuring Charges to re-shape our workforce and simplify our business at the reset of the Group’s strategy in 2016.
23
OUR PERFORMANCE
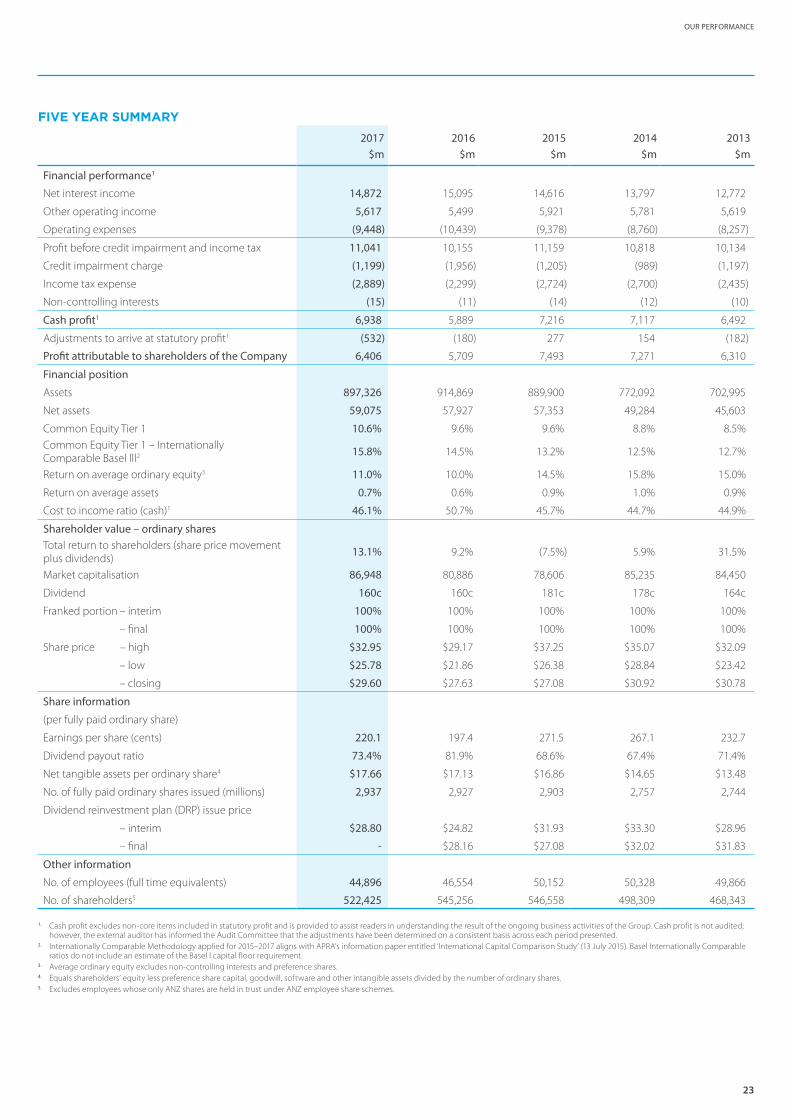
FIVE YEAR SUMMARY2017 2016 2015 2014 2013
$m $m $m $m $m
Financial performance1
Net interest income 14,872 15,095 14,616 13,797 12,772
Other operating income 5,617 5,499 5,921 5,781 5,619
Operating expenses (9,448) (10,439) (9,378) (8,760) (8,257)
Profit before credit impairment and income tax 11,041 10,155 11,159 10,818 10,134
Credit impairment charge (1,199) (1,956) (1,205) (989) (1,197)
Income tax expense (2,889) (2,299) (2,724) (2,700) (2,435)
Non-controlling interests (15) (11) (14) (12) (10)
Cash profit1 6,938 5,889 7,216 7,117 6,492
Adjustments to arrive at statutory profit1 (532) (180) 277 154 (182)
Profit attributable to shareholders of the Company 6,406 5,709 7,493 7,271 6,310
Financial position
Assets 897,326 914,869 889,900 772,092 702,995
Net assets 59,075 57,927 57,353 49,284 45,603
Common Equity Tier 1 10.6% 9.6% 9.6% 8.8% 8.5%Common Equity Tier 1 – Internationally Comparable Basel lll2 15.8% 14.5% 13.2% 12.5% 12.7%
Return on average ordinary equity3 11.0% 10.0% 14.5% 15.8% 15.0%
Return on average assets 0.7% 0.6% 0.9% 1.0% 0.9%
Cost to income ratio (cash)1 46.1% 50.7% 45.7% 44.7% 44.9%
Shareholder value – ordinary sharesTotal return to shareholders (share price movement plus dividends)
13.1% 9.2% (7.5%) 5.9% 31.5%
Market capitalisation 86,948 80,886 78,606 85,235 84,450
Dividend 160c 160c 181c 178c 164c
Franked portion – interim 100% 100% 100% 100% 100%
– final 100% 100% 100% 100% 100%
Share price – high $32.95 $29.17 $37.25 $35.07 $32.09
– low $25.78 $21.86 $26.38 $28.84 $23.42
– closing $29.60 $27.63 $27.08 $30.92 $30.78
Share information
(per fully paid ordinary share)
Earnings per share (cents) 220.1 197.4 271.5 267.1 232.7
Dividend payout ratio 73.4% 81.9% 68.6% 67.4% 71.4%
Net tangible assets per ordinary share4 $17.66 $17.13 $16.86 $14.65 $13.48
No. of fully paid ordinary shares issued (millions) 2,937 2,927 2,903 2,757 2,744
Dividend reinvestment plan (DRP) issue price
– interim $28.80 $24.82 $31.93 $33.30 $28.96
– final - $28.16 $27.08 $32.02 $31.83
Other information
No. of employees (full time equivalents) 44,896 46,554 50,152 50,328 49,866
No. of shareholders5 522,425 545,256 546,558 498,309 468,343
1. Cash profit excludes non-core items included in statutory profit and is provided to assist readers in understanding the result of the ongoing business activities of the Group. Cash profit is not audited; however, the external auditor has informed the Audit Committee that the adjustments have been determined on a consistent basis across each period presented.
2. Internationally Comparable Methodology applied for 2015–2017 aligns with APRA’s information paper entitled ‘International Capital Comparison Study’ (13 July 2015). Basel Internationally Comparable ratios do not include an estimate of the Basel l capital floor requirement.
3. Average ordinary equity excludes non-controlling interests and preference shares.4. Equals shareholders’ equity less preference share capital, goodwill, software and other intangible assets divided by the number of ordinary shares.5. Excludes employees whose only ANZ shares are held in trust under ANZ employee share schemes.

A EC G
B FD H
David Gonski, AC Chairman, Independent Non-Executive Director
Graeme Liebelt Independent Non-Executive Director
John Macfarlane Independent Non-Executive Director
Paula Dwyer Independent Non-Executive Director
Ilana Atlas Independent Non-Executive Director
Shayne Elliott Chief Executive Officer, Executive Director
Jane Halton, AO, PSM Independent Non-Executive Director
Lee Hsien Yang Independent Non-Executive Director
AB
CD
BOARD OF DIRECTORS
GOVERNANCE
ANZ 2017 ANNUAL REPORT
24

The Board comprises seven Non-Executive, Independent Directors and one Executive Director — the Chief Executive Officer. Details of each Director’s qualifications, experience and special responsibilities are set out on the following pages. In addition, ANZ’s Board skills matrix (available on anz.com/corporategovernance) sets out the skills that ANZ considers each Director brings to the Board.
E
F
G
H
GOVERNANCE
25
GOVERNANCE (continued)
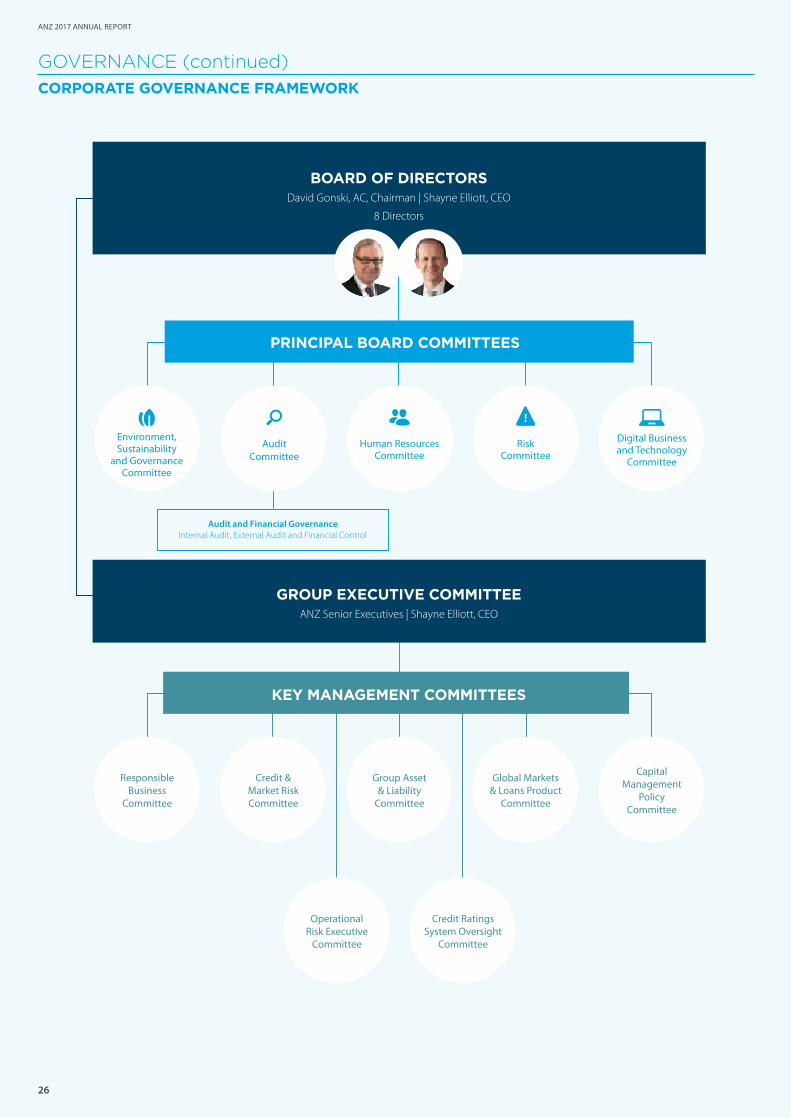
CORPORATE GOVERNANCE FRAMEWORK
BOARD OF DIRECTORSDavid Gonski, AC, Chairman | Shayne Elliott, CEO
8 Directors
GROUP EXECUTIVE COMMITTEEANZ Senior Executives | Shayne Elliott, CEO
Responsible Business
Committee
Operational Risk Executive
Committee
Credit Ratings System Oversight
Committee
Group Asset & Liability
Committee
Credit & Market Risk Committee
Global Markets & Loans Product
Committee
Capital Management
Policy Committee
Digital Business and Technology
Committee
Environment, Sustainability
and Governance Committee
Risk Committee
Human Resources Committee
KEY MANAGEMENT COMMITTEES
PRINCIPAL BOARD COMMITTEES
ANZ 2017 ANNUAL REPORT
Audit and Financial GovernanceInternal Audit, External Audit and Financial Control
AuditCommittee
26
27
GOVERNANCE
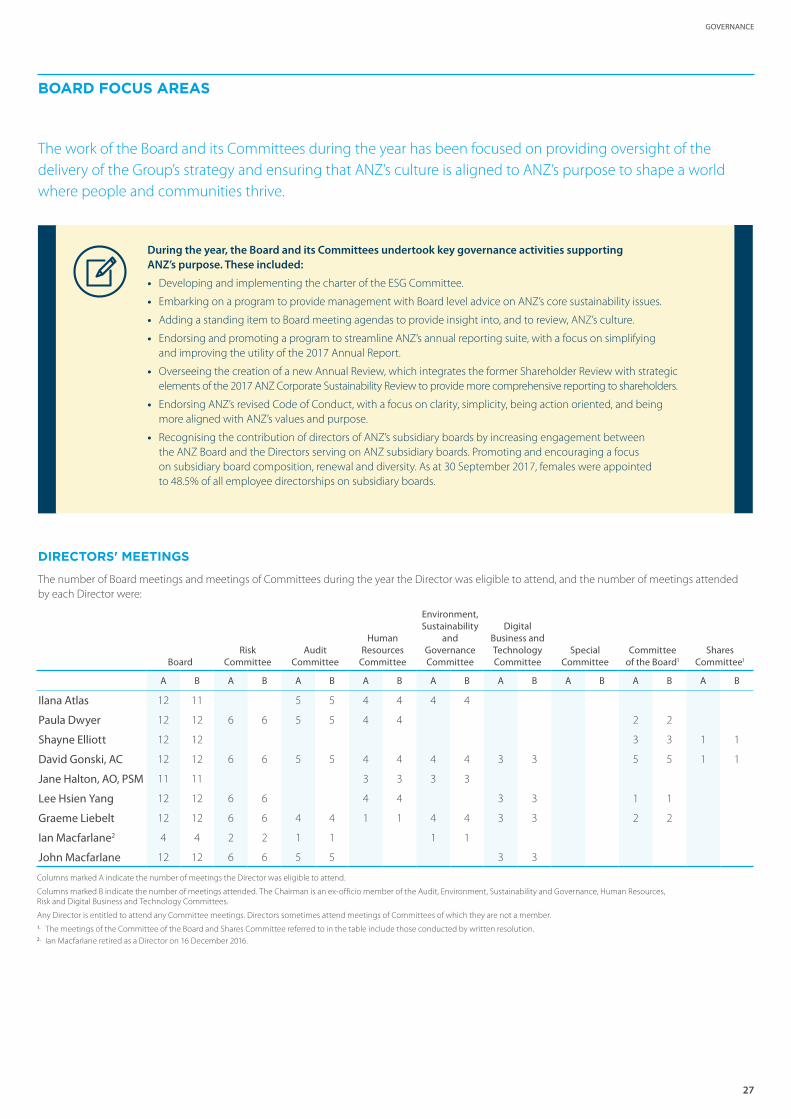
The work of the Board and its Committees during the year has been focused on providing oversight of the delivery of the Group’s strategy and ensuring that ANZ’s culture is aligned to ANZ’s purpose to shape a world where people and communities thrive.
BOARD FOCUS AREAS
Columns marked A indicate the number of meetings the Director was eligible to attend.
Columns marked B indicate the number of meetings attended. The Chairman is an ex-officio member of the Audit, Environment, Sustainability and Governance, Human Resources, Risk and Digital Business and Technology Committees.
Any Director is entitled to attend any Committee meetings. Directors sometimes attend meetings of Committees of which they are not a member.1. The meetings of the Committee of the Board and Shares Committee referred to in the table include those conducted by written resolution.2. Ian Macfarlane retired as a Director on 16 December 2016.
DIRECTORS' MEETINGS
The number of Board meetings and meetings of Committees during the year the Director was eligible to attend, and the number of meetings attended by each Director were:
BoardRisk
CommitteeAudit
Committee
Human Resources
Committee
Environment, Sustainability
and Governance Committee
Digital Business and Technology Committee
Special Committee
Committee of the Board1
Shares Committee1
A B A B A B A B A B A B A B A B A B
Ilana Atlas 12 11 5 5 4 4 4 4
Paula Dwyer 12 12 6 6 5 5 4 4 2 2
Shayne Elliott 12 12 3 3 1 1
David Gonski, AC 12 12 6 6 5 5 4 4 4 4 3 3 5 5 1 1
Jane Halton, AO, PSM 11 11 3 3 3 3
Lee Hsien Yang 12 12 6 6 4 4 3 3 1 1
Graeme Liebelt 12 12 6 6 4 4 1 1 4 4 3 3 2 2
Ian Macfarlane2 4 4 2 2 1 1 1 1
John Macfarlane 12 12 6 6 5 5 3 3
During the year, the Board and its Committees undertook key governance activities supporting ANZ’s purpose. These included:
• Developing and implementing the charter of the ESG Committee.
• Embarking on a program to provide management with Board level advice on ANZ’s core sustainability issues.
• Adding a standing item to Board meeting agendas to provide insight into, and to review, ANZ’s culture.
• Endorsing and promoting a program to streamline ANZ’s annual reporting suite, with a focus on simplifying and improving the utility of the 2017 Annual Report.
• Overseeing the creation of a new Annual Review, which integrates the former Shareholder Review with strategic elements of the 2017 ANZ Corporate Sustainability Review to provide more comprehensive reporting to shareholders.
• Endorsing ANZ’s revised Code of Conduct, with a focus on clarity, simplicity, being action oriented, and being more aligned with ANZ’s values and purpose.
• Recognising the contribution of directors of ANZ’s subsidiary boards by increasing engagement between the ANZ Board and the Directors serving on ANZ subsidiary boards. Promoting and encouraging a focus on subsidiary board composition, renewal and diversity. As at 30 September 2017, females were appointed to 48.5% of all employee directorships on subsidiary boards.
28
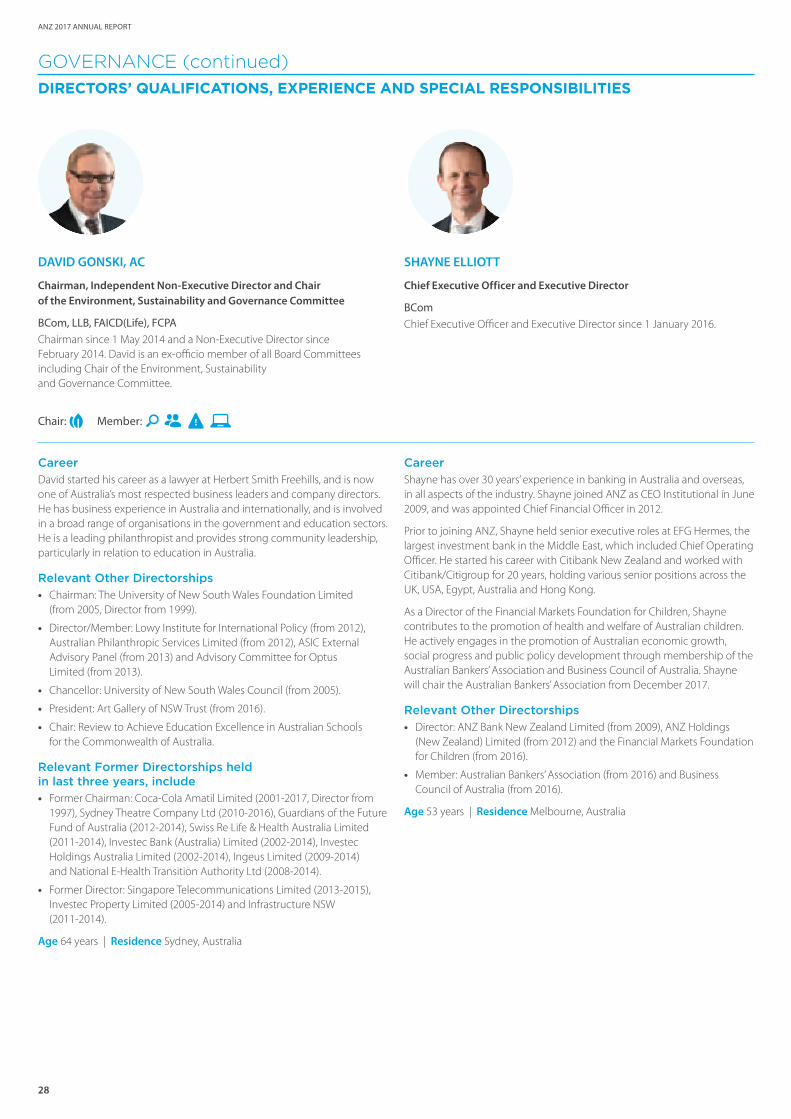
SHAYNE ELLIOTT
Chief Executive Officer and Executive Director
BCom
Chief Executive Officer and Executive Director since 1 January 2016.
Career
David started his career as a lawyer at Herbert Smith Freehills, and is now one of Australia’s most respected business leaders and company directors. He has business experience in Australia and internationally, and is involved in a broad range of organisations in the government and education sectors. He is a leading philanthropist and provides strong community leadership, particularly in relation to education in Australia.
Relevant Other Directorships
• Chairman: The University of New South Wales Foundation Limited (from 2005, Director from 1999).
• Director/Member: Lowy Institute for International Policy (from 2012), Australian Philanthropic Services Limited (from 2012), ASIC External Advisory Panel (from 2013) and Advisory Committee for Optus Limited (from 2013).
• Chancellor: University of New South Wales Council (from 2005).
• President: Art Gallery of NSW Trust (from 2016).
• Chair: Review to Achieve Education Excellence in Australian Schools for the Commonwealth of Australia.
Relevant Former Directorships held in last three years, include
• Former Chairman: Coca-Cola Amatil Limited (2001-2017, Director from 1997), Sydney Theatre Company Ltd (2010-2016), Guardians of the Future Fund of Australia (2012-2014), Swiss Re Life & Health Australia Limited (2011-2014), Investec Bank (Australia) Limited (2002-2014), Investec Holdings Australia Limited (2002-2014), Ingeus Limited (2009-2014) and National E-Health Transition Authority Ltd (2008-2014).
• Former Director: Singapore Telecommunications Limited (2013-2015), Investec Property Limited (2005-2014) and Infrastructure NSW (2011-2014).
Age 64 years | Residence Sydney, Australia
Career
Shayne has over 30 years’ experience in banking in Australia and overseas, in all aspects of the industry. Shayne joined ANZ as CEO Institutional in June 2009, and was appointed Chief Financial Officer in 2012.
Prior to joining ANZ, Shayne held senior executive roles at EFG Hermes, the largest investment bank in the Middle East, which included Chief Operating Officer. He started his career with Citibank New Zealand and worked with Citibank/Citigroup for 20 years, holding various senior positions across the UK, USA, Egypt, Australia and Hong Kong.
As a Director of the Financial Markets Foundation for Children, Shayne contributes to the promotion of health and welfare of Australian children. He actively engages in the promotion of Australian economic growth, social progress and public policy development through membership of the Australian Bankers’ Association and Business Council of Australia. Shayne will chair the Australian Bankers’ Association from December 2017.
Relevant Other Directorships
• Director: ANZ Bank New Zealand Limited (from 2009), ANZ Holdings (New Zealand) Limited (from 2012) and the Financial Markets Foundation for Children (from 2016).
• Member: Australian Bankers’ Association (from 2016) and Business Council of Australia (from 2016).
Age 53 years | Residence Melbourne, Australia
DAVID GONSKI, AC
Chairman, Independent Non-Executive Director and Chair of the Environment, Sustainability and Governance Committee
BCom, LLB, FAICD(Life), FCPA
Chairman since 1 May 2014 and a Non-Executive Director since February 2014. David is an ex-officio member of all Board Committees including Chair of the Environment, Sustainability and Governance Committee.
Chair: Member:
GOVERNANCE (continued)
DIRECTORS’ QUALIFICATIONS, EXPERIENCE AND SPECIAL RESPONSIBILITIES
ANZ 2017 ANNUAL REPORT
29
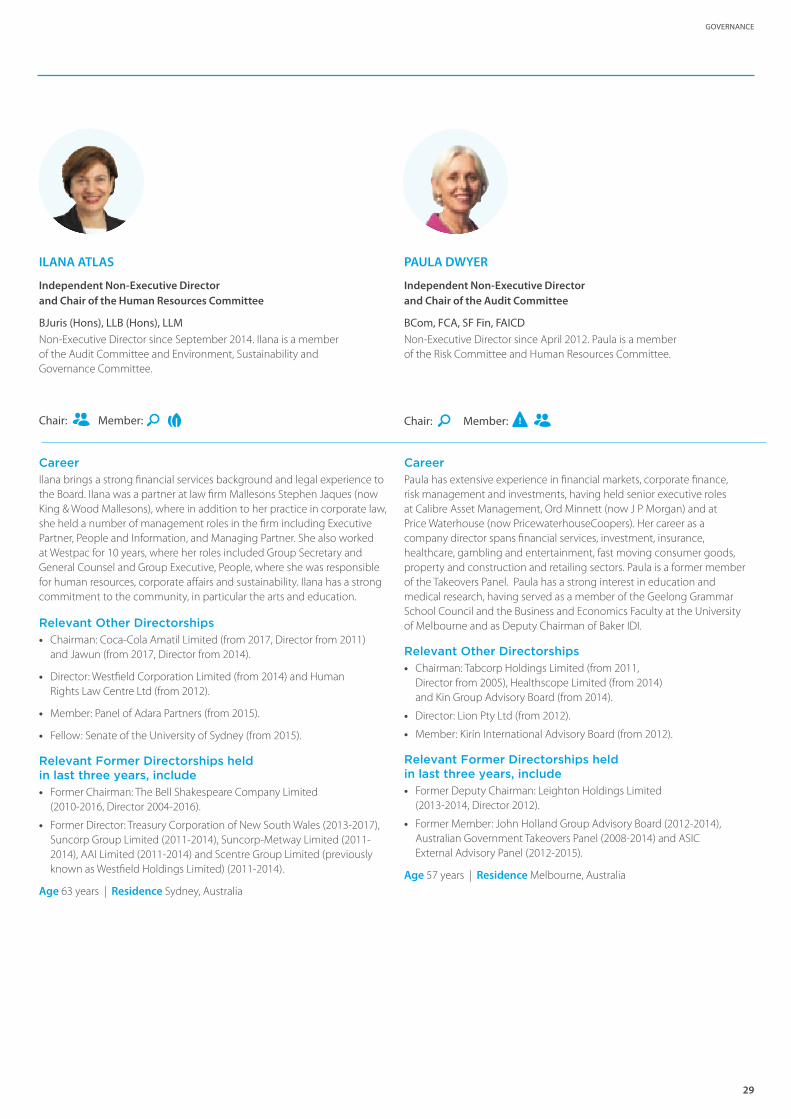
PAULA DWYER
Independent Non-Executive Director and Chair of the Audit Committee
BCom, FCA, SF Fin, FAICD
Non-Executive Director since April 2012. Paula is a member of the Risk Committee and Human Resources Committee.
Career
Ilana brings a strong financial services background and legal experience to the Board. Ilana was a partner at law firm Mallesons Stephen Jaques (now King & Wood Mallesons), where in addition to her practice in corporate law, she held a number of management roles in the firm including Executive Partner, People and Information, and Managing Partner. She also worked at Westpac for 10 years, where her roles included Group Secretary and General Counsel and Group Executive, People, where she was responsible for human resources, corporate affairs and sustainability. Ilana has a strong commitment to the community, in particular the arts and education.
Relevant Other Directorships
• Chairman: Coca-Cola Amatil Limited (from 2017, Director from 2011) and Jawun (from 2017, Director from 2014).
• Director: Westfield Corporation Limited (from 2014) and Human Rights Law Centre Ltd (from 2012).
• Member: Panel of Adara Partners (from 2015).
• Fellow: Senate of the University of Sydney (from 2015).
Relevant Former Directorships held in last three years, include
• Former Chairman: The Bell Shakespeare Company Limited (2010-2016, Director 2004-2016).
• Former Director: Treasury Corporation of New South Wales (2013-2017), Suncorp Group Limited (2011-2014), Suncorp-Metway Limited (2011-2014), AAI Limited (2011-2014) and Scentre Group Limited (previously known as Westfield Holdings Limited) (2011-2014).
Age 63 years | Residence Sydney, Australia
Career
Paula has extensive experience in financial markets, corporate finance, risk management and investments, having held senior executive roles at Calibre Asset Management, Ord Minnett (now J P Morgan) and at Price Waterhouse (now PricewaterhouseCoopers). Her career as a company director spans financial services, investment, insurance, healthcare, gambling and entertainment, fast moving consumer goods, property and construction and retailing sectors. Paula is a former member of the Takeovers Panel. Paula has a strong interest in education and medical research, having served as a member of the Geelong Grammar School Council and the Business and Economics Faculty at the University of Melbourne and as Deputy Chairman of Baker IDI.
Relevant Other Directorships
• Chairman: Tabcorp Holdings Limited (from 2011, Director from 2005), Healthscope Limited (from 2014) and Kin Group Advisory Board (from 2014).
• Director: Lion Pty Ltd (from 2012).
• Member: Kirin International Advisory Board (from 2012).
Relevant Former Directorships held in last three years, include
• Former Deputy Chairman: Leighton Holdings Limited (2013-2014, Director 2012).
• Former Member: John Holland Group Advisory Board (2012-2014), Australian Government Takeovers Panel (2008-2014) and ASIC External Advisory Panel (2012-2015).
Age 57 years | Residence Melbourne, Australia
ILANA ATLAS
Independent Non-Executive Director and Chair of the Human Resources Committee
BJuris (Hons), LLB (Hons), LLM
Non-Executive Director since September 2014. Ilana is a member of the Audit Committee and Environment, Sustainability and Governance Committee.
Chair: Member: Chair: Member:
GOVERNANCE
30
ANZ 2017 ANNUAL REPORT
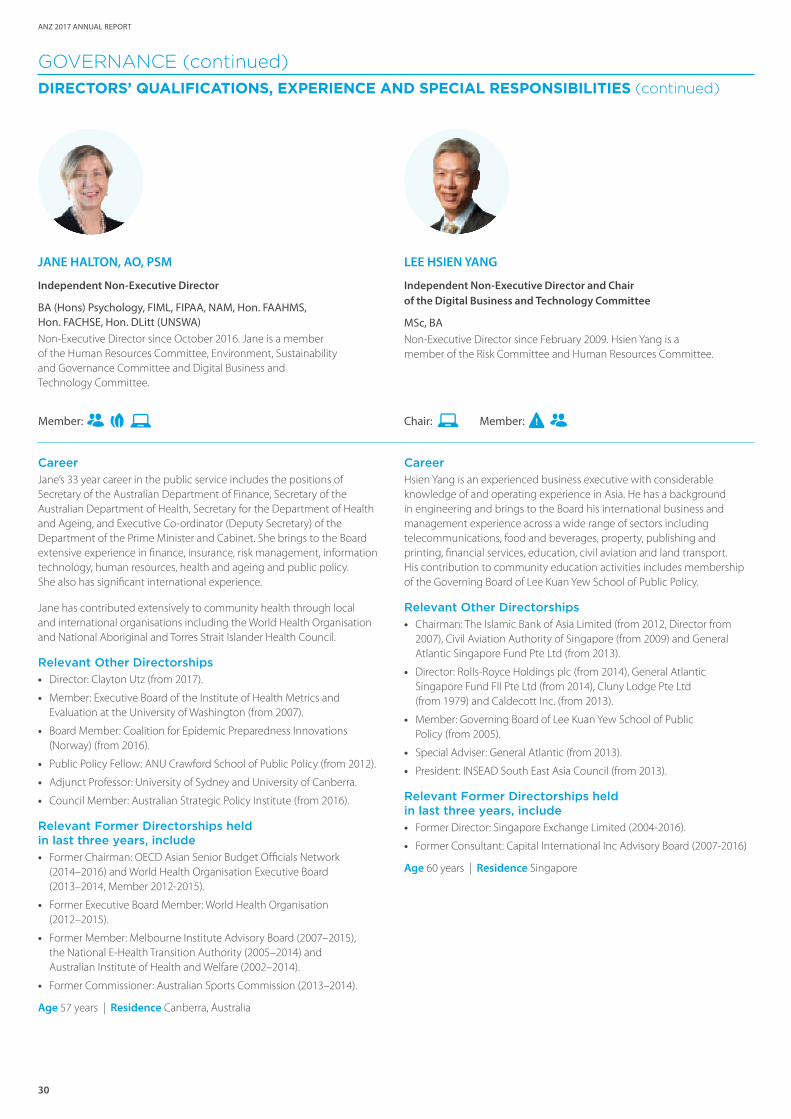
LEE HSIEN YANG
Independent Non-Executive Director and Chair of the Digital Business and Technology Committee
MSc, BANon-Executive Director since February 2009. Hsien Yang is a member of the Risk Committee and Human Resources Committee.
Career
Jane’s 33 year career in the public service includes the positions of Secretary of the Australian Department of Finance, Secretary of the Australian Department of Health, Secretary for the Department of Health and Ageing, and Executive Co-ordinator (Deputy Secretary) of the Department of the Prime Minister and Cabinet. She brings to the Board extensive experience in finance, insurance, risk management, information technology, human resources, health and ageing and public policy. She also has significant international experience.
Jane has contributed extensively to community health through local and international organisations including the World Health Organisation and National Aboriginal and Torres Strait Islander Health Council.
Relevant Other Directorships
• Director: Clayton Utz (from 2017).
• Member: Executive Board of the Institute of Health Metrics and Evaluation at the University of Washington (from 2007).
• Board Member: Coalition for Epidemic Preparedness Innovations (Norway) (from 2016).
• Public Policy Fellow: ANU Crawford School of Public Policy (from 2012).
• Adjunct Professor: University of Sydney and University of Canberra.
• Council Member: Australian Strategic Policy Institute (from 2016).
Relevant Former Directorships held in last three years, include
• Former Chairman: OECD Asian Senior Budget Officials Network (2014–2016) and World Health Organisation Executive Board (2013–2014, Member 2012-2015).
• Former Executive Board Member: World Health Organisation (2012–2015).
• Former Member: Melbourne Institute Advisory Board (2007–2015), the National E-Health Transition Authority (2005–2014) and Australian Institute of Health and Welfare (2002–2014).
• Former Commissioner: Australian Sports Commission (2013–2014).
Age 57 years | Residence Canberra, Australia
Career
Hsien Yang is an experienced business executive with considerable knowledge of and operating experience in Asia. He has a background in engineering and brings to the Board his international business and management experience across a wide range of sectors including telecommunications, food and beverages, property, publishing and printing, financial services, education, civil aviation and land transport. His contribution to community education activities includes membership of the Governing Board of Lee Kuan Yew School of Public Policy.
Relevant Other Directorships
• Chairman: The Islamic Bank of Asia Limited (from 2012, Director from 2007), Civil Aviation Authority of Singapore (from 2009) and General Atlantic Singapore Fund Pte Ltd (from 2013).
• Director: Rolls-Royce Holdings plc (from 2014), General Atlantic Singapore Fund FII Pte Ltd (from 2014), Cluny Lodge Pte Ltd (from 1979) and Caldecott Inc. (from 2013).
• Member: Governing Board of Lee Kuan Yew School of Public Policy (from 2005).
• Special Adviser: General Atlantic (from 2013).
• President: INSEAD South East Asia Council (from 2013).
Relevant Former Directorships held in last three years, include
• Former Director: Singapore Exchange Limited (2004-2016).
• Former Consultant: Capital International Inc Advisory Board (2007-2016)
Age 60 years | Residence Singapore
JANE HALTON, AO, PSM
Independent Non-Executive Director
BA (Hons) Psychology, FIML, FIPAA, NAM, Hon. FAAHMS, Hon. FACHSE, Hon. DLitt (UNSWA)Non-Executive Director since October 2016. Jane is a member of the Human Resources Committee, Environment, Sustainability and Governance Committee and Digital Business and Technology Committee.
Chair: Member:
GOVERNANCE (continued)
DIRECTORS’ QUALIFICATIONS, EXPERIENCE AND SPECIAL RESPONSIBILITIES (continued)
Member:
31
GOVERNANCE
JOHN MACFARLANE
Independent Non-Executive Director
BCom, MCom (Hons)
Non-Executive Director since May 2014. John is a member of the Audit Committee, Risk Committee and Digital Business and Technology Committee.
Career
Graeme brings to the Board his experience of a 23 year executive career with Orica Limited (including a period as Chief Executive Officer), a global mining services company with operations in more than 50 countries. He has extensive international experience and a strong record of achievement as a senior executive including in strategy development and implementation.
Graeme is committed to global trade and co-operation, as well as community education.
Relevant Other Directorships
• Chairman: Amcor Limited (from 2013, Director from 2012).
• Director: Australian Foundation Investment Company Limited (from 2012), Carey Baptist Grammar School (from 2012) and DuluxGroup Limited (from 2016).
Relevant Former Directorships held in last three years, include
• Former Deputy Chairman: Melbourne Business School (2012-2015, Director from 2008).
• Former Chairman: The Global Foundation (2014-2015, Director from 2006).
Age 63 years | Residence Melbourne, Australia
Career
John is one of Australia’s most experienced international bankers having previously served as Executive Chairman of Deutsche Bank Australia and New Zealand, and CEO of Deutsche Bank Australia. John has also worked in the USA, Japan and PNG, and brings to the Board a depth of banking experience in ANZ’s key markets in Australia, New Zealand and the Asia Pacific.
He is committed to community health, and is a Director of St Vincent’s Institute of Medical Research (from 2008) and the Aikenhead Centre of Medical Discovery Limited (from 2016).
Relevant Other Directorships
• Director: Craigs Investment Partners Limited (from 2013), Colmac Group Pty Ltd (from 2014) and AGInvest Holdings Limited (MyFarm Limited) (from 2014, Chairman 2014-2016).
Relevant Former Directorships held in last three years, include
• Former Executive Chairman: Deutsche Bank AG, Australia and New Zealand (2007-2014) and Chief Country Officer, Australia (2011-2014).
• Former Director: Deutsche Australia Limited (2007-2014) and Deutsche Securities Australia Limited (2011-2014).
• Former Chief Executive Officer: Deutsche Australia Limited (2011-2014).
Age 57 years | Residence Melbourne, Australia
GRAEME LIEBELT
Independent Non-Executive Director and Chair of the Risk Committee
BEc (Hons), FAICD, FTSE, FIML
Non-Executive Director since July 2013. Graeme is a member of the Audit Committee and Human Resources Committee.
Chair: Member: Member:

Currently there are three people appointed as Company Secretaries of the Company. Details of their roles are contained in the Corporate Governance Statement. Their qualifications and experience are as follows:
BOB SANTAMARIA
Group General Counsel
BCom, LLB (Hons)
Bob joined ANZ in 2007. He had previously been a Partner at the law firm Allens Arthur Robinson (now Allens) since 1987. He was Executive Partner Corporate, responsible for client liaison with some of Allens Arthur Robinson’s largest corporate clients. Bob brings to ANZ a strong background in leadership of a major law firm, together with significant experience in securities, mergers and acquisitions. He holds a Bachelor of Commerce and Bachelor of Laws (Honours) from the University of Melbourne.
SIMON PORDAGE
Company Secretary
LLB (Hons), FGIA, FCIS
Simon joined ANZ in May 2016. He is a Chartered Secretary and has extensive company secretarial and corporate governance experience. From 2009 to 2016 he was Company Secretary for Australian Foundation Investment Company Limited and a number of other listed investment companies. Other former roles include being Deputy Company Secretary for ANZ and Head of Board Support for Barclays PLC in the United Kingdom.
Simon is committed to the promotion of good corporate governance. He is a former National President and Chairman of Governance Institute of Australia, and is a member and former Chairman of its National Legislation Review Committee, and regularly presents on governance issues.
JOHN PRIESTLEY
Senior Legal Advisor
BEc, LLB, FGIA, FCIS
John, a qualified lawyer, joined ANZ in 2004. Prior to joining ANZ, he had a long career with Mayne Group and held positions which included responsibility for the legal, company secretarial, compliance and insurance functions. He is a Fellow of the Governance Institute of Australia and also a member of the Governance Institute of Australia’s National Legislation Review Committee. John was responsible for the day to day operation of ANZ’s Company Secretariat function from 2004 to July 2016 when Simon Pordage took over that responsibility. He is currently a member of ANZ’s Group Legal team.
GOVERNANCE (continued)
COMPANY SECRETARIES’ QUALIFICATIONS AND EXPERIENCE
ANZ 2017 ANNUAL REPORT
32

GOVERNANCE
EXECUTIVE COMMITTEE
From left to right: Shayne Elliott – Chief Executive Officer, Maile Carnegie – Group Executive Digital Banking, Graham Hodges – Deputy Chief Executive Officer, Farhan Faruqui – Group Executive, International, Alexis George – Group Executive Wealth, Nigel Williams – Chief Risk Officer, Michelle Jablko – Chief Financial Officer, Fred Ohlsson – Group Executive, Australia, Mark Whelan – Group Executive, Institutional, Kathryn van der Merwe – Group Executive Talent and Culture, Gerard Florian – Group Executive Technology, David Hisco – CEO New Zealand and Group Executive, Asia Wealth, Pacific and International Retail.
Full biography details can be found on our website: shareholder.anz.com/our-company/executive-committee.
33
34
ANZ 2017 ANNUAL REPORT
The material risks facing the group per the Group’s RMS, and how these risks are managed are summarised below:
Key Material Risks
Risk Type Description Management of Risks
Capital Adequacy Risk
The risk of loss arising from the Group failing to maintain the level of capital required by prudential regulators and other key stakeholders (shareholders, debt investors, depositors, rating agencies, etc.) to support ANZ’s consolidated operations and risk appetite.
The Group pursues an active approach to Capital Management through ongoing review, and Board approval, of the level and composition of the Group’s capital base against key policy objectives.
Compliance Risk
The probability and impact of an event that results in a breach of any of the following that apply to the Group’s businesses: laws, regulations, industry standards, codes, internal policies, internal procedures, or principles of good governance.
Key features of our Compliance Risk framework include centralised management of key obligations, and emphasis on identifying changes in regulations and the business environment, so as to enable us to:
• proactively assess emerging compliance risks; and
• implement robust reporting and certification processes.
Credit Risk
The risk of financial loss resulting from:
• a counterparty failing to fulfill its obligations; or
• a decrease in credit quality of a counterparty resulting in a financial loss.
Credit Risk incorporates the risks associated with us lending to customers who could be impacted by climate change or by changes to laws, regulations, or other policies adopted by governments or regulatory authorities, including carbon pricing and climate change adaptation or mitigation policies.
Our Credit Risk framework is top down, being defined by credit principles and policies. Credit policies, requirements and procedures cover all aspects of the credit life cycle — for example: transaction structuring, risk grading, initial approval, ongoing management and problem debt management, as well as specialist policy topics.
The success of the Group’s strategy is underpinned by our sound management of the Group’s risks. All of the Group’s activities involve — to varying degrees — the analysis, evaluation, acceptance and management of risks or combinations of risks.
The Board is responsible for establishing and overseeing the Group’s risk management framework. The Board has delegated authority to the Board Risk Committee (BRC) to develop and monitor compliance with the Group’s risk management policies. The Committee reports regularly to the Board on its activities.
The key pillars of the Group’s risk management framework include:
• The Risk Appetite Statement (RAS), which clearly and concisely sets out the Board’s expectations regarding the degree of risk that the Group is prepared to accept in pursuing its strategic objectives and its business plan; and
• The Risk Management Statement (RMS), which describes the Group’s strategy for managing risks and a summary of the key elements of the Risk Management Framework (RMF) that give effect to that strategy. The RMS includes: a description of each material risk and an overview of how the RMF addresses each risk, with reference to the relevant policies, standards and procedures. It also includes information on how the Group identifies, measures, evaluates, monitors, reports and then either controls or mitigates material risks.
OUR APPROACH TO RISK MANAGEMENT

35
OUR APPROACH TO RISK MANAGEMENT
Risk Type Description Management of Risks
Insurance Risk
The risk of unexpected losses resulting from worse than expected claims experience, including any of the following that expose an insurer to financial loss: inadequate or inappropriate underwriting, claims management, reserving, insurance concentrations, reinsurance management, product design and pricing.
We manage Insurance Risk primarily by:
• product design to price all applicable risks into contracts;
• reinsurance to reduce liability for large individual risks;
• underwriting to price, or reserve, for the level of risk associated with an individual contract;
• claims management to admit and pay only genuine claims;
• insurance experience reviews to update assumptions; and
• portfolio management to maintain a diversity of individual risks.
Liquidity and Funding Risk
The risk that the Group is unable to meet its payment obligations as they fall due, including:
• repaying depositors or maturing wholesale debt; or
• the Group having insufficient capacity to fund increases in assets.
Key principles in managing our Liquidity and Funding Risk include:
• maintaining the Group’s ability to meet liquidity ‘survival horizons’ under a range of stress scenarios to meet cash flow obligations over a short to medium term horizon;
• maintaining a strong structural funding profile; and
• maintaining a portfolio of high-quality liquid assets to act as a source of liquidity in times of stress.
Market Risk
The risk to the Group’s earnings arising from:
• changes in any interest rates, foreign exchange rates, credit spreads, volatility, and correlations; or
• from fluctuations in bond, commodity or equity prices.
Our risk management and control framework for Market Risk involves us quantifying the magnitude of market risk within the trading and balance sheet portfolios through independent risk measurement. First, we identify the range of possible outcomes, the likely timeframe, and the likelihood of the outcome occurring. Then we allocate an appropriate amount of capital to support these activities.
Operational Risk
The risk of loss resulting from inadequate or failed internal processes, people and systems, or from external events. Operational Risk:
• includes technology risk, cyber risk, legal risk and conduct risk, and damage arising from inadequate or failed internal processes, people and systems; but
• excludes Strategic Risk.
The Group operates a three-lines-of-defence model to manage Operational Risk, with each line of defence having defined roles, responsibilities and escalation paths to support effective two-way communication and effective management of our operational risk. Also, we have ongoing review mechanisms to ensure our Operational Risk framework continues to meet organisational needs and regulatory requirements.
Reinsurance Risk
The risk that a reinsurer fails to meet its contractual obligations, that is, to pay us reinsurance claims when due, which in turn creates a counterparty credit.
We manage Reinsurance Risk by:
• measuring our counterparties’ probability of default, and
• then restricting our counterparty exposures on the basis of financial strength and concentration.
Reputation Risk
The risk of loss that directly or indirectly impacts earnings, capital adequacy or value, that is caused by:
• adverse perceptions of the Group held by any of customers, the community, shareholders, investors, regulators, or rating agencies;
• conduct risk associated with the Group’s employees or contractors (or both); or
• the social or environmental (or both) impacts of our lending decisions.
We manage Reputation Risk by maintaining a positive and dynamic culture that:
• ensures we act with integrity; and
• enables us to build strong and trusted relationships with customers and clients, with colleagues, and with the broader society.
We have well established decision-making frameworks and policies to ensure our business decisions are guided by sound social and environmental standards that take into account Reputation Risk.
Strategic Risk
The risk that the Group’s business strategy and strategic objectives may lead to an increase in other key Material Risks — for example: Credit Risk, Market Risk and Operational Risk.
We consider and manage Strategic Risks through our annual strategic planning process, managed by the Executive Committee and approved by the Board. Any increase to our key Material Risks is managed in accordance with the risk management practices specified above.

Dear Shareholder,
2017 Remuneration Report (audited)
I am pleased to present our Remuneration Report for the year ending 30 September 2017.
2017 Outcomes — Strong link between performance and remuneration outcomes
The Board assesses the performance of the Group, the Chief Executive Officer (CEO) and each Disclosed Executive at the end of each year. The assessments include a review of performance against annual targets and progress towards achieving longer term strategic goals.
In 2017 ANZ produced good results for shareholders, customers and the communities in which we operate. Cash profit increased by 18% and good progress was made towards becoming a better balanced, better capitalised and more efficient bank. ANZ has maintained a strong cost management discipline, achieved sound risk management and compliance outcomes, improved capital efficiency and credit quality, and rebalanced the business portfolio to improve capital allocation and returns. While performance was good, it is recognised that there is more to do to rebuild community trust and improve the customer experience.
Taking into consideration Group, business and individual performance, the Board determines remuneration outcomes for the Chief Executive Officer and Disclosed Executives. In relation to variable remuneration at risk, we set stretching yet achievable objectives and targets for each executive. When executives deliver on target performance at a Group and individual level (taking into consideration ANZ Values and risk/compliance standards), then variable remuneration awards are likely to be around the target.
• For 2017, variable remuneration outcomes averaged 96% of target overall (64% of maximum opportunity), with significant differentiation at an individual level (ranging from 76% to 136% of target).
• The performance rights awarded in November 2013 were tested in November 2016, but as the relative Total Shareholder Return performance hurdles were not met these performance rights lapsed and executives received no value from this award.
Changes to this year’s Remuneration Report
We have consolidated and simplified this year’s Remuneration Report to help readers understand our remuneration framework and how we determine remuneration outcomes based on performance.
We’ve included a new overview section: 'Remuneration at a glance' on page 38, the weighting of the different elements in the Group performance outcomes section, and two new tables which detail 1) the variable remuneration awarded; and 2) the remuneration actually received by the CEO and current Disclosed Executives during the 2017 performance year.
In 2018 we are reviewing our reward framework to ensure it continues to support ANZ’s strategic direction, culture and new ways of working. The review will also take into consideration the new Banking Executive Accountability Regime.
On behalf of the Board, I invite you to read our refreshed Remuneration Report which will be presented to shareholders for adoption at the 2017 Annual General Meeting.
Ilana Atlas Chair — Human Resources Committee
REMUNERATION REPORT
1. Who is Covered by this Report 37
2. Remuneration at a Glance 38
3. Composition of Executive Remuneration 39
4. Application of our Remuneration Principles 44
5. 2017 Outcomes 44
6. Non-Executive Director Remuneration 52
7. Remuneration Governance 53
8. Other Information 55
CONTENTS
ANZ 2017 ANNUAL REPORT
36
37
REMUNERATION REPORT
1. WHO IS COVERED BY THIS REPORT
The Key Management Personnel (KMP) whose remuneration is disclosed in this year’s report are:
Non-Executive Directors (NEDs) — Current
D Gonski Chairman
I Atlas Director
P Dwyer Director
J Halton Director — appointed 21 October 2016
H Lee Director
G Liebelt Director
J Macfarlane Director
Non-Executive Directors (NEDs) — Former
I Macfarlane Director — retired 16 December 2016
Chief Executive Officer (CEO) and Disclosed Executives — Current
S Elliott Chief Executive Officer and Executive Director
M Carnegie Group Executive, Digital Banking
A George Group Executive, Wealth Australia — appointed 1 December 2016
D Hisco Group Executive and Chief Executive Officer, New Zealand
G Hodges Deputy Chief Executive Officer
M Jablko Chief Financial Officer
F Ohlsson Group Executive, Australia
M Whelan Group Executive, Institutional
N Williams Chief Risk Officer
Disclosed Executives — Former
A Currie Former Chief Operating Officer — concluded in role 31 October 2016, ceased employment 1 July 2017
The Remuneration Report for the Group outlines our remuneration strategy and framework and the remuneration practices that apply to KMP.
This report has been prepared, and audited, as required by the Corporations Act 2001. It forms part of the Directors’ Report.
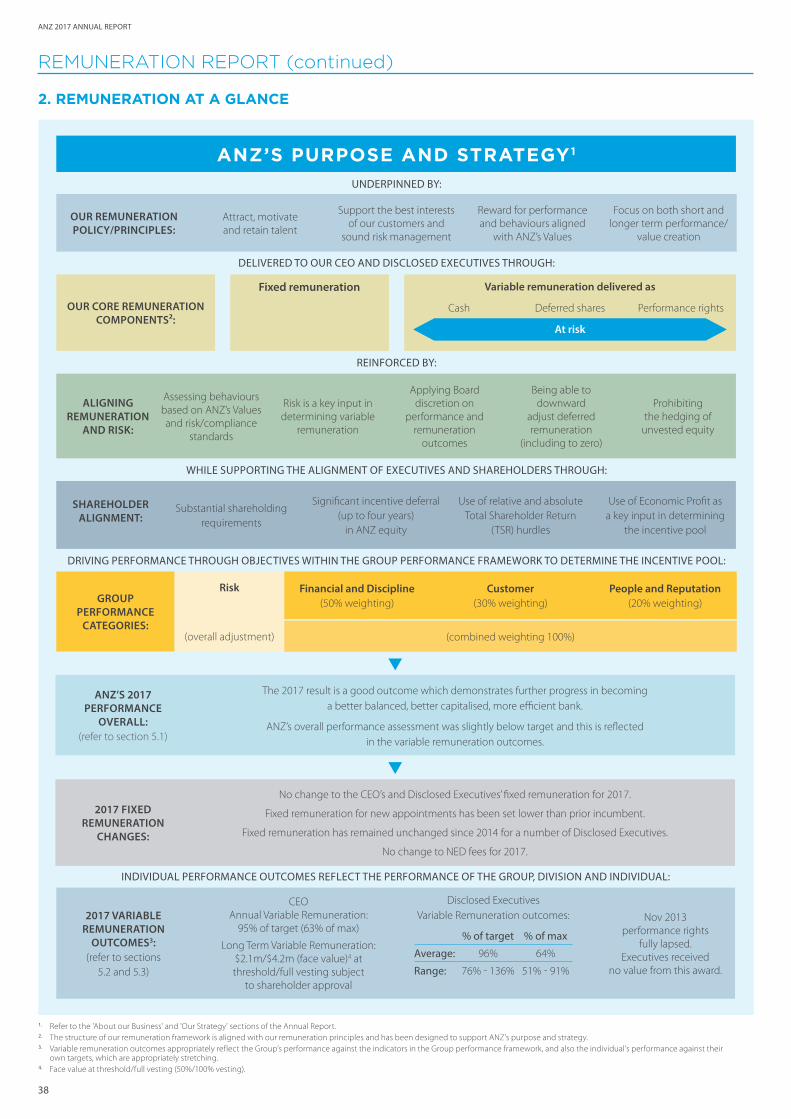
ANZ 2017 ANNUAL REPORT
38
2. REMUNERATION AT A GLANCE
1. Refer to the 'About our Business' and 'Our Strategy' sections of the Annual Report.2. The structure of our remuneration framework is aligned with our remuneration principles and has been designed to support ANZ’s purpose and strategy.3. Variable remuneration outcomes appropriately reflect the Group’s performance against the indicators in the Group performance framework, and also the individual’s performance against their
own targets, which are appropriately stretching.4. Face value at threshold/full vesting (50%/100% vesting).
ANZ’S PURPOSE AND STRATEGY1
OUR REMUNERATION POLICY/PRINCIPLES:
Attract, motivate and retain talent
Support the best interests of our customers and
sound risk management
Reward for performance and behaviours aligned
with ANZ’s Values
Focus on both short and longer term performance/
value creation
REINFORCED BY:
WHILE SUPPORTING THE ALIGNMENT OF EXECUTIVES AND SHAREHOLDERS THROUGH:
INDIVIDUAL PERFORMANCE OUTCOMES REFLECT THE PERFORMANCE OF THE GROUP, DIVISION AND INDIVIDUAL:
DRIVING PERFORMANCE THROUGH OBJECTIVES WITHIN THE GROUP PERFORMANCE FRAMEWORK TO DETERMINE THE INCENTIVE POOL:
DELIVERED TO OUR CEO AND DISCLOSED EXECUTIVES THROUGH:
UNDERPINNED BY:
ANZ’S 2017 PERFORMANCE
OVERALL: (refer to section 5.1)
The 2017 result is a good outcome which demonstrates further progress in becoming a better balanced, better capitalised, more efficient bank.
ANZ’s overall performance assessment was slightly below target and this is reflected in the variable remuneration outcomes.
2017 FIXED REMUNERATION
CHANGES:
No change to the CEO’s and Disclosed Executives’ fixed remuneration for 2017.
Fixed remuneration for new appointments has been set lower than prior incumbent.
Fixed remuneration has remained unchanged since 2014 for a number of Disclosed Executives.
No change to NED fees for 2017.
OUR CORE REMUNERATION COMPONENTS2:
Cash Deferred shares Performance rights
Variable remuneration delivered asFixed remuneration
At risk
(combined weighting 100%)
GROUP PERFORMANCE
CATEGORIES:
Financial and Discipline (50% weighting)
Customer (30% weighting)
People and Reputation (20% weighting)
Risk
(overall adjustment)
ALIGNING REMUNERATION
AND RISK:
Assessing behaviours based on ANZ’s Values and risk/compliance
standards
Risk is a key input in determining variable
remuneration
Applying Board discretion on
performance and remuneration
outcomes
Being able to downward
adjust deferred remuneration
(including to zero)
Prohibiting the hedging of
unvested equity
Substantial shareholding requirements
Significant incentive deferral (up to four years)
in ANZ equity
Use of relative and absolute Total Shareholder Return
(TSR) hurdles
Use of Economic Profit as a key input in determining
the incentive pool
SHAREHOLDER ALIGNMENT:
2017 VARIABLE REMUNERATION
OUTCOMES3: (refer to sections
5.2 and 5.3)
CEO Annual Variable Remuneration:
95% of target (63% of max)
Long Term Variable Remuneration: $2.1m/$4.2m (face value)4 at threshold/full vesting subject
to shareholder approval
Disclosed ExecutivesVariable Remuneration outcomes:
% of target % of max
Average: 96% 64%
Range: 76% - 136% 51% - 91%
Nov 2013 performance rights
fully lapsed. Executives received
no value from this award.
REMUNERATION REPORT (continued)
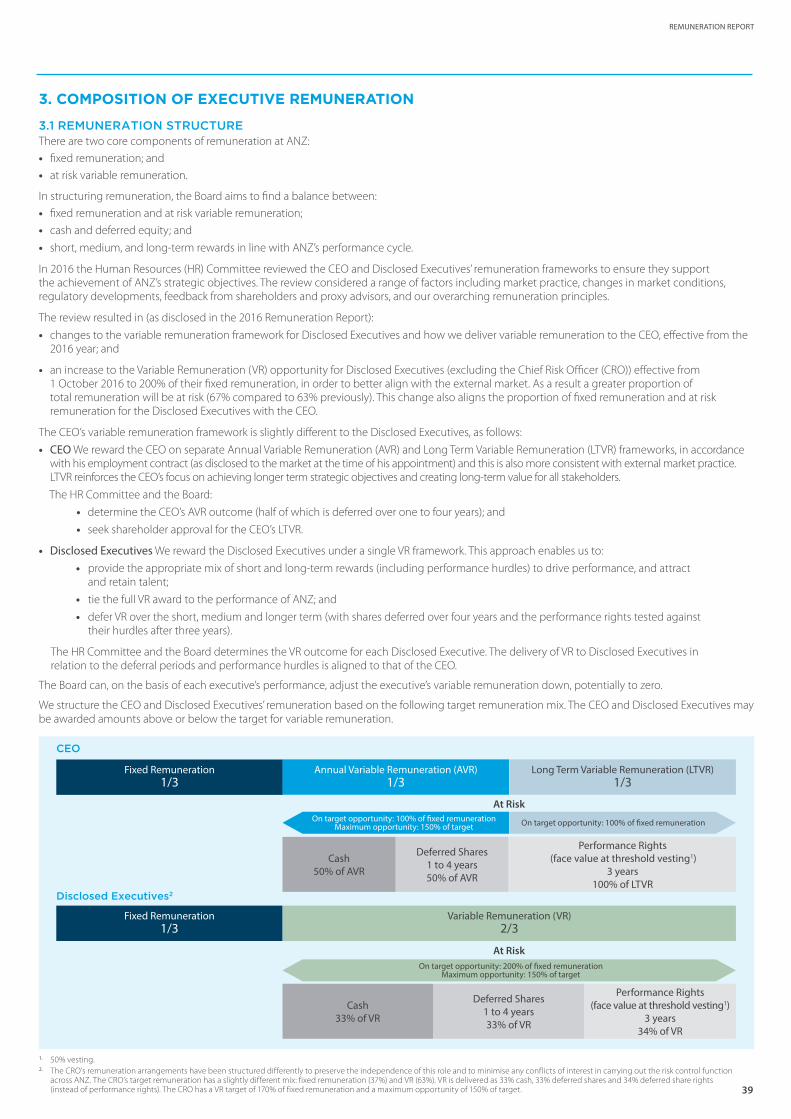
39
REMUNERATION REPORT
3. COMPOSITION OF EXECUTIVE REMUNERATION
3.1 REMUNERATION STRUCTUREThere are two core components of remuneration at ANZ:
• fixed remuneration; and
• at risk variable remuneration.
In structuring remuneration, the Board aims to find a balance between:
• fixed remuneration and at risk variable remuneration;
• cash and deferred equity; and
• short, medium, and long-term rewards in line with ANZ’s performance cycle.
In 2016 the Human Resources (HR) Committee reviewed the CEO and Disclosed Executives’ remuneration frameworks to ensure they support the achievement of ANZ’s strategic objectives. The review considered a range of factors including market practice, changes in market conditions, regulatory developments, feedback from shareholders and proxy advisors, and our overarching remuneration principles.
The review resulted in (as disclosed in the 2016 Remuneration Report):
• changes to the variable remuneration framework for Disclosed Executives and how we deliver variable remuneration to the CEO, effective from the 2016 year; and
• an increase to the Variable Remuneration (VR) opportunity for Disclosed Executives (excluding the Chief Risk Officer (CRO)) effective from 1 October 2016 to 200% of their fixed remuneration, in order to better align with the external market. As a result a greater proportion of total remuneration will be at risk (67% compared to 63% previously). This change also aligns the proportion of fixed remuneration and at risk remuneration for the Disclosed Executives with the CEO.
The CEO’s variable remuneration framework is slightly different to the Disclosed Executives, as follows:
• CEO We reward the CEO on separate Annual Variable Remuneration (AVR) and Long Term Variable Remuneration (LTVR) frameworks, in accordance with his employment contract (as disclosed to the market at the time of his appointment) and this is also more consistent with external market practice. LTVR reinforces the CEO’s focus on achieving longer term strategic objectives and creating long-term value for all stakeholders.
The HR Committee and the Board:
• determine the CEO’s AVR outcome (half of which is deferred over one to four years); and
• seek shareholder approval for the CEO’s LTVR.
• Disclosed Executives We reward the Disclosed Executives under a single VR framework. This approach enables us to:
• provide the appropriate mix of short and long-term rewards (including performance hurdles) to drive performance, and attract and retain talent;
• tie the full VR award to the performance of ANZ; and
• defer VR over the short, medium and longer term (with shares deferred over four years and the performance rights tested against their hurdles after three years).
The HR Committee and the Board determines the VR outcome for each Disclosed Executive. The delivery of VR to Disclosed Executives in relation to the deferral periods and performance hurdles is aligned to that of the CEO.
The Board can, on the basis of each executive’s performance, adjust the executive’s variable remuneration down, potentially to zero.
We structure the CEO and Disclosed Executives’ remuneration based on the following target remuneration mix. The CEO and Disclosed Executives may be awarded amounts above or below the target for variable remuneration.
1. 50% vesting.2. The CRO’s remuneration arrangements have been structured differently to preserve the independence of this role and to minimise any conflicts of interest in carrying out the risk control function
across ANZ. The CRO’s target remuneration has a slightly different mix: fixed remuneration (37%) and VR (63%). VR is delivered as 33% cash, 33% deferred shares and 34% deferred share rights (instead of performance rights). The CRO has a VR target of 170% of fixed remuneration and a maximum opportunity of 150% of target.
Deferred Shares 1 to 4 years 50% of AVR
Cash 50% of AVR
Performance Rights (face value at threshold vesting1)
3 years 100% of LTVR
Deferred Shares 1 to 4 years 33% of VR
Cash 33% of VR
Performance Rights (face value at threshold vesting1)
3 years 34% of VR
Fixed Remuneration1/3
Annual Variable Remuneration (AVR)1/3
Long Term Variable Remuneration (LTVR)1/3
Fixed Remuneration1/3
Variable Remuneration (VR)2/3
Disclosed Executives2
At RiskOn target opportunity: 100% of fixed remuneration
Maximum opportunity: 150% of target On target opportunity: 100% of fixed remuneration
At RiskOn target opportunity: 200% of fixed remuneration
Maximum opportunity: 150% of target
CEO

ANZ 2017 ANNUAL REPORT
40
3. COMPOSITION OF EXECUTIVE REMUNERATION (continued)
By deferring a significant portion of an executive’s remuneration, we ensure that their variable remuneration:
• is linked to performance;
• has significant retention elements;
• aligns their interests with shareholders’ to deliver against strategic objectives; and
• can be adjusted downwards including to zero (if appropriate).
3.2 FIXED REMUNERATION
We express fixed remuneration as a total dollar amount which is delivered as cash salary and superannuation contributions. The Board sets (and reviews annually) the CEO’s and Disclosed Executives’ fixed remuneration based on financial services market relativities reflecting their responsibilities, performance, qualifications, experience and location. In addition, for new appointments we have looked to set fixed remuneration lower than that of the prior incumbent (following the trend established with the CEO appointment).
3.3 VARIABLE REMUNERATION
The ANZ Incentive Plan (ANZIP) is our main variable remuneration plan covering the majority of employees, including the CEO and Disclosed Executives.
ANZIP pool sizing and allocation process
ANZIP pool determined based on performance and affordability
Board approval of ANZIP pool Business and individual
allocation of pool
3.3.1 HOW DO WE DETERMINE THE VARIABLE REMUNERATION POOL AT A GROUP LEVEL?
ANZIP incentive pool based on performance
As managing risk appropriately is fundamental to the way ANZ operates, it is a key element in how we measure and assess performance at a Group, Division and individual level. The size of the overall incentive pool is determined considering Economic Profit performance (a risk adjusted financial measure) and also our performance against the Group performance categories (Risk, Financial and Discipline, Customer, and People and Reputation).
ANZ uses a Group performance framework approach to measure the overall performance of the Group in relation to the ANZIP. The Group performance framework is designed around three key inputs:
• Creating a safe bank with sound risk practices;
• Achieving our agreed annual and longer term goals; and
• Realising our strategic vision.
This approach provides indicators under the categories of:
• Risk — separate measure which can adjust the overall performance assessment;
• Financial and Discipline (50% weighting);
• Customer (30% weighting); and
• People and Reputation (20% weighting).
The indicators within each category encourage our people to be focused on both annual priorities and on broader long-term strategies to deliver shareholder value.
The performance indicators are designed to be stretching yet achievable: they are approved by the Board and are set considering prior year performance, industry standards and ANZ’s strategic objectives. Many of our indicators also focus on targets which are set for the current year in context of progress towards longer term goals. As the specific targets and features relating to all these indicators are commercially sensitive, we have not provided them in detail.
REMUNERATION REPORT (continued)
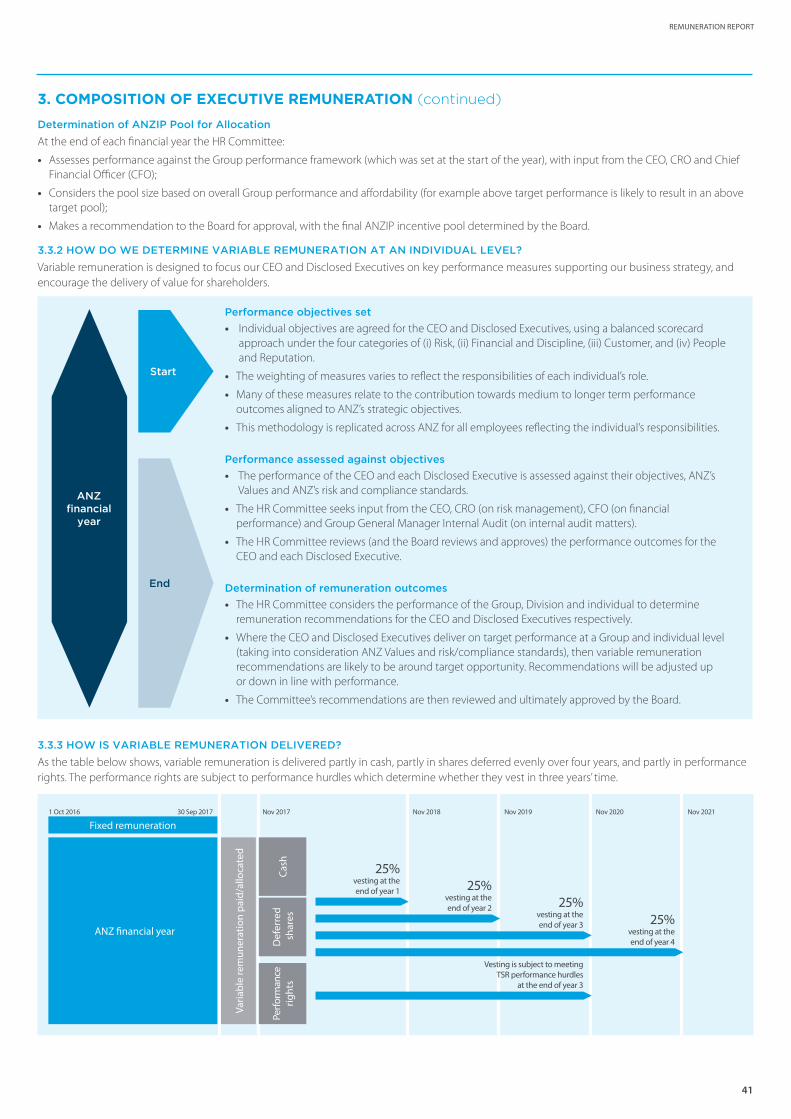
41
REMUNERATION REPORT
3. COMPOSITION OF EXECUTIVE REMUNERATION (continued)
Determination of ANZIP Pool for Allocation
At the end of each financial year the HR Committee:
• Assesses performance against the Group performance framework (which was set at the start of the year), with input from the CEO, CRO and Chief Financial Officer (CFO);
• Considers the pool size based on overall Group performance and affordability (for example above target performance is likely to result in an above target pool);
• Makes a recommendation to the Board for approval, with the final ANZIP incentive pool determined by the Board.
3.3.2 HOW DO WE DETERMINE VARIABLE REMUNERATION AT AN INDIVIDUAL LEVEL?
Variable remuneration is designed to focus our CEO and Disclosed Executives on key performance measures supporting our business strategy, and encourage the delivery of value for shareholders.
Performance objectives set
• Individual objectives are agreed for the CEO and Disclosed Executives, using a balanced scorecard approach under the four categories of (i) Risk, (ii) Financial and Discipline, (iii) Customer, and (iv) People and Reputation.
• The weighting of measures varies to reflect the responsibilities of each individual’s role.
• Many of these measures relate to the contribution towards medium to longer term performance outcomes aligned to ANZ’s strategic objectives.
• This methodology is replicated across ANZ for all employees reflecting the individual’s responsibilities.
Performance assessed against objectives
• The performance of the CEO and each Disclosed Executive is assessed against their objectives, ANZ’s Values and ANZ’s risk and compliance standards.
• The HR Committee seeks input from the CEO, CRO (on risk management), CFO (on financial performance) and Group General Manager Internal Audit (on internal audit matters).
• The HR Committee reviews (and the Board reviews and approves) the performance outcomes for the CEO and each Disclosed Executive.
Determination of remuneration outcomes
• The HR Committee considers the performance of the Group, Division and individual to determine remuneration recommendations for the CEO and Disclosed Executives respectively.
• Where the CEO and Disclosed Executives deliver on target performance at a Group and individual level (taking into consideration ANZ Values and risk/compliance standards), then variable remuneration recommendations are likely to be around target opportunity. Recommendations will be adjusted up or down in line with performance.
• The Committee’s recommendations are then reviewed and ultimately approved by the Board.
Start
ANZ financial
year
End
3.3.3 HOW IS VARIABLE REMUNERATION DELIVERED?
As the table below shows, variable remuneration is delivered partly in cash, partly in shares deferred evenly over four years, and partly in performance rights. The performance rights are subject to performance hurdles which determine whether they vest in three years’ time.
Cash
Def
erre
d s
hare
sPe
rform
ance
rig
hts
Varia
ble
rem
uner
atio
n pa
id/a
lloca
ted
Fixed remuneration
ANZ financial year
1 Oct 2016 Nov 2018
25% vesting at the end of year 1 25%
vesting at the end of year 2 25%
vesting at the end of year 3 25%
vesting at the end of year 4
Vesting is subject to meeting TSR performance hurdles
at the end of year 3
30 Sep 2017 Nov 2019Nov 2017 Nov 2020 Nov 2021
ANZ 2017 ANNUAL REPORT
42
3. COMPOSITION OF EXECUTIVE REMUNERATION (continued)
Cash
The cash component is paid to executives at the end of the annual Performance and Remuneration Review (usually in late November).
Deferred shares
Deferred shares are ordinary shares and are deferred evenly over one to four years. By deferring part of an executives’ remuneration over time (and it remaining subject to downward adjustment), we enable a substantial amount of their remuneration to be directly linked to delivering long-term shareholder value. We grant deferred shares in respect of the 1 October to 30 September performance period in late November each year.
We calculate the number of deferred shares to be granted based on the Volume Weighted Average Price (VWAP) of the shares traded on the ASX in the week leading up to and including the date of grant. For disclosure and expensing purposes, we use the one day VWAP to determine the fair value.
In some cases (generally due to regulatory/tax reasons), we may grant deferred share rights to executives instead of deferred shares. Each deferred share right entitles the holder to one ordinary share.
Performance rights — CEO (LTVR) and Disclosed Executives (VR) excluding the CRO1
What is a performance right?
A performance right is a right to acquire one ordinary ANZ share at nil cost — as long as time and performance hurdles are met.
The future value of performance rights may range from zero to an indeterminate value depending on performance against the hurdles and the share price at the time of exercise.
What is the performance period?
Performance rights have a three year performance period. For the 2017 grant (to be granted in November/December 2017), the performance period is from 22 November 2017 to 21 November 2020.
We use a three year performance period as it: aligns to our business planning cycle, provides sufficient time for longer term performance to be reflected, while balancing a reasonable timeframe for executives to find the award meaningful and motivating.
What are the performance hurdles and why?
We will apply two Total Shareholder Return (TSR) performance hurdles for the 2017 grants of performance rights (as we did in 2016):
• 75% will be measured against a relative TSR hurdle (tranche 1);
• 25% will be measured against an absolute TSR hurdle (tranche 2).
TSR represents the change in value of a share plus the value of reinvested dividends paid. We regard it as the most appropriate long-term measure as it focuses on the delivery of shareholder value and is a well understood and tested mechanism to measure performance.
The combination of relative and absolute TSR hurdles provides balance to the plan by:
• Relative: rewarding executives for performance that exceeds that of peer companies; and
• Absolute: ensuring there is a continued focus on providing positive growth — even when the market is declining.
The two hurdles measure separate aspects of performance:
• the relative TSR hurdle measures our TSR compared to that of the Select Financial Services comparator group, comprising of core local and global competitors. This comparator group is chosen to broadly reflect the geographies and business segments in which ANZ competes for revenue; and
• the absolute Compound Annual Growth Rate (CAGR) TSR hurdle provides executives with a more direct line of sight to the level of shareholder return to be achieved. It also provides a tighter correlation between the executives’ rewards and the shareholders’ financial outcomes.
We will measure ANZ’s TSR against each hurdle at the end of the three year performance period to determine whether each tranche of performance rights become exercisable. We measure each tranche independently from the other, so one tranche may vest fully or partially but another tranche may not vest.
REMUNERATION REPORT (continued)
43
REMUNERATION REPORT
3. COMPOSITION OF EXECUTIVE REMUNERATION (continued)
Performance rights — CEO (LTVR) and Disclosed Executives (VR) excluding the CRO1
What is the relative TSR performance hurdle?
(Also refer to ANZ TSR performance in section 5.1 and hurdle outcomes in section 5.3)
Relative TSR is an external hurdle that measures our TSR against that of the Select Financial Services comparator group over three years.
The Select Financial Services comparator group is made up of: Bank of Queensland Limited; Bendigo and Adelaide Bank Limited; Commonwealth Bank of Australia Limited; DBS Bank Limited; Macquarie Group Limited; National Australia Bank Limited; Standard Chartered PLC; Suncorp Group Limited; and Westpac Banking Corporation.
If our TSR when compared to the TSR of the comparator group
then the percentage of performance rights that vest
is less than the 50th percentile is nil
reaches at least the 50th percentile, but is less than the 75th percentile
is 50% plus 2% for every one percentile increase above the 50th percentile
reaches or exceeds the 75th percentile is 100%
What is the absolute TSR performance hurdle?
Absolute CAGR TSR is an internal hurdle of whether ANZ achieves or exceeds a threshold level of growth the Board sets at the start of the performance period.
The HR Committee recommends the absolute TSR targets for that year’s award to the Board for approval. In recommending the targets the Committee considers factors including: the risk free bond rate; historical volatility of ANZ’s share price relative to the market; and the market risk premium.
If the absolute CAGR of our TSR
then the percentage of performance rights that vest
is less than 9.5% is nil
is 9.5% is 50%
reaches at least 9.5%, but is less than 14.3% is progressively increased on a pro-rata, straight-line, basis from 50% to 100%
reaches or exceeds 14.3% is 100%
How do we calculate TSR performance?
When calculating performance against TSR, we:
• reduce the impact of share price volatility, by using an averaging calculation over a 90 day period for start and end values;
• ensure an independent measurement, by engaging the services of an external organisation (Mercer Consulting (Australia) Pty Ltd) to calculate ANZ’s performance against the TSR hurdles; and
• test the performance against the relevant hurdle once only at the end of the three year performance period — the rights lapse if the performance hurdle is not met.
How do we calculate the number of performance rights?
The number of performance rights we grant is calculated using a face value basis (i.e. the full share price). Face value at full (100%) vesting is split into two tranches. Each tranche value is then divided by the market price (five trading day VWAP of ANZ shares at the start of the performance period) to determine the number of performance rights we award in each tranche.
Performance rights are allocated in November for Disclosed Executives and December for the CEO (subject to shareholder approval).
How do we expense performance rights?
ANZ engages an external expert to independently determine the fair value of:
• performance rights, for expensing purposes; and
• deferred share rights, for allocation and expensing purposes.
They consider factors including: the performance conditions; share price volatility; life of the instrument; dividend yield; and share price at grant date.
1. Excluding the CRO who receives deferred share rights instead of performance rights to preserve the independence of this role and to minimise any conflicts of interest in carrying out the risk control function across the organisation. These deferred share rights are subject to a time-based vesting hurdle of three years. The value used to determine the number of deferred share rights to be allocated is based on an independent fair value calculation.
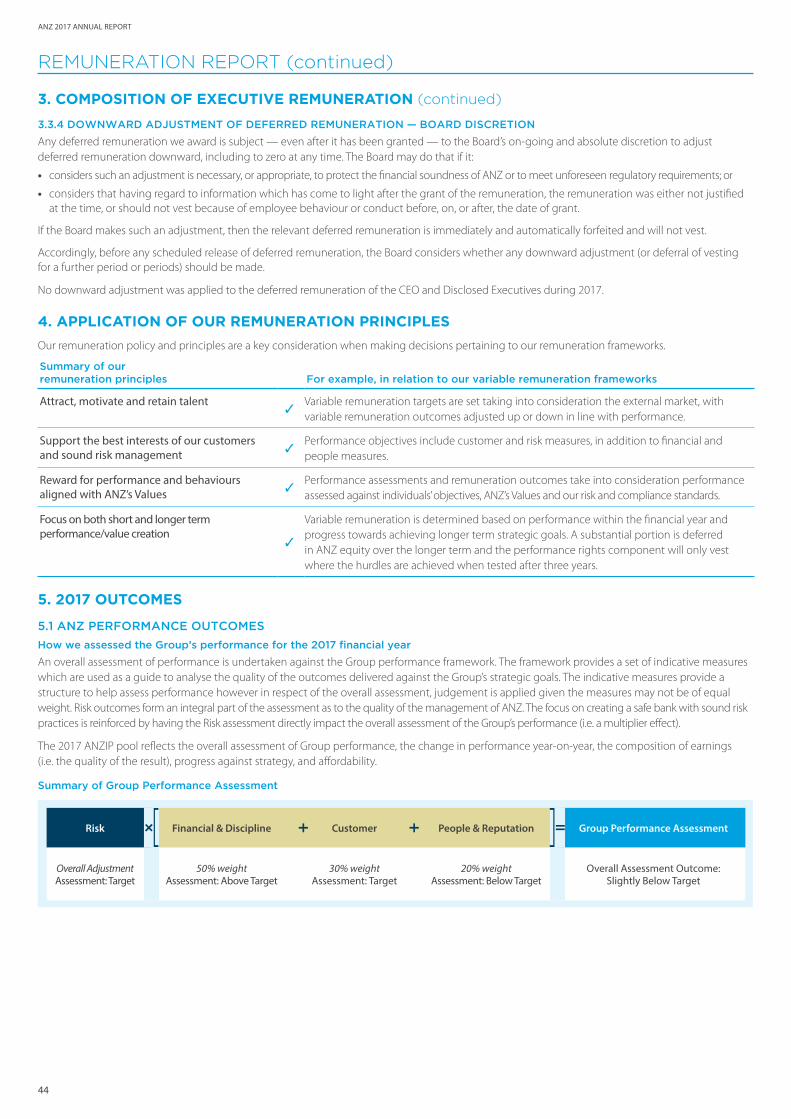
ANZ 2017 ANNUAL REPORT
44
3. COMPOSITION OF EXECUTIVE REMUNERATION (continued)
3.3.4 DOWNWARD ADJUSTMENT OF DEFERRED REMUNERATION — BOARD DISCRETION
Any deferred remuneration we award is subject — even after it has been granted — to the Board’s on-going and absolute discretion to adjust deferred remuneration downward, including to zero at any time. The Board may do that if it:
• considers such an adjustment is necessary, or appropriate, to protect the financial soundness of ANZ or to meet unforeseen regulatory requirements; or
• considers that having regard to information which has come to light after the grant of the remuneration, the remuneration was either not justified at the time, or should not vest because of employee behaviour or conduct before, on, or after, the date of grant.
If the Board makes such an adjustment, then the relevant deferred remuneration is immediately and automatically forfeited and will not vest.
Accordingly, before any scheduled release of deferred remuneration, the Board considers whether any downward adjustment (or deferral of vesting for a further period or periods) should be made.
No downward adjustment was applied to the deferred remuneration of the CEO and Disclosed Executives during 2017.
4. APPLICATION OF OUR REMUNERATION PRINCIPLES
Our remuneration policy and principles are a key consideration when making decisions pertaining to our remuneration frameworks.
Summary of our remuneration principles
For example, in relation to our variable remuneration frameworks
Attract, motivate and retain talent✓
Variable remuneration targets are set taking into consideration the external market, with variable remuneration outcomes adjusted up or down in line with performance.
Support the best interests of our customers and sound risk management ✓
Performance objectives include customer and risk measures, in addition to financial and people measures.
Reward for performance and behaviours aligned with ANZ’s Values ✓
Performance assessments and remuneration outcomes take into consideration performance assessed against individuals’ objectives, ANZ’s Values and our risk and compliance standards.
Focus on both short and longer term performance/value creation
✓
Variable remuneration is determined based on performance within the financial year and progress towards achieving longer term strategic goals. A substantial portion is deferred in ANZ equity over the longer term and the performance rights component will only vest where the hurdles are achieved when tested after three years.
5. 2017 OUTCOMES
5.1 ANZ PERFORMANCE OUTCOMES
How we assessed the Group’s performance for the 2017 financial year
An overall assessment of performance is undertaken against the Group performance framework. The framework provides a set of indicative measures which are used as a guide to analyse the quality of the outcomes delivered against the Group’s strategic goals. The indicative measures provide a structure to help assess performance however in respect of the overall assessment, judgement is applied given the measures may not be of equal weight. Risk outcomes form an integral part of the assessment as to the quality of the management of ANZ. The focus on creating a safe bank with sound risk practices is reinforced by having the Risk assessment directly impact the overall assessment of the Group’s performance (i.e. a multiplier effect).
The 2017 ANZIP pool reflects the overall assessment of Group performance, the change in performance year-on-year, the composition of earnings (i.e. the quality of the result), progress against strategy, and affordability.
Summary of Group Performance Assessment
Risk Financial & Discipline Customer People & Reputation Group Performance Assessment
Overall Adjustment Assessment: Target
50% weight Assessment: Above Target
30% weight Assessment: Target
20% weight Assessment: Below Target
Overall Assessment Outcome: Slightly Below Target
+ + + =
REMUNERATION REPORT (continued)
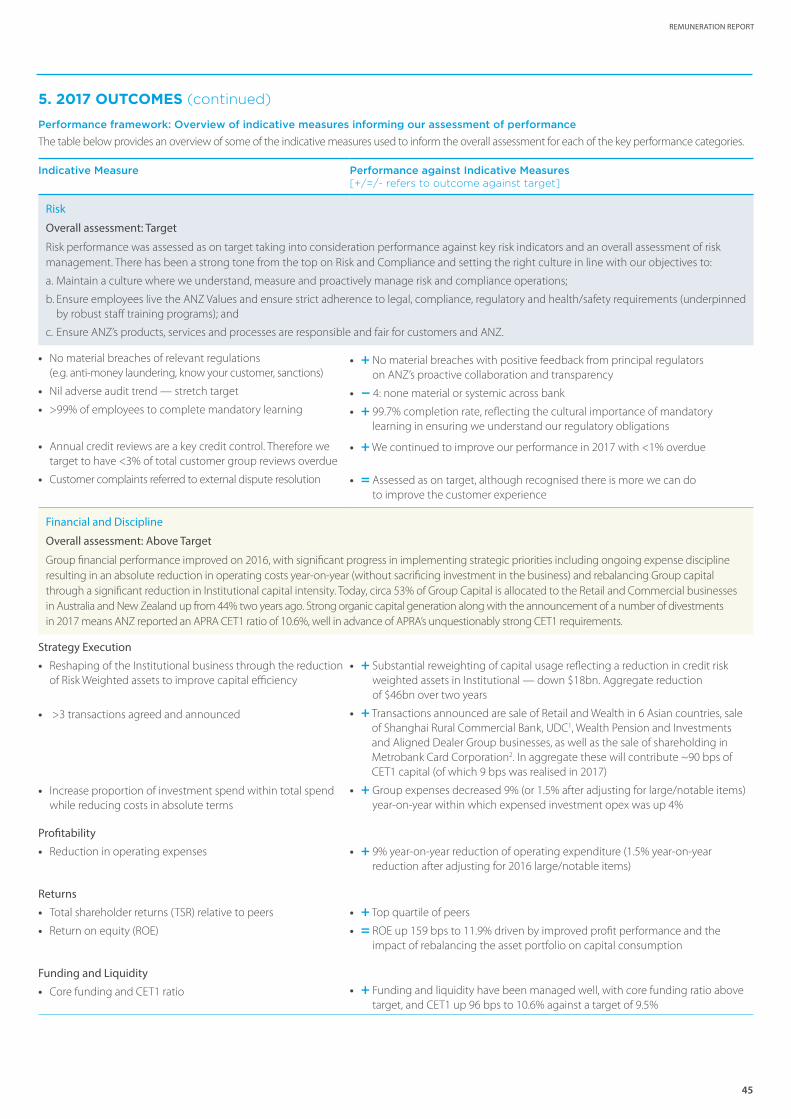
45
REMUNERATION REPORT
5. 2017 OUTCOMES (continued)
Performance framework: Overview of indicative measures informing our assessment of performance
The table below provides an overview of some of the indicative measures used to inform the overall assessment for each of the key performance categories.
Indicative Measure Performance against Indicative Measures [+/=/- refers to outcome against target]
Risk
Overall assessment: Target
Risk performance was assessed as on target taking into consideration performance against key risk indicators and an overall assessment of risk management. There has been a strong tone from the top on Risk and Compliance and setting the right culture in line with our objectives to:
a. Maintain a culture where we understand, measure and proactively manage risk and compliance operations;
b. Ensure employees live the ANZ Values and ensure strict adherence to legal, compliance, regulatory and health/safety requirements (underpinned by robust staff training programs); and
c. Ensure ANZ’s products, services and processes are responsible and fair for customers and ANZ.
• No material breaches of relevant regulations (e.g. anti-money laundering, know your customer, sanctions)
• Nil adverse audit trend — stretch target
• >99% of employees to complete mandatory learning
• Annual credit reviews are a key credit control. Therefore we target to have <3% of total customer group reviews overdue
• Customer complaints referred to external dispute resolution
• + No material breaches with positive feedback from principal regulators on ANZ’s proactive collaboration and transparency
• - 4: none material or systemic across bank
• + 99.7% completion rate, reflecting the cultural importance of mandatory learning in ensuring we understand our regulatory obligations
• + We continued to improve our performance in 2017 with <1% overdue
• = Assessed as on target, although recognised there is more we can do to improve the customer experience
Financial and Discipline
Overall assessment: Above Target
Group financial performance improved on 2016, with significant progress in implementing strategic priorities including ongoing expense discipline resulting in an absolute reduction in operating costs year-on-year (without sacrificing investment in the business) and rebalancing Group capital through a significant reduction in Institutional capital intensity. Today, circa 53% of Group Capital is allocated to the Retail and Commercial businesses in Australia and New Zealand up from 44% two years ago. Strong organic capital generation along with the announcement of a number of divestments in 2017 means ANZ reported an APRA CET1 ratio of 10.6%, well in advance of APRA’s unquestionably strong CET1 requirements.
Strategy Execution
• Reshaping of the Institutional business through the reduction of Risk Weighted assets to improve capital efficiency
• >3 transactions agreed and announced
• Increase proportion of investment spend within total spend while reducing costs in absolute terms
• + Substantial reweighting of capital usage reflecting a reduction in credit risk weighted assets in Institutional — down $18bn. Aggregate reduction of $46bn over two years
• + Transactions announced are sale of Retail and Wealth in 6 Asian countries, sale of Shanghai Rural Commercial Bank, UDC1, Wealth Pension and Investments and Aligned Dealer Group businesses, as well as the sale of shareholding in Metrobank Card Corporation2. In aggregate these will contribute ~90 bps of CET1 capital (of which 9 bps was realised in 2017)
• + Group expenses decreased 9% (or 1.5% after adjusting for large/notable items) year-on-year within which expensed investment opex was up 4%
Profitability
• Reduction in operating expenses • + 9% year-on-year reduction of operating expenditure (1.5% year-on-year reduction after adjusting for 2016 large/notable items)
Returns
• Total shareholder returns (TSR) relative to peers
• Return on equity (ROE)
• + Top quartile of peers
• = ROE up 159 bps to 11.9% driven by improved profit performance and the impact of rebalancing the asset portfolio on capital consumption
Funding and Liquidity
• Core funding and CET1 ratio • + Funding and liquidity have been managed well, with core funding ratio above target, and CET1 up 96 bps to 10.6% against a target of 9.5%
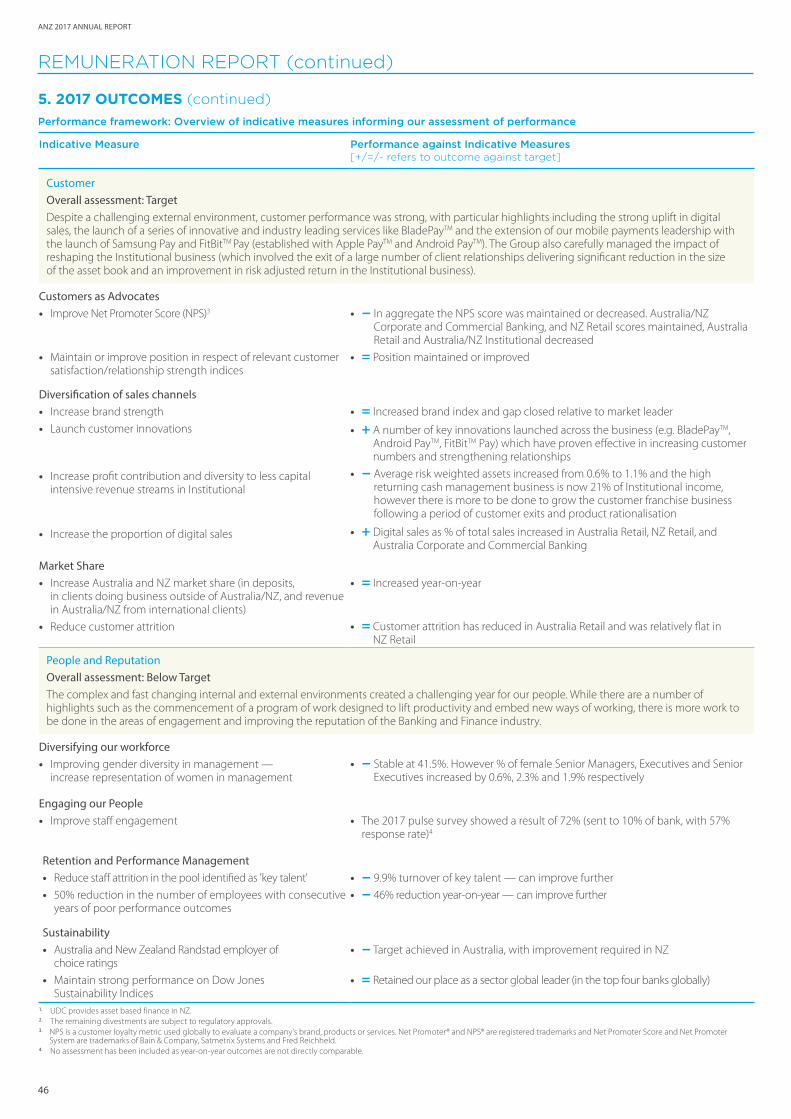
ANZ 2017 ANNUAL REPORT
46
Indicative Measure Performance against Indicative Measures [+/=/- refers to outcome against target]
CustomerOverall assessment: Target Despite a challenging external environment, customer performance was strong, with particular highlights including the strong uplift in digital sales, the launch of a series of innovative and industry leading services like BladePayTM and the extension of our mobile payments leadership with the launch of Samsung Pay and FitBitTM Pay (established with Apple PayTM and Android PayTM). The Group also carefully managed the impact of reshaping the Institutional business (which involved the exit of a large number of client relationships delivering significant reduction in the size of the asset book and an improvement in risk adjusted return in the Institutional business).
Customers as Advocates • Improve Net Promoter Score (NPS)3
• Maintain or improve position in respect of relevant customer satisfaction/relationship strength indices
• - In aggregate the NPS score was maintained or decreased. Australia/NZ Corporate and Commercial Banking, and NZ Retail scores maintained, Australia Retail and Australia/NZ Institutional decreased
• = Position maintained or improved
Diversification of sales channels • Increase brand strength
• Launch customer innovations
• Increase profit contribution and diversity to less capital intensive revenue streams in Institutional
• Increase the proportion of digital sales
• = Increased brand index and gap closed relative to market leader
• + A number of key innovations launched across the business (e.g. BladePayTM, Android PayTM, FitBitTM Pay) which have proven effective in increasing customer numbers and strengthening relationships
• - Average risk weighted assets increased from 0.6% to 1.1% and the high returning cash management business is now 21% of Institutional income, however there is more to be done to grow the customer franchise business following a period of customer exits and product rationalisation
• + Digital sales as % of total sales increased in Australia Retail, NZ Retail, and Australia Corporate and Commercial Banking
Market Share • Increase Australia and NZ market share (in deposits,
in clients doing business outside of Australia/NZ, and revenue in Australia/NZ from international clients)
• Reduce customer attrition
• = Increased year-on-year
• = Customer attrition has reduced in Australia Retail and was relatively flat in NZ Retail
People and ReputationOverall assessment: Below TargetThe complex and fast changing internal and external environments created a challenging year for our people. While there are a number of highlights such as the commencement of a program of work designed to lift productivity and embed new ways of working, there is more work to be done in the areas of engagement and improving the reputation of the Banking and Finance industry.
Diversifying our workforce • Improving gender diversity in management —
increase representation of women in management • - Stable at 41.5%. However % of female Senior Managers, Executives and Senior
Executives increased by 0.6%, 2.3% and 1.9% respectively
Engaging our People • Improve staff engagement • The 2017 pulse survey showed a result of 72% (sent to 10% of bank, with 57%
response rate)4
Retention and Performance Management • Reduce staff attrition in the pool identified as 'key talent'
• 50% reduction in the number of employees with consecutive years of poor performance outcomes
• - 9.9% turnover of key talent — can improve further
• - 46% reduction year-on-year — can improve further
Sustainability • Australia and New Zealand Randstad employer of
choice ratings
• Maintain strong performance on Dow Jones Sustainability Indices
• - Target achieved in Australia, with improvement required in NZ
• = Retained our place as a sector global leader (in the top four banks globally)
1. UDC provides asset based finance in NZ.2. The remaining divestments are subject to regulatory approvals.3. NPS is a customer loyalty metric used globally to evaluate a company’s brand, products or services. Net Promoter® and NPS® are registered trademarks and Net Promoter Score and Net Promoter
System are trademarks of Bain & Company, Satmetrix Systems and Fred Reichheld.4. No assessment has been included as year-on-year outcomes are not directly comparable.
5. 2017 OUTCOMES (continued)
Performance framework: Overview of indicative measures informing our assessment of performance
REMUNERATION REPORT (continued)
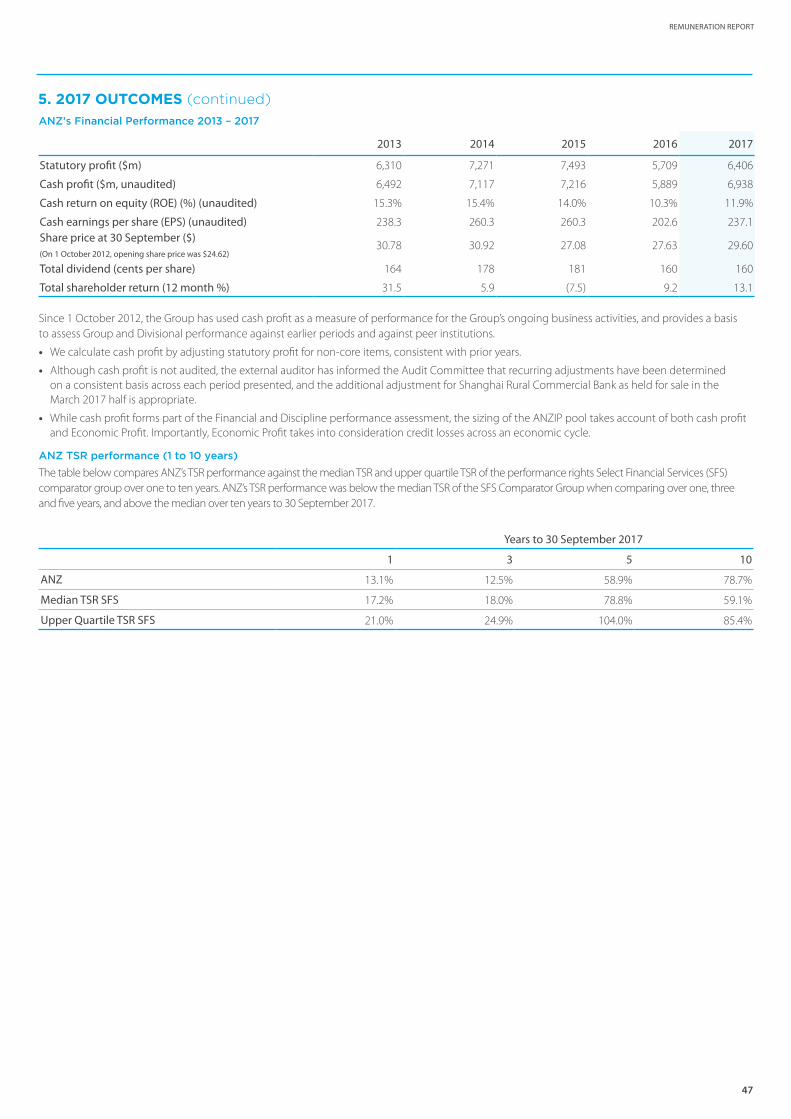
47
REMUNERATION REPORT
ANZ’s Financial Performance 2013 – 2017
2013 2014 2015 2016 2017
Statutory profit ($m) 6,310 7,271 7,493 5,709 6,406
Cash profit ($m, unaudited) 6,492 7,117 7,216 5,889 6,938
Cash return on equity (ROE) (%) (unaudited) 15.3% 15.4% 14.0% 10.3% 11.9%
Cash earnings per share (EPS) (unaudited) 238.3 260.3 260.3 202.6 237.1Share price at 30 September ($) (On 1 October 2012, opening share price was $24.62)
30.78 30.92 27.08 27.63 29.60
Total dividend (cents per share) 164 178 181 160 160
Total shareholder return (12 month %) 31.5 5.9 (7.5) 9.2 13.1
Since 1 October 2012, the Group has used cash profit as a measure of performance for the Group’s ongoing business activities, and provides a basis to assess Group and Divisional performance against earlier periods and against peer institutions.
• We calculate cash profit by adjusting statutory profit for non-core items, consistent with prior years.
• Although cash profit is not audited, the external auditor has informed the Audit Committee that recurring adjustments have been determined on a consistent basis across each period presented, and the additional adjustment for Shanghai Rural Commercial Bank as held for sale in the March 2017 half is appropriate.
• While cash profit forms part of the Financial and Discipline performance assessment, the sizing of the ANZIP pool takes account of both cash profit and Economic Profit. Importantly, Economic Profit takes into consideration credit losses across an economic cycle.
ANZ TSR performance (1 to 10 years)
The table below compares ANZ’s TSR performance against the median TSR and upper quartile TSR of the performance rights Select Financial Services (SFS) comparator group over one to ten years. ANZ’s TSR performance was below the median TSR of the SFS Comparator Group when comparing over one, three and five years, and above the median over ten years to 30 September 2017.
Years to 30 September 2017
1 3 5 10
ANZ 13.1% 12.5% 58.9% 78.7%
Median TSR SFS 17.2% 18.0% 78.8% 59.1%
Upper Quartile TSR SFS 21.0% 24.9% 104.0% 85.4%
5. 2017 OUTCOMES (continued)
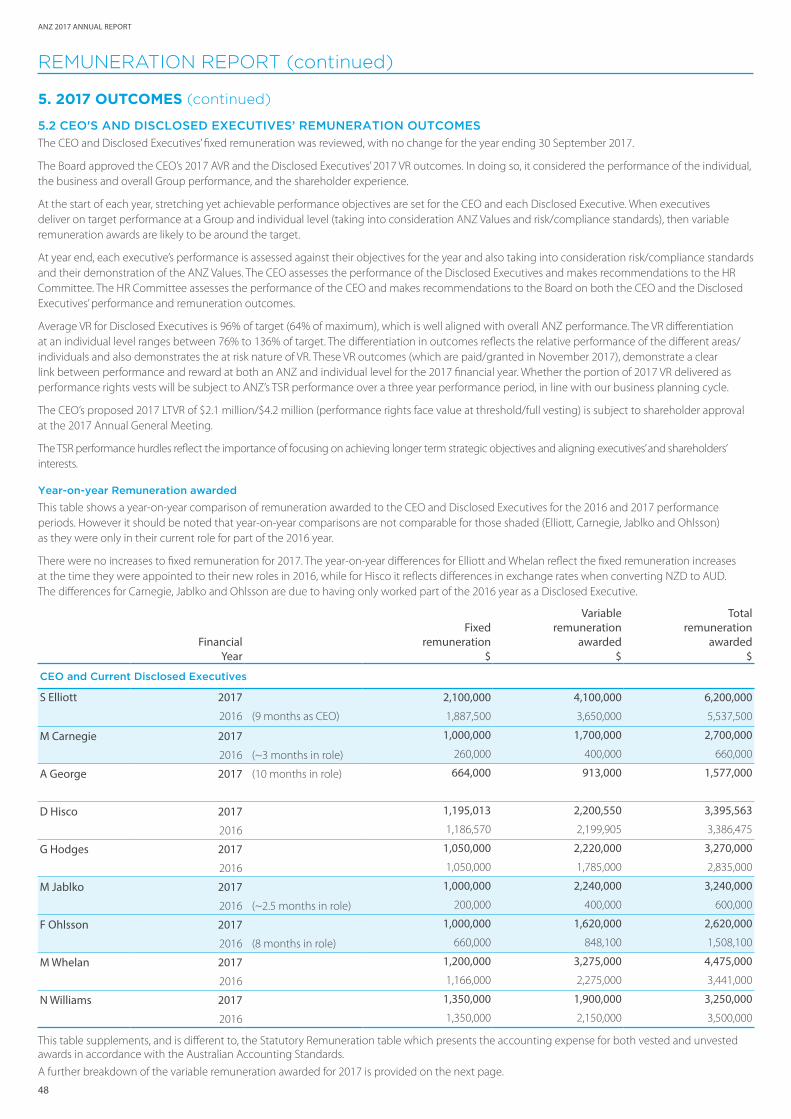
ANZ 2017 ANNUAL REPORT
48
5. 2017 OUTCOMES (continued)
5.2 CEO'S AND DISCLOSED EXECUTIVES’ REMUNERATION OUTCOMES
The CEO and Disclosed Executives’ fixed remuneration was reviewed, with no change for the year ending 30 September 2017.
The Board approved the CEO’s 2017 AVR and the Disclosed Executives’ 2017 VR outcomes. In doing so, it considered the performance of the individual, the business and overall Group performance, and the shareholder experience.
At the start of each year, stretching yet achievable performance objectives are set for the CEO and each Disclosed Executive. When executives deliver on target performance at a Group and individual level (taking into consideration ANZ Values and risk/compliance standards), then variable remuneration awards are likely to be around the target.
At year end, each executive’s performance is assessed against their objectives for the year and also taking into consideration risk/compliance standards and their demonstration of the ANZ Values. The CEO assesses the performance of the Disclosed Executives and makes recommendations to the HR Committee. The HR Committee assesses the performance of the CEO and makes recommendations to the Board on both the CEO and the Disclosed Executives’ performance and remuneration outcomes.
Average VR for Disclosed Executives is 96% of target (64% of maximum), which is well aligned with overall ANZ performance. The VR differentiation at an individual level ranges between 76% to 136% of target. The differentiation in outcomes reflects the relative performance of the different areas/individuals and also demonstrates the at risk nature of VR. These VR outcomes (which are paid/granted in November 2017), demonstrate a clear link between performance and reward at both an ANZ and individual level for the 2017 financial year. Whether the portion of 2017 VR delivered as performance rights vests will be subject to ANZ’s TSR performance over a three year performance period, in line with our business planning cycle.
The CEO’s proposed 2017 LTVR of $2.1 million/$4.2 million (performance rights face value at threshold/full vesting) is subject to shareholder approval at the 2017 Annual General Meeting.
The TSR performance hurdles reflect the importance of focusing on achieving longer term strategic objectives and aligning executives’ and shareholders’ interests.
Year-on-year Remuneration awarded
This table shows a year-on-year comparison of remuneration awarded to the CEO and Disclosed Executives for the 2016 and 2017 performance periods. However it should be noted that year-on-year comparisons are not comparable for those shaded (Elliott, Carnegie, Jablko and Ohlsson) as they were only in their current role for part of the 2016 year.
There were no increases to fixed remuneration for 2017. The year-on-year differences for Elliott and Whelan reflect the fixed remuneration increases at the time they were appointed to their new roles in 2016, while for Hisco it reflects differences in exchange rates when converting NZD to AUD. The differences for Carnegie, Jablko and Ohlsson are due to having only worked part of the 2016 year as a Disclosed Executive.
Financial
Year
Fixed remuneration
$
Variable remuneration
awarded $
Total remuneration
awarded
$
CEO and Current Disclosed Executives
S Elliott 2017 2,100,000 4,100,000 6,200,000
2016 (9 months as CEO) 1,887,500 3,650,000 5,537,500
M Carnegie 2017 1,000,000 1,700,000 2,700,000
2016 (~3 months in role) 260,000 400,000 660,000
A George 2017 (10 months in role) 664,000 913,000 1,577,000
D Hisco 2017 1,195,013 2,200,550 3,395,563
2016 1,186,570 2,199,905 3,386,475
G Hodges 2017 1,050,000 2,220,000 3,270,000
2016 1,050,000 1,785,000 2,835,000
M Jablko 2017 1,000,000 2,240,000 3,240,000
2016 (~2.5 months in role) 200,000 400,000 600,000
F Ohlsson 2017 1,000,000 1,620,000 2,620,000
2016 (8 months in role) 660,000 848,100 1,508,100
M Whelan 2017 1,200,000 3,275,000 4,475,000
2016 1,166,000 2,275,000 3,441,000
N Williams 2017 1,350,000 1,900,000 3,250,000
2016 1,350,000 2,150,000 3,500,000
This table supplements, and is different to, the Statutory Remuneration table which presents the accounting expense for both vested and unvested awards in accordance with the Australian Accounting Standards.
A further breakdown of the variable remuneration awarded for 2017 is provided on the next page.
REMUNERATION REPORT (continued)
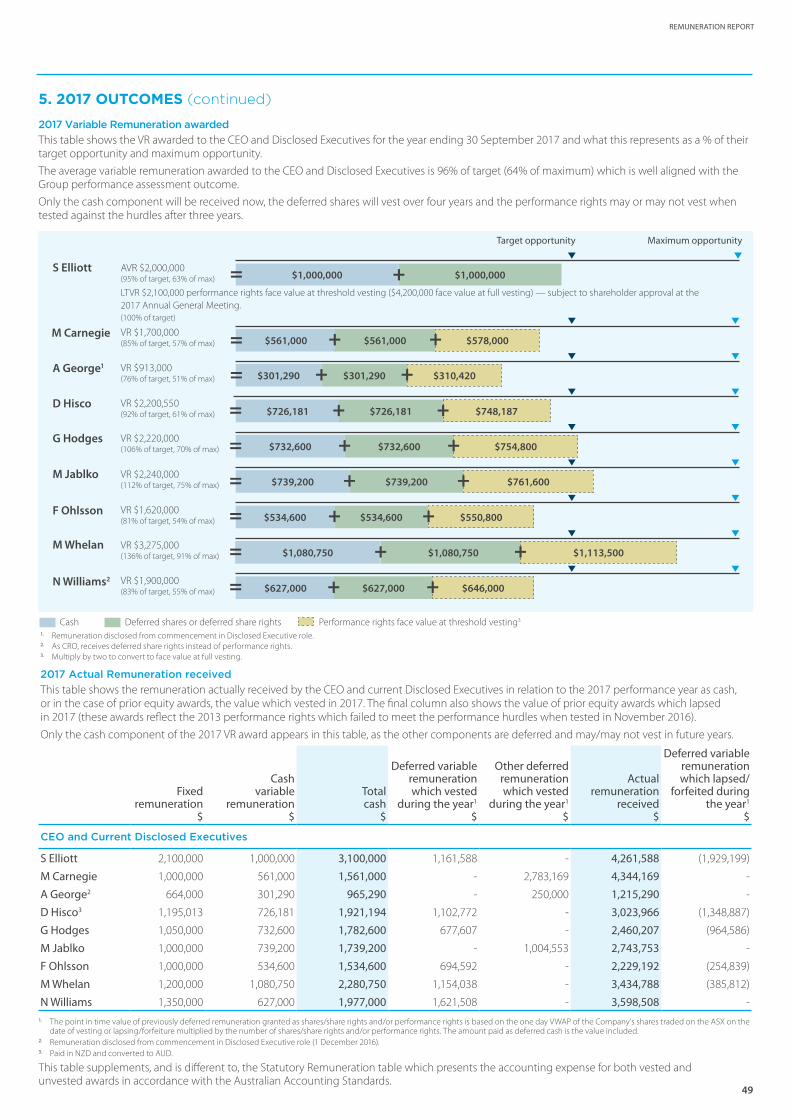
49
REMUNERATION REPORT
5. 2017 OUTCOMES (continued)
2017 Variable Remuneration awarded
This table shows the VR awarded to the CEO and Disclosed Executives for the year ending 30 September 2017 and what this represents as a % of their target opportunity and maximum opportunity.The average variable remuneration awarded to the CEO and Disclosed Executives is 96% of target (64% of maximum) which is well aligned with the Group performance assessment outcome.Only the cash component will be received now, the deferred shares will vest over four years and the performance rights may or may not vest when tested against the hurdles after three years.
Cash Deferred shares or deferred share rights Performance rights face value at threshold vesting3
1. Remuneration disclosed from commencement in Disclosed Executive role.2. As CRO, receives deferred share rights instead of performance rights. 3. Multiply by two to convert to face value at full vesting.
2017 Actual Remuneration received
This table shows the remuneration actually received by the CEO and current Disclosed Executives in relation to the 2017 performance year as cash, or in the case of prior equity awards, the value which vested in 2017. The final column also shows the value of prior equity awards which lapsed in 2017 (these awards reflect the 2013 performance rights which failed to meet the performance hurdles when tested in November 2016).Only the cash component of the 2017 VR award appears in this table, as the other components are deferred and may/may not vest in future years.
Fixed remuneration
Cash variable
remunerationTotal cash
Deferred variable remuneration which vested
during the year1
Other deferred remuneration which vested
during the year1
Actual remuneration
received
Deferred variable remuneration which lapsed/
forfeited during the year1
$ $ $ $ $ $ $
CEO and Current Disclosed Executives
S Elliott 2,100,000 1,000,000 3,100,000 1,161,588 - 4,261,588 (1,929,199)
M Carnegie 1,000,000 561,000 1,561,000 - 2,783,169 4,344,169 -
A George2 664,000 301,290 965,290 - 250,000 1,215,290 -
D Hisco3 1,195,013 726,181 1,921,194 1,102,772 - 3,023,966 (1,348,887)
G Hodges 1,050,000 732,600 1,782,600 677,607 - 2,460,207 (964,586)
M Jablko 1,000,000 739,200 1,739,200 - 1,004,553 2,743,753 -
F Ohlsson 1,000,000 534,600 1,534,600 694,592 - 2,229,192 (254,839)
M Whelan 1,200,000 1,080,750 2,280,750 1,154,038 - 3,434,788 (385,812)
N Williams 1,350,000 627,000 1,977,000 1,621,508 - 3,598,508 - 1. The point in time value of previously deferred remuneration granted as shares/share rights and/or performance rights is based on the one day VWAP of the Company’s shares traded on the ASX on the
date of vesting or lapsing/forfeiture multiplied by the number of shares/share rights and/or performance rights. The amount paid as deferred cash is the value included.2. Remuneration disclosed from commencement in Disclosed Executive role (1 December 2016).3. Paid in NZD and converted to AUD.
This table supplements, and is different to, the Statutory Remuneration table which presents the accounting expense for both vested and unvested awards in accordance with the Australian Accounting Standards.
Maximum opportunityTarget opportunity
S Elliott AVR $2,000,000 (95% of target, 63% of max)
LTVR $2,100,000 performance rights face value at threshold vesting ($4,200,000 face value at full vesting) — subject to shareholder approval at the 2017 Annual General Meeting.(100% of target)
$1,000,000$1,000,000 +=
M Carnegie VR $1,700,000 (85% of target, 57% of max)
A George1 VR $913,000 (76% of target, 51% of max)
D Hisco VR $2,200,550 (92% of target, 61% of max) $726,181 $726,181 $748,187+ +=
$301,290 $301,290 $310,420+ +=
$561,000 $561,000 $578,000+ +=
G Hodges VR $2,220,000 (106% of target, 70% of max) $732,600 $732,600 $754,800+ +=
M Jablko VR $2,240,000 (112% of target, 75% of max) $739,200 $739,200 $761,600+ +=
F Ohlsson VR $1,620,000 (81% of target, 54% of max) $534,600 $534,600 $550,800+ +=
M Whelan VR $3,275,000 (136% of target, 91% of max) $1,080,750 $1,080,750 $1,113,500+ +=
N Williams2 VR $1,900,000 (83% of target, 55% of max) $627,000 $627,000 $646,000+ +=
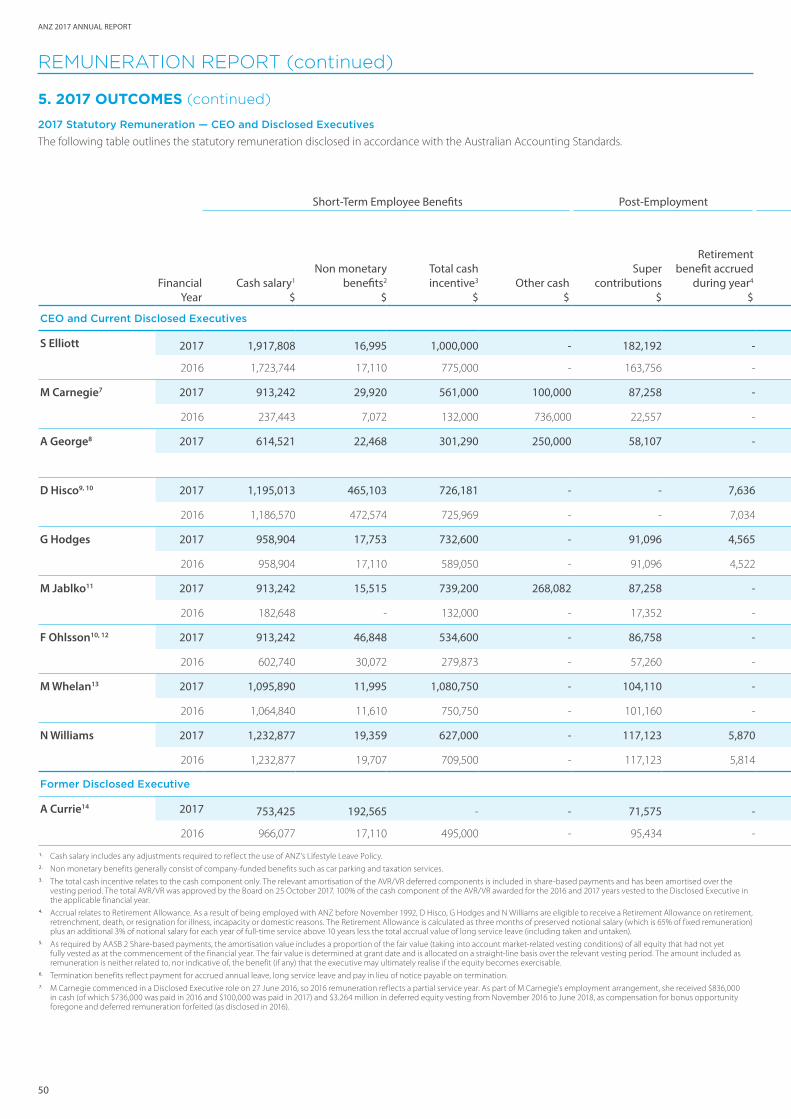
ANZ 2017 ANNUAL REPORT
50
Financial Year
Short-Term Employee Benefits Post-Employment
Cash salary1
$
Non monetary benefits2
$
Total cash incentive3
$Other cash
$
Super contributions
$
Retirement benefit accrued
during year4
$
CEO and Current Disclosed Executives
S Elliott 2017 1,917,808 16,995 1,000,000 - 182,192 -
2016 1,723,744 17,110 775,000 - 163,756 -
M Carnegie7 2017 913,242 29,920 561,000 100,000 87,258 -
2016 237,443 7,072 132,000 736,000 22,557 -
A George8 2017 614,521 22,468 301,290 250,000 58,107 -
D Hisco9, 10 2017 1,195,013 465,103 726,181 - - 7,636
2016 1,186,570 472,574 725,969 - - 7,034
G Hodges 2017 958,904 17,753 732,600 - 91,096 4,565
2016 958,904 17,110 589,050 - 91,096 4,522
M Jablko11 2017 913,242 15,515 739,200 268,082 87,258 -
2016 182,648 - 132,000 - 17,352 -
F Ohlsson10, 12 2017 913,242 46,848 534,600 - 86,758 -
2016 602,740 30,072 279,873 - 57,260 -
M Whelan13 2017 1,095,890 11,995 1,080,750 - 104,110 -
2016 1,064,840 11,610 750,750 - 101,160 -
N Williams 2017 1,232,877 19,359 627,000 - 117,123 5,870
2016 1,232,877 19,707 709,500 - 117,123 5,814
Former Disclosed Executive
A Currie14 2017 753,425 192,565 - - 71,575 -
2016 966,077 17,110 495,000 - 95,434 -
1. Cash salary includes any adjustments required to reflect the use of ANZ's Lifestyle Leave Policy.2. Non monetary benefits generally consist of company-funded benefits such as car parking and taxation services. 3. The total cash incentive relates to the cash component only. The relevant amortisation of the AVR/VR deferred components is included in share-based payments and has been amortised over the
vesting period. The total AVR/VR was approved by the Board on 25 October 2017. 100% of the cash component of the AVR/VR awarded for the 2016 and 2017 years vested to the Disclosed Executive in the applicable financial year.
4. Accrual relates to Retirement Allowance. As a result of being employed with ANZ before November 1992, D Hisco, G Hodges and N Williams are eligible to receive a Retirement Allowance on retirement, retrenchment, death, or resignation for illness, incapacity or domestic reasons. The Retirement Allowance is calculated as three months of preserved notional salary (which is 65% of fixed remuneration) plus an additional 3% of notional salary for each year of full-time service above 10 years less the total accrual value of long service leave (including taken and untaken).
5. As required by AASB 2 Share-based payments, the amortisation value includes a proportion of the fair value (taking into account market-related vesting conditions) of all equity that had not yet fully vested as at the commencement of the financial year. The fair value is determined at grant date and is allocated on a straight-line basis over the relevant vesting period. The amount included as remuneration is neither related to, nor indicative of, the benefit (if any) that the executive may ultimately realise if the equity becomes exercisable.
6. Termination benefits reflect payment for accrued annual leave, long service leave and pay in lieu of notice payable on termination.7. M Carnegie commenced in a Disclosed Executive role on 27 June 2016, so 2016 remuneration reflects a partial service year. As part of M Carnegie's employment arrangement, she received $836,000
in cash (of which $736,000 was paid in 2016 and $100,000 was paid in 2017) and $3.264 million in deferred equity vesting from November 2016 to June 2018, as compensation for bonus opportunity foregone and deferred remuneration forfeited (as disclosed in 2016).
5. 2017 OUTCOMES (continued)
2017 Statutory Remuneration — CEO and Disclosed Executives
The following table outlines the statutory remuneration disclosed in accordance with the Australian Accounting Standards.
REMUNERATION REPORT (continued)
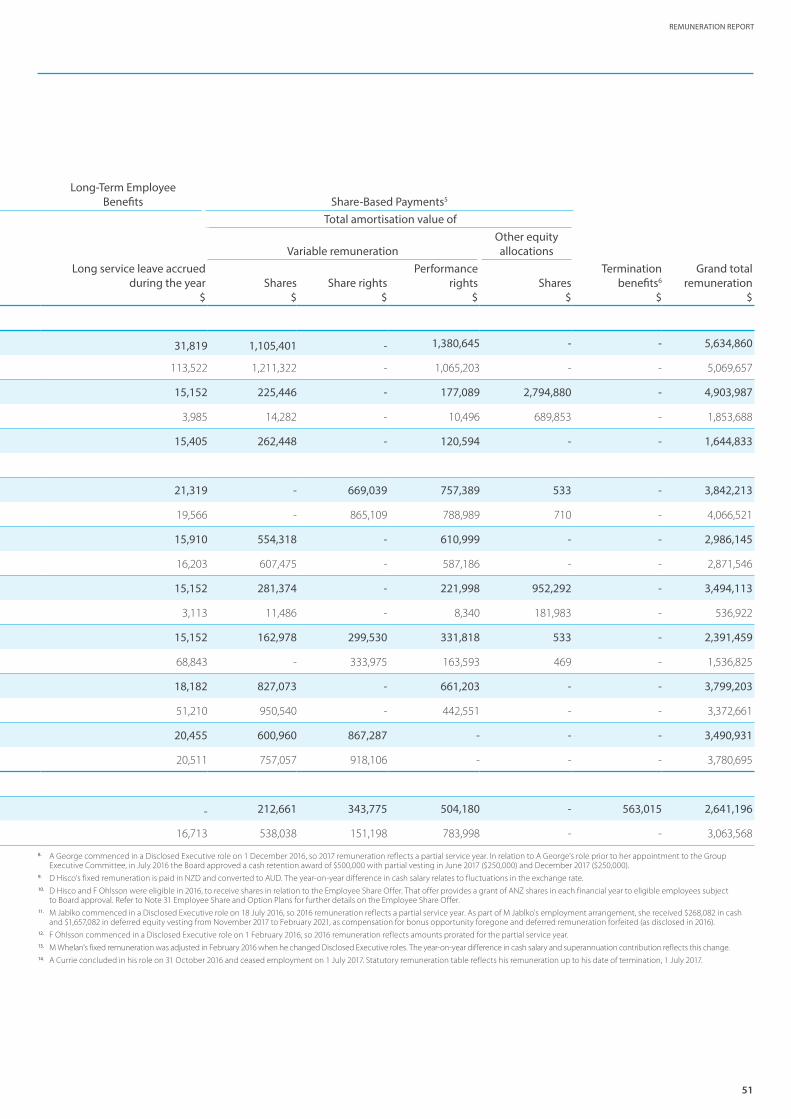
51
REMUNERATION REPORT
Long-Term Employee Benefits Share-Based Payments5
Long service leave accrued during the year
$
Total amortisation value of
Variable remunerationOther equity allocations
Shares$
Share rights$
Performance rights
$Shares
$
Termination benefits6
$
Grand total remuneration
$
31,819 1,105,401 - 1,380,645 - - 5,634,860
113,522 1,211,322 - 1,065,203 - - 5,069,657
15,152 225,446 - 177,089 2,794,880 - 4,903,987
3,985 14,282 - 10,496 689,853 - 1,853,688
15,405 262,448 - 120,594 - - 1,644,833
21,319 - 669,039 757,389 533 - 3,842,213
19,566 - 865,109 788,989 710 - 4,066,521
15,910 554,318 - 610,999 - - 2,986,145
16,203 607,475 - 587,186 - - 2,871,546
15,152 281,374 - 221,998 952,292 - 3,494,113
3,113 11,486 - 8,340 181,983 - 536,922
15,152 162,978 299,530 331,818 533 - 2,391,459
68,843 - 333,975 163,593 469 - 1,536,825
18,182 827,073 - 661,203 - - 3,799,203
51,210 950,540 - 442,551 - - 3,372,661
20,455 600,960 867,287 - - - 3,490,931
20,511 757,057 918,106 - - - 3,780,695
- 212,661 343,775 504,180 - 563,015 2,641,196
16,713 538,038 151,198 783,998 - - 3,063,568
8. A George commenced in a Disclosed Executive role on 1 December 2016, so 2017 remuneration reflects a partial service year. In relation to A George's role prior to her appointment to the Group Executive Committee, in July 2016 the Board approved a cash retention award of $500,000 with partial vesting in June 2017 ($250,000) and December 2017 ($250,000).
9. D Hisco's fixed remuneration is paid in NZD and converted to AUD. The year-on-year difference in cash salary relates to fluctuations in the exchange rate.10. D Hisco and F Ohlsson were eligible in 2016, to receive shares in relation to the Employee Share Offer. That offer provides a grant of ANZ shares in each financial year to eligible employees subject
to Board approval. Refer to Note 31 Employee Share and Option Plans for further details on the Employee Share Offer. 11. M Jablko commenced in a Disclosed Executive role on 18 July 2016, so 2016 remuneration reflects a partial service year. As part of M Jablko's employment arrangement, she received $268,082 in cash
and $1,657,082 in deferred equity vesting from November 2017 to February 2021, as compensation for bonus opportunity foregone and deferred remuneration forfeited (as disclosed in 2016).12. F Ohlsson commenced in a Disclosed Executive role on 1 February 2016, so 2016 remuneration reflects amounts prorated for the partial service year.13. M Whelan's fixed remuneration was adjusted in February 2016 when he changed Disclosed Executive roles. The year-on-year difference in cash salary and superannuation contribution reflects this change.14. A Currie concluded in his role on 31 October 2016 and ceased employment on 1 July 2017. Statutory remuneration table reflects his remuneration up to his date of termination, 1 July 2017.

ANZ 2017 ANNUAL REPORT
52
5. 2017 OUTCOMES (continued)
5.3 PERFORMANCE RIGHTS VESTING OUTCOMES
Performance rights granted to the CEO and Disclosed Executives (excluding the CRO) in November 2013 reached the end of their performance period in November 2016.
Hurdle Grant dateFirst date
exercisable
ANZ TSR over
three years
Median TSR over
three years%
vested Outcome
Relative TSR — Select Financial Services
Comparator Group
22-Nov-13 22-Nov-16 4.07% 18.01% 0% Performance rights lapsed
Relative TSR — ASX 50 Comparator Group 22-Nov-13 22-Nov-16 4.07% 19.14% 0% Performance rights lapsed
It is likely that the performance rights we awarded our executives in late 2014 will also lapse when we test them in November 2017.
6. NON-EXECUTIVE DIRECTOR (NED) REMUNERATIONThe Board reviewed and determined not to increase NED fees for 2017.
NEDs receive a fee for being a Director of the Board, and additional fees for either chairing, or being a member of a Board Committee. The Chairman of the Board does not receive additional fees for serving on a Board Committee.
In setting Board and Committee fees consideration is given to: general industry practice; best principles of corporate governance; the responsibilities and risks attached to the NED role; the time commitment expected of NEDs on Group and Company matters; and fees paid to NEDs of comparable companies.
ANZ compares NED fees to a comparator group of Australian listed companies with a similar market capitalisation, with particular focus on the major financial services institutions. This is considered an appropriate group, given similarity in size, nature of work and time commitment by NEDs.
This table shows the NED fee structure for 2017 (unchanged from 2016):
Board1
Audit Committee
Risk Committee
Human Resources
Committee
Digital Business & Technology
Committee
Environment, Sustainability
& Governance Committee
Chair fee $825,000 $65,000 $62,000 $57,000 $35,000 $35,000
Member fee $240,000 $32,500 $31,000 $29,000 $15,000 $15,0001. Including superannuation.
To maintain NED independence and impartiality:
• NED fees are not linked to the performance of the Group; and
• NEDs are not eligible to participate in any of the Group’s variable remuneration arrangements.
The current aggregate fee pool for NEDs of $4 million was approved by shareholders at the 2012 Annual General Meeting. The annual total of NEDs’ fees, including superannuation contributions, is within this agreed limit.
We expect our NEDs to hold ANZ shares
NEDs are required:
• to accumulate shares — over a five year period from their appointment — to the value of 100% (200% for the Chairman) of the NED fee for a Board member; and
• to maintain this shareholding while they are a Director of ANZ.
All NEDs have met — or, if appointed within the last five years, are on track to meet — their minimum shareholding requirement.
REMUNERATION REPORT (continued)
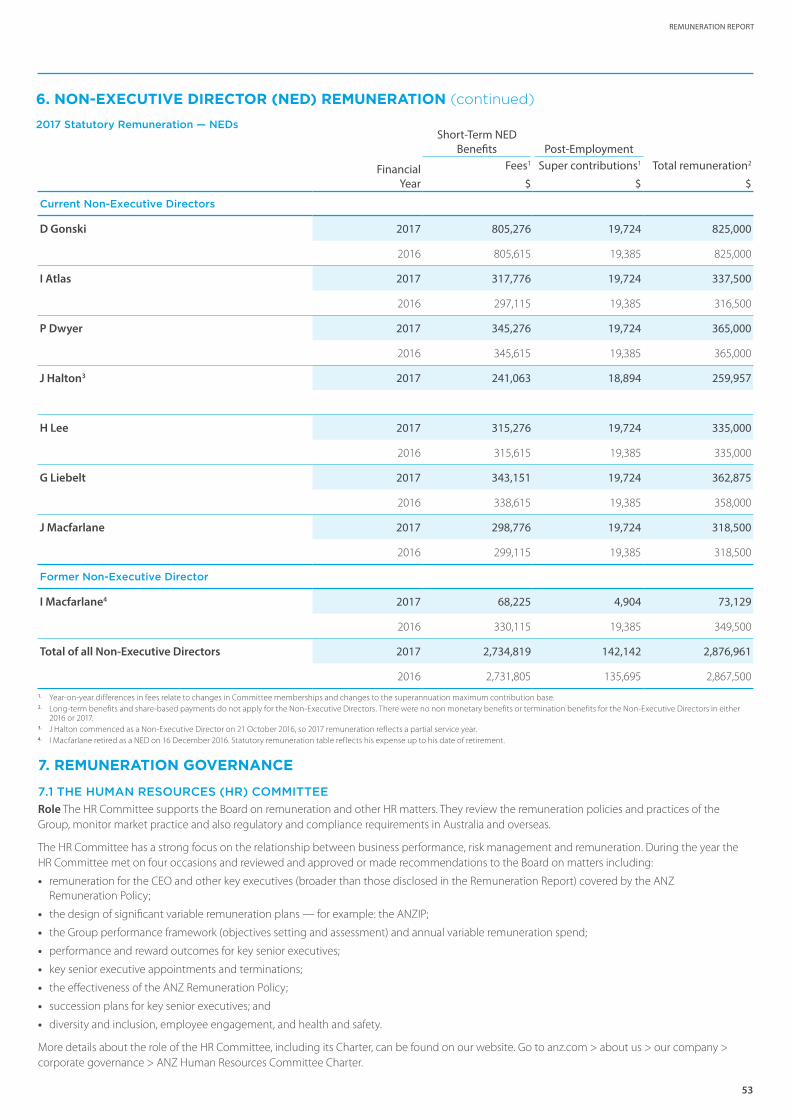
53
REMUNERATION REPORT
Short-Term NED Benefits Post-Employment
Financial Year
Fees1
$
Super contributions1
$
Total remuneration2
$
Current Non-Executive Directors
D Gonski 2017 805,276 19,724 825,000
2016 805,615 19,385 825,000
I Atlas 2017 317,776 19,724 337,500
2016 297,115 19,385 316,500
P Dwyer 2017 345,276 19,724 365,000
2016 345,615 19,385 365,000
J Halton3 2017 241,063 18,894 259,957
H Lee 2017 315,276 19,724 335,000
2016 315,615 19,385 335,000
G Liebelt 2017 343,151 19,724 362,875
2016 338,615 19,385 358,000
J Macfarlane 2017 298,776 19,724 318,500
2016 299,115 19,385 318,500
Former Non-Executive Director
I Macfarlane4 2017 68,225 4,904 73,129
2016 330,115 19,385 349,500
Total of all Non-Executive Directors 2017 2,734,819 142,142 2,876,961
2016 2,731,805 135,695 2,867,500
1. Year-on-year differences in fees relate to changes in Committee memberships and changes to the superannuation maximum contribution base.2. Long-term benefits and share-based payments do not apply for the Non-Executive Directors. There were no non monetary benefits or termination benefits for the Non-Executive Directors in either
2016 or 2017.3. J Halton commenced as a Non-Executive Director on 21 October 2016, so 2017 remuneration reflects a partial service year. 4. I Macfarlane retired as a NED on 16 December 2016. Statutory remuneration table reflects his expense up to his date of retirement.
7. REMUNERATION GOVERNANCE
7.1 THE HUMAN RESOURCES (HR) COMMITTEE
Role The HR Committee supports the Board on remuneration and other HR matters. They review the remuneration policies and practices of the Group, monitor market practice and also regulatory and compliance requirements in Australia and overseas.
The HR Committee has a strong focus on the relationship between business performance, risk management and remuneration. During the year the HR Committee met on four occasions and reviewed and approved or made recommendations to the Board on matters including:
• remuneration for the CEO and other key executives (broader than those disclosed in the Remuneration Report) covered by the ANZ Remuneration Policy;
• the design of significant variable remuneration plans — for example: the ANZIP;
• the Group performance framework (objectives setting and assessment) and annual variable remuneration spend;
• performance and reward outcomes for key senior executives;
• key senior executive appointments and terminations;
• the effectiveness of the ANZ Remuneration Policy;
• succession plans for key senior executives; and
• diversity and inclusion, employee engagement, and health and safety.
More details about the role of the HR Committee, including its Charter, can be found on our website. Go to anz.com > about us > our company > corporate governance > ANZ Human Resources Committee Charter.
6. NON-EXECUTIVE DIRECTOR (NED) REMUNERATION (continued)
2017 Statutory Remuneration — NEDs
ANZ 2017 ANNUAL REPORT
54
7. REMUNERATION GOVERNANCE (continued)
Link between remuneration and risk To further reflect the importance of the link between remuneration and risk:
• the Board had two NEDs in 2017 (increasing to three in 2018) who serve on both the HR Committee and the Risk Committee;
• the HR Committee has free and unfettered access to risk and financial control personnel; and
• the HR Committee can engage independent external advisors as needed.
External advisors provided information but not recommendations Throughout the year, the HR Committee and management received information from the following external providers: Aon Hewitt, Ashurst, Ernst & Young, Mercer Consulting (Australia) Pty Ltd and PricewaterhouseCoopers. This information related to market data, market practices, legislative requirements and the interpretation of governance and regulatory requirements.
During the year, the HR Committee did not receive any remuneration recommendations from consultants about the remuneration of KMP.
ANZ employs in-house remuneration professionals who provide recommendations to the HR Committee and the Board. When doing so, they consider market information provided by external providers. The Board made its decisions independently, using the information provided and with careful regard to ANZ’s strategic objectives, risk appetite and the ANZ Remuneration Policy and principles.
7.2 INTERNAL GOVERNANCE
Hedging prohibition
All deferred equity must remain at risk until it has fully vested. Accordingly, executives and their associated persons must not enter into any schemes that specifically protect the unvested value of equity allocated. If they do so, then they forfeit the relevant equity.
Shareholding guidelines
We expect the CEO and each Disclosed Executive to, over a five year period:
• accumulate ANZ shares to the value of 200% of their fixed remuneration; and
• maintain this shareholding level while they are an executive of ANZ.
For this purpose, shareholdings include all vested, and unvested, equity that is not subject to performance hurdles.
Based on equity holdings as at 30 September 2017, the CEO and all Disclosed Executives:
• who have been with us for at least five years, meet this requirement; and
• who have been with us for less than five years, are on track to meet it.
CEO and Disclosed Executives’ Contract Terms and equity treatment
The details of the contract terms and also the equity treatment on termination (in accordance with the Conditions of Grant) relating to the CEO and Disclosed Executives are below. Although they are similar, they vary in some cases to suit different circumstances.
Type of contract Permanent ongoing employment contract.
Notice on resignation • 12 months’ by CEO;
• 6 months’ by Disclosed Executives.
Notice on termination by ANZ • 12 months’ by ANZ.
However, ANZ may immediately terminate an individual’s employment at any time in the case of serious misconduct. In that case, the individual will be entitled only to payment of fixed remuneration up to the date of termination.
How unvested equity is treated on leaving ANZ
Executives who resign or are terminated will forfeit all their unvested deferred equity — unless the Board determines otherwise.
Where an executive is terminated due to redundancy or they are classified as a 'good leaver', then:
• their deferred shares/rights are released at the original vesting date; and
• their performance rights1 are prorated for service to the full notice termination date and released at the original vesting date (if performance hurdles are met).
On an executive’s death or total and permanent disablement, their deferred equity vests.
Change of control (applicable for the CEO only)
If a change of control or other similar event occurs, then we will test the performance conditions applying to the CEO’s performance rights. They will vest to the extent that the performance conditions are satisfied.
1. Or deferred share rights granted to the CRO instead of performance rights.
REMUNERATION REPORT (continued)
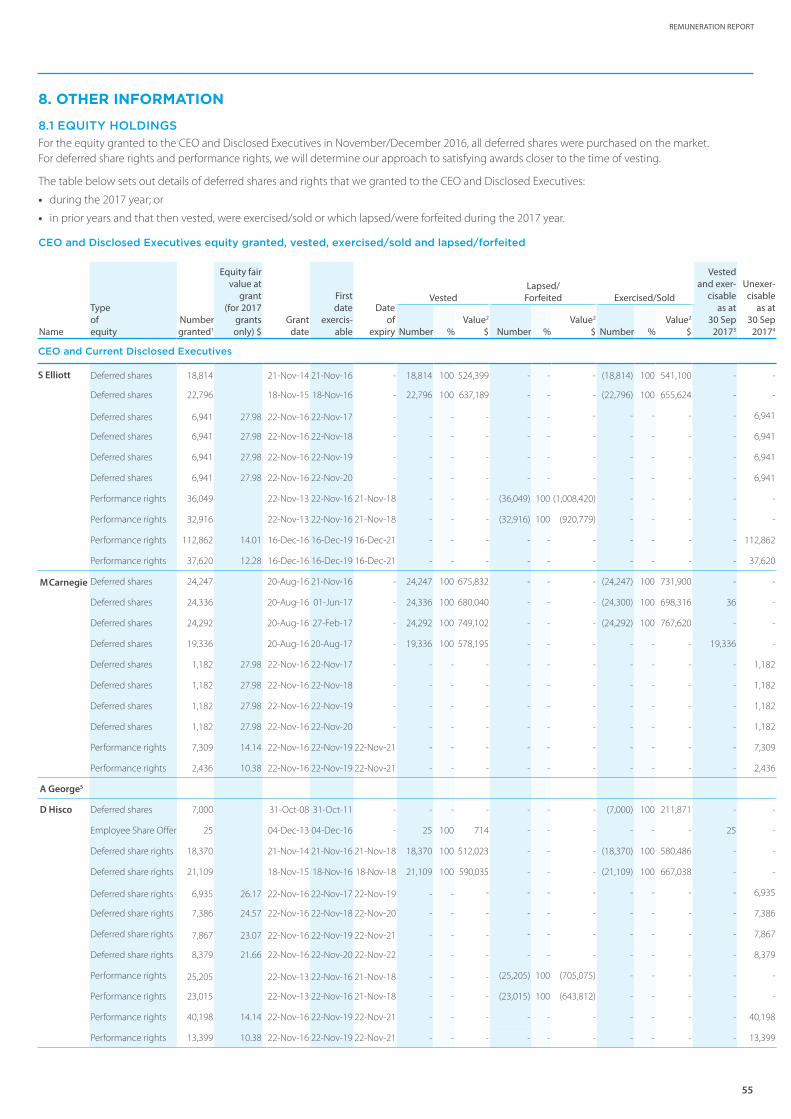
55
REMUNERATION REPORT
Name
Type of equity
Number granted1
Equity fair value at
grant (for 2017
grants only) $
Grant date
First date
exercis-able
Date of
expiry
VestedLapsed/
Forfeited Exercised/Sold
Vested and exer-
cisable as at
30 Sep 20173
Unexer-cisable
as at 30 Sep
20174Number %Value2
$ Number %Value2
$ Number %Value2
$
CEO and Current Disclosed Executives
S Elliott Deferred shares 18,814 21-Nov-14 21-Nov-16 - 18,814 100 524,399 - - - (18,814) 100 541,100 - -
Deferred shares 22,796 18-Nov-15 18-Nov-16 - 22,796 100 637,189 - - - (22,796) 100 655,624 - -
Deferred shares 6,941 27.98 22-Nov-16 22-Nov-17 - - - - - - - - - - - 6,941
Deferred shares 6,941 27.98 22-Nov-16 22-Nov-18 - - - - - - - - - - - 6,941
Deferred shares 6,941 27.98 22-Nov-16 22-Nov-19 - - - - - - - - - - - 6,941
Deferred shares 6,941 27.98 22-Nov-16 22-Nov-20 - - - - - - - - - - - 6,941
Performance rights 36,049 22-Nov-13 22-Nov-16 21-Nov-18 - - - (36,049) 100 (1,008,420) - - - - -
Performance rights 32,916 22-Nov-13 22-Nov-16 21-Nov-18 - - - (32,916) 100 (920,779) - - - - -
Performance rights 112,862 14.01 16-Dec-16 16-Dec-19 16-Dec-21 - - - - - - - - - - 112,862
Performance rights 37,620 12.28 16-Dec-16 16-Dec-19 16-Dec-21 - - - - - - - - - - 37,620
M Carnegie Deferred shares 24,247 20-Aug-16 21-Nov-16 - 24,247 100 675,832 - - - (24,247) 100 731,900 - -
Deferred shares 24,336 20-Aug-16 01-Jun-17 - 24,336 100 680,040 - - - (24,300) 100 698,316 36 -
Deferred shares 24,292 20-Aug-16 27-Feb-17 - 24,292 100 749,102 - - - (24,292) 100 767,620 - -
Deferred shares 19,336 20-Aug-16 20-Aug-17 - 19,336 100 578,195 - - - - - - 19,336 -
Deferred shares 1,182 27.98 22-Nov-16 22-Nov-17 - - - - - - - - - - - 1,182
Deferred shares 1,182 27.98 22-Nov-16 22-Nov-18 - - - - - - - - - - - 1,182
Deferred shares 1,182 27.98 22-Nov-16 22-Nov-19 - - - - - - - - - - - 1,182
Deferred shares 1,182 27.98 22-Nov-16 22-Nov-20 - - - - - - - - - - - 1,182
Performance rights 7,309 14.14 22-Nov-16 22-Nov-19 22-Nov-21 - - - - - - - - - - 7,309
Performance rights 2,436 10.38 22-Nov-16 22-Nov-19 22-Nov-21 - - - - - - - - - - 2,436
A George5
D Hisco Deferred shares 7,000 31-Oct-08 31-Oct-11 - - - - - - - (7,000) 100 211,871 - -
Employee Share Offer 25 04-Dec-13 04-Dec-16 - 25 100 714 - - - - - - 25 -
Deferred share rights 18,370 21-Nov-14 21-Nov-16 21-Nov-18 18,370 100 512,023 - - - (18,370) 100 580,486 - -
Deferred share rights 21,109 18-Nov-15 18-Nov-16 18-Nov-18 21,109 100 590,035 - - - (21,109) 100 667,038 - -
Deferred share rights 6,935 26.17 22-Nov-16 22-Nov-17 22-Nov-19 - - - - - - - - - - 6,935
Deferred share rights 7,386 24.57 22-Nov-16 22-Nov-18 22-Nov-20 - - - - - - - - - - 7,386
Deferred share rights 7,867 23.07 22-Nov-16 22-Nov-19 22-Nov-21 - - - - - - - - - - 7,867
Deferred share rights 8,379 21.66 22-Nov-16 22-Nov-20 22-Nov-22 - - - - - - - - - - 8,379
Performance rights 25,205 22-Nov-13 22-Nov-16 21-Nov-18 - - - (25,205) 100 (705,075) - - - - -
Performance rights 23,015 22-Nov-13 22-Nov-16 21-Nov-18 - - - (23,015) 100 (643,812) - - - - -
Performance rights 40,198 14.14 22-Nov-16 22-Nov-19 22-Nov-21 - - - - - - - - - - 40,198
Performance rights 13,399 10.38 22-Nov-16 22-Nov-19 22-Nov-21 - - - - - - - - - - 13,399
8. OTHER INFORMATION
8.1 EQUITY HOLDINGS
For the equity granted to the CEO and Disclosed Executives in November/December 2016, all deferred shares were purchased on the market. For deferred share rights and performance rights, we will determine our approach to satisfying awards closer to the time of vesting.
The table below sets out details of deferred shares and rights that we granted to the CEO and Disclosed Executives:
• during the 2017 year; or
• in prior years and that then vested, were exercised/sold or which lapsed/were forfeited during the 2017 year.
CEO and Disclosed Executives equity granted, vested, exercised/sold and lapsed/forfeited
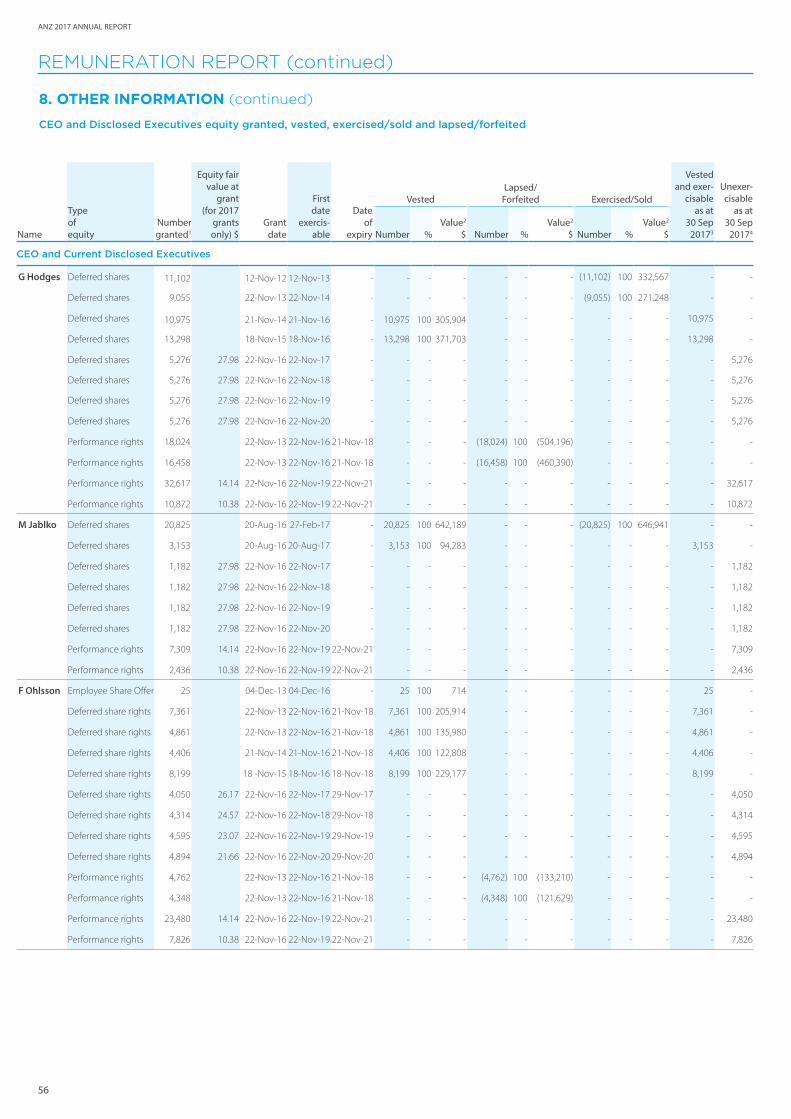
ANZ 2017 ANNUAL REPORT
56
Name
Type of equity
Number granted1
Equity fair value at
grant (for 2017
grants only) $
Grant date
First date
exercis-able
Date of
expiry
VestedLapsed/
Forfeited Exercised/Sold
Vested and exer-
cisable as at
30 Sep 20173
Unexer-cisable
as at 30 Sep
20174Number %Value2
$ Number %Value2
$ Number %Value2
$
CEO and Current Disclosed Executives
G Hodges Deferred shares 11,102 12-Nov-12 12-Nov-13 - - - - - - - (11,102) 100 332,567 - -
Deferred shares 9,055 22-Nov-13 22-Nov-14 - - - - - - - (9,055) 100 271,248 - -
Deferred shares 10,975 21-Nov-14 21-Nov-16 - 10,975 100 305,904 - - - - - - 10,975 -
Deferred shares 13,298 18-Nov-15 18-Nov-16 - 13,298 100 371,703 - - - - - - 13,298 -
Deferred shares 5,276 27.98 22-Nov-16 22-Nov-17 - - - - - - - - - - - 5,276
Deferred shares 5,276 27.98 22-Nov-16 22-Nov-18 - - - - - - - - - - - 5,276
Deferred shares 5,276 27.98 22-Nov-16 22-Nov-19 - - - - - - - - - - - 5,276
Deferred shares 5,276 27.98 22-Nov-16 22-Nov-20 - - - - - - - - - - - 5,276
Performance rights 18,024 22-Nov-13 22-Nov-16 21-Nov-18 - - - (18,024) 100 (504,196) - - - - -
Performance rights 16,458 22-Nov-13 22-Nov-16 21-Nov-18 - - - (16,458) 100 (460,390) - - - - -
Performance rights 32,617 14.14 22-Nov-16 22-Nov-19 22-Nov-21 - - - - - - - - - - 32,617
Performance rights 10,872 10.38 22-Nov-16 22-Nov-19 22-Nov-21 - - - - - - - - - - 10,872
M Jablko Deferred shares 20,825 20-Aug-16 27-Feb-17 - 20,825 100 642,189 - - - (20,825) 100 646,941 - -
Deferred shares 3,153 20-Aug-16 20-Aug-17 - 3,153 100 94,283 - - - - - - 3,153 -
Deferred shares 1,182 27.98 22-Nov-16 22-Nov-17 - - - - - - - - - - - 1,182
Deferred shares 1,182 27.98 22-Nov-16 22-Nov-18 - - - - - - - - - - - 1,182
Deferred shares 1,182 27.98 22-Nov-16 22-Nov-19 - - - - - - - - - - - 1,182
Deferred shares 1,182 27.98 22-Nov-16 22-Nov-20 - - - - - - - - - - - 1,182
Performance rights 7,309 14.14 22-Nov-16 22-Nov-19 22-Nov-21 - - - - - - - - - - 7,309
Performance rights 2,436 10.38 22-Nov-16 22-Nov-19 22-Nov-21 - - - - - - - - - - 2,436
F Ohlsson Employee Share Offer 25 04-Dec-13 04-Dec-16 - 25 100 714 - - - - - - 25 -
Deferred share rights 7,361 22-Nov-13 22-Nov-16 21-Nov-18 7,361 100 205,914 - - - - - - 7,361 -
Deferred share rights 4,861 22-Nov-13 22-Nov-16 21-Nov-18 4,861 100 135,980 - - - - - - 4,861 -
Deferred share rights 4,406 21-Nov-14 21-Nov-16 21-Nov-18 4,406 100 122,808 - - - - - - 4,406 -
Deferred share rights 8,199 18 -Nov-15 18-Nov-16 18-Nov-18 8,199 100 229,177 - - - - - - 8,199 -
Deferred share rights 4,050 26.17 22-Nov-16 22-Nov-17 29-Nov-17 - - - - - - - - - - 4,050
Deferred share rights 4,314 24.57 22-Nov-16 22-Nov-18 29-Nov-18 - - - - - - - - - - 4,314
Deferred share rights 4,595 23.07 22-Nov-16 22-Nov-19 29-Nov-19 - - - - - - - - - - 4,595
Deferred share rights 4,894 21.66 22-Nov-16 22-Nov-20 29-Nov-20 - - - - - - - - - - 4,894
Performance rights 4,762 22-Nov-13 22-Nov-16 21-Nov-18 - - - (4,762) 100 (133,210) - - - - -
Performance rights 4,348 22-Nov-13 22-Nov-16 21-Nov-18 - - - (4,348) 100 (121,629) - - - - -
Performance rights 23,480 14.14 22-Nov-16 22-Nov-19 22-Nov-21 - - - - - - - - - - 23,480
Performance rights 7,826 10.38 22-Nov-16 22-Nov-19 22-Nov-21 - - - - - - - - - - 7,826
8. OTHER INFORMATION (continued)
CEO and Disclosed Executives equity granted, vested, exercised/sold and lapsed/forfeited
REMUNERATION REPORT (continued)
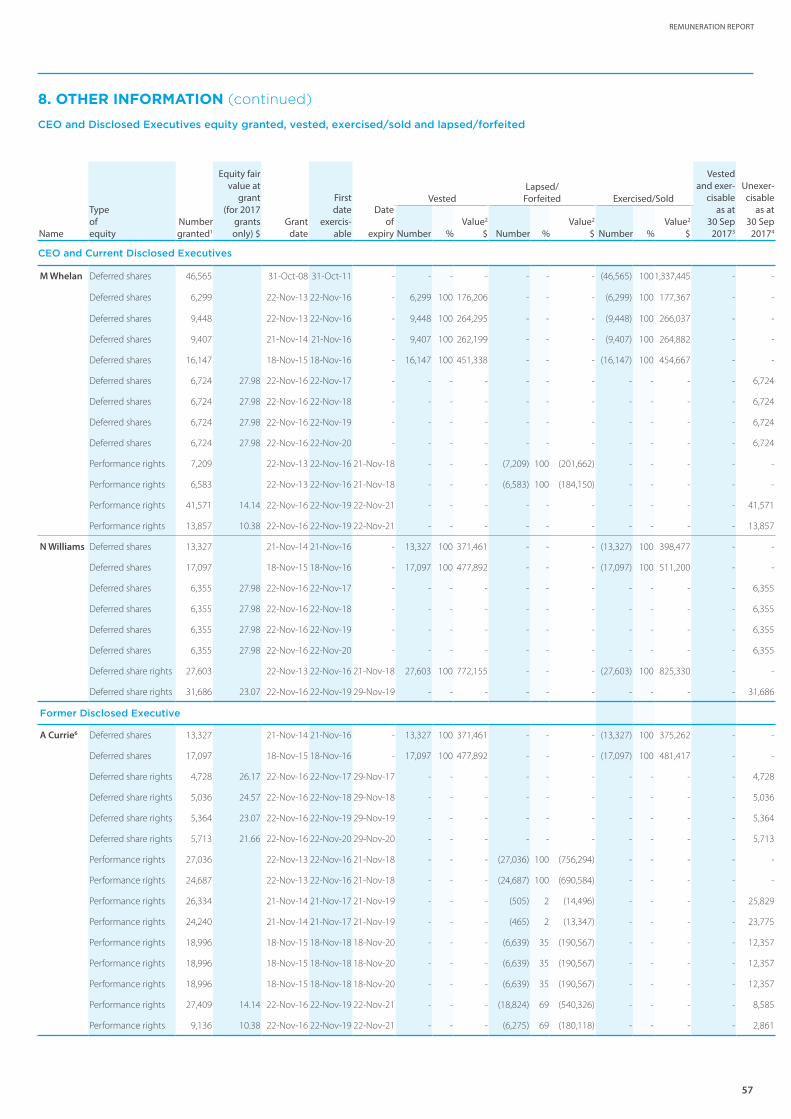
57
REMUNERATION REPORT
8. OTHER INFORMATION (continued)
CEO and Disclosed Executives equity granted, vested, exercised/sold and lapsed/forfeited
Name
Type of equity
Number granted1
Equity fair value at
grant (for 2017
grants only) $
Grant date
First date
exercis-able
Date of
expiry
VestedLapsed/
Forfeited Exercised/Sold
Vested and exer-
cisable as at
30 Sep 20173
Unexer-cisable
as at 30 Sep
20174Number %Value2
$ Number %Value2
$ Number %Value2
$
CEO and Current Disclosed Executives
M Whelan Deferred shares 46,565 31-Oct-08 31-Oct-11 - - - - - - - (46,565) 100 1,337,445 - -
Deferred shares 6,299 22-Nov-13 22-Nov-16 - 6,299 100 176,206 - - - (6,299) 100 177,367 - -
Deferred shares 9,448 22-Nov-13 22-Nov-16 - 9,448 100 264,295 - - - (9,448) 100 266,037 - -
Deferred shares 9,407 21-Nov-14 21-Nov-16 - 9,407 100 262,199 - - - (9,407) 100 264,882 - -
Deferred shares 16,147 18-Nov-15 18-Nov-16 - 16,147 100 451,338 - - - (16,147) 100 454,667 - -
Deferred shares 6,724 27.98 22-Nov-16 22-Nov-17 - - - - - - - - - - - 6,724
Deferred shares 6,724 27.98 22-Nov-16 22-Nov-18 - - - - - - - - - - - 6,724
Deferred shares 6,724 27.98 22-Nov-16 22-Nov-19 - - - - - - - - - - - 6,724
Deferred shares 6,724 27.98 22-Nov-16 22-Nov-20 - - - - - - - - - - - 6,724
Performance rights 7,209 22-Nov-13 22-Nov-16 21-Nov-18 - - - (7,209) 100 (201,662) - - - - -
Performance rights 6,583 22-Nov-13 22-Nov-16 21-Nov-18 - - - (6,583) 100 (184,150) - - - - -
Performance rights 41,571 14.14 22-Nov-16 22-Nov-19 22-Nov-21 - - - - - - - - - - 41,571
Performance rights 13,857 10.38 22-Nov-16 22-Nov-19 22-Nov-21 - - - - - - - - - - 13,857
N Williams Deferred shares 13,327 21-Nov-14 21-Nov-16 - 13,327 100 371,461 - - - (13,327) 100 398,477 - -
Deferred shares 17,097 18-Nov-15 18-Nov-16 - 17,097 100 477,892 - - - (17,097) 100 511,200 - -
Deferred shares 6,355 27.98 22-Nov-16 22-Nov-17 - - - - - - - - - - - 6,355
Deferred shares 6,355 27.98 22-Nov-16 22-Nov-18 - - - - - - - - - - - 6,355
Deferred shares 6,355 27.98 22-Nov-16 22-Nov-19 - - - - - - - - - - - 6,355
Deferred shares 6,355 27.98 22-Nov-16 22-Nov-20 - - - - - - - - - - - 6,355
Deferred share rights 27,603 22-Nov-13 22-Nov-16 21-Nov-18 27,603 100 772,155 - - - (27,603) 100 825,330 - -
Deferred share rights 31,686 23.07 22-Nov-16 22-Nov-19 29-Nov-19 - - - - - - - - - - 31,686
Former Disclosed Executive
A Currie6 Deferred shares 13,327 21-Nov-14 21-Nov-16 - 13,327 100 371,461 - - - (13,327) 100 375,262 - -
Deferred shares 17,097 18-Nov-15 18-Nov-16 - 17,097 100 477,892 - - - (17,097) 100 481,417 - -
Deferred share rights 4,728 26.17 22-Nov-16 22-Nov-17 29-Nov-17 - - - - - - - - - - 4,728
Deferred share rights 5,036 24.57 22-Nov-16 22-Nov-18 29-Nov-18 - - - - - - - - - - 5,036
Deferred share rights 5,364 23.07 22-Nov-16 22-Nov-19 29-Nov-19 - - - - - - - - - - 5,364
Deferred share rights 5,713 21.66 22-Nov-16 22-Nov-20 29-Nov-20 - - - - - - - - - - 5,713
Performance rights 27,036 22-Nov-13 22-Nov-16 21-Nov-18 - - - (27,036) 100 (756,294) - - - - -
Performance rights 24,687 22-Nov-13 22-Nov-16 21-Nov-18 - - - (24,687) 100 (690,584) - - - - -
Performance rights 26,334 21-Nov-14 21-Nov-17 21-Nov-19 - - - (505) 2 (14,496) - - - - 25,829
Performance rights 24,240 21-Nov-14 21-Nov-17 21-Nov-19 - - - (465) 2 (13,347) - - - - 23,775
Performance rights 18,996 18-Nov-15 18-Nov-18 18-Nov-20 - - - (6,639) 35 (190,567) - - - - 12,357
Performance rights 18,996 18-Nov-15 18-Nov-18 18-Nov-20 - - - (6,639) 35 (190,567) - - - - 12,357
Performance rights 18,996 18-Nov-15 18-Nov-18 18-Nov-20 - - - (6,639) 35 (190,567) - - - - 12,357
Performance rights 27,409 14.14 22-Nov-16 22-Nov-19 22-Nov-21 - - - (18,824) 69 (540,326) - - - - 8,585
Performance rights 9,136 10.38 22-Nov-16 22-Nov-19 22-Nov-21 - - - (6,275) 69 (180,118) - - - - 2,861
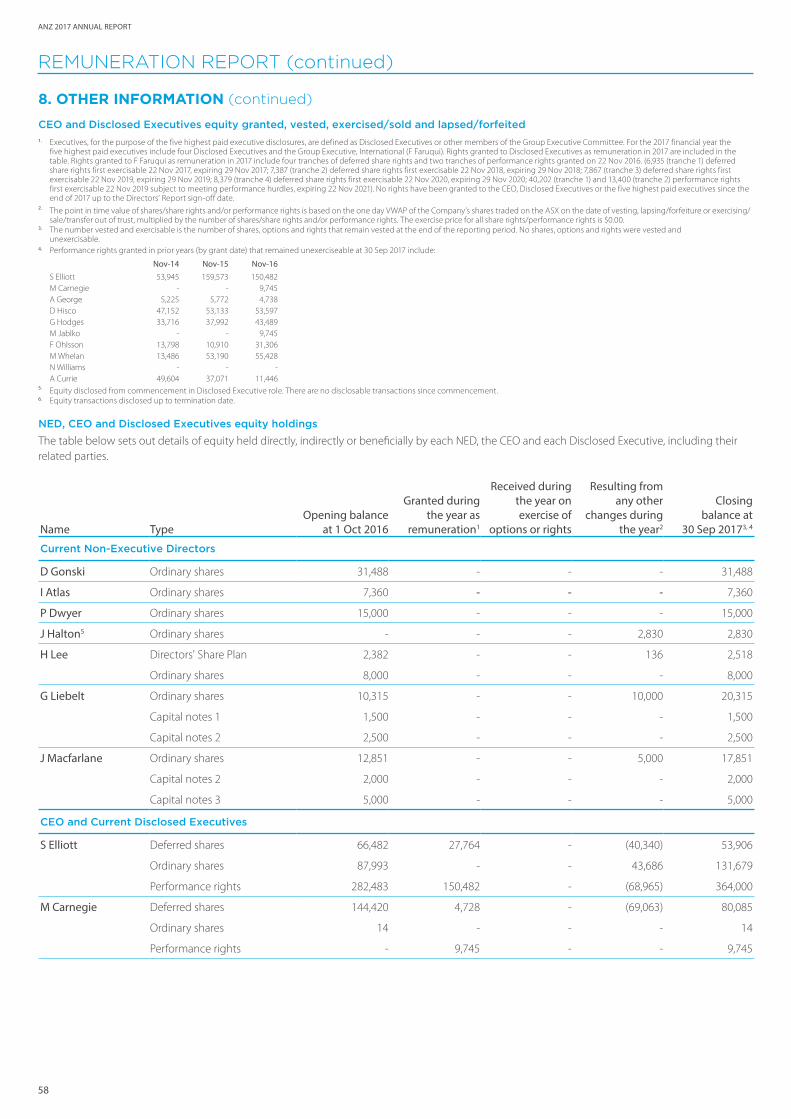
ANZ 2017 ANNUAL REPORT
58
8. OTHER INFORMATION (continued)
CEO and Disclosed Executives equity granted, vested, exercised/sold and lapsed/forfeited1. Executives, for the purpose of the five highest paid executive disclosures, are defined as Disclosed Executives or other members of the Group Executive Committee. For the 2017 financial year the
five highest paid executives include four Disclosed Executives and the Group Executive, International (F Faruqui). Rights granted to Disclosed Executives as remuneration in 2017 are included in the table. Rights granted to F Faruqui as remuneration in 2017 include four tranches of deferred share rights and two tranches of performance rights granted on 22 Nov 2016. (6,935 (tranche 1) deferred share rights first exercisable 22 Nov 2017, expiring 29 Nov 2017; 7,387 (tranche 2) deferred share rights first exercisable 22 Nov 2018, expiring 29 Nov 2018; 7,867 (tranche 3) deferred share rights first exercisable 22 Nov 2019, expiring 29 Nov 2019; 8,379 (tranche 4) deferred share rights first exercisable 22 Nov 2020, expiring 29 Nov 2020; 40,202 (tranche 1) and 13,400 (tranche 2) performance rights first exercisable 22 Nov 2019 subject to meeting performance hurdles, expiring 22 Nov 2021). No rights have been granted to the CEO, Disclosed Executives or the five highest paid executives since the end of 2017 up to the Directors' Report sign-off date.
2. The point in time value of shares/share rights and/or performance rights is based on the one day VWAP of the Company’s shares traded on the ASX on the date of vesting, lapsing/forfeiture or exercising/sale/transfer out of trust, multiplied by the number of shares/share rights and/or performance rights. The exercise price for all share rights/performance rights is $0.00.
3. The number vested and exercisable is the number of shares, options and rights that remain vested at the end of the reporting period. No shares, options and rights were vested and unexercisable.
4. Performance rights granted in prior years (by grant date) that remained unexerciseable at 30 Sep 2017 include:
Nov-14 Nov-15 Nov-16S Elliott 53,945 159,573 150,482M Carnegie - - 9,745A George 5,225 5,772 4,738D Hisco 47,152 53,133 53,597G Hodges 33,716 37,992 43,489M Jablko - - 9,745F Ohlsson 13,798 10,910 31,306M Whelan 13,486 53,190 55,428N Williams - - -A Currie 49,604 37,071 11,446
5. Equity disclosed from commencement in Disclosed Executive role. There are no disclosable transactions since commencement.6. Equity transactions disclosed up to termination date.
NED, CEO and Disclosed Executives equity holdings
The table below sets out details of equity held directly, indirectly or beneficially by each NED, the CEO and each Disclosed Executive, including their related parties.
Name TypeOpening balance
at 1 Oct 2016
Granted during the year as
remuneration1
Received during the year on exercise of
options or rights
Resulting from any other
changes during the year2
Closing balance at
30 Sep 20173, 4
Current Non-Executive Directors
D Gonski Ordinary shares 31,488 - - - 31,488
I Atlas Ordinary shares 7,360 - - - 7,360
P Dwyer Ordinary shares 15,000 - - - 15,000
J Halton5 Ordinary shares - - - 2,830 2,830
H Lee Directors' Share Plan 2,382 - - 136 2,518
Ordinary shares 8,000 - - - 8,000
G Liebelt Ordinary shares 10,315 - - 10,000 20,315
Capital notes 1 1,500 - - - 1,500
Capital notes 2 2,500 - - - 2,500
J Macfarlane Ordinary shares 12,851 - - 5,000 17,851
Capital notes 2 2,000 - - - 2,000
Capital notes 3 5,000 - - - 5,000
CEO and Current Disclosed Executives
S Elliott Deferred shares 66,482 27,764 - (40,340) 53,906
Ordinary shares 87,993 - - 43,686 131,679
Performance rights 282,483 150,482 - (68,965) 364,000
M Carnegie Deferred shares 144,420 4,728 - (69,063) 80,085
Ordinary shares 14 - - - 14
Performance rights - 9,745 - - 9,745
REMUNERATION REPORT (continued)

59
REMUNERATION REPORT
8. OTHER INFORMATION (continued)
NED, CEO and Disclosed Executive equity holdings
Name TypeOpening balance
at 1 Oct 2016
Granted during the year as
remuneration1
Received during the year on exercise of
options or rights
Resulting from any other
changes during the year2
Closing balance at
30 Sep 20173, 4
CEO and Current Disclosed Executives
A George5 Deferred shares 29,438 - - 1,188 30,626
Ordinary shares 2,678 - - - 2,678
Capital notes 1 802 - - - 802
Performance rights 15,735 - - - 15,735
D Hisco Deferred shares 7,000 - - (7,000) -
Employee Share Offer 74 - - - 74
Ordinary shares 211,178 - 39,479 (55,000) 195,657
Deferred share rights 61,906 30,567 (39,479) - 52,994
Performance rights 148,505 53,597 - (48,220) 153,882
G Hodges Deferred shares 208,692 21,104 - (24,170) 205,626
Capital notes 4 1,350 - - - 1,350
Ordinary shares 70,639 - - - 70,639
Performance rights 106,190 43,489 - (34,482) 115,197
M Jablko Deferred shares 62,176 4,728 - (20,335) 46,569
Performance rights - 9,745 - - 9,745
F Ohlsson Employee Share Offer 74 - - - 74
Deferred share rights 45,718 17,853 - - 63,571
Performance rights 33,818 31,306 - (9,110) 56,014
M Whelan Deferred shares 112,715 26,896 - (87,813) 51,798
Performance rights 80,468 55,428 - (13,792) 122,104
N Williams Deferred shares 50,525 25,420 - (30,772) 45,173
Ordinary shares - - 27,603 (27,603) -
Deferred share rights 88,920 31,686 (27,603) - 93,003
Former Non-Executive Director
I Macfarlane6 Ordinary shares 18,183 - - - 18,183
Capital notes 1 1,500 - - - 1,500
Capital notes 4 1,000 - - 500 1,500
Convertible preference shares (CPS3)
1,000 - - - 1,000
Former Disclosed Executive
A Currie6 Deferred shares 50,463 - - (31,418) 19,045
Ordinary shares 1,042 - - - 1,042
Deferred share rights - 20,841 - - 20,841
Performance rights 159,285 36,545 - (97,709) 98,121
1. Details of options/rights granted as remuneration during 2017 are provided in the previous table.2. Shares resulting from any other changes during the year include the net result of any shares purchased (including under the ANZ Share Purchase Plan), forfeited, sold or acquired under the Dividend
Reinvestment Plan.3. The following shares (included in the holdings above) were held on behalf of the NEDs, CEO and Disclosed Executives (i.e. indirect beneficially held shares) as at 30 September 2017: D Gonski - 31,488,
I Atlas - 7,360, P Dwyer - 15,000, J Halton - 0, H Lee - 2,518, G Liebelt - 24,315, J Macfarlane - 24,851, S Elliott - 185,585, M Carnegie - 80,085, A George - 34,106, D Hisco - 106,074, G Hodges - 249,711, M Jablko - 46,569, F Ohlsson - 74, M Whelan - 51,798, N Williams - 45,173, I Macfarlane - 22,183 and A Currie - 19,045.
4. No options/rights were vested and exercisable as at 30 September 2017, except for 24,827 deferred share rights for F Ohlsson. No options/rights were vested and unexerciseable as at 30 September 2017. There was no change in the balance as at the Directors' Report sign-off date, except for 188,638 ordinary shares for D Hisco.
5. Commencing balance is based on holdings as at the date of commencement in a KMP role.6. Concluding balance is based on holdings as at the date of retirement/termination.
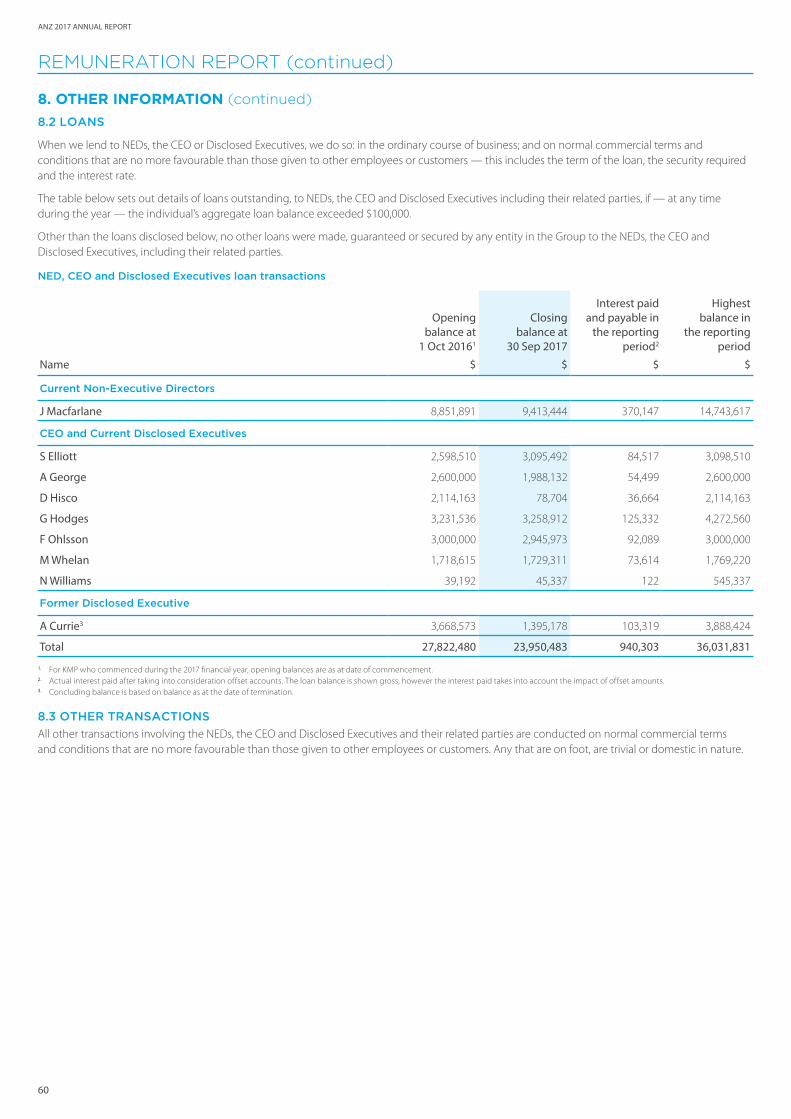
ANZ 2017 ANNUAL REPORT
60
8. OTHER INFORMATION (continued)
8.2 LOANS
When we lend to NEDs, the CEO or Disclosed Executives, we do so: in the ordinary course of business; and on normal commercial terms and conditions that are no more favourable than those given to other employees or customers — this includes the term of the loan, the security required and the interest rate.
The table below sets out details of loans outstanding, to NEDs, the CEO and Disclosed Executives including their related parties, if — at any time during the year — the individual’s aggregate loan balance exceeded $100,000.
Other than the loans disclosed below, no other loans were made, guaranteed or secured by any entity in the Group to the NEDs, the CEO and Disclosed Executives, including their related parties.
NED, CEO and Disclosed Executives loan transactions
Name
Opening balance at
1 Oct 20161
$
Closing balance at
30 Sep 2017
$
Interest paid and payable in
the reporting period2
$
Highest balance in
the reporting period
$
Current Non-Executive Directors
J Macfarlane 8,851,891 9,413,444 370,147 14,743,617
CEO and Current Disclosed Executives
S Elliott 2,598,510 3,095,492 84,517 3,098,510
A George 2,600,000 1,988,132 54,499 2,600,000
D Hisco 2,114,163 78,704 36,664 2,114,163
G Hodges 3,231,536 3,258,912 125,332 4,272,560
F Ohlsson 3,000,000 2,945,973 92,089 3,000,000
M Whelan 1,718,615 1,729,311 73,614 1,769,220
N Williams 39,192 45,337 122 545,337
Former Disclosed Executive
A Currie3 3,668,573 1,395,178 103,319 3,888,424
Total 27,822,480 23,950,483 940,303 36,031,831
1. For KMP who commenced during the 2017 financial year, opening balances are as at date of commencement. 2. Actual interest paid after taking into consideration offset accounts. The loan balance is shown gross, however the interest paid takes into account the impact of offset amounts.3. Concluding balance is based on balance as at the date of termination.
8.3 OTHER TRANSACTIONS
All other transactions involving the NEDs, the CEO and Disclosed Executives and their related parties are conducted on normal commercial terms and conditions that are no more favourable than those given to other employees or customers. Any that are on foot, are trivial or domestic in nature.
REMUNERATION REPORT (continued)

REMUNERATION REPORT
61
ANZ Centre foyer
62
ANZ 2017 ANNUAL REPORT
The Directors’ Report for the financial year ended 30 September 2017 has been prepared in accordance with the requirements of the Corporations Act 2001. The information below forms part of this Directors’ Report:
• Principal activities on page 11
• Operating and financial review on pages 14 to 23
• Dividends on page 17
• Information on the Directors, Company Secretaries and Directors’ meetings on pages 24 to 32
• Remuneration report on pages 36 to 61
Significant changes in state of affairs
There have been no significant changes in the Group’s state of affairs.
Events since the end of the financial year
On 17 October 2017, the Group announced it had agreed to sell OnePath pensions and investments (OnePath P&I) and aligned dealer groups (ADG) business to IOOF Holdings Limited (IOOF) for $975 million. Completion is expected in March 2019 half subject to certain conditions including regulatory approvals and the completion of the extraction of the OnePath P&I business from OnePath Life Insurance. An expected accounting loss on sale of ~$120 million is anticipated as a result of the sale, however the final gain/loss on sale will be determined at completion and will be impacted by transaction and separation costs, final determination of goodwill to be disposed, other balances and final taxation impacts.
On 18 October 2017, the Group announced it had entered into an agreement with its joint venture partner Metropolitan Bank & Trust Company (Metrobank) regarding the sale of its 40% stake in the Philippines based Metrobank Card Corporation (MCC). The Group has agreed to sell one half of its 40% stake in MCC to Metrobank, for US$144 million (A$184 million) expected to settle in late 2017. The Group also entered into a put option to sell its remaining 20% stake to Metrobank, exercisable in the September 2018 half on the same terms and for the same consideration. If exercised, this would deliver a total sale price of US$288 million (A$368 million). The sale is subject to customary regulatory approvals.
On 23 October 2017, the Group announced it had reached a confidential in-principle agreement with the Australian Securities and Investments Commission (ASIC) to settle court action in respect of interbank trading and the bank bill swap rate (BBSW). On 30 October 2017, ANZ informed the Court that agreement with ASIC had been concluded. By consent of ASIC and ANZ, the Court referred it for a hearing on penalty approval on 10 November 2017. The financial impact to ANZ has been reflected in the financial statements.
Other than the matters above, there have been no significant events from 30 September 2017 to the date of signing this report.
Political donations
The Board has agreed that ANZ will donate $150,000 to each of the Liberal Party of Australia and the Australian Labor Party during the 2017 calendar year. All political donations are reviewed and approved by the Board, and the matter is annually reviewed.
Environmental Regulation
ANZ recognises the expectations of its stakeholders – customers, shareholders, staff and the community – to operate in a way that mitigates its environmental impact.
In Australia, ANZ meets the requirements of the National Greenhouse and Energy Reporting Act 2007 (Cth), which imposes reporting obligations where energy production, usage or greenhouse gas emissions trigger specified thresholds.
ANZ holds a licence under the Water Act 1989 (Vic), allowing it to extract water from the Yarra River for thermal regulation of its Melbourne head office building. The licence specifies daily and annual limits for the extraction of water from the Yarra River with which ANZ fully complies. The extraction of river water reduces reliance on the high quality potable water supply and is one of several environmental initiatives that ANZ has introduced at its Melbourne head office building.
The Group does not believe that its operations are subject to any particular and significant environmental regulation under a law of the Commonwealth of Australia or of an Australian State or Territory. It may become subject to environmental regulation as a result of its lending activities in the ordinary course of business and has developed policies to identify and manage such environmental matters.
Having made due enquiry, and to the best of ANZ’s knowledge, no entity of the Group has incurred any material environmental liability during the year.
Further details of ANZ’s environmental performance, including progress against its targets and details of its emissions profile, are available on anz.com>About us>Corporate Sustainability.
Corporate Governance Statement
ANZ is committed to maintaining a high standard in its governance framework. ANZ confirms it has followed the ASX Corporate Governance Council’s Corporate Governance Principles and Recommendations (3rd edition) (ASX Governance Principles) during the 2017 financial year. ANZ’s Corporate Governance Statement, together with the ASX Appendix 4G which relates to the Corporate Governance Statement, can be viewed at anz.com/CorporateGovernance and has been lodged with the ASX.
As an overseas listed issuer on the NZX, ANZ is deemed to comply with the NZX Listing Rules provided that it remains listed on the ASX, complies with the ASX Listing Rules and provides the NZX with all the information and notices that it provides to the ASX. ANZ met those requirements during the year.
The ASX Governance Principles may materially differ from the NZX’s corporate governance rules and the principles of the NZX’s Corporate Governance Code. More information about the corporate governance rules and principles of the ASX can be found at asx.com and, in respect of the NZX, at nzx.com.
Pillar 3 information
ANZ provides information required by APS 330: Public Disclosure in the Regulatory Disclosures section at shareholder.anz.com/pages/regulatory-disclosure.
DIRECTORS' REPORT
63
DIRECTORS’ REPORT
Non-audit services
The Group’s Stakeholder Engagement Model for Relationship with the External Auditor (the Policy), which incorporates requirements of the Corporations Act 2001 and industry best practice, prevents the external auditor from providing services that are perceived to be in conflict with the role of the external auditor or breach independence requirements. This includes consulting advice and sub-contracting of operational activities normally undertaken by management, and engagements where the external auditor may ultimately be required to express an opinion on its own work.
Specifically the Policy:
• limits the scope of non-audit services that may be provided;
• requires that audit, audit-related and permitted non-audit services be considered in light of independence requirements and for any potential conflicts of interest before they are approved by the Audit Committee, or approved by the Chair of the Audit Committee (or delegate) and notified to the Audit Committee; and
• requires pre-approval before the external auditor can commence any engagement for the Group.
Further details about the Policy can be found in the Corporate Governance Statement.
The external auditor has confirmed to the Audit Committee that it has:
• implemented procedures to ensure it complies with independence rules in applicable jurisdictions, including Australia and the United States; and
• complied with applicable policies and regulations regarding the provision of non-audit services including those applicable in Australia, those prescribed by the US Securities and Exchange Commission, and the Policy.
The Audit Committee has reviewed the non-audit services provided by the external auditor during financial year 2017, and has confirmed that the provision of these services is consistent with the Policy, compatible with the general standard of independence for auditors imposed by the Corporations Act 2001 and did not compromise the auditor independence requirements of the Corporations Act 2001. This has been formally advised by the Audit Committee to the Board of Directors.
The categories of non-audit services supplied to the Group during the year ended 30 September 2017 by the external auditor, KPMG, or by another person or firm on KPMG’s behalf, and the amounts paid or payable (including GST) by the Group are as follows:
Amount paid/payable$’000
Non-audit services 2017 2016
General market or regulatory insights 91 -
Training related services 8 368
Controls related assessments 165 137
Methodology and procedural reviews 478 52
Total 742 557
Further details on the compensation paid to KPMG is provided in Note 34 Compensation of Auditors to the financial statements including details of audit-related services provided during the year of $6.17 million (2016: $5.68 million).
For the reasons set out above, the Directors are satisfied that the provision of non-audit services by the external auditor during the year ended 30 September 2017 is compatible with the general standard of independence for external auditors imposed by the Corporations Act 2001 and did not compromise the auditor independence requirements of the Corporations Act 2001.
Directors’ and Officers’ indemnity
The Company’s Constitution (Rule 11.1) permits the Company to:
• indemnify any officer or employee of the Company, against liabilities (so far as may be permitted under applicable law) incurred as such by an officer or employee, including liabilities incurred as a result of appointment or nomination by the Company as a trustee or as an officer or employee of another corporation; and
• make payments in respect of legal costs incurred by an officer or employee in defending an action for a liability incurred as such by an officer, employee or in resisting or responding to actions taken by a government agency, a duly constituted Royal Commission or other official inquiry, a liquidator, administrator, trustee in bankruptcy or other authorised official.
It is the Company’s policy that its employees should be protected from any liability they incur as a result of acting in the course of their employment, subject to appropriate conditions.
Under the policy, the Company will indemnify employees and former employees against any liability they incur to any third party as a result of acting in the course of their employment with the Company or a subsidiary of the Company and this extends to liability incurred as a result of their appointment/nomination by or at the request of the Group as an officer or employee of another corporation or body or as trustee.
The indemnity is subject to applicable law and in addition will not apply to liability arising from:
• serious misconduct, gross negligence or lack of good faith;
• illegal, dishonest or fraudulent conduct; or
• material non-compliance with the Company’s policies, processes or discretions.
The Company has entered into Indemnity Deeds with each of its Directors, with certain secretaries and former Directors of the Company, and with certain employees and other individuals who act as directors or officers of related bodies corporate or of another company, to indemnify them against liabilities and legal costs of the kind mentioned in the Company’s constitution. In accordance with Mr Elliott’s Deed, the Company has paid legal expenses incurred by the Company, Mr Elliott and another executive in defending defamation proceedings brought against them by a third party. The proceedings have been resolved with no payment by the Company on behalf of Mr Elliott or the other executive.
64
ANZ 2017 ANNUAL REPORT
During the financial year, the Company has paid premiums for insurance for the benefit of the directors and employees of the Company and related bodies corporate of the Company. In accordance with common commercial practice, the insurance prohibits disclosure of the nature of the liability insured against and the amount of the premium.
Key management personnel and employee share and option plans
The Remuneration Report contains details of Non-executive Directors, Chief Executive Officer and Disclosed Executives equity holdings and options/rights issued during the 2017 financial year and as at the date of this report.
Note 31 Employee Share and Option Plans to the 2017 Financial Report contains details of the 2017 financial year and as at the date of this report:
• Options/rights issued over shares granted to employees;
• Shares issued as a result of the exercise of options/rights granted to employees; and
• Other details about share options/rights issued, including any rights to participate in any share issues of the Company.
The names of all persons who currently hold options/rights are entered in the register kept by the Company pursuant to section 170 of the Corporations Act 2001. This register may be inspected free of charge.
Rounding of amounts
The Company is a company of the kind referred to in Australian Securities and Investments Commission Corporations (Rounding in Financial/Directors’ Reports) Instrument 2016/191 dated 24 March 2016 and, in accordance with that Instrument, amounts in the consolidated financial statements and this Directors’ Report have been rounded to the nearest million dollars unless specifically stated otherwise.
This report is made in accordance with a resolution of the Board of Directors and is signed for and on behalf of the Directors.
David M Gonski, AC Shayne Elliott Chairman Director
2 November 2017
Lead Auditor’s Independence Declaration
The Lead Auditors Independence Declaration given under Section 307C of the Corporations Act 2001 is set out below and forms part of the Directors Report for the year ended 30 September 2017.
To: the Directors of Australia and New Zealand Banking Group Limited I declare that, to the best of my knowledge and belief, in relation to the audit for the financial year ended 30 September 2017, there have been:
• no contraventions of the auditor independence requirements as set out in the Corporations Act 2001 in relation to the audit; and
• no contraventions of any applicable code of professional conduct in relation to the audit.
KPMG Alison Kitchen Partner
2 November 2017
DIRECTORS’ REPORT (continued)
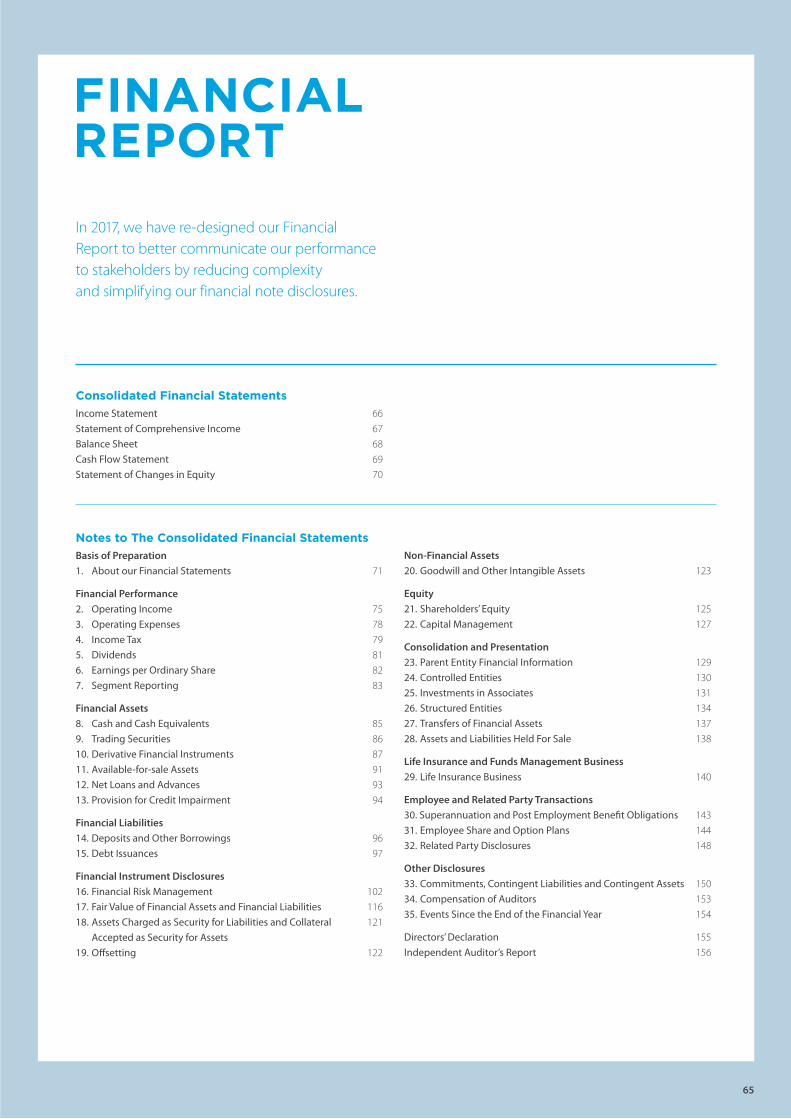
FINANCIAL REPORT
Consolidated Financial StatementsIncome Statement 66
Statement of Comprehensive Income 67
Balance Sheet 68
Cash Flow Statement 69
Statement of Changes in Equity 70
Basis of Preparation 1. About our Financial Statements 71
Financial Performance
2. Operating Income 75
3. Operating Expenses 78
4. Income Tax 79
5. Dividends 81
6. Earnings per Ordinary Share 82
7. Segment Reporting 83
Financial Assets
8. Cash and Cash Equivalents 85
9. Trading Securities 86
10. Derivative Financial Instruments 87
11. Available-for-sale Assets 91
12. Net Loans and Advances 93
13. Provision for Credit Impairment 94
Financial Liabilities
14. Deposits and Other Borrowings 96
15. Debt Issuances 97
Financial Instrument Disclosures
16. Financial Risk Management 102
17. Fair Value of Financial Assets and Financial Liabilities 116
18. Assets Charged as Security for Liabilities and Collateral 121
Accepted as Security for Assets
19. Offsetting 122
Non-Financial Assets
20. Goodwill and Other Intangible Assets 123
Equity
21. Shareholders’ Equity 125
22. Capital Management 127
Consolidation and Presentation
23. Parent Entity Financial Information 129
24. Controlled Entities 130
25. Investments in Associates 131
26. Structured Entities 134
27. Transfers of Financial Assets 137
28. Assets and Liabilities Held For Sale 138
Life Insurance and Funds Management Business
29. Life Insurance Business 140
Employee and Related Party Transactions
30. Superannuation and Post Employment Benefit Obligations 143
31. Employee Share and Option Plans 144
32. Related Party Disclosures 148
Other Disclosures
33. Commitments, Contingent Liabilities and Contingent Assets 150
34. Compensation of Auditors 153
35. Events Since the End of the Financial Year 154
Directors’ Declaration 155
Independent Auditor’s Report 156
Notes to The Consolidated Financial Statements
In 2017, we have re-designed our Financial Report to better communicate our performance to stakeholders by reducing complexity and simplifying our financial note disclosures.
65
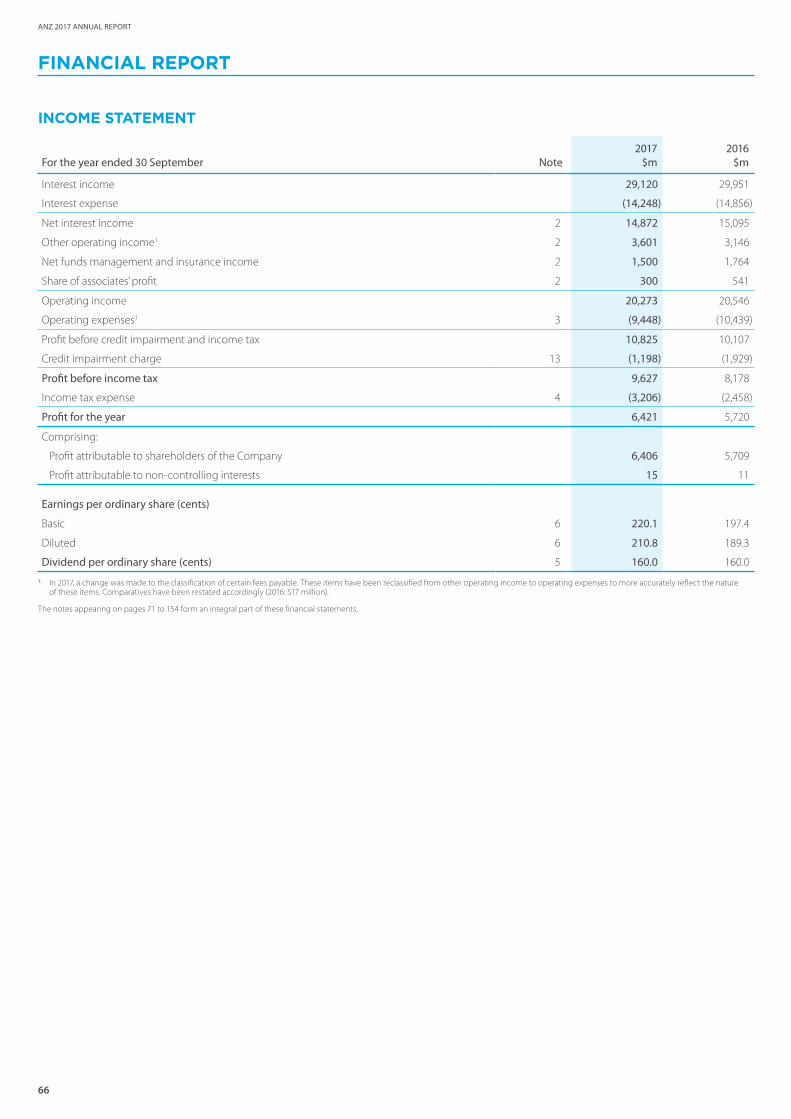
66
ANZ 2017 ANNUAL REPORT
FINANCIAL REPORT
INCOME STATEMENT
For the year ended 30 September Note2017 2016
$m $m
Interest income 29,120 29,951
Interest expense (14,248) (14,856)
Net interest income 2 14,872 15,095
Other operating income1 2 3,601 3,146
Net funds management and insurance income 2 1,500 1,764
Share of associates’ profit 2 300 541
Operating income 20,273 20,546
Operating expenses1 3 (9,448) (10,439)
Profit before credit impairment and income tax 10,825 10,107
Credit impairment charge 13 (1,198) (1,929)
Profit before income tax 9,627 8,178
Income tax expense 4 (3,206) (2,458)
Profit for the year 6,421 5,720
Comprising:
Profit attributable to shareholders of the Company 6,406 5,709
Profit attributable to non-controlling interests 15 11
Earnings per ordinary share (cents)
Basic 6 220.1 197.4
Diluted 6 210.8 189.3
Dividend per ordinary share (cents) 5 160.0 160.0
1. In 2017, a change was made to the classification of certain fees payable. These items have been reclassified from other operating income to operating expenses to more accurately reflect the nature of these items. Comparatives have been restated accordingly (2016: $17 million).
The notes appearing on pages 71 to 154 form an integral part of these financial statements.
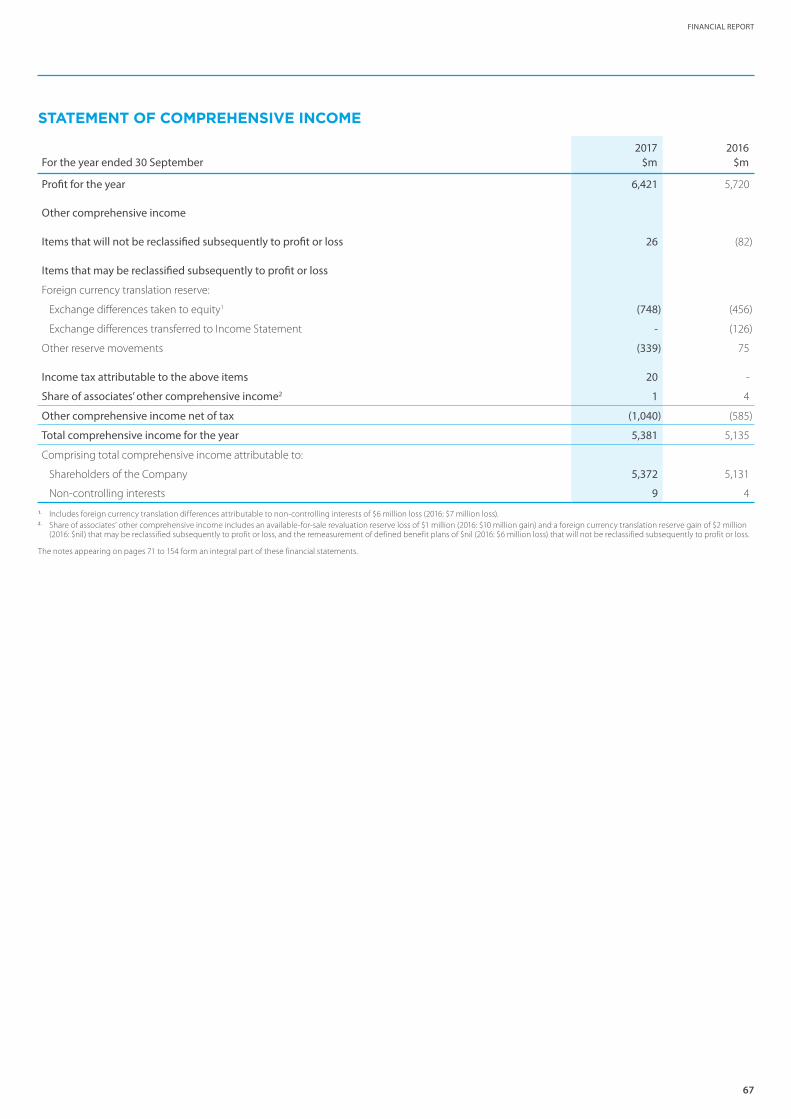
67
FINANCIAL REPORT
STATEMENT OF COMPREHENSIVE INCOME
For the year ended 30 September2017 2016
$m $m
Profit for the year 6,421 5,720
Other comprehensive income
Items that will not be reclassified subsequently to profit or loss 26 (82)
Items that may be reclassified subsequently to profit or loss
Foreign currency translation reserve:
Exchange differences taken to equity1 (748) (456)
Exchange differences transferred to Income Statement - (126)
Other reserve movements (339) 75
Income tax attributable to the above items 20 -
Share of associates’ other comprehensive income2 1 4
Other comprehensive income net of tax (1,040) (585)
Total comprehensive income for the year 5,381 5,135
Comprising total comprehensive income attributable to:
Shareholders of the Company 5,372 5,131
Non-controlling interests 9 4
1. Includes foreign currency translation differences attributable to non-controlling interests of $6 million loss (2016: $7 million loss).2. Share of associates’ other comprehensive income includes an available-for-sale revaluation reserve loss of $1 million (2016: $10 million gain) and a foreign currency translation reserve gain of $2 million
(2016: $nil) that may be reclassified subsequently to profit or loss, and the remeasurement of defined benefit plans of $nil (2016: $6 million loss) that will not be reclassified subsequently to profit or loss.
The notes appearing on pages 71 to 154 form an integral part of these financial statements.

68
ANZ 2017 ANNUAL REPORT
FINANCIAL REPORT (continued)
BALANCE SHEET
As at 30 September2017 2016
Note $m $m
Assets
Cash and cash equivalents 8 68,048 66,220
Settlement balances owed to ANZ 5,504 4,406
Collateral paid 8,987 12,723
Trading securities 9 43,605 47,188
Derivative financial instruments 10 62,518 87,496
Available-for-sale assets 11 69,384 63,113
Net loans and advances 12 574,331 575,852
Regulatory deposits 2,015 2,296
Assets held for sale 28 7,970 -
Investments in associates 25 2,248 4,272
Current tax assets 30 126
Deferred tax assets 675 623
Goodwill and other intangible assets 20 6,970 7,672
Investments backing policy liabilities 29 37,964 35,656
Premises and equipment 1,965 2,205
Other assets 5,112 5,021
Total assets 897,326 914,869
Liabilities
Settlement balances owed by ANZ 9,914 10,625
Collateral received 5,919 6,386
Deposits and other borrowings 14 595,611 588,195
Derivative financial instruments 10 62,252 88,725
Current tax liabilities 241 188
Deferred tax liabilities 257 227
Liabilities held for sale 28 4,693 -
Policy liabilities 29 37,448 36,145
External unit holder liabilities (life insurance funds) 4,435 3,333
Payables and other liabilities 8,350 8,865
Employee entitlements 530 543
Other provisions 628 666
Debt issuances 15 107,973 113,044
Total liabilities 838,251 856,942
Net assets 59,075 57,927
Shareholders' equity
Ordinary share capital 21 29,088 28,765
Reserves 21 37 1,078
Retained earnings 21 29,834 27,975
Share capital and reserves attributable to shareholders of the Company 58,959 57,818
Non-controlling interests 21 116 109
Total shareholders' equity 59,075 57,927
The notes appearing on pages 71 to 154 form an integral part of these financial statements.
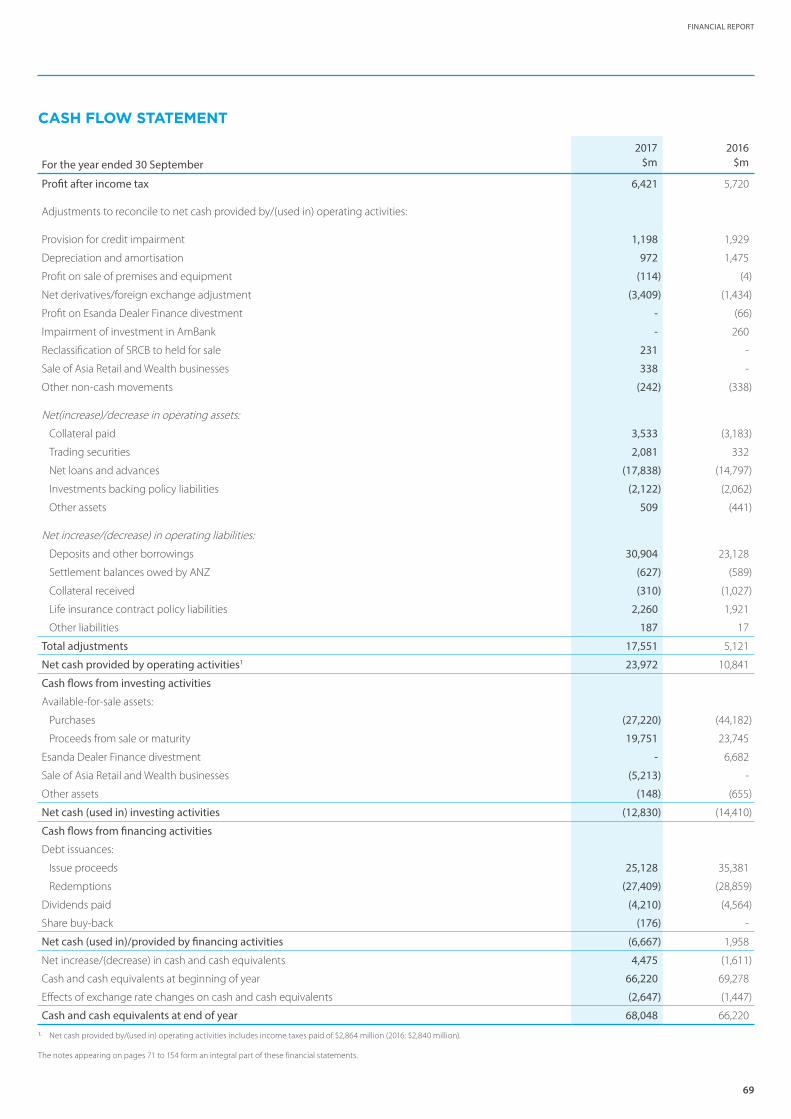
69
FINANCIAL REPORT
CASH FLOW STATEMENT
For the year ended 30 September2017 2016
$m $m
Profit after income tax 6,421 5,720
Adjustments to reconcile to net cash provided by/(used in) operating activities:
Provision for credit impairment 1,198 1,929
Depreciation and amortisation 972 1,475
Profit on sale of premises and equipment (114) (4)
Net derivatives/foreign exchange adjustment (3,409) (1,434)
Profit on Esanda Dealer Finance divestment - (66)
Impairment of investment in AmBank - 260
Reclassification of SRCB to held for sale 231 -
Sale of Asia Retail and Wealth businesses 338 -
Other non-cash movements (242) (338)
Net(increase)/decrease in operating assets:
Collateral paid 3,533 (3,183)
Trading securities 2,081 332
Net loans and advances (17,838) (14,797)
Investments backing policy liabilities (2,122) (2,062)
Other assets 509 (441)
Net increase/(decrease) in operating liabilities:
Deposits and other borrowings 30,904 23,128
Settlement balances owed by ANZ (627) (589)
Collateral received (310) (1,027)
Life insurance contract policy liabilities 2,260 1,921
Other liabilities 187 17
Total adjustments 17,551 5,121
Net cash provided by operating activities1 23,972 10,841
Cash flows from investing activities
Available-for-sale assets:
Purchases (27,220) (44,182)
Proceeds from sale or maturity 19,751 23,745
Esanda Dealer Finance divestment - 6,682
Sale of Asia Retail and Wealth businesses (5,213) -
Other assets (148) (655)
Net cash (used in) investing activities (12,830) (14,410)
Cash flows from financing activities
Debt issuances:
Issue proceeds 25,128 35,381
Redemptions (27,409) (28,859)
Dividends paid (4,210) (4,564)
Share buy-back (176) -
Net cash (used in)/provided by financing activities (6,667) 1,958
Net increase/(decrease) in cash and cash equivalents 4,475 (1,611)
Cash and cash equivalents at beginning of year 66,220 69,278
Effects of exchange rate changes on cash and cash equivalents (2,647) (1,447)
Cash and cash equivalents at end of year 68,048 66,2201. Net cash provided by/(used in) operating activities includes income taxes paid of $2,864 million (2016: $2,840 million).
The notes appearing on pages 71 to 154 form an integral part of these financial statements.
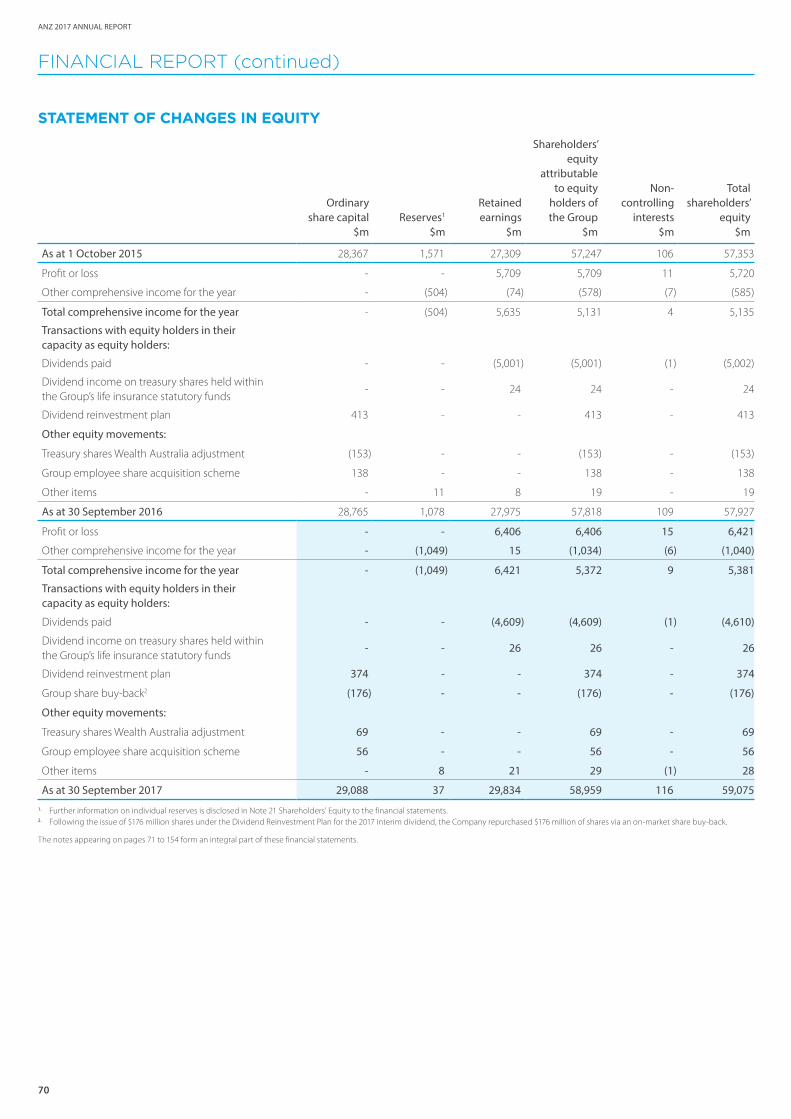
70
ANZ 2017 ANNUAL REPORT
FINANCIAL REPORT (continued)
STATEMENT OF CHANGES IN EQUITY
Ordinaryshare capital
$mReserves1
$m
Retained earnings
$m
Shareholders’ equity
attributable to equity
holders of the Group
$m
Non-controlling
interests$m
Totalshareholders’
equity$m
As at 1 October 2015 28,367 1,571 27,309 57,247 106 57,353
Profit or loss - - 5,709 5,709 11 5,720
Other comprehensive income for the year - (504) (74) (578) (7) (585)
Total comprehensive income for the year - (504) 5,635 5,131 4 5,135
Transactions with equity holders in their capacity as equity holders:
Dividends paid - - (5,001) (5,001) (1) (5,002)
Dividend income on treasury shares held within the Group’s life insurance statutory funds
- - 24 24 - 24
Dividend reinvestment plan 413 - - 413 - 413
Other equity movements:
Treasury shares Wealth Australia adjustment (153) - - (153) - (153)
Group employee share acquisition scheme 138 - - 138 - 138
Other items - 11 8 19 - 19
As at 30 September 2016 28,765 1,078 27,975 57,818 109 57,927
Profit or loss - - 6,406 6,406 15 6,421
Other comprehensive income for the year - (1,049) 15 (1,034) (6) (1,040)
Total comprehensive income for the year - (1,049) 6,421 5,372 9 5,381
Transactions with equity holders in their capacity as equity holders:
Dividends paid - - (4,609) (4,609) (1) (4,610)
Dividend income on treasury shares held within the Group’s life insurance statutory funds
- - 26 26 - 26
Dividend reinvestment plan 374 - - 374 - 374
Group share buy-back2 (176) - - (176) - (176)
Other equity movements:
Treasury shares Wealth Australia adjustment 69 - - 69 - 69
Group employee share acquisition scheme 56 - - 56 - 56
Other items - 8 21 29 (1) 28
As at 30 September 2017 29,088 37 29,834 58,959 116 59,0751. Further information on individual reserves is disclosed in Note 21 Shareholders' Equity to the financial statements.2. Following the issue of $176 million shares under the Dividend Reinvestment Plan for the 2017 interim dividend, the Company repurchased $176 million of shares via an on-market share buy-back.
The notes appearing on pages 71 to 154 form an integral part of these financial statements.
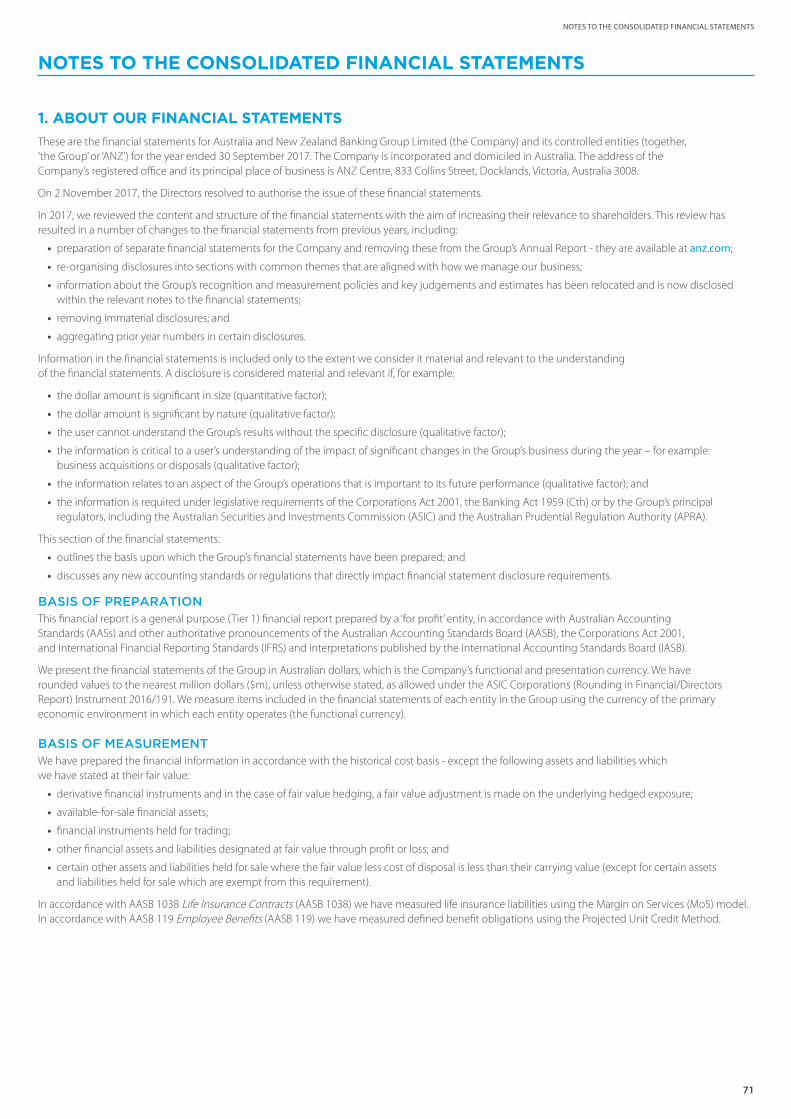
71
NOTES TO THE CONSOLIDATED FINANCIAL STATEMENTS
NOTES TO THE CONSOLIDATED FINANCIAL STATEMENTS
1. ABOUT OUR FINANCIAL STATEMENTSThese are the financial statements for Australia and New Zealand Banking Group Limited (the Company) and its controlled entities (together, ‘the Group’ or ‘ANZ’) for the year ended 30 September 2017. The Company is incorporated and domiciled in Australia. The address of the Company’s registered office and its principal place of business is ANZ Centre, 833 Collins Street, Docklands, Victoria, Australia 3008.
On 2 November 2017, the Directors resolved to authorise the issue of these financial statements.
In 2017, we reviewed the content and structure of the financial statements with the aim of increasing their relevance to shareholders. This review has resulted in a number of changes to the financial statements from previous years, including:
• preparation of separate financial statements for the Company and removing these from the Group’s Annual Report - they are available at anz.com;
• re-organising disclosures into sections with common themes that are aligned with how we manage our business;
• information about the Group’s recognition and measurement policies and key judgements and estimates has been relocated and is now disclosed within the relevant notes to the financial statements;
• removing immaterial disclosures; and
• aggregating prior year numbers in certain disclosures.
Information in the financial statements is included only to the extent we consider it material and relevant to the understanding of the financial statements. A disclosure is considered material and relevant if, for example:
• the dollar amount is significant in size (quantitative factor);
• the dollar amount is significant by nature (qualitative factor);
• the user cannot understand the Group’s results without the specific disclosure (qualitative factor);
• the information is critical to a user’s understanding of the impact of significant changes in the Group’s business during the year – for example: business acquisitions or disposals (qualitative factor);
• the information relates to an aspect of the Group’s operations that is important to its future performance (qualitative factor); and
• the information is required under legislative requirements of the Corporations Act 2001, the Banking Act 1959 (Cth) or by the Group’s principal regulators, including the Australian Securities and Investments Commission (ASIC) and the Australian Prudential Regulation Authority (APRA).
This section of the financial statements:
• outlines the basis upon which the Group’s financial statements have been prepared; and
• discusses any new accounting standards or regulations that directly impact financial statement disclosure requirements.
BASIS OF PREPARATIONThis financial report is a general purpose (Tier 1) financial report prepared by a ‘for profit’ entity, in accordance with Australian Accounting Standards (AASs) and other authoritative pronouncements of the Australian Accounting Standards Board (AASB), the Corporations Act 2001, and International Financial Reporting Standards (IFRS) and interpretations published by the International Accounting Standards Board (IASB).
We present the financial statements of the Group in Australian dollars, which is the Company’s functional and presentation currency. We have rounded values to the nearest million dollars ($m), unless otherwise stated, as allowed under the ASIC Corporations (Rounding in Financial/Directors Report) Instrument 2016/191. We measure items included in the financial statements of each entity in the Group using the currency of the primary economic environment in which each entity operates (the functional currency).
BASIS OF MEASUREMENTWe have prepared the financial information in accordance with the historical cost basis - except the following assets and liabilities which we have stated at their fair value:
• derivative financial instruments and in the case of fair value hedging, a fair value adjustment is made on the underlying hedged exposure;
• available-for-sale financial assets;
• financial instruments held for trading;
• other financial assets and liabilities designated at fair value through profit or loss; and
• certain other assets and liabilities held for sale where the fair value less cost of disposal is less than their carrying value (except for certain assets and liabilities held for sale which are exempt from this requirement).
In accordance with AASB 1038 Life Insurance Contracts (AASB 1038) we have measured life insurance liabilities using the Margin on Services (MoS) model. In accordance with AASB 119 Employee Benefits (AASB 119) we have measured defined benefit obligations using the Projected Unit Credit Method.
72
ANZ 2017 ANNUAL REPORT
NOTES TO THE CONSOLIDATED FINANCIAL STATEMENTS (continued)
1. ABOUT OUR FINANCIAL STATEMENTS (continued)
BASIS OF CONSOLIDATIONThe consolidated financial statements of the Group comprise the financial statements of the Company and all its subsidiaries. An entity, including a structured entity, is considered a subsidiary of the Group when we determine that the Company has control over the entity. Control exists when the Group is exposed to, or has rights to, variable returns from its involvement with the entity and has the ability to affect those returns through its power over the entity. We assess power by examining existing rights that give the Group the current ability to direct the relevant activities of the entity. We have eliminated, on consolidation, the effect of all transactions between entities in the Group.
FOREIGN CURRENCY TRANSLATION
TRANSACTIONS AND BALANCES Foreign currency transactions are translated into the relevant functional currency at the exchange rate prevailing at the date of the transaction. At the reporting date, monetary assets and liabilities denominated in foreign currencies are translated into the functional currency at the relevant spot rate. Any foreign currency translation gains or losses are included in profit or loss in the period they arise.
We measure translation differences on non-monetary items at fair value through profit or loss and report them as part of the fair value gain or loss on these items. We include any translation differences on non-monetary items classified as available-for-sale financial assets in the available-for-sale revaluation reserve in equity.
FINANCIAL STATEMENTS OF FOREIGN OPERATIONS THAT HAVE A FUNCTIONAL CURRENCY THAT IS NOT AUSTRALIAN DOLLARSThe financial statements of our foreign operations are translated into Australian dollars for consolidation into the Group Financial Statements using the following method:
Foreign currency item Exchange rate used
Assets and liabilities The reporting date rate
Equity The initial investment date rate
Income and expensesThe average rate for the period – but if for a significant transaction we believe the average rate is not reasonable, then we use the transaction date rate
Exchange differences arising from the translation of financial statements of foreign operations are recognised in the foreign currency translation reserve in equity. When we dispose of a foreign operation, the cumulative exchange differences are transferred to profit or loss as part of the gain or loss on sale.
FIDUCIARY ACTIVITIESThe Group provides fiduciary services to third parties including custody, nominee, trustee, administration and investment management services predominantly through the wealth businesses. This involves the Group holding assets on behalf of third parties and making decisions regarding the purchase and sale of financial instruments. If ANZ is not the beneficial owner or does not control the assets, then we do not recognise these transactions in these financial statements, except when required by accounting standards or another legislative requirement.
KEY JUDGEMENTS AND ESTIMATES
In the process of applying the Group’s accounting policies, management has made a number of judgements and applied estimates and assumptions about future events. Further information on the key judgements and estimates that we consider material to the financial statements are contained within the notes to the financial statements.

73
NOTES TO THE CONSOLIDATED FINANCIAL STATEMENTS
1. ABOUT OUR FINANCIAL STATEMENTS (continued)
ACCOUNTING STANDARDS NOT EARLY ADOPTEDA number of new standards, amendments to standards and interpretations have been published but are not mandatory for the financial statements for the year ended 30 September 2017, and have not been applied by the Group in preparing these financial statements.
We have identified four standards where this applies to the Group and further details are set out below.
AASB 9 Financial Instruments (AASB 9)AASB 9 was issued in December 2014. When operative, this standard will replace AASB 139 Financial Instruments: Recognition and Measurement (AASB 139) and includes requirements for impairment, classification and measurement and general hedge accounting.
ImpairmentAASB 9 replaces the incurred loss model under AASB 139 with a forward-looking expected loss model. This model will be applied to financial assets measured at amortised cost, debt instruments measured at fair value through other comprehensive income, lease receivables, and certain loan commitments and financial guarantees. Under AASB 9, a three-stage approach is applied to measuring expected credit losses (ECL) based on credit migration between the stages as follows:
• Stage 1: At initial recognition, a provision equivalent to 12 months ECL is recognised.
• Stage 2: Where there has been a significant increase in credit risk since initial recognition, a provision equivalent to full lifetime ECL is required.
• Stage 3: Similar to the current AASB 139 requirements for individual impairment provisions, lifetime ECL is recognised for loans where there is objective evidence of impairment.
ECL are probability weighted and determined by evaluating a range of possible outcomes, taking into account the time value of money, past events, current conditions and forecasts of future economic conditions.
Classification and measurementThere are three measurement classifications under AASB 9: amortised cost, fair value through profit or loss (FVTPL) and, for financial assets, fair value through other comprehensive income (FVOCI). Financial assets are classified into these measurement classifications taking into account the business model within which they are managed, and their contractual cash flow characteristics.
The classification and measurement requirements for financial liabilities under AASB 9 are largely consistent with AASB 139 with the exception that for financial liabilities designated as measured at fair value, gains or losses relating to changes in the entity’s own credit risk are included in other comprehensive income. This part of the standard was early adopted by the Group from 1 October 2013.
General hedge accountingAASB 9 introduces general hedge accounting requirements which more closely align with risk management activities undertaken when hedging financial and non-financial risks.
Transition and impactOther than noted above under classification and measurement, AASB 9 has a date of initial application for the Group of 1 October 2018.
The classification and measurement, and impairment requirements will be applied retrospectively by adjusting the opening balance sheet at the date of initial application, with no requirements to restate comparative periods. ANZ does not intend to restate comparatives.
AASB 9 provides an accounting policy choice to continue with AASB 139 hedge accounting given the International Accounting Standards Board’s ongoing project on macro hedge accounting. The Group’s current expectation is that it will continue to apply the hedge accounting requirements of AASB 139.
The Group is in the process of assessing the impact of the application of AASB 9 and is not yet able to reasonably estimate the impact on its financial statements.
AASB 15 Revenue from Contracts with Customers (AASB 15)AASB 15 was issued in December 2014 and is not effective for the Group until 1 October 2018. AASB 15 contains new requirements for the recognition of revenue.
The standard requires identification of distinct performance obligations within a contract and allocation of the transaction price of the contract to those performance obligations. Revenue is recognised as each performance obligation is satisfied. Variable amounts of revenue can only be recognised if it is highly probable that a significant reversal of the variable amount will not be required in future periods.
Although a significant proportion of the Group’s revenue is outside the scope of AASB 15, certain revenue streams are in the scope of the standard. The Group is in the process of assessing the impact of the application of AASB 15 and is not yet able to reasonably estimate the impact on its financial statements.
AASB 15 may be applied under different transition approaches which could impact (a) revenue recognised in future periods and (b) the opening adjustment to retained earnings at the relevant date of initial application. The Group has not determined which transition approach it will adopt.
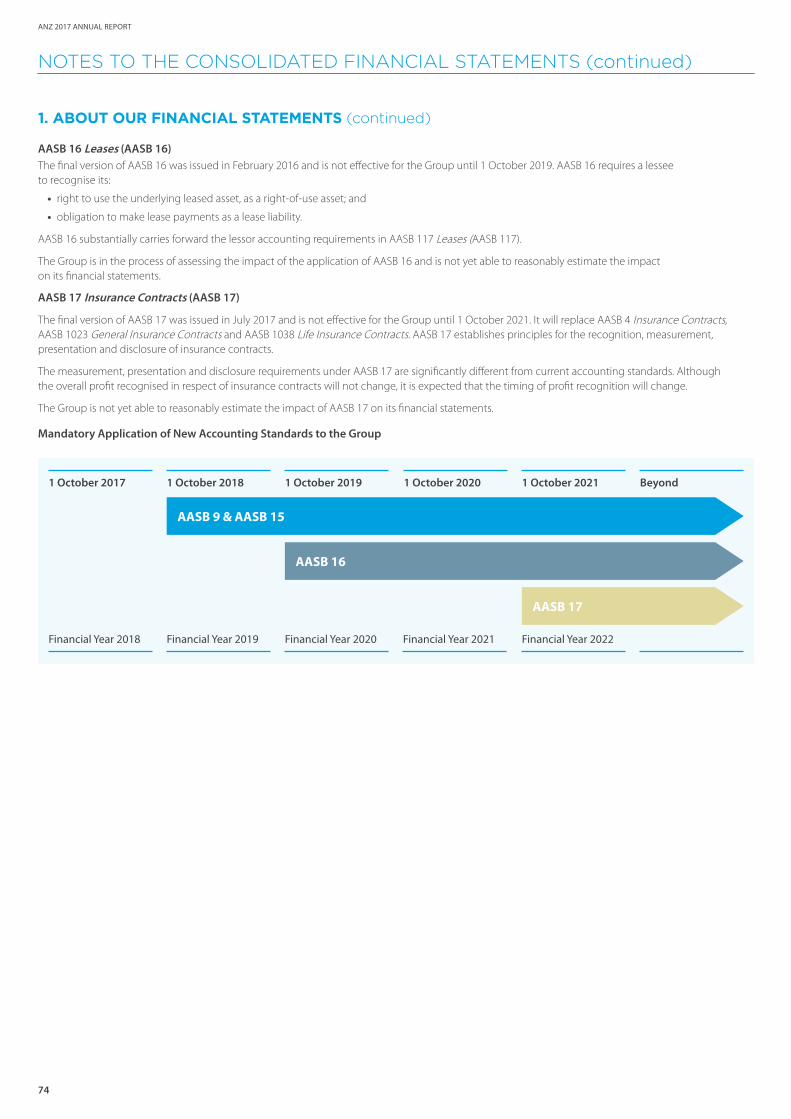
74
ANZ 2017 ANNUAL REPORT
NOTES TO THE CONSOLIDATED FINANCIAL STATEMENTS (continued)
1. ABOUT OUR FINANCIAL STATEMENTS (continued)
AASB 16 Leases (AASB 16)The final version of AASB 16 was issued in February 2016 and is not effective for the Group until 1 October 2019. AASB 16 requires a lessee to recognise its:
• right to use the underlying leased asset, as a right-of-use asset; and
• obligation to make lease payments as a lease liability.
AASB 16 substantially carries forward the lessor accounting requirements in AASB 117 Leases (AASB 117).
The Group is in the process of assessing the impact of the application of AASB 16 and is not yet able to reasonably estimate the impact on its financial statements.
AASB 17 Insurance Contracts (AASB 17)
The final version of AASB 17 was issued in July 2017 and is not effective for the Group until 1 October 2021. It will replace AASB 4 Insurance Contracts, AASB 1023 General Insurance Contracts and AASB 1038 Life Insurance Contracts. AASB 17 establishes principles for the recognition, measurement, presentation and disclosure of insurance contracts.
The measurement, presentation and disclosure requirements under AASB 17 are significantly different from current accounting standards. Although the overall profit recognised in respect of insurance contracts will not change, it is expected that the timing of profit recognition will change.
The Group is not yet able to reasonably estimate the impact of AASB 17 on its financial statements.
Mandatory Application of New Accounting Standards to the Group
1 October 2017
Financial Year 2018 Financial Year 2020 Financial Year 2022Financial Year 2019 Financial Year 2021
1 October 2019 1 October 20211 October 2018 1 October 2020 Beyond
AASB 9 & AASB 15
AASB 16
AASB 17
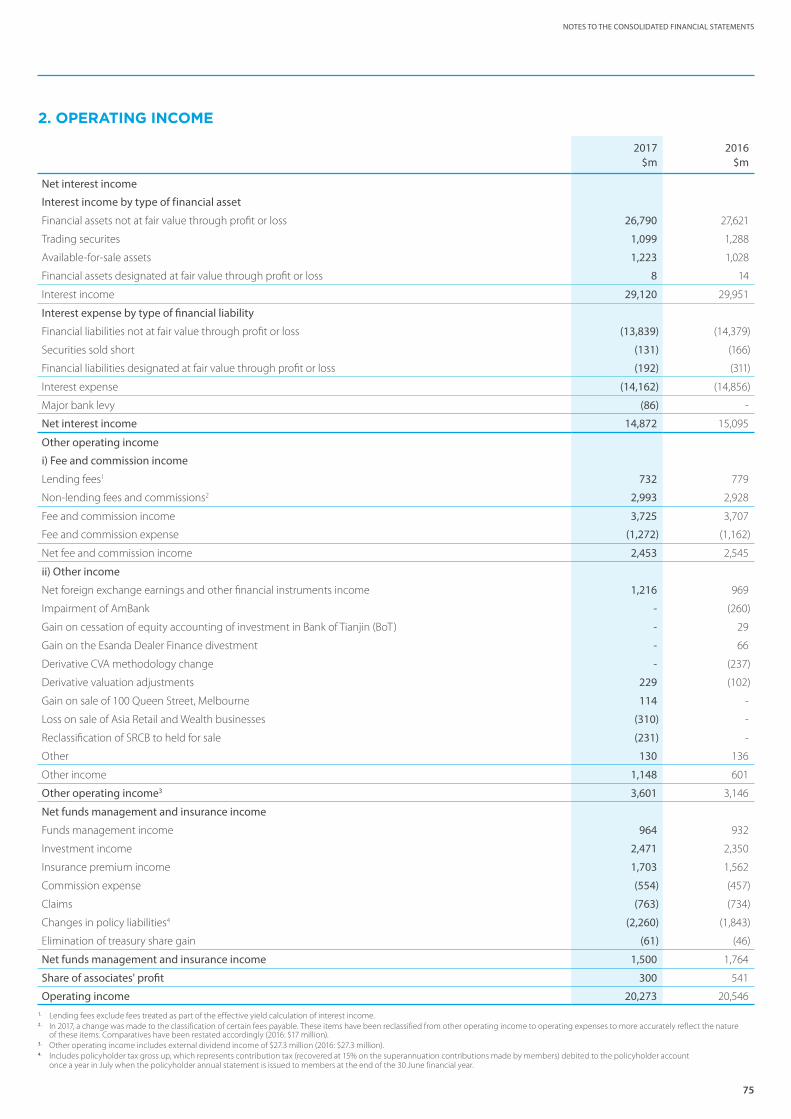
75
NOTES TO THE CONSOLIDATED FINANCIAL STATEMENTS
2. OPERATING INCOME
2017 2016$m $m
Net interest income
Interest income by type of financial asset
Financial assets not at fair value through profit or loss 26,790 27,621
Trading securites 1,099 1,288
Available-for-sale assets 1,223 1,028
Financial assets designated at fair value through profit or loss 8 14
Interest income 29,120 29,951
Interest expense by type of financial liability
Financial liabilities not at fair value through profit or loss (13,839) (14,379)
Securities sold short (131) (166)
Financial liabilities designated at fair value through profit or loss (192) (311)
Interest expense (14,162) (14,856)
Major bank levy (86) -
Net interest income 14,872 15,095
Other operating income
i) Fee and commission income
Lending fees1 732 779
Non-lending fees and commissions2 2,993 2,928
Fee and commission income 3,725 3,707
Fee and commission expense (1,272) (1,162)
Net fee and commission income 2,453 2,545
ii) Other income
Net foreign exchange earnings and other financial instruments income 1,216 969
Impairment of AmBank - (260)
Gain on cessation of equity accounting of investment in Bank of Tianjin (BoT) - 29
Gain on the Esanda Dealer Finance divestment - 66
Derivative CVA methodology change - (237)
Derivative valuation adjustments 229 (102)
Gain on sale of 100 Queen Street, Melbourne 114 -
Loss on sale of Asia Retail and Wealth businesses (310) -
Reclassification of SRCB to held for sale (231) -
Other 130 136
Other income 1,148 601
Other operating income3 3,601 3,146
Net funds management and insurance income
Funds management income 964 932
Investment income 2,471 2,350
Insurance premium income 1,703 1,562
Commission expense (554) (457)
Claims (763) (734)
Changes in policy liabilities4 (2,260) (1,843)
Elimination of treasury share gain (61) (46)
Net funds management and insurance income 1,500 1,764
Share of associates' profit 300 541
Operating income 20,273 20,5461. Lending fees exclude fees treated as part of the effective yield calculation of interest income.2. In 2017, a change was made to the classification of certain fees payable. These items have been reclassified from other operating income to operating expenses to more accurately reflect the nature
of these items. Comparatives have been restated accordingly (2016: $17 million).3. Other operating income includes external dividend income of $27.3 million (2016: $27.3 million).4. Includes policyholder tax gross up, which represents contribution tax (recovered at 15% on the superannuation contributions made by members) debited to the policyholder account
once a year in July when the policyholder annual statement is issued to members at the end of the 30 June financial year.
76
ANZ 2017 ANNUAL REPORT
NOTES TO THE CONSOLIDATED FINANCIAL STATEMENTS (continued)
2. OPERATING INCOME (continued)
RECOGNITION AND MEASUREMENT
NET INTEREST INCOMEInterest Income and ExpenseWe recognise interest income and expense for all financial instruments, including those classified as held for trading, available-for-sale-assets or designated at fair value, in profit or loss using the effective interest rate method. This method uses the effective interest rate of a financial asset or financial liability to calculate its amortised cost. The effective interest rate is the rate that discounts the stream of estimated future cash receipts or payments over the expected life of the financial instrument or, when appropriate, a shorter period, to the net carrying amount of the financial asset or liability. For assets subject to prepayment, we determine their expected life on the basis of historical behaviour of the particular asset portfolio - taking into account contractual obligations and prepayment experience.
We recognise fees and costs, which form an integral part of the financial instrument (for example loan origination fees and costs), using the effective interest method. This is presented as part of interest income or expense depending on whether the underlying financial instrument is a financial asset or financial liability.
Major Bank LevyThe Major Bank Levy Act 2017 (‘Levy’ or ‘Major Bank Levy’) was introduced in 2017 and is effective from 1 July 2017. The Levy applies a rate of 0.06% to certain liabilities of the Company. The Group has determined that the levy represents a finance cost for the Group and is included as a component of net interest income. This is presented within interest expense in the Income Statement.
OTHER OPERATING INCOMEFee and Commission Income We recognise fees or commissions:
• that relate to the execution of a significant act (for example, advisory or arrangement services, placement fees and underwriting fees) when the significant act has been completed; and
• charged for providing ongoing services (for example, maintaining and administering existing facilities) as income over the period the service is provided.
Net Foreign Exchange Earnings and Other Financial Instruments Income
We recognise the following as net foreign exchange earnings and other financial instruments income:
• exchange rate differences arising on the settlement of monetary items and translation differences on monetary items translated at rates different to those at which they were initially recognised or included in a previous financial report;
• fair value movements (excluding realised and accrued interest) on derivatives not designated as accounting hedges that we use to manage interest rate and foreign exchange risk on funding instruments;
• the ineffective portions of fair value hedges, cash flow hedges and net investment hedges;
• fair value movements on financial assets and financial liabilities designated at fair value through profit or loss or held for trading; and
• immediately upon sale or repayment of a hedged item, the unamortised fair value adjustments in items designated as fair value hedges and amounts accumulated in equity related to designated cash flow hedges.
Gain or Loss on Disposal of Non-Financial AssetsThe gain or loss on the disposal of assets is the difference between the carrying value of the asset and the proceeds of disposal net of disposal costs. This is recognised in other income in the year in which the significant risks and rewards transfer to the buyer.

77
NOTES TO THE CONSOLIDATED FINANCIAL STATEMENTS
2. OPERATING INCOME (continued)
RECOGNITION AND MEASUREMENT
NET FUNDS MANAGEMENT AND INSURANCE INCOMEFunds Management IncomeWe recognise the fees we charge to policyholders in connection with life insurance and life investment contracts when we have provided the service.
Investment IncomeInvestment income primarily relates to gains and losses on investments held to back policy liabilities (Refer to Note 29 Life Insurance Business). Investment income excludes gains and losses on treasury shares and intercompany balances including cash and term deposits held as policyholder or shareholder assets.
Insurance Premium IncomeWe recognise:
• premiums with a regular due date as income on an accruals basis;
• unpaid premiums as income and include them as receivables in the balance sheet only during the grace periods in the contract, or for longer only where secured by the surrender value of the policy; and
• premiums with no due date (such as one off premiums) in income when the premiums are received.
We show these insurance premiums net of any reinsurance premium, which we account for on the same basis as the underlying direct insurance premium.
ClaimsInsurance claims relate to us paying benefits to policyholders. We recognise these on an accruals basis once our liability to the policyholder has been confirmed under the terms of the contract. We show these insurance claims net of reinsurance, which we account for on the same basis as the underlying direct insurance claims.
Changes in Policy LiabilitiesChange in policyholder liabilities represents the movement of the life insurance contract liability. Under the Margin of Service (MoS) model, this movement represents:
• the release of the planned profit margin for the year on existing life insurance policies;
• offset by the recognition of contracts in an expected loss position; and
• the deferral of expected future profit margins on new life insurance policies.
We recognise the movement as the service is provided and we show this change in policyholder liabilities net of reinsurance.
Life Insurance Acquisition CostsThe Group incurs life insurance acquisition costs to acquire new business. We recognise those costs in the profit or loss as incurred. In addition, these acquisition costs form part of the calculation to determine a contract’s planned profit margin under the MoS model (see Changes in Policy Liabilities above).
SHARE OF ASSOCIATES’ PROFITThe equity method is applied to accounting for associates in the consolidated financial statements. Under the equity method, the Group’s share of the after tax results of associates is included in the Income Statement and the Statement of Comprehensive Income.
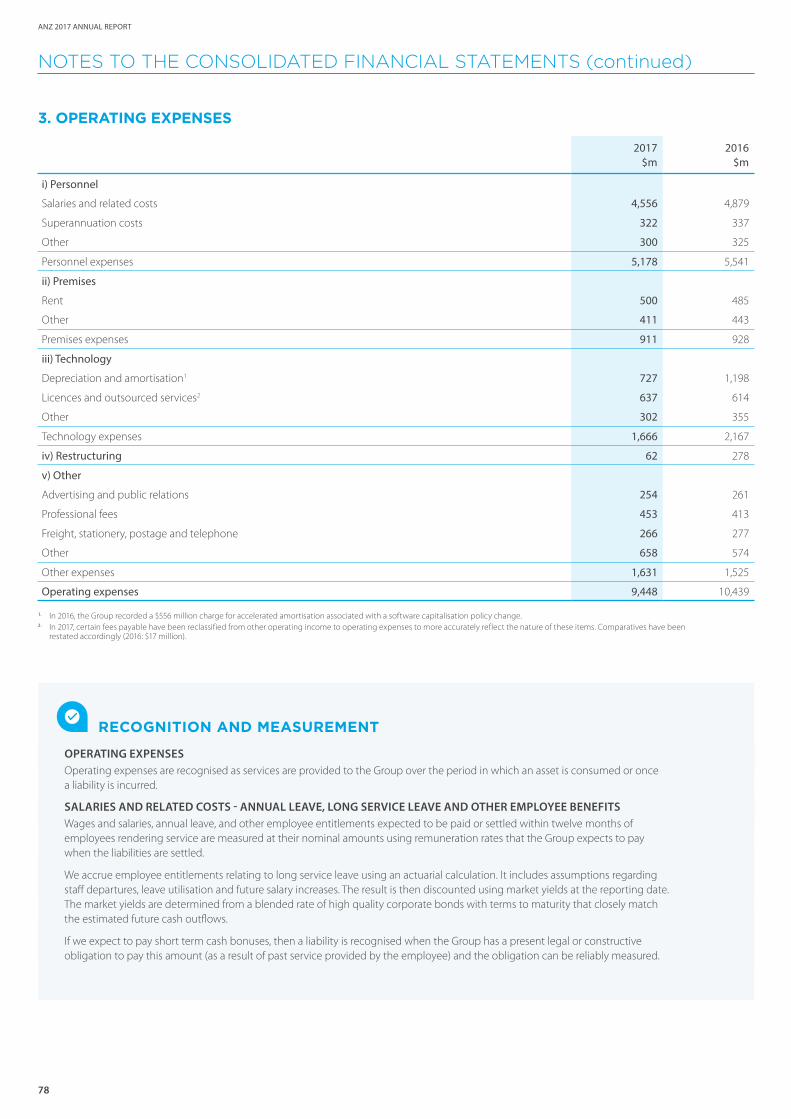
78
ANZ 2017 ANNUAL REPORT
NOTES TO THE CONSOLIDATED FINANCIAL STATEMENTS (continued)
3. OPERATING EXPENSES
2017 2016$m $m
i) Personnel
Salaries and related costs 4,556 4,879
Superannuation costs 322 337
Other 300 325
Personnel expenses 5,178 5,541
ii) Premises
Rent 500 485
Other 411 443
Premises expenses 911 928
iii) Technology
Depreciation and amortisation1 727 1,198
Licences and outsourced services2 637 614
Other 302 355
Technology expenses 1,666 2,167
iv) Restructuring 62 278
v) Other
Advertising and public relations 254 261
Professional fees 453 413
Freight, stationery, postage and telephone 266 277
Other 658 574
Other expenses 1,631 1,525
Operating expenses 9,448 10,439
1. In 2016, the Group recorded a $556 million charge for accelerated amortisation associated with a software capitalisation policy change.2. In 2017, certain fees payable have been reclassified from other operating income to operating expenses to more accurately reflect the nature of these items. Comparatives have been
restated accordingly (2016: $17 million).
RECOGNITION AND MEASUREMENT
OPERATING EXPENSESOperating expenses are recognised as services are provided to the Group over the period in which an asset is consumed or once a liability is incurred.
SALARIES AND RELATED COSTS - ANNUAL LEAVE, LONG SERVICE LEAVE AND OTHER EMPLOYEE BENEFITSWages and salaries, annual leave, and other employee entitlements expected to be paid or settled within twelve months of employees rendering service are measured at their nominal amounts using remuneration rates that the Group expects to pay when the liabilities are settled.
We accrue employee entitlements relating to long service leave using an actuarial calculation. It includes assumptions regarding staff departures, leave utilisation and future salary increases. The result is then discounted using market yields at the reporting date. The market yields are determined from a blended rate of high quality corporate bonds with terms to maturity that closely match the estimated future cash outflows.
If we expect to pay short term cash bonuses, then a liability is recognised when the Group has a present legal or constructive obligation to pay this amount (as a result of past service provided by the employee) and the obligation can be reliably measured.
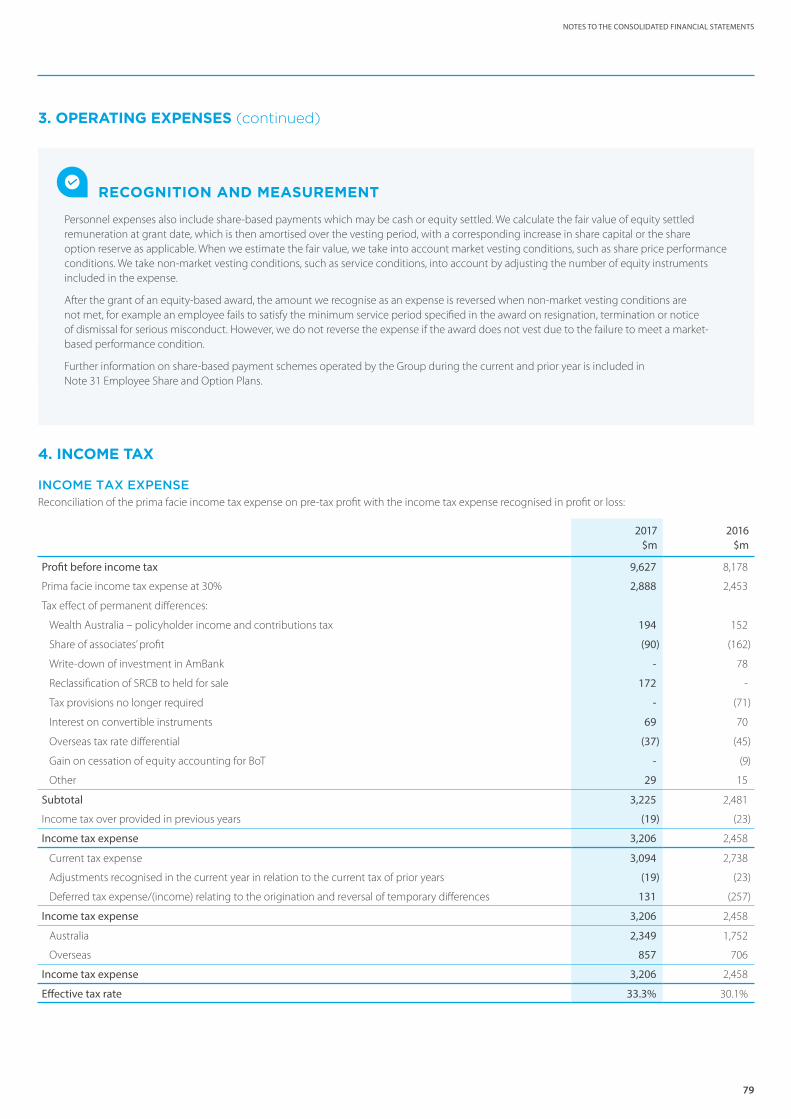
79
NOTES TO THE CONSOLIDATED FINANCIAL STATEMENTS
3. OPERATING EXPENSES (continued)
RECOGNITION AND MEASUREMENT
Personnel expenses also include share-based payments which may be cash or equity settled. We calculate the fair value of equity settled remuneration at grant date, which is then amortised over the vesting period, with a corresponding increase in share capital or the share option reserve as applicable. When we estimate the fair value, we take into account market vesting conditions, such as share price performance conditions. We take non-market vesting conditions, such as service conditions, into account by adjusting the number of equity instruments included in the expense.
After the grant of an equity-based award, the amount we recognise as an expense is reversed when non-market vesting conditions are not met, for example an employee fails to satisfy the minimum service period specified in the award on resignation, termination or notice of dismissal for serious misconduct. However, we do not reverse the expense if the award does not vest due to the failure to meet a market-based performance condition.
Further information on share-based payment schemes operated by the Group during the current and prior year is included in Note 31 Employee Share and Option Plans.
4. INCOME TAX
INCOME TAX EXPENSEReconciliation of the prima facie income tax expense on pre-tax profit with the income tax expense recognised in profit or loss:
2017 2016$m $m
Profit before income tax 9,627 8,178
Prima facie income tax expense at 30% 2,888 2,453
Tax effect of permanent differences:
Wealth Australia – policyholder income and contributions tax 194 152
Share of associates’ profit (90) (162)
Write-down of investment in AmBank - 78
Reclassification of SRCB to held for sale 172 -
Tax provisions no longer required - (71)
Interest on convertible instruments 69 70
Overseas tax rate differential (37) (45)
Gain on cessation of equity accounting for BoT - (9)
Other 29 15
Subtotal 3,225 2,481
Income tax over provided in previous years (19) (23)
Income tax expense 3,206 2,458
Current tax expense 3,094 2,738
Adjustments recognised in the current year in relation to the current tax of prior years (19) (23)
Deferred tax expense/(income) relating to the origination and reversal of temporary differences 131 (257)
Income tax expense 3,206 2,458
Australia 2,349 1,752
Overseas 857 706
Income tax expense 3,206 2,458
Effective tax rate 33.3% 30.1%
80
ANZ 2017 ANNUAL REPORT
NOTES TO THE CONSOLIDATED FINANCIAL STATEMENTS (continued)
4. INCOME TAX (continued)
TAX CONSOLIDATIONThe Company and all its wholly owned Australian resident entities are part of a tax-consolidated group under Australian taxation law. The Company is the head entity in the tax-consolidated group. We recognise each of the following in the separate financial statements of members of the tax-consolidated group on a ‘group allocation’ basis: tax expense/income, and deferred tax liabilities/assets, that arise from temporary differences of the members of the tax-consolidated group. The Company (as head entity in the tax-consolidated group) recognises current tax liabilities and assets of the tax consolidated group.
Under a tax funding arrangement between the entities in the tax-consolidated group, amounts are recognised as payable to or receivable by the Company and each member of the tax-consolidated group in relation to the tax contribution amounts paid or payable between the Company and the other members of the tax-consolidated group.
Members of the tax-consolidated group have also entered into a tax sharing agreement that provides for the allocation of income tax liabilities between the entities were the head entity to default on its income tax payment obligations.
UNRECOGNISED DEFERRED TAX ASSETS AND LIABILITIESUnrecognised deferred tax assets related to unused realised tax losses (on revenue account) total $4 million (2016: $4 million). Unrecognised deferred tax liabilities related to additional potential foreign tax costs (assuming all retained earnings in offshore branches and subsidiaries are repatriated) total $413 million (2016: $416 million).
RECOGNITION AND MEASUREMENT
INCOME TAX EXPENSEIncome tax expense comprises both current and deferred taxes and is based on the accounting profit adjusted for differences in the accounting and tax treatments of income and expenses (that is, taxable income). We recognise tax expense in profit or loss except to the extent to which it relates to items recognised directly in equity and other comprehensive income, in which case we recognise directly in equity or other comprehensive income respectively.
CURRENT TAX EXPENSECurrent tax is the tax we expect to pay on taxable income for the year, based on tax rates (and tax laws) which are enacted at the reporting date. We recognise current tax as a liability (or asset) to the extent that it is unpaid (or refundable).
DEFERRED TAX ASSETS AND LIABILITIESWe account for deferred tax using the balance sheet method. Deferred tax arises because the accounting income is not always the same as the taxable income. This creates temporary differences, which usually reverse over time. Until they reverse, we recognise a deferred tax asset, or liability, on the balance sheet. We measure deferred taxes at the tax rates that we expect will apply to the period(s) when the asset is realised, or the liability settled, based on tax rates (and tax laws) that have been enacted or substantially enacted at the reporting date.
We offset current and deferred tax assets and liabilities only to the extent that: they relate to income taxes imposed by the same taxation authority; there is a legal right and intention to settle on a net basis; and it is allowed under the tax law of the relevant jurisdiction.
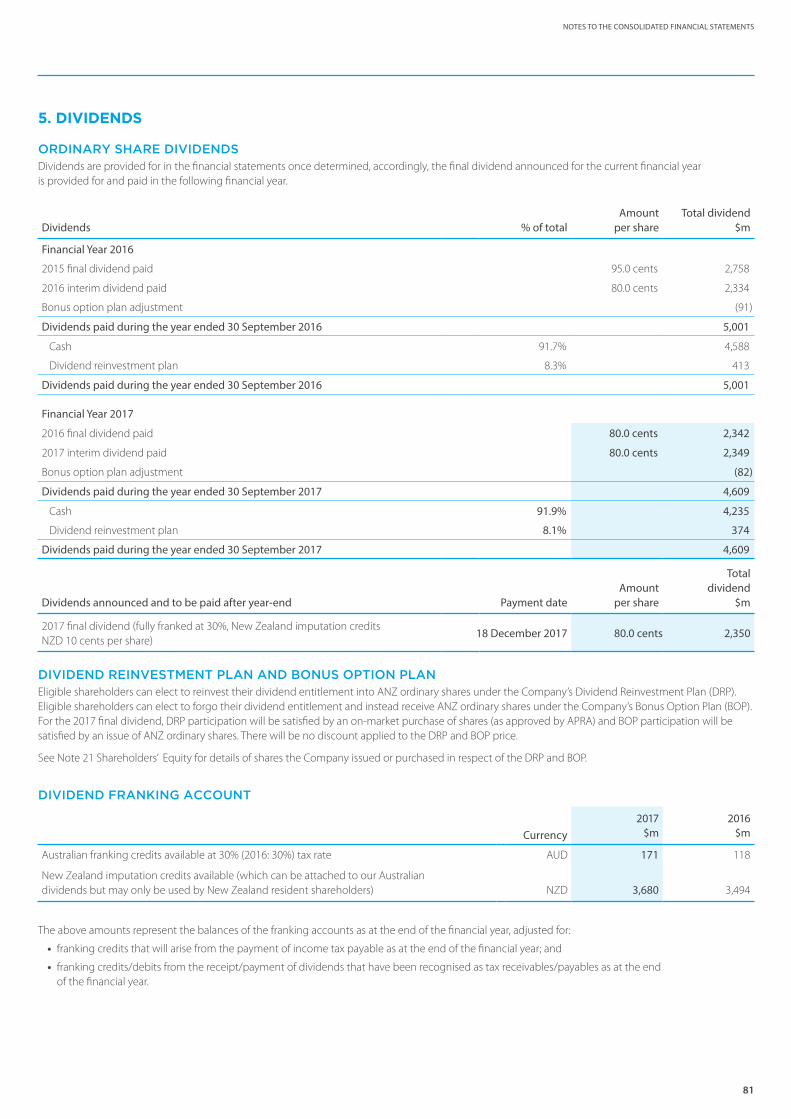
81
NOTES TO THE CONSOLIDATED FINANCIAL STATEMENTS
5. DIVIDENDS
ORDINARY SHARE DIVIDENDSDividends are provided for in the financial statements once determined, accordingly, the final dividend announced for the current financial year is provided for and paid in the following financial year.
Dividends % of totalAmount
per shareTotal dividend
$m
Financial Year 2016
2015 final dividend paid 95.0 cents 2,758
2016 interim dividend paid 80.0 cents 2,334
Bonus option plan adjustment (91)
Dividends paid during the year ended 30 September 2016 5,001
Cash 91.7% 4,588
Dividend reinvestment plan 8.3% 413
Dividends paid during the year ended 30 September 2016 5,001
Financial Year 2017
2016 final dividend paid 80.0 cents 2,342
2017 interim dividend paid 80.0 cents 2,349
Bonus option plan adjustment (82)
Dividends paid during the year ended 30 September 2017 4,609
Cash 91.9% 4,235
Dividend reinvestment plan 8.1% 374
Dividends paid during the year ended 30 September 2017 4,609
Dividends announced and to be paid after year-end Payment dateAmount
per share
Totaldividend
$m
2017 final dividend (fully franked at 30%, New Zealand imputation credits NZD 10 cents per share)
18 December 2017 80.0 cents 2,350
DIVIDEND REINVESTMENT PLAN AND BONUS OPTION PLAN Eligible shareholders can elect to reinvest their dividend entitlement into ANZ ordinary shares under the Company’s Dividend Reinvestment Plan (DRP). Eligible shareholders can elect to forgo their dividend entitlement and instead receive ANZ ordinary shares under the Company’s Bonus Option Plan (BOP). For the 2017 final dividend, DRP participation will be satisfied by an on-market purchase of shares (as approved by APRA) and BOP participation will be satisfied by an issue of ANZ ordinary shares. There will be no discount applied to the DRP and BOP price.
See Note 21 Shareholders’ Equity for details of shares the Company issued or purchased in respect of the DRP and BOP.
DIVIDEND FRANKING ACCOUNT
Currency2017 2016
$m $m
Australian franking credits available at 30% (2016: 30%) tax rate AUD 171 118
New Zealand imputation credits available (which can be attached to our Australian dividends but may only be used by New Zealand resident shareholders) NZD 3,680 3,494
The above amounts represent the balances of the franking accounts as at the end of the financial year, adjusted for:
• franking credits that will arise from the payment of income tax payable as at the end of the financial year; and
• franking credits/debits from the receipt/payment of dividends that have been recognised as tax receivables/payables as at the end of the financial year.
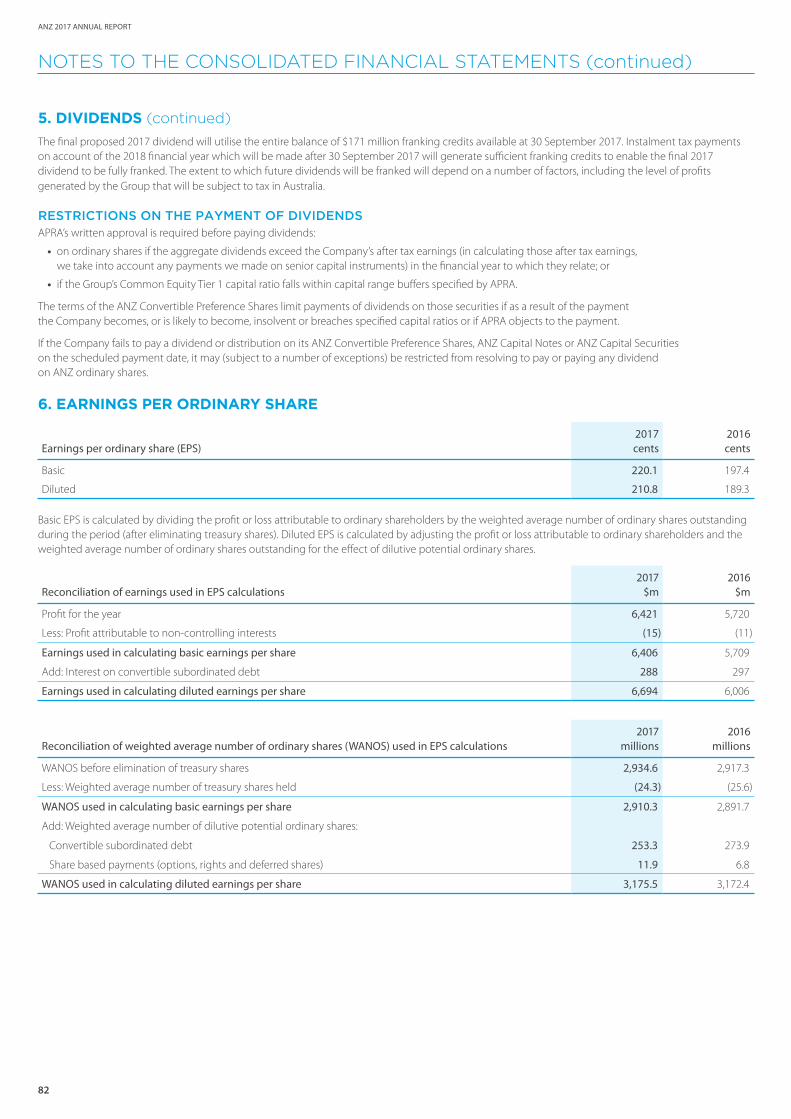
82
ANZ 2017 ANNUAL REPORT
NOTES TO THE CONSOLIDATED FINANCIAL STATEMENTS (continued)
5. DIVIDENDS (continued)
The final proposed 2017 dividend will utilise the entire balance of $171 million franking credits available at 30 September 2017. Instalment tax payments on account of the 2018 financial year which will be made after 30 September 2017 will generate sufficient franking credits to enable the final 2017 dividend to be fully franked. The extent to which future dividends will be franked will depend on a number of factors, including the level of profits generated by the Group that will be subject to tax in Australia.
RESTRICTIONS ON THE PAYMENT OF DIVIDENDSAPRA’s written approval is required before paying dividends:
• on ordinary shares if the aggregate dividends exceed the Company’s after tax earnings (in calculating those after tax earnings, we take into account any payments we made on senior capital instruments) in the financial year to which they relate; or
• if the Group’s Common Equity Tier 1 capital ratio falls within capital range buffers specified by APRA.
The terms of the ANZ Convertible Preference Shares limit payments of dividends on those securities if as a result of the payment the Company becomes, or is likely to become, insolvent or breaches specified capital ratios or if APRA objects to the payment.
If the Company fails to pay a dividend or distribution on its ANZ Convertible Preference Shares, ANZ Capital Notes or ANZ Capital Securities on the scheduled payment date, it may (subject to a number of exceptions) be restricted from resolving to pay or paying any dividend on ANZ ordinary shares.
6. EARNINGS PER ORDINARY SHARE
Earnings per ordinary share (EPS)2017 2016cents cents
Basic 220.1 197.4
Diluted 210.8 189.3
Basic EPS is calculated by dividing the profit or loss attributable to ordinary shareholders by the weighted average number of ordinary shares outstanding during the period (after eliminating treasury shares). Diluted EPS is calculated by adjusting the profit or loss attributable to ordinary shareholders and the weighted average number of ordinary shares outstanding for the effect of dilutive potential ordinary shares.
Reconciliation of earnings used in EPS calculations2017 2016
$m $m
Profit for the year 6,421 5,720
Less: Profit attributable to non-controlling interests (15) (11)
Earnings used in calculating basic earnings per share 6,406 5,709
Add: Interest on convertible subordinated debt 288 297
Earnings used in calculating diluted earnings per share 6,694 6,006
2017 2016Reconciliation of weighted average number of ordinary shares (WANOS) used in EPS calculations millions millions
WANOS before elimination of treasury shares 2,934.6 2,917.3
Less: Weighted average number of treasury shares held (24.3) (25.6)
WANOS used in calculating basic earnings per share 2,910.3 2,891.7
Add: Weighted average number of dilutive potential ordinary shares:
Convertible subordinated debt 253.3 273.9
Share based payments (options, rights and deferred shares) 11.9 6.8
WANOS used in calculating diluted earnings per share 3,175.5 3,172.4
83
NOTES TO THE CONSOLIDATED FINANCIAL STATEMENTS
7. SEGMENT REPORTING
DESCRIPTION OF SEGMENTSThe Group’s six operating segments are presented on a basis that is consistent with the information provided internally to the Chief Executive Officer, who is the chief operating decision maker. This reflects the way the Group’s businesses are managed, rather than the legal structure of the Group.
We measure the performance of these segments on a cash profit basis. To calculate cash profit, we remove certain non-core items from statutory profit. Details of these items are included in the 'Other items' section of this note. Transactions between business units across segments within ANZ are conducted on an arm's-length basis and disclosed as part of the income and expenses of these segments.
The reportable segments are divisions engaged in providing either different products or services or similar products and services in different geographical areas. They are as follows:
AustraliaThe Australia division comprises the Retail and Corporate & Commercial Banking (C&CB) business units.
• Retail provides products and services to consumer and private banking customers in Australia via the branch network, mortgage specialists, the contact centres, a variety of self-service channels (internet banking, phone banking, ATMs, website and digital banking) and third party brokers.
• C&CB provides a full range of banking services including traditional relationship banking and sophisticated financial solutions through dedicated managers focusing on privately owned small, medium and large enterprises as well as the agricultural business segment.
InstitutionalThe Institutional division services global institutional and business customers across three product sets: Transaction Banking, Loans & Specialised Finance and Markets.
• Transaction Banking provides working capital and liquidity solutions including documentary trade, supply chain financing as well as cash management solutions, deposits, payments and clearing.
• Loans & Specialised Finance provides loan products, loan syndication, specialised loan structuring and execution, project and export finance, debt structuring and acquisition finance, structured trade and asset finance, and corporate advisory.
• Markets provide risk management services on foreign exchange, interest rates, credit, commodities, debt capital markets and wealth solutions in addition to managing the Group's interest rate exposure and liquidity position.
New ZealandThe New Zealand division comprises the Retail and Commercial business units.
• Retail provides a full range of banking and wealth management services to consumer, private banking and small business banking customers. We deliver our services via our internet and app-based digital solutions and network of branches, mortgage specialists, relationship managers and contact centres.
• Commercial provides a full range of banking services including traditional relationship banking and sophisticated financial solutions (including asset financing) through dedicated managers focusing on privately owned medium to large enterprises and the agricultural business segment.
Wealth AustraliaThe Wealth Australia division comprises the Insurance and Funds Management business units, which provide insurance, investment and superannuation solutions intended to make it easier for customers to manage, protect and grow their wealth.
• Insurance includes life insurance, general insurance and ANZ Lenders Mortgage Insurance.
• Funds Management includes the Pensions and Investments business and ANZ Share Investing.
Asia Retail & PacificThe Asia Retail & Pacific division comprises the Asia Retail & Pacific business units, connecting customers to specialists for their banking needs.
• Asia Retail provides general banking and wealth management services to affluent and emerging affluent retail customers via relationship managers, branches, contact centres and a variety of self-service digital channels (internet and mobile banking, phone and ATMs). Core products offered include deposits, credit cards, loans, investments and insurance. Refer to Note 28 Assets and Liabilities Held for Sale for details on the sale of Asia Retail and Wealth businesses.
• Pacific provides products and services to retail customers, small to medium-sized enterprises, institutional customers and Governments located in the Pacific Islands. Products and services include retail products provided to customers, traditional relationship banking and sophisticated financial solutions provided to business customers through dedicated managers.
Technology, Services & Operations (TSO) and Group CentreTSO and Group Centre provide support to the operating divisions, including technology, operations, shared services, property, risk management, financial management, strategy, marketing, human resources and corporate affairs. The Group Centre includes Group Treasury, Shareholder Functions, Enablement Functions and minority investments in Asia.
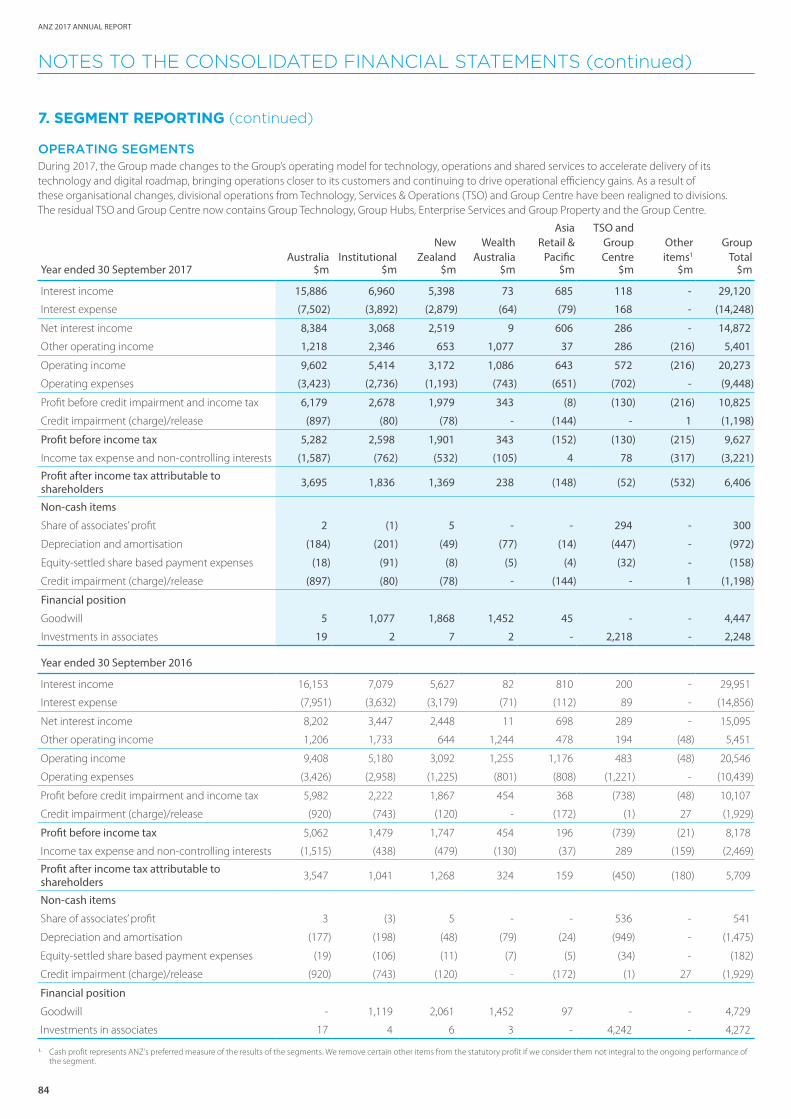
84
ANZ 2017 ANNUAL REPORT
NOTES TO THE CONSOLIDATED FINANCIAL STATEMENTS (continued)
7. SEGMENT REPORTING (continued)
OPERATING SEGMENTSDuring 2017, the Group made changes to the Group’s operating model for technology, operations and shared services to accelerate delivery of its technology and digital roadmap, bringing operations closer to its customers and continuing to drive operational efficiency gains. As a result of these organisational changes, divisional operations from Technology, Services & Operations (TSO) and Group Centre have been realigned to divisions. The residual TSO and Group Centre now contains Group Technology, Group Hubs, Enterprise Services and Group Property and the Group Centre.
Australia InstitutionalNew
ZealandWealth
Australia
AsiaRetail &
Pacific
TSO andGroup Centre
Other items1
Group Total
Year ended 30 September 2017 $m $m $m $m $m $m $m $m
Interest income 15,886 6,960 5,398 73 685 118 - 29,120
Interest expense (7,502) (3,892) (2,879) (64) (79) 168 - (14,248)
Net interest income 8,384 3,068 2,519 9 606 286 - 14,872
Other operating income 1,218 2,346 653 1,077 37 286 (216) 5,401
Operating income 9,602 5,414 3,172 1,086 643 572 (216) 20,273
Operating expenses (3,423) (2,736) (1,193) (743) (651) (702) - (9,448)
Profit before credit impairment and income tax 6,179 2,678 1,979 343 (8) (130) (216) 10,825
Credit impairment (charge)/release (897) (80) (78) - (144) - 1 (1,198)
Profit before income tax 5,282 2,598 1,901 343 (152) (130) (215) 9,627
Income tax expense and non-controlling interests (1,587) (762) (532) (105) 4 78 (317) (3,221)
Profit after income tax attributable to shareholders 3,695 1,836 1,369 238 (148) (52) (532) 6,406
Non-cash items
Share of associates’ profit 2 (1) 5 - - 294 - 300
Depreciation and amortisation (184) (201) (49) (77) (14) (447) - (972)
Equity-settled share based payment expenses (18) (91) (8) (5) (4) (32) - (158)
Credit impairment (charge)/release (897) (80) (78) - (144) - 1 (1,198)
Financial position
Goodwill 5 1,077 1,868 1,452 45 - - 4,447
Investments in associates 19 2 7 2 - 2,218 - 2,248
Year ended 30 September 2016
Interest income 16,153 7,079 5,627 82 810 200 - 29,951
Interest expense (7,951) (3,632) (3,179) (71) (112) 89 - (14,856)
Net interest income 8,202 3,447 2,448 11 698 289 - 15,095
Other operating income 1,206 1,733 644 1,244 478 194 (48) 5,451
Operating income 9,408 5,180 3,092 1,255 1,176 483 (48) 20,546
Operating expenses (3,426) (2,958) (1,225) (801) (808) (1,221) - (10,439)
Profit before credit impairment and income tax 5,982 2,222 1,867 454 368 (738) (48) 10,107
Credit impairment (charge)/release (920) (743) (120) - (172) (1) 27 (1,929)
Profit before income tax 5,062 1,479 1,747 454 196 (739) (21) 8,178
Income tax expense and non-controlling interests (1,515) (438) (479) (130) (37) 289 (159) (2,469)
Profit after income tax attributable to shareholders 3,547 1,041 1,268 324 159 (450) (180) 5,709
Non-cash items
Share of associates’ profit 3 (3) 5 - - 536 - 541
Depreciation and amortisation (177) (198) (48) (79) (24) (949) - (1,475)
Equity-settled share based payment expenses (19) (106) (11) (7) (5) (34) - (182)
Credit impairment (charge)/release (920) (743) (120) - (172) (1) 27 (1,929)
Financial position
Goodwill - 1,119 2,061 1,452 97 - - 4,729
Investments in associates 17 4 6 3 - 4,242 - 4,272
1. Cash profit represents ANZ's preferred measure of the results of the segments. We remove certain other items from the statutory profit if we consider them not integral to the ongoing performance of the segment.
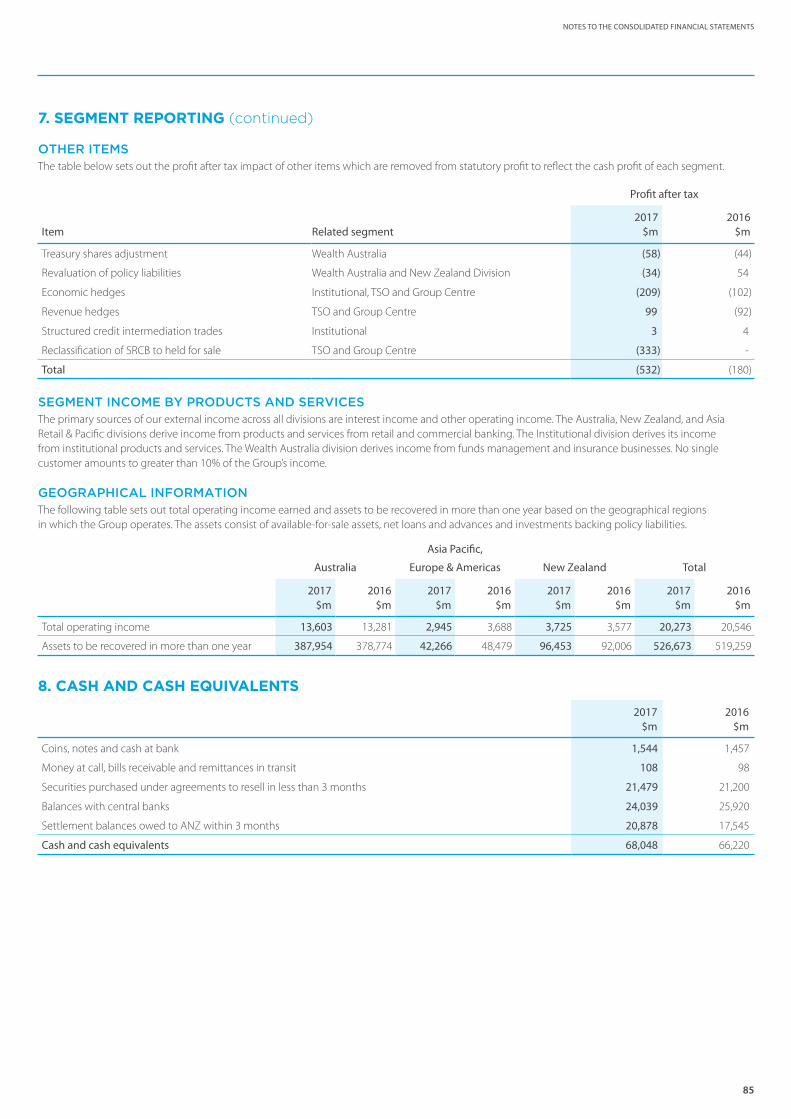
85
NOTES TO THE CONSOLIDATED FINANCIAL STATEMENTS
7. SEGMENT REPORTING (continued)
OTHER ITEMSThe table below sets out the profit after tax impact of other items which are removed from statutory profit to reflect the cash profit of each segment.
Profit after tax
Item Related segment2017 2016
$m $m
Treasury shares adjustment Wealth Australia (58) (44)
Revaluation of policy liabilities Wealth Australia and New Zealand Division (34) 54
Economic hedges Institutional, TSO and Group Centre (209) (102)
Revenue hedges TSO and Group Centre 99 (92)
Structured credit intermediation trades Institutional 3 4
Reclassification of SRCB to held for sale TSO and Group Centre (333) -
Total (532) (180)
SEGMENT INCOME BY PRODUCTS AND SERVICESThe primary sources of our external income across all divisions are interest income and other operating income. The Australia, New Zealand, and Asia Retail & Pacific divisions derive income from products and services from retail and commercial banking. The Institutional division derives its income from institutional products and services. The Wealth Australia division derives income from funds management and insurance businesses. No single customer amounts to greater than 10% of the Group’s income.
GEOGRAPHICAL INFORMATIONThe following table sets out total operating income earned and assets to be recovered in more than one year based on the geographical regions in which the Group operates. The assets consist of available-for-sale assets, net loans and advances and investments backing policy liabilities.
Australia
Asia Pacific,
Europe & Americas New Zealand Total
2017 2016 2017 2016 2017 2016 2017 2016$m $m $m $m $m $m $m $m
Total operating income 13,603 13,281 2,945 3,688 3,725 3,577 20,273 20,546
Assets to be recovered in more than one year 387,954 378,774 42,266 48,479 96,453 92,006 526,673 519,259
8. CASH AND CASH EQUIVALENTS
2017 2016$m $m
Coins, notes and cash at bank 1,544 1,457
Money at call, bills receivable and remittances in transit 108 98
Securities purchased under agreements to resell in less than 3 months 21,479 21,200
Balances with central banks 24,039 25,920
Settlement balances owed to ANZ within 3 months 20,878 17,545
Cash and cash equivalents 68,048 66,220
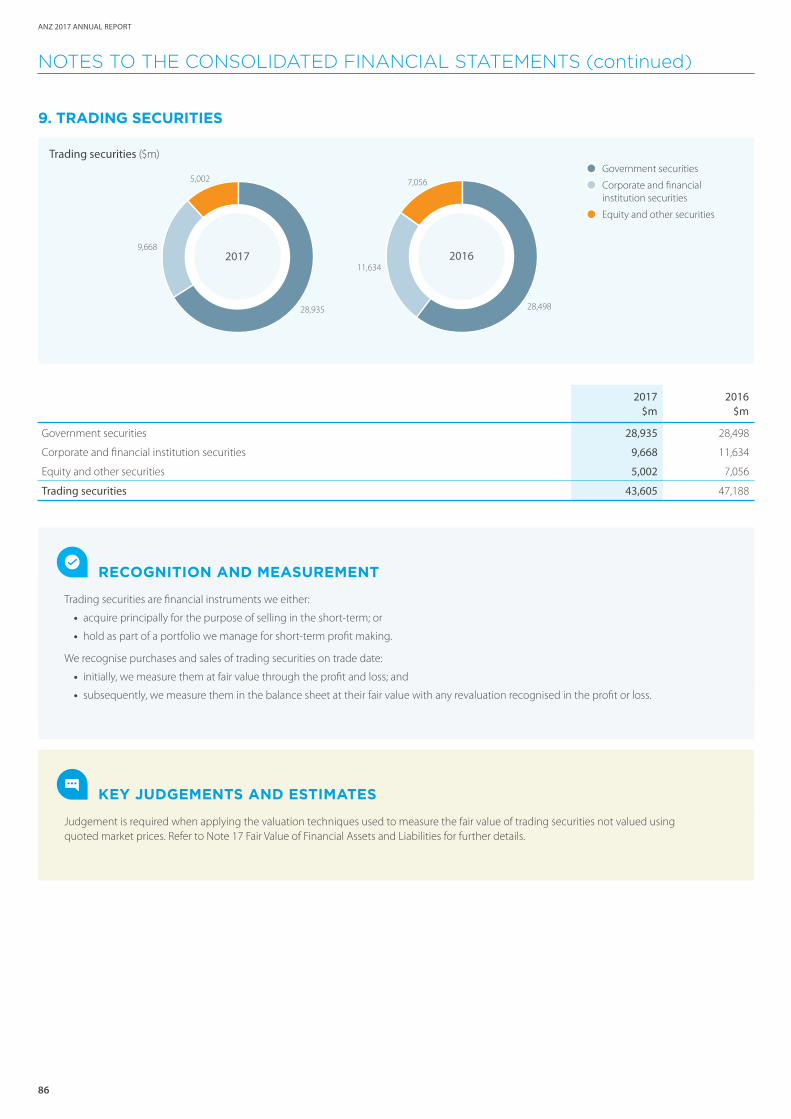
86
ANZ 2017 ANNUAL REPORT
NOTES TO THE CONSOLIDATED FINANCIAL STATEMENTS (continued)
9. TRADING SECURITIES
2017 2016$m $m
Government securities 28,935 28,498
Corporate and financial institution securities 9,668 11,634
Equity and other securities 5,002 7,056
Trading securities 43,605 47,188
RECOGNITION AND MEASUREMENT
Trading securities are financial instruments we either:
• acquire principally for the purpose of selling in the short-term; or
• hold as part of a portfolio we manage for short-term profit making.
We recognise purchases and sales of trading securities on trade date:
• initially, we measure them at fair value through the profit and loss; and
• subsequently, we measure them in the balance sheet at their fair value with any revaluation recognised in the profit or loss.
KEY JUDGEMENTS AND ESTIMATES
Judgement is required when applying the valuation techniques used to measure the fair value of trading securities not valued using quoted market prices. Refer to Note 17 Fair Value of Financial Assets and Liabilities for further details.
Trading securities ($m)● Government securities
● Corporate and financial institution securities
● Equity and other securities
28,935
9,668
5,002
2017
28,498
11,634
7,056
2016
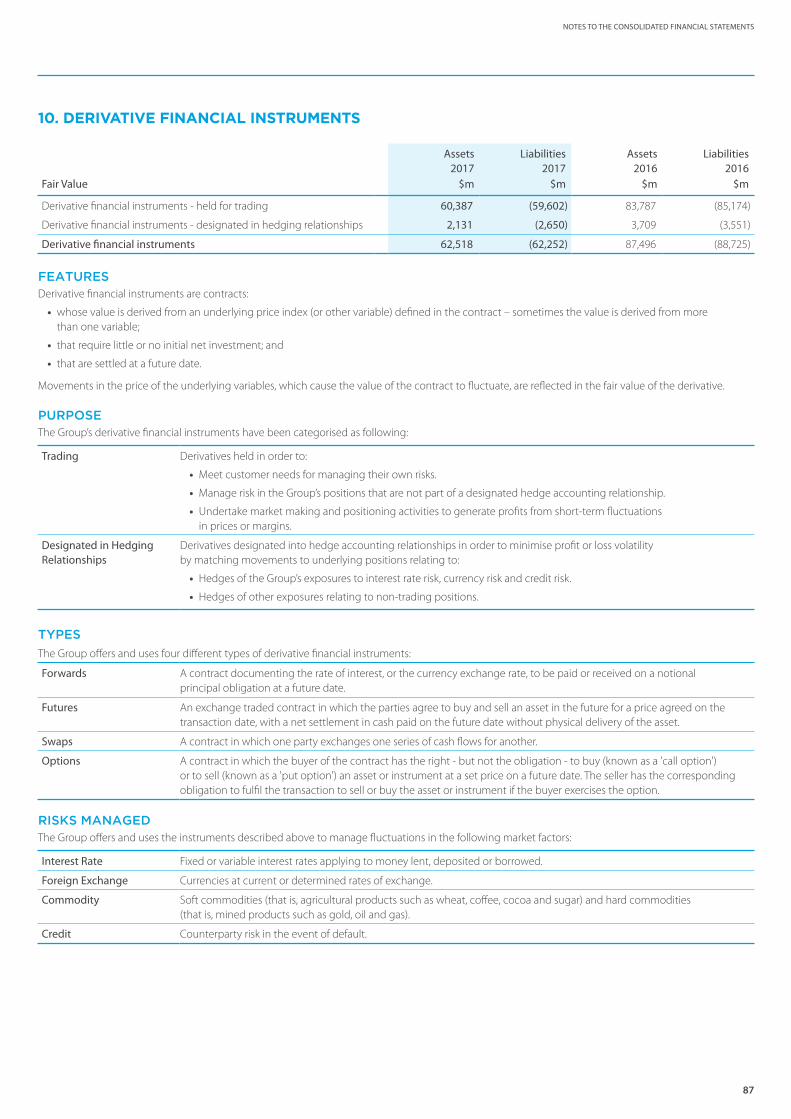
87
NOTES TO THE CONSOLIDATED FINANCIAL STATEMENTS
10. DERIVATIVE FINANCIAL INSTRUMENTS
Assets2017
Liabilities2017
Assets2016
Liabilities2016
Fair Value $m $m $m $m
Derivative financial instruments - held for trading 60,387 (59,602) 83,787 (85,174)
Derivative financial instruments - designated in hedging relationships 2,131 (2,650) 3,709 (3,551)
Derivative financial instruments 62,518 (62,252) 87,496 (88,725)
FEATURESDerivative financial instruments are contracts:
• whose value is derived from an underlying price index (or other variable) defined in the contract – sometimes the value is derived from more than one variable;
• that require little or no initial net investment; and
• that are settled at a future date.
Movements in the price of the underlying variables, which cause the value of the contract to fluctuate, are reflected in the fair value of the derivative.
PURPOSEThe Group’s derivative financial instruments have been categorised as following:
Trading Derivatives held in order to:
• Meet customer needs for managing their own risks.
• Manage risk in the Group’s positions that are not part of a designated hedge accounting relationship.
• Undertake market making and positioning activities to generate profits from short-term fluctuations in prices or margins.
Designated in Hedging Relationships
Derivatives designated into hedge accounting relationships in order to minimise profit or loss volatility by matching movements to underlying positions relating to:
• Hedges of the Group’s exposures to interest rate risk, currency risk and credit risk.
• Hedges of other exposures relating to non-trading positions.
TYPES
The Group offers and uses four different types of derivative financial instruments:
Forwards A contract documenting the rate of interest, or the currency exchange rate, to be paid or received on a notional principal obligation at a future date.
Futures An exchange traded contract in which the parties agree to buy and sell an asset in the future for a price agreed on the transaction date, with a net settlement in cash paid on the future date without physical delivery of the asset.
Swaps A contract in which one party exchanges one series of cash flows for another.
Options A contract in which the buyer of the contract has the right - but not the obligation - to buy (known as a 'call option') or to sell (known as a 'put option') an asset or instrument at a set price on a future date. The seller has the corresponding obligation to fulfil the transaction to sell or buy the asset or instrument if the buyer exercises the option.
RISKS MANAGED The Group offers and uses the instruments described above to manage fluctuations in the following market factors:
Interest Rate Fixed or variable interest rates applying to money lent, deposited or borrowed.
Foreign Exchange Currencies at current or determined rates of exchange.
Commodity Soft commodities (that is, agricultural products such as wheat, coffee, cocoa and sugar) and hard commodities (that is, mined products such as gold, oil and gas).
Credit Counterparty risk in the event of default.
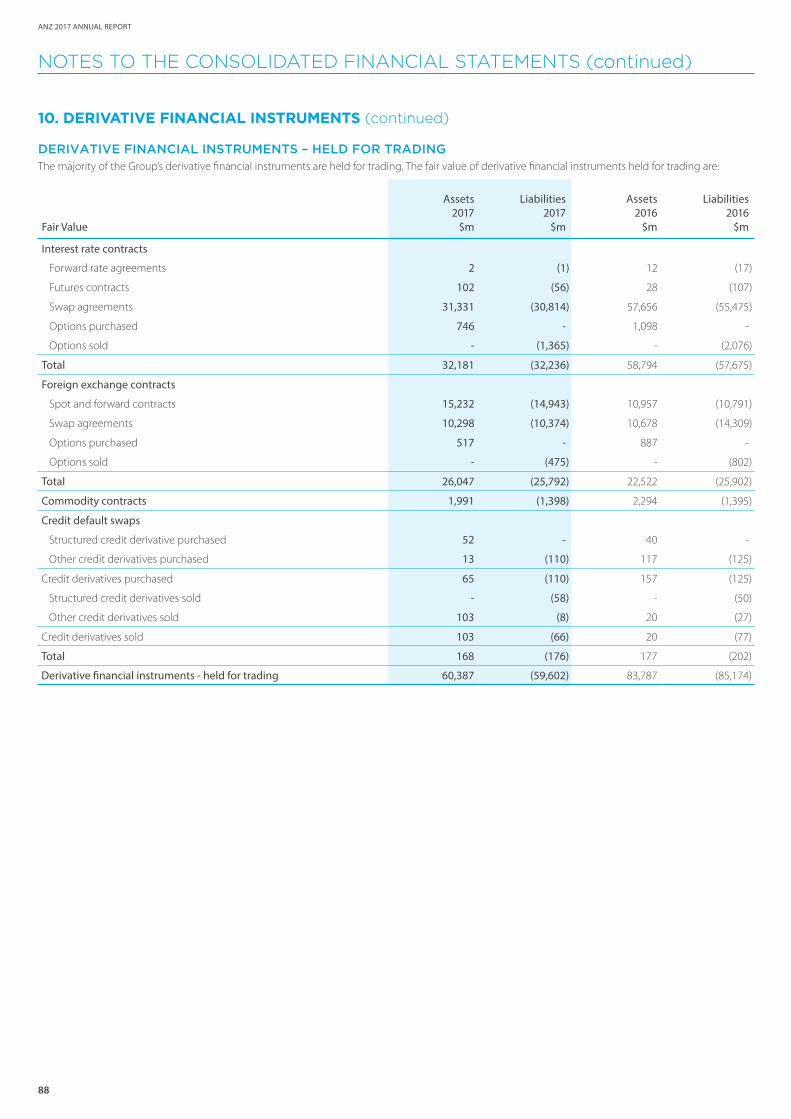
88
ANZ 2017 ANNUAL REPORT
NOTES TO THE CONSOLIDATED FINANCIAL STATEMENTS (continued)
10. DERIVATIVE FINANCIAL INSTRUMENTS (continued)
DERIVATIVE FINANCIAL INSTRUMENTS – HELD FOR TRADINGThe majority of the Group’s derivative financial instruments are held for trading. The fair value of derivative financial instruments held for trading are:
Assets2017
Liabilities2017
Assets2016
Liabilities2016
Fair Value $m $m $m $m
Interest rate contracts
Forward rate agreements 2 (1) 12 (17)
Futures contracts 102 (56) 28 (107)
Swap agreements 31,331 (30,814) 57,656 (55,475)
Options purchased 746 - 1,098 -
Options sold - (1,365) - (2,076)
Total 32,181 (32,236) 58,794 (57,675)
Foreign exchange contracts
Spot and forward contracts 15,232 (14,943) 10,957 (10,791)
Swap agreements 10,298 (10,374) 10,678 (14,309)
Options purchased 517 - 887 -
Options sold - (475) - (802)
Total 26,047 (25,792) 22,522 (25,902)
Commodity contracts 1,991 (1,398) 2,294 (1,395)
Credit default swaps
Structured credit derivative purchased 52 - 40 -
Other credit derivatives purchased 13 (110) 117 (125)
Credit derivatives purchased 65 (110) 157 (125)
Structured credit derivatives sold - (58) - (50)
Other credit derivatives sold 103 (8) 20 (27)
Credit derivatives sold 103 (66) 20 (77)
Total 168 (176) 177 (202)
Derivative financial instruments - held for trading 60,387 (59,602) 83,787 (85,174)
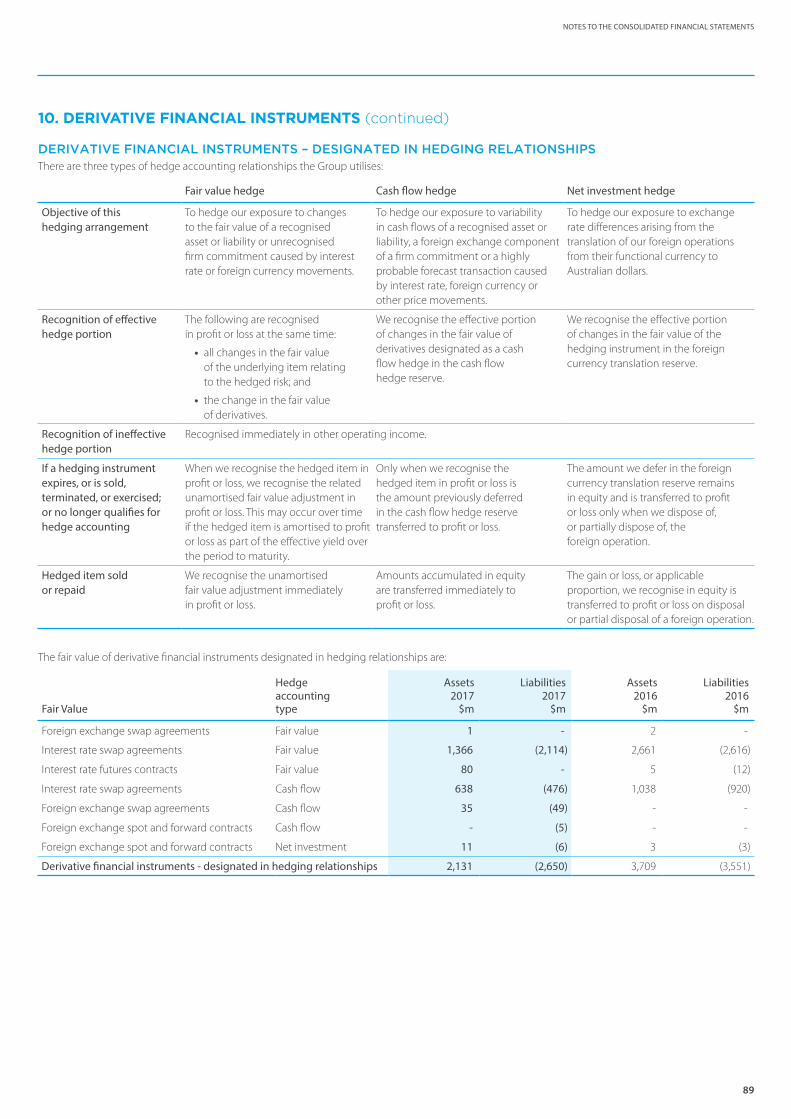
89
NOTES TO THE CONSOLIDATED FINANCIAL STATEMENTS
10. DERIVATIVE FINANCIAL INSTRUMENTS (continued)
DERIVATIVE FINANCIAL INSTRUMENTS – DESIGNATED IN HEDGING RELATIONSHIPSThere are three types of hedge accounting relationships the Group utilises:
Fair value hedge Cash flow hedge Net investment hedge
Objective of this hedging arrangement
To hedge our exposure to changes to the fair value of a recognised asset or liability or unrecognised firm commitment caused by interest rate or foreign currency movements.
To hedge our exposure to variability in cash flows of a recognised asset or liability, a foreign exchange component of a firm commitment or a highly probable forecast transaction caused by interest rate, foreign currency or other price movements.
To hedge our exposure to exchange rate differences arising from the translation of our foreign operations from their functional currency to Australian dollars.
Recognition of effective hedge portion
The following are recognised in profit or loss at the same time:
• all changes in the fair value of the underlying item relating to the hedged risk; and
• the change in the fair value of derivatives.
We recognise the effective portion of changes in the fair value of derivatives designated as a cash flow hedge in the cash flow hedge reserve.
We recognise the effective portion of changes in the fair value of the hedging instrument in the foreign currency translation reserve.
Recognition of ineffective hedge portion
Recognised immediately in other operating income.
If a hedging instrument expires, or is sold, terminated, or exercised; or no longer qualifies for hedge accounting
When we recognise the hedged item in profit or loss, we recognise the related unamortised fair value adjustment in profit or loss. This may occur over time if the hedged item is amortised to profit or loss as part of the effective yield over the period to maturity.
Only when we recognise the hedged item in profit or loss is the amount previously deferred in the cash flow hedge reserve transferred to profit or loss.
The amount we defer in the foreign currency translation reserve remains in equity and is transferred to profit or loss only when we dispose of, or partially dispose of, the foreign operation.
Hedged item sold or repaid
We recognise the unamortised fair value adjustment immediately in profit or loss.
Amounts accumulated in equity are transferred immediately to profit or loss.
The gain or loss, or applicable proportion, we recognise in equity is transferred to profit or loss on disposal or partial disposal of a foreign operation.
The fair value of derivative financial instruments designated in hedging relationships are:
Hedge accounting
Assets2017
Liabilities2017
Assets2016
Liabilities2016
Fair Value type $m $m $m $m
Foreign exchange swap agreements Fair value 1 - 2 -
Interest rate swap agreements Fair value 1,366 (2,114) 2,661 (2,616)
Interest rate futures contracts Fair value 80 - 5 (12)
Interest rate swap agreements Cash flow 638 (476) 1,038 (920)
Foreign exchange swap agreements Cash flow 35 (49) - -
Foreign exchange spot and forward contracts Cash flow - (5) - -
Foreign exchange spot and forward contracts Net investment 11 (6) 3 (3)
Derivative financial instruments - designated in hedging relationships 2,131 (2,650) 3,709 (3,551)
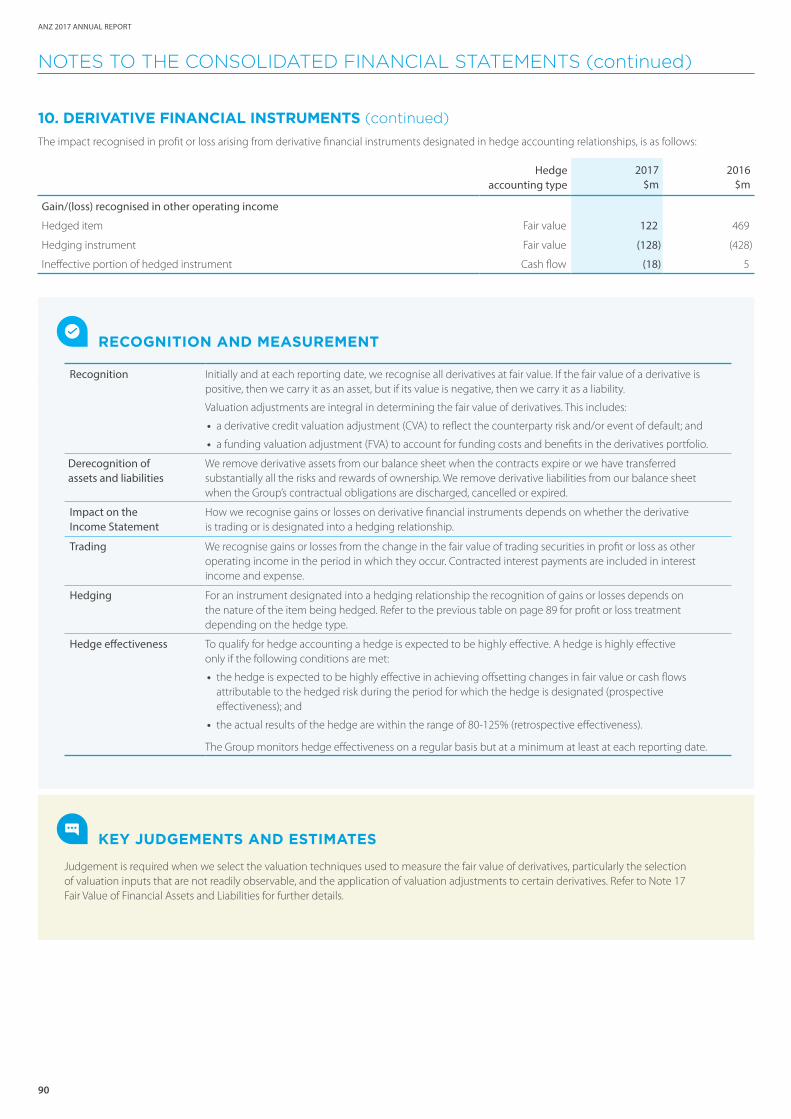
90
ANZ 2017 ANNUAL REPORT
NOTES TO THE CONSOLIDATED FINANCIAL STATEMENTS (continued)
10. DERIVATIVE FINANCIAL INSTRUMENTS (continued)
The impact recognised in profit or loss arising from derivative financial instruments designated in hedge accounting relationships, is as follows:
Hedge accounting type
2017 2016$m $m
Gain/(loss) recognised in other operating income
Hedged item Fair value 122 469
Hedging instrument Fair value (128) (428)
Ineffective portion of hedged instrument Cash flow (18) 5
RECOGNITION AND MEASUREMENT
Recognition Initially and at each reporting date, we recognise all derivatives at fair value. If the fair value of a derivative is positive, then we carry it as an asset, but if its value is negative, then we carry it as a liability.
Valuation adjustments are integral in determining the fair value of derivatives. This includes:
• a derivative credit valuation adjustment (CVA) to reflect the counterparty risk and/or event of default; and
• a funding valuation adjustment (FVA) to account for funding costs and benefits in the derivatives portfolio.
Derecognition of assets and liabilities
We remove derivative assets from our balance sheet when the contracts expire or we have transferred substantially all the risks and rewards of ownership. We remove derivative liabilities from our balance sheet when the Group’s contractual obligations are discharged, cancelled or expired.
Impact on the Income Statement
How we recognise gains or losses on derivative financial instruments depends on whether the derivative is trading or is designated into a hedging relationship.
Trading We recognise gains or losses from the change in the fair value of trading securities in profit or loss as other operating income in the period in which they occur. Contracted interest payments are included in interest income and expense.
Hedging For an instrument designated into a hedging relationship the recognition of gains or losses depends on the nature of the item being hedged. Refer to the previous table on page 89 for profit or loss treatment depending on the hedge type.
Hedge effectiveness To qualify for hedge accounting a hedge is expected to be highly effective. A hedge is highly effective only if the following conditions are met:
• the hedge is expected to be highly effective in achieving offsetting changes in fair value or cash flows attributable to the hedged risk during the period for which the hedge is designated (prospective effectiveness); and
• the actual results of the hedge are within the range of 80-125% (retrospective effectiveness).
The Group monitors hedge effectiveness on a regular basis but at a minimum at least at each reporting date.
KEY JUDGEMENTS AND ESTIMATES
Judgement is required when we select the valuation techniques used to measure the fair value of derivatives, particularly the selection of valuation inputs that are not readily observable, and the application of valuation adjustments to certain derivatives. Refer to Note 17 Fair Value of Financial Assets and Liabilities for further details.
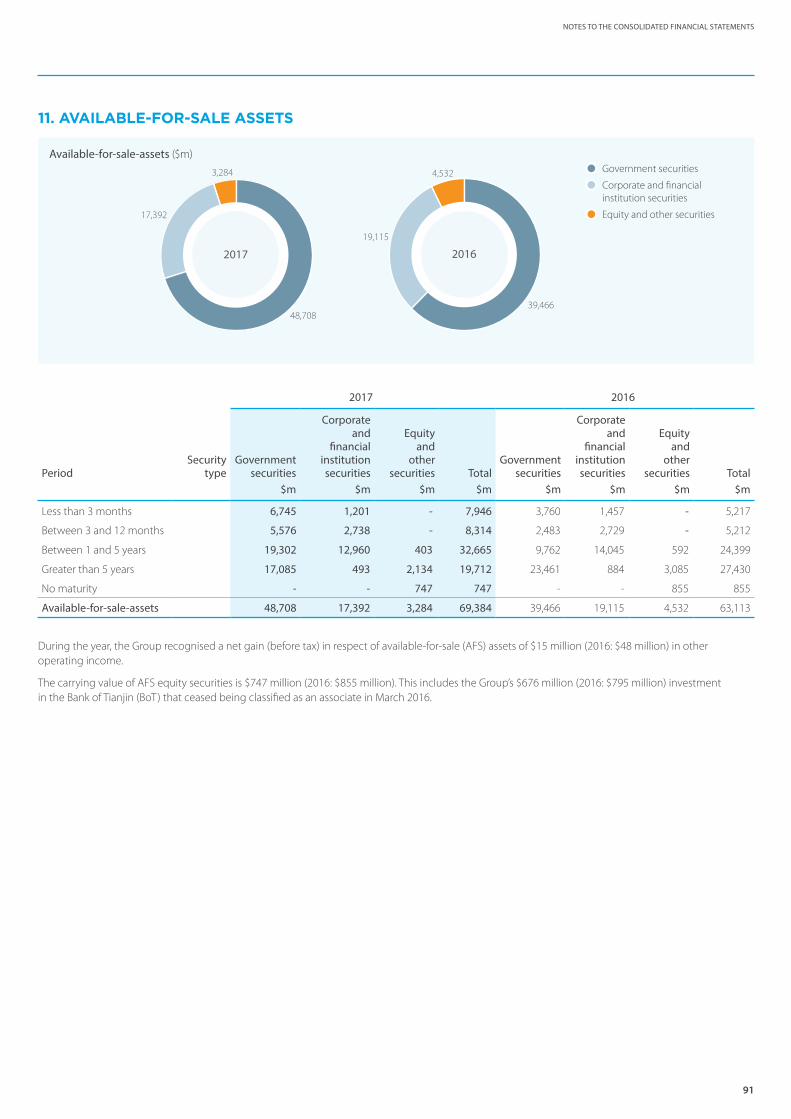
91
NOTES TO THE CONSOLIDATED FINANCIAL STATEMENTS
11. AVAILABLE-FOR-SALE ASSETS
2017 2016
PeriodSecurity
typeGovernment
securities
Corporate and
financial institutionsecurities
Equity and
othersecurities Total
Governmentsecurities
Corporate and
financial institutionsecurities
Equity and
othersecurities Total
$m $m $m $m $m $m $m $m
Less than 3 months 6,745 1,201 - 7,946 3,760 1,457 - 5,217
Between 3 and 12 months 5,576 2,738 - 8,314 2,483 2,729 - 5,212
Between 1 and 5 years 19,302 12,960 403 32,665 9,762 14,045 592 24,399
Greater than 5 years 17,085 493 2,134 19,712 23,461 884 3,085 27,430
No maturity - - 747 747 - - 855 855
Available-for-sale-assets 48,708 17,392 3,284 69,384 39,466 19,115 4,532 63,113
During the year, the Group recognised a net gain (before tax) in respect of available-for-sale (AFS) assets of $15 million (2016: $48 million) in other operating income.
The carrying value of AFS equity securities is $747 million (2016: $855 million). This includes the Group’s $676 million (2016: $795 million) investment in the Bank of Tianjin (BoT) that ceased being classified as an associate in March 2016.
Available-for-sale-assets ($m)● Government securities
● Corporate and financial institution securities
● Equity and other securities
48,708
17,392
3,284
2017
39,466
19,115
4,532
2016
92
ANZ 2017 ANNUAL REPORT
NOTES TO THE CONSOLIDATED FINANCIAL STATEMENTS (continued)
11. AVAILABLE-FOR-SALE ASSETS (continued)
RECOGNITION AND MEASUREMENT
AFS assets comprise non-derivative financial assets which we designate as AFS since we do not hold them principally for trading purposes. They include both equity and debt securities. AFS assets are initially recognised at fair value plus transaction costs and are revalued at least bi-annually. On revaluation, we include movements in fair value within the available-for-sale revaluation reserve in equity, except for certain items which are recognised directly in profit or loss, being interest on debt securities, dividends received, foreign exchange on debt securities and impairment charges.
When we sell the asset, any cumulative gain or loss from the available-for-sale revaluation reserve is recognised in profit or loss.
At each reporting date, we assess whether any AFS assets are impaired. We assess the impairment of any debt securities if an event has occurred which will have a negative impact on the asset’s estimated cash flows. For equity securities, we assess if there is a significant or prolonged decline in fair value below cost.
If an AFS asset is impaired, then we remove the cumulative loss related to that asset from the available-for-sale revaluation reserve. We then recognise it in profit or loss for:
• debt instruments, as a credit impairment expense; and
• equity instruments, as a negative impact in other operating income.
We recognise any later reversals of impairment on debt securities in the profit or loss through the credit impairment charge line. However, we do not make any reversals of impairment for equity securities. To the extent previously impaired equity securities recover in value, gains are recognised directly in equity.
KEY JUDGEMENTS AND ESTIMATES
Judgement is required when we select valuation techniques used to measure the fair value of AFS assets not valued using quoted market prices, particularly the selection of valuation inputs that are not readily observable. Refer to Note 17 Fair Value of Financial Assets and Liabilities for further details.
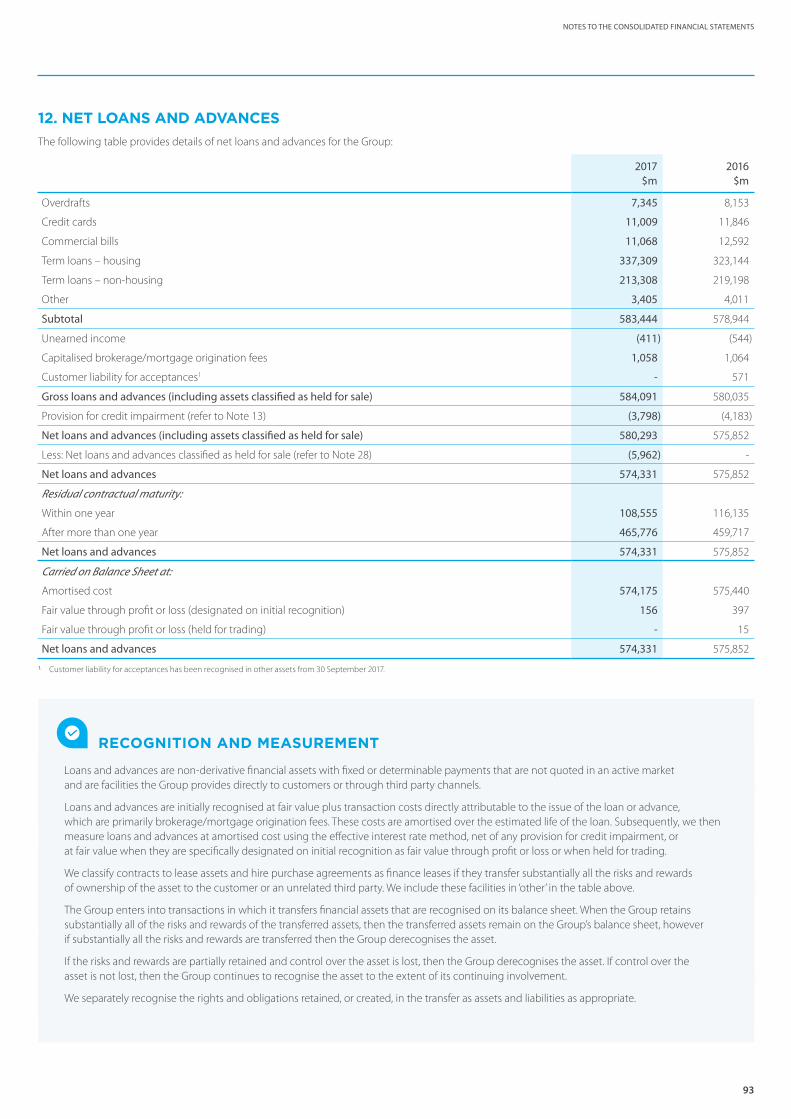
93
NOTES TO THE CONSOLIDATED FINANCIAL STATEMENTS
12. NET LOANS AND ADVANCESThe following table provides details of net loans and advances for the Group:
2017 2016$m $m
Overdrafts 7,345 8,153
Credit cards 11,009 11,846
Commercial bills 11,068 12,592
Term loans – housing 337,309 323,144
Term loans – non-housing 213,308 219,198
Other 3,405 4,011
Subtotal 583,444 578,944
Unearned income (411) (544)
Capitalised brokerage/mortgage origination fees 1,058 1,064
Customer liability for acceptances1 - 571
Gross loans and advances (including assets classified as held for sale) 584,091 580,035
Provision for credit impairment (refer to Note 13) (3,798) (4,183)
Net loans and advances (including assets classified as held for sale) 580,293 575,852
Less: Net loans and advances classified as held for sale (refer to Note 28) (5,962) -
Net loans and advances 574,331 575,852
Residual contractual maturity:
Within one year 108,555 116,135
After more than one year 465,776 459,717
Net loans and advances 574,331 575,852
Carried on Balance Sheet at:
Amortised cost 574,175 575,440
Fair value through profit or loss (designated on initial recognition) 156 397
Fair value through profit or loss (held for trading) - 15
Net loans and advances 574,331 575,852
1. Customer liability for acceptances has been recognised in other assets from 30 September 2017.
RECOGNITION AND MEASUREMENT
Loans and advances are non-derivative financial assets with fixed or determinable payments that are not quoted in an active market and are facilities the Group provides directly to customers or through third party channels.
Loans and advances are initially recognised at fair value plus transaction costs directly attributable to the issue of the loan or advance, which are primarily brokerage/mortgage origination fees. These costs are amortised over the estimated life of the loan. Subsequently, we then measure loans and advances at amortised cost using the effective interest rate method, net of any provision for credit impairment, or at fair value when they are specifically designated on initial recognition as fair value through profit or loss or when held for trading.
We classify contracts to lease assets and hire purchase agreements as finance leases if they transfer substantially all the risks and rewards of ownership of the asset to the customer or an unrelated third party. We include these facilities in ‘other’ in the table above.
The Group enters into transactions in which it transfers financial assets that are recognised on its balance sheet. When the Group retains substantially all of the risks and rewards of the transferred assets, then the transferred assets remain on the Group’s balance sheet, however if substantially all the risks and rewards are transferred then the Group derecognises the asset.
If the risks and rewards are partially retained and control over the asset is lost, then the Group derecognises the asset. If control over the asset is not lost, then the Group continues to recognise the asset to the extent of its continuing involvement.
We separately recognise the rights and obligations retained, or created, in the transfer as assets and liabilities as appropriate.
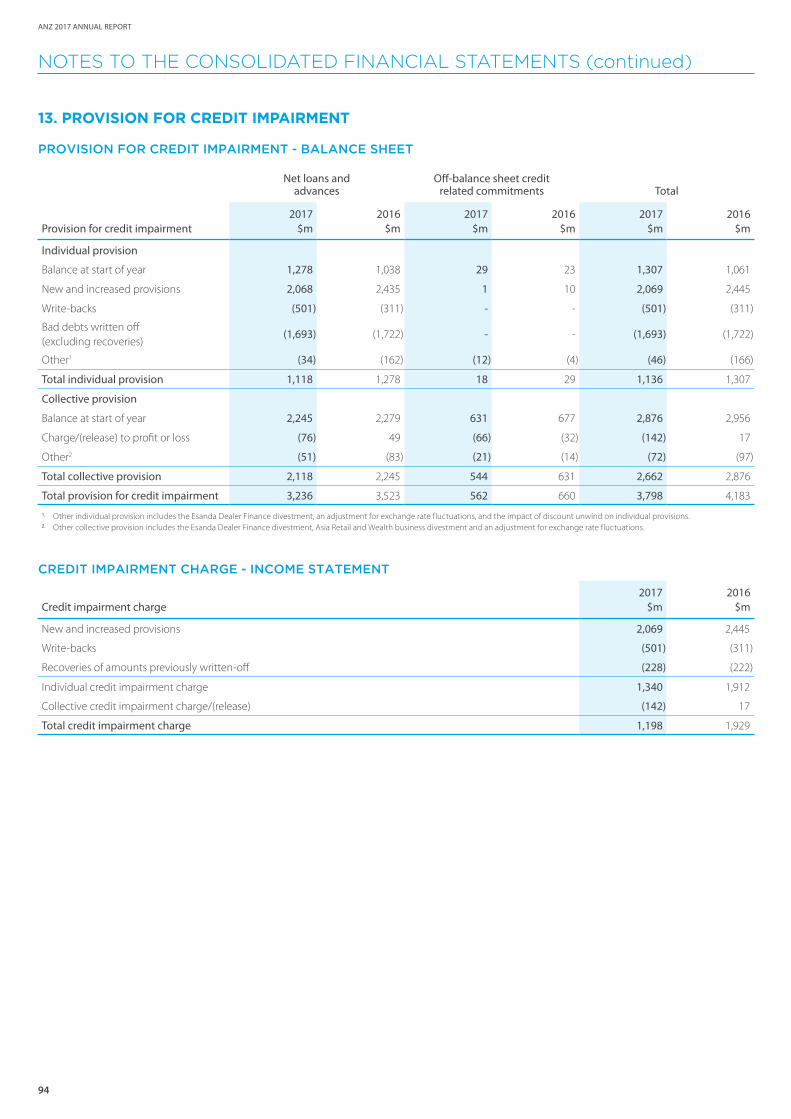
94
ANZ 2017 ANNUAL REPORT
NOTES TO THE CONSOLIDATED FINANCIAL STATEMENTS (continued)
13. PROVISION FOR CREDIT IMPAIRMENT
PROVISION FOR CREDIT IMPAIRMENT - BALANCE SHEET
Net loans and Off-balance sheet creditTotal advances related commitments
Provision for credit impairment2017 2016 2017 2016 2017 2016
$m $m $m $m $m $m
Individual provision
Balance at start of year 1,278 1,038 29 23 1,307 1,061
New and increased provisions 2,068 2,435 1 10 2,069 2,445
Write-backs (501) (311) - - (501) (311)
Bad debts written off (excluding recoveries)
(1,693) (1,722) - - (1,693) (1,722)
Other1 (34) (162) (12) (4) (46) (166)
Total individual provision 1,118 1,278 18 29 1,136 1,307
Collective provision
Balance at start of year 2,245 2,279 631 677 2,876 2,956
Charge/(release) to profit or loss (76) 49 (66) (32) (142) 17
Other2 (51) (83) (21) (14) (72) (97)
Total collective provision 2,118 2,245 544 631 2,662 2,876
Total provision for credit impairment 3,236 3,523 562 660 3,798 4,183
1. Other individual provision includes the Esanda Dealer Finance divestment, an adjustment for exchange rate fluctuations, and the impact of discount unwind on individual provisions.2. Other collective provision includes the Esanda Dealer Finance divestment, Asia Retail and Wealth business divestment and an adjustment for exchange rate fluctuations.
CREDIT IMPAIRMENT CHARGE - INCOME STATEMENT
Credit impairment charge2017 2016
$m $m
New and increased provisions 2,069 2,445
Write-backs (501) (311)
Recoveries of amounts previously written-off (228) (222)
Individual credit impairment charge 1,340 1,912
Collective credit impairment charge/(release) (142) 17
Total credit impairment charge 1,198 1,929
95
NOTES TO THE CONSOLIDATED FINANCIAL STATEMENTS
13. PROVISION FOR CREDIT IMPAIRMENT (continued)
RECOGNITION AND MEASUREMENT
The Group recognises two types of impairment provisions for its loans and advances:
• Individual provisions for significant assets that are assessed to be impaired; and
• Collective provisions for portfolios of similar assets that are assessed collectively for impairment.
The accounting treatment for each of them is detailed below:
Individually Collectively
Assessment If any impaired loans and advances exceed specified thresholds and an impairment event has been identified, then we assess the need for a provision individually.
To allow for any small value loans and advances where losses may have been incurred but not yet identified, and individually significant loans and advances that we do not assess as impaired, we assess them collectively in pools of assets with similar risk characteristics.
Impairment Loans and advances are assessed as impaired if we have objective evidence that we may not recover principal or interest payments (that is, a loss event has been incurred) and we can reliably measure the impairment.
We estimate the provision on the basis of historical loss experience for assets with credit risk characteristics similar to others in the respective collective pool. We adjust the historical loss experience based on current observable data – such as: changing economic conditions, the impact of the inherent risk of large concentrated losses within the portfolio and an assessment of the economic cycle.
Measurement We measure impairment loss as the difference between the asset’s carrying amount and estimated future cash flows discounted to their present value at the asset’s original effective interest rate. We record the result as an expense in profit or loss in the period we identify the impairment and recognise a corresponding reduction in the carrying amount of loans and advances through an offsetting provision.
Uncollectable amounts
If a loan or advance is uncollectable (whether partially or in full), then we write off the balance (and also any related provision for credit impairment).
We write off unsecured retail facilities at the earlier of the facility becoming 180 days past due, or the customer’s bankruptcy or similar legal release from the obligation to repay the loan or advance. For secured facilities, write offs occur net of the proceeds determined to be recoverable from the realisation of collateral.
Recoveries If we recover any cash flows from loans and advances we have previously written off, then we recognise the recovery in profit or loss in the period the cash flows are received.
Off-balance sheet amounts
Any off-balance sheet items, such as loan commitments, are considered for impairment both on an individual and collective basis.
KEY JUDGEMENTS AND ESTIMATES
When we measure impairment of loans and advances, we use management’s judgement of the extent of losses at reporting date.
Individually Collectively
Key Judgements • Estimated future cash flows
• Business prospects for the customer
• Realisable value of any collateral
• Group’s position relative to other claimants
• Reliability of customer information
• Likely cost and duration of recovering loans
• Estimated future cash flows
• Historical loss experience of assets with similar risk characteristics
• Impact of large concentrated losses inherent in the portfolio
• Assessment of the economic cycle
We regularly review our key judgements and update them to reflect actual loss experience.
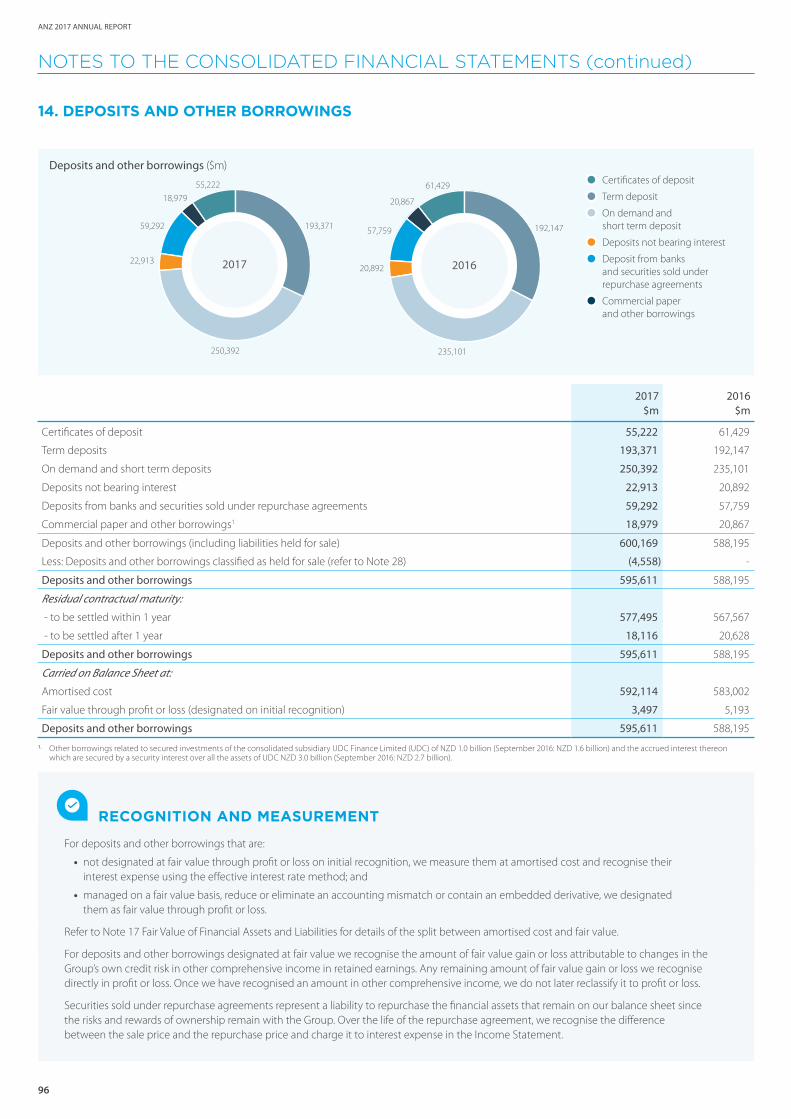
96
ANZ 2017 ANNUAL REPORT
14. DEPOSITS AND OTHER BORROWINGS
2017 2016$m $m
Certificates of deposit 55,222 61,429
Term deposits 193,371 192,147
On demand and short term deposits 250,392 235,101
Deposits not bearing interest 22,913 20,892
Deposits from banks and securities sold under repurchase agreements 59,292 57,759
Commercial paper and other borrowings1 18,979 20,867
Deposits and other borrowings (including liabilities held for sale) 600,169 588,195
Less: Deposits and other borrowings classified as held for sale (refer to Note 28) (4,558) -
Deposits and other borrowings 595,611 588,195
Residual contractual maturity:
- to be settled within 1 year 577,495 567,567
- to be settled after 1 year 18,116 20,628
Deposits and other borrowings 595,611 588,195
Carried on Balance Sheet at:
Amortised cost 592,114 583,002
Fair value through profit or loss (designated on initial recognition) 3,497 5,193
Deposits and other borrowings 595,611 588,1951. Other borrowings related to secured investments of the consolidated subsidiary UDC Finance Limited (UDC) of NZD 1.0 billion (September 2016: NZD 1.6 billion) and the accrued interest thereon
which are secured by a security interest over all the assets of UDC NZD 3.0 billion (September 2016: NZD 2.7 billion).
RECOGNITION AND MEASUREMENT
For deposits and other borrowings that are:
• not designated at fair value through profit or loss on initial recognition, we measure them at amortised cost and recognise their interest expense using the effective interest rate method; and
• managed on a fair value basis, reduce or eliminate an accounting mismatch or contain an embedded derivative, we designated them as fair value through profit or loss.
Refer to Note 17 Fair Value of Financial Assets and Liabilities for details of the split between amortised cost and fair value.
For deposits and other borrowings designated at fair value we recognise the amount of fair value gain or loss attributable to changes in the Group’s own credit risk in other comprehensive income in retained earnings. Any remaining amount of fair value gain or loss we recognise directly in profit or loss. Once we have recognised an amount in other comprehensive income, we do not later reclassify it to profit or loss.
Securities sold under repurchase agreements represent a liability to repurchase the financial assets that remain on our balance sheet since the risks and rewards of ownership remain with the Group. Over the life of the repurchase agreement, we recognise the difference between the sale price and the repurchase price and charge it to interest expense in the Income Statement.
NOTES TO THE CONSOLIDATED FINANCIAL STATEMENTS (continued)
Deposits and other borrowings ($m)● Certificates of deposit
● Term deposit
● On demand and short term deposit
● Deposits not bearing interest
● Deposit from banks and securities sold under repurchase agreements
● Commercial paper and other borrowings
193,371
18,979
59,292
22,913
250,392
55,222
2017
192,147
20,867
57,759
20,892
235,101
61,429
2016

97
NOTES TO THE CONSOLIDATED FINANCIAL STATEMENTS
15. DEBT ISSUANCES The Group uses a variety of funding programmes to issue senior debt (including covered bonds and securitisations) and subordinated debt. The difference between senior debt and subordinated debt is that holders of senior debt take priority over holders of subordinated debt owed by the relevant issuer and subordinated debt will be repaid by the relevant issuer only after the repayment of claims of depositors, other creditors and the senior debt holders.
2017 2016$m $m
Senior debt 68,852 70,041
Covered bonds 19,859 21,039
Securitisation 1,552 -
Total unsubordinated debt 90,263 91,080
Subordinated debt
- Additional Tier 1 capital 8,452 9,493
- Tier 2 capital 9,258 12,471
Total subordinated debt 17,710 21,964
Total debt issued 107,973 113,044
TOTAL DEBT ISSUED BY CURRENCYThe table below shows the Group’s issued debt by currency of issue, which broadly represents the debt holders’ base location.
2017 2016$m $m
USD United States Dollars 45,799 44,536
EUR Euro 22,507 25,141
AUD Australian Dollars 23,194 24,083
NZD New Zealand Dollars 6,361 6,972
JPY Japanese Yen 3,233 4,069
CHF Swiss Francs 2,248 2,074
GBP Pounds Sterling 854 1,744
HKD Hong Kong Dollars 1,136 1,188
OtherChinese Yuan, Norwegian Kroner, Turkish Lira, Singapore Dollars, Canadian Dollars, Mexican Peso and South African Rand
2,641 3,237
Total debt issued 107,973 113,044
Residual contractual maturity:
- to be settled within 1 year 13,458 23,348
- to be settled after 1 year 92,159 87,177
- no maturity date (instruments in perpetuity) 2,356 2,519
Total debt issued 107,973 113,044
SUBORDINATED DEBTSubordinated debt qualifies as regulatory capital for the Group and is classified as either Additional Tier 1 (AT1) capital or Tier 2 capital for APRA’s capital adequacy purposes depending on their terms and conditions:
• AT1 capital - perpetual capital instruments such as:
• ANZ Convertible Preference Shares (ANZ CPS);
• ANZ Capital Notes (ANZ CN);
• ANZ Capital Securities (ANZ CS); and
• ANZ NZ Capital Notes (ANZ NZ CN).
• Tier 2 capital - all other perpetual or term subordinated notes.
98
ANZ 2017 ANNUAL REPORT
NOTES TO THE CONSOLIDATED FINANCIAL STATEMENTS (continued)
15. DEBT ISSUANCES (continued)
AT1 CAPITALAll outstanding AT1 capital instruments (other than CPS3) are Basel III fully compliant instruments (refer to Note 22 Capital Management for further information about Basel III). For CPS3, APRA has granted the Group transitional Basel III capital treatment until 1 September 2019. CPS3, and each of the ANZ CN and ANZ CS rank equally with each other.
Distributions on the AT1 capital instruments are non-cumulative and subject to the issuer’s absolute discretion and certain payment conditions (including regulatory requirements). Distributions on CPS3 and ANZ CN are franked in line with the franking applied to ANZ ordinary shares.
Where specified, the AT1 capital instruments provide the issuer with an early redemption or conversion option on a specified date and in certain other circumstances (such as a tax or regulatory event). This option is subject to APRA’s and, in respect of the ANZ NZ CN, the Reserve Bank of New Zealand’s (RBNZ) prior written approval.
Where specified, the AT1 capital instruments will immediately convert into a variable number of ANZ ordinary shares (based on the average market price of the shares immediately prior to conversion less a 1% discount, subject to a maximum conversion number) if:
• ANZ’s or, in the case of the ANZ NZ CN, ANZ Bank New Zealand Limited’s (ANZ NZ) Common Equity Tier 1 capital ratio is equal to or less than 5.125% - known as a Common Equity Capital Trigger Event; or
• APRA notifies the Company that, without the conversion or write-off of certain securities or a public sector injection of capital (or equivalent support), it considers that the Company would become non-viable or, in the case of the ANZ NZ CN, the RBNZ directs ANZ NZ to convert or write-off the notes or a statutory manager is appointed to ANZ NZ and decides that ANZ NZ must convert or write-off the notes – known as a Non-Viability Trigger Event.
The AT1 capital instruments (other than the ANZ CS) mandatorily convert into a variable number of ANZ ordinary shares (based on the average market price of the shares immediately prior to conversion less a 1% discount):
• on a specified date; or
• on an earlier date under certain circumstances.
However the mandatory conversion is deferred for a specified period if certain conversion tests are not met.
The tables below show the key details of the Group’s AT1 capital instruments on issue at 30 September in both the current and prior year:
ANZ Convertible Preference Shares (ANZ CPS)CPS2 CPS3
Issuer ANZ ANZ
Issue date 17 December 2009 28 September 2011
Issue amount $1,968 million On 27 September 2016, ANZ bought back and cancelled $900 million of CPS2, and reinvested the proceeds into CN4. The remaining CPS2 was bought back and cancelled on 15 December 2016.
$1,340 million On 28 September 2017, ANZ bought back and cancelled $767 million of CPS3, and either reinvested the proceeds into CN5 or returned the cash proceeds to investors.
Face value $100 $100
Dividend frequency Quarterly in arrears Semi-annually in arrears
Dividend rate Floating rate: (90 day Bank Bill rate +3.1%)x (1-Australian corporate tax rate)
Floating rate: (180 day Bank Bill rate +3.1%)x (1-Australian corporate tax rate)
Issuer’s early redemption or conversion option
No 1 March 2018 and each subsequent semi-annual dividend payment date
Mandatory conversion date N/A 1 September 2019
Common equity capital trigger event No Yes
Non-viability trigger event No No
Cash dividend payments treated as interest expense
$8 million (2016: $75 million) $47 million (2016: $51 million)
Carrying value 2017 (net of issue costs) $nil million (2016: $1,068 million) $573 million (2016: $1,340 million)

99
NOTES TO THE CONSOLIDATED FINANCIAL STATEMENTS
15. DEBT ISSUANCES (continued)
ANZ Capital Notes (ANZ CN)CN1 CN2 CN3
Issuer ANZ ANZ ANZ, acting through its New Zealand branch
Issue date 7 August 2013 31 March 2014 5 March 2015
Issue amount $1,120 million $1,610 million $970 million
Face value $100 $100 $100
Distribution frequency Semi-annually in arrears Semi-annually in arrears Semi-annually in arrears
Distribution rate Floating rate: (180 day Bank Bill rate +3.4%)x(1-Australian corporate tax rate)
Floating rate: (180 day Bank Bill rate +3.25%)x(1-Australian corporate tax rate)
Floating rate: (180 day Bank Bill rate +3.6%)x(1-Australian corporate tax rate)
Issuer’s early redemption or conversion option 1 September 2021 24 March 2022 24 March 2023
Mandatory conversion date 1 September 2023 24 March 2024 24 March 2025
Common equity capital trigger event Yes Yes Yes
Non-viability trigger event Yes Yes Yes
Carrying value 2017 (net of issue costs) $1,116 million (2016: $1,115 million)
$1,604 million (2016: $1,602 million)
$963 million (2016: $962 million)
CN4 CN5
Issuer ANZ ANZ
Issue date 27 September 2016 28 September 2017
Issue amount $1,622 million $931 million
Face value $100 $100
Distribution frequency Quarterly in arrears Quarterly in arrears
Distribution rate Floating rate: (90 day Bank Bill rate +4.7%)x(1-Australian corporate tax rate)
Floating rate: (90 day Bank Bill rate +3.8%)x(1-Australian corporate tax rate)
Issuer’s early redemption or conversion option 20 March 2024 20 March 2025
Mandatory conversion date 20 March 2026 20 March 2027
Common equity capital trigger event Yes Yes
Non-viability trigger event Yes Yes
Carrying value 2017 (net of issue costs) $1,608 million (2016: $1,604 million)
$925 million (2016: $0 million)
100
ANZ 2017 ANNUAL REPORT
NOTES TO THE CONSOLIDATED FINANCIAL STATEMENTS (continued)
15. DEBT ISSUANCES (continued)
ANZ Capital Securities (ANZ CS)
Issuer ANZ, acting through its London branch
Issue date 15 June 2016
Issue amount USD 1,000 million
Face value Minimum denomination of USD 200,000 and an integral multiple of USD 1,000 above that
Interest frequency Semi-annually in arrears
Interest rateFixed at 6.75% p.a. until 15 June 2026. Reset on 15 June 2026 and each 5 year anniversary to a floating rate: 5 year USD mid-market swap rate + 5.168%
Issuer’s early redemption option 15 June 2026 and each 5 year anniversary
Common equity capital trigger event Yes
Non-viability trigger event Yes
Carrying value 2017 (net of issue costs) $1,206 million (2016: $1,329 million)
ANZ NZ Capital Notes (ANZ NZ CN)
Issuer ANZ Bank New Zealand Limited (ANZ NZ)
Issue date 31 March 2015
Issue amount NZD 500 million
Face value NZD 1
Interest frequency Quarterly in arrears
Interest rate
Fixed at 7.2% p.a. until 25 May 2020. Resets in May 2020 to a floating rate: New Zealand 3 month bank bill rate + 3.5%
Interest payments are subject to ANZ NZ’s absolute discretion and certain payment conditions (including APRA and RBNZ requirements)
Issuer’s early redemption option 25 May 2020
Mandatory conversion date 25 May 2022
Common equity capital trigger event Yes
Non-viability trigger event Yes
Carrying value 2017 (net of issue costs) $457 million (2016: $473 million)
101
NOTES TO THE CONSOLIDATED FINANCIAL STATEMENTS
15. DEBT ISSUANCES (continued)
TIER 2 CAPITALThe convertible term subordinated notes are Basel III fully compliant instruments. If a Non-Viability Trigger Event occurs, the convertible term subordinated notes will immediately convert into ANZ ordinary shares (based on the average market price of the shares immediately prior to conversion less a 1% discount, subject to a maximum conversion number).
APRA has granted transitional Basel III capital treatment for:
• all other term subordinated notes until their first call date;
• the USD 300 million perpetual subordinated notes until the end of the transitional period (December 2021); and
• the NZD 835 million perpetual subordinated notes until the April 2018 call date.
The table below shows the Tier 2 capital subordinated notes the Group holds at 30 September in both the current and prior year:
Currency Face value MaturityNext optional call date – subject to APRA’s prior approval
Interest rate
Non- Viability Trigger Event
2017$m
2016$m
Basel III transitional subordinated notes (perpetual)
USD 300m Perpetual Each semi-annual interest payment date Floating No 382 394
NZD 835m1 Perpetual 2018 Fixed No 768 796
Basel III transitional subordinated notes (term)
EUR 750m 2019 N/A Fixed No 1,205 1,224
AUD 500m 2022 2017 Floating No - 499
AUD 1,509m 2022 2017 Floating No - 1,507
USD 750m 2022 2017 Fixed No - 978
AUD 750m 2023 2018 Floating No 747 749
Total Basel III transitional subordinated notes 3,102 6,147
Basel III fully compliant convertible subordinated notes (term)
AUD 750m 2024 2019 Floating Yes 750 750
USD 800m 2024 N/A Fixed Yes 1,061 1,158
CNY 2,500m 2025 2020 Fixed Yes 478 491
SGD 500m 2027 2022 Fixed Yes 478 493
AUD 200m 2027 2022 Fixed Yes 199 199
JPY 20,000m 2026 N/A Fixed Yes 226 264
AUD 700m 2026 2021 Floating Yes 699 700
USD 1,500m 2026 N/A Fixed Yes 1,817 2,011
JPY 10,000m 2026 2021 Fixed Yes 112 129
JPY 10,000m 2028 2023 Fixed Yes 111 129
AUD 225m 2032 2027 Fixed Yes 225 -
Total Basel III fully compliant subordinated notes 6,156 6,324
Total Tier 2 capital 9,258 12,471
1. Call is subject to prior RBNZ and APRA approval.
RECOGNITION AND MEASUREMENT
Debt issuances are measured at amortised cost, except where designated at fair value through profit or loss. Where the Group enters into a hedge accounting relationship, the fair value attributable to the hedged risk is reflected in adjustments to the carrying value of the debt. Interest expense is recognised using the effective interest rate method.
Subordinated debt with capital-based conversion features (i.e. Common Equity Capital Trigger Event or Non-Viability Trigger Events) are considered to contain embedded derivatives that we account for separately at fair value through profit and loss. The embedded derivatives have no value as of the reporting date given the remote nature of those triggering events.
102
ANZ 2017 ANNUAL REPORT
NOTES TO THE CONSOLIDATED FINANCIAL STATEMENTS (continued)
16. FINANCIAL RISK MANAGEMENT
RISK MANAGEMENT FRAMEWORK AND MODEL
INTRODUCTIONThe use of financial instruments is fundamental to the Group’s businesses of providing banking and other financial services to our customers. The associated financial risks (primarily credit, market, and liquidity risks) are a significant portion of the Group’s principal risks.
We disclose details of all principal risks impacting the Group, and further information on the Group’s risk management activities, in the Governance and Risk Management section.
This note details the Group’s financial risk management policies, processes and quantitative disclosures in relation to the key financial risks:
Principal financial risks Key sections applicable to this risk
Overview • An overview of our Risk Management Framework
Credit risk
Credit risk is the risk of financial loss from a customer, or counterparty, failing to meet their financial obligations – including the whole and timely payment of principal, interest, collateral, and other receivables.
• Credit risk overview, management and control responsibilities
• Maximum exposure to credit risk
• Credit quality
• Concentrations of credit risk
• Collateral management
Market risk
Market risk is the risk of loss arising from potential adverse changes in the value of the Group’s assets and liabilities and other trading positions from fluctuations in market variables. These variables include, but are not limited to interest rates, foreign exchange, equity prices, commodity prices, credit spreads, implied volatilities, and asset correlations.
• Market risk overview, management and control responsibilities
• Measurement of market risk
• Traded and Non-traded market risk
• Equity securities classified as Available-for-sale
• Foreign currency risk – structural exposures
Liquidity and funding risk
Liquidity risk is the risk that the Group is unable to meet its payment obligations when they fall due; or does not have the appropriate amount, tenor and composition of funding and liquidity to fund increases in its assets.
Refer to Note 29 Life Insurance Business for details of the insurance and funds management risk management.
• Liquidity risk overview, management and control responsibilities
• Key areas of measurement for liquidity risk
• Funding position
• Residual contractual maturity analysis of the Group’s liabilities
103
NOTES TO THE CONSOLIDATED FINANCIAL STATEMENTS
16. FINANCIAL RISK MANAGEMENT (continued)
OVERVIEW
AN OVERVIEW OF OUR RISK MANAGEMENT FRAMEWORK This overview is provided to aid the users of the financial statements to understand the context of the financial disclosures required under AASB 7 Financial Instruments: Disclosures. It should be read in conjunction with the Governance and Risk Management section.
The Board is responsible for establishing and overseeing the Group’s Risk Management Framework (RMF). The Board has delegated authority to the Board Risk Committee (BRC) to develop and monitor compliance with the Group’s risk management policies. The BRC reports regularly to the Board on its activities.
The Board approves the strategic objectives of the Group including:
• the Risk Appetite Statement (RAS), sets out the Board’s expectations regarding the degree of risk that ANZ is prepared to accept in pursuit of its strategic objectives and business plan; and
• the Risk Management Strategy (RMS), which describes ANZ’s strategy for managing risks and the key elements of the Risk Management Framework (RMF) that gives effect to this strategy. This includes a description of each material risk, and an overview of how the RMF addresses each risk, with reference to the relevant policies, standards and procedures. It also includes information on how ANZ identifies measures, evaluates, monitors, reports and controls or mitigates material risks.
The Group, through its training and management standards and procedures, aims to maintain a disciplined and robust control environment in which all employees understand their roles and obligations. At ANZ, risk is everyone’s responsibility.
The Group has an independent risk management function, headed by the Chief Risk Officer who:
• is responsible for overseeing the risk profile and the risk management framework;
• can effectively challenge activities and decisions that materially affect ANZ’s risk profile; and
• has an independent reporting line to the BRC to enable the appropriate escalation of issues of concern.
The Internal Audit Function reports directly to the Board Audit Committee (BAC). Internal Audit provides:
• an independent evaluation of the Group’s RMF annually and undertakes a comprehensive review every three years;
• assurance on the appropriateness, effectiveness and adequacy of the risk management framework, which includes assurance the framework is operating effectively; and
• recommendations to improve the framework and/or work practices to strengthen the effectiveness of day to day operations.

104
ANZ 2017 ANNUAL REPORT
NOTES TO THE CONSOLIDATED FINANCIAL STATEMENTS (continued)
16. FINANCIAL RISK MANAGEMENT (continued)
CREDIT RISK
CREDIT RISK OVERVIEW, MANAGEMENT AND CONTROL RESPONSIBILITIESGranting credit facilities to customers is one of the Group’s major sources of income. As this activity is also a principal risk, the Group dedicates considerable resources to its management. The Group assumes credit risk in a wide range of lending and other activities in diverse markets and in many jurisdictions. Credit risks arise from traditional lending to customers as well as from inter-bank, treasury, trade finance and capital markets activities around the world.
Our credit risk management framework ensures we apply a consistent approach across the Group when we measure, monitor and manage the credit risk appetite set by the Board. The Board is assisted and advised by the BRC in discharging its duty to oversee credit risk. The BRC:
• sets the credit risk appetite and credit strategies; and
• approves credit transactions beyond the discretion of executive management.
We quantify credit risk through an internal credit rating system (masterscales) to ensure consistency across exposure types and to provide a consistent framework for reporting and analysis. The system uses models and other tools to measure the following for customer exposures:
Probability of Default (PD) Expressed by a Customer Credit Rating (CCR), reflecting the Group’s assessment of a customer’s ability to service and repay debt.
Exposure at Default (EAD) The expected amount of loan outstanding at the time of default.
Loss in the Event of Default (LGD) Expressed by a Security Indicator (SI) ranging from A to G. The SI is calculated by reference to the percentage of loan covered by security which the Group can realise if a customer defaults. The A-G scale is supplemented by a range of other SIs which cover such factors as cash cover and sovereign backing. For some customers, we group exposures into large homogenous pools - and the LGD is assigned at the pool level.
Our specialist credit risk teams develop and validate the Group’s PD and LGD rating models. The outputs from these models drive our day-to-day credit risk management decisions including origination, pricing, approval levels, regulatory capital adequacy, economic capital allocation, and credit provisioning.
All customers with whom ANZ has a credit relationship are assigned a CCR at origination via either of the following assessment approaches:
Large and more complex lending Retail and some small business lending
Rating models provide a consistent and structured assessment, with judgement required around the use of out-of-model factors. We handle credit approval on a dual approval basis, jointly with the business writer and an independent credit officer.
Automated assessment of credit applications using a combination of scoring (application and behavioural), policy rules and external credit reporting information. If the application does not meet the automated assessment criteria, then it is referred out for manual assessment.
We use the Group’s internal CCRs to manage the credit quality of financial assets neither past due nor impaired. To enable wider comparisons, the Group’s CCRs are mapped to external rating agency scales as follows:
Internal Rating ANZ Customer Requirements Moody’s Rating Standard & Poors Rating
Strong credit profile Demonstrated superior stability in their operating and financial performance over the long-term, and whose capacity is not significantly vulnerable to foreseeable events.
Aaa - Baa3 AAA - BBB-
Satisfactory risk Demonstrated sound operational and financial stability over the medium to long-term — even though some may be susceptible to cyclical trends or variability in earnings.
Ba1 - Ba3 BB+ - BB-
Sub-standard but not past due nor impaired
Demonstrated some operational and financial instability, with variability and uncertainty in profitability and liquidity projected to continue over the short and possibly medium term.
B1 - Caa B+ - CCC
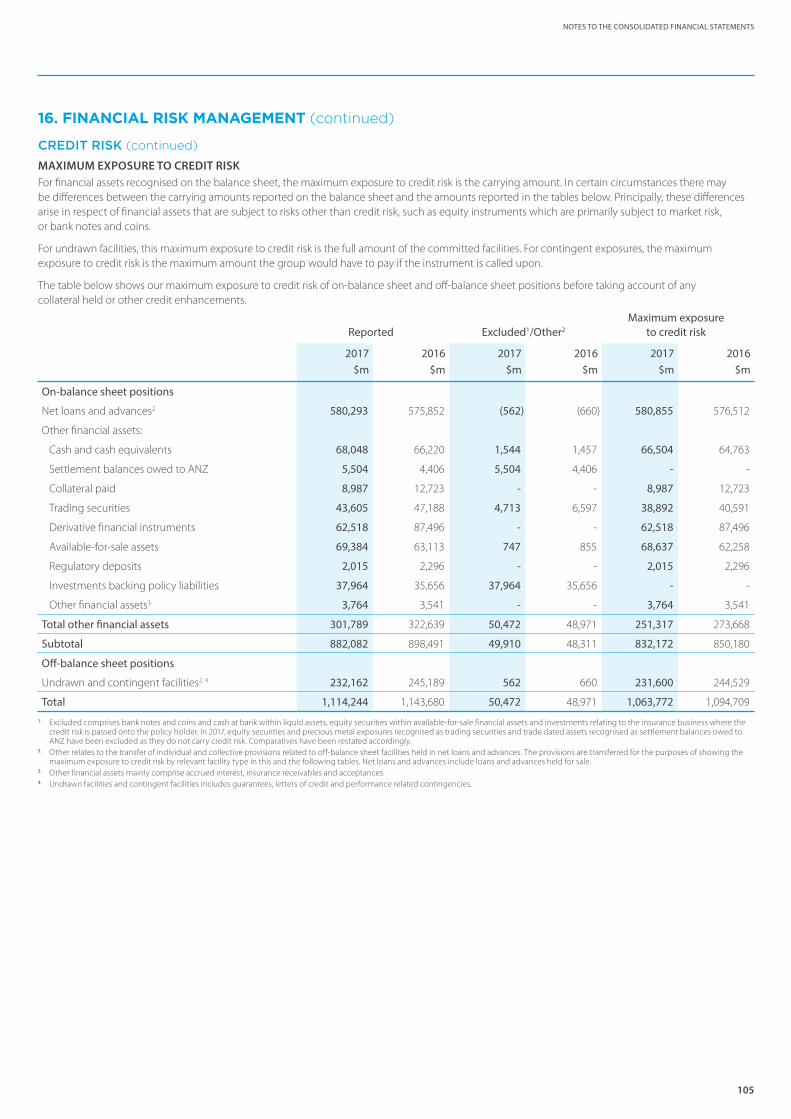
105
NOTES TO THE CONSOLIDATED FINANCIAL STATEMENTS
16. FINANCIAL RISK MANAGEMENT (continued)
CREDIT RISK (continued)
MAXIMUM EXPOSURE TO CREDIT RISK For financial assets recognised on the balance sheet, the maximum exposure to credit risk is the carrying amount. In certain circumstances there may be differences between the carrying amounts reported on the balance sheet and the amounts reported in the tables below. Principally, these differences arise in respect of financial assets that are subject to risks other than credit risk, such as equity instruments which are primarily subject to market risk, or bank notes and coins.
For undrawn facilities, this maximum exposure to credit risk is the full amount of the committed facilities. For contingent exposures, the maximum exposure to credit risk is the maximum amount the group would have to pay if the instrument is called upon.
The table below shows our maximum exposure to credit risk of on-balance sheet and off-balance sheet positions before taking account of any collateral held or other credit enhancements.
Reported Excluded1/Other2
Maximum exposureto credit risk
2017 2016 2017 2016 2017 2016$m $m $m $m $m $m
On-balance sheet positions
Net loans and advances2 580,293 575,852 (562) (660) 580,855 576,512
Other financial assets:
Cash and cash equivalents 68,048 66,220 1,544 1,457 66,504 64,763
Settlement balances owed to ANZ 5,504 4,406 5,504 4,406 - -
Collateral paid 8,987 12,723 - - 8,987 12,723
Trading securities 43,605 47,188 4,713 6,597 38,892 40,591
Derivative financial instruments 62,518 87,496 - - 62,518 87,496
Available-for-sale assets 69,384 63,113 747 855 68,637 62,258
Regulatory deposits 2,015 2,296 - - 2,015 2,296
Investments backing policy liabilities 37,964 35,656 37,964 35,656 - -
Other financial assets3 3,764 3,541 - - 3,764 3,541
Total other financial assets 301,789 322,639 50,472 48,971 251,317 273,668
Subtotal 882,082 898,491 49,910 48,311 832,172 850,180
Off-balance sheet positions
Undrawn and contingent facilities2, 4 232,162 245,189 562 660 231,600 244,529
Total 1,114,244 1,143,680 50,472 48,971 1,063,772 1,094,709
1. Excluded comprises bank notes and coins and cash at bank within liquid assets, equity securities within available-for-sale financial assets and investments relating to the insurance business where the credit risk is passed onto the policy holder. In 2017, equity securities and precious metal exposures recognised as trading securities and trade dated assets recognised as settlement balances owed to ANZ have been excluded as they do not carry credit risk. Comparatives have been restated accordingly.
2. Other relates to the transfer of individual and collective provisions related to off-balance sheet facilities held in net loans and advances. The provisions are transferred for the purposes of showing the maximum exposure to credit risk by relevant facility type in this and the following tables. Net loans and advances include loans and advances held for sale.
3. Other financial assets mainly comprise accrued interest, insurance receivables and acceptances.4. Undrawn facilities and contingent facilities includes guarantees, letters of credit and performance related contingencies.
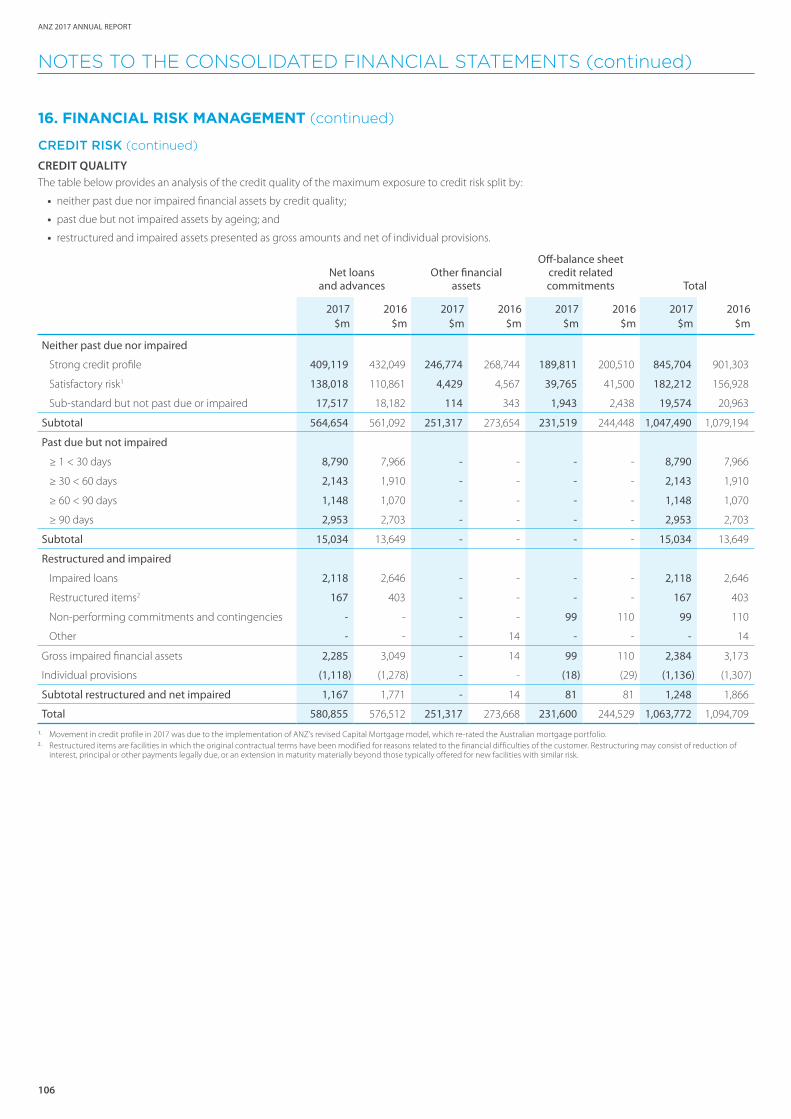
106
ANZ 2017 ANNUAL REPORT
NOTES TO THE CONSOLIDATED FINANCIAL STATEMENTS (continued)
16. FINANCIAL RISK MANAGEMENT (continued)
CREDIT RISK (continued)
CREDIT QUALITYThe table below provides an analysis of the credit quality of the maximum exposure to credit risk split by:
• neither past due nor impaired financial assets by credit quality;
• past due but not impaired assets by ageing; and
• restructured and impaired assets presented as gross amounts and net of individual provisions.
Net loans and advances
Other financial assets
Off-balance sheet credit related commitments Total
2017 2016 2017 2016 2017 2016 2017 2016$m $m $m $m $m $m $m $m
Neither past due nor impaired
Strong credit profile 409,119 432,049 246,774 268,744 189,811 200,510 845,704 901,303
Satisfactory risk1 138,018 110,861 4,429 4,567 39,765 41,500 182,212 156,928
Sub-standard but not past due or impaired 17,517 18,182 114 343 1,943 2,438 19,574 20,963
Subtotal 564,654 561,092 251,317 273,654 231,519 244,448 1,047,490 1,079,194
Past due but not impaired
≥ 1 < 30 days 8,790 7,966 - - - - 8,790 7,966
≥ 30 < 60 days 2,143 1,910 - - - - 2,143 1,910
≥ 60 < 90 days 1,148 1,070 - - - - 1,148 1,070
≥ 90 days 2,953 2,703 - - - - 2,953 2,703
Subtotal 15,034 13,649 - - - - 15,034 13,649
Restructured and impaired
Impaired loans 2,118 2,646 - - - - 2,118 2,646
Restructured items2 167 403 - - - - 167 403
Non-performing commitments and contingencies - - - - 99 110 99 110
Other - - - 14 - - - 14
Gross impaired financial assets 2,285 3,049 - 14 99 110 2,384 3,173
Individual provisions (1,118) (1,278) - - (18) (29) (1,136) (1,307)
Subtotal restructured and net impaired 1,167 1,771 - 14 81 81 1,248 1,866
Total 580,855 576,512 251,317 273,668 231,600 244,529 1,063,772 1,094,709
1. Movement in credit profile in 2017 was due to the implementation of ANZ’s revised Capital Mortgage model, which re-rated the Australian mortgage portfolio.2. Restructured items are facilities in which the original contractual terms have been modified for reasons related to the financial difficulties of the customer. Restructuring may consist of reduction of
interest, principal or other payments legally due, or an extension in maturity materially beyond those typically offered for new facilities with similar risk.
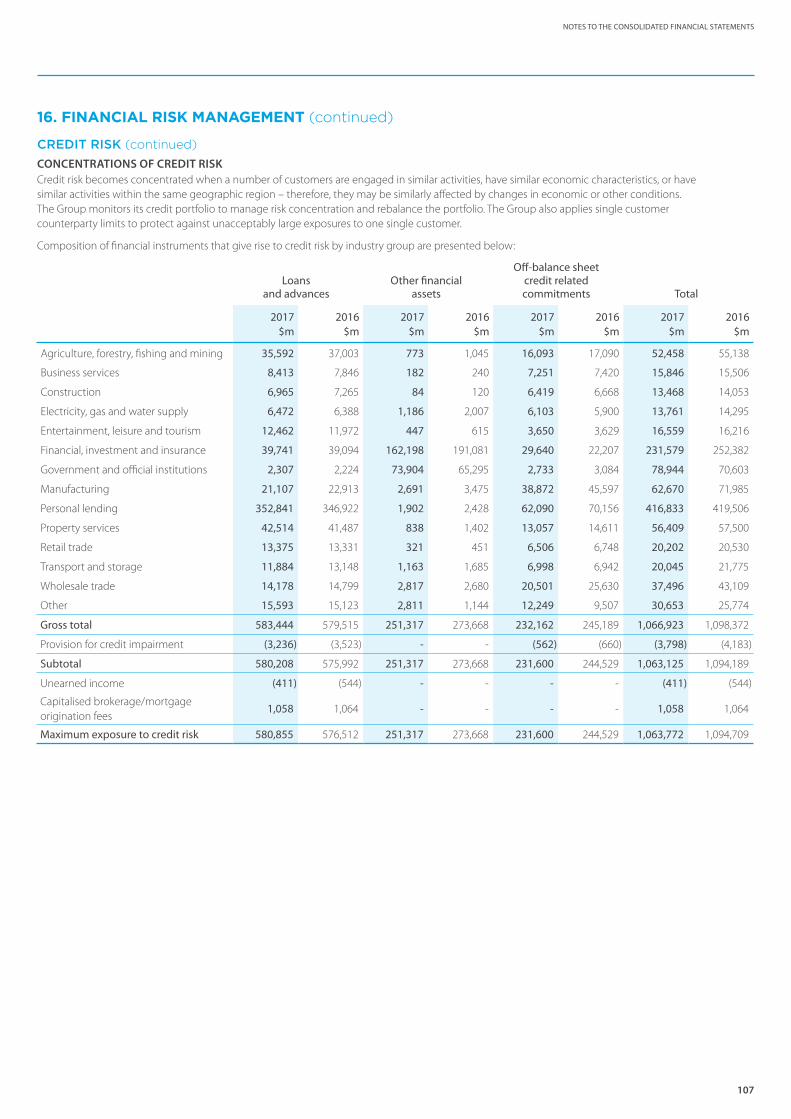
107
NOTES TO THE CONSOLIDATED FINANCIAL STATEMENTS
16. FINANCIAL RISK MANAGEMENT (continued)
CREDIT RISK (continued)
CONCENTRATIONS OF CREDIT RISKCredit risk becomes concentrated when a number of customers are engaged in similar activities, have similar economic characteristics, or have similar activities within the same geographic region – therefore, they may be similarly affected by changes in economic or other conditions. The Group monitors its credit portfolio to manage risk concentration and rebalance the portfolio. The Group also applies single customer counterparty limits to protect against unacceptably large exposures to one single customer.
Composition of financial instruments that give rise to credit risk by industry group are presented below:
Loans and advances
Other financial assets
Off-balance sheet credit related commitments Total
2017 2016 2017 2016 2017 2016 2017 2016$m $m $m $m $m $m $m $m
Agriculture, forestry, fishing and mining 35,592 37,003 773 1,045 16,093 17,090 52,458 55,138
Business services 8,413 7,846 182 240 7,251 7,420 15,846 15,506
Construction 6,965 7,265 84 120 6,419 6,668 13,468 14,053
Electricity, gas and water supply 6,472 6,388 1,186 2,007 6,103 5,900 13,761 14,295
Entertainment, leisure and tourism 12,462 11,972 447 615 3,650 3,629 16,559 16,216
Financial, investment and insurance 39,741 39,094 162,198 191,081 29,640 22,207 231,579 252,382
Government and official institutions 2,307 2,224 73,904 65,295 2,733 3,084 78,944 70,603
Manufacturing 21,107 22,913 2,691 3,475 38,872 45,597 62,670 71,985
Personal lending 352,841 346,922 1,902 2,428 62,090 70,156 416,833 419,506
Property services 42,514 41,487 838 1,402 13,057 14,611 56,409 57,500
Retail trade 13,375 13,331 321 451 6,506 6,748 20,202 20,530
Transport and storage 11,884 13,148 1,163 1,685 6,998 6,942 20,045 21,775
Wholesale trade 14,178 14,799 2,817 2,680 20,501 25,630 37,496 43,109
Other 15,593 15,123 2,811 1,144 12,249 9,507 30,653 25,774
Gross total 583,444 579,515 251,317 273,668 232,162 245,189 1,066,923 1,098,372
Provision for credit impairment (3,236) (3,523) - - (562) (660) (3,798) (4,183)
Subtotal 580,208 575,992 251,317 273,668 231,600 244,529 1,063,125 1,094,189
Unearned income (411) (544) - - - - (411) (544)
Capitalised brokerage/mortgage origination fees
1,058 1,064 - - - - 1,058 1,064
Maximum exposure to credit risk 580,855 576,512 251,317 273,668 231,600 244,529 1,063,772 1,094,709
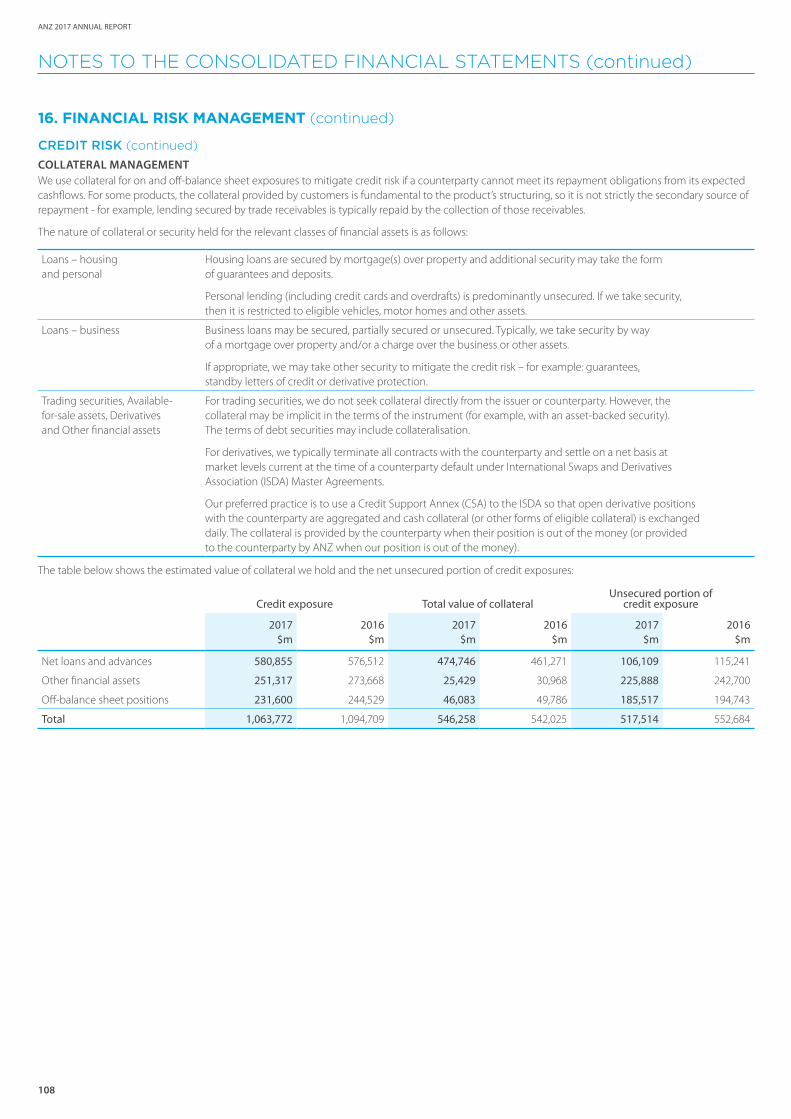
108
ANZ 2017 ANNUAL REPORT
NOTES TO THE CONSOLIDATED FINANCIAL STATEMENTS (continued)
16. FINANCIAL RISK MANAGEMENT (continued)
CREDIT RISK (continued)
COLLATERAL MANAGEMENTWe use collateral for on and off-balance sheet exposures to mitigate credit risk if a counterparty cannot meet its repayment obligations from its expected cashflows. For some products, the collateral provided by customers is fundamental to the product’s structuring, so it is not strictly the secondary source of repayment - for example, lending secured by trade receivables is typically repaid by the collection of those receivables.
The nature of collateral or security held for the relevant classes of financial assets is as follows:
Loans – housing and personal
Housing loans are secured by mortgage(s) over property and additional security may take the form of guarantees and deposits.
Personal lending (including credit cards and overdrafts) is predominantly unsecured. If we take security, then it is restricted to eligible vehicles, motor homes and other assets.
Loans – business Business loans may be secured, partially secured or unsecured. Typically, we take security by way of a mortgage over property and/or a charge over the business or other assets.
If appropriate, we may take other security to mitigate the credit risk – for example: guarantees, standby letters of credit or derivative protection.
Trading securities, Available- for-sale assets, Derivatives and Other financial assets
For trading securities, we do not seek collateral directly from the issuer or counterparty. However, the collateral may be implicit in the terms of the instrument (for example, with an asset-backed security). The terms of debt securities may include collateralisation.
For derivatives, we typically terminate all contracts with the counterparty and settle on a net basis at market levels current at the time of a counterparty default under International Swaps and Derivatives Association (ISDA) Master Agreements.
Our preferred practice is to use a Credit Support Annex (CSA) to the ISDA so that open derivative positions with the counterparty are aggregated and cash collateral (or other forms of eligible collateral) is exchanged daily. The collateral is provided by the counterparty when their position is out of the money (or provided to the counterparty by ANZ when our position is out of the money).
The table below shows the estimated value of collateral we hold and the net unsecured portion of credit exposures:
Credit exposure Total value of collateralUnsecured portion of
credit exposure
2017 2016 2017 2016 2017 2016$m $m $m $m $m $m
Net loans and advances 580,855 576,512 474,746 461,271 106,109 115,241
Other financial assets 251,317 273,668 25,429 30,968 225,888 242,700
Off-balance sheet positions 231,600 244,529 46,083 49,786 185,517 194,743
Total 1,063,772 1,094,709 546,258 542,025 517,514 552,684
109
NOTES TO THE CONSOLIDATED FINANCIAL STATEMENTS
16. FINANCIAL RISK MANAGEMENT (continued)
MARKET RISK
MARKET RISK OVERVIEW, MANAGEMENT AND CONTROL RESPONSIBILITIESMarket risk stems from ANZ’s trading and balance sheet management activities, the impact of changes and correlation between interest rates, foreign exchange rates, credit spreads and volatility in bond, commodity or equity prices.
The BRC delegates responsibility for day-to-day management of both market risks and compliance with market risk policies to the Credit & Market Risk Committee (CMRC) and the Group Asset & Liability Committee (GALCO).
Within overall strategies and policies established by the BRC, business units and risk management have joint responsibility for the control of market risk at the Group level. The Market Risk team (a specialist risk management unit independent of the business) allocates market risk limits at various levels and monitors and reports on them daily. This detailed framework allocates individual limits to manage and control exposures using risk factors and profit and loss limits.
Management, measurement and reporting of market risk, the management of market risk is undertaken in two broad categories:
Traded Market Risk Non-Traded Market Risk
Risk of loss from changes in the value of financial instruments due to movements in price factors for both physical and derivative trading positions. Principal risk categories monitored are:
1. Currency risk – potential loss arising from changes in foreign exchange rates or their implied volatilities.
2. Interest rate risk – potential loss from changes in market interest rates or their implied volatilities.
3. Credit spread risk – potential loss arising from a movement in margin or spread relative to a benchmark.
4. Commodity risk – potential loss arising from changes in commodity prices or their implied volatilities.
5. Equity risk – potential loss arising from changes in equity prices.
Risk of loss associated with the management of non-traded interest rate risk, liquidity risk and foreign exchange exposures. This includes interest rate risk in the banking book. This risk of loss arises from adverse changes in the overall and relative level of interest rates for different tenors, differences in the actual versus expected net interest margin, and the potential valuation risk associated with embedded options in financial instruments and bank products.
MEASUREMENT OF MARKET RISKWe primarily manage and control market risk using Value at Risk (VaR), sensitivity analysis and stress testing.
VaR gauges the Group’s possible daily loss based on historical market movements.
The Group’s VaR approach for both traded and non-traded risk is historical simulation. We use historical changes in market rates, prices and volatilities over:
• the previous 500 business days, to calculate standard VaR; and
• a 1-year stressed period, to calculate stressed VaR.
We calculate traded and non-traded VaR using one-day and ten-day holding periods. For stressed VaR, we use a ten-day period. Back testing is used to ensure our VaR models remain accurate.
ANZ measures VaR at a 99% confidence interval which means there is a 99% chance that a loss will not exceed the VaR on any given day.
110
ANZ 2017 ANNUAL REPORT
NOTES TO THE CONSOLIDATED FINANCIAL STATEMENTS (continued)
16. FINANCIAL RISK MANAGEMENT (continued)
MARKET RISK (continued)
TRADED AND NON-TRADED MARKET RISK
Traded market riskThe table below shows the traded market risk VaR on a diversified basis by risk categories:
30 September 2017 30 September 2016
High for Low for Average High for Low for AverageAs at year year for year As at year year for year
$m $m $m $m $m $m $m $m
Traded value at risk 99% confidence
Foreign exchange 4.2 10.5 2.5 5.1 4.0 11.4 2.2 5.2
Interest rate 6.3 21.3 5.1 7.9 4.7 20.1 4.1 9.1
Credit 4.4 5.4 2.0 3.4 3.3 4.6 2.2 3.2
Commodity 2.2 3.8 1.4 2.1 2.5 2.8 1.1 1.7
Equity - 0.5 - 0.2 0.5 2.0 0.1 0.2
Diversification benefit1 (7.6) n/a n/a (7.7) (6.8) n/a n/a (6.2)
Total VaR 9.5 24.9 6.9 11.0 8.2 25.4 6.1 13.2
1. The diversification benefit reflects risks that offset across categories. The high and low VaR figures reported for each factor did not necessarily occur on the same day as the high and low VaR reported for the Group as a whole. Consequently, a diversification benefit for high and low would not be meaningful and is therefore omitted from the table.
Non-traded market risk
Balance sheet risk managementThe principal objectives of balance sheet risk management are to maintain acceptable levels of interest rate and liquidity risk to mitigate the negative impact of movements in interest rates on the earnings and market value of the Group’s banking book, while ensuring the Group maintains sufficient liquidity to meet its obligations as they fall due.
Interest rate risk managementNon-traded interest rate risk relates to the potential adverse impact of changes in market interest rates on the Group’s future net interest income. This risk arises from two principal sources, namely mismatches between the repricing dates of interest bearing assets and liabilities; and the investment of capital and other non-interest bearing liabilities in interest bearing assets. Interest rate risk is reported using VaR and scenario analysis (based on the impact of a 1% rate shock). The table below shows VaR figures for non-traded interest rate risk for the combined Group as well as Australia, New Zealand and Asia Pacific, Europe and Americas (APEA) geographies which are calculated separately.
30 September 2017 30 September 2016
High for Low for Average High for Low for AverageAs at year year for year As at year year for year
$m $m $m $m $m $m $m $m
Non-traded value at risk 99% confidence
Australia 31.6 37.5 25.9 31.3 38.4 40.6 28.0 33.7
New Zealand 11.8 15.1 11.1 12.4 11.4 11.4 8.8 10.0
APEA 14.6 19.0 14.3 15.9 14.7 17.3 14.4 15.8
Diversification benefit1 (20.6) n/a n/a (19.7) (24.0) n/a n/a (22.9)
Total VaR 37.4 44.0 33.5 39.9 40.5 44.7 31.3 36.6
1. The diversification benefit reflects the historical correlation between the regions. The high and low VaR figures reported for the region did not necessarily occur on the same day as the high and low VaR reported for the Group as a whole. Consequently, a diversification benefit for high and low would not be meaningful and is therefore omitted from the table.
111
NOTES TO THE CONSOLIDATED FINANCIAL STATEMENTS
16. FINANCIAL RISK MANAGEMENT (continued)
MARKET RISK (continued)We undertake scenario analysis to stress test the impact of extreme events on the Group’s market risk exposures. We model an 1% overnight parallel positive shift in the yield curve to determine the potential impact on our net interest income over the next 12 months. This is a standard risk measure which assumes the parallel shift is reflected in all wholesale and customer rates.
The table below shows the outcome of this risk measure for the current and previous financial years, expressed as a percentage of reported net interest income. A positive number signifies that a rate increase is positive for net interest income over the next 12 months.
2017 2016
Impact of 1% rate shock
As at period end 0.52% 0.37%
Maximum exposure 0.65% 0.48%
Minimum exposure 0.01% 0.00%
Average exposure (in absolute terms) 0.28% 0.21%
EQUITY SECURITIES CLASSIFIED AS AVAILABLE-FOR-SALEOur available-for-sale financial assets contain equity investment holdings which predominantly comprise investments we hold for longer-term strategic reasons. The market risk impact on these equity investments is not captured by the Group’s VaR processes for traded and non-traded market risks. Therefore, the Group regularly reviews the valuations of the investments within the portfolio and assesses whether the investments are impaired based on the recognition and measurement policies set out in Note 11 Available-for-sale Assets.
FOREIGN CURRENCY RISK – STRUCTURAL EXPOSURESOur investment of capital in foreign operations — for example, branches, subsidiaries or associates with functional currencies other than the Australian Dollar — exposes the Group to the risk of changes in foreign exchange rates. Variations in the value of these foreign operations arising as a result of exchange differences are reflected in the foreign currency translation reserve in equity.
Where it is considered appropriate, the Group takes out economic hedges against larger foreign exchange denominated revenue streams (primarily New Zealand Dollar, US Dollar and US Dollar correlated). The primary objective of hedging is to ensure that, if practical, the consolidated capital ratios are neutral to the effect of changes in exchange rates. During the current and prior years, we had selective hedges in place. Further detail on the Group’s hedging relationships is disclosed in Note 10 Derivative Financial Instruments.
112
ANZ 2017 ANNUAL REPORT
NOTES TO THE CONSOLIDATED FINANCIAL STATEMENTS (continued)
16. FINANCIAL RISK MANAGEMENT (continued)
LIQUIDITY AND FUNDING RISK
LIQUIDITY RISK OVERVIEW, MANAGEMENT AND CONTROL RESPONSIBILITIESLiquidity risk is the risk that the Group is either:
• unable to meet its payment obligations (including repaying depositors or maturing wholesale debt) when they fall due; or
• does not have the appropriate amount, tenor and composition of funding and liquidity to support its assets.
Management of liquidity and funding risks are overseen by GALCO. The Group’s liquidity and funding risks are governed by a set of principles approved by the BRC and include:
• maintaining the ability to meet all payment obligations in the immediate term;
• ensuring that the Group has the ability to meet ‘survival horizons’ under a range of ANZ specific, and general market, liquidity stress scenarios, at the site and Group-wide level, to meet cash flow obligations over the short to medium term;
• maintaining strength in the Group’s balance sheet structure to ensure long term resilience in the liquidity and funding risk profile;
• ensuring the liquidity management framework is compatible with local regulatory requirements;
• preparing daily liquidity reports and scenario analysis to quantify the Group’s positions;
• targeting a diversified funding base to avoid undue concentrations by investor type, maturity, market source and currency;
• holding a portfolio of high quality liquid assets to protect against adverse funding conditions and to support day-to-day operations; and
• establishing detailed contingency plans to cover different liquidity crisis events.
KEY AREAS OF MEASUREMENT FOR LIQUIDITY RISK
Scenario modelling of funding sourcesANZ’s liquidity risk appetite is defined by a range of regulatory and internal liquidity metrics mandated by the Board. The metrics cover a range of scenarios of varying duration and level of severity.
A key component of this framework is the Liquidity Coverage Ratio (LCR), which is a severe short term liquidity stress scenario mandated by banking regulators including APRA. As part of meeting LCR requirements, the Group has a Committed Liquidity Facility (CLF) with the Reserve Bank of Australia. The CLF has been established to offset the shortage of available High Quality Liquid Assets (HQLA) in Australia and provides an alternative form of contingent liquidity. The total amount of the CLF available to a qualifying Australian Deposit-taking Institution is set annually by APRA. From 1 January 2017, ANZ’s CLF is $43.8 billion (2016 calendar year end: $50.3 billion).
Liquid assetsThe Group holds a portfolio of high quality (unencumbered) liquid assets to protect the Group’s liquidity position in a severely stressed environment, to meet regulatory requirements. HQLA comprise three categories consistent with Basel III LCR requirements:
• HQLA1 – Cash and highest credit quality government, central bank or public sector securities eligible for repurchase with central banks to provide same-day liquidity.
• HQLA2 – High credit quality government, central bank or public sector securities, high quality corporate debt securities and high quality covered bonds eligible for repurchase with central banks to provide same-day liquidity.
• Alternative liquid assets (ALA) – Assets qualifying as collateral for the CLF and eligible securities listed by Reserve Bank of New Zealand (RBNZ).
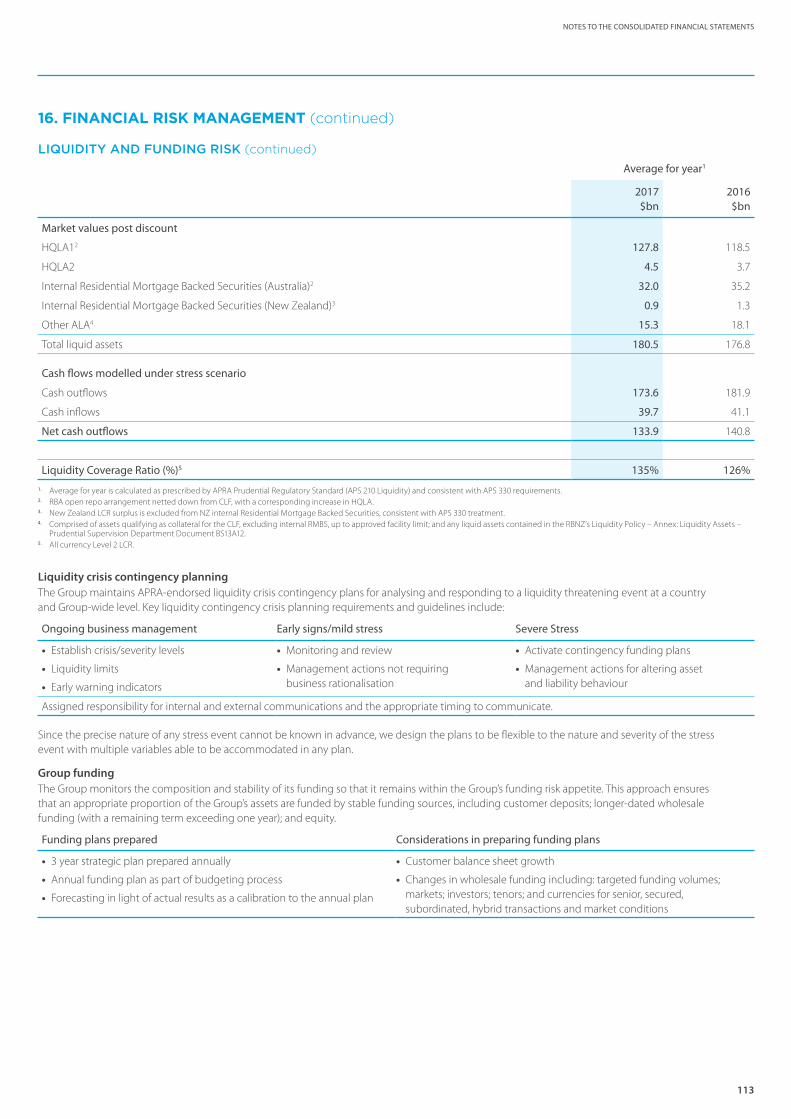
113
NOTES TO THE CONSOLIDATED FINANCIAL STATEMENTS
16. FINANCIAL RISK MANAGEMENT (continued)
LIQUIDITY AND FUNDING RISK (continued)
Average for year1
2017 2016$bn $bn
Market values post discount
HQLA12 127.8 118.5
HQLA2 4.5 3.7
Internal Residential Mortgage Backed Securities (Australia)2 32.0 35.2
Internal Residential Mortgage Backed Securities (New Zealand)3 0.9 1.3
Other ALA4 15.3 18.1
Total liquid assets 180.5 176.8
Cash flows modelled under stress scenario
Cash outflows 173.6 181.9
Cash inflows 39.7 41.1
Net cash outflows 133.9 140.8
Liquidity Coverage Ratio (%)5 135% 126%
1. Average for year is calculated as prescribed by APRA Prudential Regulatory Standard (APS 210 Liquidity) and consistent with APS 330 requirements.2. RBA open repo arrangement netted down from CLF, with a corresponding increase in HQLA.3. New Zealand LCR surplus is excluded from NZ internal Residential Mortgage Backed Securities, consistent with APS 330 treatment.4. Comprised of assets qualifying as collateral for the CLF, excluding internal RMBS, up to approved facility limit; and any liquid assets contained in the RBNZ’s Liquidity Policy – Annex: Liquidity Assets –
Prudential Supervision Department Document BS13A12.5. All currency Level 2 LCR.
Liquidity crisis contingency planningThe Group maintains APRA-endorsed liquidity crisis contingency plans for analysing and responding to a liquidity threatening event at a country and Group-wide level. Key liquidity contingency crisis planning requirements and guidelines include:
Ongoing business management Early signs/mild stress Severe Stress
• Establish crisis/severity levels
• Liquidity limits
• Early warning indicators
• Monitoring and review
• Management actions not requiring business rationalisation
• Activate contingency funding plans
• Management actions for altering asset and liability behaviour
Assigned responsibility for internal and external communications and the appropriate timing to communicate.
Since the precise nature of any stress event cannot be known in advance, we design the plans to be flexible to the nature and severity of the stress event with multiple variables able to be accommodated in any plan.
Group fundingThe Group monitors the composition and stability of its funding so that it remains within the Group’s funding risk appetite. This approach ensures that an appropriate proportion of the Group’s assets are funded by stable funding sources, including customer deposits; longer-dated wholesale funding (with a remaining term exceeding one year); and equity.
Funding plans prepared Considerations in preparing funding plans
• 3 year strategic plan prepared annually
• Annual funding plan as part of budgeting process
• Forecasting in light of actual results as a calibration to the annual plan
• Customer balance sheet growth
• Changes in wholesale funding including: targeted funding volumes; markets; investors; tenors; and currencies for senior, secured, subordinated, hybrid transactions and market conditions

114
ANZ 2017 ANNUAL REPORT
NOTES TO THE CONSOLIDATED FINANCIAL STATEMENTS (continued)
16. FINANCIAL RISK MANAGEMENT (continued)
LIQUIDITY AND FUNDING RISK (continued)
FUNDING POSITION During the year ended 30 September 2017, the Group issued $22.0 billion of term wholesale debt (excluding Additional Tier 1 Capital) with a remaining term greater than one year (2016: $32.1 billion). The weighted average tenor of new term debt was 5.3 years (2016: 5.5 years).
The following tables represent the Group’s funding composition at 30 September:
2017 2016$m $m
Customer deposits and other liabilities1
Customer deposits 467,630 449,623
Other funding liabilities2,3 12,838 14,049
Total customer liabilities (funding) 480,468 463,672
Wholesale funding4
Debt issuances 107,973 113,044
Certificates of deposit 55,222 61,429
Commercial paper 18,023 19,349
Other wholesale borrowings2,5,6 65,441 65,924
Total wholesale funding 246,659 259,746
Shareholders' equity 59,075 57,927
Total funding 786,202 781,345
2017 2016$m $m
Funded assets
Other short term assets & trade finance assets7 58,576 65,800
Liquids6 169,317 161,302
Short term funded assets 227,893 227,102
Lending & fixed assets8 558,309 554,243
Total funded assets 786,202 781,345
Funding liabilities4,6
Other short term liabilities2 46,021 49,288
Short term funding 62,119 69,028
Term funding < 12 months 18,872 23,668
Other customer and central bank deposits1,2,9 78,652 79,115
Total short term funding liabilities 205,664 221,099
Stable customer deposits1,10 421,172 402,146
Term funding > 12 months 91,840 90,708
Shareholders' equity and hybrid debt 67,526 67,392
Total stable funding 580,538 560,246
Total funding 786,202 781,345
1. Includes term deposits, other deposits and an adjustment to eliminate Wealth Australia investments in ANZ deposit products.2. Securitites sold under repurchase agreements reclassified to align with current period presentation.3. Includes interest accruals, payables and other liabilities, provisions and net tax provisions, excluding other liabilities in Wealth Australia.4. Excludes liability for acceptances as they do not provide net funding.5. Includes borrowings from banks, securitites sold under repurchase agreements, net derivative balances, special purpose vehicles and other borrowings.6. Includes RBA open-repo arrangement netted down by the exchange settlement account cash balance.7. Includes short-dated assets such as trading securities, available-for-sale securities, trade dated assets and trade finance loans.8. Excludes trade finance loans.9. Total customer liabilities (funding) plus central bank deposits less stable customer deposits.10. Stable customer deposits represent operational type deposits or those sourced from retail/business/corporate customers and the stable component of other funding liabilities.
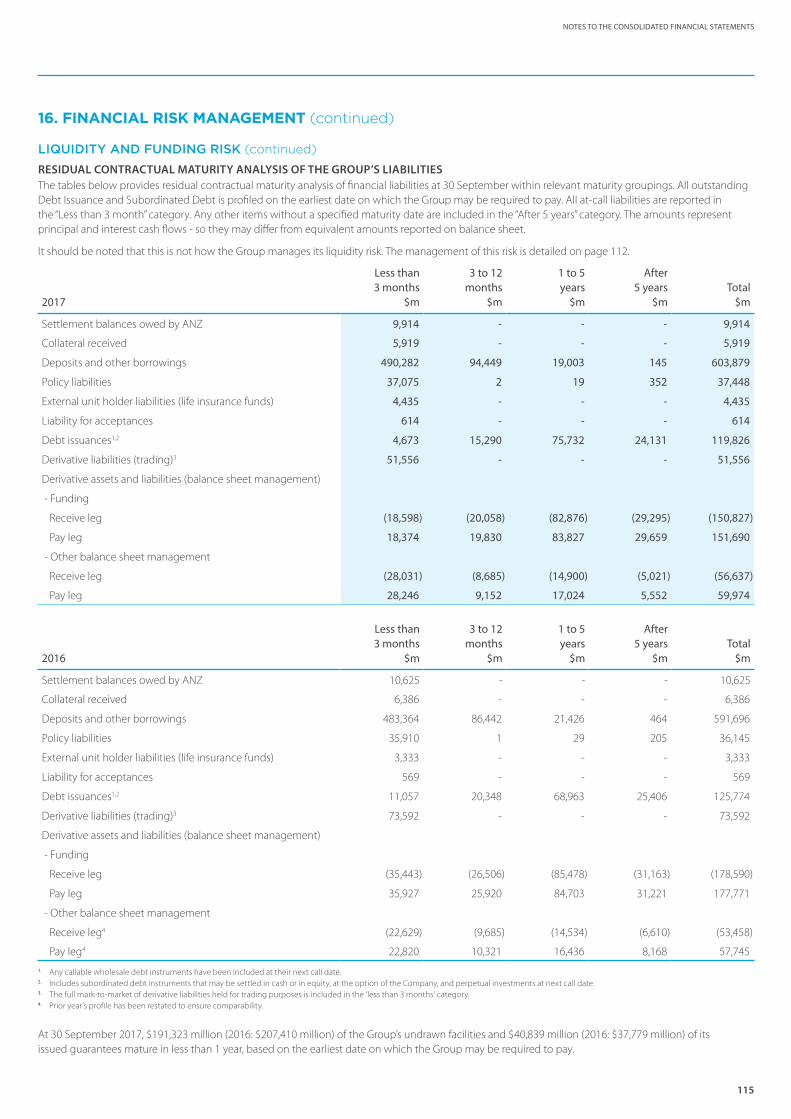
115
NOTES TO THE CONSOLIDATED FINANCIAL STATEMENTS
16. FINANCIAL RISK MANAGEMENT (continued)
LIQUIDITY AND FUNDING RISK (continued)
RESIDUAL CONTRACTUAL MATURITY ANALYSIS OF THE GROUP’S LIABILITIESThe tables below provides residual contractual maturity analysis of financial liabilities at 30 September within relevant maturity groupings. All outstanding Debt Issuance and Subordinated Debt is profiled on the earliest date on which the Group may be required to pay. All at-call liabilities are reported in the “Less than 3 month” category. Any other items without a specified maturity date are included in the “After 5 years” category. The amounts represent principal and interest cash flows - so they may differ from equivalent amounts reported on balance sheet.
It should be noted that this is not how the Group manages its liquidity risk. The management of this risk is detailed on page 112.
2017
Less than3 months
$m
3 to 12months
$m
1 to 5years
$m
After5 years
$mTotal
$m
Settlement balances owed by ANZ 9,914 - - - 9,914
Collateral received 5,919 - - - 5,919
Deposits and other borrowings 490,282 94,449 19,003 145 603,879
Policy liabilities 37,075 2 19 352 37,448
External unit holder liabilities (life insurance funds) 4,435 - - - 4,435
Liability for acceptances 614 - - - 614
Debt issuances1,2 4,673 15,290 75,732 24,131 119,826
Derivative liabilities (trading)3 51,556 - - - 51,556
Derivative assets and liabilities (balance sheet management)
- Funding
Receive leg (18,598) (20,058) (82,876) (29,295) (150,827)
Pay leg 18,374 19,830 83,827 29,659 151,690
- Other balance sheet management
Receive leg (28,031) (8,685) (14,900) (5,021) (56,637)
Pay leg 28,246 9,152 17,024 5,552 59,974
2016
Less than3 months
$m
3 to 12months
$m
1 to 5years
$m
After5 years
$mTotal
$m
Settlement balances owed by ANZ 10,625 - - - 10,625
Collateral received 6,386 - - - 6,386
Deposits and other borrowings 483,364 86,442 21,426 464 591,696
Policy liabilities 35,910 1 29 205 36,145
External unit holder liabilities (life insurance funds) 3,333 - - - 3,333
Liability for acceptances 569 - - - 569
Debt issuances1,2 11,057 20,348 68,963 25,406 125,774
Derivative liabilities (trading)3 73,592 - - - 73,592
Derivative assets and liabilities (balance sheet management)
- Funding
Receive leg (35,443) (26,506) (85,478) (31,163) (178,590)
Pay leg 35,927 25,920 84,703 31,221 177,771
- Other balance sheet management
Receive leg4 (22,629) (9,685) (14,534) (6,610) (53,458)
Pay leg4 22,820 10,321 16,436 8,168 57,745
1. Any callable wholesale debt instruments have been included at their next call date. 2. Includes subordinated debt instruments that may be settled in cash or in equity, at the option of the Company, and perpetual investments at next call date.3. The full mark-to-market of derivative liabilities held for trading purposes is included in the ‘less than 3 months’ category. 4. Prior year’s profile has been restated to ensure comparability.
At 30 September 2017, $191,323 million (2016: $207,410 million) of the Group’s undrawn facilities and $40,839 million (2016: $37,779 million) of its issued guarantees mature in less than 1 year, based on the earliest date on which the Group may be required to pay.
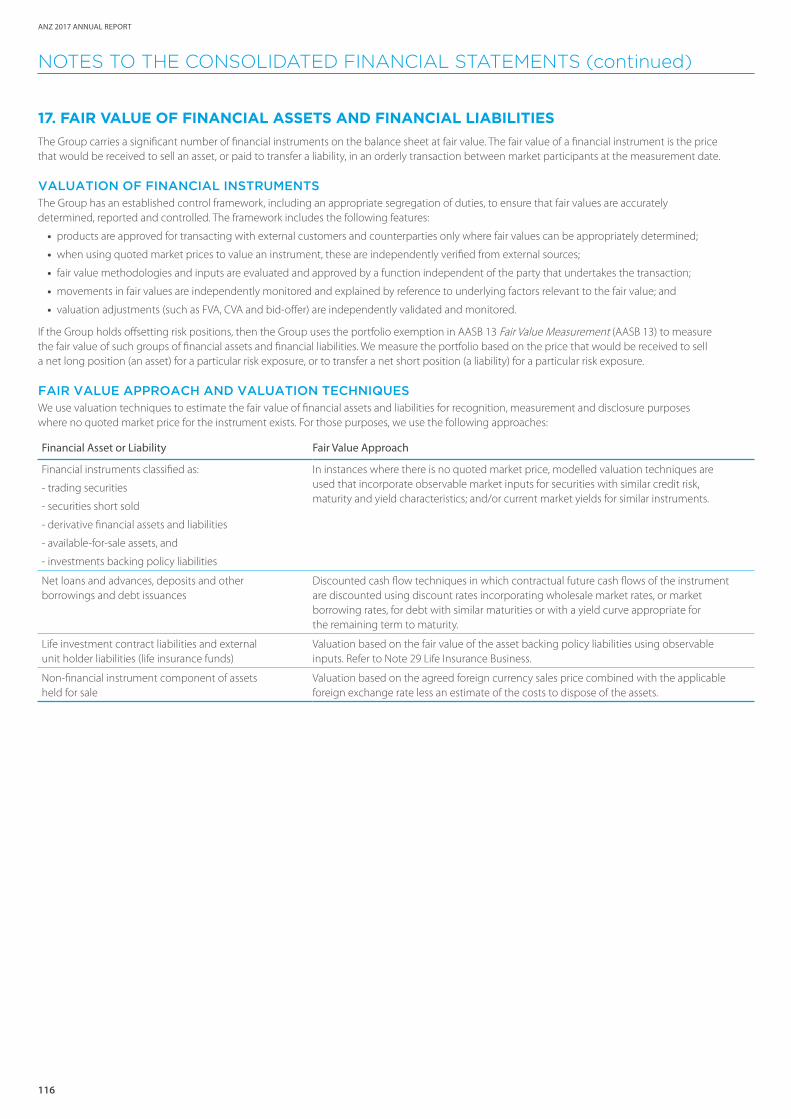
116
ANZ 2017 ANNUAL REPORT
NOTES TO THE CONSOLIDATED FINANCIAL STATEMENTS (continued)
17. FAIR VALUE OF FINANCIAL ASSETS AND FINANCIAL LIABILITIESThe Group carries a significant number of financial instruments on the balance sheet at fair value. The fair value of a financial instrument is the price that would be received to sell an asset, or paid to transfer a liability, in an orderly transaction between market participants at the measurement date.
VALUATION OF FINANCIAL INSTRUMENTSThe Group has an established control framework, including an appropriate segregation of duties, to ensure that fair values are accurately determined, reported and controlled. The framework includes the following features:
• products are approved for transacting with external customers and counterparties only where fair values can be appropriately determined;
• when using quoted market prices to value an instrument, these are independently verified from external sources;
• fair value methodologies and inputs are evaluated and approved by a function independent of the party that undertakes the transaction;
• movements in fair values are independently monitored and explained by reference to underlying factors relevant to the fair value; and
• valuation adjustments (such as FVA, CVA and bid-offer) are independently validated and monitored.
If the Group holds offsetting risk positions, then the Group uses the portfolio exemption in AASB 13 Fair Value Measurement (AASB 13) to measure the fair value of such groups of financial assets and financial liabilities. We measure the portfolio based on the price that would be received to sell a net long position (an asset) for a particular risk exposure, or to transfer a net short position (a liability) for a particular risk exposure.
FAIR VALUE APPROACH AND VALUATION TECHNIQUESWe use valuation techniques to estimate the fair value of financial assets and liabilities for recognition, measurement and disclosure purposes where no quoted market price for the instrument exists. For those purposes, we use the following approaches:
Financial Asset or Liability Fair Value Approach
Financial instruments classified as:
- trading securities
- securities short sold
- derivative financial assets and liabilities
- available-for-sale assets, and
- investments backing policy liabilities
In instances where there is no quoted market price, modelled valuation techniques are used that incorporate observable market inputs for securities with similar credit risk, maturity and yield characteristics; and/or current market yields for similar instruments.
Net loans and advances, deposits and other borrowings and debt issuances
Discounted cash flow techniques in which contractual future cash flows of the instrument are discounted using discount rates incorporating wholesale market rates, or market borrowing rates, for debt with similar maturities or with a yield curve appropriate for the remaining term to maturity.
Life investment contract liabilities and external unit holder liabilities (life insurance funds)
Valuation based on the fair value of the asset backing policy liabilities using observable inputs. Refer to Note 29 Life Insurance Business.
Non-financial instrument component of assets held for sale
Valuation based on the agreed foreign currency sales price combined with the applicable foreign exchange rate less an estimate of the costs to dispose of the assets.

117
NOTES TO THE CONSOLIDATED FINANCIAL STATEMENTS
17. FAIR VALUE OF FINANCIAL ASSETS AND FINANCIAL LIABILITIES (continued)
CLASSIFICATION OF FINANCIAL ASSETS AND FINANCIAL LIABILITIESThe following tables set out the classification of financial asset and liability categories according to measurement bases together with their carrying amounts as reported on the balance sheet.
2017 2016
Fair value details refer
to Note
At amortised
cost
Atfair
value Total
At amortised
cost
At fair
value Total$m $m $m $m $m $m
Financial assets
Cash and cash equivalents 68,048 - 68,048 66,220 - 66,220
Settlement balances owed to ANZ 5,504 - 5,504 4,406 - 4,406
Collateral paid 8,987 - 8,987 12,723 - 12,723
Trading securities 9 - 43,605 43,605 - 47,188 47,188
Derivative financial instruments 10 - 62,518 62,518 - 87,496 87,496
Available-for-sale assets 11 - 69,384 69,384 - 63,113 63,113
Net loans and advances 12 574,175 156 574,331 575,440 412 575,852
Regulatory deposits 2,015 - 2,015 2,296 - 2,296
Assets held for sale1 5,966 - 5,966 - - -
Investments backing policy liabilities 29 - 37,964 37,964 - 35,656 35,656
Other financial assets 4,364 - 4,364 4,198 - 4,198
Total 669,059 213,627 882,686 665,283 233,865 899,148
Financial liabilities
Settlement balances owed by ANZ 9,914 - 9,914 10,625 - 10,625
Collateral received 5,919 - 5,919 6,386 - 6,386
Deposits and other borrowings 14 592,114 3,497 595,611 583,002 5,193 588,195
Derivative financial instruments 10 - 62,252 62,252 - 88,725 88,725
Liabilities held for sale1 4,635 - 4,635 - - -
Policy liabilities2 29 342 37,106 37,448 190 35,955 36,145
External unit holder liabilities (life insurance funds)3 - 4,435 4,435 - 3,333 3,333
Payables and other liabilities 6,458 1,892 8,350 6,485 2,380 8,865
Debt issuances 106,221 1,752 107,973 110,852 2,192 113,044
Total 725,603 110,934 836,537 717,540 137,778 855,3181. Assets held for sale and liabilities held for sale include only the components of assets or liabilities held for sale which are financial instruments.2. Policy liabilities includes: • life insurance contract liabilities of $342 million (2016: $190 million) measured in accordance with AASB 1038 Life Insurance Contracts; and • life investment contract liabilities of $37,106 million (2016: $35,955 million) which have been designated at fair value through profit or loss under AASB 139 Financial Instruments: Recognition and
Measurement. None of the fair value is attributable to changes in the credit risk of the life investment contract liabilities.3. External unit holder liabilities are designated on initial recognition at fair value through profit or loss.
FINANCIAL ASSETS AND FINANCIAL LIABILITIES CARRIED AT FAIR VALUE ON THE BALANCE SHEETThe Group categorises financial assets and liabilities carried at fair value into a fair value hierarchy as required by AASB 13 based on the observability of inputs used to measure the fair value:
• Level 1 – valuations based on quoted prices (unadjusted) in active markets for identical assets or liabilities;
• Level 2 – valuations using inputs other than quoted prices included within Level 1 that are observable for a similar asset or liability, either directly or indirectly; and
• Level 3 – valuations using inputs for the asset or liability that are not based on observable market data (unobservable inputs).
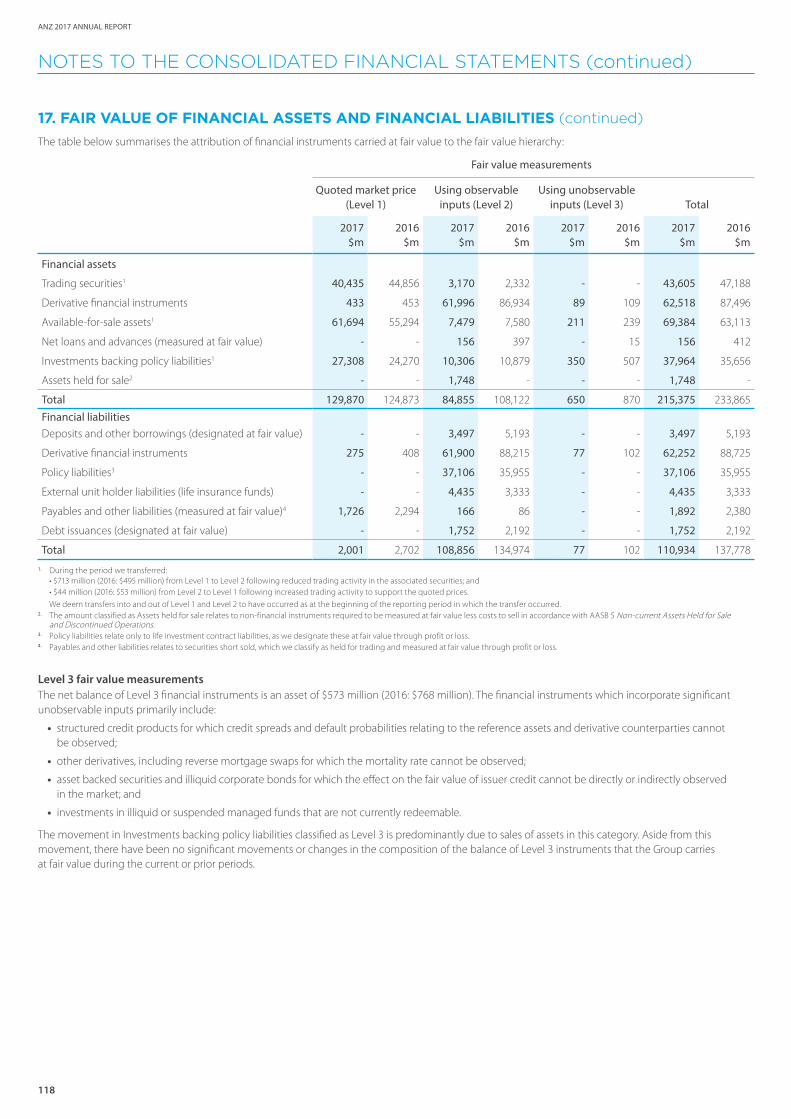
118
ANZ 2017 ANNUAL REPORT
NOTES TO THE CONSOLIDATED FINANCIAL STATEMENTS (continued)
17. FAIR VALUE OF FINANCIAL ASSETS AND FINANCIAL LIABILITIES (continued)
The table below summarises the attribution of financial instruments carried at fair value to the fair value hierarchy:
Fair value measurements
Quoted market price (Level 1)
Using observable inputs (Level 2)
Using unobservable inputs (Level 3) Total
2017 2016 2017 2016 2017 2016 2017 2016$m $m $m $m $m $m $m $m
Financial assets
Trading securities1 40,435 44,856 3,170 2,332 - - 43,605 47,188
Derivative financial instruments 433 453 61,996 86,934 89 109 62,518 87,496
Available-for-sale assets1 61,694 55,294 7,479 7,580 211 239 69,384 63,113
Net loans and advances (measured at fair value) - - 156 397 - 15 156 412
Investments backing policy liabilities1 27,308 24,270 10,306 10,879 350 507 37,964 35,656
Assets held for sale2 - - 1,748 - - - 1,748 -
Total 129,870 124,873 84,855 108,122 650 870 215,375 233,865
Financial liabilitiesDeposits and other borrowings (designated at fair value) - - 3,497 5,193 - - 3,497 5,193
Derivative financial instruments 275 408 61,900 88,215 77 102 62,252 88,725
Policy liabilities3 - - 37,106 35,955 - - 37,106 35,955
External unit holder liabilities (life insurance funds) - - 4,435 3,333 - - 4,435 3,333
Payables and other liabilities (measured at fair value)4 1,726 2,294 166 86 - - 1,892 2,380
Debt issuances (designated at fair value) - - 1,752 2,192 - - 1,752 2,192
Total 2,001 2,702 108,856 134,974 77 102 110,934 137,778
1. During the period we transferred:
• $713 million (2016: $495 million) from Level 1 to Level 2 following reduced trading activity in the associated securities; and • $44 million (2016: $53 million) from Level 2 to Level 1 following increased trading activity to support the quoted prices.
We deem transfers into and out of Level 1 and Level 2 to have occurred as at the beginning of the reporting period in which the transfer occurred.2. The amount classified as Assets held for sale relates to non-financial instruments required to be measured at fair value less costs to sell in accordance with AASB 5 Non-current Assets Held for Sale
and Discontinued Operations.3. Policy liabilities relate only to life investment contract liabilities, as we designate these at fair value through profit or loss.4. Payables and other liabilities relates to securities short sold, which we classify as held for trading and measured at fair value through profit or loss.
Level 3 fair value measurementsThe net balance of Level 3 financial instruments is an asset of $573 million (2016: $768 million). The financial instruments which incorporate significant unobservable inputs primarily include:
• structured credit products for which credit spreads and default probabilities relating to the reference assets and derivative counterparties cannot be observed;
• other derivatives, including reverse mortgage swaps for which the mortality rate cannot be observed;
• asset backed securities and illiquid corporate bonds for which the effect on the fair value of issuer credit cannot be directly or indirectly observed in the market; and
• investments in illiquid or suspended managed funds that are not currently redeemable.
The movement in Investments backing policy liabilities classified as Level 3 is predominantly due to sales of assets in this category. Aside from this movement, there have been no significant movements or changes in the composition of the balance of Level 3 instruments that the Group carries at fair value during the current or prior periods.
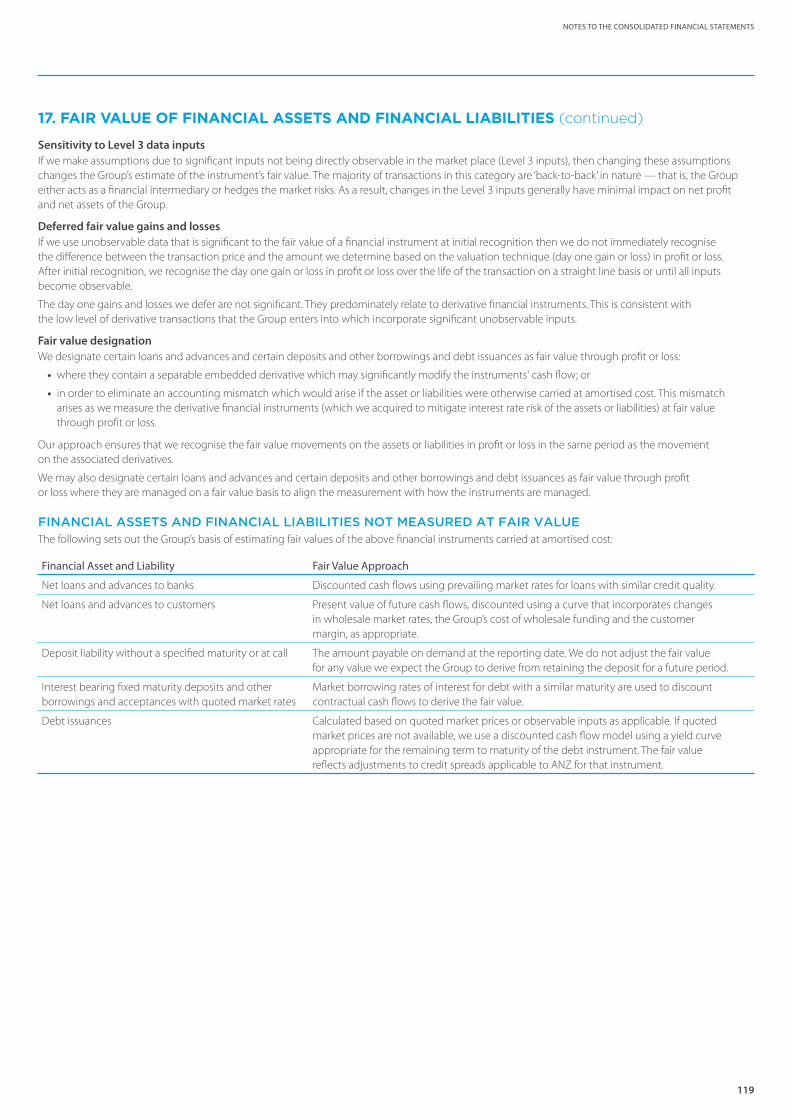
119
NOTES TO THE CONSOLIDATED FINANCIAL STATEMENTS
17. FAIR VALUE OF FINANCIAL ASSETS AND FINANCIAL LIABILITIES (continued)
Sensitivity to Level 3 data inputsIf we make assumptions due to significant inputs not being directly observable in the market place (Level 3 inputs), then changing these assumptions changes the Group’s estimate of the instrument’s fair value. The majority of transactions in this category are ‘back-to-back’ in nature — that is, the Group either acts as a financial intermediary or hedges the market risks. As a result, changes in the Level 3 inputs generally have minimal impact on net profit and net assets of the Group.
Deferred fair value gains and lossesIf we use unobservable data that is significant to the fair value of a financial instrument at initial recognition then we do not immediately recognise the difference between the transaction price and the amount we determine based on the valuation technique (day one gain or loss) in profit or loss. After initial recognition, we recognise the day one gain or loss in profit or loss over the life of the transaction on a straight line basis or until all inputs become observable.
The day one gains and losses we defer are not significant. They predominately relate to derivative financial instruments. This is consistent with the low level of derivative transactions that the Group enters into which incorporate significant unobservable inputs.
Fair value designationWe designate certain loans and advances and certain deposits and other borrowings and debt issuances as fair value through profit or loss:
• where they contain a separable embedded derivative which may significantly modify the instruments' cash flow; or
• in order to eliminate an accounting mismatch which would arise if the asset or liabilities were otherwise carried at amortised cost. This mismatch arises as we measure the derivative financial instruments (which we acquired to mitigate interest rate risk of the assets or liabilities) at fair value through profit or loss.
Our approach ensures that we recognise the fair value movements on the assets or liabilities in profit or loss in the same period as the movement on the associated derivatives.
We may also designate certain loans and advances and certain deposits and other borrowings and debt issuances as fair value through profit or loss where they are managed on a fair value basis to align the measurement with how the instruments are managed.
FINANCIAL ASSETS AND FINANCIAL LIABILITIES NOT MEASURED AT FAIR VALUEThe following sets out the Group’s basis of estimating fair values of the above financial instruments carried at amortised cost:
Financial Asset and Liability Fair Value Approach
Net loans and advances to banks Discounted cash flows using prevailing market rates for loans with similar credit quality.
Net loans and advances to customers Present value of future cash flows, discounted using a curve that incorporates changes in wholesale market rates, the Group’s cost of wholesale funding and the customer margin, as appropriate.
Deposit liability without a specified maturity or at call The amount payable on demand at the reporting date. We do not adjust the fair value for any value we expect the Group to derive from retaining the deposit for a future period.
Interest bearing fixed maturity deposits and other borrowings and acceptances with quoted market rates
Market borrowing rates of interest for debt with a similar maturity are used to discount contractual cash flows to derive the fair value.
Debt issuances Calculated based on quoted market prices or observable inputs as applicable. If quoted market prices are not available, we use a discounted cash flow model using a yield curve appropriate for the remaining term to maturity of the debt instrument. The fair value reflects adjustments to credit spreads applicable to ANZ for that instrument.
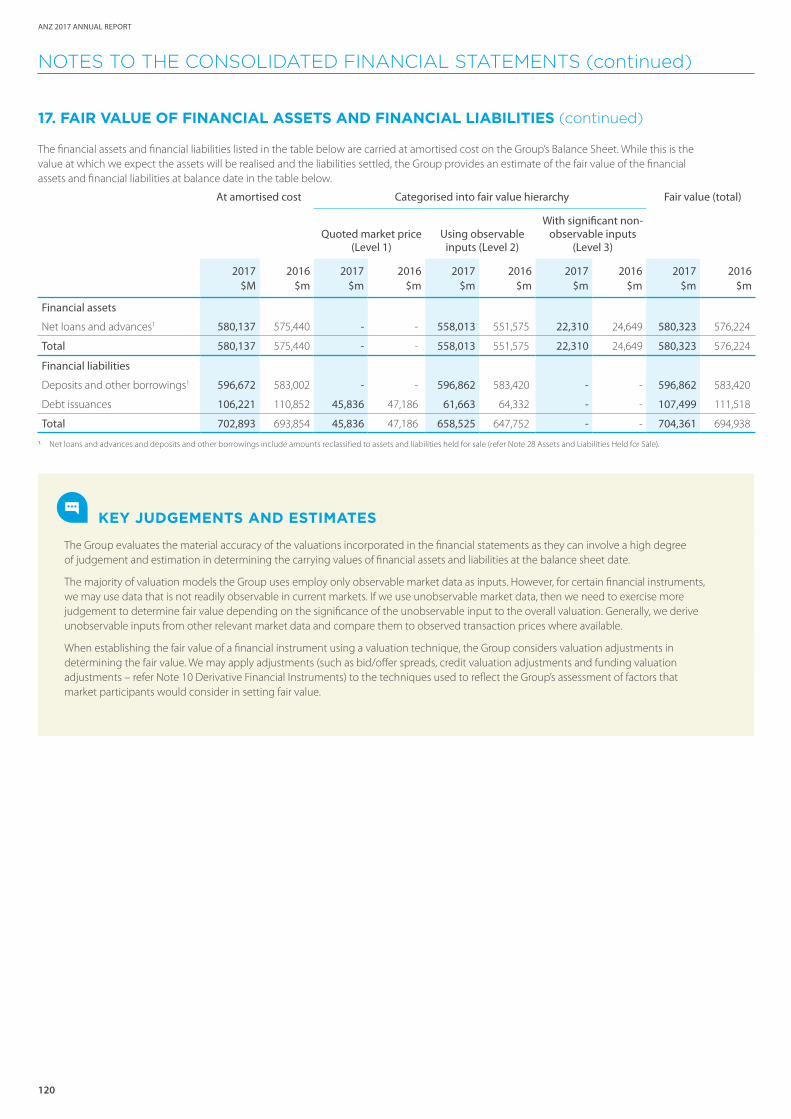
120
ANZ 2017 ANNUAL REPORT
NOTES TO THE CONSOLIDATED FINANCIAL STATEMENTS (continued)
17. FAIR VALUE OF FINANCIAL ASSETS AND FINANCIAL LIABILITIES (continued)
The financial assets and financial liabilities listed in the table below are carried at amortised cost on the Group’s Balance Sheet. While this is the value at which we expect the assets will be realised and the liabilities settled, the Group provides an estimate of the fair value of the financial assets and financial liabilities at balance date in the table below.
At amortised cost Categorised into fair value hierarchy Fair value (total)
Quoted market price (Level 1)
Using observable inputs (Level 2)
With significant non-observable inputs
(Level 3)
2017$M
2016 $m
2017 $m
2016 $m
2017 $m
2016 $m
2017 $m
2016 $m
2017 $m
2016 $m
Financial assets
Net loans and advances1 580,137 575,440 - - 558,013 551,575 22,310 24,649 580,323 576,224
Total 580,137 575,440 - - 558,013 551,575 22,310 24,649 580,323 576,224
Financial liabilities
Deposits and other borrowings1 596,672 583,002 - - 596,862 583,420 - - 596,862 583,420
Debt issuances 106,221 110,852 45,836 47,186 61,663 64,332 - - 107,499 111,518
Total 702,893 693,854 45,836 47,186 658,525 647,752 - - 704,361 694,938
1. Net loans and advances and deposits and other borrowings include amounts reclassified to assets and liabilities held for sale (refer Note 28 Assets and Liabilities Held for Sale).
KEY JUDGEMENTS AND ESTIMATES
The Group evaluates the material accuracy of the valuations incorporated in the financial statements as they can involve a high degree of judgement and estimation in determining the carrying values of financial assets and liabilities at the balance sheet date.
The majority of valuation models the Group uses employ only observable market data as inputs. However, for certain financial instruments, we may use data that is not readily observable in current markets. If we use unobservable market data, then we need to exercise more judgement to determine fair value depending on the significance of the unobservable input to the overall valuation. Generally, we derive unobservable inputs from other relevant market data and compare them to observed transaction prices where available.
When establishing the fair value of a financial instrument using a valuation technique, the Group considers valuation adjustments in determining the fair value. We may apply adjustments (such as bid/offer spreads, credit valuation adjustments and funding valuation adjustments – refer Note 10 Derivative Financial Instruments) to the techniques used to reflect the Group’s assessment of factors that market participants would consider in setting fair value.
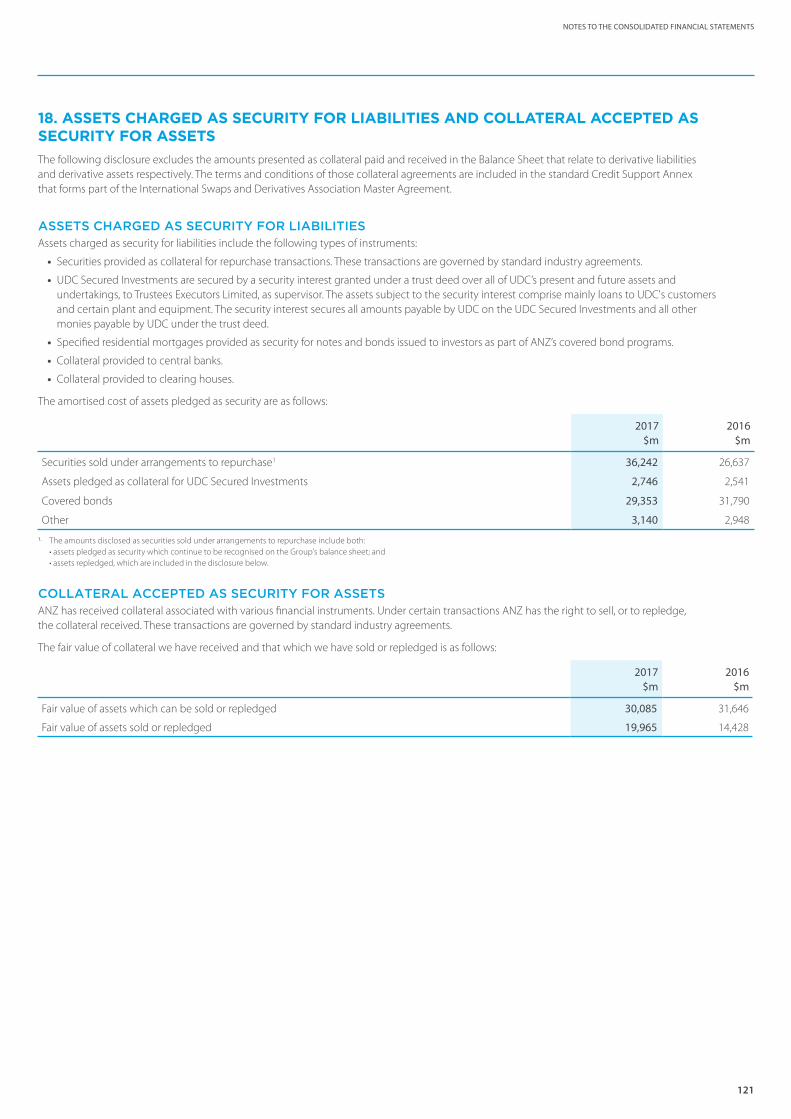
121
NOTES TO THE CONSOLIDATED FINANCIAL STATEMENTS
18. ASSETS CHARGED AS SECURITY FOR LIABILITIES AND COLLATERAL ACCEPTED AS SECURITY FOR ASSETSThe following disclosure excludes the amounts presented as collateral paid and received in the Balance Sheet that relate to derivative liabilities and derivative assets respectively. The terms and conditions of those collateral agreements are included in the standard Credit Support Annex that forms part of the International Swaps and Derivatives Association Master Agreement.
ASSETS CHARGED AS SECURITY FOR LIABILITIESAssets charged as security for liabilities include the following types of instruments:
• Securities provided as collateral for repurchase transactions. These transactions are governed by standard industry agreements.
• UDC Secured Investments are secured by a security interest granted under a trust deed over all of UDC’s present and future assets and undertakings, to Trustees Executors Limited, as supervisor. The assets subject to the security interest comprise mainly loans to UDC's customers and certain plant and equipment. The security interest secures all amounts payable by UDC on the UDC Secured Investments and all other monies payable by UDC under the trust deed.
• Specified residential mortgages provided as security for notes and bonds issued to investors as part of ANZ’s covered bond programs.
• Collateral provided to central banks.
• Collateral provided to clearing houses.
The amortised cost of assets pledged as security are as follows:
2017 2016$m $m
Securities sold under arrangements to repurchase1 36,242 26,637
Assets pledged as collateral for UDC Secured Investments 2,746 2,541
Covered bonds 29,353 31,790
Other 3,140 2,948
1. The amounts disclosed as securities sold under arrangements to repurchase include both: • assets pledged as security which continue to be recognised on the Group's balance sheet; and • assets repledged, which are included in the disclosure below.
COLLATERAL ACCEPTED AS SECURITY FOR ASSETSANZ has received collateral associated with various financial instruments. Under certain transactions ANZ has the right to sell, or to repledge, the collateral received. These transactions are governed by standard industry agreements.
The fair value of collateral we have received and that which we have sold or repledged is as follows:
2017 2016$m $m
Fair value of assets which can be sold or repledged 30,085 31,646
Fair value of assets sold or repledged 19,965 14,428
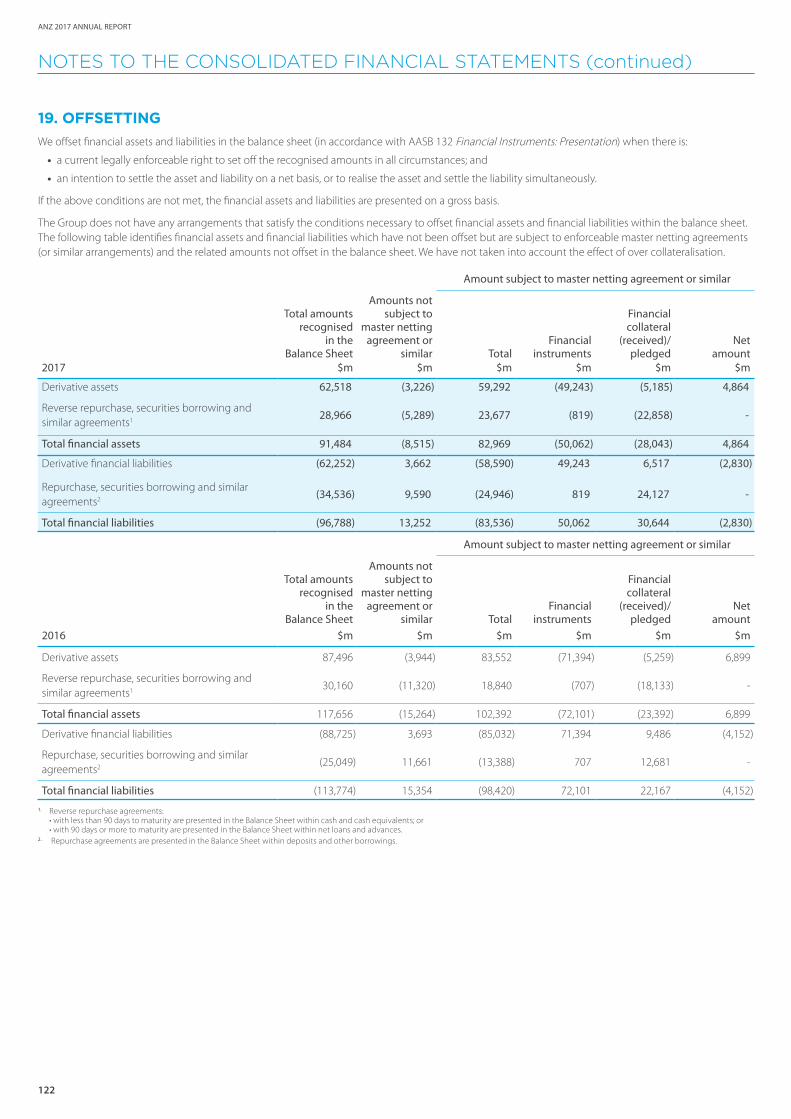
122
ANZ 2017 ANNUAL REPORT
NOTES TO THE CONSOLIDATED FINANCIAL STATEMENTS (continued)
19. OFFSETTINGWe offset financial assets and liabilities in the balance sheet (in accordance with AASB 132 Financial Instruments: Presentation) when there is:
• a current legally enforceable right to set off the recognised amounts in all circumstances; and
• an intention to settle the asset and liability on a net basis, or to realise the asset and settle the liability simultaneously.
If the above conditions are not met, the financial assets and liabilities are presented on a gross basis.
The Group does not have any arrangements that satisfy the conditions necessary to offset financial assets and financial liabilities within the balance sheet. The following table identifies financial assets and financial liabilities which have not been offset but are subject to enforceable master netting agreements (or similar arrangements) and the related amounts not offset in the balance sheet. We have not taken into account the effect of over collateralisation.
Amount subject to master netting agreement or similar
Total amounts recognised
in the Balance Sheet
Amounts not subject to
master netting agreement or
similar TotalFinancial
instruments
Financial collateral
(received)/pledged
Net amount
2017 $m $m $m $m $m $m
Derivative assets 62,518 (3,226) 59,292 (49,243) (5,185) 4,864
Reverse repurchase, securities borrowing and similar agreements1 28,966 (5,289) 23,677 (819) (22,858) -
Total financial assets 91,484 (8,515) 82,969 (50,062) (28,043) 4,864
Derivative financial liabilities (62,252) 3,662 (58,590) 49,243 6,517 (2,830)
Repurchase, securities borrowing and similar agreements2 (34,536) 9,590 (24,946) 819 24,127 -
Total financial liabilities (96,788) 13,252 (83,536) 50,062 30,644 (2,830)
Amount subject to master netting agreement or similar
Total amounts recognised
in the Balance Sheet
Amounts not subject to
master netting agreement or
similar TotalFinancial
instruments
Financial collateral
(received)/pledged
Net amount
2016 $m $m $m $m $m $m
Derivative assets 87,496 (3,944) 83,552 (71,394) (5,259) 6,899
Reverse repurchase, securities borrowing and similar agreements1 30,160 (11,320) 18,840 (707) (18,133) -
Total financial assets 117,656 (15,264) 102,392 (72,101) (23,392) 6,899
Derivative financial liabilities (88,725) 3,693 (85,032) 71,394 9,486 (4,152)
Repurchase, securities borrowing and similar agreements2 (25,049) 11,661 (13,388) 707 12,681 -
Total financial liabilities (113,774) 15,354 (98,420) 72,101 22,167 (4,152)
1. Reverse repurchase agreements: • with less than 90 days to maturity are presented in the Balance Sheet within cash and cash equivalents; or • with 90 days or more to maturity are presented in the Balance Sheet within net loans and advances.
2. Repurchase agreements are presented in the Balance Sheet within deposits and other borrowings.

123
NOTES TO THE CONSOLIDATED FINANCIAL STATEMENTS
20. GOODWILL AND OTHER INTANGIBLE ASSETS
Goodwill1 Software Other Intangibles2 Total
2017 2016 2017 2016 2017 2016 2017 2016$m $m $m $m $m $m $m $m
Balance at start of year 4,729 4,597 2,202 2,893 741 822 7,672 8,312
Additions 5 - 404 431 - 1 409 432
Amortisation expense3 - - (567) (1,056) (73) (83) (640) (1,139)
Impairment expense (3) - (17) (27) - - (20) (27)
Impairment on reclassification of Retail Asia and Wealth businesses to held for sale
(50) - (154) - - - (204) -
Derecognised on disposal - - - - - (3) - (3)
Transferred to held for sale (refer to Note 28) (122) - - - - - (122) -
Foreign currency exchange difference (112) 132 (8) (39) (5) 4 (125) 97
Balance at end of year 4,447 4,729 1,860 2,202 663 741 6,970 7,672
Cost 4,447 4,729 6,092 6,022 1,358 1,396 11,897 12,147
Accumulated amortisation/impairment n/a n/a (4,232) (3,820) (695) (655) (4,927) (4,475)
Carrying amount 4,447 4,729 1,860 2,202 663 741 6,970 7,672
1. Goodwill excludes notional goodwill in equity accounted investments.2. Other intangible assets comprises: aligned advisor relationships, distribution agreements and management fee rights, acquired portfolio of Insurance and Investment business and other intangibles. 3. In 2016, we made a $556 million charge for accelerated amortisation associated with a change in the software capitalisation policy.
GOODWILL ALLOCATED TO CASH–GENERATING UNITS (CGUs)An annual assessment is made as to whether the current carrying value of goodwill is impaired. For the purposes of impairment testing, goodwill is allocated at the date of acquisition to a CGU. Goodwill is considered to be impaired if the carrying amount of the relevant CGU exceeds its recoverable amount.
To estimate the recoverable amount of the CGU to which each goodwill component is allocated, we use a fair value less cost of disposal assessment approach for each segment, with the exception of Wealth Australia, for which the Group applied a value-in-use approach for the year ended 30 September 2017.
FAIR VALUE LESS COST OF DISPOSALFor those CGUs where the impairment assessment was undertaken using a market multiple approach, the Group has determined that the result represents the fair value less costs of disposal of each CGU, and is primarily based on observable price earnings multiples reflecting the businesses and markets in which each CGU operates plus a control premium. The earnings are based on the current forecast earnings of the divisions. As at 30 September 2017, our impairment testing did not result in any material impairment being identified.
For each of ANZ’s CGUs with goodwill, the price earnings multiples applied were as follows:
Division 2017 2016
Australia 17.3 16.1
Institutional 15.4 13.7
New Zealand 17.0 16.1
Wealth Australia n/a 20.8
Asia Retail & Pacific1 17.3 13.71. In 2017, goodwill in this segment consists of amounts attributable to Pacific only.
VALUE-IN-USE – WEALTH AUSTRALIADue to various strategic options being considered for certain components of the Wealth Australia CGU, we have undertaken a value-in-use assessment excluding ANZ Lenders Mortgage Insurance, ANZ Share Investing and ANZ Financial Planning businesses and compared this to the net assets of the CGU. The value-in-use is in excess of the net asset value and confirms our conclusion that the goodwill is not impaired.
The valuation is based on the embedded value which represents the present value of future profits and releases of capital arising from the business in-force at the valuation date, and adjusted net assets. It is determined using best estimate assumptions with franking credits included at 70% of face value. Projected cash flows have been discounted using capital asset pricing model risk discount rates of 7.75% and 9.50%.
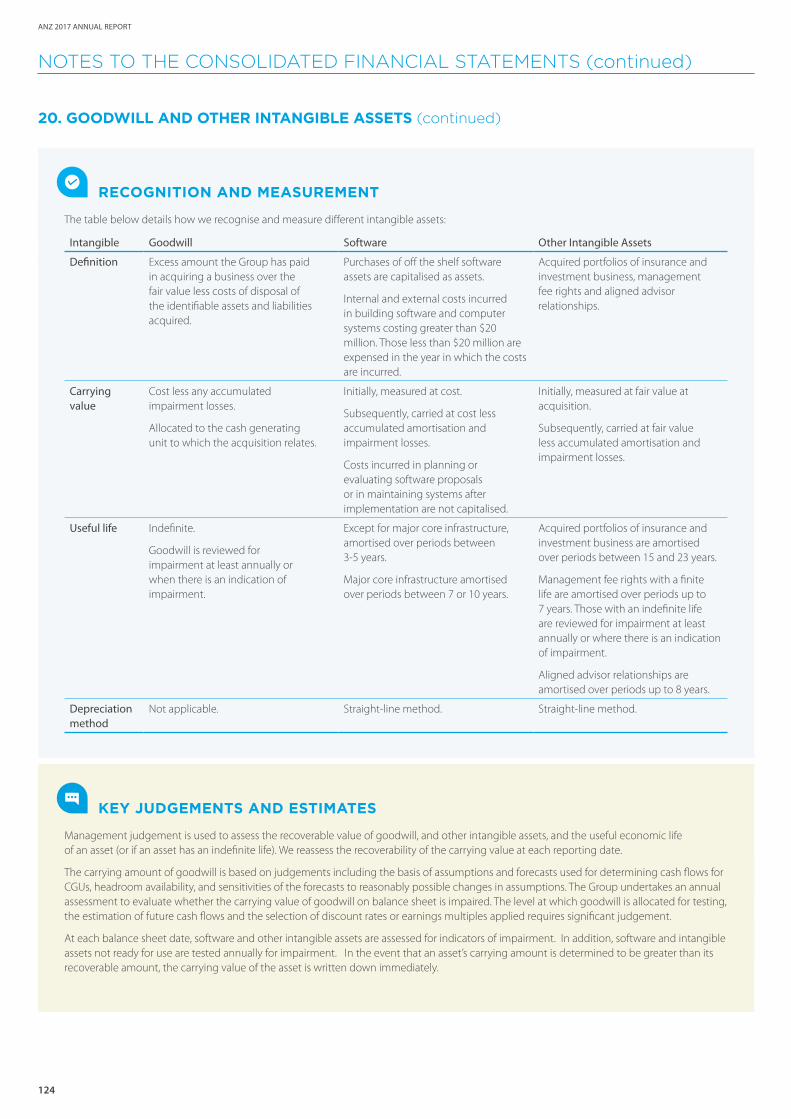
124
ANZ 2017 ANNUAL REPORT
NOTES TO THE CONSOLIDATED FINANCIAL STATEMENTS (continued)
20. GOODWILL AND OTHER INTANGIBLE ASSETS (continued)
RECOGNITION AND MEASUREMENT
The table below details how we recognise and measure different intangible assets:
Intangible Goodwill Software Other Intangible Assets
Definition Excess amount the Group has paid in acquiring a business over the fair value less costs of disposal of the identifiable assets and liabilities acquired.
Purchases of off the shelf software assets are capitalised as assets.
Internal and external costs incurred in building software and computer systems costing greater than $20 million. Those less than $20 million are expensed in the year in which the costs are incurred.
Acquired portfolios of insurance and investment business, management fee rights and aligned advisor relationships.
Carrying value
Cost less any accumulated impairment losses.
Allocated to the cash generating unit to which the acquisition relates.
Initially, measured at cost.
Subsequently, carried at cost less accumulated amortisation and impairment losses.
Costs incurred in planning or evaluating software proposals or in maintaining systems after implementation are not capitalised.
Initially, measured at fair value at acquisition.
Subsequently, carried at fair value less accumulated amortisation and impairment losses.
Useful life Indefinite.
Goodwill is reviewed for impairment at least annually or when there is an indication of impairment.
Except for major core infrastructure, amortised over periods between 3-5 years.
Major core infrastructure amortised over periods between 7 or 10 years.
Acquired portfolios of insurance and investment business are amortised over periods between 15 and 23 years.
Management fee rights with a finite life are amortised over periods up to 7 years. Those with an indefinite life are reviewed for impairment at least annually or where there is an indication of impairment.
Aligned advisor relationships are amortised over periods up to 8 years.
Depreciation method
Not applicable. Straight-line method. Straight-line method.
KEY JUDGEMENTS AND ESTIMATES
Management judgement is used to assess the recoverable value of goodwill, and other intangible assets, and the useful economic life of an asset (or if an asset has an indefinite life). We reassess the recoverability of the carrying value at each reporting date.
The carrying amount of goodwill is based on judgements including the basis of assumptions and forecasts used for determining cash flows for CGUs, headroom availability, and sensitivities of the forecasts to reasonably possible changes in assumptions. The Group undertakes an annual assessment to evaluate whether the carrying value of goodwill on balance sheet is impaired. The level at which goodwill is allocated for testing, the estimation of future cash flows and the selection of discount rates or earnings multiples applied requires significant judgement.
At each balance sheet date, software and other intangible assets are assessed for indicators of impairment. In addition, software and intangible assets not ready for use are tested annually for impairment. In the event that an asset’s carrying amount is determined to be greater than its recoverable amount, the carrying value of the asset is written down immediately.
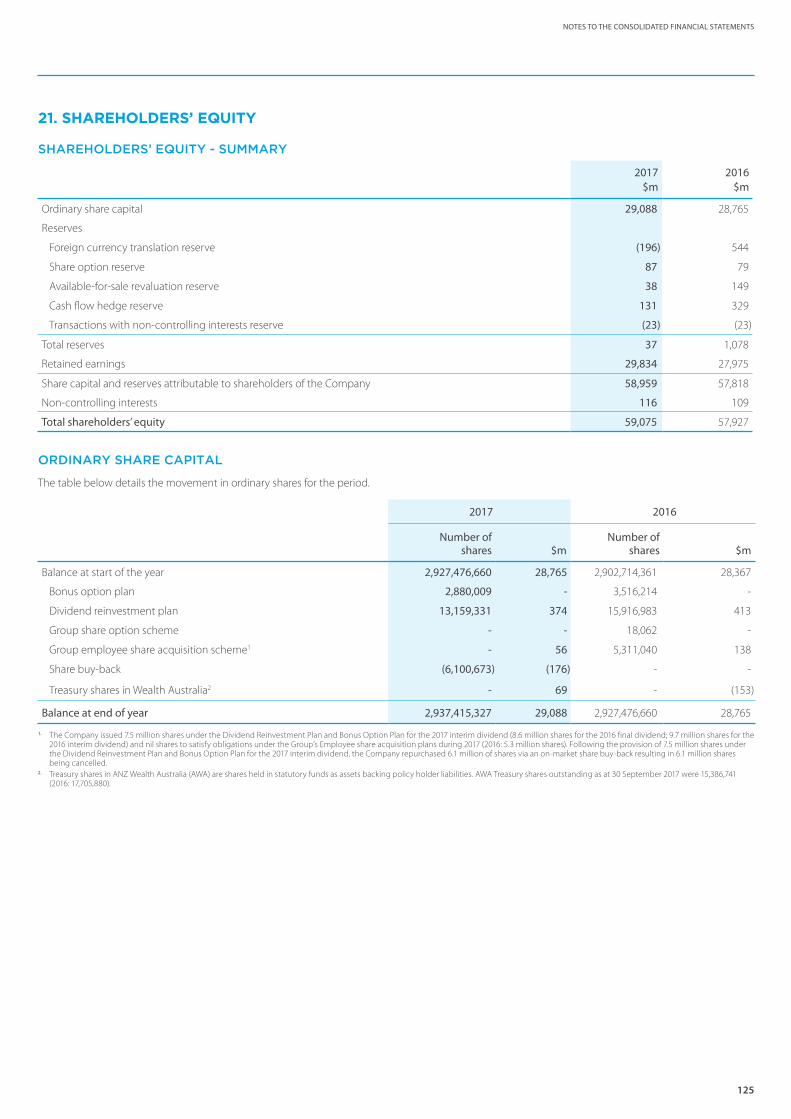
125
NOTES TO THE CONSOLIDATED FINANCIAL STATEMENTS
21. SHAREHOLDERS’ EQUITY
SHAREHOLDERS’ EQUITY - SUMMARY
2017 2016$m $m
Ordinary share capital 29,088 28,765
Reserves
Foreign currency translation reserve (196) 544
Share option reserve 87 79
Available-for-sale revaluation reserve 38 149
Cash flow hedge reserve 131 329
Transactions with non-controlling interests reserve (23) (23)
Total reserves 37 1,078
Retained earnings 29,834 27,975
Share capital and reserves attributable to shareholders of the Company 58,959 57,818
Non-controlling interests 116 109
Total shareholders’ equity 59,075 57,927
ORDINARY SHARE CAPITAL
The table below details the movement in ordinary shares for the period.
2017 2016
Number of shares
Number of shares$m $m
Balance at start of the year 2,927,476,660 28,765 2,902,714,361 28,367
Bonus option plan 2,880,009 - 3,516,214 -
Dividend reinvestment plan 13,159,331 374 15,916,983 413
Group share option scheme - - 18,062 -
Group employee share acquisition scheme1 - 56 5,311,040 138
Share buy-back (6,100,673) (176) - -
Treasury shares in Wealth Australia2 - 69 - (153)
Balance at end of year 2,937,415,327 29,088 2,927,476,660 28,765
1. The Company issued 7.5 million shares under the Dividend Reinvestment Plan and Bonus Option Plan for the 2017 interim dividend (8.6 million shares for the 2016 final dividend; 9.7 million shares for the 2016 interim dividend) and nil shares to satisfy obligations under the Group’s Employee share acquisition plans during 2017 (2016: 5.3 million shares). Following the provision of 7.5 million shares under the Dividend Reinvestment Plan and Bonus Option Plan for the 2017 interim dividend, the Company repurchased 6.1 million of shares via an on-market share buy-back resulting in 6.1 million shares being cancelled.
2. Treasury shares in ANZ Wealth Australia (AWA) are shares held in statutory funds as assets backing policy holder liabilities. AWA Treasury shares outstanding as at 30 September 2017 were 15,386,741 (2016: 17,705,880).
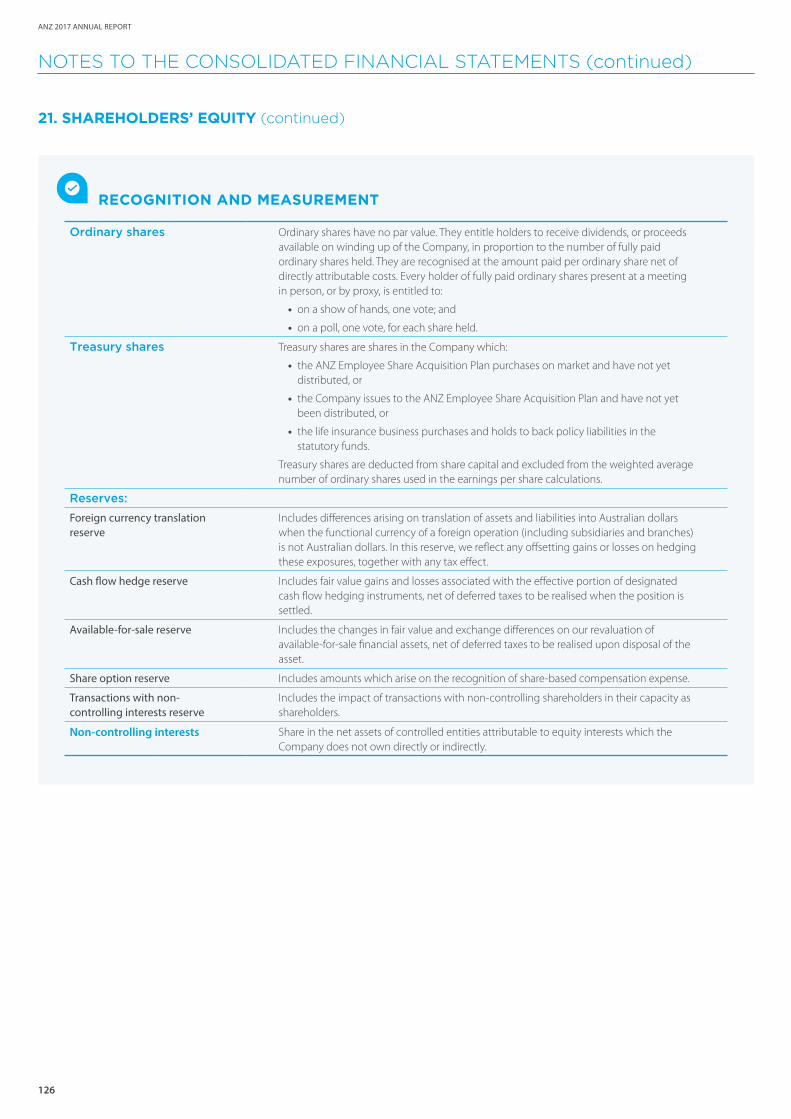
126
ANZ 2017 ANNUAL REPORT
NOTES TO THE CONSOLIDATED FINANCIAL STATEMENTS (continued)
21. SHAREHOLDERS’ EQUITY (continued)
RECOGNITION AND MEASUREMENT
Ordinary shares Ordinary shares have no par value. They entitle holders to receive dividends, or proceeds available on winding up of the Company, in proportion to the number of fully paid ordinary shares held. They are recognised at the amount paid per ordinary share net of directly attributable costs. Every holder of fully paid ordinary shares present at a meeting in person, or by proxy, is entitled to:
• on a show of hands, one vote; and
• on a poll, one vote, for each share held.
Treasury shares Treasury shares are shares in the Company which:
• the ANZ Employee Share Acquisition Plan purchases on market and have not yet distributed, or
• the Company issues to the ANZ Employee Share Acquisition Plan and have not yet been distributed, or
• the life insurance business purchases and holds to back policy liabilities in the statutory funds.
Treasury shares are deducted from share capital and excluded from the weighted average number of ordinary shares used in the earnings per share calculations.
Reserves:
Foreign currency translation reserve
Includes differences arising on translation of assets and liabilities into Australian dollars when the functional currency of a foreign operation (including subsidiaries and branches) is not Australian dollars. In this reserve, we reflect any offsetting gains or losses on hedging these exposures, together with any tax effect.
Cash flow hedge reserve Includes fair value gains and losses associated with the effective portion of designated cash flow hedging instruments, net of deferred taxes to be realised when the position is settled.
Available-for-sale reserve Includes the changes in fair value and exchange differences on our revaluation of available-for-sale financial assets, net of deferred taxes to be realised upon disposal of the asset.
Share option reserve Includes amounts which arise on the recognition of share-based compensation expense.
Transactions with non-controlling interests reserve
Includes the impact of transactions with non-controlling shareholders in their capacity as shareholders.
Non-controlling interests Share in the net assets of controlled entities attributable to equity interests which the Company does not own directly or indirectly.
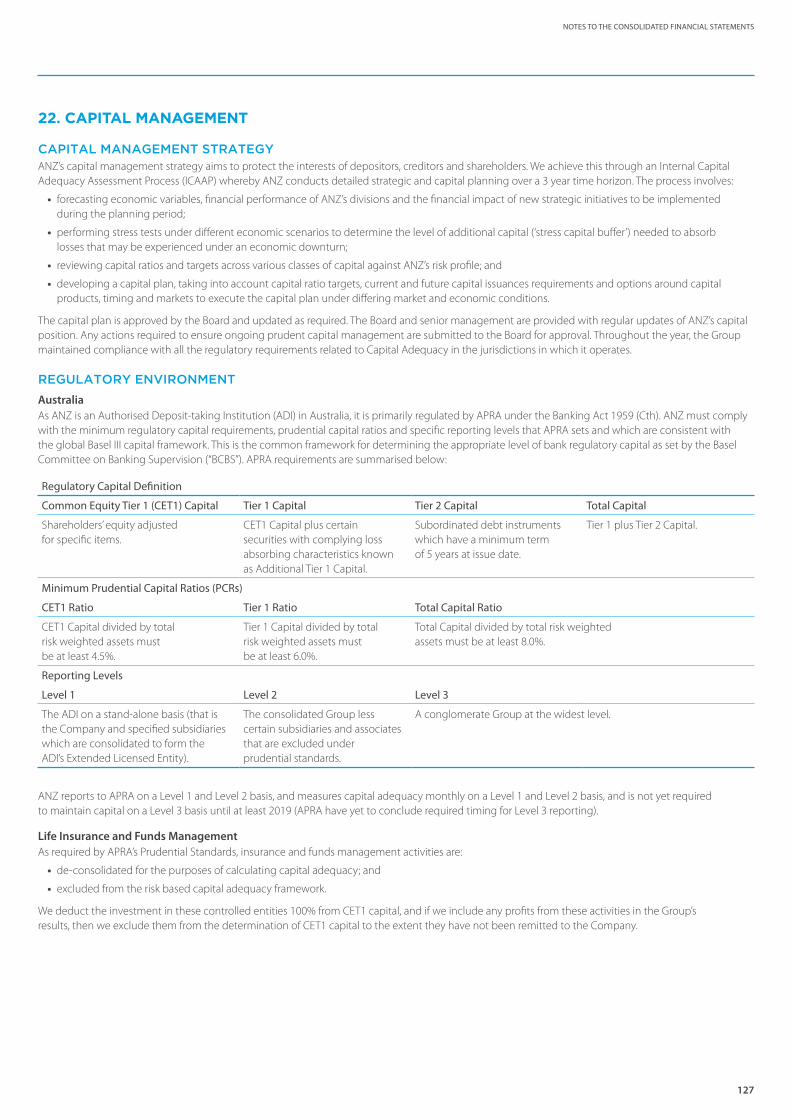
127
NOTES TO THE CONSOLIDATED FINANCIAL STATEMENTS
22. CAPITAL MANAGEMENT
CAPITAL MANAGEMENT STRATEGYANZ’s capital management strategy aims to protect the interests of depositors, creditors and shareholders. We achieve this through an Internal Capital Adequacy Assessment Process (ICAAP) whereby ANZ conducts detailed strategic and capital planning over a 3 year time horizon. The process involves:
• forecasting economic variables, financial performance of ANZ’s divisions and the financial impact of new strategic initiatives to be implemented during the planning period;
• performing stress tests under different economic scenarios to determine the level of additional capital (‘stress capital buffer’) needed to absorb losses that may be experienced under an economic downturn;
• reviewing capital ratios and targets across various classes of capital against ANZ’s risk profile; and
• developing a capital plan, taking into account capital ratio targets, current and future capital issuances requirements and options around capital products, timing and markets to execute the capital plan under differing market and economic conditions.
The capital plan is approved by the Board and updated as required. The Board and senior management are provided with regular updates of ANZ’s capital position. Any actions required to ensure ongoing prudent capital management are submitted to the Board for approval. Throughout the year, the Group maintained compliance with all the regulatory requirements related to Capital Adequacy in the jurisdictions in which it operates.
REGULATORY ENVIRONMENT
AustraliaAs ANZ is an Authorised Deposit-taking Institution (ADI) in Australia, it is primarily regulated by APRA under the Banking Act 1959 (Cth). ANZ must comply with the minimum regulatory capital requirements, prudential capital ratios and specific reporting levels that APRA sets and which are consistent with the global Basel III capital framework. This is the common framework for determining the appropriate level of bank regulatory capital as set by the Basel Committee on Banking Supervision (“BCBS”). APRA requirements are summarised below:
Regulatory Capital Definition
Common Equity Tier 1 (CET1) Capital Tier 1 Capital Tier 2 Capital Total Capital
Shareholders’ equity adjusted for specific items.
CET1 Capital plus certain securities with complying loss absorbing characteristics known as Additional Tier 1 Capital.
Subordinated debt instruments which have a minimum term of 5 years at issue date.
Tier 1 plus Tier 2 Capital.
Minimum Prudential Capital Ratios (PCRs)
CET1 Ratio Tier 1 Ratio Total Capital Ratio
CET1 Capital divided by total risk weighted assets must be at least 4.5%.
Tier 1 Capital divided by total risk weighted assets must be at least 6.0%.
Total Capital divided by total risk weighted assets must be at least 8.0%.
Reporting Levels
Level 1 Level 2 Level 3
The ADI on a stand-alone basis (that is the Company and specified subsidiaries which are consolidated to form the ADI’s Extended Licensed Entity).
The consolidated Group less certain subsidiaries and associates that are excluded under prudential standards.
A conglomerate Group at the widest level.
ANZ reports to APRA on a Level 1 and Level 2 basis, and measures capital adequacy monthly on a Level 1 and Level 2 basis, and is not yet required to maintain capital on a Level 3 basis until at least 2019 (APRA have yet to conclude required timing for Level 3 reporting).
Life Insurance and Funds ManagementAs required by APRA’s Prudential Standards, insurance and funds management activities are:
• de-consolidated for the purposes of calculating capital adequacy; and
• excluded from the risk based capital adequacy framework.
We deduct the investment in these controlled entities 100% from CET1 capital, and if we include any profits from these activities in the Group’s results, then we exclude them from the determination of CET1 capital to the extent they have not been remitted to the Company.

128
ANZ 2017 ANNUAL REPORT
NOTES TO THE CONSOLIDATED FINANCIAL STATEMENTS (continued)
22. CAPITAL MANAGEMENT (continued)
Outside Australia In addition to APRA, the Company’s branch operations and major banking subsidiary operations are also overseen by local regulators such as the Reserve Bank of New Zealand, the US Federal Reserve, the UK Prudential Regulation Authority, the Monetary Authority of Singapore, the Hong Kong Monetary Authority and the China Banking Regulatory Commission. They may impose minimum capitalisation levels on operations in their individual jurisdictions.
CAPITAL ADEQUACYThe following table provides details of the Group’s capital adequacy ratios at 30 September:
2017 2016$m $m
Qualifying capital
Tier 1
Shareholders' equity and non-controlling interests 59,075 57,927
Prudential adjustments to shareholders' equity (481) (481)
Gross Common Equity Tier 1 capital 58,594 57,446
Deductions (17,258) (18,179)
Common Equity Tier 1 capital 41,336 39,267
Additional Tier 1 capital 7,988 9,018
Tier 1 capital 49,324 48,285
Tier 2 capital 8,669 10,328
Total qualifying capital 57,993 58,613
Capital adequacy ratios
Common Equity Tier 1 10.6% 9.6%
Tier 1 12.6% 11.8%
Tier 2 2.2% 2.5%
Total 14.8% 14.3%
Risk weighted assets 391,113 408,582

129
NOTES TO THE CONSOLIDATED FINANCIAL STATEMENTS
23. PARENT ENTITY FINANCIAL INFORMATION Australia and New Zealand Banking Group Limited (the Company) has prepared a separate set of financial statements to satisfy the requirements of its Australian Financial Services License it holds with ASIC. These separate Company financial statements are available on the ANZ website at anz.com and have been lodged with ASIC.
Selected financial information of the Company is provided as follows:
SUMMARY FINANCIAL INFORMATION
2017 2016$m $m
Income statement information for the financial year
Profit after tax for the year 6,234 5,687
Total comprehensive income for the year 5,915 5,002
Balance sheet information as at the end of the financial year
Cash and cash equivalents 63,399 61,994
Net loans and advances 452,424 446,531
Total assets 797,379 823,962
Deposits and other borrowings 494,235 479,963
Total liabilities 745,531 773,703
Shareholders' equity
Ordinary share capital 29,416 29,162
Reserves 36 344
Retained earnings 22,396 20,753
Total shareholders' equity 51,848 50,259
PARENT ENTITY’S CONTRACTUAL COMMITMENTS
PROPERTY RELATED COMMITMENTS
2017 2016$m $m
Property capital expenditure
Contracts for outstanding capital expenditure 98 103
Total capital expenditure commitments for property 98 103
Lease rentals
Land and buildings 1,818 2,044
Furniture and equipment 145 144
Total lease rental commitments1 1,963 2,188
Due within 1 year 394 403
Due later than 1 year but not later than 5 years 908 982
Due later than 5 years 661 803
Total lease rental commitments1 1,963 2,188
1. Total future minimum sublease payments we expect to receive under non-cancellable subleases at 30 September 2017 is $91 million (2016: $114 million). During the year, we received sublease payments of $28 million (2016: $22 million) and netted them against rent expense.
CREDIT RELATED COMMITMENTS AND CONTINGENCIES
2017 2016$m $m
Contract amount of:
Undrawn facilities 150,339 161,178
Guarantees and letters of credit 18,062 15,633
Performance related contingencies 18,890 17,710
Total 187,291 194,521
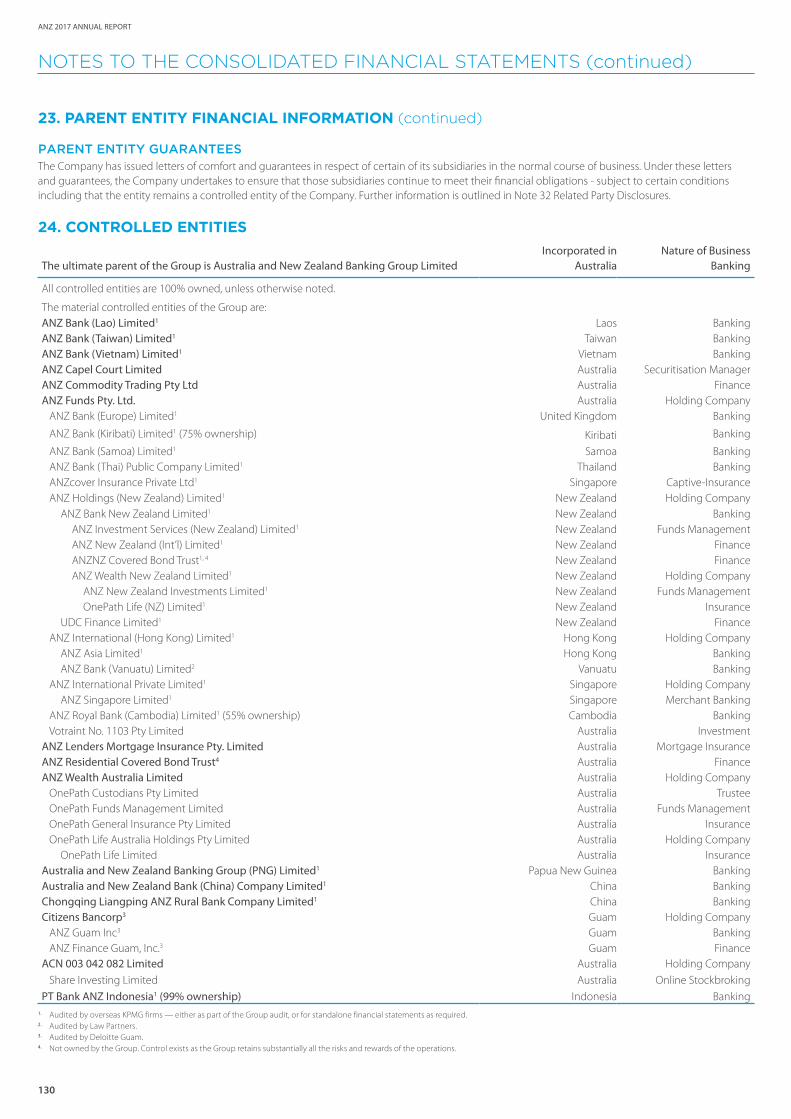
130
ANZ 2017 ANNUAL REPORT
NOTES TO THE CONSOLIDATED FINANCIAL STATEMENTS (continued)
23. PARENT ENTITY FINANCIAL INFORMATION (continued)
PARENT ENTITY GUARANTEESThe Company has issued letters of comfort and guarantees in respect of certain of its subsidiaries in the normal course of business. Under these letters and guarantees, the Company undertakes to ensure that those subsidiaries continue to meet their financial obligations - subject to certain conditions including that the entity remains a controlled entity of the Company. Further information is outlined in Note 32 Related Party Disclosures.
24. CONTROLLED ENTITIESIncorporated in Nature of Business
The ultimate parent of the Group is Australia and New Zealand Banking Group Limited Australia Banking
All controlled entities are 100% owned, unless otherwise noted.
The material controlled entities of the Group are: ANZ Bank (Lao) Limited1 Laos BankingANZ Bank (Taiwan) Limited1 Taiwan BankingANZ Bank (Vietnam) Limited1 Vietnam BankingANZ Capel Court Limited Australia Securitisation ManagerANZ Commodity Trading Pty Ltd Australia FinanceANZ Funds Pty. Ltd. Australia Holding Company
ANZ Bank (Europe) Limited1 United Kingdom Banking
ANZ Bank (Kiribati) Limited1 (75% ownership) Kiribati Banking
ANZ Bank (Samoa) Limited1 Samoa BankingANZ Bank (Thai) Public Company Limited1 Thailand BankingANZcover Insurance Private Ltd1 Singapore Captive-InsuranceANZ Holdings (New Zealand) Limited1 New Zealand Holding Company
ANZ Bank New Zealand Limited1 New Zealand BankingANZ Investment Services (New Zealand) Limited1 New Zealand Funds ManagementANZ New Zealand (Int’l) Limited1 New Zealand FinanceANZNZ Covered Bond Trust1, 4 New Zealand FinanceANZ Wealth New Zealand Limited1 New Zealand Holding Company
ANZ New Zealand Investments Limited1 New Zealand Funds ManagementOnePath Life (NZ) Limited1 New Zealand Insurance
UDC Finance Limited1 New Zealand FinanceANZ International (Hong Kong) Limited1 Hong Kong Holding Company
ANZ Asia Limited1 Hong Kong BankingANZ Bank (Vanuatu) Limited2 Vanuatu Banking
ANZ International Private Limited1 Singapore Holding CompanyANZ Singapore Limited1 Singapore Merchant Banking
ANZ Royal Bank (Cambodia) Limited1 (55% ownership) Cambodia BankingVotraint No. 1103 Pty Limited Australia Investment
ANZ Lenders Mortgage Insurance Pty. Limited Australia Mortgage InsuranceANZ Residential Covered Bond Trust4 Australia FinanceANZ Wealth Australia Limited Australia Holding Company
OnePath Custodians Pty Limited Australia TrusteeOnePath Funds Management Limited Australia Funds ManagementOnePath General Insurance Pty Limited Australia InsuranceOnePath Life Australia Holdings Pty Limited Australia Holding Company
OnePath Life Limited Australia InsuranceAustralia and New Zealand Banking Group (PNG) Limited1 Papua New Guinea BankingAustralia and New Zealand Bank (China) Company Limited1 China BankingChongqing Liangping ANZ Rural Bank Company Limited1 China BankingCitizens Bancorp3 Guam Holding Company
ANZ Guam Inc3 Guam BankingANZ Finance Guam, Inc.3 Guam Finance
ACN 003 042 082 Limited Australia Holding CompanyShare Investing Limited Australia Online Stockbroking
PT Bank ANZ Indonesia1 (99% ownership) Indonesia Banking1. Audited by overseas KPMG firms — either as part of the Group audit, or for standalone financial statements as required.2. Audited by Law Partners.3. Audited by Deloitte Guam.4. Not owned by the Group. Control exists as the Group retains substantially all the risks and rewards of the operations.
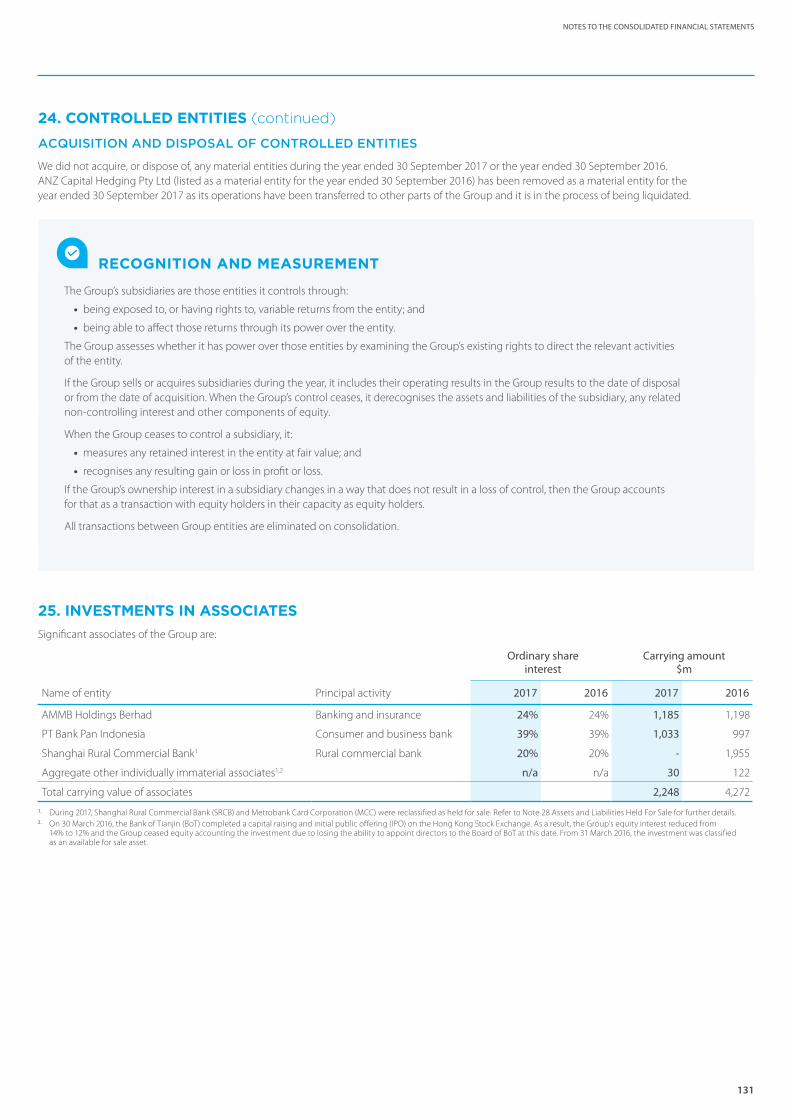
131
NOTES TO THE CONSOLIDATED FINANCIAL STATEMENTS
24. CONTROLLED ENTITIES (continued)
ACQUISITION AND DISPOSAL OF CONTROLLED ENTITIES
We did not acquire, or dispose of, any material entities during the year ended 30 September 2017 or the year ended 30 September 2016. ANZ Capital Hedging Pty Ltd (listed as a material entity for the year ended 30 September 2016) has been removed as a material entity for the year ended 30 September 2017 as its operations have been transferred to other parts of the Group and it is in the process of being liquidated.
RECOGNITION AND MEASUREMENT
The Group’s subsidiaries are those entities it controls through:
• being exposed to, or having rights to, variable returns from the entity; and
• being able to affect those returns through its power over the entity.
The Group assesses whether it has power over those entities by examining the Group’s existing rights to direct the relevant activities of the entity.
If the Group sells or acquires subsidiaries during the year, it includes their operating results in the Group results to the date of disposal or from the date of acquisition. When the Group’s control ceases, it derecognises the assets and liabilities of the subsidiary, any related non-controlling interest and other components of equity.
When the Group ceases to control a subsidiary, it:
• measures any retained interest in the entity at fair value; and
• recognises any resulting gain or loss in profit or loss.
If the Group’s ownership interest in a subsidiary changes in a way that does not result in a loss of control, then the Group accounts for that as a transaction with equity holders in their capacity as equity holders.
All transactions between Group entities are eliminated on consolidation.
25. INVESTMENTS IN ASSOCIATESSignificant associates of the Group are:
Ordinary share interest
Carrying amount $m
Name of entity Principal activity 2017 2016 2017 2016
AMMB Holdings Berhad Banking and insurance 24% 24% 1,185 1,198
PT Bank Pan Indonesia Consumer and business bank 39% 39% 1,033 997
Shanghai Rural Commercial Bank1 Rural commercial bank 20% 20% - 1,955
Aggregate other individually immaterial associates1,2 n/a n/a 30 122
Total carrying value of associates 2,248 4,272
1. During 2017, Shanghai Rural Commercial Bank (SRCB) and Metrobank Card Corporation (MCC) were reclassified as held for sale. Refer to Note 28 Assets and Liabilities Held For Sale for further details. 2. On 30 March 2016, the Bank of Tianjin (BoT) completed a capital raising and initial public offering (IPO) on the Hong Kong Stock Exchange. As a result, the Group’s equity interest reduced from
14% to 12% and the Group ceased equity accounting the investment due to losing the ability to appoint directors to the Board of BoT at this date. From 31 March 2016, the investment was classified as an available for sale asset.

132
ANZ 2017 ANNUAL REPORT
NOTES TO THE CONSOLIDATED FINANCIAL STATEMENTS (continued)
25. INVESTMENTS IN ASSOCIATES (continued)
FINANCIAL INFORMATION ON SIGNIFICANT ASSOCIATESSet out below is the summarised financial information of each associate that is significant to the Group. The summarised financial information is based on the associates’ IFRS financial information.
AMMB Holdings Berhad
PT Bank Pan Indonesia
Shanghai Rural Commercial Bank
Principal place of business and country of incorporation Malaysia IndonesiaPeople's Republic
of China
2017 2016 2017 2016 2017 2016$m $m $m $m $m $m
Summarised results
Operating income 2,469 2,698 930 960 - 3,390
Profit for the year 415 414 253 160 - 1,338
Other comprehensive income/(loss) (1) (8) 22 2 - 59
Total comprehensive income 414 406 275 162 - 1,397
Less: Total comprehensive income attributable to non–controlling interests (19) (26) (10) (11) - (36)
Total comprehensive income attributable to owners of associate 395 380 265 151 - 1,361
Summarised financial position
Total assets1 41,304 41,442 20,216 19,692 - 129,081
Total liabilities1 36,004 36,092 17,298 16,873 - 119,027
Total Net assets1 5,300 5,350 2,918 2,819 - 10,054
Less: Non–controlling interests of associate (320) (312) (259) (252) - (281)
Net assets attributable to owners of associate 4,980 5,038 2,659 2,567 - 9,773
Reconciliation to carrying amount of Group's interest in associate2
Carrying amount at the beginning of the year 1,198 1,424 997 904 1,955 1,981
Group's share of total comprehensive income 95 90 103 59 58 273
Dividends received from associate (38) (35) - - - (41)
Group's share of other reserve movements of associate and foreign currency translation reserve adjustments
(70) (21) (67) 34 (46) (258)
Impairment charge - (260) - - (219) -
Less: Carrying value transferred to assets held for sale (Note 28) - - - - (1,748) -
Carrying amount at the end of the year 1,185 1,198 1,033 997 - 1,955
Market value of Group's investment in associate3 943 929 1,009 779 n/a n/a
1. Includes market value adjustments (including goodwill) the Group made at the time of acquisition (and adjustments for any differences in accounting policies).2. For SRCB this includes movements up to the cessation of equity accounting.3. Applies to those investments in associates with published price quotations. Market Value is based on a price per share and does not include any adjustments for the size of our holding.
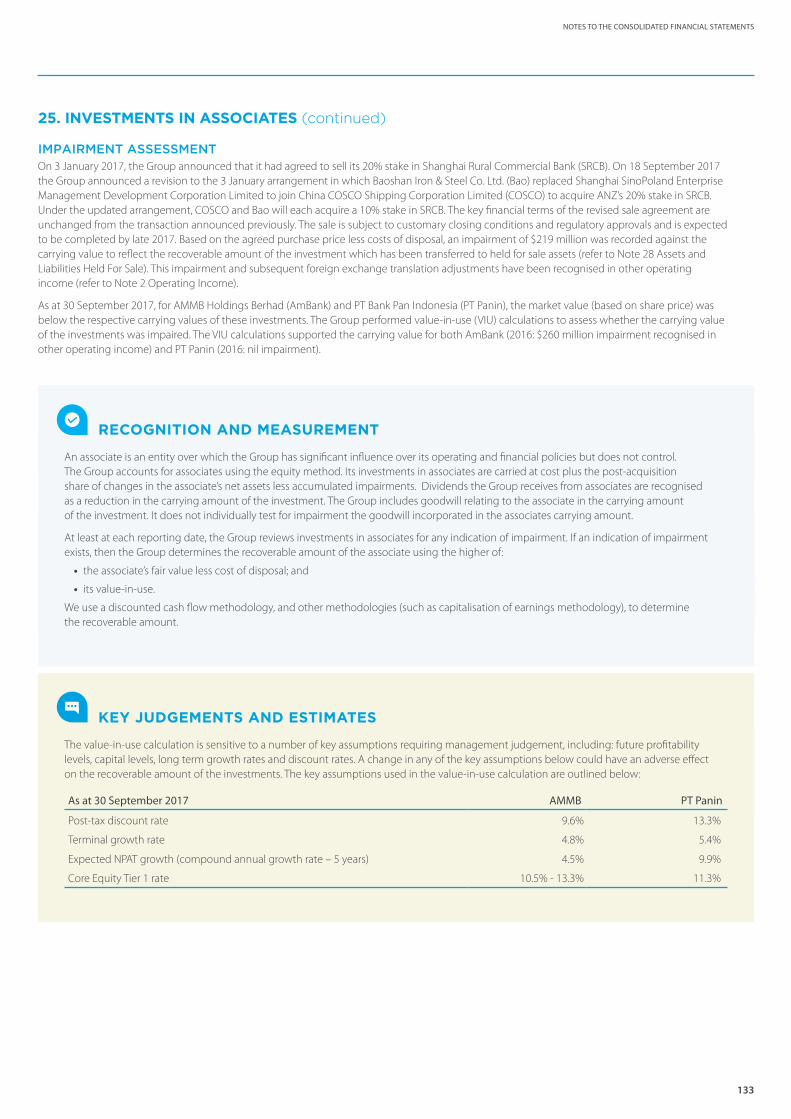
133
NOTES TO THE CONSOLIDATED FINANCIAL STATEMENTS
25. INVESTMENTS IN ASSOCIATES (continued)
IMPAIRMENT ASSESSMENTOn 3 January 2017, the Group announced that it had agreed to sell its 20% stake in Shanghai Rural Commercial Bank (SRCB). On 18 September 2017 the Group announced a revision to the 3 January arrangement in which Baoshan Iron & Steel Co. Ltd. (Bao) replaced Shanghai SinoPoland Enterprise Management Development Corporation Limited to join China COSCO Shipping Corporation Limited (COSCO) to acquire ANZ’s 20% stake in SRCB. Under the updated arrangement, COSCO and Bao will each acquire a 10% stake in SRCB. The key financial terms of the revised sale agreement are unchanged from the transaction announced previously. The sale is subject to customary closing conditions and regulatory approvals and is expected to be completed by late 2017. Based on the agreed purchase price less costs of disposal, an impairment of $219 million was recorded against the carrying value to reflect the recoverable amount of the investment which has been transferred to held for sale assets (refer to Note 28 Assets and Liabilities Held For Sale). This impairment and subsequent foreign exchange translation adjustments have been recognised in other operating income (refer to Note 2 Operating Income).
As at 30 September 2017, for AMMB Holdings Berhad (AmBank) and PT Bank Pan Indonesia (PT Panin), the market value (based on share price) was below the respective carrying values of these investments. The Group performed value-in-use (VIU) calculations to assess whether the carrying value of the investments was impaired. The VIU calculations supported the carrying value for both AmBank (2016: $260 million impairment recognised in other operating income) and PT Panin (2016: nil impairment).
RECOGNITION AND MEASUREMENT
An associate is an entity over which the Group has significant influence over its operating and financial policies but does not control. The Group accounts for associates using the equity method. Its investments in associates are carried at cost plus the post-acquisition share of changes in the associate’s net assets less accumulated impairments. Dividends the Group receives from associates are recognised as a reduction in the carrying amount of the investment. The Group includes goodwill relating to the associate in the carrying amount of the investment. It does not individually test for impairment the goodwill incorporated in the associates carrying amount.
At least at each reporting date, the Group reviews investments in associates for any indication of impairment. If an indication of impairment exists, then the Group determines the recoverable amount of the associate using the higher of:
• the associate’s fair value less cost of disposal; and
• its value-in-use.
We use a discounted cash flow methodology, and other methodologies (such as capitalisation of earnings methodology), to determine the recoverable amount.
KEY JUDGEMENTS AND ESTIMATES
The value-in-use calculation is sensitive to a number of key assumptions requiring management judgement, including: future profitability levels, capital levels, long term growth rates and discount rates. A change in any of the key assumptions below could have an adverse effect on the recoverable amount of the investments. The key assumptions used in the value-in-use calculation are outlined below:
As at 30 September 2017 AMMB PT Panin
Post-tax discount rate 9.6% 13.3%
Terminal growth rate 4.8% 5.4%
Expected NPAT growth (compound annual growth rate – 5 years) 4.5% 9.9%
Core Equity Tier 1 rate 10.5% - 13.3% 11.3%
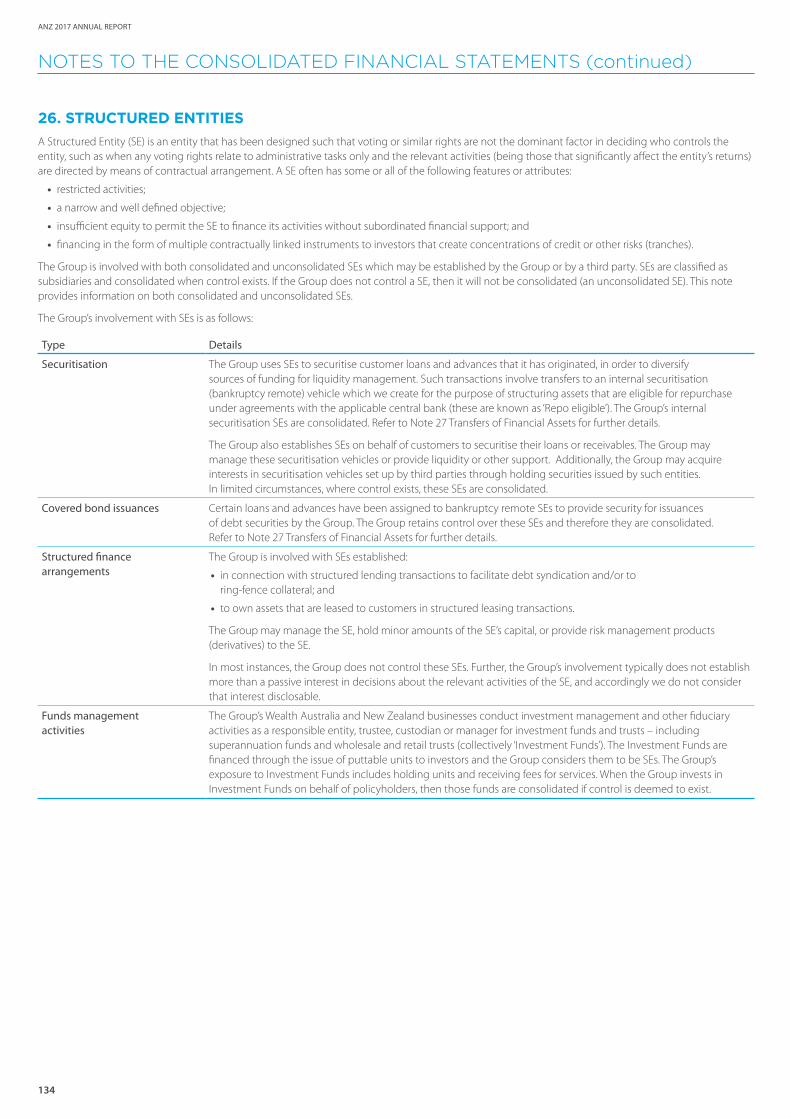
134
ANZ 2017 ANNUAL REPORT
NOTES TO THE CONSOLIDATED FINANCIAL STATEMENTS (continued)
26. STRUCTURED ENTITIESA Structured Entity (SE) is an entity that has been designed such that voting or similar rights are not the dominant factor in deciding who controls the entity, such as when any voting rights relate to administrative tasks only and the relevant activities (being those that significantly affect the entity’s returns) are directed by means of contractual arrangement. A SE often has some or all of the following features or attributes:
• restricted activities;
• a narrow and well defined objective;
• insufficient equity to permit the SE to finance its activities without subordinated financial support; and
• financing in the form of multiple contractually linked instruments to investors that create concentrations of credit or other risks (tranches).
The Group is involved with both consolidated and unconsolidated SEs which may be established by the Group or by a third party. SEs are classified as subsidiaries and consolidated when control exists. If the Group does not control a SE, then it will not be consolidated (an unconsolidated SE). This note provides information on both consolidated and unconsolidated SEs.
The Group’s involvement with SEs is as follows:
Type Details
Securitisation The Group uses SEs to securitise customer loans and advances that it has originated, in order to diversify sources of funding for liquidity management. Such transactions involve transfers to an internal securitisation (bankruptcy remote) vehicle which we create for the purpose of structuring assets that are eligible for repurchase under agreements with the applicable central bank (these are known as ‘Repo eligible’). The Group’s internal securitisation SEs are consolidated. Refer to Note 27 Transfers of Financial Assets for further details.
The Group also establishes SEs on behalf of customers to securitise their loans or receivables. The Group may manage these securitisation vehicles or provide liquidity or other support. Additionally, the Group may acquire interests in securitisation vehicles set up by third parties through holding securities issued by such entities. In limited circumstances, where control exists, these SEs are consolidated.
Covered bond issuances Certain loans and advances have been assigned to bankruptcy remote SEs to provide security for issuances of debt securities by the Group. The Group retains control over these SEs and therefore they are consolidated. Refer to Note 27 Transfers of Financial Assets for further details.
Structured finance arrangements
The Group is involved with SEs established:
• in connection with structured lending transactions to facilitate debt syndication and/or to ring-fence collateral; and
• to own assets that are leased to customers in structured leasing transactions.
The Group may manage the SE, hold minor amounts of the SE’s capital, or provide risk management products (derivatives) to the SE.
In most instances, the Group does not control these SEs. Further, the Group’s involvement typically does not establish more than a passive interest in decisions about the relevant activities of the SE, and accordingly we do not consider that interest disclosable.
Funds management activities
The Group’s Wealth Australia and New Zealand businesses conduct investment management and other fiduciary activities as a responsible entity, trustee, custodian or manager for investment funds and trusts – including superannuation funds and wholesale and retail trusts (collectively ‘Investment Funds’). The Investment Funds are financed through the issue of puttable units to investors and the Group considers them to be SEs. The Group’s exposure to Investment Funds includes holding units and receiving fees for services. When the Group invests in Investment Funds on behalf of policyholders, then those funds are consolidated if control is deemed to exist.

135
NOTES TO THE CONSOLIDATED FINANCIAL STATEMENTS
26. STRUCTURED ENTITIES (continued)
CONSOLIDATED STRUCTURED ENTITIES
Financial or Other Support Provided to Consolidated Structured EntitiesThe Group provides financial support to consolidated SEs as outlined below. As these are intra-group transactions, they are eliminated on consolidation:
Securitisation and covered bond issuances
The Group provides lending facilities, derivatives and commitments to these SEs and/or holds debt instruments that they have issued.
Structured finance arrangements The assets held by these SEs are normally pledged as collateral for financing provided. Certain consolidated SEs are financed entirely by the Group while others are financed by syndicated loan facilities in which the Group is a participant. The financing provided by the Group includes lending facilities where the Group’s exposure is limited to the amount of the loan and any undrawn amount. Additionally, the Group has provided Letters of Support to these consolidated SEs confirming that the Group will not demand repayment of the financing provided for the ensuing 12 month period.
The Group did not provide any non-contractual support to consolidated SEs during the year (2016: nil). Other than as disclosed above, the Group does not have any current intention to provide financial or other support to consolidated SEs.
UNCONSOLIDATED STRUCTURED ENTITIES
Group’s Interest in Unconsolidated Structured EntitiesAn ‘interest’ in an unconsolidated SE is any form of contractual or non-contractual involvement with an SE that exposes the Group to variability of returns from the performance of that SE. These interests include, but are not limited to: holdings of debt or equity securities; derivatives that pass-on risks specific to the performance of the SE; lending; loan commitments; financial guarantees; and fees from funds management activities.
For the purpose of disclosing interests in unconsolidated SEs:
• no disclosure is made if the Group’s involvement is not more than a passive interest - for example: when the Group’s involvement constitutes a typical customer-supplier relationship. On this basis, exposures to unconsolidated SEs that arise from lending, trading and investing activities are not considered disclosable interests - unless the design of the structured entity allows the Group to participate in decisions about the relevant activities (being those that significantly affect the entity’s returns).
• ‘interests’ do not include derivatives intended to expose the Group to market-risk (rather than performance risk specific to the SE) or derivatives through which the Group creates, rather than absorbs, variability of the unconsolidated SE (such as purchase of credit protection under a credit default swap).
The table below sets out the Group’s interests in unconsolidated SEs together with the maximum exposure to loss that could arise from those interests:
Securitisation and structured finance Investment funds Total
2017 2016 2017 2016 2017 2016$m $m $m $m $m $m
On-balance sheet interests:
Available-for-sale assets 2,532 3,591 - - 2,532 3,591
Investments backing policy liabilities - - 21 156 21 156
Loans and advances 7,130 7,269 - - 7,130 7,269
Total on-balance sheet 9,662 10,860 21 156 9,683 11,016
Off-balance sheet interests:
Commitments (facilities undrawn) 4,371 2,588 - - 4,371 2,588
Total off-balance sheet 4,371 2,588 - - 4,371 2,588
Maximum exposure to loss 14,033 13,448 21 156 14,054 13,604
In addition to the interests above, the Group earned funds management fees from unconsolidated SEs of $493 million (2016: $524 million) during the year.
136
ANZ 2017 ANNUAL REPORT
NOTES TO THE CONSOLIDATED FINANCIAL STATEMENTS (continued)
26. STRUCTURED ENTITIES (continued)
The Group’s maximum exposure to loss represents the maximum amount of loss that the Group could incur as a result of its involvement with unconsolidated SEs if loss events were to take place – regardless of the probability of occurrence. This does not in any way represent the actual losses expected to be incurred. Instead, the maximum exposure to loss is contingent in nature – for example, it may arise: on the bankruptcy of an issuer of securities, or a debtor; or if liquidity facilities or guarantees were to be called on. Furthermore, the maximum exposure to loss is stated gross of the effects of hedging and collateral arrangements entered into to mitigate ANZ’s exposure to loss.
For each type of interest, the maximum exposure to loss has been determined as follows:
• available-for-sale assets and investments backing policy liabilities – carrying amount; and
• loans and advances – carrying amount plus the undrawn amount of any commitments.
Information about the size of the unconsolidated SEs that the Group is involved with is as follows:
• Securitisation and structured finance: size is indicated by total assets which vary by SE with a maximum value of approximately $2.1 billion (2016: $1.7 billion); and
• Investment funds: size is indicated by Funds Under Management which vary by SE with a maximum value of approximately $35.9 billion (2016: $35.0 billion).
The Group did not provide any non-contractual support to unconsolidated SEs during the year (2016: nil): nor does it have any current intention to provide financial or other support to unconsolidated SEs.
SPONSORED UNCONSOLIDATED STRUCTURED ENTITIESThe Group may also sponsor unconsolidated SEs in which it has no disclosable interest.
For the purposes of this disclosure, the Group considers itself the ‘sponsor’ of an unconsolidated SE if it is the primary party involved in the design and establishment of that SE and:
• the Group is the major user of that SE; or
• the Group’s name appears in the name of that SE, or on its products; or
• the Group provides implicit or explicit guarantees of that SE’s performance.
The Group has sponsored the ANZ PIE Fund in New Zealand, which invests only in deposits with ANZ Bank New Zealand Limited. The Group does not provide any implicit or explicit guarantees of the capital value or performance of investments in the ANZ PIE Fund. There was no income received from, nor assets transferred to, this entity during the year.
KEY JUDGEMENTS AND ESTIMATES
Significant judgement is required in assessing whether control exists over Structured Entities involved in securitisation activities and structured finance transactions, and investment funds. Judgement is required in relation to the existence of:
• power over the relevant activities (being those that significantly affect the entity’s returns); and
• exposure to variable returns of that entity
137
NOTES TO THE CONSOLIDATED FINANCIAL STATEMENTS
27. TRANSFERS OF FINANCIAL ASSETSIn the normal course of business the Group enters into transactions where it transfers financial assets directly to third parties or to SEs. These transfers may give rise to the Group fully, or partially, derecognising those financial assets - depending on the Group’s exposure to the risks and rewards or control over the transferred assets. If the Group retains substantially all of the risk and rewards of a transferred asset, the transfer does not qualify for derecognition and the asset remains on the Group’s balance sheet in its entirety.
SECURITISATIONS Net loans and advances include residential mortgages securitised under the Group’s securitisation programs which are assigned to bankruptcy remote SEs to provide security for obligations payable on the notes issued by the SEs. This includes mortgages that are held for potential repurchase agreements (Repos) with central banks. The holders of the issued notes have full recourse to the pool of residential mortgages which have been securitised and the Group cannot otherwise pledge or dispose of the transferred assets.
In some instances the Group is also the holder of the securitised notes. In addition, the Group is entitled to any residual income of the SEs and sometimes enters into derivatives with the SEs. The Group retains the majority of the risks and rewards of the residential mortgages and continues to recognise the mortgages as financial assets. The obligation to pay this amount to the SE is recognised as a financial liability of the Group.
The Group is exposed to variable returns from its involvement with these securitisation SEs and has the ability to affect those returns through its power over the SEs activities. The SEs are therefore consolidated by the Group.
COVERED BONDS The Group operates various global covered bond programs to raise funding in its primary markets. Net loans and advances include residential mortgages assigned to bankruptcy remote SEs associated with these covered bond programs. The mortgages provide security for the obligations payable on the issued covered bonds.
The covered bond holders have dual recourse to the issuer and the cover pool of assets. The issuer cannot otherwise pledge or dispose of the transferred assets, however, subject to legal arrangements it may repurchase and substitute assets as long as the required cover is maintained.
The Group is required to maintain the cover pool at a level sufficient to cover the bond obligations. In addition the Group is entitled to any residual income of the covered bond SEs and enters into derivatives with the SEs. The Group retains the majority of the risks and rewards of the residential mortgages and continues to recognise the mortgages as financial assets. The obligation to pay this amount to the SEs is recognised as a financial liability of the Group.
The Group is exposed to variable returns from its involvement with the covered bond SEs and has the ability to affect those returns through its power over the SEs activities. The SEs are therefore consolidated by the Group. The covered bonds issued externally are included within debt issuances.
REPURCHASE AGREEMENTSIf the Group sells securities subject to repurchase agreements under which substantially all the risks and rewards of ownership remain with the Group, then those assets are considered to be transferred assets that do not qualify for derecognition. An associated liability is recognised for the consideration received from the counterparty.
STRUCTURED FINANCE ARRANGEMENTSThe Group arranges funding for certain customer transactions through structured leasing and commodity prepayment arrangements. At times, other financial institutions participate in the funding of these arrangements. This participation involves a proportionate transfer of the rights to the lease receivable or financing arrangement. The participating banks have limited recourse to the leased assets or financed commodity and related proceeds. In some circumstances the Group continues to be exposed to some of the risks of the transferred lease receivable or financing arrangement through a derivative or other continuing involvement. When this occurs, the Group does not derecognise the lease receivable or loan. Instead, the Group recognises an associated liability representing its obligations to the participating financial institutions.

138
ANZ 2017 ANNUAL REPORT
NOTES TO THE CONSOLIDATED FINANCIAL STATEMENTS (continued)
27. TRANSFERS OF FINANCIAL ASSETS (continued)
The table below sets out the balance of assets transferred that do not qualify for derecognition, along with the associated liabilities:
Securitisations1,2 Covered bonds Repurchase agreementsStructured finance
arrangements
2017 2016 2017 2016 2017 2016 2017 2016$m $m $m $m $m $m $m $m
Current carrying amount of assets transferred 1,520 - 29,353 31,790 36,242 26,637 98 275
Carrying amount of associated liabilities 1,552 - 19,859 21,039 34,536 25,049 91 266
1. Does not include transfers to internal structured entities where there are no external investors.2. The securitisation noteholders have recourse only to the pool of residential mortgages which have been securitised. The carrying value of securitised assets and the associated liabilities approximates
their fair value.
28. ASSETS AND LIABILITIES HELD FOR SALE The Group announced the following strategic divestments in line with the Group’s strategy to simplify the businesses and improve capital efficiency. Accordingly, they are presented as assets and liabilities held for sale.
• Asia Retail & Wealth Businesses The Group announced that it had agreed to sell Retail and Wealth businesses in Singapore, Hong Kong, China, Taiwan and Indonesia to Singapore’s DBS Bank on 31 October 2016, and its Retail business in Vietnam to Shinhan Bank Vietnam on 21 April 2017. During the September 2017 half, the Group successfully completed the sales in China, Singapore and Hong Kong. Subject to regulatory approval, the sales in Vietnam, Taiwan, and Indonesia are expected to complete in late 2017 and early 2018 and these remaining countries form part of the assets and liabilities held for sale. These businesses are part of the Asia Retail & Pacific division.
• UDC Finance On 11 January 2017, the Group announced it had agreed to sell UDC Finance to HNA Group. The sale is subject to certain conditions (including regulatory approvals) and we are working with HNA Group towards completion of the sale. This business is part of the New Zealand division.
• Shanghai Rural Commercial Bank On 3 January 2017, the Group announced that it had agreed to sell its 20% stake in Shanghai Rural Commercial Bank (SRCB). On 18 September 2017 the Group announced a revision to the 3 January arrangement in which Baoshan Iron & Steel Co. Ltd. (Bao) replaced Shanghai Sino-Poland Enterprise Management Development Corporation Limited to join China COSCO Shipping Corporation Limited (COSCO) to acquire ANZ’s 20% stake in SRCB. Under the updated arrangement, COSCO and Bao will each acquire a 10% stake in SRCB. The key financial terms of the revised sale agreement are unchanged from the transaction announced previously. The sale is subject to customary closing conditions and regulatory approvals and is expected to complete late 2017. This asset is part of the TSO and Group Centre Division.
• Metrobank Card Corporation On 18 October 2017, the Group announced it had entered into an agreement with its joint venture partner Metropolitan Bank & Trust Company (Metrobank) in relation to its 40% stake in the Philippines based Metrobank Card Corporation (MCC). The Group has agreed to sell 20% of its stake, and entered into a put option to sell the remaining 20% stake, exercisable in the fourth quarter of 2018 on the same terms for the same consideration. The asset has been classified as held for sale at 30 September 2017 as sale negotiations were well progressed at that time, and it was highly probable the sale transaction would complete within 12 months. The sale is subject to customary closing conditions and regulatory approvals. This asset is part of the TSO and Group Centre Division.
INCOME STATEMENT IMPACT RELATING TO ASSETS AND LIABILITIES HELD FOR SALEDuring the September 2017 full year, the Group recognised the following impacts in relation to assets and liabilities held for sale:
• $310 million loss relating to the reclassification and partial completion of the Asia Retail and Wealth sale comprising of $222 million of software, goodwill and other assets impairment charges and $88 million of various other charges net of recoveries and sale premium.
• $333 million loss relating to the Group’s investment in SRCB comprising of a $219 million impairment to the investment, $12 million of foreign exchange losses, and $102 million of tax expenses.
The net result of these impacts is included in ‘Other income’ and ‘Income tax expense’ (refer to Note 2 Operating Income and Note 4 Income Tax).
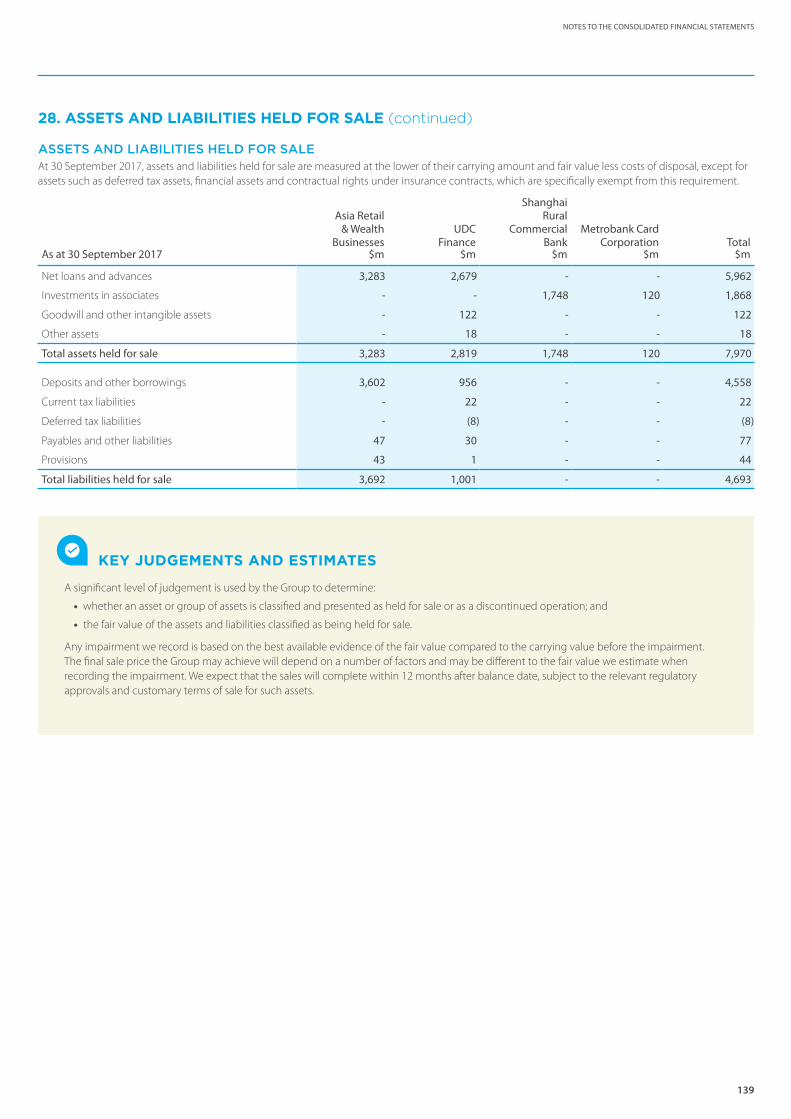
139
NOTES TO THE CONSOLIDATED FINANCIAL STATEMENTS
28. ASSETS AND LIABILITIES HELD FOR SALE (continued)
ASSETS AND LIABILITIES HELD FOR SALEAt 30 September 2017, assets and liabilities held for sale are measured at the lower of their carrying amount and fair value less costs of disposal, except for assets such as deferred tax assets, financial assets and contractual rights under insurance contracts, which are specifically exempt from this requirement.
As at 30 September 2017
Asia Retail & Wealth
Businesses UDC
Finance
Shanghai Rural
Commercial Bank
Metrobank Card Corporation Total
$m $m $m $m $m
Net loans and advances 3,283 2,679 - - 5,962
Investments in associates - - 1,748 120 1,868
Goodwill and other intangible assets - 122 - - 122
Other assets - 18 - - 18
Total assets held for sale 3,283 2,819 1,748 120 7,970
Deposits and other borrowings 3,602 956 - - 4,558
Current tax liabilities - 22 - - 22
Deferred tax liabilities - (8) - - (8)
Payables and other liabilities 47 30 - - 77
Provisions 43 1 - - 44
Total liabilities held for sale 3,692 1,001 - - 4,693
KEY JUDGEMENTS AND ESTIMATES
A significant level of judgement is used by the Group to determine:
• whether an asset or group of assets is classified and presented as held for sale or as a discontinued operation; and
• the fair value of the assets and liabilities classified as being held for sale.
Any impairment we record is based on the best available evidence of the fair value compared to the carrying value before the impairment. The final sale price the Group may achieve will depend on a number of factors and may be different to the fair value we estimate when recording the impairment. We expect that the sales will complete within 12 months after balance date, subject to the relevant regulatory approvals and customary terms of sale for such assets.
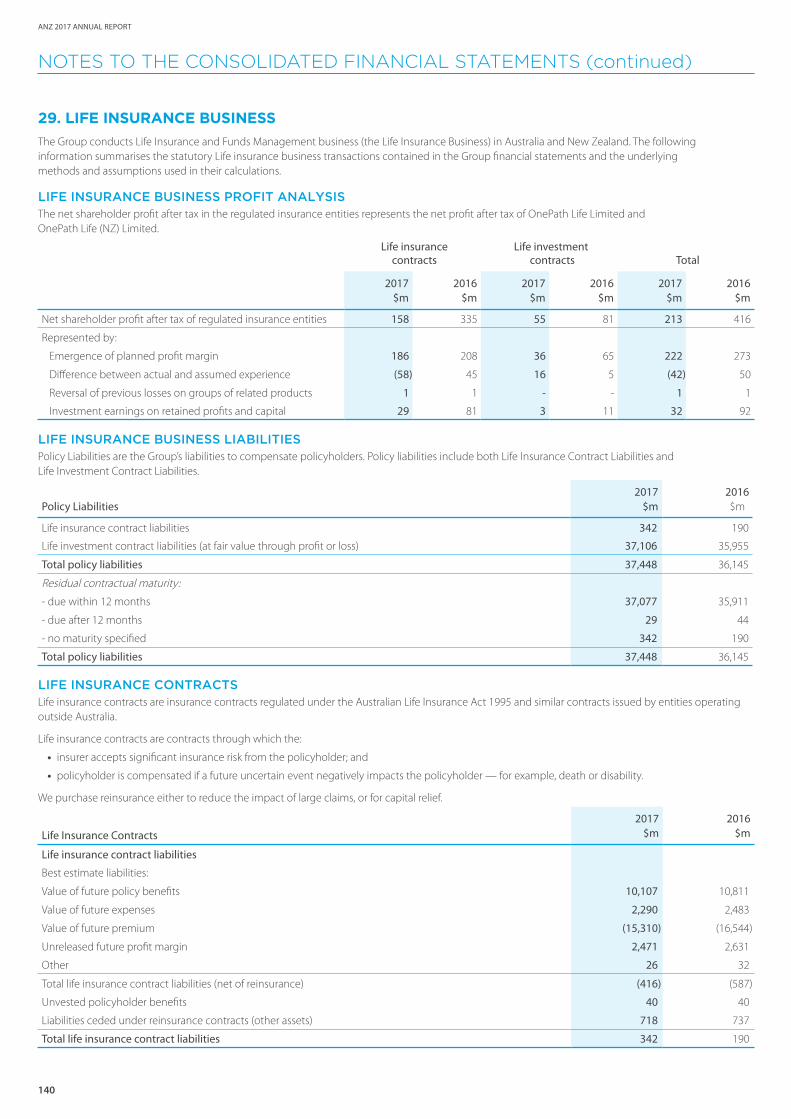
140
ANZ 2017 ANNUAL REPORT
NOTES TO THE CONSOLIDATED FINANCIAL STATEMENTS (continued)
29. LIFE INSURANCE BUSINESSThe Group conducts Life Insurance and Funds Management business (the Life Insurance Business) in Australia and New Zealand. The following information summarises the statutory Life insurance business transactions contained in the Group financial statements and the underlying methods and assumptions used in their calculations.
LIFE INSURANCE BUSINESS PROFIT ANALYSISThe net shareholder profit after tax in the regulated insurance entities represents the net profit after tax of OnePath Life Limited and OnePath Life (NZ) Limited.
Life insurance Life investmentTotalcontracts contracts
2017 2016 2017 2016 2017 2016$m $m $m $m $m $m
Net shareholder profit after tax of regulated insurance entities 158 335 55 81 213 416
Represented by:
Emergence of planned profit margin 186 208 36 65 222 273
Difference between actual and assumed experience (58) 45 16 5 (42) 50
Reversal of previous losses on groups of related products 1 1 - - 1 1
Investment earnings on retained profits and capital 29 81 3 11 32 92
LIFE INSURANCE BUSINESS LIABILITIESPolicy Liabilities are the Group’s liabilities to compensate policyholders. Policy liabilities include both Life Insurance Contract Liabilities and Life Investment Contract Liabilities.
Policy Liabilities2017 2016
$m $m
Life insurance contract liabilities 342 190
Life investment contract liabilities (at fair value through profit or loss) 37,106 35,955
Total policy liabilities 37,448 36,145
Residual contractual maturity:
- due within 12 months 37,077 35,911
- due after 12 months 29 44
- no maturity specified 342 190
Total policy liabilities 37,448 36,145
LIFE INSURANCE CONTRACTS Life insurance contracts are insurance contracts regulated under the Australian Life Insurance Act 1995 and similar contracts issued by entities operating outside Australia.
Life insurance contracts are contracts through which the:
• insurer accepts significant insurance risk from the policyholder; and
• policyholder is compensated if a future uncertain event negatively impacts the policyholder — for example, death or disability.
We purchase reinsurance either to reduce the impact of large claims, or for capital relief.
Life Insurance Contracts
2017 2016$m $m
Life insurance contract liabilities
Best estimate liabilities:
Value of future policy benefits 10,107 10,811
Value of future expenses 2,290 2,483
Value of future premium (15,310) (16,544)
Unreleased future profit margin 2,471 2,631
Other 26 32
Total life insurance contract liabilities (net of reinsurance) (416) (587)
Unvested policyholder benefits 40 40
Liabilities ceded under reinsurance contracts (other assets) 718 737
Total life insurance contract liabilities 342 190
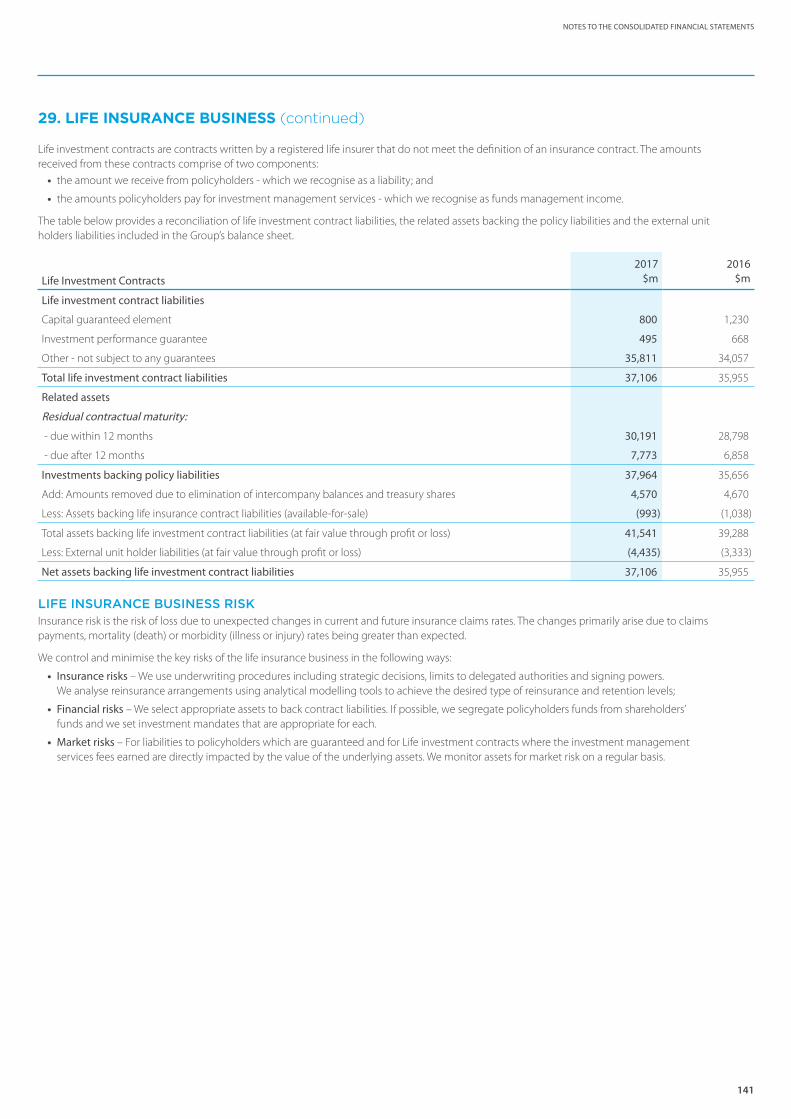
141
NOTES TO THE CONSOLIDATED FINANCIAL STATEMENTS
29. LIFE INSURANCE BUSINESS (continued)
Life investment contracts are contracts written by a registered life insurer that do not meet the definition of an insurance contract. The amounts received from these contracts comprise of two components:
• the amount we receive from policyholders - which we recognise as a liability; and
• the amounts policyholders pay for investment management services - which we recognise as funds management income.
The table below provides a reconciliation of life investment contract liabilities, the related assets backing the policy liabilities and the external unit holders liabilities included in the Group’s balance sheet.
Life Investment Contracts
2017 2016$m $m
Life investment contract liabilities
Capital guaranteed element 800 1,230
Investment performance guarantee 495 668
Other - not subject to any guarantees 35,811 34,057
Total life investment contract liabilities 37,106 35,955
Related assets
Residual contractual maturity:
- due within 12 months 30,191 28,798
- due after 12 months 7,773 6,858
Investments backing policy liabilities 37,964 35,656
Add: Amounts removed due to elimination of intercompany balances and treasury shares 4,570 4,670
Less: Assets backing life insurance contract liabilities (available-for-sale) (993) (1,038)
Total assets backing life investment contract liabilities (at fair value through profit or loss) 41,541 39,288
Less: External unit holder liabilities (at fair value through profit or loss) (4,435) (3,333)
Net assets backing life investment contract liabilities 37,106 35,955
LIFE INSURANCE BUSINESS RISKInsurance risk is the risk of loss due to unexpected changes in current and future insurance claims rates. The changes primarily arise due to claims payments, mortality (death) or morbidity (illness or injury) rates being greater than expected.
We control and minimise the key risks of the life insurance business in the following ways:
• Insurance risks – We use underwriting procedures including strategic decisions, limits to delegated authorities and signing powers. We analyse reinsurance arrangements using analytical modelling tools to achieve the desired type of reinsurance and retention levels;
• Financial risks – We select appropriate assets to back contract liabilities. If possible, we segregate policyholders funds from shareholders’ funds and we set investment mandates that are appropriate for each.
• Market risks – For liabilities to policyholders which are guaranteed and for Life investment contracts where the investment management services fees earned are directly impacted by the value of the underlying assets. We monitor assets for market risk on a regular basis.

142
ANZ 2017 ANNUAL REPORT
NOTES TO THE CONSOLIDATED FINANCIAL STATEMENTS (continued)
29. LIFE INSURANCE BUSINESS (continued)
RECOGNITION AND MEASUREMENT
Life insurance contract liabilitiesWe calculate Life insurance contract Liabilities under the Margin on Service (MoS) model using a projection method through which we determine the liability as the present value of:
• expected future cashflows (premiums, expenses, and benefit payments); plus
• planned profit margin to be released in future periods.
We discount these cashflows at the risk-free discount rate. We calculate the Life insurance contract liabilities across portfolios of contracts using recognised actuarial principles and standards (e.g. Life Insurance Prudential Standard 340 Valuation of Policy Liabilities issued by APRA). This methodology takes into account the risks and uncertainties of the particular portfolio.
Liabilities ceded under reinsurance contractsWe account for reinsurance on the same basis as the underlying direct insurance contracts for which we purchased the reinsurance.
Unvested policyholder benefitsWe issue participating contracts to policyholders where the policyholder is entitled to a share of the profits as they are exposed to the performance of specific assets in addition to a guaranteed benefit. This profit sharing is governed by the Life Act and the life insurance company’s constitution. If any benefits remain payable at the end of the reporting period, then we recognise them as unvested policyholder benefits.
Life investment contract liabilitiesA life investment contract liability is measured at fair value and is directly linked to the fair value of the assets that back it. We determine the liability as the fair value of those assets after tax. For guaranteed policies, we determine the liability as the net present value of expected cash flows, subject to a minimum of current surrender value.
External unit holder liabilities The life insurance business includes controlling interests in investment funds which we aggregate. When we aggregate a controlled investment fund, we recognise the external unit holder liabilities as a liability and include them on the balance sheet in external unit holder liabilities.
Investments backing policy liabilities Investments backing policy liabilities include:
• Assets backing investment contract liabilities - being the assets held in regulated insurance entities that are not segregated and managed under a distinct shareholder investment mandate. We also call these policyholder assets.
• Assets backing life insurance contract liabilities - being the assets held in regulated insurance entities that are managed under a distinct shareholder mandate. We also call these shareholder assets.
Our determination of fair value of the policyholder and shareholder assets involves the same judgement as other financial assets as described in Note 17 Fair Value of Financial Assets and Liabilities.
KEY JUDGEMENTS AND ESTIMATES
The key factors that affect how we estimate life insurance liabilities and related assets are:
• the cost of providing benefits and administering contracts;
• mortality and morbidity experience, which includes enhancements to policyholder benefits;
• discontinuance experience, which affects the Group’s ability to recover the cost of acquiring new business over the lives of the contracts; and
• the amounts credited to policyholders’ accounts compared to the returns on invested assets through asset-liability management and strategic and tactical asset allocation.
Our estimates of life insurance liabilities are affected by: regulation, competition, interest rates, inflation, taxes and general economic conditions.
We have performed sensitivity analysis on key variables influencing insurance liabilities and assets — namely: interest, inflation, mortality, morbidity and discontinuance risk. We have determined that there would be no material impact to the Group for a reasonable change in any of these variables.
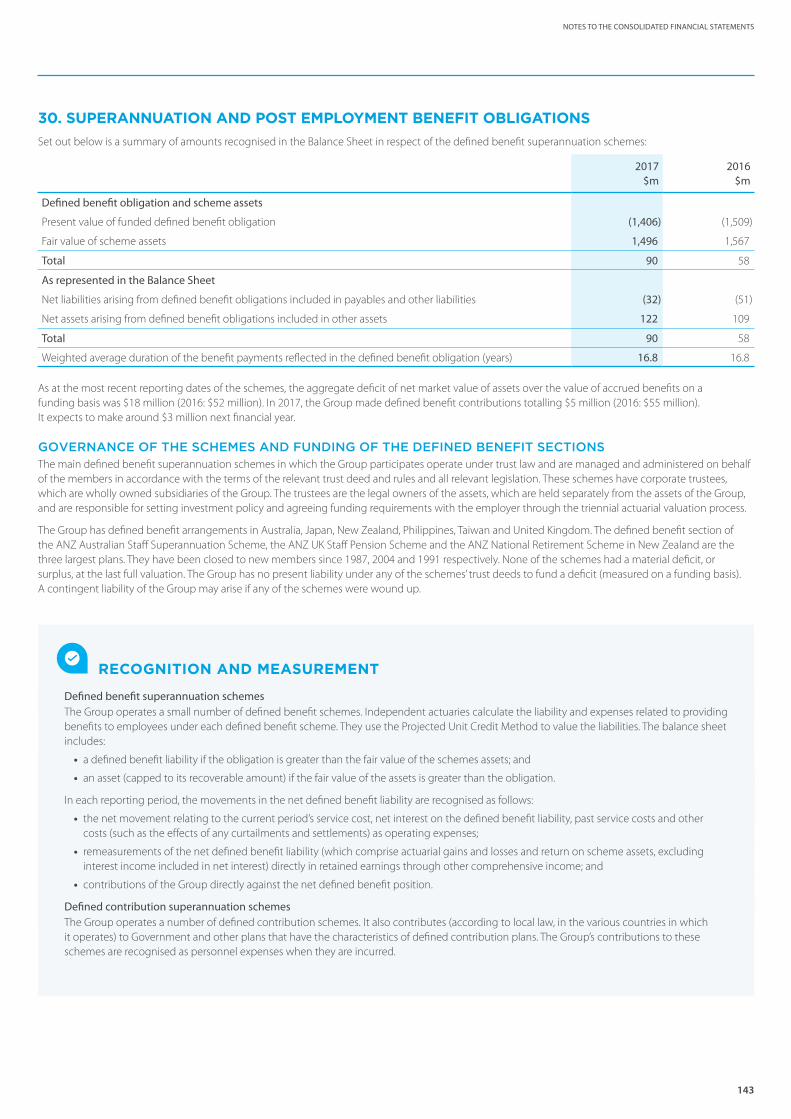
143
NOTES TO THE CONSOLIDATED FINANCIAL STATEMENTS
30. SUPERANNUATION AND POST EMPLOYMENT BENEFIT OBLIGATIONSSet out below is a summary of amounts recognised in the Balance Sheet in respect of the defined benefit superannuation schemes:
2017 2016$m $m
Defined benefit obligation and scheme assets
Present value of funded defined benefit obligation (1,406) (1,509)
Fair value of scheme assets 1,496 1,567
Total 90 58
As represented in the Balance Sheet
Net liabilities arising from defined benefit obligations included in payables and other liabilities (32) (51)
Net assets arising from defined benefit obligations included in other assets 122 109
Total 90 58
Weighted average duration of the benefit payments reflected in the defined benefit obligation (years) 16.8 16.8
As at the most recent reporting dates of the schemes, the aggregate deficit of net market value of assets over the value of accrued benefits on a funding basis was $18 million (2016: $52 million). In 2017, the Group made defined benefit contributions totalling $5 million (2016: $55 million). It expects to make around $3 million next financial year.
GOVERNANCE OF THE SCHEMES AND FUNDING OF THE DEFINED BENEFIT SECTIONSThe main defined benefit superannuation schemes in which the Group participates operate under trust law and are managed and administered on behalf of the members in accordance with the terms of the relevant trust deed and rules and all relevant legislation. These schemes have corporate trustees, which are wholly owned subsidiaries of the Group. The trustees are the legal owners of the assets, which are held separately from the assets of the Group, and are responsible for setting investment policy and agreeing funding requirements with the employer through the triennial actuarial valuation process.
The Group has defined benefit arrangements in Australia, Japan, New Zealand, Philippines, Taiwan and United Kingdom. The defined benefit section of the ANZ Australian Staff Superannuation Scheme, the ANZ UK Staff Pension Scheme and the ANZ National Retirement Scheme in New Zealand are the three largest plans. They have been closed to new members since 1987, 2004 and 1991 respectively. None of the schemes had a material deficit, or surplus, at the last full valuation. The Group has no present liability under any of the schemes’ trust deeds to fund a deficit (measured on a funding basis). A contingent liability of the Group may arise if any of the schemes were wound up.
RECOGNITION AND MEASUREMENT
Defined benefit superannuation schemesThe Group operates a small number of defined benefit schemes. Independent actuaries calculate the liability and expenses related to providing benefits to employees under each defined benefit scheme. They use the Projected Unit Credit Method to value the liabilities. The balance sheet includes:
• a defined benefit liability if the obligation is greater than the fair value of the schemes assets; and
• an asset (capped to its recoverable amount) if the fair value of the assets is greater than the obligation.
In each reporting period, the movements in the net defined benefit liability are recognised as follows:
• the net movement relating to the current period’s service cost, net interest on the defined benefit liability, past service costs and other costs (such as the effects of any curtailments and settlements) as operating expenses;
• remeasurements of the net defined benefit liability (which comprise actuarial gains and losses and return on scheme assets, excluding interest income included in net interest) directly in retained earnings through other comprehensive income; and
• contributions of the Group directly against the net defined benefit position.
Defined contribution superannuation schemesThe Group operates a number of defined contribution schemes. It also contributes (according to local law, in the various countries in which it operates) to Government and other plans that have the characteristics of defined contribution plans. The Group’s contributions to these schemes are recognised as personnel expenses when they are incurred.
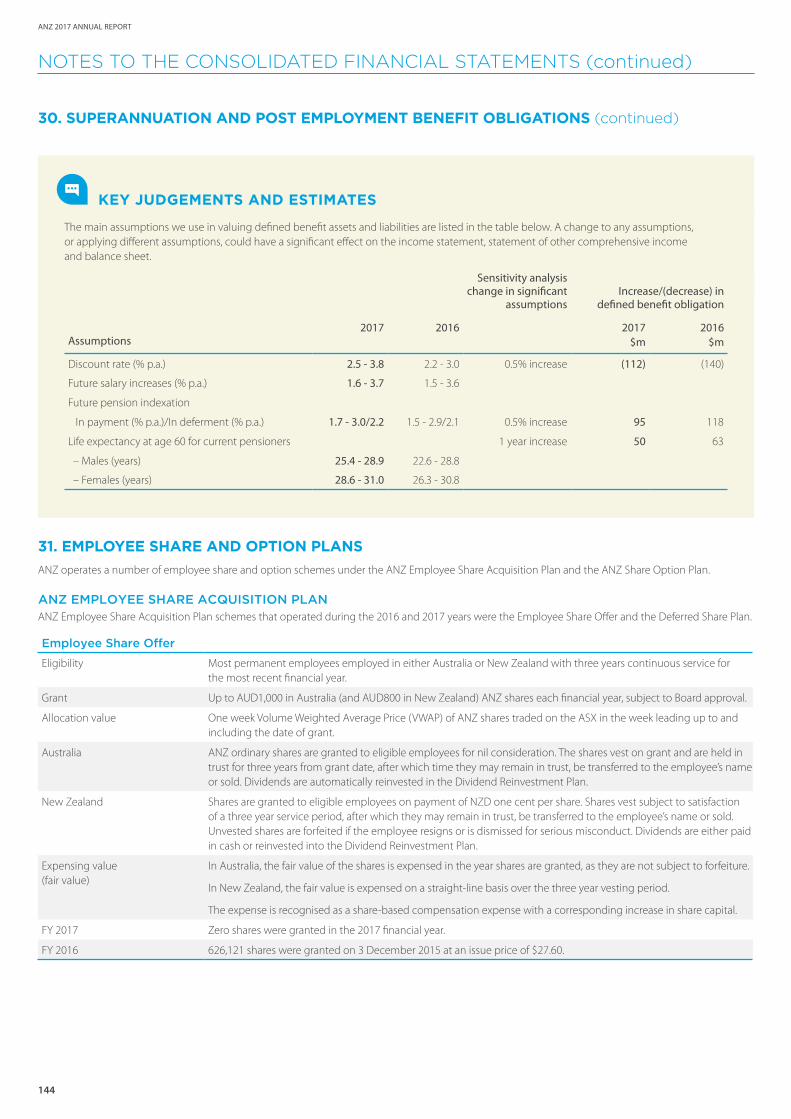
144
ANZ 2017 ANNUAL REPORT
NOTES TO THE CONSOLIDATED FINANCIAL STATEMENTS (continued)
30. SUPERANNUATION AND POST EMPLOYMENT BENEFIT OBLIGATIONS (continued)
KEY JUDGEMENTS AND ESTIMATES
The main assumptions we use in valuing defined benefit assets and liabilities are listed in the table below. A change to any assumptions, or applying different assumptions, could have a significant effect on the income statement, statement of other comprehensive income and balance sheet.
Sensitivity analysischange in significant
assumptionsIncrease/(decrease) in
defined benefit obligation
2017 2016 2017 2016Assumptions $m $m
Discount rate (% p.a.) 2.5 - 3.8 2.2 - 3.0 0.5% increase (112) (140)
Future salary increases (% p.a.) 1.6 - 3.7 1.5 - 3.6
Future pension indexation
In payment (% p.a.)/In deferment (% p.a.) 1.7 - 3.0/2.2 1.5 - 2.9/2.1 0.5% increase 95 118
Life expectancy at age 60 for current pensioners 1 year increase 50 63
– Males (years) 25.4 - 28.9 22.6 - 28.8
– Females (years) 28.6 - 31.0 26.3 - 30.8
31. EMPLOYEE SHARE AND OPTION PLANSANZ operates a number of employee share and option schemes under the ANZ Employee Share Acquisition Plan and the ANZ Share Option Plan.
ANZ EMPLOYEE SHARE ACQUISITION PLANANZ Employee Share Acquisition Plan schemes that operated during the 2016 and 2017 years were the Employee Share Offer and the Deferred Share Plan.
Employee Share Offer
Eligibility Most permanent employees employed in either Australia or New Zealand with three years continuous service for the most recent financial year.
Grant Up to AUD1,000 in Australia (and AUD800 in New Zealand) ANZ shares each financial year, subject to Board approval.
Allocation value One week Volume Weighted Average Price (VWAP) of ANZ shares traded on the ASX in the week leading up to and including the date of grant.
Australia ANZ ordinary shares are granted to eligible employees for nil consideration. The shares vest on grant and are held in trust for three years from grant date, after which time they may remain in trust, be transferred to the employee’s name or sold. Dividends are automatically reinvested in the Dividend Reinvestment Plan.
New Zealand Shares are granted to eligible employees on payment of NZD one cent per share. Shares vest subject to satisfaction of a three year service period, after which they may remain in trust, be transferred to the employee’s name or sold. Unvested shares are forfeited if the employee resigns or is dismissed for serious misconduct. Dividends are either paid in cash or reinvested into the Dividend Reinvestment Plan.
Expensing value (fair value)
In Australia, the fair value of the shares is expensed in the year shares are granted, as they are not subject to forfeiture.
In New Zealand, the fair value is expensed on a straight-line basis over the three year vesting period.
The expense is recognised as a share-based compensation expense with a corresponding increase in share capital.
FY 2017 Zero shares were granted in the 2017 financial year.
FY 2016 626,121 shares were granted on 3 December 2015 at an issue price of $27.60.
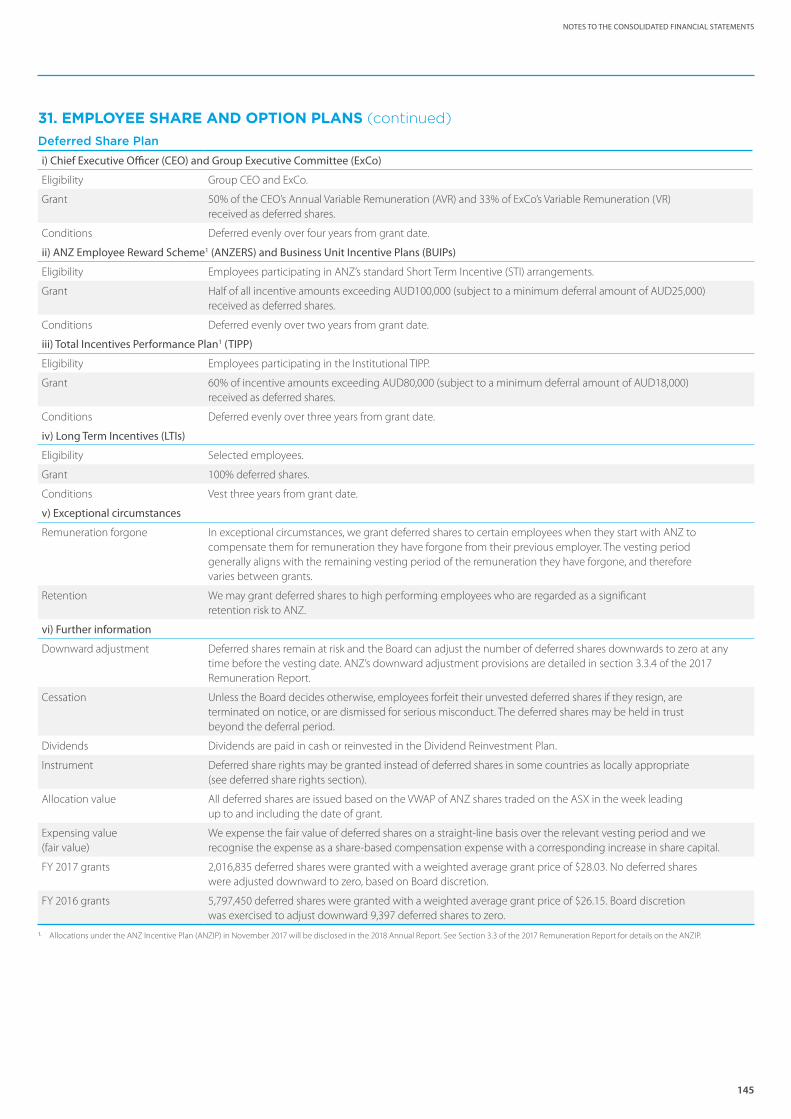
145
NOTES TO THE CONSOLIDATED FINANCIAL STATEMENTS
31. EMPLOYEE SHARE AND OPTION PLANS (continued)
Deferred Share Plan
i) Chief Executive Officer (CEO) and Group Executive Committee (ExCo)
Eligibility Group CEO and ExCo.
Grant 50% of the CEO’s Annual Variable Remuneration (AVR) and 33% of ExCo’s Variable Remuneration (VR) received as deferred shares.
Conditions Deferred evenly over four years from grant date.
ii) ANZ Employee Reward Scheme1 (ANZERS) and Business Unit Incentive Plans (BUIPs)
Eligibility Employees participating in ANZ’s standard Short Term Incentive (STI) arrangements.
Grant Half of all incentive amounts exceeding AUD100,000 (subject to a minimum deferral amount of AUD25,000) received as deferred shares.
Conditions Deferred evenly over two years from grant date.
iii) Total Incentives Performance Plan1 (TIPP)
Eligibility Employees participating in the Institutional TIPP.
Grant 60% of incentive amounts exceeding AUD80,000 (subject to a minimum deferral amount of AUD18,000) received as deferred shares.
Conditions Deferred evenly over three years from grant date.
iv) Long Term Incentives (LTIs)
Eligibility Selected employees.
Grant 100% deferred shares.
Conditions Vest three years from grant date.
v) Exceptional circumstances
Remuneration forgone In exceptional circumstances, we grant deferred shares to certain employees when they start with ANZ to compensate them for remuneration they have forgone from their previous employer. The vesting period generally aligns with the remaining vesting period of the remuneration they have forgone, and therefore varies between grants.
Retention We may grant deferred shares to high performing employees who are regarded as a significant retention risk to ANZ.
vi) Further information
Downward adjustment Deferred shares remain at risk and the Board can adjust the number of deferred shares downwards to zero at any time before the vesting date. ANZ’s downward adjustment provisions are detailed in section 3.3.4 of the 2017 Remuneration Report.
Cessation Unless the Board decides otherwise, employees forfeit their unvested deferred shares if they resign, are terminated on notice, or are dismissed for serious misconduct. The deferred shares may be held in trust beyond the deferral period.
Dividends Dividends are paid in cash or reinvested in the Dividend Reinvestment Plan.
Instrument Deferred share rights may be granted instead of deferred shares in some countries as locally appropriate (see deferred share rights section).
Allocation value All deferred shares are issued based on the VWAP of ANZ shares traded on the ASX in the week leading up to and including the date of grant.
Expensing value (fair value)
We expense the fair value of deferred shares on a straight-line basis over the relevant vesting period and we recognise the expense as a share-based compensation expense with a corresponding increase in share capital.
FY 2017 grants 2,016,835 deferred shares were granted with a weighted average grant price of $28.03. No deferred shares were adjusted downward to zero, based on Board discretion.
FY 2016 grants 5,797,450 deferred shares were granted with a weighted average grant price of $26.15. Board discretion was exercised to adjust downward 9,397 deferred shares to zero.
1. Allocations under the ANZ Incentive Plan (ANZIP) in November 2017 will be disclosed in the 2018 Annual Report. See Section 3.3 of the 2017 Remuneration Report for details on the ANZIP.

146
ANZ 2017 ANNUAL REPORT
NOTES TO THE CONSOLIDATED FINANCIAL STATEMENTS (continued)
31. EMPLOYEE SHARE AND OPTION PLANS (continued)
Expensing of the ANZ Employee Share Acquisition Plan
Expensing value (fair value)
The fair value of shares we granted during 2017 under the Employee Share Offer and the Deferred Share Plan, measured as at the date of grant of the shares, is $56.7 million (2016: $171.3 million) based on 2,016,835 shares (2016: 6,423,571) at VWAP of $28.09 (2016: $26.67).
ANZ SHARE OPTION PLAN
Allocation We may grant selected employees options/rights which entitle them to acquire fully paid ordinary ANZ shares at a fixed price at the time the options/rights vest. Voting and dividend rights will be attached to the ordinary shares allocated on exercise of the options/rights.
Each option/right entitles the holder to one ordinary share subject to the terms and conditions imposed on grant. Exercise price of options, determined in accordance with the rules of the plan, is generally based on the VWAP of the shares traded on the ASX in the week leading up to and including the date of grant. For rights, the exercise price is nil.
Rules Prior to the exercise of the option/right if ANZ changes its share capital due to a bonus share issue, pro-rata new share issue or reorganisation the following adjustments are required:
• Issue of bonus shares - When the holder exercises their option, they are also entitled to be issued the number of bonus shares they would have been entitled to had they held the underlying shares at the time of the bonus issue;
• Pro-rata share offer - We will adjust the exercise price of the option in the manner set out in the ASX Listing Rules; and
• Reorganisation - In respect of rights, if there is a bonus issue or reorganisation of ANZ’s share capital, then the Board may adjust the number of rights or the number of underlying shares so that there is no advantage or disadvantage to the holder.
Holders otherwise have no other entitlements to participate:
• in any new issue of ANZ securities before they exercise their options/rights; or
• in a share issue of a body corporate other than ANZ (such as a subsidiary).
For equity grants made after 1 November 2012, any portion of the award which vests may, at the Board’s discretion, be satisfied by a cash equivalent payment rather than shares.
Expensing We expense the fair value of options/rights on a straight-line basis over the relevant vesting period and we recognise the expense as a share-based compensation expense with a corresponding increase in share options reserve.
Cessation The provisions that apply if the employee’s employment ends are in section 7.2 of the 2017 Remuneration Report.
Downward adjustment ANZ’s downward adjustment provisions are detailed in section 3.3.4 of the 2017 Remuneration Report.
Option Plans that operated during 2017 and 2016
i) Performance Rights
Allocation We grant performance rights to selected employees as part of ANZ’s incentive plans. Performance rights provide the holder with the right to acquire ANZ shares at nil cost, subject to a three year vesting period and Total Shareholder Return (TSR) performance hurdles.
FY 2017 and FY 2016 grants During the 2017 year, we granted 944,419 performance rights (2016: 1,570,627). No performance rights were adjusted downward to zero in 2017 and 2016, based on Board discretion.
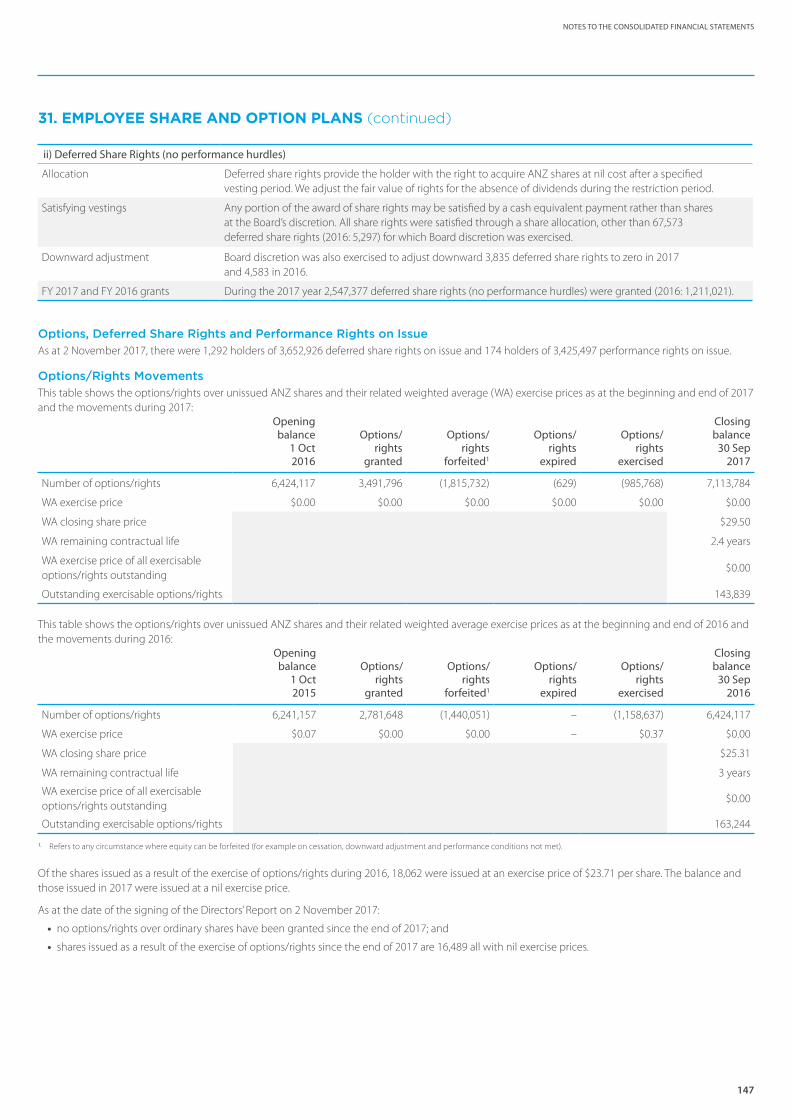
147
NOTES TO THE CONSOLIDATED FINANCIAL STATEMENTS
31. EMPLOYEE SHARE AND OPTION PLANS (continued)
ii) Deferred Share Rights (no performance hurdles)
Allocation Deferred share rights provide the holder with the right to acquire ANZ shares at nil cost after a specified vesting period. We adjust the fair value of rights for the absence of dividends during the restriction period.
Satisfying vestings Any portion of the award of share rights may be satisfied by a cash equivalent payment rather than shares at the Board’s discretion. All share rights were satisfied through a share allocation, other than 67,573 deferred share rights (2016: 5,297) for which Board discretion was exercised.
Downward adjustment Board discretion was also exercised to adjust downward 3,835 deferred share rights to zero in 2017 and 4,583 in 2016.
FY 2017 and FY 2016 grants During the 2017 year 2,547,377 deferred share rights (no performance hurdles) were granted (2016: 1,211,021).
Options, Deferred Share Rights and Performance Rights on Issue
As at 2 November 2017, there were 1,292 holders of 3,652,926 deferred share rights on issue and 174 holders of 3,425,497 performance rights on issue.
Options/Rights Movements
This table shows the options/rights over unissued ANZ shares and their related weighted average (WA) exercise prices as at the beginning and end of 2017 and the movements during 2017:
Opening balance
1 Oct 2016
Options/ rights
granted
Options/ rights
forfeited1
Options/ rights
expired
Options/ rights
exercised
Closing balance
30 Sep 2017
Number of options/rights 6,424,117 3,491,796 (1,815,732) (629) (985,768) 7,113,784
WA exercise price $0.00 $0.00 $0.00 $0.00 $0.00 $0.00
WA closing share price $29.50
WA remaining contractual life 2.4 years
WA exercise price of all exercisable options/rights outstanding
$0.00
Outstanding exercisable options/rights 143,839
This table shows the options/rights over unissued ANZ shares and their related weighted average exercise prices as at the beginning and end of 2016 and the movements during 2016:
Opening balance
1 Oct 2015
Options/ rights
granted
Options/ rights
forfeited1
Options/ rights
expired
Options/ rights
exercised
Closing balance
30 Sep 2016
Number of options/rights 6,241,157 2,781,648 (1,440,051) – (1,158,637) 6,424,117
WA exercise price $0.07 $0.00 $0.00 – $0.37 $0.00
WA closing share price $25.31
WA remaining contractual life 3 years
WA exercise price of all exercisable options/rights outstanding
$0.00
Outstanding exercisable options/rights 163,244
1. Refers to any circumstance where equity can be forfeited (for example on cessation, downward adjustment and performance conditions not met).
Of the shares issued as a result of the exercise of options/rights during 2016, 18,062 were issued at an exercise price of $23.71 per share. The balance and those issued in 2017 were issued at a nil exercise price.
As at the date of the signing of the Directors’ Report on 2 November 2017:
• no options/rights over ordinary shares have been granted since the end of 2017; and
• shares issued as a result of the exercise of options/rights since the end of 2017 are 16,489 all with nil exercise prices.
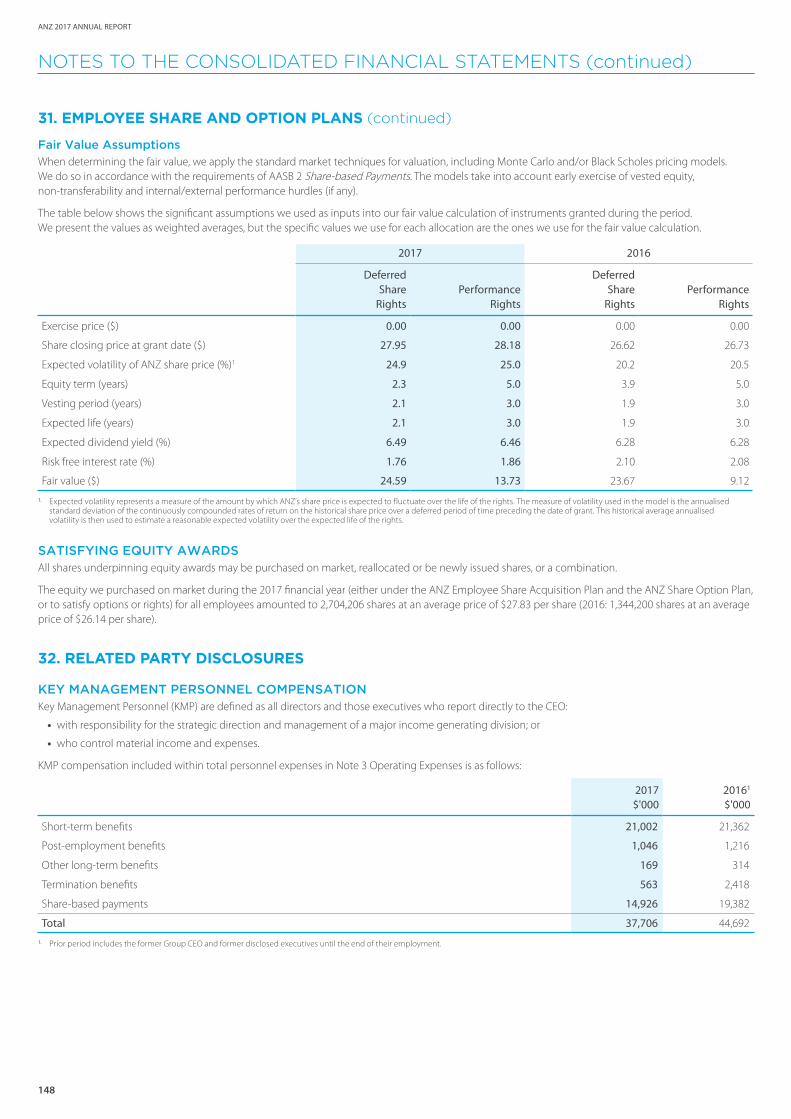
148
ANZ 2017 ANNUAL REPORT
NOTES TO THE CONSOLIDATED FINANCIAL STATEMENTS (continued)
31. EMPLOYEE SHARE AND OPTION PLANS (continued)
Fair Value Assumptions
When determining the fair value, we apply the standard market techniques for valuation, including Monte Carlo and/or Black Scholes pricing models. We do so in accordance with the requirements of AASB 2 Share-based Payments. The models take into account early exercise of vested equity, non-transferability and internal/external performance hurdles (if any).
The table below shows the significant assumptions we used as inputs into our fair value calculation of instruments granted during the period. We present the values as weighted averages, but the specific values we use for each allocation are the ones we use for the fair value calculation.
2017 2016
Deferred Share
RightsPerformance
Rights
Deferred Share
RightsPerformance
Rights
Exercise price ($) 0.00 0.00 0.00 0.00
Share closing price at grant date ($) 27.95 28.18 26.62 26.73
Expected volatility of ANZ share price (%)1 24.9 25.0 20.2 20.5
Equity term (years) 2.3 5.0 3.9 5.0
Vesting period (years) 2.1 3.0 1.9 3.0
Expected life (years) 2.1 3.0 1.9 3.0
Expected dividend yield (%) 6.49 6.46 6.28 6.28
Risk free interest rate (%) 1.76 1.86 2.10 2.08
Fair value ($) 24.59 13.73 23.67 9.12
1. Expected volatility represents a measure of the amount by which ANZ’s share price is expected to fluctuate over the life of the rights. The measure of volatility used in the model is the annualised standard deviation of the continuously compounded rates of return on the historical share price over a deferred period of time preceding the date of grant. This historical average annualised volatility is then used to estimate a reasonable expected volatility over the expected life of the rights.
SATISFYING EQUITY AWARDSAll shares underpinning equity awards may be purchased on market, reallocated or be newly issued shares, or a combination.
The equity we purchased on market during the 2017 financial year (either under the ANZ Employee Share Acquisition Plan and the ANZ Share Option Plan, or to satisfy options or rights) for all employees amounted to 2,704,206 shares at an average price of $27.83 per share (2016: 1,344,200 shares at an average price of $26.14 per share).
32. RELATED PARTY DISCLOSURES
KEY MANAGEMENT PERSONNEL COMPENSATIONKey Management Personnel (KMP) are defined as all directors and those executives who report directly to the CEO:
• with responsibility for the strategic direction and management of a major income generating division; or
• who control material income and expenses.
KMP compensation included within total personnel expenses in Note 3 Operating Expenses is as follows:
2017 20161
$'000 $'000
Short-term benefits 21,002 21,362
Post-employment benefits 1,046 1,216
Other long-term benefits 169 314
Termination benefits 563 2,418
Share-based payments 14,926 19,382
Total 37,706 44,692
1. Prior period includes the former Group CEO and former disclosed executives until the end of their employment.
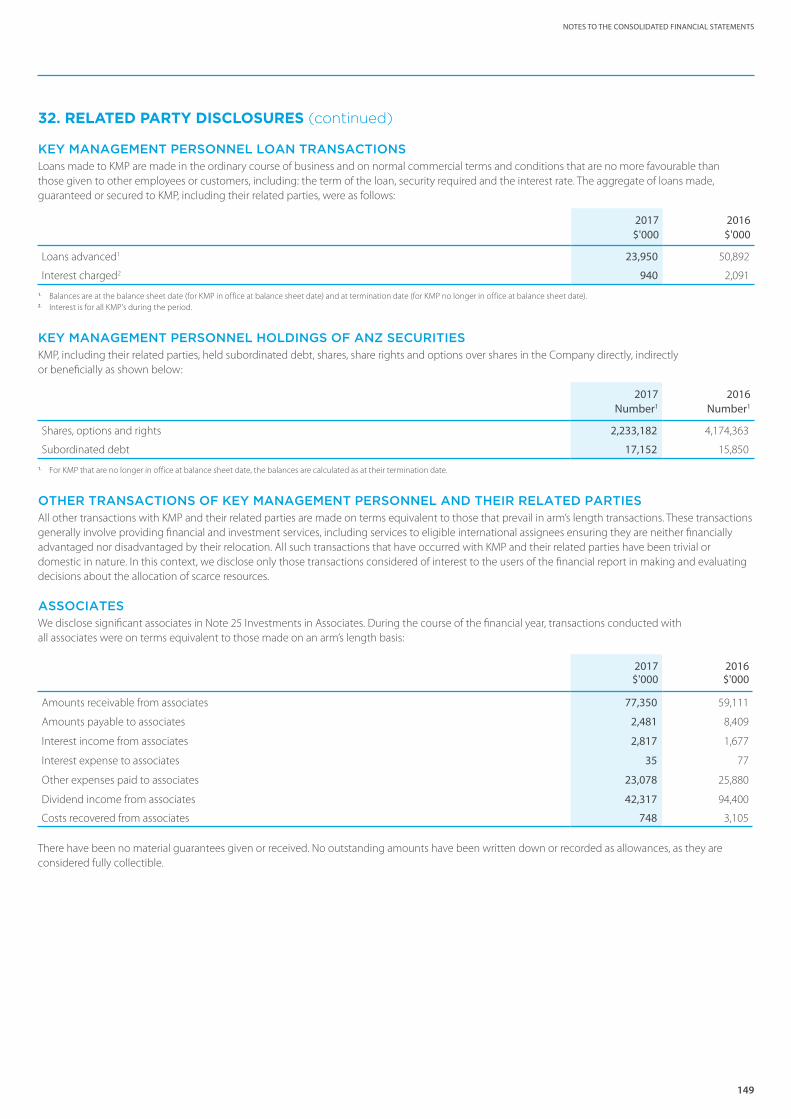
149
NOTES TO THE CONSOLIDATED FINANCIAL STATEMENTS
32. RELATED PARTY DISCLOSURES (continued)
KEY MANAGEMENT PERSONNEL LOAN TRANSACTIONSLoans made to KMP are made in the ordinary course of business and on normal commercial terms and conditions that are no more favourable than those given to other employees or customers, including: the term of the loan, security required and the interest rate. The aggregate of loans made, guaranteed or secured to KMP, including their related parties, were as follows:
2017 2016$'000 $'000
Loans advanced1 23,950 50,892
Interest charged2 940 2,091
1. Balances are at the balance sheet date (for KMP in office at balance sheet date) and at termination date (for KMP no longer in office at balance sheet date).2. Interest is for all KMP’s during the period.
KEY MANAGEMENT PERSONNEL HOLDINGS OF ANZ SECURITIESKMP, including their related parties, held subordinated debt, shares, share rights and options over shares in the Company directly, indirectly or beneficially as shown below:
2017 2016Number1 Number1
Shares, options and rights 2,233,182 4,174,363
Subordinated debt 17,152 15,850
1. For KMP that are no longer in office at balance sheet date, the balances are calculated as at their termination date.
OTHER TRANSACTIONS OF KEY MANAGEMENT PERSONNEL AND THEIR RELATED PARTIESAll other transactions with KMP and their related parties are made on terms equivalent to those that prevail in arm’s length transactions. These transactions generally involve providing financial and investment services, including services to eligible international assignees ensuring they are neither financially advantaged nor disadvantaged by their relocation. All such transactions that have occurred with KMP and their related parties have been trivial or domestic in nature. In this context, we disclose only those transactions considered of interest to the users of the financial report in making and evaluating decisions about the allocation of scarce resources.
ASSOCIATESWe disclose significant associates in Note 25 Investments in Associates. During the course of the financial year, transactions conducted with all associates were on terms equivalent to those made on an arm’s length basis:
2017 2016$'000 $'000
Amounts receivable from associates 77,350 59,111
Amounts payable to associates 2,481 8,409
Interest income from associates 2,817 1,677
Interest expense to associates 35 77
Other expenses paid to associates 23,078 25,880
Dividend income from associates 42,317 94,400
Costs recovered from associates 748 3,105
There have been no material guarantees given or received. No outstanding amounts have been written down or recorded as allowances, as they are considered fully collectible.
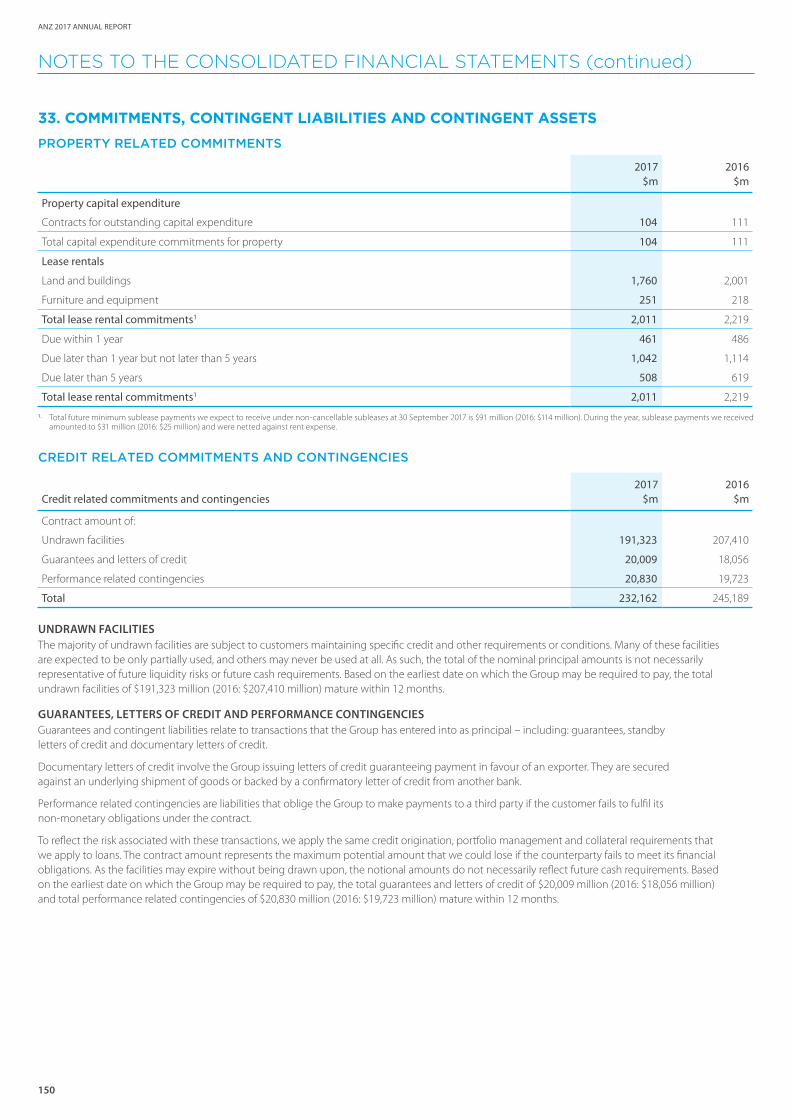
150
ANZ 2017 ANNUAL REPORT
NOTES TO THE CONSOLIDATED FINANCIAL STATEMENTS (continued)
33. COMMITMENTS, CONTINGENT LIABILITIES AND CONTINGENT ASSETS
PROPERTY RELATED COMMITMENTS
2017 2016$m $m
Property capital expenditure
Contracts for outstanding capital expenditure 104 111
Total capital expenditure commitments for property 104 111
Lease rentals
Land and buildings 1,760 2,001
Furniture and equipment 251 218
Total lease rental commitments1 2,011 2,219
Due within 1 year 461 486
Due later than 1 year but not later than 5 years 1,042 1,114
Due later than 5 years 508 619
Total lease rental commitments1 2,011 2,219
1. Total future minimum sublease payments we expect to receive under non-cancellable subleases at 30 September 2017 is $91 million (2016: $114 million). During the year, sublease payments we received amounted to $31 million (2016: $25 million) and were netted against rent expense.
CREDIT RELATED COMMITMENTS AND CONTINGENCIES
Credit related commitments and contingencies2017 2016
$m $m
Contract amount of:
Undrawn facilities 191,323 207,410
Guarantees and letters of credit 20,009 18,056
Performance related contingencies 20,830 19,723
Total 232,162 245,189
UNDRAWN FACILITIES The majority of undrawn facilities are subject to customers maintaining specific credit and other requirements or conditions. Many of these facilities are expected to be only partially used, and others may never be used at all. As such, the total of the nominal principal amounts is not necessarily representative of future liquidity risks or future cash requirements. Based on the earliest date on which the Group may be required to pay, the total undrawn facilities of $191,323 million (2016: $207,410 million) mature within 12 months.
GUARANTEES, LETTERS OF CREDIT AND PERFORMANCE CONTINGENCIESGuarantees and contingent liabilities relate to transactions that the Group has entered into as principal – including: guarantees, standby letters of credit and documentary letters of credit.
Documentary letters of credit involve the Group issuing letters of credit guaranteeing payment in favour of an exporter. They are secured against an underlying shipment of goods or backed by a confirmatory letter of credit from another bank.
Performance related contingencies are liabilities that oblige the Group to make payments to a third party if the customer fails to fulfil its non-monetary obligations under the contract.
To reflect the risk associated with these transactions, we apply the same credit origination, portfolio management and collateral requirements that we apply to loans. The contract amount represents the maximum potential amount that we could lose if the counterparty fails to meet its financial obligations. As the facilities may expire without being drawn upon, the notional amounts do not necessarily reflect future cash requirements. Based on the earliest date on which the Group may be required to pay, the total guarantees and letters of credit of $20,009 million (2016: $18,056 million) and total performance related contingencies of $20,830 million (2016: $19,723 million) mature within 12 months.
151
NOTES TO THE CONSOLIDATED FINANCIAL STATEMENTS
33. COMMITMENTS, CONTINGENT LIABILITIES AND CONTINGENT ASSETS (continued)
OTHER CONTINGENT LIABILITIESAs at 30 September 2017, the Group had contingent liabilities in respect of the matters outlined below. Where relevant, expert legal advice has been obtained and, in the light of such advice, provisions and/or disclosures as deemed appropriate have been made. In some instances we have not disclosed the estimated financial impact of the individual items either because it is not practicable to do so or because such disclosure may prejudice the interests of the Group.
BANK FEES LITIGATIONA litigation funder commenced a class action against the Company in 2010, followed by a second similar class action in March 2013. The applicants contended that certain exception fees (honour, dishonour and non-payment fees on transaction accounts and late payment and over-limit fees on credit cards) were unenforceable penalties and that various of the fees were also unenforceable under statutory provisions governing unconscionable conduct, unfair contract terms and unjust transactions. A further action, limited to late payment fees only, commenced in August 2014.
The penalty and statutory claims in the March 2013 class action failed and the claims have been dismissed. The August 2014 action was discontinued in October 2016.
The original claims in the 2010 class action have been dismissed. A new claim has been added to the 2010 class action, in relation to the Company’s entitlement to charge certain periodical payment non-payment fees.
BENCHMARK/RATE ACTIONSIn July and August 2016, class action complaints were brought in the United States District Court against local and international banks, including the Company – one action relating to the bank bill swap rate (BBSW), and one action relating to the Singapore Interbank Offered Rate (SIBOR) and the Singapore Swap Offer Rate (SOR). The class actions are expressed to apply to persons and entities that engaged in US-based transactions in financial instruments that were priced, benchmarked, and/or settled based on BBSW, SIBOR, or SOR. The claimants seek damages or compensation in amounts not specified, and allege that the defendant banks, including the Company, violated US anti-trust laws, anti-racketeering laws, the Commodity Exchange Act, and (in the BBSW case only) unjust enrichment principles. The Company is defending the proceedings. The matters are at an early stage.
In February 2017, the South African Competition Commission commenced proceedings against local and international banks including the Company alleging breaches of the cartel provisions of the South African Competition Act in respect of trading in the South African rand. The potential civil penalty or other financial impact is uncertain. The matter is at an early stage.
REGULATORY REVIEWS AND CUSTOMER EXPOSURESIn recent years there have been significant increases in the nature and scale of regulatory investigations and reviews, enforcement actions (whether by court action or otherwise) and the quantum of fines issued by regulators, particularly against financial institutions both in Australia and globally. The nature of these investigations and reviews can be wide ranging and, for example, currently include a range of matters including responsible lending practices, product suitability, wealth advice, pricing and competition, conduct in financial markets and capital market transactions. During the year, ANZ has received various notices and requests for information from its regulators as part of both industry-wide and ANZ-specific reviews. There may be exposures to customers which are additional to any regulatory exposures. These could include class actions, individual claims or customer remediation or compensation activities. The outcomes and total costs associated with such reviews and possible exposures remain uncertain.
SECURITY RECOVERY ACTIONSVarious claims have been made or are anticipated, arising from security recovery actions taken to resolve impaired assets over recent years. ANZ will defend these claims.
CLEARING AND SETTLEMENT OBLIGATIONS Under the following arrangements, the Company has a commitment to comply with rules which could result in a bilateral exposure and loss if a member institution fails to settle: the Australian Payments Clearing Association Limited’s Regulations for the Australian Paper Clearing System, the Bulk Electronic Clearing System, the Issuers and Acquirers Community and the High Value Clearing System (HVCS). The Company’s potential exposure arising from these arrangements is unquantifiable in advance.
Under the Austraclear System Regulations (Austraclear), and the CLS Bank International Rules, the Company has a commitment to participate in loss-sharing arrangements if a member institution fails to settle. The Company’s potential exposure arising from these arrangements is unquantifiable in advance. For HVCS and Austraclear, the above obligation arises only in limited circumstances.
The Company is a member of various central clearing houses globally, including ASX Clear (Futures), London Clearing House (LCH) SwapClear, Korea Exchange (KRX), Hong Kong Exchange (HKEX) and the Shanghai Clearing House. These memberships allow the Company to centrally clear derivative instruments in line with cross-border regulatory requirements. Common to all of these memberships is the requirement for the Company to make default fund contributions. In the event of a default by another member, the Company could potentially be required to commit additional default fund contributions which are unquantifiable in advance.

152
ANZ 2017 ANNUAL REPORT
NOTES TO THE CONSOLIDATED FINANCIAL STATEMENTS (continued)
33. COMMITMENTS, CONTINGENT LIABILITIES AND CONTINGENT ASSETS (continued)
PARENT ENTITY GUARANTEESThe Company has issued letters of comfort and guarantees in respect of certain subsidiaries in the normal course of business. Under these letters and guarantees, the Company undertakes to ensure that those subsidiaries continue to meet their financial obligations, subject to certain conditions including that the entity remains a controlled entity of the Company.
SALE OF GRINDLAYS BUSINESSESOn 31 July 2000, the Company completed the sale to Standard Chartered Bank (SCB) of ANZ Grindlays Bank Limited and the private banking business of ANZ in the United Kingdom and Jersey, together with ANZ Grindlays (Jersey) Holdings Limited and its subsidiaries, for USD1.3 billion in cash. The Company provided warranties and certain indemnities relating to those businesses and, where it was anticipated that payments would be likely under the warranties or indemnities, made provisions to cover the anticipated liabilities. The issue below has not adversely impacted the reported results. All settlements and penalties to date have been covered within existing provisions.
In 1991 certain amounts were transferred from non-convertible Indian Rupee accounts maintained with Grindlays in India. These transactions may not have complied with the provisions of the Foreign Exchange Regulation Act, 1973 (India). Grindlays, on its own initiative, brought these transactions to the attention of the Reserve Bank of India. The Indian authorities served notices on Grindlays and certain of its officers in India and civil penalties have been imposed which are the subject of appeals. Criminal prosecutions are pending and will be defended. The amounts in issue are not material.
REVOCATION OF DEED OF CROSS GUARANTEE IN RESPECT OF CERTAIN CONTROLLED ENTITIESASIC class order 98/1418 (as amended) provided relief to a number of wholly owned controlled entities from the requirements for preparation, audit, and lodgement of individual financial statements.
Relief was previously granted to the following entities:
• ANZ Properties (Australia) Pty Ltd
• ANZ Capital Hedging Pty Ltd (in liquidation)
• ANZ Funds Pty Ltd
• Votraint No. 1103 Pty Limited
• ANZ Securities (Holdings) Pty Limited
• ANZ Commodity Trading Pty Ltd
• ANZ Nominees Pty Limited
During the current year, ASIC replaced this class order with a new legislative instrument ASIC Corporations (Wholly owned Companies) Instrument 2016/785. Under the new instrument, APRA regulated companies are not eligible to rely on the ASIC Class Order relief for financial reporting obligations under Part 2M.3 of the Corporations Act 2001 (Cth).
As Australia and New Zealand Banking Group Limited is regulated by APRA, the parties to the Deed are no longer able to obtain relief. The Company and the other entities which were party to the deed executed a deed of revocation on 30 March 2017 and lodged that deed with ASIC on 31 March 2017. All companies were released from the Deed of Cross Guarantee by 30 September 2017.
CONTINGENT ASSETS
NATIONAL HOUSING BANKThe Company is pursuing recovery of the proceeds of certain disputed cheques which were credited to the account of a former Grindlays customer in the early 1990s.
The disputed cheques were drawn on the National Housing Bank (NHB) in India. Proceedings between Grindlays and NHB concerning the proceeds of the cheques were resolved in early 2002.
Recovery is now being pursued from the estate of the Grindlays customer who received the cheque proceeds. Any amounts recovered are to be shared between the Company and NHB.
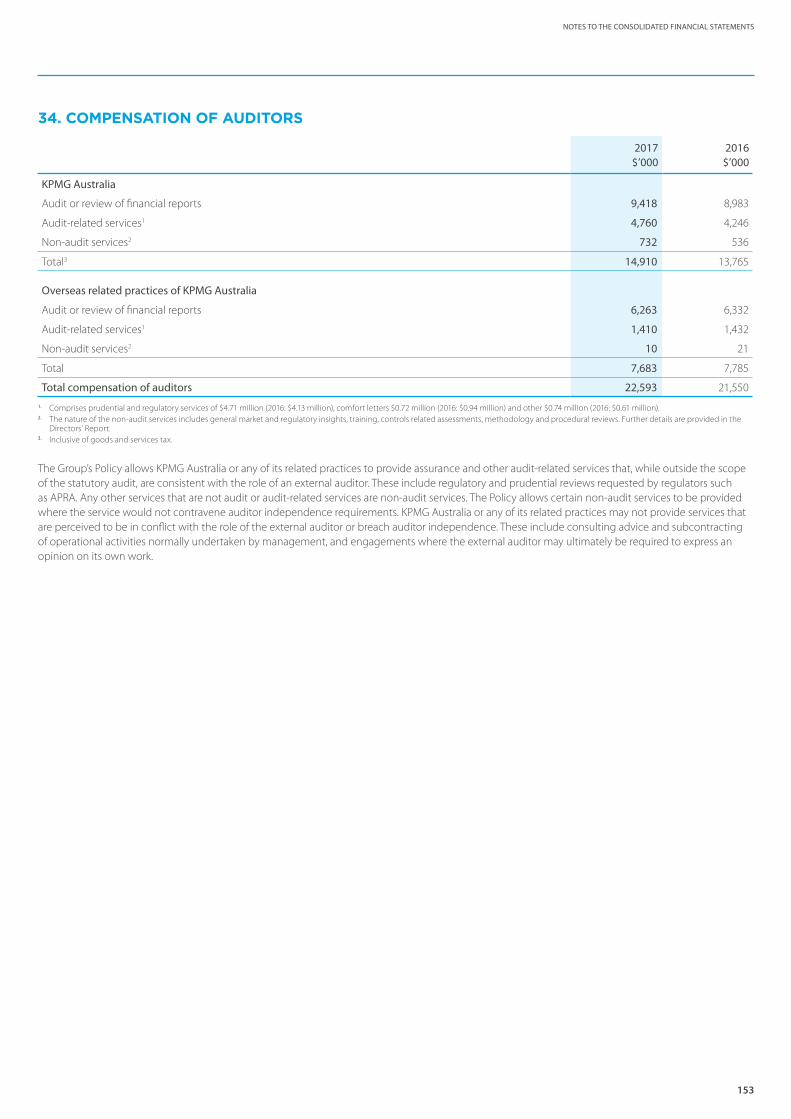
153
NOTES TO THE CONSOLIDATED FINANCIAL STATEMENTS
34. COMPENSATION OF AUDITORS
2017 2016$’000 $’000
KPMG Australia
Audit or review of financial reports 9,418 8,983
Audit-related services1 4,760 4,246
Non-audit services2 732 536
Total3 14,910 13,765
Overseas related practices of KPMG Australia
Audit or review of financial reports 6,263 6,332
Audit-related services1 1,410 1,432
Non-audit services2 10 21
Total 7,683 7,785
Total compensation of auditors 22,593 21,550
1. Comprises prudential and regulatory services of $4.71 million (2016: $4.13 million), comfort letters $0.72 million (2016: $0.94 million) and other $0.74 million (2016: $0.61 million). 2. The nature of the non-audit services includes general market and regulatory insights, training, controls related assessments, methodology and procedural reviews. Further details are provided in the
Directors’ Report.3. Inclusive of goods and services tax.
The Group’s Policy allows KPMG Australia or any of its related practices to provide assurance and other audit-related services that, while outside the scope of the statutory audit, are consistent with the role of an external auditor. These include regulatory and prudential reviews requested by regulators such as APRA. Any other services that are not audit or audit-related services are non-audit services. The Policy allows certain non-audit services to be provided where the service would not contravene auditor independence requirements. KPMG Australia or any of its related practices may not provide services that are perceived to be in conflict with the role of the external auditor or breach auditor independence. These include consulting advice and subcontracting of operational activities normally undertaken by management, and engagements where the external auditor may ultimately be required to express an opinion on its own work.

154
ANZ 2017 ANNUAL REPORT
NOTES TO THE CONSOLIDATED FINANCIAL STATEMENTS (continued)
35. EVENTS SINCE THE END OF THE FINANCIAL YEAR On 17 October 2017, the Group announced it had agreed to sell OnePath pensions and investments (OnePath P&I) and aligned dealer groups (ADG) business to IOOF Holdings Limited (IOOF) for $975 million. Completion is expected in the March 2019 half subject to certain conditions including regulatory approvals and the completion of the extraction of the OnePath P&I business from OnePath Life Insurance. The expected accounting loss on sale of ~$120 million is anticipated, however the final gain/loss on sale will be determined at completion and will be impacted by transaction and separation costs, final determination of goodwill to be disposed, other balances and final taxation impacts.
On 18 October 2017, the Group announced it had entered into an agreement with its joint venture partner Metropolitan Bank & Trust Company (Metrobank) regarding the sale of its 40% stake in the Philippines based Metrobank Card Corporation (MCC). The Group has agreed to sell one half of its 40% stake in MCC to Metrobank, for US$144 million (A$184 million) expected to settle in late 2017. The Group also entered into a put option to sell its remaining 20% stake to Metrobank, exercisable in the September 2018 half on the same terms and for the same consideration. If exercised, this would deliver a total sale price of US$288 million (A$368 million). The sale is subject to customary regulatory approvals.
On 23 October 2017, the Group announced it had reached a confidential in-principle agreement with the Australian Securities and Investments Commission (ASIC) to settle court action in respect of interbank trading and the bank bill swap rate (BBSW). On 30 October 2017, ANZ informed the Court that agreement with ASIC had been concluded. The financial impact to ANZ has been reflected in the financial statements. On 10 November 2017, there will be a hearing to determine whether the court is prepared to make the orders which ANZ and ASIC seek so as to give effect to the settlement.
Other than the matters above, there have been no significant events from 30 September 2017 to the date of signing this report.
155
NOTES TO THE CONSOLIDATED FINANCIAL STATEMENTS
CONSOLIDATED GROUP DIRECTORS' DECLARATION
Directors’ Declaration
The Directors of Australia and New Zealand Banking Group Limited declare that:
a) in the Directors’ opinion, the financial statements and notes of the Consolidated Entity are in accordance with the Corporations Act 2001, including:
i) section 296, that they comply with the Australian Accounting Standards and any further requirements of the Corporations Regulations 2001; and
ii) section 297, that they give a true and fair view of the financial position of the Consolidated Entity as at 30 September 2017 and of its performance for the year ended on that date;
b) the notes to the financial statements of the Consolidated Entity include a statement that the financial statements and notes of the Consolidated Entity comply with International Financial Reporting Standards;
c) the Directors have been given the declarations required by section 295A of the Corporations Act 2001; and
d) in the Directors’ opinion, there are reasonable grounds to believe that the Company will be able to pay its debts as and when they become due and payable.
Signed in accordance with a resolution of the Directors.
David M Gonski, AC Chairman
2 November 2017
Shayne C Elliott Director
156
ANZ 2017 ANNUAL REPORT
INDEPENDENT AUDITOR’S REPORT
TO THE SHAREHOLDERS OF AUSTRALIA AND NEW ZEALAND BANKING GROUP LIMITED
REPORT ON THE AUDIT OF THE FINANCIAL REPORT
OPINION We have audited the Financial Report of Australia and New Zealand Banking Group Limited (the Company) and the entities it controlled at the year end and from time to time during the financial year (together, the Group).
In our opinion, the accompanying Financial Report of the Group is in accordance with the Corporations Act 2001, including:
• giving a true and fair view of the Group’s financial position as at 30 September 2017 and of its financial performance for the year ended on that date; and
• complying with Australian Accounting Standards and the Corporations Regulations 2001.
The Financial Report comprises the:
• consolidated statement of financial position as at 30 September 2017;
• consolidated income statement, consolidated statement of comprehensive income, consolidated statement of changes in equity, and consolidated statement of cash flows for the year then ended;
• Notes 1 to 35 including a summary of significant accounting policies; and
• Directors’ Declaration.
BASIS FOR OPINION We conducted our audit in accordance with Australian Auditing Standards. We believe that the audit evidence we have obtained is sufficient and appropriate to provide a basis for our opinion.
Our responsibilities under those standards are further described in the Auditor’s responsibilities for the audit of the Financial Report section of our report.
We are independent of the Group in accordance with the Corporations Act 2001 and the ethical requirements of the Accounting Professional and Ethical Standards Board’s APES 110 Code of Ethics for Professional Accountants (the Code) that are relevant to our audit of the Financial Report in Australia. We have fulfilled our other ethical responsibilities in accordance with the Code.
KEY AUDIT MATTERS The Key Audit Matters we identified are:
• Provision for Credit Impairment;
• Valuation of Financial Instruments held at Fair Value; and
• IT Systems and Controls.
Key Audit Matters are those matters that, in our professional judgement, were of most significance in our audit of the Financial Report of the current period.
These matters were addressed in the context of our audit of the Financial Report as a whole, and in forming our opinion thereon, and we do not provide a separate opinion on these matters.
157
NOTES TO THE CONSOLIDATED FINANCIAL STATEMENTS
KEY AUDIT MATTERS (continued)
PROVISION FOR CREDIT IMPAIRMENT ($3,798M)Refer to the critical accounting estimates and judgements and disclosures in relation to credit impairment provisioning in Notes 13 and 16 to the Financial Report.
The Key Audit MatterThe provision for credit impairment is a Key Audit Matter as the Group has significant credit risk exposure to a large number of counterparties across a wide range of lending and other products, industries and geographies. The value of loans and advances on the balance sheet is significant and there is a high degree of complexity and judgement involved for the Group in estimating individual and collective credit impairment provisions against these loans. These features resulted in significant audit effort to address the risks around loan recoverability and the determination of related provisions.
How the matter was addressed in our auditOur audit procedures for the individual and collective provision for credit impairment included:
Provisions estimated across loan portfolios (individual provision)
• Testing the key controls over counterparty risk grading for wholesale loans (larger customer exposures that are monitored individually). We tested the approval of new lending facilities against the Group’s lending policies, the performance of annual loan assessments, and controls over the monitoring of counterparty credit quality. This included testing controls over the identification of exposures showing signs of stress, either due to internal factors specific to the counterparty or external macroeconomic factors, and testing the timeliness of and the accuracy of counterparty risk assessments and risk grading against the requirements of the Group’s lending policies and regulatory requirements;
• Performing credit assessments of a sample of wholesale loans managed by the Group’s specialist workout and recovery team assessed as higher risk or impaired, and a sample of other loans, focusing on larger exposures assessed by the Group as showing signs of deterioration, or in areas of emerging risk (assessed against external market conditions). We challenged the Group’s risk grading of the loan, their assessment of loan recoverability and the impact on the credit provision. To do this, we used the information on the Group’s loan file, discussed the case with the loan officer and management, and performed our own assessment of recoverability. This involved using our understanding of relevant industries and the macroeconomic environment, engaging KPMG specialists where required, and comparing assumptions of inputs used by the Group in recoverability assessments to externally sourced evidence, such as commodity prices, publicly available audited financial statements, and comparable external valuations of collateral held; and
• For retail loans (smaller customer exposures not monitored individually), testing controls over the systems which record lending arrears, group exposures into delinquency buckets based on the number of days loans are overdue, and calculate individual provisions. We tested automated calculation and change management controls and evaluated the Group’s oversight of the portfolios, with a focus on controls over delinquency statistics monitoring. We tested a sample of the level of provisions held against different loan products based on the delinquency profile and challenged assumptions made in respect of expected recoveries, primarily from collateral held.
Provisions estimated across loan portfolios (collective provision)
• Testing the Group’s processes to validate the models used to calculate collective provisions, and evaluating the Group’s model methodologies against established market practices and criteria in the accounting standards;
• Testing the key controls within IT systems used to calculate the collective provision, specifically those relating to data management and the completeness and accuracy of data transfer from underlying source systems to the collective provision models;
• Testing the accuracy of key inputs into models by checking a sample of year-end balances to the general ledger, and repayment history and risk ratings to source systems;
• Challenging the key assumptions in the models such as emergence periods, probability of default and loss given default, for a sample of retail and wholesale portfolios. We compared modelled estimates against actual losses incurred by the Group; and
• Re-performing, for a sample of retail and wholesale portfolios and using a KPMG-constructed calculation tool, the calculation of collective provisions, to determine the accuracy of model output.
We also challenged key assumptions in the components of the Group’s collective provision balance held above modelled provision estimates. This included:
• Evaluating inputs to the concentration risk and economic cycle provisions by comparing underlying portfolio characteristics to recent loss experience, current market conditions and specific risks inherent in the Group’s loan portfolios;
• Assessing the requirement for other additional provisions by considering model or data deficiencies identified by the Group’s model validation processes; and
• Assessing the completeness of additional provisions by checking the consistency of risks identified in the portfolios to their inclusion in the Group’s assessment.

158
ANZ 2017 ANNUAL REPORT
INDEPENDENT AUDITOR’S REPORT (continued)
KEY AUDIT MATTERS (continued)
VALUATION OF FINANCIAL INSTRUMENTS HELD AT FAIR VALUE:
- FINANCIAL ASSETS HELD AT FAIR VALUE $213,627M
- FINANCIAL LIABILITIES HELD AT FAIR VALUE $110,934M
Refer to the critical accounting estimates, judgements and disclosures of fair values in Note 17 to the Financial Report.
The Key Audit MatterFinancial instruments held at fair value on the Group’s balance sheet include available for sale assets, trading securities, derivative assets and liabilities, investments backing policy liabilities, policy liabilities, certain debt securities, and other assets and liabilities designated as measured at fair value through profit or loss. The instruments are mainly risk management products sold to customers and used by the Group to manage its own interest rate and foreign exchange risk.
The valuation of financial instruments held at fair value is considered a Key Audit Matter as:
• Financial instruments held at fair value are significant (24% of total assets and 13% of total liabilities);
• The significant volume and range of products transacted, in a number of international locations, increases the risk of inconsistencies in transaction management processes that could lead to inaccurate valuation;
• Determining the fair value of trading securities and derivatives involves a significant level of judgement by the Group, increasing the risk of error, and adding complexity to our audit. The level of judgement increases where internal models, as opposed to quoted market prices, are used to determine fair value of an instrument, or where inputs to the internal models, such as discount rates and measures of volatility, are not observable; and
• The valuation of certain derivatives held by the Group is sensitive to inputs including funding rates, probabilities of default and loss given default, and industry practice is evolving as to how the impact of both funding and credit risk is incorporated within the valuation of certain derivative instruments. This increased our audit effort in this area and necessitated the involvement of valuation specialists.
How the matter was addressed in our auditOur audit procedures for the valuation of financial instruments held at fair value included:
• Testing access rights and change management controls for key valuation systems;
• Testing interface controls, notably the completeness and accuracy of data transfers between transaction processing systems, key systems used to generate valuations and any related valuation adjustments, and the Group’s market risk management and finance systems to identify inconsistencies in transaction management and valuation processes across products and locations;
• Testing the governance and approval controls, such as management review and approval of the valuation models, and approval of new products against policies and procedures;
• Testing the front office management review and approval of the daily financial instrument trading profit and loss reconciliations prepared by the Group’s independent product control function;
• Testing the management review and approval of model construction and validation, aimed at assessing the validity and robustness of underlying valuation models; and
• Testing the Group’s data validation controls, such as those over key inputs in generating the fair value to market data where fair values were determined by front office teams.
We carried out testing over the valuation of financial instruments with both observable and unobservable inputs. Our specific testing involved valuation specialists and included:
• Re-performing the valuation of ‘level 1’ and ‘level 2’ available for sale assets and trading securities, which are primarily government, semi-government and corporate debt securities, by comparing the observable inputs, including quoted prices, to independently sourced market data;
• Using independent models, re-calculating the valuation of a sample, across locations, of derivative assets and liabilities where the fair value was determined using observable inputs. This included comparing a sample of observable inputs used in the Group’s derivative valuations to independently-sourced market data, such as interest rates, foreign exchange rates and volatilities;
• Where the fair value of derivatives and other financial assets and liabilities were determined using unobservable inputs (‘level 3’ instruments), challenging the Group’s valuation model by testing the key inputs used to comparable data in the market, including the use of proxy instruments and available alternatives. We compared the Group’s valuation methodology to industry practice and the criteria in the accounting standards; and
• Evaluating the appropriateness of the Group’s valuation methodology for derivative financial instruments, having regard to current and emerging derivative valuation practices across a range of peer institutions, and against the required criteria in the accounting standards. We tested adjustments made to valuations, particularly funding and credit valuation adjustments on un-collateralised derivatives. In particular, for a sample of individual counterparties, across locations, we tested key inputs to the credit valuation adjustment calculation, including the probability of default, against observable market data. Where proxies were used, we assessed the proxy against available alternatives, across a number of locations.

159
NOTES TO THE CONSOLIDATED FINANCIAL STATEMENTS
KEY AUDIT MATTERS (continued)
IT SYSTEMS AND CONTROLS Refer to the basis of preparation in Note 1 to the Financial Report.
The Key Audit MatterAs a major Australian bank, the group’s businesses utilise a large number of complex, interdependent Information Technology (IT) systems to process and record a high volume of transactions. Controls over access and changes to IT systems are critical to the recording of financial information and the preparation of a financial report which provides a true and fair view of the Group’s financial position and performance. The IT systems and controls, as they impact the financial recording and reporting of transactions, is a key audit matter and our audit approach could significantly differ depending on the effective operation of the Group’s IT controls. KPMG IT specialists were used throughout the engagement as a core part of our audit team.
How the matter was addressed in our auditWe tested the control environment for key IT applications (systems) used in processing significant transactions and recording balances in the general ledger. We also tested automated controls embedded within these systems. Our audit procedures included:
• Testing the governance controls used by the Group’s technology teams to monitor system integrity, by checking matters impacting the operational integrity of core systems for escalation and action in accordance with the Group’s policies;
• Testing the access rights given to staff by checking them to approved records, and inspecting the reports over the granting and removal of access rights. We also looked for evidence of escalation of breaches;
• Testing preventative controls designed to enforce segregation of duties between users within particular systems;
• Testing the operating effectiveness of automated controls, principally relating to the automated calculation of financial transactions. We tested the inputs used within automated calculations to source data and also tested the accuracy of the calculation logic for a sample of transactions within each identified control; and
• Testing the operating effectiveness of automated reconciliation controls, both between systems and intra-system. We checked a sample of identified breaks in reconciliations were recorded on exception reports, and subsequently investigated and cleared by the Group.
OTHER INFORMATION Other Information is both financial and non-financial information in Australia and New Zealand Banking Group Limited’s annual reporting which is provided in addition to the Financial Report and the Auditor's Report. The Directors are responsible for the Other Information.
Our opinion on the Financial Report does not cover the Other Information and, accordingly, we do not express an audit opinion or any form of assurance conclusion thereon, with the exception of the Remuneration Report and our related assurance opinion.
In connection with our audit of the Financial Report, our responsibility is to read the Other Information. In doing so, we consider whether the Other Information is materially inconsistent with the Financial Report or our knowledge obtained in the audit, or otherwise appears to be materially misstated.
We are required to report if we conclude that there is a material misstatement of this Other Information, and based on the work we have performed on the Other Information that we obtained prior to the date of this Auditor’s Report, we have nothing to report.
RESPONSIBILITIES OF DIRECTORS FOR THE FINANCIAL REPORTThe Directors are responsible for:
• preparing a Financial Report that gives a true and fair view in accordance with Australian Accounting Standards and the Corporations Act 2001;
• implementing necessary internal control to enable the preparation of a Financial Report that gives a true and fair view and is free from material misstatement, whether due to fraud or error; and
• assessing the Group’s ability to continue as a going concern. This includes disclosing, as applicable, matters related to going concern and using the going concern basis of accounting unless they either intend to liquidate the Group or to cease operations, or have no realistic alternative but to do so.
AUDITOR’S RESPONSIBILITIES FOR THE AUDIT OF THE FINANCIAL REPORTOur objective is:
• to obtain reasonable assurance about whether the Financial Report as a whole is free from material misstatement, whether due to fraud or error; and
• to issue an Auditor’s Report that includes our opinion.
Reasonable assurance is a high level of assurance, but is not a guarantee that an audit conducted in accordance with Australian Auditing Standards will always detect a material misstatement when it exists. Misstatements can arise from fraud or error. They are considered material if, individually or in the aggregate, they could reasonably be expected to influence the economic decisions of users taken on the basis of this Financial Report.
A further description of our responsibilities for the audit of the Financial Report is located at the Auditing and Assurance Standards Board website at: http://www.auasb.gov.au/auditors_files/ar2.pdf. This description forms part of our Auditor’s Report.
160
ANZ 2017 ANNUAL REPORT
INDEPENDENT AUDITOR’S REPORT (continued)
REPORT ON THE REMUNERATION REPORTIn our opinion, the Remuneration Report of Australia and New Zealand Banking Group Limited for the year ended 30 September 2017, complies with Section 300A of the Corporations Act 2001.
DIRECTORS’ RESPONSIBILITIESThe Directors of the Company are responsible for the preparation and presentation of the Remuneration Report in accordance with Section 300A of the Corporations Act 2001.
OUR RESPONSIBILITIESWe have audited the Remuneration Report included in pages 36 to 61 of the Directors’ report for the year ended 30 September 2017.
Our responsibility is to express an opinion on the Remuneration Report, based on our audit conducted in accordance with Australian Auditing Standards.
KPMG Alison Kitchen Partner Melbourne 2 November 2017
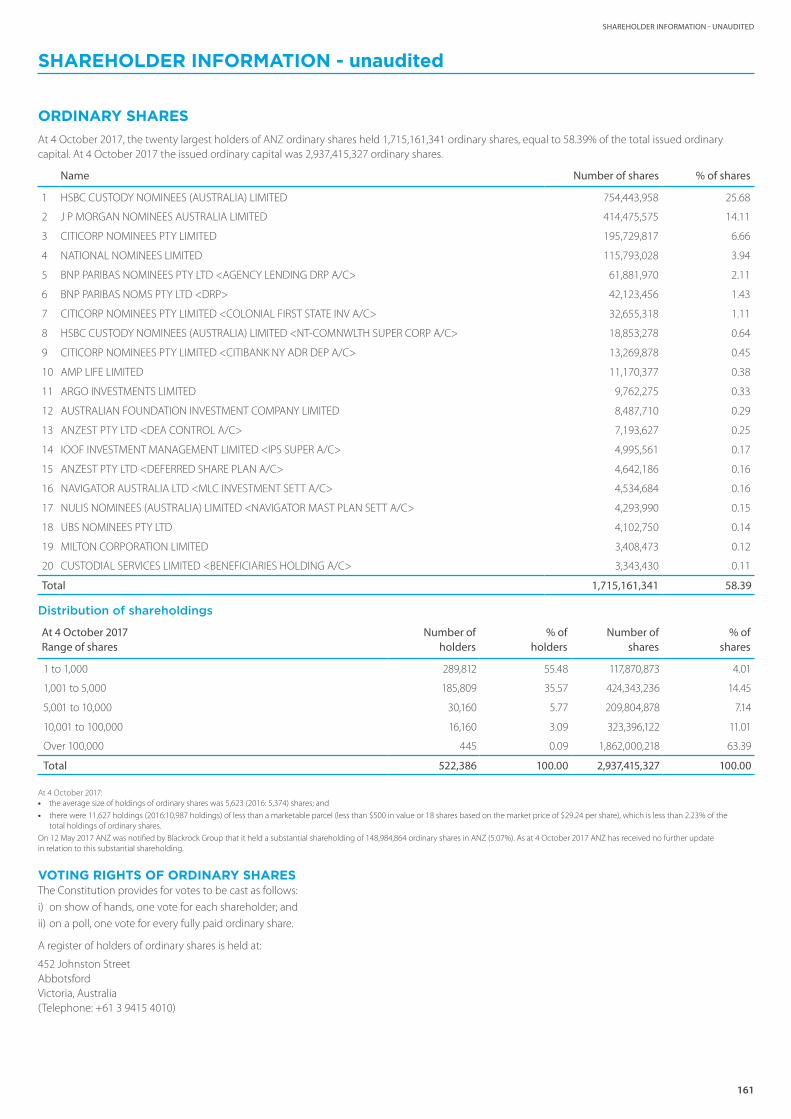
161
SHAREHOLDER INFORMATION - UNAUDITED
ORDINARY SHARESAt 4 October 2017, the twenty largest holders of ANZ ordinary shares held 1,715,161,341 ordinary shares, equal to 58.39% of the total issued ordinary capital. At 4 October 2017 the issued ordinary capital was 2,937,415,327 ordinary shares.
Name Number of shares % of shares
1 HSBC CUSTODY NOMINEES (AUSTRALIA) LIMITED 754,443,958 25.68
2 J P MORGAN NOMINEES AUSTRALIA LIMITED 414,475,575 14.11
3 CITICORP NOMINEES PTY LIMITED 195,729,817 6.66
4 NATIONAL NOMINEES LIMITED 115,793,028 3.94
5 BNP PARIBAS NOMINEES PTY LTD <AGENCY LENDING DRP A/C> 61,881,970 2.11
6 BNP PARIBAS NOMS PTY LTD <DRP> 42,123,456 1.43
7 CITICORP NOMINEES PTY LIMITED <COLONIAL FIRST STATE INV A/C> 32,655,318 1.11
8 HSBC CUSTODY NOMINEES (AUSTRALIA) LIMITED <NT-COMNWLTH SUPER CORP A/C> 18,853,278 0.64
9 CITICORP NOMINEES PTY LIMITED <CITIBANK NY ADR DEP A/C> 13,269,878 0.45
10 AMP LIFE LIMITED 11,170,377 0.38
11 ARGO INVESTMENTS LIMITED 9,762,275 0.33
12 AUSTRALIAN FOUNDATION INVESTMENT COMPANY LIMITED 8,487,710 0.29
13 ANZEST PTY LTD <DEA CONTROL A/C> 7,193,627 0.25
14 IOOF INVESTMENT MANAGEMENT LIMITED <IPS SUPER A/C> 4,995,561 0.17
15 ANZEST PTY LTD <DEFERRED SHARE PLAN A/C> 4,642,186 0.16
16 NAVIGATOR AUSTRALIA LTD <MLC INVESTMENT SETT A/C> 4,534,684 0.16
17 NULIS NOMINEES (AUSTRALIA) LIMITED <NAVIGATOR MAST PLAN SETT A/C> 4,293,990 0.15
18 UBS NOMINEES PTY LTD 4,102,750 0.14
19 MILTON CORPORATION LIMITED 3,408,473 0.12
20 CUSTODIAL SERVICES LIMITED <BENEFICIARIES HOLDING A/C> 3,343,430 0.11
Total 1,715,161,341 58.39
Distribution of shareholdings
At 4 October 2017 Range of shares
Number ofholders
% ofholders
Number ofshares
% ofshares
1 to 1,000 289,812 55.48 117,870,873 4.01
1,001 to 5,000 185,809 35.57 424,343,236 14.45
5,001 to 10,000 30,160 5.77 209,804,878 7.14
10,001 to 100,000 16,160 3.09 323,396,122 11.01
Over 100,000 445 0.09 1,862,000,218 63.39
Total 522,386 100.00 2,937,415,327 100.00
At 4 October 2017: • the average size of holdings of ordinary shares was 5,623 (2016: 5,374) shares; and
• there were 11,627 holdings (2016:10,987 holdings) of less than a marketable parcel (less than $500 in value or 18 shares based on the market price of $29.24 per share), which is less than 2.23% of the total holdings of ordinary shares.
On 12 May 2017 ANZ was notified by Blackrock Group that it held a substantial shareholding of 148,984,864 ordinary shares in ANZ (5.07%). As at 4 October 2017 ANZ has received no further update in relation to this substantial shareholding.
VOTING RIGHTS OF ORDINARY SHARESThe Constitution provides for votes to be cast as follows:
i) on show of hands, one vote for each shareholder; and
ii) on a poll, one vote for every fully paid ordinary share.
A register of holders of ordinary shares is held at:
452 Johnston Street Abbotsford Victoria, Australia (Telephone: +61 3 9415 4010)
SHAREHOLDER INFORMATION - unaudited

162
ANZ 2017 ANNUAL REPORT
SHAREHOLDER INFORMATION - unaudited (continued)
ANZ CONVERTIBLE PREFERENCE SHARESANZ CPS3 On 28 September 2011 the Company issued convertible preference shares (ANZ CPS3) which were offered pursuant to a prospectus dated 31 August 2011.
At 4 October 2017, the twenty largest holders of ANZ CPS3 held 1,463,836 securities, equal to 25.55% of the total issued securities. At 4 October 2017 the total number of CPS3 on issue was 5,728,859.
Name Number of securities % of securities
1 HSBC CUSTODY NOMINEES (AUSTRALIA) LIMITED - A/C 2 310,905 5.43
2 J P MORGAN NOMINEES AUSTRALIA LIMITED 257,168 4.49
3 HSBC CUSTODY NOMINEES (AUSTRALIA) LIMITED 186,069 3.25
4 CITICORP NOMINEES PTY LIMITED 171,454 2.99
5 NAVIGATOR AUSTRALIA LTD <MLC INVESTMENT SETT A/C> 72,798 1.27
6 IOOF INVESTMENT MANAGEMENT LIMITED <IPS SUPER A/C> 65,532 1.14
7 NULIS NOMINEES (AUSTRALIA) LIMITED <NAVIGATOR MAST PLAN SETT A/C> 62,307 1.09
8 BNP PARIBAS NOMS PTY LTD <DRP> 41,485 0.72
9 SA BUILDING INDUSTRY REDUNDANCY SCHEME 40,000 0.70
10 AUST EXECUTOR TRUSTEES LTD <DDH PREFERRED INCOME FUND> 34,427 0.60
11 NETWEALTH INVESTMENTS LIMITED <WRAP SERVICES A/C> 33,582 0.59
12 AUST EXECUTOR TRUSTEES LTD <CHARITABLE FOUNDATION> 32,615 0.57
13 TRANBER PTY LTD <SUPERFUND A/C> 32,500 0.57
14 MADINGLEY NOMINEES PTY LTD <ANDREW THYNE REID CHARIT A/C> 23,776 0.41
15 G P MARKETING INTERNATIONAL PTY LTD 20,000 0.35
16 INVIA CUSTODIAN PTY LIMITED <RACS A/C> 17,892 0.31
17 SUNSTONE FINANCE PTY LTD 15,809 0.28
18 BNP PARIBAS NOMINEES PTY LTD HUB24 CUSTODIAL SERV LTD DRP 15,420 0.27
19 AUSTRALIAN EXECUTOR TRUSTEES LIMITED <NO 1 ACCOUNT> 15,097 0.26
20 PCI PTY LTD 15,000 0.26
Total 1,463,836 25.55
Distribution of ANZ CPS3 holdings
At 4 October 2017 Range of securities
Number ofholders
% ofholders
Number ofsecurities
% ofsecurities
1 to 1,000 8,785 92.74 2,623,845 45.80
1,001 to 5,000 622 6.57 1,234,986 21.56
5,001 to 10,000 39 0.41 326,066 5.69
10,001 to 100,000 23 0.24 618,366 10.79
Over 100,000 4 0.04 925,596 16.16
Total 9,473 100.00 5,728,859 100.00
At 4 October 2017 there were 13 holdings (2016:14 holdings) of less than a marketable parcel (less than $500 in value or 5 securities based on the market price of $100.76 per security), which is less than 0.14% of the total holdings of ANZ CPS3.
VOTING RIGHTS OF ANZ CPS3An ANZ CPS3 holder has the right to vote at a meeting of members of the Company in the following circumstances and in no others:
i) on any proposal to reduce the Company’s share capital, other than a resolution to approve a redemption of the ANZ CPS3;
ii) on a proposal that affects the rights attached to the ANZ CPS3;
iii) on any resolution to approve the terms of a buy-back agreement, other than a resolution to approve a redemption of ANZ CPS3;
iv) on a proposal to wind up the Company;
v) on a proposal for the disposal of the whole of the Company’s property, business and undertaking;
vi) on any matter during a winding-up of the Company; and
vii) on any matter during a period in which a dividend remains unpaid.
On a resolution or proposal on which an ANZ CPS3 holder is entitled to vote, the ANZ CPS3 holder has:
i) on a show of hands, one vote; and
ii) on a poll, one vote for each ANZ CPS3 held.
A register of holders of ordinary shares is held at:
452 Johnston Street Abbotsford Victoria, Australia (Telephone: +61 3 9415 4010
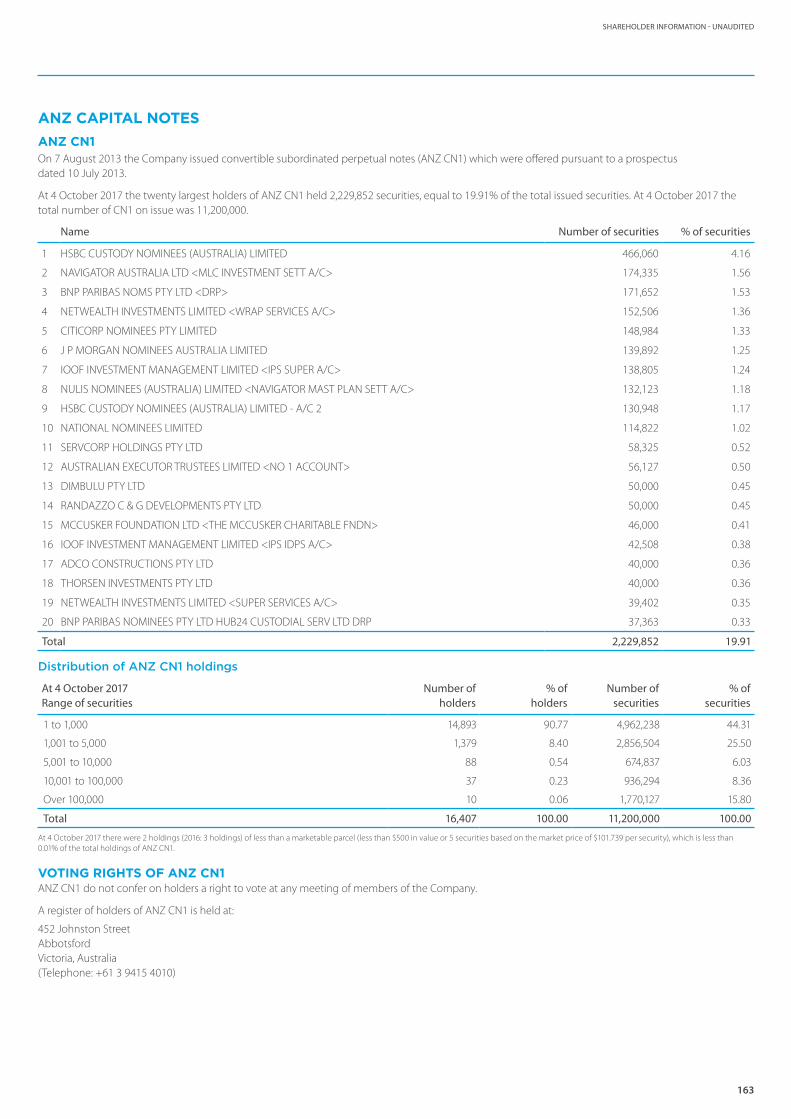
163
SHAREHOLDER INFORMATION - UNAUDITED
ANZ CAPITAL NOTESANZ CN1On 7 August 2013 the Company issued convertible subordinated perpetual notes (ANZ CN1) which were offered pursuant to a prospectus dated 10 July 2013.
At 4 October 2017 the twenty largest holders of ANZ CN1 held 2,229,852 securities, equal to 19.91% of the total issued securities. At 4 October 2017 the total number of CN1 on issue was 11,200,000.
Name Number of securities % of securities
1 HSBC CUSTODY NOMINEES (AUSTRALIA) LIMITED 466,060 4.16
2 NAVIGATOR AUSTRALIA LTD <MLC INVESTMENT SETT A/C> 174,335 1.56
3 BNP PARIBAS NOMS PTY LTD <DRP> 171,652 1.53
4 NETWEALTH INVESTMENTS LIMITED <WRAP SERVICES A/C> 152,506 1.36
5 CITICORP NOMINEES PTY LIMITED 148,984 1.33
6 J P MORGAN NOMINEES AUSTRALIA LIMITED 139,892 1.25
7 IOOF INVESTMENT MANAGEMENT LIMITED <IPS SUPER A/C> 138,805 1.24
8 NULIS NOMINEES (AUSTRALIA) LIMITED <NAVIGATOR MAST PLAN SETT A/C> 132,123 1.18
9 HSBC CUSTODY NOMINEES (AUSTRALIA) LIMITED - A/C 2 130,948 1.17
10 NATIONAL NOMINEES LIMITED 114,822 1.02
11 SERVCORP HOLDINGS PTY LTD 58,325 0.52
12 AUSTRALIAN EXECUTOR TRUSTEES LIMITED <NO 1 ACCOUNT> 56,127 0.50
13 DIMBULU PTY LTD 50,000 0.45
14 RANDAZZO C & G DEVELOPMENTS PTY LTD 50,000 0.45
15 MCCUSKER FOUNDATION LTD <THE MCCUSKER CHARITABLE FNDN> 46,000 0.41
16 IOOF INVESTMENT MANAGEMENT LIMITED <IPS IDPS A/C> 42,508 0.38
17 ADCO CONSTRUCTIONS PTY LTD 40,000 0.36
18 THORSEN INVESTMENTS PTY LTD 40,000 0.36
19 NETWEALTH INVESTMENTS LIMITED <SUPER SERVICES A/C> 39,402 0.35
20 BNP PARIBAS NOMINEES PTY LTD HUB24 CUSTODIAL SERV LTD DRP 37,363 0.33
Total 2,229,852 19.91
Distribution of ANZ CN1 holdings
At 4 October 2017 Range of securities
Number ofholders
% ofholders
Number ofsecurities
% ofsecurities
1 to 1,000 14,893 90.77 4,962,238 44.31
1,001 to 5,000 1,379 8.40 2,856,504 25.50
5,001 to 10,000 88 0.54 674,837 6.03
10,001 to 100,000 37 0.23 936,294 8.36
Over 100,000 10 0.06 1,770,127 15.80
Total 16,407 100.00 11,200,000 100.00
At 4 October 2017 there were 2 holdings (2016: 3 holdings) of less than a marketable parcel (less than $500 in value or 5 securities based on the market price of $101.739 per security), which is less than 0.01% of the total holdings of ANZ CN1.
VOTING RIGHTS OF ANZ CN1ANZ CN1 do not confer on holders a right to vote at any meeting of members of the Company.
A register of holders of ANZ CN1 is held at:
452 Johnston Street Abbotsford Victoria, Australia (Telephone: +61 3 9415 4010)
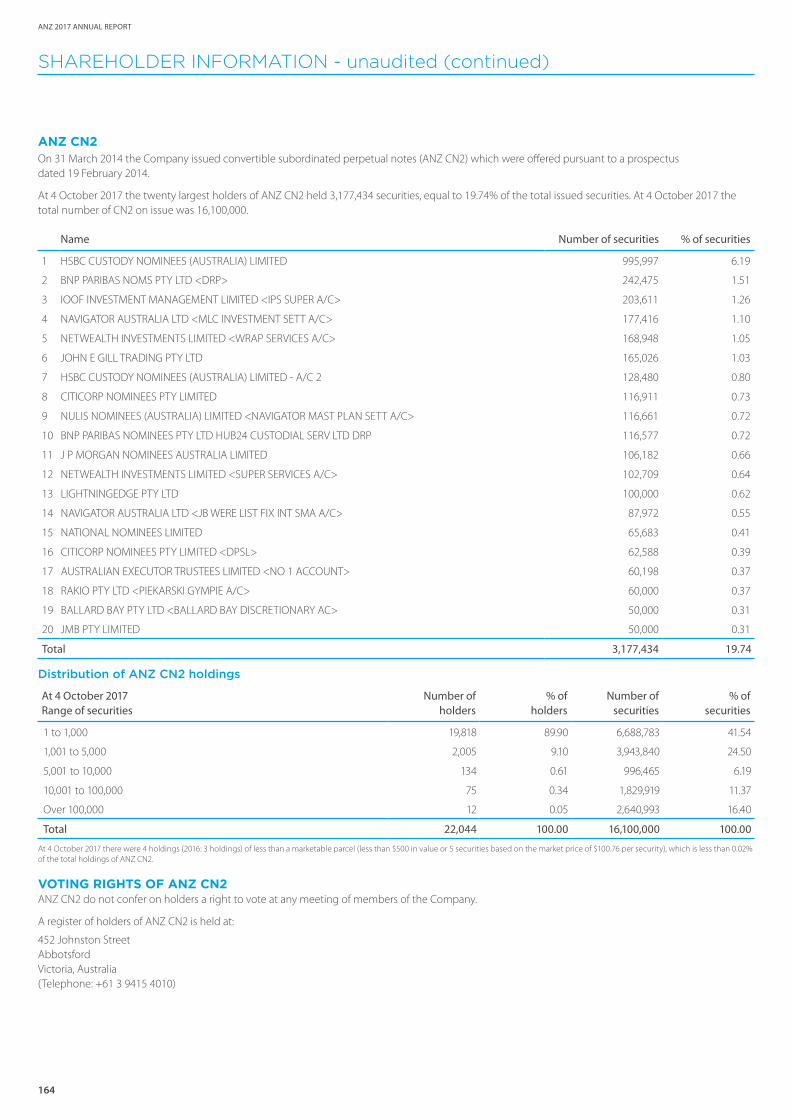
164
ANZ 2017 ANNUAL REPORT
SHAREHOLDER INFORMATION - unaudited (continued)
ANZ CN2On 31 March 2014 the Company issued convertible subordinated perpetual notes (ANZ CN2) which were offered pursuant to a prospectus dated 19 February 2014.
At 4 October 2017 the twenty largest holders of ANZ CN2 held 3,177,434 securities, equal to 19.74% of the total issued securities. At 4 October 2017 the total number of CN2 on issue was 16,100,000.
Name Number of securities % of securities
1 HSBC CUSTODY NOMINEES (AUSTRALIA) LIMITED 995,997 6.19
2 BNP PARIBAS NOMS PTY LTD <DRP> 242,475 1.51
3 IOOF INVESTMENT MANAGEMENT LIMITED <IPS SUPER A/C> 203,611 1.26
4 NAVIGATOR AUSTRALIA LTD <MLC INVESTMENT SETT A/C> 177,416 1.10
5 NETWEALTH INVESTMENTS LIMITED <WRAP SERVICES A/C> 168,948 1.05
6 JOHN E GILL TRADING PTY LTD 165,026 1.03
7 HSBC CUSTODY NOMINEES (AUSTRALIA) LIMITED - A/C 2 128,480 0.80
8 CITICORP NOMINEES PTY LIMITED 116,911 0.73
9 NULIS NOMINEES (AUSTRALIA) LIMITED <NAVIGATOR MAST PLAN SETT A/C> 116,661 0.72
10 BNP PARIBAS NOMINEES PTY LTD HUB24 CUSTODIAL SERV LTD DRP 116,577 0.72
11 J P MORGAN NOMINEES AUSTRALIA LIMITED 106,182 0.66
12 NETWEALTH INVESTMENTS LIMITED <SUPER SERVICES A/C> 102,709 0.64
13 LIGHTNINGEDGE PTY LTD 100,000 0.62
14 NAVIGATOR AUSTRALIA LTD <JB WERE LIST FIX INT SMA A/C> 87,972 0.55
15 NATIONAL NOMINEES LIMITED 65,683 0.41
16 CITICORP NOMINEES PTY LIMITED <DPSL> 62,588 0.39
17 AUSTRALIAN EXECUTOR TRUSTEES LIMITED <NO 1 ACCOUNT> 60,198 0.37
18 RAKIO PTY LTD <PIEKARSKI GYMPIE A/C> 60,000 0.37
19 BALLARD BAY PTY LTD <BALLARD BAY DISCRETIONARY AC> 50,000 0.31
20 JMB PTY LIMITED 50,000 0.31
Total 3,177,434 19.74
Distribution of ANZ CN2 holdings
At 4 October 2017 Range of securities
Number ofholders
% ofholders
Number ofsecurities
% ofsecurities
1 to 1,000 19,818 89.90 6,688,783 41.54
1,001 to 5,000 2,005 9.10 3,943,840 24.50
5,001 to 10,000 134 0.61 996,465 6.19
10,001 to 100,000 75 0.34 1,829,919 11.37
Over 100,000 12 0.05 2,640,993 16.40
Total 22,044 100.00 16,100,000 100.00
At 4 October 2017 there were 4 holdings (2016: 3 holdings) of less than a marketable parcel (less than $500 in value or 5 securities based on the market price of $100.76 per security), which is less than 0.02% of the total holdings of ANZ CN2.
VOTING RIGHTS OF ANZ CN2ANZ CN2 do not confer on holders a right to vote at any meeting of members of the Company.
A register of holders of ANZ CN2 is held at:
452 Johnston Street Abbotsford Victoria, Australia (Telephone: +61 3 9415 4010)
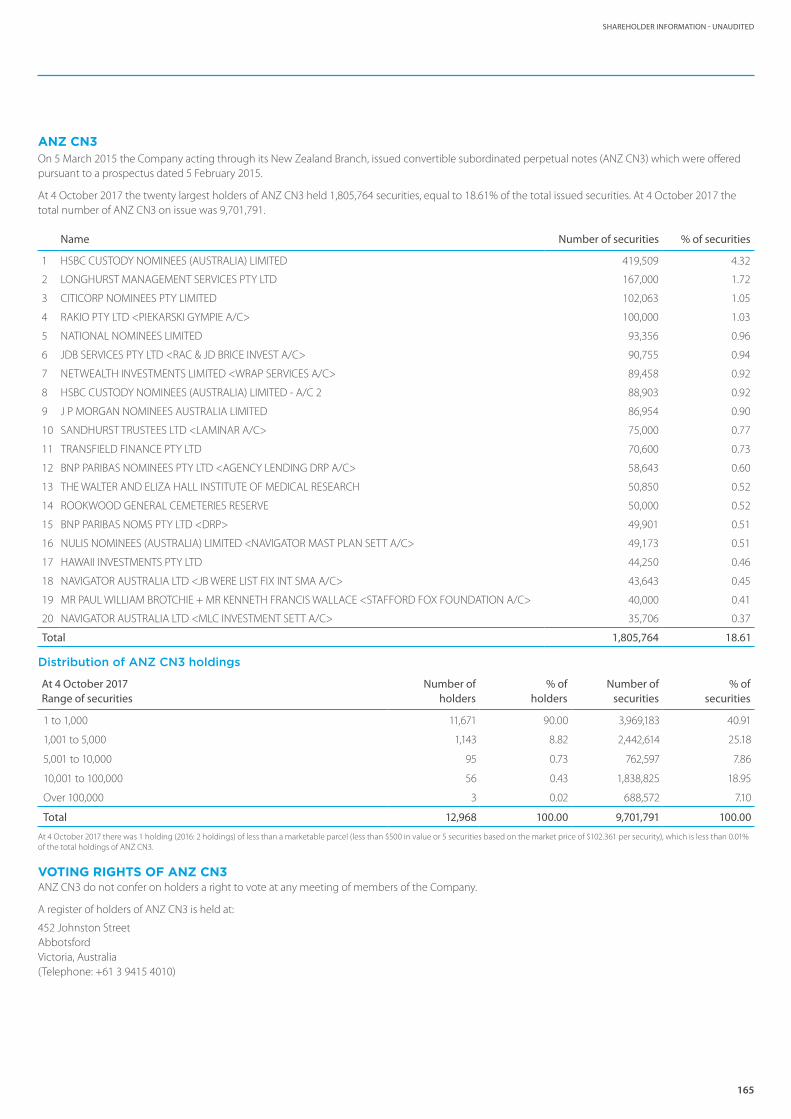
165
SHAREHOLDER INFORMATION - UNAUDITED
ANZ CN3On 5 March 2015 the Company acting through its New Zealand Branch, issued convertible subordinated perpetual notes (ANZ CN3) which were offered pursuant to a prospectus dated 5 February 2015.
At 4 October 2017 the twenty largest holders of ANZ CN3 held 1,805,764 securities, equal to 18.61% of the total issued securities. At 4 October 2017 the total number of ANZ CN3 on issue was 9,701,791.
Name Number of securities % of securities
1 HSBC CUSTODY NOMINEES (AUSTRALIA) LIMITED 419,509 4.32
2 LONGHURST MANAGEMENT SERVICES PTY LTD 167,000 1.72
3 CITICORP NOMINEES PTY LIMITED 102,063 1.05
4 RAKIO PTY LTD <PIEKARSKI GYMPIE A/C> 100,000 1.03
5 NATIONAL NOMINEES LIMITED 93,356 0.96
6 JDB SERVICES PTY LTD <RAC & JD BRICE INVEST A/C> 90,755 0.94
7 NETWEALTH INVESTMENTS LIMITED <WRAP SERVICES A/C> 89,458 0.92
8 HSBC CUSTODY NOMINEES (AUSTRALIA) LIMITED - A/C 2 88,903 0.92
9 J P MORGAN NOMINEES AUSTRALIA LIMITED 86,954 0.90
10 SANDHURST TRUSTEES LTD <LAMINAR A/C> 75,000 0.77
11 TRANSFIELD FINANCE PTY LTD 70,600 0.73
12 BNP PARIBAS NOMINEES PTY LTD <AGENCY LENDING DRP A/C> 58,643 0.60
13 THE WALTER AND ELIZA HALL INSTITUTE OF MEDICAL RESEARCH 50,850 0.52
14 ROOKWOOD GENERAL CEMETERIES RESERVE 50,000 0.52
15 BNP PARIBAS NOMS PTY LTD <DRP> 49,901 0.51
16 NULIS NOMINEES (AUSTRALIA) LIMITED <NAVIGATOR MAST PLAN SETT A/C> 49,173 0.51
17 HAWAII INVESTMENTS PTY LTD 44,250 0.46
18 NAVIGATOR AUSTRALIA LTD <JB WERE LIST FIX INT SMA A/C> 43,643 0.45
19 MR PAUL WILLIAM BROTCHIE + MR KENNETH FRANCIS WALLACE <STAFFORD FOX FOUNDATION A/C> 40,000 0.41
20 NAVIGATOR AUSTRALIA LTD <MLC INVESTMENT SETT A/C> 35,706 0.37
Total 1,805,764 18.61
Distribution of ANZ CN3 holdings
At 4 October 2017 Range of securities
Number ofholders
% ofholders
Number ofsecurities
% ofsecurities
1 to 1,000 11,671 90.00 3,969,183 40.91
1,001 to 5,000 1,143 8.82 2,442,614 25.18
5,001 to 10,000 95 0.73 762,597 7.86
10,001 to 100,000 56 0.43 1,838,825 18.95
Over 100,000 3 0.02 688,572 7.10
Total 12,968 100.00 9,701,791 100.00
At 4 October 2017 there was 1 holding (2016: 2 holdings) of less than a marketable parcel (less than $500 in value or 5 securities based on the market price of $102.361 per security), which is less than 0.01% of the total holdings of ANZ CN3.
VOTING RIGHTS OF ANZ CN3ANZ CN3 do not confer on holders a right to vote at any meeting of members of the Company.
A register of holders of ANZ CN3 is held at:
452 Johnston Street Abbotsford Victoria, Australia (Telephone: +61 3 9415 4010)
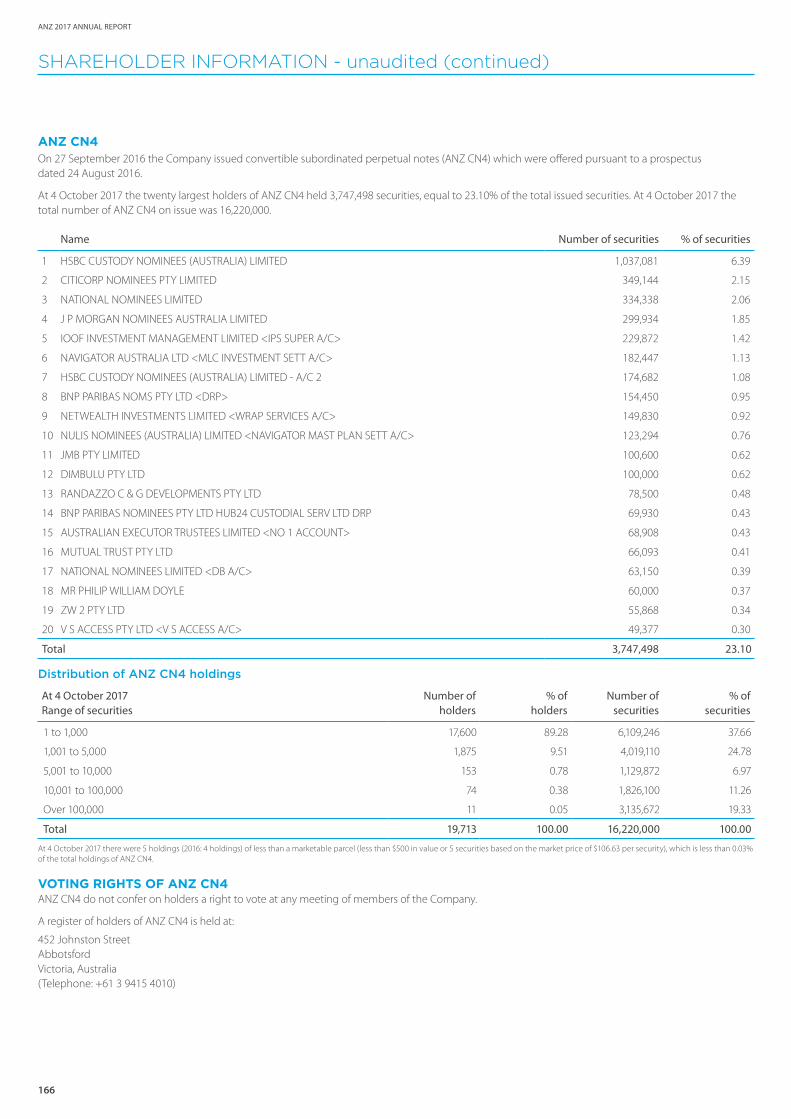
166
ANZ 2017 ANNUAL REPORT
SHAREHOLDER INFORMATION - unaudited (continued)
ANZ CN4On 27 September 2016 the Company issued convertible subordinated perpetual notes (ANZ CN4) which were offered pursuant to a prospectus dated 24 August 2016.
At 4 October 2017 the twenty largest holders of ANZ CN4 held 3,747,498 securities, equal to 23.10% of the total issued securities. At 4 October 2017 the total number of ANZ CN4 on issue was 16,220,000.
Name Number of securities % of securities
1 HSBC CUSTODY NOMINEES (AUSTRALIA) LIMITED 1,037,081 6.39
2 CITICORP NOMINEES PTY LIMITED 349,144 2.15
3 NATIONAL NOMINEES LIMITED 334,338 2.06
4 J P MORGAN NOMINEES AUSTRALIA LIMITED 299,934 1.85
5 IOOF INVESTMENT MANAGEMENT LIMITED <IPS SUPER A/C> 229,872 1.42
6 NAVIGATOR AUSTRALIA LTD <MLC INVESTMENT SETT A/C> 182,447 1.13
7 HSBC CUSTODY NOMINEES (AUSTRALIA) LIMITED - A/C 2 174,682 1.08
8 BNP PARIBAS NOMS PTY LTD <DRP> 154,450 0.95
9 NETWEALTH INVESTMENTS LIMITED <WRAP SERVICES A/C> 149,830 0.92
10 NULIS NOMINEES (AUSTRALIA) LIMITED <NAVIGATOR MAST PLAN SETT A/C> 123,294 0.76
11 JMB PTY LIMITED 100,600 0.62
12 DIMBULU PTY LTD 100,000 0.62
13 RANDAZZO C & G DEVELOPMENTS PTY LTD 78,500 0.48
14 BNP PARIBAS NOMINEES PTY LTD HUB24 CUSTODIAL SERV LTD DRP 69,930 0.43
15 AUSTRALIAN EXECUTOR TRUSTEES LIMITED <NO 1 ACCOUNT> 68,908 0.43
16 MUTUAL TRUST PTY LTD 66,093 0.41
17 NATIONAL NOMINEES LIMITED <DB A/C> 63,150 0.39
18 MR PHILIP WILLIAM DOYLE 60,000 0.37
19 ZW 2 PTY LTD 55,868 0.34
20 V S ACCESS PTY LTD <V S ACCESS A/C> 49,377 0.30
Total 3,747,498 23.10
Distribution of ANZ CN4 holdings
At 4 October 2017 Range of securities
Number ofholders
% ofholders
Number ofsecurities
% ofsecurities
1 to 1,000 17,600 89.28 6,109,246 37.66
1,001 to 5,000 1,875 9.51 4,019,110 24.78
5,001 to 10,000 153 0.78 1,129,872 6.97
10,001 to 100,000 74 0.38 1,826,100 11.26
Over 100,000 11 0.05 3,135,672 19.33
Total 19,713 100.00 16,220,000 100.00
At 4 October 2017 there were 5 holdings (2016: 4 holdings) of less than a marketable parcel (less than $500 in value or 5 securities based on the market price of $106.63 per security), which is less than 0.03% of the total holdings of ANZ CN4.
VOTING RIGHTS OF ANZ CN4ANZ CN4 do not confer on holders a right to vote at any meeting of members of the Company.
A register of holders of ANZ CN4 is held at:
452 Johnston Street Abbotsford Victoria, Australia (Telephone: +61 3 9415 4010)
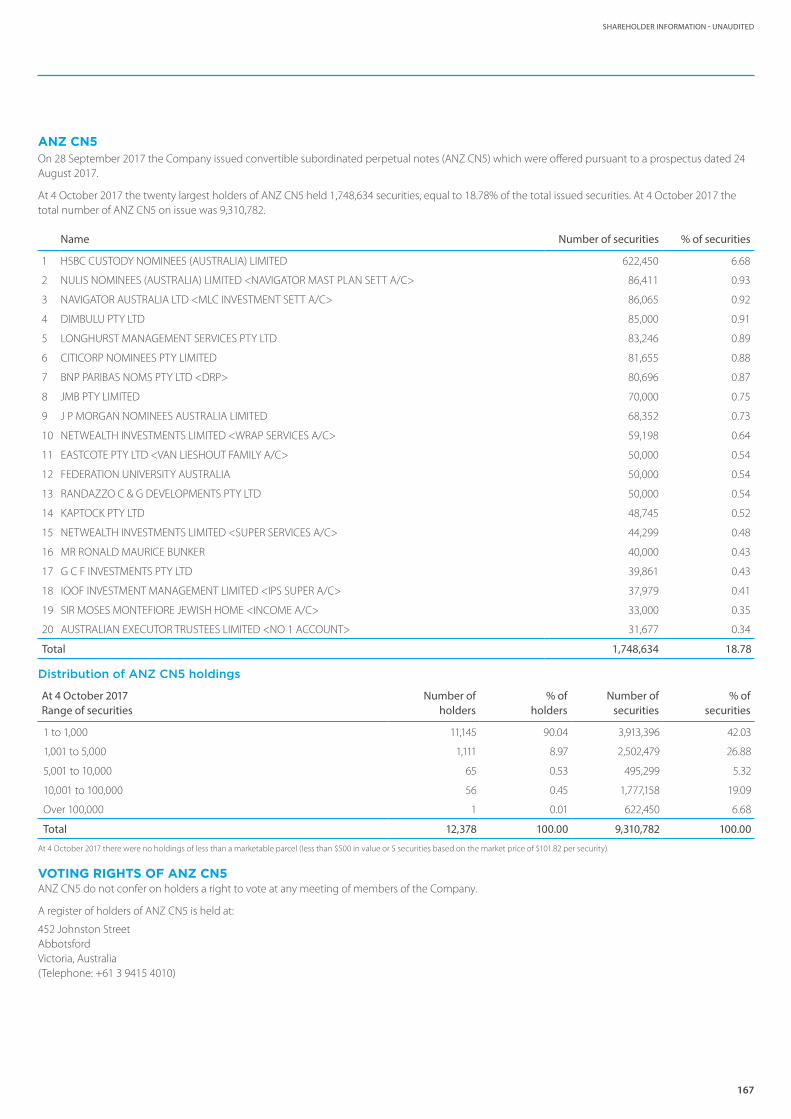
167
SHAREHOLDER INFORMATION - UNAUDITED
ANZ CN5On 28 September 2017 the Company issued convertible subordinated perpetual notes (ANZ CN5) which were offered pursuant to a prospectus dated 24 August 2017.
At 4 October 2017 the twenty largest holders of ANZ CN5 held 1,748,634 securities, equal to 18.78% of the total issued securities. At 4 October 2017 the total number of ANZ CN5 on issue was 9,310,782.
Name Number of securities % of securities
1 HSBC CUSTODY NOMINEES (AUSTRALIA) LIMITED 622,450 6.68
2 NULIS NOMINEES (AUSTRALIA) LIMITED <NAVIGATOR MAST PLAN SETT A/C> 86,411 0.93
3 NAVIGATOR AUSTRALIA LTD <MLC INVESTMENT SETT A/C> 86,065 0.92
4 DIMBULU PTY LTD 85,000 0.91
5 LONGHURST MANAGEMENT SERVICES PTY LTD 83,246 0.89
6 CITICORP NOMINEES PTY LIMITED 81,655 0.88
7 BNP PARIBAS NOMS PTY LTD <DRP> 80,696 0.87
8 JMB PTY LIMITED 70,000 0.75
9 J P MORGAN NOMINEES AUSTRALIA LIMITED 68,352 0.73
10 NETWEALTH INVESTMENTS LIMITED <WRAP SERVICES A/C> 59,198 0.64
11 EASTCOTE PTY LTD <VAN LIESHOUT FAMILY A/C> 50,000 0.54
12 FEDERATION UNIVERSITY AUSTRALIA 50,000 0.54
13 RANDAZZO C & G DEVELOPMENTS PTY LTD 50,000 0.54
14 KAPTOCK PTY LTD 48,745 0.52
15 NETWEALTH INVESTMENTS LIMITED <SUPER SERVICES A/C> 44,299 0.48
16 MR RONALD MAURICE BUNKER 40,000 0.43
17 G C F INVESTMENTS PTY LTD 39,861 0.43
18 IOOF INVESTMENT MANAGEMENT LIMITED <IPS SUPER A/C> 37,979 0.41
19 SIR MOSES MONTEFIORE JEWISH HOME <INCOME A/C> 33,000 0.35
20 AUSTRALIAN EXECUTOR TRUSTEES LIMITED <NO 1 ACCOUNT> 31,677 0.34
Total 1,748,634 18.78
Distribution of ANZ CN5 holdings
At 4 October 2017 Range of securities
Number ofholders
% ofholders
Number ofsecurities
% ofsecurities
1 to 1,000 11,145 90.04 3,913,396 42.03
1,001 to 5,000 1,111 8.97 2,502,479 26.88
5,001 to 10,000 65 0.53 495,299 5.32
10,001 to 100,000 56 0.45 1,777,158 19.09
Over 100,000 1 0.01 622,450 6.68
Total 12,378 100.00 9,310,782 100.00
At 4 October 2017 there were no holdings of less than a marketable parcel (less than $500 in value or 5 securities based on the market price of $101.82 per security).
VOTING RIGHTS OF ANZ CN5ANZ CN5 do not confer on holders a right to vote at any meeting of members of the Company.
A register of holders of ANZ CN5 is held at:
452 Johnston Street Abbotsford Victoria, Australia (Telephone: +61 3 9415 4010)
168
ANZ 2017 ANNUAL REPORT
SHAREHOLDER INFORMATION - unaudited (continued)
EMPLOYEE SHAREHOLDER INFORMATIONIn order to comply with the requirements of the ANZ Employee Share Acquisition Plan Rules and the ANZ Share Option Plan Rules, shares or options must not be issued under these Plans if the aggregate number of shares and options that remain subject to the Rules of either Plan exceed 7% of the total number of ANZ shares of all classes on issue (including preference shares). At 30 September 2017 participants under the following plans/schemes held 0.87% (2016: 1.01%) of the total number of ANZ shares of all classes on issue:
• ANZ Employee Share Acquisition Plan;
• ANZ Employee Share Save Scheme;
• ANZ Share Option Plan; and
• ANZ Directors’ Share Plan.
STOCK EXCHANGE LISTINGSAustralia and New Zealand Banking Group Limited’s ordinary shares are listed on the Australian Securities Exchange and the New Zealand Exchange.
The Group’s other stock exchange listings include:
• Australian Securities Exchange – ANZ Convertible Preference Shares (ANZ CPS3), ANZ Capital Notes (CN1, CN2, CN3, CN4 and CN5), ANZ Capital Securities, senior debt (including covered bonds) and subordinated debt (including ANZ Subordinated Notes) [Australia and New Zealand Banking Group Limited], and residential mortgage backed securities;
• London Stock Exchange – Senior (including covered bonds) and subordinated debt [Australia and New Zealand Banking Group Limited]; senior (including covered bonds) debt [ANZ New Zealand (Int’l) Limited];
• Luxembourg Stock Exchange – Perpetual subordinated debt [Australia and New Zealand Banking Group Limited];
• New Zealand Exchange – ANZ NZ Capital Notes, senior debt and perpetual callable subordinated notes [ANZ Bank New Zealand Limited];
• SIX Swiss Exchange – Senior debt (including covered bonds) [Australia and New Zealand Banking Group Limited and ANZ New Zealand (Int’l) Limited]; and
• Taipei Exchange – Senior debt [Australia and New Zealand Banking Group Limited].
For more information on the ANZ Convertible Preference Shares, ANZ Capital Notes, ANZ Capital Securities and ANZ NZ Capital Notes please refer to Note 15 to the Financial Report.
AMERICAN DEPOSITARY RECEIPTSThe Group has American Depositary Receipts (ADRs) representing American Depositary Shares (ADSs) that are traded on the over-the-counter securities market ‘OTC Pink’ electronic platform operated by OTC Markets Group Inc. in the United States under the ticker symbol: ANZBY and the CUSIP number: 052528304.
With effect from 23 July 2008, the ADR ratio changed from one ADS representing five ANZ ordinary shares to one ADS representing one ANZ ordinary share.
Citibank Shareholder Services is the Depositary for the Company’s ADR program in the United States. Holders of the Company’s ADRs should deal directly with Citibank Shareholder Services on all matters relating to their ADR holdings. Registered Depositary Receipt shareholders can sell shares, access account balances and transaction history, find answers to frequently asked questions and download commonly needed forms. To speak directly to a Citibank Shareholder Services representative, please call 1-877-CITI-ADR (1-877-248-4237) if you are calling from within the United States. If you are calling from outside the United States, please call 1-781-575-4555. You may also send an e-mail inquiry to [email protected] or visit the website at citi.com/adr.
169
GLOSSARY
AASs – Australian Accounting Standards.
AASB – Australian Accounting Standards Board. The term “AASB” is commonly used when identifying AASs issued by the AASB. In doing so, the term is used together with the AAS number.
ADI – Authorised Deposit-taking Institution.
APRA – Australian Prudential Regulation Authority.
APS – ADI Prudential Standard.
BCBS – Basel Committee on Banking Supervision.
Cash profit is an additional measure of profit which is prepared on a basis other than in accordance with accounting standards. Cash profit represents ANZ’s preferred measure of the result of the ongoing business activities of the Group, enabling readers to assess Group and Divisional performance against prior periods and against peer institutions. To calculate cash profit, the Group excludes non-core items from statutory profit as noted below. These items are calculated consistently period on period so as not to discriminate between positive and negative adjustments.
Gains and losses are adjusted where they are significant, or have the potential to be significant in any one period, and fall into one of three categories:
1. gains or losses included in earnings arising from changes in tax, legal or accounting legislation or other non-core items not associated with the ongoing operations of the Group;
2. treasury shares, revaluation of policy liabilities, economic hedging impacts and similar accounting items that represent timing differences that will reverse through earnings in the future; and
3. accounting reclassifications between individual line items that do not impact reported results, such as policyholder tax gross up.
4. Cash profit is not a measure of cash flow or profit determined on a cash accounting basis.
Collective provision is the provision for credit losses that are inherent in the portfolio but not able to be individually identified. A collective provision is only recognised when a loss event has occurred. Losses expected as a result of future events, no matter how likely, are not recognised.
Covered Bonds are bonds issued by an ADI to external investors secured against a pool of the ADI’s assets (the cover pool) assigned to a bankruptcy remote special purpose entity. The primary assets forming the cover pool are mortgage loans. The mortgages remain on the issuer’s balance sheet. The covered bond holders have dual recourse to the issuer and the cover pool assets. The mortgages included in the cover pool cannot be otherwise pledged or disposed of but may be repurchased and substituted in order to maintain the credit quality of the pool. The Group issues covered bonds as part of its funding activities.
Credit risk is the risk of financial loss resulting from the failure of ANZ’s customers and counterparties to honour or perform fully the terms of a loan or contract.
Credit risk weighted assets represent assets which are weighted for credit risk according to a set formula contained within APS 112/113.
Credit valuation adjustment (CVA) – Over the life of a derivative instrument, ANZ uses a CVA model to adjust fair value to take into account the impact of counterparty credit quality. The methodology calculates the present value of expected losses over the life of the financial instrument as a function of probability of default, loss given default, expected credit risk exposure and an asset correlation factor. Impaired derivatives are also subject to a CVA.
Customer deposits represent term deposits, other deposits bearing interest, deposits not bearing interest and borrowing corporations debt excluding securitisation deposits.
Dividend payout ratio is the total ordinary dividend payment divided by profit attributable to shareholders of the Company, adjusted for the amount of preference share dividends paid.
Fair value is an amount at which an asset or liability could be exchanged between knowledgeable and willing parties in an arm’s length transaction.
Gross loans and advances (GLA) is made up of loans and advances, acceptances and capitalised brokerage/mortgage origination fees less unearned income.
IFRS – International Financial Reporting Standards.
Impaired assets are those financial assets where doubt exists as to whether the full contractual amount will be received in a timely manner, or where concessional terms have been provided because of the financial difficulties of the customer. Financial assets are impaired if there is objective evidence of impairment as a result of a loss event that occurred prior to the reporting date, and that loss event has had an impact, which can be reliably estimated, on the expected future cash flows of the individual asset or portfolio of assets.
Impaired loans comprise drawn facilities where the customer’s status is defined as impaired.
Individual provision is the amount of expected credit losses on financial instruments assessed for impairment on an individual basis (as opposed to on a collective basis). It takes into account expected cash flows over the lives of those financial instruments.
Interest rate risk in the banking book (IRRBB) relates to the potential adverse impact of changes in market interest rates on ANZ’s future net interest income. The risk generally arises from:
1. Repricing and yield curve risk - the risk to earnings or market value as a result of changes in the overall level of interest rates and/or the relativity of these rates across the yield curve;
2. Basis risk - the risk to earnings or market value arising from volatility in the interest margin applicable to banking book items; and
3. Optionality risk - the risk to earnings or market value arising from the existence of stand-alone or embedded options in banking book items.
Internationally comparable ratios are ANZ’s interpretation of the regulations documented in the Basel Committee publications; “Basel lll: A global regulatory framework for more resilient banks and banking systems” (June 2011) and “International Convergence of Capital Measurement and Capital Standards” (June 2006). They also include differences identified in APRA’s information paper entitled International Capital Comparison Study (13 July 2015).
Net interest margin is net interest income as a percentage of average interest earning assets.
Net loans and advances represent gross loans and advances less provisions for credit impairment.
Net tangible assets equal share capital and reserves attributable to shareholders of the Company less preference share capital and unamortised intangible assets (including goodwill and software).
Regulatory deposits are mandatory reserve deposits lodged with local central banks in accordance with statutory requirements.
GLOSSARY
170
ANZ 2017 ANNUAL REPORT
GLOSSARY (continued)
Restructured items comprise facilities in which the original contractual terms have been modified for reasons related to the financial difficulties of the customer. Restructuring may consist of reduction of interest, principal or other payments legally due, or an extension in maturity materially beyond those typically offered to new facilities with similar risk.
Return on average assets calculated as the profit attributable to shareholders of the Company, adjusted for the amount of preference share dividends paid, divided by average total assets.
Return on average ordinary equity calculated as the profit attributable to shareholders of the Company, adjusted for the amount of preference share dividends paid, divided by average ordinary shareholders’ equity.
Regulatory deposits are mandatory reserve deposits lodged with local central banks in accordance with statutory requirements.
Risk weighted assets (RWA) – Assets (both on and off-balance sheet) are risk weighted according to each asset’s inherent potential for default and what the likely losses would be in the case of default. In the case of non asset backed risks (i.e. market and operational risk), RWA is determined by multiplying the capital requirements for those risks by 12.5.
Settlement balances owed to / by ANZ represent financial assets and/or liabilities which are in the course of being settled. These may include trade dated assets and liabilities, nostro/vostro accounts and securities settlement accounts.
REGISTERED OFFICE:ANZ Centre MelbourneLevel 9, 833 Collins StreetDocklands VIC 3008 Australia
Telephone: +61 3 9273 5555Facsimile: +61 3 8542 5252
Company Secretary: Simon Pordage
INVESTOR RELATIONS:Level 10, 833 Collins StreetDocklands VIC 3008 Australia
Telephone: +61 3 8654 7682Facsimile: +61 3 8654 8886Email: [email protected]
www.shareholder.anz.com
Group General ManagerInvestor Relations: Jill Campbell
CORPORATE AFFAIRS:Level 10, 833 Collins StreetDocklands VIC 3008 Australia
Telephone: +61 3 8654 3276Email: [email protected]
Group General ManagerCorporate Affairs: Gerard Brown
SHARE REGISTRAR:AUSTRALIAComputershare Investor Services Pty LtdGPO Box 2975Melbourne VIC 3001
Telephone within Australia: 1800 11 33 99International Callers: +61 3 9415 4010Facsimile: +61 3 9473 2500
Austraclear Services Limited20 Bridge StreetSydney NSW 2000
Telephone: +61 8298 8476
LUXEMBOURGDeutsche Bank Luxembourg S.A.2, Boulevard Konrad AdenauerL-1115 LuxembourgLuxembourg
Telephone: +352 4 21 22 1
NEW ZEALANDComputershare Investor Services LimitedPrivate Bag 92119Auckland 1142
Telephone: 0800 174 007Facsimile: +64 9 488 8787
UNITED KINGDOMComputershare Investor Services PLCThe Pavilions Bridgwater RoadBristol BS99 6ZZ
Telephone: +44 870 702 0000Facsimile: +44 870 703 6101
UNITED STATESCitibank Shareholder ServicesP.O. Box 43077 ProvidenceRhode Island 02940-3077
Callers outside USA: +1-781-575-4555Callers within USA (toll free):+1-877-248-4237 (+1-877-CITI-ADR)
Email: [email protected]
www.citi.com/adr
The Bank of New York Mellon101 Barclay Street, Floor 7ENew York, NY 10286
Telephone: +1 212 815 5811
Deutsche Bank Trust Company Americas60 Wall Street, Mailstop NYC 60-1630New York, NY 10005
Telephone: +1 212 250 2500
CONTACTS
MORE INFORMATIONGeneral Information on ANZ can be obtained from our website: anz.com. Shareholders can visit our Shareholder Centre at shareholder.anz.com. ANZ Corporate Governance: For information about ANZ’s approach to Corporate Governance and to obtain copies of ANZ’s Constitution, Board/Board Committee Charters, Codes of Conduct and Ethics and summaries of other ANZ policies of interest to shareholders and stakeholders, visit anz.com/governance. Australia and New Zealand Banking Group Limited ABN 11 005 357 522. This Annual Report has been prepared for Australia and New Zealand Banking Group Limited (“the Company”) together with its subsidiaries which are variously described as: “ANZ”, “Group”, “ANZ Group”, “the Bank”, “us”, “we” or “our”.
FTSE4Good

shareholder.anz.com
Australia and New Zealand Banking Group Limited (ANZ) ABN 11 005 357 522. ANZ’s colour blue is a trade mark of ANZ.

AN
Z 20
17 AN
NU
AL R
EPOR
T