2017 a brave new world? - · pdf file4 | 2017 – a brave new world? business rates...
TRANSCRIPT

2017 A brave new world?Business rates research paper

Contents
Page 3 Key findings
Page 4 2017 – a brave new world?
Page 5 Will rates increase even where rents have been stable?
Page 6 Offices – pain in London, steadier elsewhere
Page 12 Retail – limited relief
Page 16 Industrial and logistics – an increasing burden
Page 18 Changing the system – are business rates fit for purpose?
Page 20 Devolve or not to devolve: is the government tinkering at the edges?
Page 25 The technical stuff
2 | 2017 – A brave new world? Business rates research paper

2017 – A brave new world? Business rates research paper | 3
Key findings
Business rates are set to be revised in 2017, based on how rents stood in 2015; the current framework, introduced in 2010, is based on 2008 rental levels. Although we expect the liability changes will be phased, there will be major impacts for many occupiers.
Business rates to rise even where rents have remained stableUnder current legislation, the amount collected by government from business rates is kept constant in real terms, regardless of what is happening to the economy. As average rents across the whole commercial property universe have fallen between the two revaluations, companies who have not seen any increase in rents – or even a slight fall – may still see their rates bills rise.
Retail sector to see significant change but relief for struggling businesses slow to arriveRetailers in prime West End locations such as New Bond Street and core Oxford Street are looking at steep increases in their liability. In contrast, secondary locations especially in the north and west of the country will see falling liabilities, although there are exceptions. In some cities – such as Birmingham – the opening of new shopping centres will lead to reducing rates in previously prime pitches. But the anticipated transitional phasing of the changes will delay the urgently needed revision to retailers’ liability.
Largest increases in office business rates in newly established London marketsIn areas such as King’s Cross, Stratford, Shoreditch and Clerkenwell, which have seen a combination of high demand and widespread improvements to stock, notional rate liabilities will increase by 85% or more. Cost differentials between traditionally ‘core’ and ‘fringe’ locations will be eroded. Smaller improving centres in outer London and the south east will also see a significant impact. In comparison, liabilities in the big six regional cities are likely to be flat or rise only slightly.
Radical changes neededJLL is suggesting that radical changes to the business rates system are required, including the removal of downward transitional relief, the use of CPI rather than RPI as an index, more frequent revaluations, a fixed UBR following a revaluation and a modernisation of the collection process.

4 | 2017 – A brave new world? Business rates research paper
2017 – a brave new world?
Currently business rates are based on rental values as at 1 April 2008 when rents still were at high levels after several years of sustained growth. From 2017, rates will be based on rents on 1 April 2015. Whilst rents today are recovering from the lows of 2009/10 with strong growth in some sectors and localities, for the property sector as a whole there has been little if any rent increase since 2008. Consequently this revaluation will be the most redistributive of recent times. Add in the Government’s devolution agenda and there is real concern that rates payable will change markedly for individual ratepayers.Under the rating system, the total revenue from non-domestic rates is fixed in real terms. Rates are increased each year in line with RPI and the effect of a revaluation is to redistribute the burden of rates according to the new rateable values. The amount of tax paid in rates has not tracked the economic situation, placing an unwelcome burden on UK commerce whilst acting as a dependable source of revenue for the Treasury.
In the long term this system would be ‘fair’ if RPI truly reflected the rate of economic growth, and the property sector was a fixed percentage of UK Plc. Neither is true. RPI has continued to rise during the recession (albeit at a slowing pace) and with the rise of multi-channel retailing,
the decline of aspects of manufacturing and remote working practices, it is clear that property is not a constant in the economy.
This made the politically expedient decision by the last government to defer the 2015 rating revaluation especially unwelcome in those sectors that were and are in urgent need of a re-balancing of the rates burden. Those sectors will be looking to 2017 for redress. The findings suggest that there will be relief for some, but overall the impact of the revaluation will not be enough to produce the redistribution required.
This is partly as a consequence of the transitional arrangements that have been introduced for each new rating list. The intention is that those who would face very large hikes in their rates payable should have that increase phased in to soften the blow and facilitate budgeting. The system has to be fiscally neutral. The method chosen by successive governments is that the funds to pay for phased increases for ‘losers’ is paid for by phasing in lower rates for the ‘winners’. This means that those sectors and ratepayers that deserve lower rates are subsidising those who would have had larger initial increases. This system can be improved.
This paper examines the redistribution of rates that will come in 2017 and highlights the principal areas and sectors where we anticipate change. Our analysis is aimed at prime and Grade A stock. Whilst this will show overall movements in the market, there will be variations in the secondary market that differ from the analysis due to micro-economic and local factors.
Rates overall are increased each year in line with RPI. The
effect of a revaluation is to redistribute the burden of rates according to the
new rateable values.
2017 – A brave new world? Business rates research paper | 5
Will rates increase even where rents have been stable?
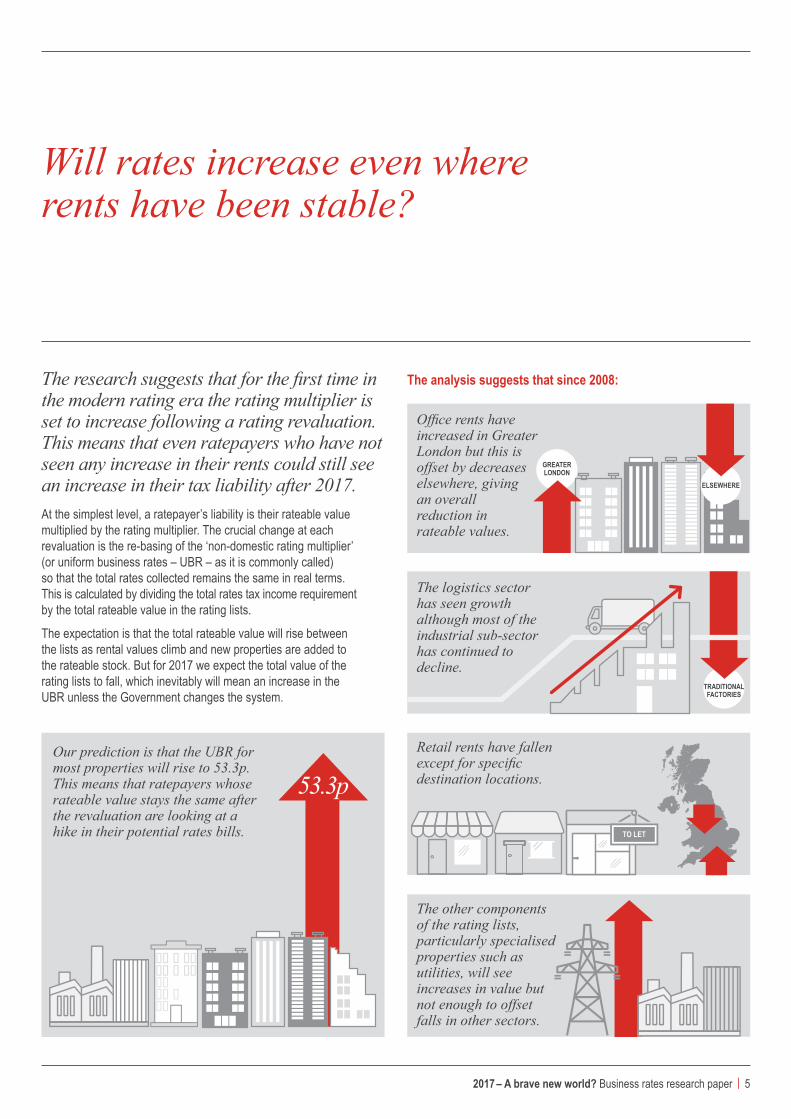
The analysis suggests that since 2008:The research suggests that for the first time in the modern rating era the rating multiplier is set to increase following a rating revaluation. This means that even ratepayers who have not seen any increase in their rents could still see an increase in their tax liability after 2017. At the simplest level, a ratepayer’s liability is their rateable value multiplied by the rating multiplier. The crucial change at each revaluation is the re-basing of the ‘non-domestic rating multiplier’ (or uniform business rates – UBR – as it is commonly called) so that the total rates collected remains the same in real terms. This is calculated by dividing the total rates tax income requirement by the total rateable value in the rating lists.
The expectation is that the total rateable value will rise between the lists as rental values climb and new properties are added to the rateable stock. But for 2017 we expect the total value of the rating lists to fall, which inevitably will mean an increase in the UBR unless the Government changes the system.
Our prediction is that the UBR for most properties will rise to 53.3p. This means that ratepayers whose rateable value stays the same after the revaluation are looking at a hike in their potential rates bills.
Office rents have increased in Greater London but this is offset by decreases elsewhere, giving an overall reduction in rateable values.
GReATeR London
Retail rents have fallen except for specific destination locations.
To LeT
53.3p
eLSeWHeRe
The other components of the rating lists, particularly specialised properties such as utilities, will see increases in value but not enough to offset falls in other sectors.
TRAdiTionAL fAcToRieS
The logistics sector has seen growth although most of the industrial sub-sector has continued to decline.
6 | 2017 – A brave new world? Business rates research paper
Offices – pain in London, steadier elsewhere
London – recent rental growth puts the rates up
The continued growth of demand for prime London space, coupled with a relatively modest revaluation in 2010 for the City due to the financial crisis, means that rates on prime property in the capital are set to increase. This effect will be felt particularly in emerging hot-spots where new sub-markets have become established since 2008.
London continues to offer occupiers access to a world financial centre, a national service centre and access to government in the world’s fifth largest economy. Even in times of relative economic uncertainty these factors continue to make the UK capital a sought after location.
After the initial contraction in 2008-09 the City market has shown its resilience by attracting a range of professional and business service providers to complement its core financial and insurance markets. Recently the financial services sector has been more expansive. Rents have risen since the last revaluation but had not by the end of the first quarter of 2015 recovered to historic highs.
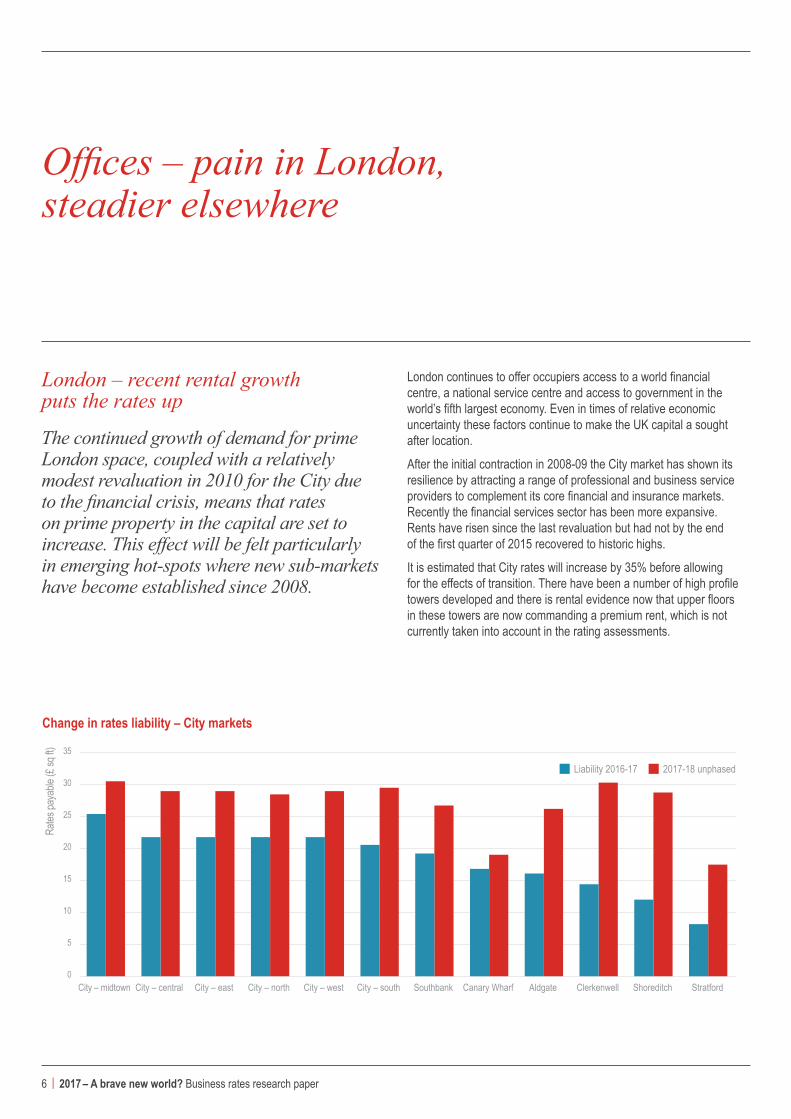
It is estimated that City rates will increase by 35% before allowing for the effects of transition. There have been a number of high profile towers developed and there is rental evidence now that upper floors in these towers are now commanding a premium rent, which is not currently taken into account in the rating assessments.
change in rates liability – city markets
0
5
10
15
20
25
30
35
Rates
paya
ble (£
sq ft)
■ Liability 2016-17 ■ 2017-18 unphased
City – midtown City – central City – east City – north City – west City – south Southbank Canary Wharf Aldgate Clerkenwell Shoreditch Stratford

2017 – A brave new world? Business rates research paper | 7
Core City
35% increase from
£22 sq ft to £29 sq ft
notional rate liabilities
King’s Cross
85% increase from
£19 sq ft to £35 sq ft
Shoreditch
142% increase from
£12 sq ft to £29 sq ft
Fitzrovia
42% increase from
£26 sq ft to £37 sq ft
Mayfair
16% increase from
£50 sq ft to £58 sq ft
In the West End, the values in 2008 were still close to their peak of the last economic cycle. Rents fell during the recession but then recovered strongly because of restricted supply and are slightly up on 2008. Coupled with the UBR change, we anticipate aggregate rates liabilities will increase potentially by over 20% – although the change will be lower in core markets and more marked in some local centres.
A feature of the evolving London market has been the emergence of former fringe areas into recognised centres, often with a market specialism. Shoreditch and King’s Cross, for example, have become increasingly popular with businesses looking for scale, value for money, access to transport links, a large talent pool and the amenities sought by young professionals. There have been some notable migrations of media and tech firms from the core London locations and from elsewhere in the South East. Combined with improved supply from regeneration schemes and a number of prime office developments, this has pushed up rents. Differentials between the core and some traditionally fringe locations are being eroded. This will be reflected in business rate changes in the years after 2017.
Shoreditch, perhaps most emblematic of this change, will see notional rate liabilities more than double from about £12 sq ft to £29 sq ft. Further East, liabilities at Stratford, which has benefited from huge investment around the Olympic site, will double from £8 sq ft to £17 sq ft before transition. Similarly, large increases are predicted for Clerkenwell (110% increase from £14 sq ft to £30 sq ft), as well as King’s Cross (85% increase from £19 sq ft to £35 sq ft) which has now become one of the most desirable headquarter locations in London. In contrast, notional rates in the core City will increase by 35% from £22 sq ft to £29 sq ft.
For longstanding occupiers in buoyant submarkets this will mean that the rise in total occupational costs up to 2022 will be considerable. This could be a problem for struggling businesses while even more healthy enterprises may choose to look elsewhere.
change in rates liability – West end markets
Rates
paya
ble (£
sq ft)
0
10
20
30
40
50
60
■ Liability 2016-17 ■ 2017-18 unphased
Mayfa
ir
St Ja
mes’s
Belgr
avia
and
Knigh
tsbrid
ge
North
of
Oxfor
d Stre
et
Soho
Kens
ington
&
Chels
ea
Victo
ria
Cove
nt Ga
rden
Fitzro
via/N
oho

8 | 2017 – A brave new world? Business rates research paper
The effect of these changes is that the cost difference between the traditional core locations and the fringes will reduce, especially in comparison with the core City market, although Mayfair and St James will remain the most expensive locations. For those pondering a move out of the West End, the decision may look less clear-cut putting pressure on rental values.
For many, it could prompt a reconsideration of the core City markets, which will look increasingly good value in comparison, particularly given the availability of high quality new buildings. However, the City is still perceived by some as not offering as comprehensive a range of amenities as some other Central London locations.
Other occupiers, particularly in more price-sensitive sectors, may look further afield to emerging London locations within, for example, Hackney. Many of the new occupiers in locations such as King’s Cross and Shoreditch – those who have driven rent rises in the higher rents of recent years – will be more able to absorb higher business rates.
While percentage rate increases in core West End submarkets such as Soho and Mayfair / St James are close to single figures, given the rents in these locations, the increases can be substantial in cash terms. In prime Mayfair business rates will rise from £50 sq ft to £58 sq ft – twice the burden within the core City. Optimistic niche financial services enterprises might be prepared to pay these rates – but for how long will the trading companies and others consider these costs justifiable?
It is worth noting, however, that some neighbouring submarkets also have seen significant increases, notably Fitzrovia. This area, north of Oxford Street, has become more popular with advertising, media, fashion and professional services firms over the past decade, with financial services take-up also increasing. The resulting lift in rents means that notional rates will increase from £26 sq ft to £37 sq ft. This may push some occupiers to look further afield – perhaps again to emerging hubs. Hitherto Clerkenwell and Shoreditch have been viable alternatives, but rising prices here may force a rethink. Meanwhile, Fitzrovia is likely to continue to attract more higher-value occupiers.
change in rates liability – fringes
Rates
paya
ble (£
sq ft)
0
5
10
15
20
25
30
35
40
■ Liability 2016-17 ■ 2017-18 unphased
Maryl
ebon
e &
Eusto
n
Bloo
msbu
ry
Padd
ington
King
s Cro
ss/
St P
ancra
s
Hamm
ersm
ith
Camd
en
Wate
rloo
Batte
rsea
Vaux
hall
London offices – likely effects
2017 – A brave new world? Business rates research paper | 9
Offices – Regions
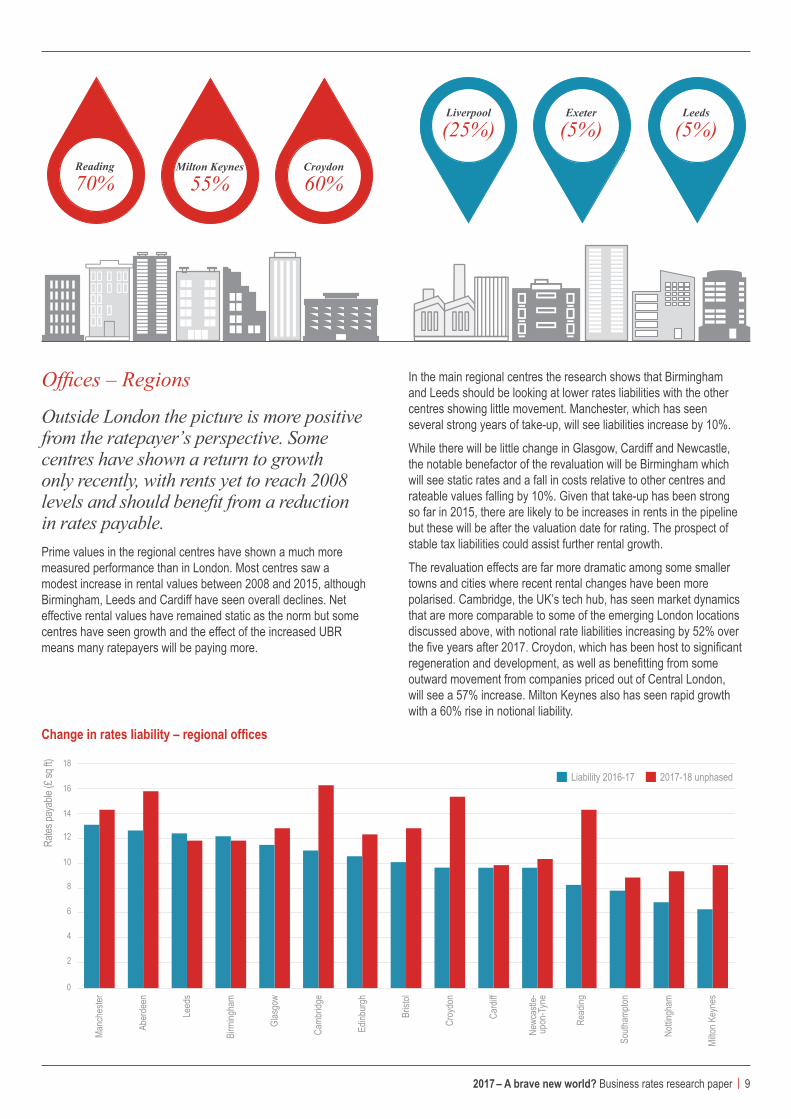
Outside London the picture is more positive from the ratepayer’s perspective. Some centres have shown a return to growth only recently, with rents yet to reach 2008 levels and should benefit from a reduction in rates payable. Prime values in the regional centres have shown a much more measured performance than in London. Most centres saw a modest increase in rental values between 2008 and 2015, although Birmingham, Leeds and Cardiff have seen overall declines. Net effective rental values have remained static as the norm but some centres have seen growth and the effect of the increased UBR means many ratepayers will be paying more.
Reading
70% Milton Keynes
55% Croydon
60%
Liverpool
(25%)Exeter
(5%) Leeds
(5%)
In the main regional centres the research shows that Birmingham and Leeds should be looking at lower rates liabilities with the other centres showing little movement. Manchester, which has seen several strong years of take-up, will see liabilities increase by 10%.
While there will be little change in Glasgow, Cardiff and Newcastle, the notable benefactor of the revaluation will be Birmingham which will see static rates and a fall in costs relative to other centres and rateable values falling by 10%. Given that take-up has been strong so far in 2015, there are likely to be increases in rents in the pipeline but these will be after the valuation date for rating. The prospect of stable tax liabilities could assist further rental growth.
The revaluation effects are far more dramatic among some smaller towns and cities where recent rental changes have been more polarised. Cambridge, the UK’s tech hub, has seen market dynamics that are more comparable to some of the emerging London locations discussed above, with notional rate liabilities increasing by 52% over the five years after 2017. Croydon, which has been host to significant regeneration and development, as well as benefitting from some outward movement from companies priced out of Central London, will see a 57% increase. Milton Keynes also has seen rapid growth with a 60% rise in notional liability.
Change in rates liability – regional offices
Rates
paya
ble (£
sq ft)
0
2
4
6
8
10
12
14
16
18■ Liability 2016-17 ■ 2017-18 unphased
Manc
heste
r
Aber
deen
Leed
s
Birm
ingha
m
Glas
gow
Camb
ridge
Edinb
urgh
Brist
ol
Croy
don
Card
iff
Newc
astle
- up
on-T
yne
Read
ing
South
ampto
n
Nottin
gham
Milto
n Key
nes

10 | 2017 – A brave new world? Business rates research paper
While significant in local terms, these increases in smaller centres only have a limited impact on the national aggregate of rateable values, which will still contract overall.
As stated above, these figures relate to prime and grade A stock and do need to be treated with some caution for more general conclusions. Less well specified or older buildings that may have seen flat or falling rents will see lower rates as a result. Also, the performance in the smaller centres is more affected by the immediate supply/demand balance in their local markets, so general market performance is less predictable. Even in tighter markets, there will be grade B buildings that may not see the same change as in the prime sector. There are variations also in how well the current rating list matched values in 2008, which means the anticipated change might not be what market movements would indicate.
Whilst higher business rates may force those committed to London to look to the fringes, the regional picture will be important to those companies considering how best to optimise their UK footprint. Many service providers are scrutinising the cost of their London operations against a background of increased competition and regulation and reduced margins. The shifting rates burden will enhance locations such as Manchester or Birmingham, which have more affordable housing and substantial numbers of graduates.
There will always be staff who have to be in the capital given the need to be close to clients or government and companies recognise the huge recruitment, productivity and skills base advantages of being in London. None of the regional cities can come close to matching this so a significant change in location patterns is not expected. The fact that regional occupational costs are likely to remain static whilst London rents and rates are likely to rise steeply might just tip the balance towards ‘nearshoring’ in some cases.
It is also important to note that the business rates calculated for 2017 will be the same in real terms until 2022, whatever happens to the rental profile of different locations over that period. So if London sees rental corrections over that period, for example, business rates will remain unchanged until the next rating revaluation.
Location notional rates increase
Reading 70%
Croydon 60%
Milton Keynes 55%
Cambridge 50%
Guildford 35%
Nottingham 35%
Bristol 25%
Aberdeen 25%
York 25%
Brighton 20%
Swindon 20%
Edinburgh 15%
Crawley (Gatwick) 15%
Southampton 15%
Glasgow 10%
Manchester 9%
Newcastle-upon-Tyne 8%
Watford 8%
Bath 8%
Sheffield 8%
Coventry 4%
Plymouth 4%
Cardiff 2%
Luton 1%
Norwich (3%)
Birmingham (5%)
Leeds (5%)
Exeter (5%)
Liverpool (25%)
Regional offices – continued

2017 – A brave new world? Business rates research paper | 11
JLL’s projections suggest that based on the current system of increasing rates by RPI between valuations, the uniform business rate could reach 60p in the pound by 2022, a huge additional burden for UK businesses.
12 | 2017 – A brave new world? Business rates research paper
Retail – limited relief
The retail sector is desperate for a fair rebalancing of the rates burden. The 2017 revaluation should produce some relief but much will depend on the transitional scheme to be introduced by the Government. If the 2010 scheme is repeated then many ratepayers will not see the full benefit of the revaluation even by the fifth year of the new rating list. Meanwhile there are some ‘hot spots’ where rates are likely to increase markedly.
The retail sector has been particularly affected by the decision to defer this revaluation. Many of the UK’s leading retailers have been vocal in calling for fundamental changes to the system. They see it as penalising traditional operators using a property based model who are facing challenges from on-line competitors with a different cost base.
This has led to a polarisation in the market: regional centres and locations which have high concentrations of affluent shoppers have seen robust growth. Key London streets, offering retailers the chance of a highly visible flagship showcase in one of the world’s top shopping destinations, are the most obvious examples. Meanwhile, secondary centres are most affected by structural change in the sector and have seen static or falling rents. The effects of the revaluation on the retail sector are far more uneven than in other property sub-markets.
The revaluation will begin to rectify a situation in which, despite rents falling by as much as 50% in a swathe of locations across the country, rates have continued to rise with RPI in line with legislation. At the same time, shops in prime Central London locations have seen the same proportional increases in their tax burden, despite booming turnover and rapidly rising rents.
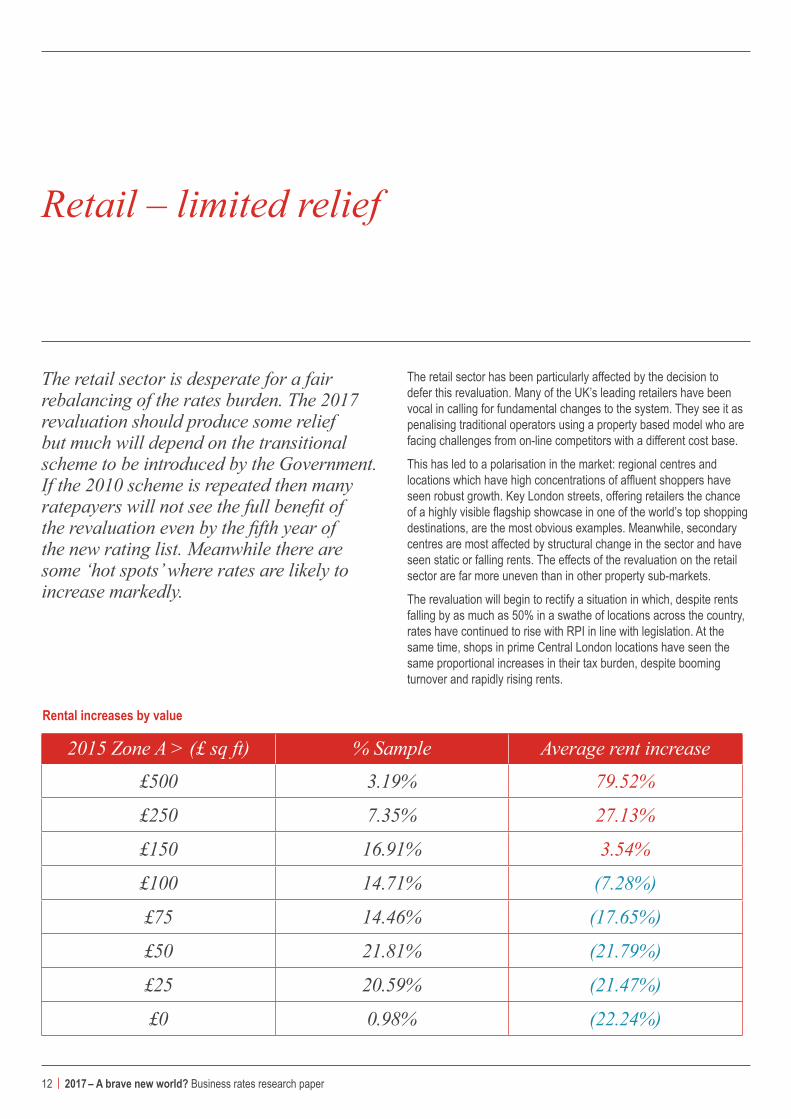
Rental increases by value
2015 Zone A > (£ sq ft) % Sample Average rent increase
£500 3.19% 79.52%
£250 7.35% 27.13%
£150 16.91% 3.54%
£100 14.71% (7.28%)
£75 14.46% (17.65%)
£50 21.81% (21.79%)
£25 20.59% (21.47%)
£0 0.98% (22.24%)

2017 – A brave new world? Business rates research paper | 13
JLL has tracked the prime Zone A rental values for 500 retail destinations each April for over a decade and this invaluable research provides a unique insight into what might be expected following the revaluation in 2017. The table on the previous page clearly shows that the higher the rent, the stronger the increase since 2008. Centres with Zone A values of less than £100 sq ft have, on average, seen rents fall.
Overall the average rental value in these centres has fallen by over 5% in nominal terms.
Against this background, individual locations will have changed value depending on whether rival centres have been developed or improved and taking account of new traders and shifting prime locations.
The highest increases in rates will be in destination locations within Central London, such as Burlington Arcade, New Bond Street and Oxford Street. The West End is an ideal place for brand showcase stores which can support and enhance a mainly on-line operation. Rates will also rise strongly in rapidly gentrifying locations such as Brixton and Peckham, which is likely to accelerate recent controversial shifts in the retail offer.
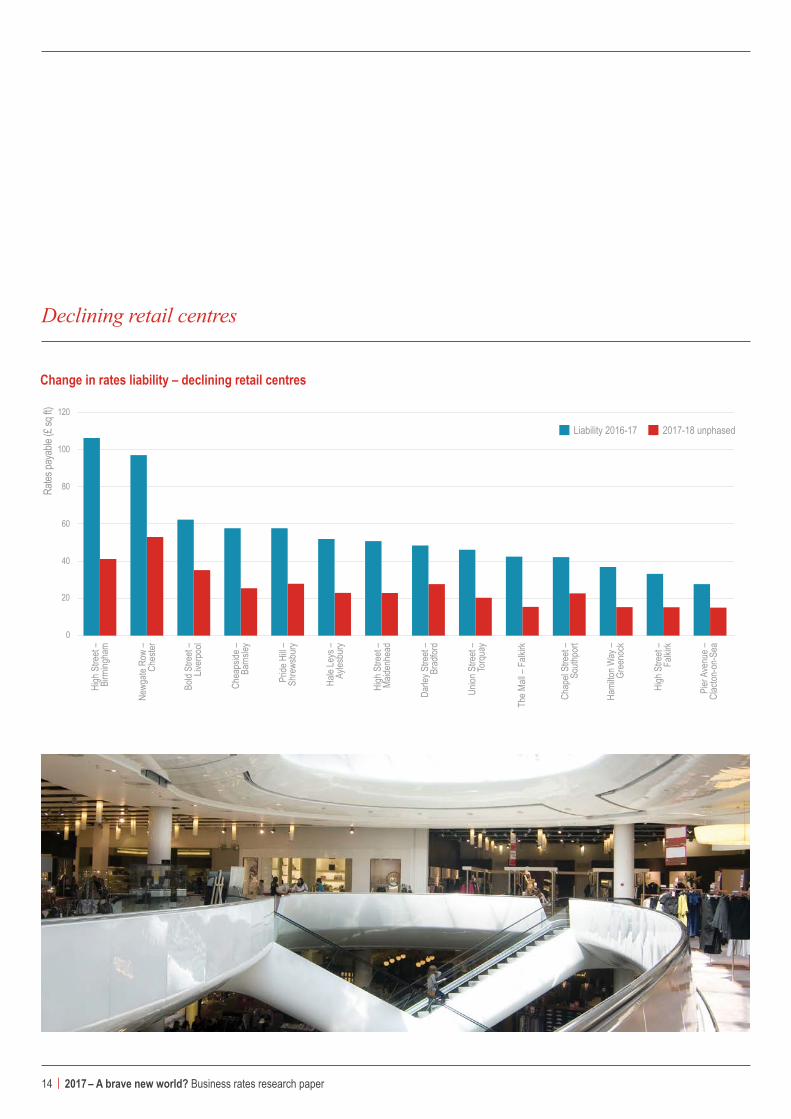
At the other end of the spectrum, the research highlights individual retailing locations affected by local changes and new developments reinforcing the effects of national trends. For example, Birmingham’s High Street has become more marginal since the development of the Bullring and the Grand Central scheme above New Street Station. Whilst many locations that should see a fall in rates are in the north and west of the country, some towns in the south-east, such as Maidenhead and Chatham, will also benefit.
New Bond Street, London W1
88% increase from
£380 sq ft to £720 sq ftZone A
Lord Street, Liverpool
71% increase from
£76 sq ft to £130 sq ftZone A
Brixton Road, Brixton
120% increase from
£50 sq ft to £110 sq ftZone A
Change in rates liability – fast growing retail centres
Rates
paya
ble (£
sq ft)
0
100
200
300
400
500
600
700
800
■ Liability 2016-17 ■ 2017-18 unphased
New
Bond
Stre
et –
Lond
on W
1
Old B
ond S
treet
– Lo
ndon
W1
Burlin
gton A
rcade
– Lo
ndon
W1
Rege
nt St
reet
– Lo
ndon
W1
Totte
nham
Cou
rt Ro
ad
– Bes
t – Lo
ndon
W1
Brom
pton C
ross
– Lo
ndon
SW
3
Cond
uit S
treet
– Lo
ndon
W1
Maryl
ebon
e High
St
reet
– Lon
don W
1
Lord
Stre
et –
Liver
pool
Jerm
yn S
treet
– Lo
ndon
SW
1
Dove
r Stre
et –
Lond
on W
1
Brixt
on R
oad –
Br
ixton
St. M
artin
s Lan
e –
Lond
on W
C2
Rye L
ane –
Pe
ckha
m
Broa
dway
– Mi
ll Hill
14 | 2017 – A brave new world? Business rates research paper
Declining retail centres
change in rates liability – declining retail centres
Rates
paya
ble (£
sq ft)
0
20
40
60
80
100
120
■ Liability 2016-17 ■ 2017-18 unphased
High
Stre
et –
Birm
ingha
m
Newg
ate R
ow –
Ches
ter
Bold
Stre
et –
Liver
pool
Chea
pside
– Ba
rnsle
y
Pride
Hill
– Sh
rews
bury
Hale
Leys
– Ay
lesbu
ry
High
Stre
et –
Maide
nhea
d
Darle
y Stre
et –
Brad
ford
Union
Stre
et –
Torq
uay
The M
all –
Falki
rk
Chap
el St
reet
– So
uthpo
rt
Hami
lton W
ay –
Gree
nock
High
Stre
et –
Falki
rk
Pier
Ave
nue –
Cl
acton
-on-
Sea

2017 – A brave new world? Business rates research paper | 15
Retail – the problem of transitional phasingThe story for retail is that the longed-for rebalancing of the rate burden will not occur if the transitional provisions applied for 2010 are re-adopted or a similar transitional scheme applied. Many centres will face three or more years of transitional phasing. The following tables shows the potential impact on the sample of premises that we track.
Nearly one in 13 of this sample will still be paying too much in rates in 2022 under these transition assumptions. More than one in five will be in downwards phasing for four or more years and 60% will experience some form of rates reduction limitation.
The rating revaluation will not solve many problems for retailers and will only gradually alleviate cost pressures in secondary centres, unless there is a radical change to the transitional arrangements. Some of the centres with potentially large increases may be able to ride the storm: international luxury brands will continue to need to be seen in key locations. Ultimately the costs of a flagship store are a small fraction of the outgoings of a profitable international business.
The revaluation is unlikely to halt the decline of secondary centres, which is perhaps a necessary adjustment to the over-supply of retail space in the UK generally. It may accelerate the transformation of the High Street as more viable users and propositions replace surplus A1 space. It will increase the cost differential between dominant and secondary centres, however, and between north and south. This might boost the relative attractiveness of some secondary centres.
On the other hand, the revaluation could limit expansion in the medium term, particularly amongst international retailers who use London as a springboard for the UK and Europe. Whilst they will remain keen on key locations, they could opt to expand more quickly and comprehensively in some neighbouring countries rather than in the UK regions. This in turn could dampen the appetite for new retail developments in the UK, potentially affecting some regeneration schemes.
Time in transition – % of centres
4 yrs in upwards phasing 1.72%
3 yrs in upwards phasing 2.70%
2 yrs in upwards phasing 8.33%
1 yr in upwards phasing 11.03%
5 yrs in upwards phasing 0.25%
1 yr in downwards phasing 12.75%
1 yr in downwards phasing 9.56%
Not in transition16.18%
3 yrs in downwards phasing 14.71%
4 yrs in downwards phasing 15.20%
5 yrs in downwards phasing 7.60%

16 | 2017 – A brave new world? Business rates research paper
Industrial and logistics – an increasing burden
The industrial sector as a whole has seen less volatile conditions than in retail and offices, with the general market showing positive growth compared with 2008, particularly in London, the south east, and the west midlands. Transition will not affect this sector as much as the others, with more locations in upwards phasing but only for one or two years.
With the expected rise in the UBR and the relative decline in other sectors, however, the occupiers of industrial and logistics properties can expect rates to increase in 2017. After the revaluation, the rates contribution from this sector will make up a higher share of the national tax take.
Occupiers of industrial and logistics
properties can expect rates to increase in 2017 as they pay a higher share of the
national tax take.
2017 – A brave new world? Business rates research paper | 17
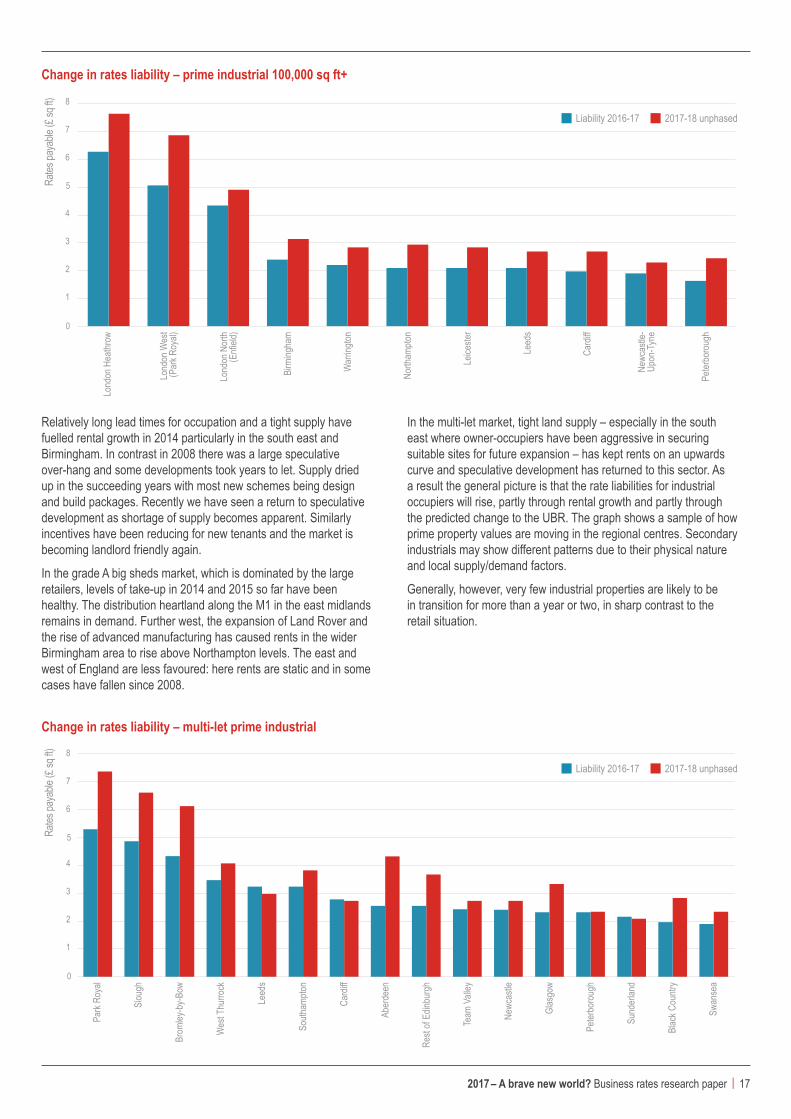
Change in rates liability – prime industrial 100,000 sq ft+
Rates
paya
ble (£
sq ft)
0
1
2
3
4
5
6
7
8
■ Liability 2016-17 ■ 2017-18 unphasedLo
ndon
Hea
throw
Lond
on W
est
(Par
k Roy
al)
Lond
on N
orth
(Enfi
eld)
Birm
ingha
m
War
ringto
n
North
ampto
n
Leice
ster
Leed
s
Card
iff
Newc
astle
- Up
on-T
yne
Peter
boro
ugh
change in rates liability – multi-let prime industrial
Rates
paya
ble (£
sq ft)
0
1
2
3
4
5
6
7
8
■ Liability 2016-17 ■ 2017-18 unphased
Park
Roya
l
Slou
gh
Brom
ley-b
y-Bow
Wes
t Thu
rrock
Leed
s
South
ampto
n
Card
iff
Aber
deen
Rest
of Ed
inbur
gh
Team
Vall
ey
Newc
astle
Glas
gow
Peter
boro
ugh
Sund
erlan
d
Blac
k Cou
ntry
Swan
sea
Relatively long lead times for occupation and a tight supply have fuelled rental growth in 2014 particularly in the south east and Birmingham. In contrast in 2008 there was a large speculative over-hang and some developments took years to let. Supply dried up in the succeeding years with most new schemes being design and build packages. Recently we have seen a return to speculative development as shortage of supply becomes apparent. Similarly incentives have been reducing for new tenants and the market is becoming landlord friendly again.
In the grade A big sheds market, which is dominated by the large retailers, levels of take-up in 2014 and 2015 so far have been healthy. The distribution heartland along the M1 in the east midlands remains in demand. Further west, the expansion of Land Rover and the rise of advanced manufacturing has caused rents in the wider Birmingham area to rise above Northampton levels. The east and west of England are less favoured: here rents are static and in some cases have fallen since 2008.
In the multi-let market, tight land supply – especially in the south east where owner-occupiers have been aggressive in securing suitable sites for future expansion – has kept rents on an upwards curve and speculative development has returned to this sector. As a result the general picture is that the rate liabilities for industrial occupiers will rise, partly through rental growth and partly through the predicted change to the UBR. The graph shows a sample of how prime property values are moving in the regional centres. Secondary industrials may show different patterns due to their physical nature and local supply/demand factors.
Generally, however, very few industrial properties are likely to be in transition for more than a year or two, in sharp contrast to the retail situation.
18 | 2017 – A brave new world? Business rates research paper
Changing the system – are business rates fit for purpose?
The internet and other technological changes mean that businesses’ demand for space is changing. The aggregate need for office and retail space in particular is likely to decline, whereas at the same time the demand for ‘hub’ or ‘destination’ locations – such as Central London and the Big Six – is increasing. This reflects the rise of flexible working balanced against the ongoing need for face-to-face contact and collaboration.
If commercial property becomes less important as a factor of production overall, then the government’s insistence on maintaining ‘fiscal neutrality’ for business rate revaluations – i.e. ensuring that the amount paid to the Treasury does not change in real terms – appears unsustainable. The sector will increasingly become overtaxed and the property market will be distorted as a result. This paper has already identified the following issues:
• potential relocations of SME and fast-growing businesses from London’s Tech Belt, resulting in a more distributed pattern and the loss of clustering benefits
• a reduced propensity for retailers to expand across the UK, with implications for development
• additional burdens for Britain’s struggling manufacturing sector
• the ever increasing rates burden providing a disincentive for development, reducing the responsiveness of UK Plc
Several changes could lessen this distorting effect in the short to medium term:
Removal of downward transitional relief Many companies have already been paying rates at an unsustainably high level for a further two years following the postponement of the revaluation from 2015 to 2017. Imposing another 3 to 4 years of tight downward transition will mean that many businesses who expected to see a big drop in their bills in 2015 will have to wait until 2020 or beyond, which for many will mean a decade of paying rates linked to high rental values set in pre-recession times that have not been seen since. The cost of phasing increases in rates liabilities, which is useful for budgeting purposes, could be paid for by a simple and modest across-the-board increase in the rating multiplier.
Business rates raised about £26bn in the last financial year. The UK now has the highest property taxation in the world, according to the Organisation for Economic Co-operation and Development (OECD). Many companies assert that business rates are a heavy and unfair form of taxation and that radical reform is required mostly to make it more responsive to the economy in which ratepayers operate. HM Treasury has been asked to undertake a review of the business rate system and report to the Chancellor in time for the next budget in March 2016. All the indications are that the Government will not entertain changes that reduce the tax revenue or its dependability. The yield from business rates has continued to rise throughout the recession, unlike most other business taxes: JLL predicts that the nationally set rate multiplier will have increased by 50% from 34.9p in 1990/91 to an anticipated 53.3p in 2017/18 for large hereditaments. This demonstrates how much faster the business rate burden is growing compared with the value of the property sector within the overall economy.
By the end of this parliament business rates will reach a level approaching 60p, assuming RPI annual increases are maintained. This is without taking into account the supplements that can now add up to a further 5% to rate bills in London.
2017 – A brave new world? Business rates research paper | 19
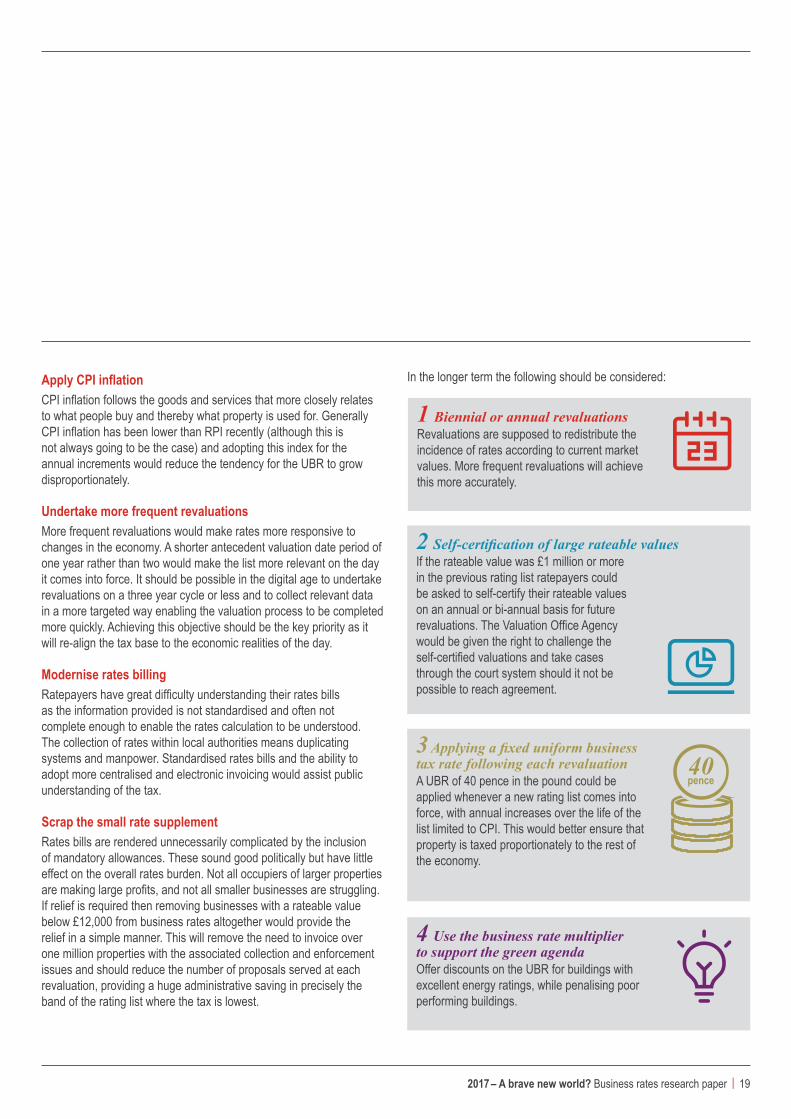
Apply CPI inflation CPI inflation follows the goods and services that more closely relates to what people buy and thereby what property is used for. Generally CPI inflation has been lower than RPI recently (although this is not always going to be the case) and adopting this index for the annual increments would reduce the tendency for the UBR to grow disproportionately.
Undertake more frequent revaluations More frequent revaluations would make rates more responsive to changes in the economy. A shorter antecedent valuation date period of one year rather than two would make the list more relevant on the day it comes into force. It should be possible in the digital age to undertake revaluations on a three year cycle or less and to collect relevant data in a more targeted way enabling the valuation process to be completed more quickly. Achieving this objective should be the key priority as it will re-align the tax base to the economic realities of the day.
Modernise rates billing Ratepayers have great difficulty understanding their rates bills as the information provided is not standardised and often not complete enough to enable the rates calculation to be understood. The collection of rates within local authorities means duplicating systems and manpower. Standardised rates bills and the ability to adopt more centralised and electronic invoicing would assist public understanding of the tax.
Scrap the small rate supplementRates bills are rendered unnecessarily complicated by the inclusion of mandatory allowances. These sound good politically but have little effect on the overall rates burden. Not all occupiers of larger properties are making large profits, and not all smaller businesses are struggling. If relief is required then removing businesses with a rateable value below £12,000 from business rates altogether would provide the relief in a simple manner. This will remove the need to invoice over one million properties with the associated collection and enforcement issues and should reduce the number of proposals served at each revaluation, providing a huge administrative saving in precisely the band of the rating list where the tax is lowest.
3 Applying a fixed uniform business tax rate following each revaluationA UBR of 40 pence in the pound could be applied whenever a new rating list comes into force, with annual increases over the life of the list limited to CPI. This would better ensure that property is taxed proportionately to the rest of the economy.
40pence
4 Use the business rate multiplier to support the green agenda Offer discounts on the UBR for buildings with excellent energy ratings, while penalising poor performing buildings.
1 Biennial or annual revaluationsRevaluations are supposed to redistribute the incidence of rates according to current market values. More frequent revaluations will achieve this more accurately.
2 Self-certification of large rateable valuesIf the rateable value was £1 million or more in the previous rating list ratepayers could be asked to self-certify their rateable values on an annual or bi-annual basis for future revaluations. The Valuation Office Agency would be given the right to challenge the self-certified valuations and take cases through the court system should it not be possible to reach agreement.
In the longer term the following should be considered:

20 | 2017 – A brave new world? Business rates research paper
Devolve or not to devolve: is the government tinkering at the edges?
The changes presented at the Conservative Party Conference are not going to consign the 50+p UBR to history. A summary of the changes which are relevant to ratepayers are summarised at the top of the next page.
The intention appears to be in the longer term to move towards local rates retention as the “normal” situation, with the details of any rates support system yet to be revealed. This could make a major difference to the flows of money between local and central government but will not necessarily have any impact on the quantum of the rates payable.
The detailed proposals reveal some key points:
• Local discounts to the UBR will only occur where a sufficient amount of revenue buoyancy occurs in a Local Authority’s area through additional RV in that area after 2020, and following lobbying by interested parties. Local Authorities are unlikely to voluntarily forego revenue.
• The 2p increase hypothecated for infrastructure projects follows the example of London and Crossrail but that city has a disproportionate amount of RV to draw upon. Whether other authorities will be able to use this provision to provide seed finance for projects, given the much lower income that will result, remains to be seen.
At the Conservative Party Conference George Osborne made some headline grabbing statements for the reform of rates and the return of an increasing proportion to direct Local Authority control, together with power to alter the UBR. In practice these initiatives will neither reduce the rates burden nor make them substantially easier to understand. Further, the proposals run the risk of favouring wealthier local authorities at the expense of others, increasing tensions of geographical inequality.

2017 – A brave new world? Business rates research paper | 21
The second issue will only be made worse by these latest proposals. The ability of local authorities to discount or add to the UBR will introduce another layer of variation into rates budgeting. The rate pooling system will be changed and phased out – so local authorities keep their rates but some will still need a rate support grant as a supplement.
How this will work given the huge imbalance of rates revenue and the consequent differences in the opportunity for local authorities to benefit from rates retention is not clear. Local authorities with high rental values will have a much greater chance of boosting their income due to new development than poorer areas. The benefits of the new control over the rates will be uneven, potentially aggravating the perceived north-south divide.
Devolution may be a laudable agenda. Needlessly passing money from local authorities to central government and back again does seem wasteful. But until we know more detail on these proposals we can only wonder what the effect of “the biggest transfer of power to our local government in living memory” will be.
For many ratepayers, it is the high incidence of rates that is the primary concern. Property taxes raise more revenue in the UK than any other country. The government needs to consider whether this is justified in terms of reductions in other taxation and the relative ease and low cost of its collection.
The second complaint is that the tax is complicated and unfair. Small businesses complain they pay more in rates as a proportion of turnover than larger ones. The small business rates relief produces an artificial boundary and can lead to occupiers in the same building having a very different liability. The use of transition which requires complex calculations, together with the increasing ability of local authorities to levy additional rates through BID schemes means that rates are complex when the underlying idea is simple.
The government is not addressing the first issue, perhaps not surprisingly, but could do a better job of explaining why the tax is an efficient component in the taxation of businesses – e.g. it is difficult to avoid and means all companies trading in the UK at least pay some tax, even when registered abroad and apparently loss-making.
Rates retention – 50% of any increase in rates collected above a
baseline set in 2013 is retained by the Local Authority.
UBR – set nationally.
Rate supplements – currently only the GLA has added an additional 2p to the UBR (to partially fund Crossrail).
Now
100% of any increase in business
rates revenue above a new 2020 baseline can
be retained by the Local Authority.
UBR set nationally but Councils permitted
to apply a discount.
Any mayoral authority can add up to 2p to the UBR to fund infrastructure
projects, subject to a local majority vote.
Proposed change

22 | 2017 – A brave new world? Business rates research paper
Property taxes raise more revenue in the UK than any other country. The government needs to consider whether this is justified in terms of reductions in other taxation and the relative ease and low cost of its collection.

Contents
Page 3 Key findings
Page 4 2017 – a brave new world?
Page 5 Will rates increase even where rents have been stable?
Page 6 Offices – pain in London, steadier elsewhere
Page 12 Retail – limited relief
Page 16 Industrial and logistics – an increasing burden
Page 18 Changing the system – are business rates fit for purpose?
Page 20 Devolve or not to devolve: is the government tinkering at the edges?
Page 25 The technical stuff
2 | 2017 – A brave new world? Business rates research paper
£31.21£27.74
FITZROVIA/NOHO
MAYFAIR
VICTORIA
BELGRAVIA &KNIGHTSBRIDGE
KENSINGTON & CHELSEA
HAMMERSMITH
PADDINGTON
KING’S CROSS/
ST. PANCRAS
MARYLEBONE& EUSTON
SOHO
BLOOMSBURY
CAMDEN
CLERKENWELL
SHOREDITCH
CANARY WHARF
STRATFORD
CITY CENTRALCITY EAST
ALDGATE
BATTERSEA
VAUXHALL
WATERLOO
SOUTHBANK
CITYMIDTOWN
NORTH OFOXFORD STREET
COVENTGARDEN
£14.88£20.55
£25.40£30.53
£21.77£28.98
£21.77£28.98
£14.40£30.31
£19.21£26.72
£20.56£29.50
£16.09£26.20
£30.25£33.91
£14.88£15.93
£44.17£39.05
£17.29£22.61
£21.61£27.74
£50.42£58.05
£40.81£43.67
£26.41£31.85
£34.81£38.02
£28.81£35.45
£28.81(£19.21)£35.45
£16.09£22.09
£28.81£31.85
HYDE PARK
REGENT’SPARK
£21.77£28.98
£12.00£28.77
£21.77£28.46
Rates payable 2016/17 (Top figure)
Notional rates payable 2017/18 (Bottom figure)
<10% increase
10% – 30% increase
>30% increase
£8.16£17.47
£16.81£19.01
£15.37£23.12
£50.42£58.05
ST. JAMES’S
CITY NORTH
CITY WEST
CITY SOUTH
£26.41£37.50
2017 Rating liability impact: Central London villages
2017 – A brave new world? Business rates research paper | 242017 – A brave new world? Business rates research paper | 23

• Every five years, on 1 April, new Rating Lists produced by the Valuation Office Agency (or ‘VOA’) or the Scottish Assessors come into force (1 April 2000, 2005, 2010 and so on) for all commercial property in the UK. The 2015 Revaluation was postponed until 2017.
• The Lists contain entries that show:
– the address of each unit that is assessed, called a ‘hereditament’
– a broad description (e.g. ‘Offices, Storage and Premises’)
– an assessment number
– a Rateable Value, and
– an effective date
• The Rateable Value (‘RV’) is a rental valuation of the property on a common valuation date which is two years before the Rating List comes into effect (1 April 1998, 2003, 2008 and so on). This date is called the Antecedent Valuation Date (‘AVD’).
• The last revaluation came into effect from 1 April 2010, with an AVD of 1 April 2008.
• The next revaluation will come into effect on 1 April 2017 with an AVD of 1 April 2015 having been deferred two years by the last government.
• Rate liability is calculated by multiplying the RV by a multiplier (commonly called the Uniform Business Rate – ‘UBR’), which for 2015/16 is 48.0p for small properties and 49.3p for large properties in England and Scotland.
• With Septembers 2015 RPI figure announced at 0.8%, we expect the UBR for small properties to be 48.4p in 2016/17.
• There are also various supplements which can be levied including, in London, a Crossrail supplement of 2.0p for hereditaments over £55,000, a City of London supplement of 0.4p and additions in Scotland for large supermarkets.
• This simple calculation is complicated by ‘transitional phasing’, which is enacted to smooth the larger increases in liability after a revaluation. Hitherto the capped increases have been paid for by limiting the rates decreases for those ratepayers whose rate liability is reduced – so in effect the ‘winners’ on each revaluation have subsidised the ‘losers’. This phasing can persist for several years.
• The new scheme won’t be announced until late 2016 so in this paper the transitional relief limits have varied with each revaluation – in this paper we have adopted the same scheme for our 2017 rate liability calculations as the 2010 List scheme.
• New properties entered into the rating list after 1 April 2017 will not benefit from transitional relief so our tables show the liability in 2017/18 without transitional relief.
25 | 2017 – A brave new world? Business rates research paper
The technical stuff
jll.co.uk
© 2015 Jones Lang LaSalle IP, Inc. All rights reserved. The information contained in this document is proprietary to Jones Lang LaSalle and shall be used solely for the purposes of evaluating this proposal. All such documentation and information remains the property of Jones Lang LaSalle and shall be kept confidential. Reproduction of any part of this document is authorized only to the extent necessary for its evaluation. It is not to be shown to any third party without the prior written authorization of Jones Lang LaSalle. All information contained herein is from sources deemed reliable; however, no representation or warranty is made as to the accuracy thereof.
Contacts
James Carson Director – Rating +44 (0)20 7852 4082 [email protected]
Stanley Booton Director – Rating +44 (0)20 7087 5760 [email protected]
Jon Neale Head of Research – UK +44 (0)20 7087 5508 [email protected]
Tim Beattie Lead Director – Rating +44 (0)20 7399 5453 [email protected]