2017-18 hydrogen student design contest · 2018-06-01 · 2017-18 hydrogen student design contest...
TRANSCRIPT

2017-18 Hydrogen Student Design ContestProject Mobius
“Revitalizing the Spirit of the ’74 World’s Fair”
AuthorsMathew Hunt Lee Taylor Ryan Hamilton
Timothy Eckhart Ashley Mills Chloe NicholAustin Anderson Austin Dowell Joseph Ostheller
Nicholas Potter Spencer Seeberger
AdvisorsJacob Leachman Ian Richardson
Washington State University
January 31, 2018

Project Mobius Washington Innovation for Sustainable Energy
TABLE OF CONTENTS
List of Figures 3
List of Tables 3
Nomenclature 3
Executive Summary 5
1 Introduction 5
2 Siting 7
3 Design Data & Equipment Drawings 113.1 Electricity to Hydrogen Conversion . . . . . . . . . . . . . . . . . . . 113.2 Equipment . . . . . . . . . . . . . . . . . . . . . . . . . . . . . . . . . 13
3.2.1 Power Generation . . . . . . . . . . . . . . . . . . . . . . . . . 133.2.2 Hydrogen Compression . . . . . . . . . . . . . . . . . . . . . . 143.2.3 Connections, fittings & piping . . . . . . . . . . . . . . . . . . 14
3.3 Gas Transportation and Storage . . . . . . . . . . . . . . . . . . . . . 153.3.1 Truck Transport . . . . . . . . . . . . . . . . . . . . . . . . . . 153.3.2 Natural Gas Pipeline Injection . . . . . . . . . . . . . . . . . . 153.3.3 Hydrogen Storage . . . . . . . . . . . . . . . . . . . . . . . . . 16
3.4 Communications Equipment . . . . . . . . . . . . . . . . . . . . . . . 163.4.1 Communication & monitoring systems . . . . . . . . . . . . . 163.4.2 Safety Equipment . . . . . . . . . . . . . . . . . . . . . . . . . 18
3.5 Hydrogen Use . . . . . . . . . . . . . . . . . . . . . . . . . . . . . . . . 183.5.1 Vehicle Refueling . . . . . . . . . . . . . . . . . . . . . . . . . . 183.5.2 Natural Gas Pipeline Injection . . . . . . . . . . . . . . . . . . 18
3.6 Equipment footprint . . . . . . . . . . . . . . . . . . . . . . . . . . . . 18
4 Cost and Economic Analysis, Commercial Viability 194.1 Operating Costs . . . . . . . . . . . . . . . . . . . . . . . . . . . . . . 194.2 Capital Costs . . . . . . . . . . . . . . . . . . . . . . . . . . . . . . . . 194.3 Economic Analysis . . . . . . . . . . . . . . . . . . . . . . . . . . . . . 214.4 Commercial Viability . . . . . . . . . . . . . . . . . . . . . . . . . . . 22
5 Safety Analysis & Codes and Standards 245.1 FMEA . . . . . . . . . . . . . . . . . . . . . . . . . . . . . . . . . . . . 24
6 Regulations, Codes and Standards 26
7 Operation & Maintenance 277.1 Operation . . . . . . . . . . . . . . . . . . . . . . . . . . . . . . . . . . 277.2 Maintenance . . . . . . . . . . . . . . . . . . . . . . . . . . . . . . . . 28
2017-18 Hydrogen Student Design Contest 1
Project Mobius Washington Innovation for Sustainable Energy
8 Environmental Analysis 298.1 Resource Analysis . . . . . . . . . . . . . . . . . . . . . . . . . . . . . 298.2 Emission Analysis . . . . . . . . . . . . . . . . . . . . . . . . . . . . . 298.3 Noise Analysis . . . . . . . . . . . . . . . . . . . . . . . . . . . . . . . 31
A Promising Future for Washington State 31
Works Cited 32
Appendix 34Policy and Regulatory Analysis & 1 Pager for Policy Maker . . . . . . . . 34
2017-18 Hydrogen Student Design Contest 2

Project Mobius Washington Innovation for Sustainable Energy
LIST OF FIGURES
1 P2G site location relative to Spokane’s Smart City District. The sitelocation is marked by a yellow star. . . . . . . . . . . . . . . . . . . . 7
2 P2G system location in the north-western corner of Riverfront Park. 83 Side view rendering of the site. . . . . . . . . . . . . . . . . . . . . . . 84 Site layout on the Riverfront Park grounds showing setback dis-
tances surrounding the P2G station. . . . . . . . . . . . . . . . . . . 105 PEM Electrolysis Diagram. . . . . . . . . . . . . . . . . . . . . . . . . 116 PEM Electrolyser Stack . . . . . . . . . . . . . . . . . . . . . . . . . . 127 PEM electrolyser System . . . . . . . . . . . . . . . . . . . . . . . . . 138 Riverfront Park Map with (a) red circle: Location of Upper Falls 10
MW subterranean Francis Turbine, (b) Yellow circle: Location ofLower Falls 14.8 MW Kaplan Turbine, (c) Blue circle: Planned SiteLocation. . . . . . . . . . . . . . . . . . . . . . . . . . . . . . . . . . . 14
9 Remote monitoring system. . . . . . . . . . . . . . . . . . . . . . . . . 1610 PLC system integration. . . . . . . . . . . . . . . . . . . . . . . . . . . 1711 Workstation view showing real-time sensor information. . . . . . . . 1712 Return on investment with varying demand in response to price. . 2213 Price needed to reach a specified return on investment given stable
non-price dependent demand. . . . . . . . . . . . . . . . . . . . . . . 2314 Explanation of Ranking Criteria for all components for an FMEA . . 2415 FMEA for Power to Gas Subsystem . . . . . . . . . . . . . . . . . . . 2516 An onboard PLC schematic . . . . . . . . . . . . . . . . . . . . . . . . 2717 The greenhouse gas emissions of tube trailers at speeds from 0-70
mph . . . . . . . . . . . . . . . . . . . . . . . . . . . . . . . . . . . . . 30
LIST OF TABLES
1 Minimum distance (in feet) from gaseous hydrogen system to expo-sure from Table H-2 of WAC-294-24-31503 . . . . . . . . . . . . . . 9
2 Electrolyser system specifications . . . . . . . . . . . . . . . . . . . . 123 Major component footprints. . . . . . . . . . . . . . . . . . . . . . . . 184 Fixed monthly costs . . . . . . . . . . . . . . . . . . . . . . . . . . . . 195 Itemized list of station. . . . . . . . . . . . . . . . . . . . . . . . . . . 206 Applicable regulations used in the development of the P2G station. 267 P2G station regulation exemptions . . . . . . . . . . . . . . . . . . . 27
2017-18 Hydrogen Student Design Contest 3
Project Mobius Washington Innovation for Sustainable Energy
NOMENCLATURE
ASTM American Society for Testing and MaterialsISO International Organization for StandardizationNFPA National Fire Protection AgencyOSHA Occupational Safety and Health AdministrationSAE Society of Automotive EngineersWAC Washington Administrative CodeDOT Department of TransportationUL Underwriters LaboratoriesNEC National Electrical Codes
2017-18 Hydrogen Student Design Contest 4

Project Mobius Washington Innovation for Sustainable Energy
EXECUTIVE SUMMARY
Avista Corporation, a local power and gas utility, owns and operates a hydroelec-tric power plant in Riverfront Park in Spokane, Washington. Urbanova, a jointurban development project of Avista and the city of Spokane has the opportunityto reutilize 576 kW from a minimum flow requirement through the Upper Fallsdiversion dam in Riverfront Park. This proposal outlines a power-to-gas (P2G)system which converts the carbon-free hydroelectric power into a multipurposeclean hydrogen fuel. The uses of hydrogen range from carbon-free transportationfuel to supplementing natural gas delivery systems through pipeline injection.
Riverfront Park has access to excess power generating capacity, abundant wa-ter, and is located on the edge of Spokane’s developing smart-city U-district.Spokane, and Riverfront Park, has the historical recognition as host of the firstenvironmentally themed World’s Fair, cementing the Northwest’s conservationleadership in 1974. The proposed P2G system would be contained within threestandard 20-foot shipping containers. An aerial view of the installation wouldreflect the logo of the ’74 Expo, a Mobius strip. This design choice reinvigoratesthe spirit of ’74 with a new view for the future of environment and energy in theNorthwest.
The proposed P2G plant will be owned by Avista, including the primary com-ponents; an electrolyser from an international manufacturer and a compressedhydrogen tube-trailer. The capital expenditure is estimated to be $2 million. An-nual operating costs of $191,868 will support daily production of 225 kg of hydro-gen. The projected uptime of the P2G trailer station is 90%. During tube trailerexchanges and routine maintenance, hydrogen production will be injected intothe local natural gas pipeline. Existing hydrogen stations purchase hydrogen atwholesale rates between $6 and $12 per kg. The production of hydrogen for re-gional transportation may yield annual revenue of $794,307. Assuming completeutilization of the fuel, a payback period of two and a half years is expected.
The P2G station is in accordance with all federal, state, and local codes andregulations ensuring public safety. Thermal and pressure safety features as wellas real-time monitoring of all components ensures safe station operation.
1. INTRODUCTION
‘Stluputqu’ or ‘Swift Water’ as it was known by the native tribe describes the seriesof waterfalls in the heart of Spokane, Washington. A small diversion dam at thebase of the falls completed in 1890, 5 years before the Niagara Falls powerplant,is the longest running hydropower facility in Washington State. The neighboringRiverfront Park was constructed to celebrate this history for the 1974 World’sFair, the first environmentally themed World’s Fair. Washington’s Innovation forSustainable Energy Organization seeks to celebrate this storied location by im-plementing a Power-to-Gas system in Riverfront Park in the shape of a Mobius
2017-18 Hydrogen Student Design Contest 5

Project Mobius Washington Innovation for Sustainable Energy
strip – the continuous and cyclical geometry symbolizing the spirit of the 1974World’s Fair.
Launched at the 2017 World Economic Forum, the Global Hydrogen Council(GHC) was initiated by 13 international companies with the mission to furtherhydrogen in the world energy transition. The GHC released a roadmap for theadoption of hydrogen technologies that concludes: by 2050, hydrogen could meet18% of the world’s final energy demands, avoid 6 Gt of C02 emissions, i.e. 20%of C02 emission reduction targets by 2050, create a market with revenues by 2.5trillion dollars each year, provide 30 million jobs and reduce C02 in sectors liketransport, industry and residential by between 40% and 60% [14]. This effortparallels that of the United States Department of Energy’s H2@Scale initiative tofurther deep decarbonization of fuels [17].
Power-to-gas (P2G) systems offer a unique opportunity by utilizing the excessenergy to split water into hydrogen and oxygen gas. By utilizing an electrolyserand hydroelectric power, the hydrogen is cleanly produced, justifying its usageas a zero-emission technology. The resulting pure hydrogen gas has utility formany needs, including the fueling of zero emission, hydrogen powered vehicles.Hydrogen Fuel Cell Vehicles (FCVs) have seen an unprecedented 300% growthsince 2016 [13]. This corresponds to about 2,500 vehicles being sold or leased.However, by 2035 this number is expected to rise to 22.2 million [8]. By taking anaverage FCV traveling 10,000 miles a year, this translates to roughly 3.7 billionkg of hydrogen needed by 2035 [2]. Major infrastructure development is requiredto meet this estimated demand, making P2G a great option to supply this market.
Inland Washington has the most affordable low carbon electricity in the countrywith rates 50% below the national average [19]. 71% of the state’s electricity isprovided by hydroelectric, a clean and renewable resource. As of 2016, Washing-ton State provided 52% of the United States renewable power generation. Wash-ington offers a unique opportunity for intermittent production issues due to itsaccess to renewables, such as the Wild Horse Wind & Solar Facility, located incentral Washington that produces 273 MW of wind and 502 kW of solar, makingthe issue of intermittent energy production prevalent in the state. Unfortunately,the region lacks storage capacity or alternative revenue streams, such as theproduction of hydrogen from these intermittent sources [20][15]. The resourcesavailable have the potential to create an environment in which a local utility cantackle the challenges renewable intermittent energy sources present while creat-ing an opportunity to expand business into hydrogen based technology.
Avista Corporation is a local utility that provides power to the City of Spokane.Spokane offers a unique location for the Avista Corporation to expand its energymarket. Partnered together, the City of Spokane and Avista are working on anurban development project known as Urbanova to expand their smart-city districtin the center of the city to a more environmentally-stable zone [3]. The UrbanovaInitiative has given Avista the opportunity to utilize 576 kW from the existingUpper Falls plant for the purpose of creating an environmentally friendly bedrock
2017-18 Hydrogen Student Design Contest 6

Project Mobius Washington Innovation for Sustainable Energy
to promote the adoption of hydrogen-based technology.
This report proposes a P2G station located at Riverfront Park in Spokane, Wash-ington and examines the economic viability of this solution. The document willintroduce the station’s design, applicable codes and public interaction therein.The final outcome of this project is for the adoption of cleaner, zero-emissiontechnologies to not only drive down the world’s current C02 emissions, but pro-vide a stable platform to create growth in the hydrogen transportation market nototherwise seeing any investment.
2. SITING
The proposed site of the project, including all local and national codes and regu-lations, will be discussed in this section. A brief rationale will then explain whythe chosen site is beneficial. This section will include a detailed table for cor-rect setback distances for gaseous hydrogen systems, as well as the permittingprocess required by the City of Spokane.
The power-to-gas system has been sited at Riverfront Park in Spokane, WA forproximity to Spokane’s smart-city district and for public engagement and educa-tion. A single electrolyser can refuel a 280 kg compressed hydrogen tube-trailerin just over a day for distribution throughout the city. The specific station site willbe in the north-western section of Riverfront Park. The park is owned and main-tained by the City of Spokane, but shares land with the Avista Corporation thatmaintains the hydroelectric dams located around the park. Figure 1 referencesthe site location in respect to Spokane’s Smart City District. Figure 2 shows thesystem in proximity to the north-western corner of Riverfront Park.
Figure 1: P2G site location relative to Spokane’s Smart City District. The sitelocation is marked by a yellow star.
This location was not only picked for its access to power and water but for itslocation on the edge of Spokane’s developing smart-city U-district. When observ-
2017-18 Hydrogen Student Design Contest 7

Project Mobius Washington Innovation for Sustainable Energy
Figure 2: P2G system location in the north-western corner of Riverfront Park.
ing the system design, it can be seen that each ISO container forms the sides ofa equilateral triangle. This corresponds to the logo of the ‘74 Expo, based off ofthe Mobius strip. This was done in part to keep the spirit of the fair alive, as wellas promoting clean hydrogen technology within the Spokane region. With thesereasons and with being within reach of Avista’s monitoring station, this regionwas chosen as the primary site of this P2G station. Figure 3 gives a side viewrendering of the system.
Figure 3: Side view rendering of the site.
The implementation of the power-to-gas system on Riverfront Park was evalu-ated using the Site Planning Process from the City of Spokane in addition to the
2017-18 Hydrogen Student Design Contest 8

Project Mobius Washington Innovation for Sustainable Energy
Washington Administrative Code (WAC) and NFPA 55. The WAC provides codesand regulations that are specific to the State of Washington and are generally inaddition to, or more limiting than national regulations. Therefore, if the power-to-gas system abides by the WAC, it also abides by national regulations and likelyabides by all other state regulations. NFPA 55 encompasses codes surroundingimplementation of hydrogen systems. Units in this section will be expressed infeet and cubic-feet to be consistent with local regulations and permits.
The City of Spokane has a regulated commercial permitting process for new con-struction. This process encompasses multiple steps and requirements that mustfall under the city’s Plan Review and must comply with the city’s ComprehensivePlan and applicable building, mechanical, electrical, plumbing, fire, and energycodes. Upon application submission and payment of appropriate fees throughSpokane Business & Development, the project plans and supplemental reportsare forwarded to 11 separate agencies located at Spokane City Hall for review ofthe various reports. Upon acceptance, a building permit may be granted [18].
The Washington Administrative Code (WAC 296-24-31503) (apps.leg.wa.gov 2017)provides the specific requirements for gaseous hydrogen system design, location,site considerations, operations, and maintenance that must be met in the state ofWashington. This code is in addition to standards set forth by NFPA 55 and NFPA2. The P2G station also falls under WAC 296-24-31503 regarding gaseous hydro-gen systems because of the storage of compressed hydrogen gas in the systembuffer storage. All internal plumbing, sensors, pressure relief, and ventilationcomponents included with the system fall in accordance with NFPA 55 and localWAC requirements. Each of the regulations is determined based on the volumeor size of the hydrogen storage tanks in cubic feet. Table 1 shows the requiredsetback distances for the storage tank used in this P2G station.
Table 1: Minimum distance (in feet) from gaseous hydrogen system to exposurefrom Table H-2 of WAC-294-24-31503
Types of Exposure Description Gaseous HydrogenStorage ( < 3,000CF )
Air compressorintakes or in-lets to ventilatingor air-conditionequipment
N/A 50
Concentration ofpeople*
N/A 25
Public sidewalks N/A 15* In congested areas such as offices, lunchrooms, locker rooms, time-clock areas,and places of public assembly.
2017-18 Hydrogen Student Design Contest 9

Project Mobius Washington Innovation for Sustainable Energy
Further information for set-back distances of gaseous hydrogen systems can belocated from Table H-2 of the previously stated standard (WAC-294-24-31503).
Figure 4 shows a diagram of the site with the required setback distances fromthe power-to-gas station. The site has existing electric and water infrastructure,and is within 100 feet of a city roadway.
Figure 4: Site layout on the Riverfront Park grounds showing setback distancessurrounding the P2G station.
This power to gas station adheres to state WAC regulations, has access to boththe required electricity and water infrastructure, and meets the local conditionsand requirements set forth by the City of Spokane.
2017-18 Hydrogen Student Design Contest 10

Project Mobius Washington Innovation for Sustainable Energy
3. DESIGN DATA & EQUIPMENT DRAWINGS
The P2G system centers on an electrolyser that derives its electricity from 576kW of power produced from local hydroelectric turbines. The hydrogen generatedfrom the electrolyser will be used to fill a 280 kg tube trailer or injected into the lo-cal natural gas grid. The major equipment, hydrogen utilization, and monitoringsystem will be discussed in this section.
3.1 ELECTRICITY TO HYDROGEN CONVERSION
Hydrogen gas will be produced with a PEM electrolyser using water supplied bythe City of Spokane and electricity supplied by Avista. The HGas system utilizespolymer exchange membrane (PEM) electrolysis technology the main componentsof which are a polymer membrane that is selectively permeable to hydrogen andwater, and two electrodes. Applying an electric potential to the electrodes splitswater at the anode into its constitutive elements: hydrogen and oxygen. Thehydrogen ions diffuse through the membrane where they combine with electronsto form hydrogen gas. Several membrane electrode assemblies are stacked inelectrical series to produce the desired amount of hydrogen. Figures 5 and 6shows the process of electrolysis and a PEM stack.
Figure 5: PEM Electrolysis Diagram.
2017-18 Hydrogen Student Design Contest 11

Project Mobius Washington Innovation for Sustainable Energy
Figure 6: PEM Electrolyser Stack
The specifications of the PEM electrolyser system for this project are listed belowin Table 2.
Table 2: Electrolyser system specifications
Specification Data# PEM stacks 1Maximum power use 672 kWNominal power use 550 kWMaximum hydrogen generation 267 kg/24hrNominal hydrogen generation 225 kg/24hrHydrogen generation pressure 20 barSystem efficiency range 53-60 kWh/kgSystem efficiency at nominal opera-tion
58.5 kWh/kg
Ambient temperature range -15 to 40 (oC)Buffer storage tank pressure rating 20 barBuffer storage volume 15 m3
2017-18 Hydrogen Student Design Contest 12

Project Mobius Washington Innovation for Sustainable Energy
The components of the PEM electrolyser system includes an on-board powertransformer, water and hydrogen purifier, gas separator and control system. Thepower system converts alternating current to direct current and regulates thepower to all components. A purification system ensures the city water supply doesnot contaminate the PEM stack. The hydrogen produced is extracted through awater and gas separator to the appropriate fuel cell grade of 99.999%. A controlsystem controls the feedstock water flow, exhaust oxygen flow, the gas and waterseparator, the power system, and the hydrogen system. The control system isalso used to monitor the components, determine if a fault has occurred and per-form further analysis, automatically reconfigure the system, alert an operator, orshut the system down for maintenance or repair. Figures 7a and 7b include aschematic of the system components [11].
(a) Right Side (b) Left Side
Figure 7: PEM electrolyser System
3.2 EQUIPMENT
3.2.1 Power Generation
The systems power needs are met by utilizing existing hydroelectric turbines thatare run and operated by Avista Corporation. There are currently two hydroelectricdams within close proximity of the specified site, which are shown with a yellowand red circle in Figure 8. These local, environmentally friendly power sourcesinclude a single 10 MW capacity Francis Turbine [16], located at the Upper FallsDam, and a 14.8 MW capacity Kaplan Turbine [16], located at the Monroe StreetDam site. The power produced from the turbines are sent to the electrical grid.An Avista representative has helped to determined that 576 kW of power can bedrawn from the Upper Falls Dam for use. Therefore, using this pre-existing powersource helps to lower the project’s environmental impact, while still meeting theelectrical needs of the system.
2017-18 Hydrogen Student Design Contest 13

Project Mobius Washington Innovation for Sustainable Energy
Figure 8: Riverfront Park Map with (a) red circle: Location of Upper Falls 10 MWsubterranean Francis Turbine, (b) Yellow circle: Location of Lower Falls 14.8 MWKaplan Turbine, (c) Blue circle: Planned Site Location.
3.2.2 Hydrogen Compression
Compression needed for safe and efficient fueling of the tube-trailers will be donewith a hydrogen-rated compressor capable of inlet pressures as low as 7 bar andas high as the needed 250-bar to fill tube-trailers. The compressor is capableof handling the entirety of the electrolyser’s output. This system will be locatedwithin the same ISO container as the buffer storage, decreasing the amount ofpiping needed between the systems.
3.2.3 Connections, fittings & piping
All tubing, connections and fittings will be constructed from certified 316 Stain-less Steel to avoid embrittlement. The electrolyser, compressor and buffer storagewill all be connected with 1
4” 316 SS tubing. All fittings between components will
be Swagelok VCR fittings to provide maximum leak protection.
The dispensing unit will be equipped with a Staubli GMV 09 Nozzle, which hasbuilt in safety features when not connected. These nozzles only allow hydrogen tobe dispensed when connected to a tube-trailer and are in accordance with SAEJ2600.
All water resources will be directly transported from the city’s water main to theelectrolyser via schedule 40 3
4” piping
2017-18 Hydrogen Student Design Contest 14

Project Mobius Washington Innovation for Sustainable Energy
3.3 GAS TRANSPORTATION AND STORAGE
3.3.1 Truck Transport
After leaving the electrolyser, hydrogen will enter the system’s buffer storagewhere it will wait to be fed into the system’s compressor. After being compressedto 250-bar, the hydrogen will flow to a dispensing unit just off-site. The hydrogenwill be dispensed to an industrial gas supplier’s tube-trailer. In general, thesetrailers storage capacity ranges from 250 kg - 280 kg. The tube-trailers will beowned and maintained by separate industrial gas companies and will not be oper-ated by Avista. These trailers will then have the capability of delivering hydrogenthroughout the Spokane region. This increased supply of clean, renewable hydro-gen enables the adoption of hydrogen fueled cars, buses and other fleet vehiclesused in the city. A tube-trailer could be filled every 27 - 30 hours, depending onthe size of the available storage. Expected downtime between fueling is 10 to 30minutes in an ideal scenario.
Typical hydrogen tube-trailers are rated to carry 18 to 60, 20.5 ft long tubes,which can store 25,395 to 84,668 cf of hydrogen. Hydrogen tube trailers rangefrom 24’ to 28’ and can weigh between 17,500 to 48,000 pounds. All tubes mustfollow DOT 3A/3AA-2400 for pressurized gas cylinders [10].
The tube-trailer will be parked 250 ft. to the south-west of the station, in aparking lot where it can fill. Figure 4 shows the parking lot and the truck route.
A dispensing unit will be available just off-site and will offer self-service to thetrained tube-trailer drivers. Upon arrival of the trailer, the main cab will detachand leave the trailer for fueling overnight. The tube trailers fill from the compres-sor through the dispensing nozzle.
3.3.2 Natural Gas Pipeline Injection
The hydrogen produced by the P2G station will be injected into the natural gaspipeline when it is not being used to fill a tube trailer. The amount of hydrogeninjected into the gas grid will not exceed 20%. This limitation is based on valuesprovided by the National Renewable Energy Laboratory [7], and is in place toprevent increased risk of ignition. The injection of hydrogen into natural gaspipelines will aid in reducing carbon emissions. This equates to a savings of$3/kg of injected hydrogen for Avista. Hydrogen injection into the gas grid willserve both residential and commercial customers. Direct injection of hydrogeninto the gas line was chosen over methanation because it is more cost efficient,requires less processes, and is overall more sustainable.
2017-18 Hydrogen Student Design Contest 15

Project Mobius Washington Innovation for Sustainable Energy
3.3.3 Hydrogen Storage
The system’s buffer storage is contained within a 20’ ISO container. The systemhas a capacity to store 530 cubic-feet (15 m3) of hydrogen at 20 bar, just over 2.5hours’ worth production capacity. This translates to 24.5 kg within the vessel.The storage tank meets NFPA 2 for gaseous hydrogen storage and is equippedwith pressure sensors and relief valves in case of over pressurization.
3.4 COMMUNICATIONS EQUIPMENT
3.4.1 Communication & monitoring systems
This system, as seen in Figure 9, is designed to run completely autonomously. Au-tonomy requires installation of a control system which is able to transmit currentsensor data, report on system faults, and manage emergency system shutdowns.
The heart of the control center for this system will be a programmable logic con-troller (PLC). To facilitate messaging with Avista employees, the center will beequipped with a remote monitoring system, seen in Figure 10, and cellular up-link that will alert Avista of any warnings or alarms.
Figure 9: Remote monitoring system.
2017-18 Hydrogen Student Design Contest 16
Project Mobius Washington Innovation for Sustainable Energy
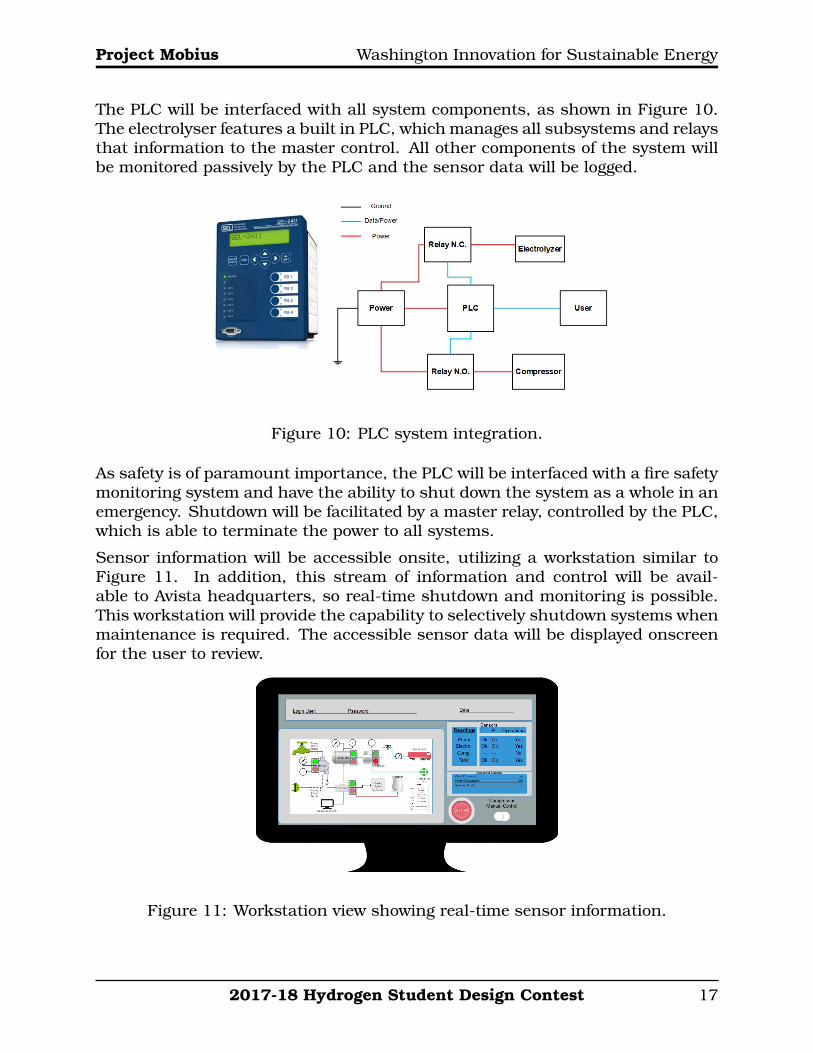
The PLC will be interfaced with all system components, as shown in Figure 10.The electrolyser features a built in PLC, which manages all subsystems and relaysthat information to the master control. All other components of the system willbe monitored passively by the PLC and the sensor data will be logged.
Figure 10: PLC system integration.
As safety is of paramount importance, the PLC will be interfaced with a fire safetymonitoring system and have the ability to shut down the system as a whole in anemergency. Shutdown will be facilitated by a master relay, controlled by the PLC,which is able to terminate the power to all systems.
Sensor information will be accessible onsite, utilizing a workstation similar toFigure 11. In addition, this stream of information and control will be avail-able to Avista headquarters, so real-time shutdown and monitoring is possible.This workstation will provide the capability to selectively shutdown systems whenmaintenance is required. The accessible sensor data will be displayed onscreenfor the user to review.
Figure 11: Workstation view showing real-time sensor information.
2017-18 Hydrogen Student Design Contest 17

Project Mobius Washington Innovation for Sustainable Energy
3.4.2 Safety Equipment
The PEM system that will be put in place has automatic safety features, includingautomatic shutoff. There will be hydrogen detectors present outside of the elec-trolyser and along the pipes where hydrogen will be flowing to detect any leakage.There will also be cameras with night time lighting so that all parts of the systemcan be seen at any time to deter vandalism. The monitoring system mentionedpreviously will not only have an automatic shutoff feature, but will also have afire suppression system, a temperature monitoring system, a pressure monitor-ing system, pressure relief valves and an alert system, all of which are specifiedin Table 3. There will be relevant safety personnel (firemen, policemen, and spe-cialized Avista personnel) informed automatically with the specifics about what isgoing wrong with the system. Other Avista employees responsible for the systemwill also be automatically contacted. The public will be notified through flood-lights and an alarm telling them to evacuate the area. A small fence will also beplaced around the perimeter to comply with set-back distances set in Table 1.
3.5 HYDROGEN USE
3.5.1 Vehicle Refueling
Hydrogen will be used to fill tube-trailers that are owned by industrial gas com-panies. This allows these companies to provide hydrogen to the local market andenables the distribution of hydrogen to consumers for FCVs and hydrogen pow-ered buses.
3.5.2 Natural Gas Pipeline Injection
When the tube-trailers are not filling, the hydrogen will be injected into the city’snatural gas grid. This increases the lower heating value of the hydrogen-naturalgas mixture, allowing for cleaner burning natural gas.
3.6 EQUIPMENT FOOTPRINT
Table 3 shows the footprint of all major components in the design of the P2Gstation. All components self-contained within ISO containers will be omitted
Table 3: Major component footprints.
Equipment Dimensions(L,W,H)
Weight (lbs)
20’ ISO Container 20’,8’,8’6” 5,050Electrolyser 20’,8’,8’6” 7,000Buffer Storage 15’,3’,3’ 6,000Natural Gas Mixing Plant 8’,5’,5’ 2,500
2017-18 Hydrogen Student Design Contest 18

Project Mobius Washington Innovation for Sustainable Energy
4. COST AND ECONOMIC ANALYSIS, COMMERCIAL VIABILITY
The P2G station’s economic success depends on the system’s capital costs, profitmargin and projected return on investment. A detailed analysis for the station’scommercial viability is given below.
4.1 OPERATING COSTS
The monthly operating costs associated with the power to gas plant are providedin Table 4.
Table 4: Fixed monthly costs
Expense Item Monthly Cost*Power 8,415.33Water 1,083.33Maintenance 6,652.75Total 16,112.08
* Costs are approximate based on nominal use.
The monthly water demand is based off of needed input into the electrolyser andis purchased from the City of Spokane. All maintenance is based on estimatesprovided by the major equipment manufactures. The annual maintenance cost ofthe electorylser components is 4% of the capital cost. All other components areapproximated to have a maintenance cost that is 10% of their capital cost. Thecost of hydropower provided by Avista is expected to be $0.2/kWh.
4.2 CAPITAL COSTS
Table 5 provides an itemized list of all the system components which representsthe capital cost for the power to gas plant. These costs were obtained by get-ting quotes from each manufacturer. The estimated capital cost of the station is$1,967,680.
2017-18 Hydrogen Student Design Contest 19

Project Mobius Washington Innovation for Sustainable Energy
Table 5: Itemized list of station.
Equipment Manufacturer Qty. Cost*(ea.) TotalElectrolyser ITM Power 1 1,316,643 1,316,643Hydrogen Compressor Hydropac 1 25,000.00 25,000.00Compressor Control & Piping Hydropac 1 29,000.00 29,000.00H2 Dispensing Nozzle Saubli 1 10,947.00 10,947.00Dispensing hose WEH 1 1,948.00 1,948.00Natural Gas Mixing plant NetzDienste 1 300,000.00 300,000.00Natural Gas Piping (feet) McMaster-Carr 810 9.87 8,000.0020’ ISO Storage Units Port Containers
LLC1 4,900.00 4,900.00
Buffer Storage Fibatech 1 100,000 100,000SS Tube Fitting Swagelok 5 11.80 59.00SS Tube Fitting, 90o UnionElbow
Swagelok 5 17.08 85.40
Medium Pressure Tube Fit-ting, 90o Union Elbow
Swagelok 5 95.85 479.25
Medium Pressure Tube Fit-ting
Swagelok 2 82.08 164.16
SS Tubing (feet) McMaster-Carr 250 20.58 5145.80Pressure Sensors Omega 4 250.00 1000.00Temperature Sensors Omega 1 33.00 33.00Hydrogen Sensors Honeywell 3 240.53 721.59Pressure Relief Valves Swagelok 1 155.00 155.00Fire Control Panel Fire-Lite 1 608.56 608.56Remote Annunciator Silent Knight 1 179.95 179.95Multi-Sensor Detector Fire-Lite 3 59.00 177.00Speak-Strobe Fire Alarm Wheelock 6 75.00 450.00Fire Suppression System Cease Fire 5 1095.00 5475.00Video Surveillance VideoSurveillance.com1 3499.00 3499.00Lighting Utilitech Pro 6 69.98 419.88Sound Barrier Sheets (sq.feet)
Audioseal 135 2.44 330.00
Sound Masking Generator Atlas Sound 1 214.36 214.36Installation Fees Hired Contractor 1 150,000 150,000.00Fees and Permits City of Spokane 1 2,045.80 2,045.80Total 1,967,680
* In congested areas such as offices, lunchrooms, locker rooms, time-clock areas,and places of public assembly.
2017-18 Hydrogen Student Design Contest 20

Project Mobius Washington Innovation for Sustainable Energy
4.3 ECONOMIC ANALYSIS
The main two revenue streams proposed for this system are hydrogen injectioninto the natural gas grid and hydrogen fueling of tube-trailers, valued at 3/kgand6-12/kg, respectively.
The commercial viability of the proposed power-to-gas system is a necessary com-ponent of the project’s success. Commercial viability depends on the required rateof return and the market demand at the necessary prices. Since the rate of returndictates the minimum allowable price Avista will accept, there is a price floor andcorresponding demand that dictates which prices provide an acceptable return.
In this case, Avista faces a maximization problem in which they must choose pricep to maximize profits. The decision is complicated by two factors. The first is thatany hydrogen not sold can be injected into natural gas pipelines, serving as analternative market to absorb excess hydrogen production. Hydrogen injected intothe natural gas pipelines has a value equivalent to $3 per kilogram. The secondis that estimating the demand function in a nascent market with few actors isnotoriously difficult, more so in the case of fuel.
The first issue is addressed directly in formulating Avista’s profit maximizationproblem as a choice of optimal price p, which has the form
{pt} = argmax{pt}
T∑t=0
[ptq(pt) + 3(Q− q(pt))− cQ] (1− δ)t − c0,
where pt is the price of hydrogen set by the owner at time t, q(pt ) is the annualdemand for hydrogen as a function of price pt, Q is the total annual productionof hydrogen, c is the marginal cost of production, and c0 is initial capital costs.Due to the project guidelines, the return on investment cannot exceed ten years.The discount rate is given by δ and is set at 6%.
The above equation captures the profit dynamic that in each year total hydrogenQ is produced, at operating cost cQ. Avista chooses pt and sells q(pt) for a profitof pq(p), and injects the remaining (Q-q(p)) earning $3 per kilogram injected.
Since we assume a time-invariant demand function, we can simplify the aboveequation to
p = argmax{p}
T [pq(p) + 3(Q− q(p))− cQ]− c0,
with the solution being the price that solves T[q(p) + (p− 3)∂q(p)
∂p
]= 0.
It remains to estimate the demand function q(p). Currently hydrogen providers inthe Spokane area manufacture hydrogen in California and transport it to Spokaneat an estimated cost of $12-15 per kilogram. Assuming a competitive market,hydrogen providers will find it more profitable to purchase hydrogen from the P2Goperator and demand will exceed total supply Q. However, above $15 hydrogenproviders will find it more profitable to obtain hydrogen from outside the Spokane
2017-18 Hydrogen Student Design Contest 21

Project Mobius Washington Innovation for Sustainable Energy
region. We therefore estimate demand q(p) as a function of total production andof price, where
q(p) =
Q if p < 1215−p3Q if 12 ≤ p ≤ 15
0 if p > 15
With this estimate of demand, the optimal price choice set by Avista is $12, yield-ing profit of T[12Q-cQ]-c0. Given capital costs of $1,967,680 and annual operatingcosts of $191,868 as shown in Table 5, annual profits are estimated at $794,307.Of annual operating costs, $12,177 are from consumed water and $100,984 arefrom consumed electricity, with the remainder being maintenance and operatingcosts of the P2G system. The net present value of total profit over ten years is$3,773,858. The sharp profit-maximizing price point is due to the price rangeson estimates of current costs to transport hydrogen.
4.4 COMMERCIAL VIABILITY
An assessment of the commercial viability of a project depends not just solelyon its profits, but also on its profits relative to potential profits of other similarprojects. For this reason, a useful metric is return on investment (ROI), definedas the ratio of total profits and initial costs. Figure 12 shows the correspondingROI at different price points given the estimated demand function. The shadedarea comprises the range of annual demand from 50-100% of total productionbased on price.
Figure 12: Return on investment with varying demand in response to price.
At 100% of estimated demand, ROI is positive for a price point between $5.67/kgand $14.27/kg. The sharp decrease in ROI above the $12/kg reflects rapidlydeclining demand as wholesalers obtain their hydrogen from elsewhere.
2017-18 Hydrogen Student Design Contest 22

Project Mobius Washington Innovation for Sustainable Energy
At 50% of estimated demand the pattern is similar, except that the P2G ownermust charge at least $8.33/kg and less than $13.42/kg in order to earn a positiveROI. These two scenarios provide a range in which to consider prices in lightof demand uncertainty. The minimum price should be between $5.67/kg and$8.33/kg and the maximum price should be between $13.42/kg and $14.27/kgbased on the P2G owner’s expectations of demand. Since price is maximizedat $12/kg, the P2G owner can expect a positive ROI for even 50% of the initialestimate of demand.
Given the uncertainty involved in a nascent market and the paucity of data oncurrent hydrogen prices, an alternative approach is to consider the price neces-sary to reach a certain ROI given a level of demand. Figure 15 shows the pricenecessary to achieve a specified ROI for a given demand level ranging from 0-100%of total hydrogen production.
To the extent that the estimate of the demand function is correct, namely thatwholesalers will be willing to buy hydrogen at prices up to $12/kg, Figure 13represents the matrix of price decision choices and the ROI that can be expectedgiven a fixed level of demand. At a maximum price of $12/kg, ROI is positive forany level of demand above 29% of annual production. At $5.73/kg, a positiveROI is achieved if demand meets total production levels.
Figure 13: Price needed to reach a specified return on investment given stablenon-price dependent demand.
2017-18 Hydrogen Student Design Contest 23

Project Mobius Washington Innovation for Sustainable Energy
5. SAFETY ANALYSIS & CODES AND STANDARDS
All components in the system are required to abide by city, state and federal codesand regulations.
5.1 FMEA
The system is analyzed for possible subsystem failures through a process knownas Failure Mode and Effect Analysis (FMEA). The purpose of FMEA is to reduce,if not completely resolve, all failures in a system. Understanding each key compo-nent’s function as well as what their vulnerabilities are such as potential powerloss, vandalism, or human error, plays as important a step in system design forimprovement. This method has been a highly effective avenue of analysis sincethe 1950s and is still heavily practiced to this day.
FMEA, again, ranks potential failures in a system and does so by calculating theRisk Priority Number (RPN). The RPN is the value assigned to a component tomeasure the its importance when considering failure; the greater the value ofthe RPN, the greater the need to develop the appropriate precautions to mitigateits failure. RPN is calculated by taking the product of three assessed actions:Severity, Occurrence, and Detection.
Severity (SEV) measures the impact, not only on the component itself but, on thesurrounding components/environment. SEV is scaled, typically, from 1 to 10,10 being the most hazardous the outcome, should failure become a reality. Oc-currence (OCC) measures a systems probability of failure within certain periodsof time. Whether the component will likely fail within a week’s time, requiringextra preventive measures, or is likely to fail within a year. OCC is scaled from1 to 10, 10 being the most probable to fail within a small period of time. Detec-tion (DET) measures the likelihood of noticing failure once it has occurred. Thisis also scaled from 1 to 10, 10 being practically impossible to detect the failure.Figure 14 provides brief explanations of the criteria used to determine each rank.Typically, FMEA’s categorize the scale with color: 1-2 (Green), 3-7 (Yellow), and7-10 (Red).
Figure 14: Explanation of Ranking Criteria for all components for an FMEA
2017-18 Hydrogen Student Design Contest 24

Project Mobius Washington Innovation for Sustainable Energy
Understandably, the dispensing system has the highest RPN, primarily becauseof the fact that the dispenser is relatively dependent upon all other subsystems.Without the electrolyser, the nozzle would still dispense to the extent of the buffertanks remaining contents. However, once this buffer tank emptied, the systemwould not be able to dispense. Without the compressor active, the system wouldbe able to dispense, but never to fill a tube tank entirely. These are only a fewexamples towards the point that the dispensing system has the greatest risk offailing. Provided the dispensing nozzle is damaged during fueling, the monitoringsystem would signal the automated flow valve to close. The second highest RPNresides with the monitoring system. Disabling this component would prohibit theability of remotely deactivate the systems safety measures. The monitoring systemis key because it controls the entirety of the facility. The primary way this wouldfail would be through power loss. The third and final RPN is the electrolyser. Thiscomponent is intended to be constantly running at full capacity for long periodsof time. Failure of the electrolyser is more of an inconvenience than a serioussafety concern.
These three high RPN subsystems have the potential to bring about inconve-niences. To avoid failure of any of the components listed, check-ups and dailymonitoring are advised with the suggested time intervals provided in Figure 15under the Prevention column.
Figure 15: FMEA for Power to Gas Subsystem
2017-18 Hydrogen Student Design Contest 25

Project Mobius Washington Innovation for Sustainable Energy
6. REGULATIONS, CODES AND STANDARDS
Development of a power-to-gas system must adhere to numerous regulations froma variety of local and national regulatory agencies. Table 6 below describes saidregulations that were employed and how they are applicable to a power-to-gassystem in a public space. Any exemptions for hydrogen are reported in Table 7.
Table 6: Applicable regulations used in the development of the P2G station.
Application Prevention Strategy Applicable Regula-tions
Setback dis-tances
The System will be placed within ac-ceptable range of any street, river orbuilding that complies with regula-tory codes.
WAC 296-24-31503,NFPA 55, OSHA Stan-dard 1910.103
Fire-resistantmaterials
Interior fire-resistant materials willline the interior of the system, pre-venting catastrophic failure due tofire.
ASTM E84, ASTME136, NFPA 55, UL454
Hydrogen Dis-pensing
The tube trailers and nozzles willcomply with the appropriate pressureclass to avoid overpressurization orleakage.
SAE J2600, SAE TIRJ2799
Tanks and piping All tanks and piping will comply andbe rated to gaseous hydrogen.
NFPA 2, NFPA 704,OSHA Standard1910.103, WAC 296-24-31503, ANSIB31.1-1967, ANSI31.3-1966
Signage Applicable signage will be posted onand around the system to inform thepublic.
NFPA 55, NFPA 704,OSHA Standard1910.103, WAC 296-24-31503
Electrical equip-ment
The electrical systems will communi-cate with monitoring to ensure con-tinued nominal operation.
NFPA 55, OSHA Stan-dard 1910.103, NECArticle 840, 800.173,800.93-A, and 514
Safety equip-ment
The sub-systems will be outfittedwith correct sensors and valves tomitigate any overpressurization orfailure.
NFPA 55, NFPA 68,WAC 296-24-31503
Exposure limits Hydrogen is a non-toxic substance,making exposure a non-issue.
Non-applicable un-der OSHA Standard1910.103
2017-18 Hydrogen Student Design Contest 26

Project Mobius Washington Innovation for Sustainable Energy
Table 7: P2G station regulation exemptions
Regulation ExplanationEmergency Planning and Commu-nity Right-to-Know Act (EPCRA), 40CFR
Gaseous hydrogen is not a toxic ma-terial and is exempted from reportingrequirements under Section 3012 ofEPCRA.
7. OPERATION & MAINTENANCE
For a P2G station, it is common practice that the subsystems run autonomouslyfor as long as possible. Good practice does include an operation team nearby oronsite to monitor a systems function. P2G systems are expected to operate forlong periods of times and are simple to maintain or repair. The necessity of thisis to optimize the limit of operational downtime
7.1 OPERATION
The Power to Gas system is designed to run autonomously, with the functionalityto switch between tube tanker dispensing, and injection into the natural gas grid.This two-state system involves running the electrolyser continuously, while theremaining components are controlled by the monitoring system.
The electrolyser includes an onboard PLC, whose schematic is shown below inFigure 16. It has been designed with autonomy in mind, with the ability to man-age all input and outputs of the system, and will feed information back to themonitoring system. In addition, it can shut the electrolyze down in the event of acritical failure, and send an alert to the monitoring system.
Figure 16: An onboard PLC schematic
2017-18 Hydrogen Student Design Contest 27

Project Mobius Washington Innovation for Sustainable Energy
The remaining system is controlled by the monitoring system. It is designed suchthat when hydrogen is being drawn by the dispensing station, the flow intendedfor blending into the gas line will be shut off, shifting flow into the compressor.The compressor will then be kicked on, and the tube trailer filled. When thetanker is filled, a pressure sensor will report back to the monitoring system, andthe above procedure will be reversed.
The minimum operational state of the system will be when hydrogen is no longerbeing dispensed to a tube tanker. In this phase, the compressor will be offline,extending the life of the unit through the reduction of wear. The hydrogen flow willnot be curtailed, and will be mixed into the natural gas line at the same pressureas the 20 bar electrolyser outputs.At peak output, all components will be use the entirety of the available power fromthe turbine. Peak operation will be functioning just over a day in length, whichis the estimated fill time of a tube truck. In this state, the pump is expectedto need replacement every 4 years, while the electrolyser and compressor are20 years. The buffer tank, piping, and all valves have lifetimes near to or morethan the electrolyser and compressor, and are expected to outlive the proposedinstallation.
7.2 MAINTENANCE
This system will have a monthly maintenance schedule, where the system is shutdown for 1-2 days, dependent on if seals, fittings, or other easily replaceablecomponents are required. This monthly servicing will involve employees of Avistaperforming inspections of the compressor, electrolyser, pump, and dispensingstation. Components which are to be entirely serviced by Avista are the buffertank, fittings, valves, and the dispensing station. In the event of the monitoringsystem detecting a pressing problem, an inspection regime will be implementedimmediately so that repairs can be completed.
From time to time, maintenance will be required on the critical electrolyser andcompressor systems. A maintenance cycle on the compressor and electrolysersystem will be dictated by the chosen compressor and electrolyser models, andthe type of service contract taken out by Avista.
2017-18 Hydrogen Student Design Contest 28

Project Mobius Washington Innovation for Sustainable Energy
8. ENVIRONMENTAL ANALYSIS
Because the proposed system operates using only water and electricity collectedfrom existing turbines in the Spokane River, there will be no carbon emissionsfrom the production of hydrogen. The only outputs will be hydrogen gas and oxy-gen gas from the electrolyser, however emissions from the tube trailers used totransport the hydrogen will also be considered. There will also be emissions asso-ciated with the development of the needed infrastructure, such as power, naturalgas, and water lines, as well as expanding the nearby parking lot to accommodatetube trailer parking. Also discussed is the noise impact the system will have onthe nearby surroundings. Because the site is in a public park, it is importantit does not have an adverse impact on the residential population, while meetingall codes and regulations set by the city of Spokane and the state of Washington.In this section, the resources, emissions, and noise associated with the system’soperation will be further discussed.
8.1 RESOURCE ANALYSIS
The only resources that will be consumed during the operation of the system arewater, by the electrolyser, and electricity, used to power the pump, electrolyser,and compressor. The water will be provided through piping connecting the systemto main water lines just to the east. The electricity will be routed to the facilityfrom power lines just to the south of the site, which are fed by the electrical grid.The extra electricity produced by the turbines is currently curtailed and can bereadily connected to the P2G system. Through its utilization, the P2G systemwill turn waste electricity into a clean fuel source for the city. The electrolyserand compressor consume a total of 580 kW of electricity nominally, which canbe reduced to 576 kW by slightly reducing the performance of the electrolyserin order to be fully fueled by the extra electricity. The natural gas in the city’slines are being omitted as a resource as it is produced and upheld by Avista. Thetube trailers that are being filled will be provided by a third party and were notincluded in the resource analysis, however their emissions will be considered.
8.2 EMISSION ANALYSIS
With the P2G system utilizing a net-zero emission turbine, and only producingoxygen and hydrogen first hand, there are virtually no carbon emissions result-ing from the facility itself. The produced hydrogen is collected and ultimatelypurchased by third parties, for purposes such as manufacturing, chemical pro-duction, or use as a fuel source. Hydrogen will also be injected into a natural gasline at up to 20%-volume of the total gas feed to supply homes and businessesthroughout the city. Because hydrogen produces only water when combusted,the overall carbon emissions associated with burning the natural gas blend overpure natural gas is reduced by about 8%, while increasing energy output [5]. As aresult, residents will be burning cleaner, more efficient natural gas in their homes
2017-18 Hydrogen Student Design Contest 29

Project Mobius Washington Innovation for Sustainable Energy
and businesses. The oxygen is non-polluting and will be vented directly into theatmosphere as it is produced, at a rate of 1800 kg of O2 per day.
The hydrogen tube trailers used for transportation will be owned and operatedby an industrial gas supplier. Typical tube trailers get an average of 6.5 miles pergallon of diesel and the resulting greenhouse gas emissions are summarized inFigure 17, depending on the average speed of the tube trailer [1].
Figure 17: The greenhouse gas emissions of tube trailers at speeds from 0-70mph
2017-18 Hydrogen Student Design Contest 30

Project Mobius Washington Innovation for Sustainable Energy
8.3 NOISE ANALYSIS
The only appreciable noise generated by the P2G system will be from the oper-ation of the electrolyser and compressor, with the compressor being the loudestcomponent. The noise provided by the electrolyser and compressor in tandem isestimated to be about 70 decibels within 10 meters of the system. To mitigatethis, several steps will be taken to cancel out as much of the noise as possible.The electrolyser and compressor are both shipped in steel containers, which whenclosed will dampen the majority of the noise. Also, noise canceling foam will beused to line the steel containers along with the operation of a white noise ma-chine. As a result, the noise released to the environment will be minimal, andwill meet all of Spokane City’s noise regulations and codes set by WAC 173-60-040 [12]. This system falls under class B regulations which state it must remainunder 65 decibels to stay within the maximum permissible environmental noiselevels. Riverfront Park is closed from the public between midnight and 5 AM sothere is no concern of disturbance during these hours. The necessary steps havebeen taken to ensure the welfare of the Riverfront Park public in Spokane in orderto maximize their comfort.
A PROMISING FUTURE FOR WASHINGTON STATE
This project would increase Washington’s potential to be a leader in the hydrogenfueling world. Currently most of the hydrogen produced is not used for fuelingvehicles and much of Washington’s hydrogen is provided by the state of California.With the movement towards clean energy this will put Spokane ahead of the curveand will catalyze the adoption of clean energy technologies within Washington andpossibly around the United States. This project has the potential to offset 2005metric tons/ year of carbon dioxide which is equivalent to the emissions of 430gasoline powered passenger vehicles.
2017-18 Hydrogen Student Design Contest 31
Project Mobius Washington Innovation for Sustainable Energy
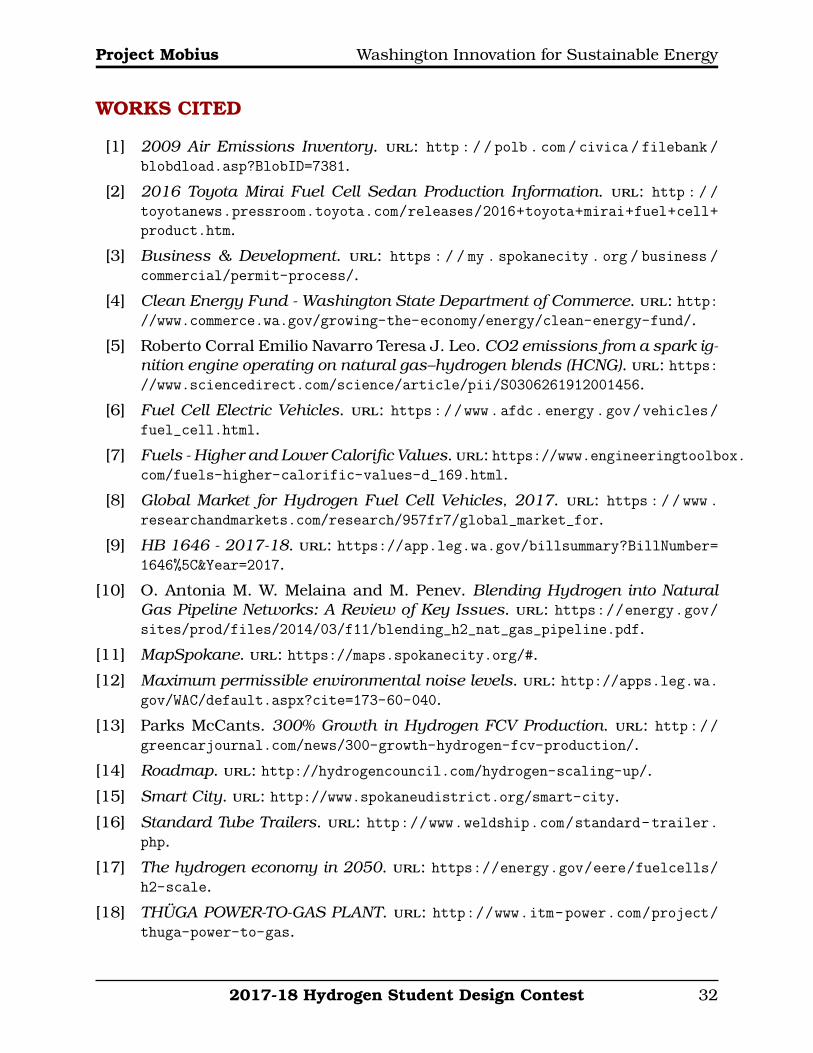
WORKS CITED
[1] 2009 Air Emissions Inventory. url: http : / / polb . com / civica / filebank /
blobdload.asp?BlobID=7381.[2] 2016 Toyota Mirai Fuel Cell Sedan Production Information. url: http : / /
toyotanews.pressroom.toyota.com/releases/2016+toyota+mirai+fuel+cell+
product.htm.[3] Business & Development. url: https : / / my . spokanecity . org / business /
commercial/permit-process/.[4] Clean Energy Fund - Washington State Department of Commerce. url: http:
//www.commerce.wa.gov/growing-the-economy/energy/clean-energy-fund/.[5] Roberto Corral Emilio Navarro Teresa J. Leo. CO2 emissions from a spark ig-
nition engine operating on natural gas–hydrogen blends (HCNG). url: https://www.sciencedirect.com/science/article/pii/S0306261912001456.
[6] Fuel Cell Electric Vehicles. url: https://www.afdc.energy.gov/vehicles/
fuel_cell.html.[7] Fuels - Higher and Lower Calorific Values. url: https://www.engineeringtoolbox.
com/fuels-higher-calorific-values-d_169.html.[8] Global Market for Hydrogen Fuel Cell Vehicles, 2017. url: https : / / www .
researchandmarkets.com/research/957fr7/global_market_for.[9] HB 1646 - 2017-18. url: https://app.leg.wa.gov/billsummary?BillNumber=
1646%5C&Year=2017.[10] O. Antonia M. W. Melaina and M. Penev. Blending Hydrogen into Natural
Gas Pipeline Networks: A Review of Key Issues. url: https://energy.gov/sites/prod/files/2014/03/f11/blending_h2_nat_gas_pipeline.pdf.
[11] MapSpokane. url: https://maps.spokanecity.org/#.[12] Maximum permissible environmental noise levels. url: http://apps.leg.wa.
gov/WAC/default.aspx?cite=173-60-040.[13] Parks McCants. 300% Growth in Hydrogen FCV Production. url: http://
greencarjournal.com/news/300-growth-hydrogen-fcv-production/.[14] Roadmap. url: http://hydrogencouncil.com/hydrogen-scaling-up/.[15] Smart City. url: http://www.spokaneudistrict.org/smart-city.[16] Standard Tube Trailers. url: http://www.weldship.com/standard-trailer.
php.[17] The hydrogen economy in 2050. url: https://energy.gov/eere/fuelcells/
h2-scale.[18] THUGA POWER-TO-GAS PLANT. url: http://www.itm-power.com/project/
thuga-power-to-gas.
2017-18 Hydrogen Student Design Contest 32

Project Mobius Washington Innovation for Sustainable Energy
[19] Washington Infosheet. url: https://www.instituteforenergyresearch.org/states/washington/.
[20] Wild Horse Wind and Solar Facility & Renewable Energy Center. url: https://pse.com/inyourcommunity/ToursandRecreation/WildHorse/Pages/default.
aspx.
2017-18 Hydrogen Student Design Contest 33
Project Mobius Washington Innovation for Sustainable Energy
APPENDIX
Policy and Regulatory Analysis & 1 Pager for Policy Maker
The technology of power-to-gas (P2G) involves splitting water into its constituents,hydrogen and oxygen gas, utilizing electricity. This is known as electrolysis and iscompleted by an electrolyser. The oxygen gas can be used for various industries,including cancer and wastewater treatment. The hydrogen can be used for rocketfuel, superconductivity research, but more importantly, hydrogen fuel-cell vehi-cles (FCV). These vehicles produce no CO2 emissions, and their only by-productis water. The average range of FCVs is around 300 miles per tank fill [6].
Strict codes slow the installation of hydrogen production systems and they areprovided by the National Fire Protection Agency (NFPA), Occupational Safety andHealth Administration (OSHA) and the Compressed Gas Association (CGA). Manyof the impedances can be mitigated by streamlining the permitting process forimplementation of hydrogen production systems.
Another issue preventing large-scale adoption of P2G stations is the expensivecost of installing the system. On average, the electrolyser alone is over one mil-lion dollars. This does not include the storage, compression for fueling and anyassociated electronics to run the system which can exceed $500,000. This pricingalone is for systems that provide relatively low amounts of hydrogen gas. Invest-ment into Washington’s Clean Energy Fund is a clear solution to advancing thedevelopment, demonstration and deployment of clean energy technologies. In2013, Washington State Legislature approved $76 million for the fund. In 2016,they approved over $100 million in funds to invest in clean energy. The grantsavailable to electric utilities sums to an invested $14.3 million since 2013 in smartgrid projects alone. This represents more than $35 million in total investment byWashington State’s largest electric utilities [4].
Washington Legislature will match funds from an industry partner, making thisan ideal solution for local utility companies such as Avista. This for example,could translate to the state paying for half of a proposed P2G station, cutting thereturn on investment for a system in half. Furthermore, currently in-committeeis House Bill 1646 (HB 1646) which states that it will “promote an equitable cleanenergy economy by creating a carbon tax that allows clean investment in cleanenergy, clean air, healthy forests, and Washington’s communities” [9]. SupportingHB 1646, as well as increasing the budget of the Clean Energy Fund has thepotentiality of creating a much larger commercial market for hydrogen and cleanenergy within the State of Washington.
2017-18 Hydrogen Student Design Contest 34

PROJECT MOBIUS
R E V I V I N G T H E S P I R I T O F T H E ’74
W O R L D ’ S F A I R
H Y D R O G E N P O W E R T O G A S S Y S T E M
Hydrogen: Why it Matters
Hydrogen gas is readily available and has applications
ranging across multiple industries. H2 gas can be used to:
• Fuel automobiles
• Aid in heating homes
• Electricity generation and storage
• Make fertilizer
Such a versatile gas has gone under-utilized in our modern
world. Hydrogen gas is relatively cheap to produce as well,
costing only the price of the energy used to extract it.
Hydrogen has advantages over other fuel sources:
• Non-Toxic Gas
• Availability
• Green! Zero Emissions
• Low production cost
Benefits:
• Cleaner air for future generations
• Investment in growing industry
•
QUESTIONS?
https://www.avistacorp.com
CONTACT US
Phone: 800.227.9187
Fax: 800.227.9160

The
ge
ne
rate
d H
ydro
ge
n w
ill in
itia
lly in
ject
into
th
e
nat
ura
l gas
pip
elin
es
ne
arb
y to
pro
vid
e c
lean
er
and
mo
re e
ffic
ien
t n
atu
ral g
as t
o r
esi
de
nts
an
d
bu
sin
ess
es
thro
ug
ho
ut
Sp
oka
ne
bu
t w
ill s
low
ly
tran
siti
on
to
fill
ing
up
tu
be
tra
ilers
as
hyd
rog
en
be
com
es
mo
re p
op
ula
r in
fu
el c
ell
veh
icle
s. P
lug
Po
we
r is
th
e c
urr
en
t te
chn
olo
gic
al le
ade
r in
th
e
hyd
rog
en
an
d f
ue
l ce
ll in
du
stry
an
d h
as r
ece
ntl
y m
ade
a $70
mill
ion
de
al w
ith
Am
azo
n f
or
hyd
rog
en
po
we
red
fork
lifts
, wit
h a
no
the
r $600
mill
ion
be
ing
sp
en
t o
ver
the
ne
xt c
ou
ple
of
year
s.
How it works
How Hydrogen Gas is Made:
Hydrogen makes up a huge percentage of all matter in the universe. The largest source of hydrogen on earth is in water. Through a process called electrolysis hydrogen is separated from oxygen in water, and hydrogen gas is created. To make electrolysis work both a membrane and electricity are required.
Electricity and Power
Power for the system is generated by a nearby hydroelectric generator. This generator is usually only used during peak flow seasons and therefore goes underutilized. By attaching the P2G system to the generator we can make use of the water that is naturally flowing.
Gas Transportation
To make use of the gas it must be trucked off to locations that require hydrogen. A semi-truck equipped with a large storage tank can haul 280kg of hydrogen anywhere in Washington. To get put into the truck hydrogen must be compressed. There is a compressor attached to the hydrogen producing electrolizer which compresses the gas to 200 bar, which is nearly 200 times normal atmospheric pressure.
Spirit of the ’74 World’s Fair
In 1974 Spokane was host to the first environmental themed worlds fair. This marked a landmark movement by the United States and the world to make a switch to more sustainable energy sources. The fair was hosted in riverfront park, where the PTG system is located.
Sustainability is at the heart of hydrogen technologies. This power to gas system will be the first of its kind in Washington. Spokane is building upon its legacy of environmental awareness.
Safety
When designing a power to gas system, safety is the number one concern. To ensure the system is operating normally, there are extensive safety controls in place which are constantly monitoring namely the pressure and temperature. This guarantees that if anything is happening out of the ordinary, production is immediately stopped, and an operator is notified.
In many ways, hydrogen is safer that the fuels commonly used today. It is non-toxic, non-polluting, and may be safely vented into the atmosphere in the case of a leak. When compared to fuels widely used today, hydrogen is more safely created, stored, and transported, and is consumed with virtually no impact to the environment.

Washington State University Final Submission Links
https://drive.google.com/drive/folders/1To3Dq_KkozcLndnsO9YNLyxU9divCv6s?usp=sharing