2017-18 executive summary - california department … department of social services local assistance...
TRANSCRIPT
California Department of Social Services Local Assistance Executive Summary 2017-18 Governor’s Budget
California Department of Social Services 2017-18 Governor’s Budget
Local Assistance
Executive Summary
January 10, 2017

California Department of Social Services Local Assistance Executive Summary 2017-18 Governor’s Budget
2
This page is intentionally blank

California Department of Social Services Local Assistance Executive Summary 2017-18 Governor’s Budget
3
Executive Summary Overview
This document provides a high-level summary of the most noteworthy changes to the Local Assistance portion of the 2017-18 Governor’s Budget for the California Department of Social Services (CDSS). The items listed in this document represent significant policy or fiscal change compared to the Fiscal Year (FY) 2016 enacted budget. A complete presentation of all budget proposals may be found in the Local Assistance Estimates, 2017-18 Governor’s Budget Binder (http://www.cdss.ca.gov/cdssweb/PG106.htm). The CDSS Local Assistance budget provides funding for a wide variety of social services and income assistance programs. The programs administered by CDSS are managed and funded through a broad-based partnership of federal, state and county governments. For FY 2017-18, the Department will be involved in the delivery of over $28.5 billion total funds ($7.9 billion General Fund [GF]) in program services and benefits for over 6.8 million of California’s neediest and vulnerable populations. The display below identifies the estimated FY 2017-18 budget for CDSS’ major programs:
In Billions Program Total Federal State County Reimb. IHSS $10.6 $0 $3.2 $0 $7.4 SSI/SSP 2.9 0 2.9 0 0 CalWORKs 5.1 3.2 1.8 0.1 0 CalFresh 1.9 0.9 0.7 0.3 0.0 Child Welfare 3.8 1.8 0.3 1.5 0.2 Foster Care 2.4 1.0 0.1 1.3 0.0
The FY 2017-18 budget represents a decrease of $770.1 million total funds ($503.4 million GF) over the 2016 enacted budget. The 2017-18 Governor’s Budget also includes updates to FY 2016-17 expenditures, resulting in an increase of $234.0 million total funds ($13.1 million GF) from the 2016 Enacted Budget.

California Department of Social Services Local Assistance Executive Summary 2017-18 Governor’s Budget
4
This page is intentionally blank

California Department of Social Services Local Assistance Executive Summary 2017-18 Governor’s Budget
5
Table of Contents CALIFORNIA WORK OPPORTUNITY AND RESPONSIBILITY TO KIDS (CALWORKS) ........................................................................................................................................ 7
CalWORKs Assistance ............................................................................................. 9
CalWORKs Services ............................................................................................... 10
CalWORKs Stage One Child Care ......................................................................... 11
HOUSING DISABILITY ASSISTANCE PROGRAM ...................................................... 13
CALFRESH AND OTHER FOOD ASSISTANCE PROGRAMS .................................... 15
Improving Participation for the Elderly and Disabled (IPED) ................................... 16
Able-Bodied Adults Without Dependents (ABAWD) Caseload and Administrative Impact ..................................................................................................................... 17
AUTOMATION UPDATES AND PROJECTS ................................................................ 19
Los Angeles Eligibility, Automated Determination, Evaluation and Reporting (LRS)/Consortium IV (C-IV) Migration .................................................................... 20
Online CalWORKs Appraisal Tool (OCAT) ............................................................. 21
California’s Foster Care Eligibility Determination (FCED) Solution ......................... 22
ADULT PROGRAMS ..................................................................................................... 23
SSI/SSP ........................................................................................................................ 23
IN-HOME SUPPORTIVE SERVICES (IHSS) ................................................................ 25
Coordinated Care Initiative (CCI) ............................................................................ 27
Eliminate IHSS County MOE .................................................................................. 28
In-Home Supportive Services Impacts of SB 75 ..................................................... 29
Fair Labor Standards Act (FLSA) Regulations ........................................................ 30
Case Management, Information and Payrolling System II (CMIPS II) .................... 31
CHILDREN AND FAMILY SERVICES .......................................................................... 33
Continuum of Care Reform (CCR) .......................................................................... 34
Approved Relative Caregiver (ARC) Program ........................................................ 36
Relative Foster Care Home Disallowance .............................................................. 37
Child Welfare Digital Services (CWDS) .................................................................. 38

California Department of Social Services Local Assistance Executive Summary 2017-18 Governor’s Budget
6
This page is intentionally blank
California Department of Social Services Local Assistance Executive Summary 2017-18 Governor’s Budget
7
CALIFORNIA WORK OPPORTUNITY AND RESPONSIBILITY TO KIDS (CALWORKS)
The 2016-17 Revised Budget includes $5.2 billion in total funding for the core CalWORKs program in FY 2016-17, a net decrease of $136.4 million ($134.1 million in Temporary Assistance for Needy Families [TANF]/GF) from the 2016 enacted budget. The expenditure decrease is primarily due to a steeper projected CalWORKs caseload decline. In FY 2016-17, the CalWORKs caseload is projected to decline by 6.5 percent from the previous FY to 463,540 average monthly cases. This represents a 4.6 percent decline from the caseload projections in the 2016 enacted budget. The 2017-18 Governor’s Budget includes $5.1 billion in total funding for the core CalWORKs program, a decrease of $126.1 million ($124.9 million decrease in TANF/GF) from the 2016-17 Revised Budget. The CalWORKs caseload is projected to decline by another 0.9 percent to 459,173 average monthly cases in FY 2017-18, to the low caseload levels experienced pre-recession. The continued CalWORKs caseload decline drives the year over year decrease in expenditures. The FY 2017-18 includes a one-time GF savings of $265.9 million to the CalWORKs Single Allocation and a corresponding shift to county funds to reflect additional county indigent health care savings realized by counties from FY 2014-15, which were higher than previously estimated. Pursuant to Assembly Bill (AB) 85 (Chapter 24, Statutes of 2013), these additional county savings must be redirected to the CalWORKs program to offset GF costs. In addition to the major program components highlighted in the following pages, the CalWORKs budget also reflects costs because of recently enacted legislation to provide Alternatives to In-Person Interviews (Senate Bill [SB] 947): total funds of $0.8 million in FY 2016-17 and $4.6 million in FY 2017-18 for grants, administration, employment services and child care. Due to the lower expenditures and the declining caseloads, FY 2017-18 reflects an additional $120.1 million for a total of $130.1 million of TANF to Title XX transfer to the California Department of Education for the Stage Two Child Care program. The CDSS budget continues to maximize the transfer of TANF to the California Student Aid Commission to fund Cal Grants ($925.7 million in FY 2016-17 and FY 2017-18). California is in the process of correcting and mitigating fiscal penalties totaling $1.5 billion for failing to meet the federal Work Participation Rate (WPR) from Federal Fiscal Years (FFY) 2011 through FFY 2015. To avoid or reduce the penalties, California entered into Corrective Compliance Plans (CCPs) for FFY 2011 through 2014. The federal Administration for Children and Families recently notified CDSS that California had achieved a rate of 55.7 percent in FFY 2015, which satisfies the overall WPR requirement. However, the two-parent rate was 62 percent, which is below the 90 percent requirement, resulting in a $93 million penalty. California is in the process of disputing the two-parent penalty amount for FFY 2015, and will likely submit a CCP if this dispute is unsuccessful.

California Department of Social Services Local Assistance Executive Summary 2017-18 Governor’s Budget
8
Per the above, because California met the overall WPR requirements in 2015, we recently received notification that the CCPs for 2008 through 2010 were successful, resulting in the elimination of the corresponding penalties, which total approximately $340 million. Preliminary data submitted to the Administration for Children and Families (ACF) suggest that California continued to meet the overall WPR in 2016 while again falling short on the two-parent WPR requirement. Once ACF reviews this 2016 data later this year, there should be substantial relief for penalties from FFYs 2011 through 2013, which set FFY 2016 as the compliance year.

California Department of Social Services Local Assistance Executive Summary 2017-18 Governor’s Budget
9
CalWORKs Assistance
Funding (In Millions)
FY 2016-17 Appropriation
FY 2016-17 Revised Budget
FY 2017-18 Governor’s
Budget FY 2016-17
Change From Appropriation
FY 2017-18
Change From Appropriation
Total* $3,107.5 $2,968.5 $3,045.4 -$139.0 -$62.1
Federal/ TANF $1,935.9 $1,860.4 $1,816.7 -$75.5 -$119.2
State $1,102.0 $1,040.8 $1,162.5 -$61.2 $60.5
*Total TANF/GF impact before subaccount funds. Total includes county funds. The CalWORKs Assistance reflects the cost of providing cash assistance to eligible CalWORKs families, including cases funded with GF, such as Recent Noncitizen Entrants, and Non-Maintenance of Effort (MOE) cases including Safety Net and cases with an adult that is a Long-Term Sanction or Fleeing Felon. The additional impacts to CalWORKs Assistance costs from policy changes, such as the Minimum Wage Increases, Maximum Aid Payment Increases, the Maximum Family Grant (MFG) Repeal, Welfare-to-Work (WTW) 24-Month Time Clock and other premises are also reflected in CalWORKs Assistance. Funding shifts resulting from subaccount funding and shifting costs for MOE are not reflected in the cost distribution above. Change from 2016-17 Appropriation: The decrease reflects an accelerated decline in the CalWORKs caseload projection and a lower average cost per case. Actual expenditures from FY 2015-16 indicate that the cost per case has declined for all families cases from $462.97 to $459.72 and two-parent cases from $563.32 to $558.70. The major changes in FY 2017-18 reflect continued caseload decline, which is offset by costs associated with the full year implementation of the MFG Repeal. FY 2017-18 includes $224.5 million ($198.2 million GF), primarily grant costs, for the MFG Repeal. Effective January 1, 2017, CalWORKs grant computations no longer exclude the needs of children born into families who already have been aided for more than ten months. Caseload:
Revised projections relative to the 2016 enacted budget for FY 2016-17 decreased from 359,720 to 340,017 for all families cases, from 39,844 to 36,422 for two-parent cases and increased from 86,287 to 87,101 for non-MOE cases. The 2017-18 Governor's Budget projects an average monthly caseload of 333,599 for all families cases, 35,470 for two-parent cases and 90,104 for non-MOE cases.
California Department of Social Services Local Assistance Executive Summary 2017-18 Governor’s Budget
10
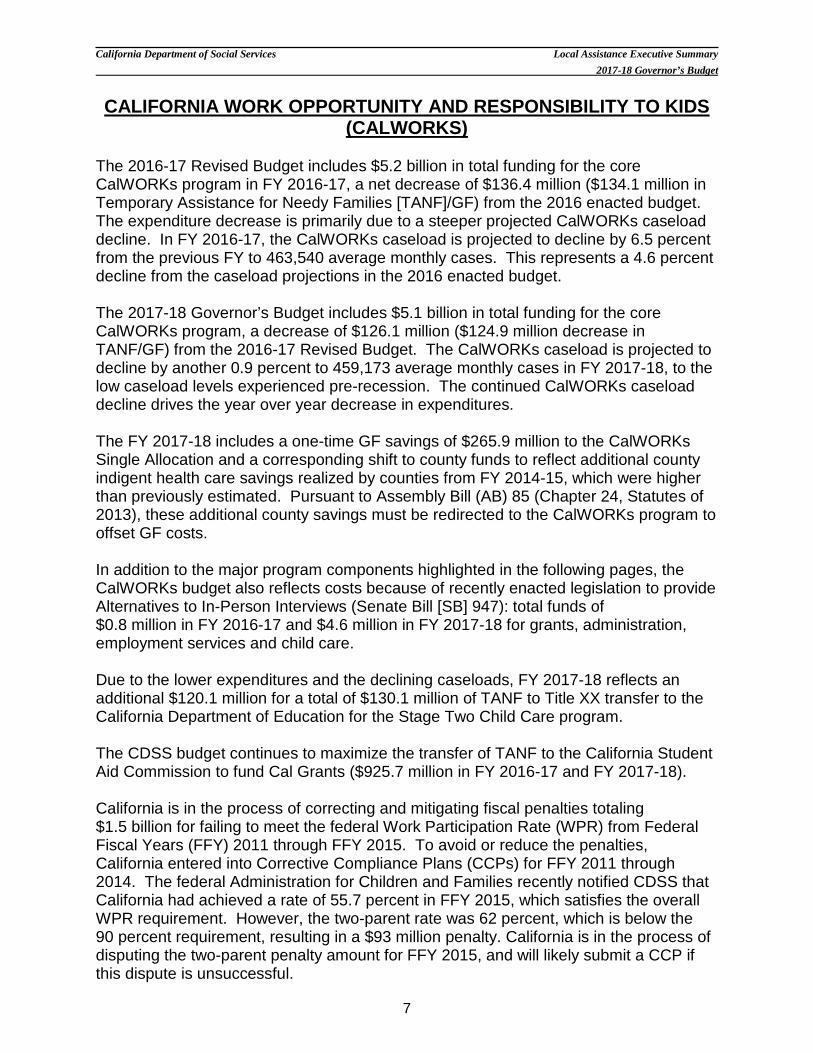
CalWORKs Services
Funding (In Millions)
FY 2016-17 Appropriation
FY 2016-17 Revised Budget
FY 2017-18 Governor’s
Budget FY 2016-17
Change From Appropriation
FY 2017-18
Change From Appropriation
Total* $1,346.9 $1,345.2 $1,254.0 -$1.7 -$92.9
Federal/ TANF $1,113.6 $1,111.4 $1,004.6 -$2.2 -$109.0
State $233.3 $233.8 $249.4 $0.5 $16.1
*Total TANF/GF impact prior to subaccount funds. Total includes county funds. The CalWORKs Services reflect the cost to provide employment services to individuals in the CalWORKs WTW program. Employment Services provided to WTW participants include a wide variety of work, educational and training activities designed to assist individuals in obtaining and retaining employment. CalWORKs Services also includes Mental Health and Substance Abuse services, Subsidized Employment, Family Stabilization, Housing Support and other program adjustments. Change from 2016-17 Appropriation: The decrease in FY 2016-17 reflects additional savings due to minimum wage increases as a higher number of cases are assumed to leave the caseload because of higher earnings. These decreases are slightly offset by an increase in Family Stabilization funding, based on county expenditures in the last two-quarters of FY 2015-16. Following the statewide implementation of the Online CalWORKs Appraisal Tool (OCAT) in October 2015, actual expenditures for Family Stabilization have increased, and it is anticipated that funding needs will be consistent with continued use of the OCAT. The overall Employment Services decrease in FY 2017-18 reflects the anticipated Employment Services caseload decline. The funding for Expanded Subsidized Employment maintains the same number of previously budgeted slots as counties continue to expand their subsidized employment programs and the number of clients served. Caseload: Revised projections relative to the 2016 enacted budget for FY 2016-17 decreased about eight percent from 211,965 adults to 195,209 adults. The FY 2017-18 projection is anticipated to decrease another half-percent to 194,360 adults.

California Department of Social Services Local Assistance Executive Summary 2017-18 Governor’s Budget
11
CalWORKs Stage One Child Care
Funding (In Millions)
FY 2016-17 Appropriation
FY 2016-17 Revised Budget
FY 2017-18 Governor’s
Budget FY 2016-17
Change From Appropriation
FY 2017-18
Change From Appropriation
Total* $408.4 $412.5 $381.6 $4.1 -$26.8
Federal/ TANF $368.6 $371.1 $312.6 $2.5 -$56.0
State $39.8 $41.4 $69.0 $1.6 $29.2
*Total TANF/GF impact before Subaccount funds The CalWORKs Stage One Child Care reflects the costs to provide Stage One Child Care for CalWORKs families participating in a WTW activity with a child less than 13 years of age. Stage One Child Care costs also reflect increases to the Regional Market Rate (RMR). Effective January 1, 2017, the RMR ceilings was updated to the 75th percentile of the 2014 RMR survey. The RMR ceilings for license-exempt providers will also be raised from 65 to 70 percent of the Family Child Care Homes rate. The FY 2017-18 RMR adjustment is being paused. Also reflected is a one-time “hold harmless” cost, effective from January 2017 through June 2018, to hold rates to the levels established October 1, 2015 (if the new rates, effective January 1, 2017, are less than those rates established on October 1, 2015). Change from 2016-17 Appropriation: The only change to Stage One Child Care in FY 2016-17 is an increase in the RMR costs. For FY 2017-18, the revised CW 115/115A report, which implemented July 2015, is used to estimate costs. The report now reflects the number of children served rather than the number of payments claimed. This change results in a lower base cost per case, which decreased from $758.40 to $675.38, excluding the changes to the RMR listed above. The total Stage One Child Care cost per case for FY 2017-18 including services, administration and all RMR increases is $756.06. Caseload: Revised projections relative to the enacted budget for FY 2016-17 decreased about 2.8 percent from 42,995 children to 41,806 children. The Stage One Child Care caseload is projected to slightly increase to 42,060 children in FY 2017-18. Despite this increase in caseload, the reduction in the cost per case results in a lower budget for FY 2017-18.

California Department of Social Services Local Assistance Executive Summary 2017-18 Governor’s Budget
12
This page is intentionally blank
California Department of Social Services Local Assistance Executive Summary 2017-18 Governor’s Budget
13
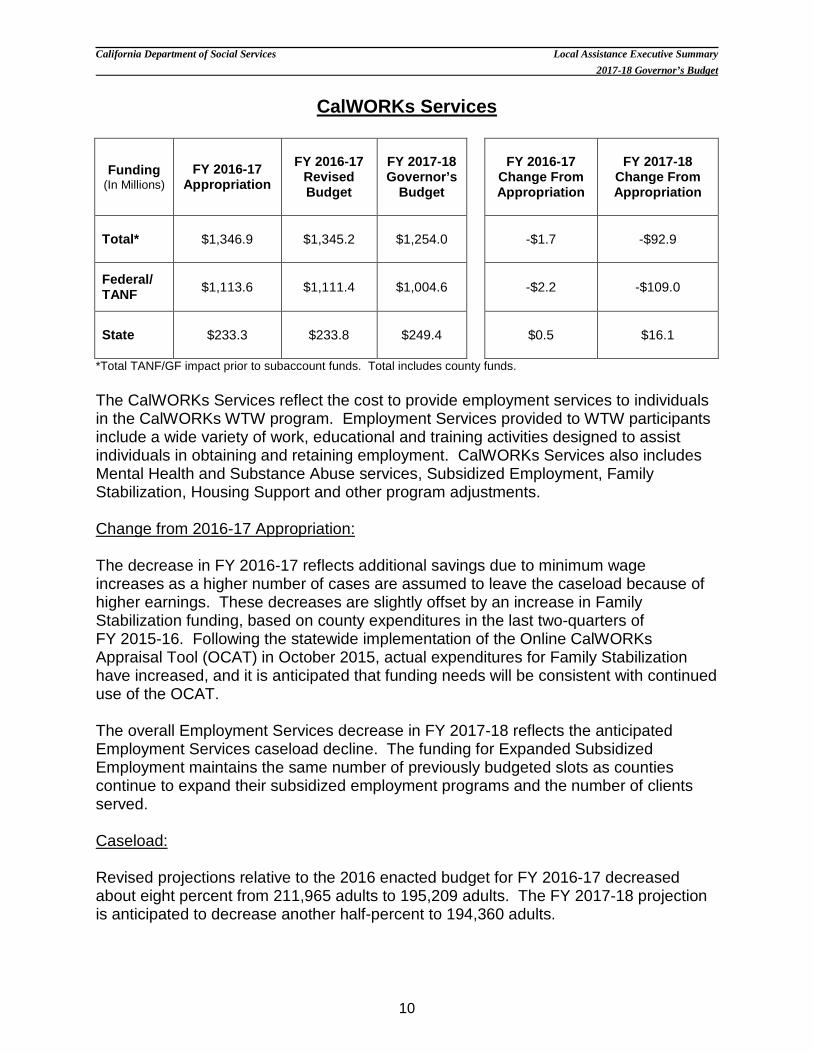
HOUSING DISABILITY ASSISTANCE PROGRAM
Funding (In Millions)
FY 2016-17 Appropriation
FY 2016-17 Revised Budget
FY 2017-18 Governor’s
Budget FY 2016-17
Change From Appropriation
FY 2017-18
Change From Appropriation
Total* $43.5 $0 $0 -$43.5 $0
Federal $0 $0 $0 $0 $0
State $43.5 $0 $0 -$43.5 $0
County $0 $0 $0 $0 $0
Reimb. $0 $0 $0 $0 $0
*Total TANF/GF impact prior to subaccount funds. This premise reflects funding for the Housing Disability Income Advocacy Program to provide state matching funds to participating counties for the provision of outreach, case management, advocacy services and housing assistance to individuals in need. The program is intended to assist homeless individuals apply for disability benefit programs including the SSI/SSP for the Aged, Blind and Disabled; the federal Social Security Disability Insurance program; the Cash Assistance Program for Immigrants; and veterans benefits provided under federal law, including disability compensation. The appropriated funding is available over a three-year period through June 30, 2019. While discussed in conjunction with CalWORKs for purposes of this Executive Summary, funding for this program is budgeted in the Supplemental Security Income/State Supplementary Program (SSI/SSP) item of the CDSS budget. Change from 2016-17 Appropriation: The 2017-18 Governor’s Budget reflects one-time savings of $43.5 million in GF in FY 2016-17 due to the proposal to halt implementation of this program. Caseload: None.

California Department of Social Services Local Assistance Executive Summary 2017-18 Governor’s Budget
14
This page is intentionally blank
California Department of Social Services Local Assistance Executive Summary 2017-18 Governor’s Budget
15
CALFRESH AND OTHER FOOD ASSISTANCE PROGRAMS The 2017-18 Governor’s Budget includes $1.9 billion in total funding ($657.9 million GF) for the CalFresh administration in FY 2017-18, which represents a $136.6 million total funds ($35.2 million GF) decrease from the 2016-17 Appropriation. The non-assistance CalFresh caseload is projected to decrease 2.8 percent in FY 2016-17, which reflects a directional shift from 15 years of caseload growth. This decline is primarily attributed to fewer applications and more discontinuances due to higher household earnings in the first six months of 2016. The CalFresh program is projected to reach an average of 2.0 million total households (public assistance and non-assistance) in FY 2016-17 and FY 2017-18. The Drought Food Assistance Program (DFAP) is a temporary program. The 2016-17 Appropriation included $18.4 million GF in local assistance funding to operate the DFAP. This funding will provide sufficient inventory for the program through December 2017. There is no proposed funding included for FY 2017-18. Finally, there is no proposed funding for the State Emergency Food Assistance Program because this was a one-time augmentation limited to 2016-17.
California Department of Social Services Local Assistance Executive Summary 2017-18 Governor’s Budget
16
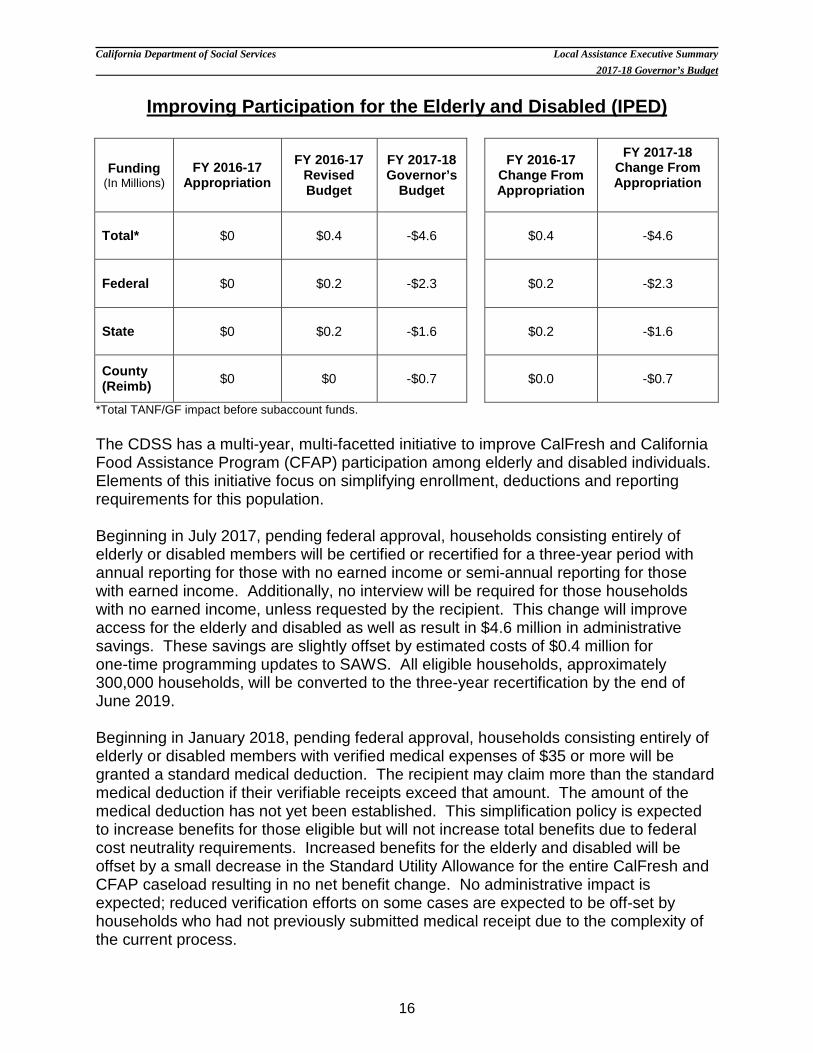
Improving Participation for the Elderly and Disabled (IPED)
Funding (In Millions)
FY 2016-17 Appropriation
FY 2016-17 Revised Budget
FY 2017-18 Governor’s
Budget FY 2016-17
Change From Appropriation
FY 2017-18 Change From Appropriation
Total* $0 $0.4 -$4.6 $0.4 -$4.6
Federal $0 $0.2 -$2.3 $0.2 -$2.3
State $0 $0.2 -$1.6 $0.2 -$1.6
County (Reimb) $0 $0 -$0.7 $0.0 -$0.7
*Total TANF/GF impact before subaccount funds. The CDSS has a multi-year, multi-facetted initiative to improve CalFresh and California Food Assistance Program (CFAP) participation among elderly and disabled individuals. Elements of this initiative focus on simplifying enrollment, deductions and reporting requirements for this population. Beginning in July 2017, pending federal approval, households consisting entirely of elderly or disabled members will be certified or recertified for a three-year period with annual reporting for those with no earned income or semi-annual reporting for those with earned income. Additionally, no interview will be required for those households with no earned income, unless requested by the recipient. This change will improve access for the elderly and disabled as well as result in $4.6 million in administrative savings. These savings are slightly offset by estimated costs of $0.4 million for one-time programming updates to SAWS. All eligible households, approximately 300,000 households, will be converted to the three-year recertification by the end of June 2019. Beginning in January 2018, pending federal approval, households consisting entirely of elderly or disabled members with verified medical expenses of $35 or more will be granted a standard medical deduction. The recipient may claim more than the standard medical deduction if their verifiable receipts exceed that amount. The amount of the medical deduction has not yet been established. This simplification policy is expected to increase benefits for those eligible but will not increase total benefits due to federal cost neutrality requirements. Increased benefits for the elderly and disabled will be offset by a small decrease in the Standard Utility Allowance for the entire CalFresh and CFAP caseload resulting in no net benefit change. No administrative impact is expected; reduced verification efforts on some cases are expected to be off-set by households who had not previously submitted medical receipt due to the complexity of the current process.
California Department of Social Services Local Assistance Executive Summary 2017-18 Governor’s Budget
17
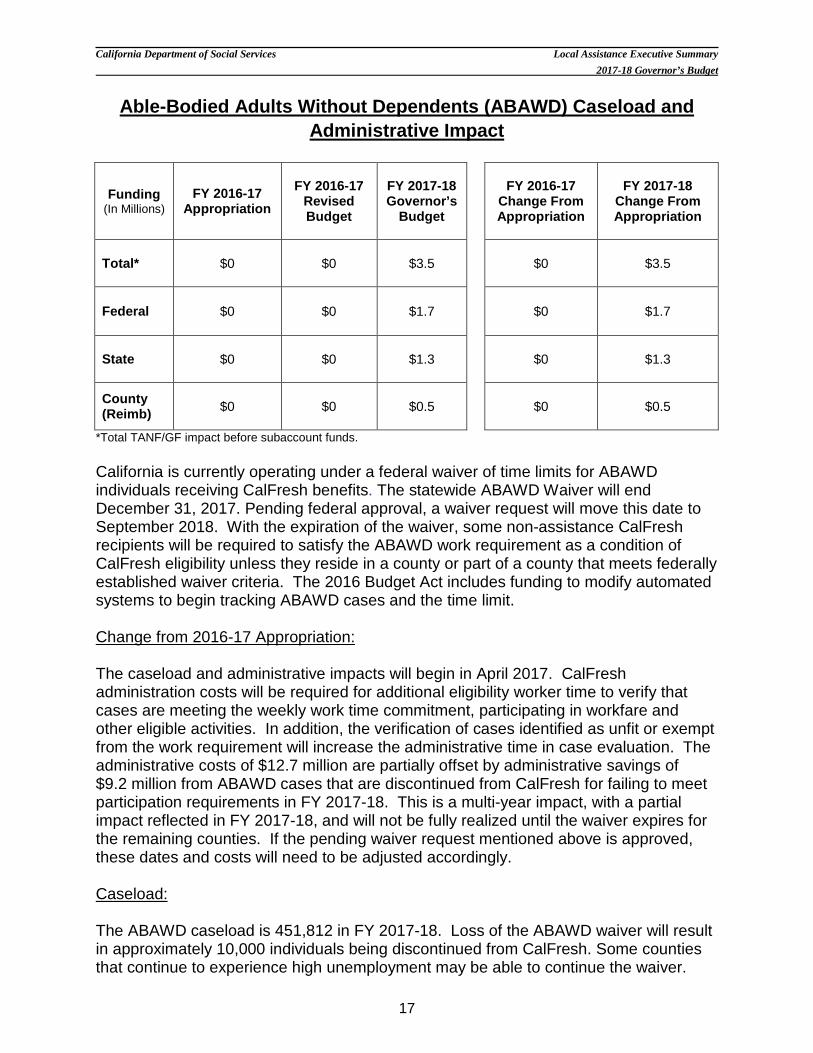
Able-Bodied Adults Without Dependents (ABAWD) Caseload and Administrative Impact
Funding (In Millions)
FY 2016-17 Appropriation
FY 2016-17 Revised Budget
FY 2017-18 Governor’s
Budget FY 2016-17
Change From Appropriation
FY 2017-18
Change From Appropriation
Total* $0 $0 $3.5 $0 $3.5
Federal $0 $0 $1.7 $0 $1.7
State $0 $0 $1.3 $0 $1.3
County (Reimb) $0 $0 $0.5 $0 $0.5
*Total TANF/GF impact before subaccount funds. California is currently operating under a federal waiver of time limits for ABAWD individuals receiving CalFresh benefits. The statewide ABAWD Waiver will end December 31, 2017. Pending federal approval, a waiver request will move this date to September 2018. With the expiration of the waiver, some non-assistance CalFresh recipients will be required to satisfy the ABAWD work requirement as a condition of CalFresh eligibility unless they reside in a county or part of a county that meets federally established waiver criteria. The 2016 Budget Act includes funding to modify automated systems to begin tracking ABAWD cases and the time limit. Change from 2016-17 Appropriation: The caseload and administrative impacts will begin in April 2017. CalFresh administration costs will be required for additional eligibility worker time to verify that cases are meeting the weekly work time commitment, participating in workfare and other eligible activities. In addition, the verification of cases identified as unfit or exempt from the work requirement will increase the administrative time in case evaluation. The administrative costs of $12.7 million are partially offset by administrative savings of $9.2 million from ABAWD cases that are discontinued from CalFresh for failing to meet participation requirements in FY 2017-18. This is a multi-year impact, with a partial impact reflected in FY 2017-18, and will not be fully realized until the waiver expires for the remaining counties. If the pending waiver request mentioned above is approved, these dates and costs will need to be adjusted accordingly. Caseload: The ABAWD caseload is 451,812 in FY 2017-18. Loss of the ABAWD waiver will result in approximately 10,000 individuals being discontinued from CalFresh. Some counties that continue to experience high unemployment may be able to continue the waiver.

California Department of Social Services Local Assistance Executive Summary 2017-18 Governor’s Budget
18
This page is intentionally blank
California Department of Social Services Local Assistance Executive Summary 2017-18 Governor’s Budget
19
AUTOMATION UPDATES AND PROJECTS The 2017-18 Governor’s Budget for SAWS Automation Maintenance and Operations (M&O) and Updates includes $301.4 million ($111.8 million in GF) which reflects a net decrease of $29.8 million ($6.8 million in GF) compared to the 2016 enacted budget. The costs reflect the following automation efforts or key implementation milestones:
• The California Work Opportunity and Responsibility to Kids Information Network
(CalWIN) enhancements are scheduled to begin in July 2017. The enhancements to the CalWIN system will ensure the ongoing efficiency and dependability of operations, the interoperability with other partner systems and proficiency in adaptations to address changes in the health and human services environment. The enhancements are expected to be complete in FY 2019-20. Funding for this effort is pending, federal approval for federal financial participation.
The CDSS is exploring options for replacing the Statewide Fingerprint Imaging System (SFIS) in anticipation of the contract expiration in August 2017. The replacement option would use a form of Knowledge-Based Authentication, which queries public and private data sources to determine the likelihood that the person is who they claim to be. This change is funded within the existing $12.1 million budget for SFIS. Starting early 2017, up to six counties will participate in a pilot program that will run parallel to SFIS. If successful, CDSS would propose to procure a long-term agreement to implement the new service statewide.
• FY 2016-17 includes a total of $1.7 million one-time funding for SAWS updates to
implement recently enacted legislation: o Inter-County Transfers – SB 1339 (Chapter 801, Statutes of 2016) waives the
interview requirement for the receiving county and requires transfers to be timely for CalWORKs, CalFresh and Medi-Cal.
o Consumer Credit Reports – SB 1232 (Chapter 308, Statutes of 2016) requires authorization to use credit reports for CalWORKs and CalFresh eligibility determinations.
o Overpayments on CalWORKs Reporting – AB 2062 (Chapter 795, Statutes of 2016) requires timely notification of reduction in benefits in order to be deemed an overpayment.
California Department of Social Services Local Assistance Executive Summary 2017-18 Governor’s Budget
20
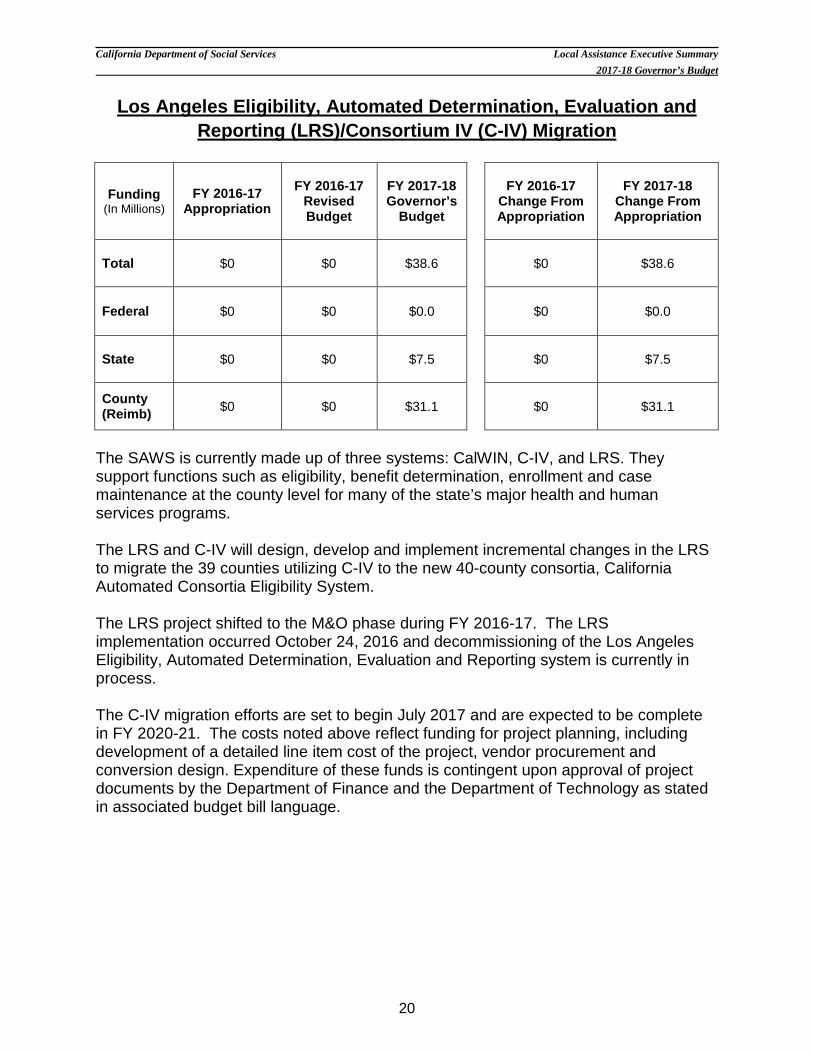
Los Angeles Eligibility, Automated Determination, Evaluation and Reporting (LRS)/Consortium IV (C-IV) Migration
Funding (In Millions)
FY 2016-17 Appropriation
FY 2016-17 Revised Budget
FY 2017-18 Governor’s
Budget FY 2016-17
Change From Appropriation
FY 2017-18
Change From Appropriation
Total $0 $0 $38.6 $0 $38.6
Federal $0 $0 $0.0 $0 $0.0
State $0 $0 $7.5 $0 $7.5
County (Reimb) $0 $0 $31.1 $0 $31.1
The SAWS is currently made up of three systems: CalWIN, C-IV, and LRS. They support functions such as eligibility, benefit determination, enrollment and case maintenance at the county level for many of the state’s major health and human services programs.
The LRS and C-IV will design, develop and implement incremental changes in the LRS to migrate the 39 counties utilizing C-IV to the new 40-county consortia, California Automated Consortia Eligibility System. The LRS project shifted to the M&O phase during FY 2016-17. The LRS implementation occurred October 24, 2016 and decommissioning of the Los Angeles Eligibility, Automated Determination, Evaluation and Reporting system is currently in process. The C-IV migration efforts are set to begin July 2017 and are expected to be complete in FY 2020-21. The costs noted above reflect funding for project planning, including development of a detailed line item cost of the project, vendor procurement and conversion design. Expenditure of these funds is contingent upon approval of project documents by the Department of Finance and the Department of Technology as stated in associated budget bill language.
California Department of Social Services Local Assistance Executive Summary 2017-18 Governor’s Budget
21
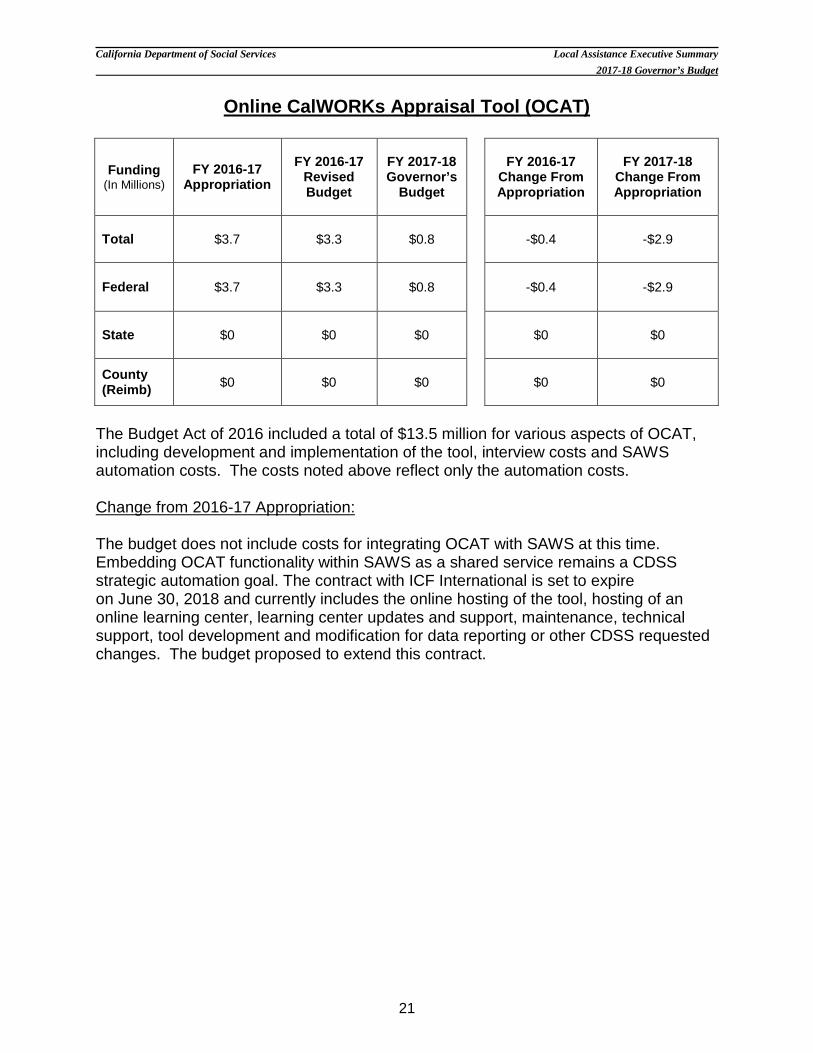
Online CalWORKs Appraisal Tool (OCAT)
Funding (In Millions)
FY 2016-17 Appropriation
FY 2016-17 Revised Budget
FY 2017-18 Governor’s
Budget FY 2016-17
Change From Appropriation
FY 2017-18
Change From Appropriation
Total $3.7 $3.3 $0.8 -$0.4 -$2.9
Federal $3.7 $3.3 $0.8 -$0.4 -$2.9
State $0 $0 $0 $0 $0
County (Reimb) $0 $0 $0 $0 $0
The Budget Act of 2016 included a total of $13.5 million for various aspects of OCAT, including development and implementation of the tool, interview costs and SAWS automation costs. The costs noted above reflect only the automation costs. Change from 2016-17 Appropriation: The budget does not include costs for integrating OCAT with SAWS at this time. Embedding OCAT functionality within SAWS as a shared service remains a CDSS strategic automation goal. The contract with ICF International is set to expire on June 30, 2018 and currently includes the online hosting of the tool, hosting of an online learning center, learning center updates and support, maintenance, technical support, tool development and modification for data reporting or other CDSS requested changes. The budget proposed to extend this contract.

California Department of Social Services Local Assistance Executive Summary 2017-18 Governor’s Budget
22
California’s Foster Care Eligibility Determination (FCED) Solution
Funding (In Millions)
FY 2016-17 Appropriation
FY 2016-17 Revised Budget
FY 2017-18 Governor’s
Budget FY 2016-17
Change From Appropriation
FY 2017-18
Change From Appropriation
Total $0 $0 $4.6 $0 $4.6
Federal $0 $0 $1.3 $0 $1.3
State $0 $0 $2.7 $0 $2.7
County (Reimb) $0 $0 $0.6 $0 $0.6
The current FCED functionality resides in each of the three SAWS Consortia. The ACF has stated that the current California model for FCED does not meet the federally acceptable level of automation. The 2017-18 Governor’s Budget proposes a new single statewide FCED solution that will leverage the existing SAWS to comply with the federal requirement that a Title IV-E agency use the same automated functions for all Title IV-E determinations. The FCED hosting solution will ultimately consider all 58 counties’ business processes and will include a governance structure that will support all counties. This integrated solution will standardize processes and reduce the amount of work put into exchanging information between the SAWS, Child Welfare Services/Case Management System (CWS/CMS), Child Welfare Digital Services (CWDS) Project and California’s court systems. The design, development and implementation activities are scheduled to occur from April 2018 to October 2019.
California Department of Social Services Local Assistance Executive Summary 2017-18 Governor’s Budget
23
ADULT PROGRAMS
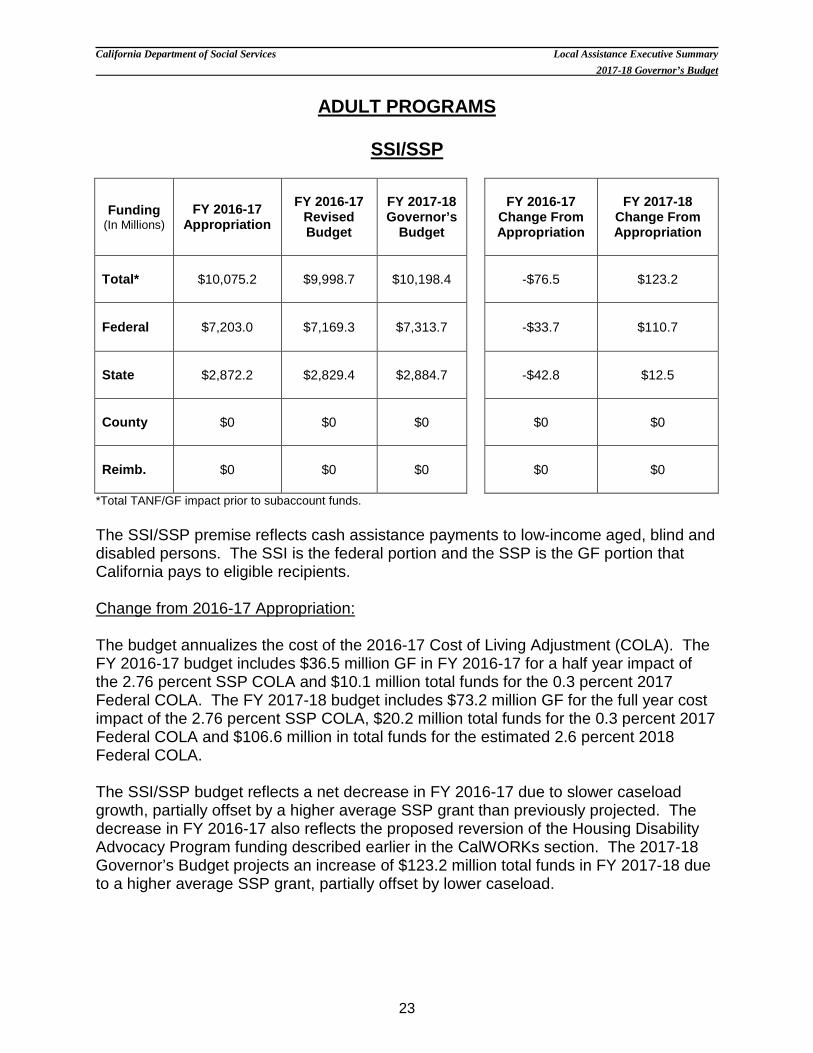
SSI/SSP
Funding (In Millions)
FY 2016-17 Appropriation
FY 2016-17 Revised Budget
FY 2017-18 Governor’s
Budget FY 2016-17
Change From Appropriation
FY 2017-18
Change From Appropriation
Total* $10,075.2 $9,998.7 $10,198.4 -$76.5 $123.2
Federal $7,203.0 $7,169.3 $7,313.7 -$33.7 $110.7
State $2,872.2 $2,829.4 $2,884.7 -$42.8 $12.5
County $0 $0 $0 $0 $0
Reimb. $0 $0 $0 $0 $0
*Total TANF/GF impact prior to subaccount funds. The SSI/SSP premise reflects cash assistance payments to low-income aged, blind and disabled persons. The SSI is the federal portion and the SSP is the GF portion that California pays to eligible recipients. Change from 2016-17 Appropriation: The budget annualizes the cost of the 2016-17 Cost of Living Adjustment (COLA). The FY 2016-17 budget includes $36.5 million GF in FY 2016-17 for a half year impact of the 2.76 percent SSP COLA and $10.1 million total funds for the 0.3 percent 2017 Federal COLA. The FY 2017-18 budget includes $73.2 million GF for the full year cost impact of the 2.76 percent SSP COLA, $20.2 million total funds for the 0.3 percent 2017 Federal COLA and $106.6 million in total funds for the estimated 2.6 percent 2018 Federal COLA. The SSI/SSP budget reflects a net decrease in FY 2016-17 due to slower caseload growth, partially offset by a higher average SSP grant than previously projected. The decrease in FY 2016-17 also reflects the proposed reversion of the Housing Disability Advocacy Program funding described earlier in the CalWORKs section. The 2017-18 Governor’s Budget projects an increase of $123.2 million total funds in FY 2017-18 due to a higher average SSP grant, partially offset by lower caseload.

California Department of Social Services Local Assistance Executive Summary 2017-18 Governor’s Budget
24
Caseload: The average monthly caseload is projected to be 1,282,787 cases in FY 2016-17, which reflects a 0.6 percent decline from the previous projection. The total average grant is projected to be $626.54 after COLAs are applied. In FY 2017-18, the average monthly caseload is projected to be 1,284,131 cases and the total average grant is projected to be $636.45 after COLAs are applied.

California Department of Social Services Local Assistance Executive Summary 2017-18 Governor’s Budget
25
IN-HOME SUPPORTIVE SERVICES (IHSS)
Funding (In Millions)
FY 2016-17 Appropriation
FY 2016-17 Revised Budget
FY 2017-18 Governor’s
Budget FY 2016-17
Change From Appropriation
FY 2017-18
Change From Appropriation
Total* $9,826.8 $9,960.0 $10,623.0 $133.2 $796.2
State $3,455.7 $3,528.7 $3,153.8 $73.0 -$301.9
County/ County Reimb.
$1,113.5 $1,117.4 $1,779.2 $3.9 $665.6
DHCS Reimb. $5,257.6 $5,313.9 $5,690.0 $56.3 $432.4
*Total TANF/GF impact prior to subaccount funds. This premise reflects the costs to provide IHSS services to eligible aged, blind or disabled individuals that allow them to stay in their own homes as an alternative to out of-home care. The costs reflected in the table above do not include CCI Reimbursement from DHCS. Change from 2016-17 Appropriation: The net increase in FY 2016-17 reflects additional cases associated with undocumented minors transitioning into IHSS as a result of SB 75 (Chapter 18, Statutes of 2015), and increases in minimum wage from $10.00 per hour to $10.50 effective January 1, 2017. It also reflects a higher caseload, cost per hour, paid hours per case and administrative costs based on updated actual caseload and expenditures. The net increase in FY 2017-18 is due to the additional undocumented minor cases, increase in minimum wage from $10.50 per hour to $11.00 effective January 1, 2018, higher caseload, cost per hour, paid hours per case and administration costs. The net decrease in GF reflects the impact of eliminating the county Maintenance of Effort (MOE). This results in the shift of $665.6 million from the state to the county share. The details regarding the impact of eliminating CCI are outlined on pages 27 and 28. Caseload, Hours Per Case and Cost Per Hour: The average monthly paid caseload for IHSS Basic in FY 2016-17 is projected to be 491,141 cases, a 0.07 percent increase compared to the 490,797 cases projected in the 2016 enacted budget. The average monthly paid caseload for IHSS Basic in FY 2017-18 is projected to be 516,935 cases, a 5.3 percent increase over FY 2016-17. The caseload projections for this program are developed using 15-month period of actual Paid caseload data through July 2016 received from Case Management, Information and Payrolling System (CMIPS II). Additional projected caseloads are not

California Department of Social Services Local Assistance Executive Summary 2017-18 Governor’s Budget
26
included in the IHSS Basic caseload as they are included in separate premise lines. Those caseloads include the Affordable Care Act (2,183 cases in FY 2016-17 and 6,472 in FY 2017-18), CCI (6,968 cases FY 2016-17 and 7,477 in FY 2017-18), and Implementation of SB 75 (114 cases in FY 2016-17 and 185 in FY 2017-18). The average monthly hours per case are projected to be 105.2 in FY 2016 17 and FY 2017 18 compared to 104.2 in the 2016 enacted budget. The average cost per hour is projected to be $13.38 in FY 2016 17, compared to $13.33. The average cost per hour is projected to be $13.50 in FY 2017 18.
California Department of Social Services Local Assistance Executive Summary 2017-18 Governor’s Budget
27
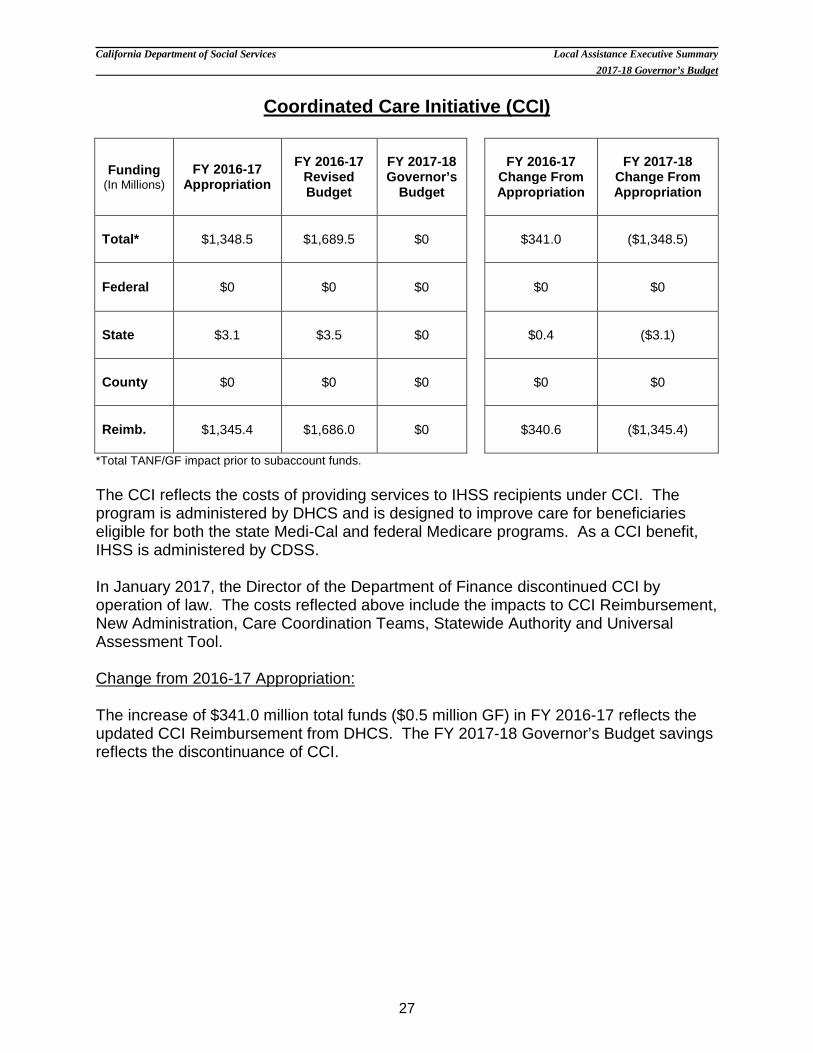
Coordinated Care Initiative (CCI)
Funding (In Millions)
FY 2016-17 Appropriation
FY 2016-17 Revised Budget
FY 2017-18 Governor’s
Budget FY 2016-17
Change From Appropriation
FY 2017-18
Change From Appropriation
Total* $1,348.5 $1,689.5 $0 $341.0 ($1,348.5)
Federal $0 $0 $0 $0 $0
State $3.1 $3.5 $0 $0.4 ($3.1)
County $0 $0 $0 $0 $0
Reimb. $1,345.4 $1,686.0 $0 $340.6 ($1,345.4)
*Total TANF/GF impact prior to subaccount funds. The CCI reflects the costs of providing services to IHSS recipients under CCI. The program is administered by DHCS and is designed to improve care for beneficiaries eligible for both the state Medi-Cal and federal Medicare programs. As a CCI benefit, IHSS is administered by CDSS. In January 2017, the Director of the Department of Finance discontinued CCI by operation of law. The costs reflected above include the impacts to CCI Reimbursement, New Administration, Care Coordination Teams, Statewide Authority and Universal Assessment Tool. Change from 2016-17 Appropriation: The increase of $341.0 million total funds ($0.5 million GF) in FY 2016-17 reflects the updated CCI Reimbursement from DHCS. The FY 2017-18 Governor’s Budget savings reflects the discontinuance of CCI.

California Department of Social Services Local Assistance Executive Summary 2017-18 Governor’s Budget
28
Eliminate IHSS County MOE
Funding (In Millions)
FY 2016-17 Appropriation
FY 2016-17 Revised Budget
FY 2017-18 Governor’s
Budget FY 2016-17
Change From Appropriation
FY 2017-18
Change From Appropriation
Total* $0 $0 $0 $0 $0
Federal $0 $0 $0 $0 $0
State -$1,113.5 -$1,117.4 -$1,779.2 -$3.8 -$665.6
County (Reimb) $1,113.5 $1,117.4 $1,779.2 $3.8 $665.6
*Total TANF/GF impact prior to subaccount funds. The IHSS MOE premise reflects the establishment of county MOE levels for the county share of IHSS service and administration costs. Due to the discontinuation of the CCI program, the MOE structure will be eliminated effective July 1, 2017. The costs and savings displayed in the FY 2016-17 Appropriation and FY 2016-17 Revised Budget columns reflect the normal IHSS County MOE amounts. The costs displayed in the FY 2017-18 Governor’s Budget column reflect the amounts that exceeded the county MOE levels that were paid with GF and the amount that will shift to counties. Change from 2016-17 Appropriation: The increase in GF savings of $3.8 million in FY 2016-17 reflects locally negotiated county rate increases from March 2016 to June 2016 offset by removal of Contract Mode cost increases. The savings in FY 2017-18 reflect the funding shift from state to counties.
California Department of Social Services Local Assistance Executive Summary 2017-18 Governor’s Budget
29
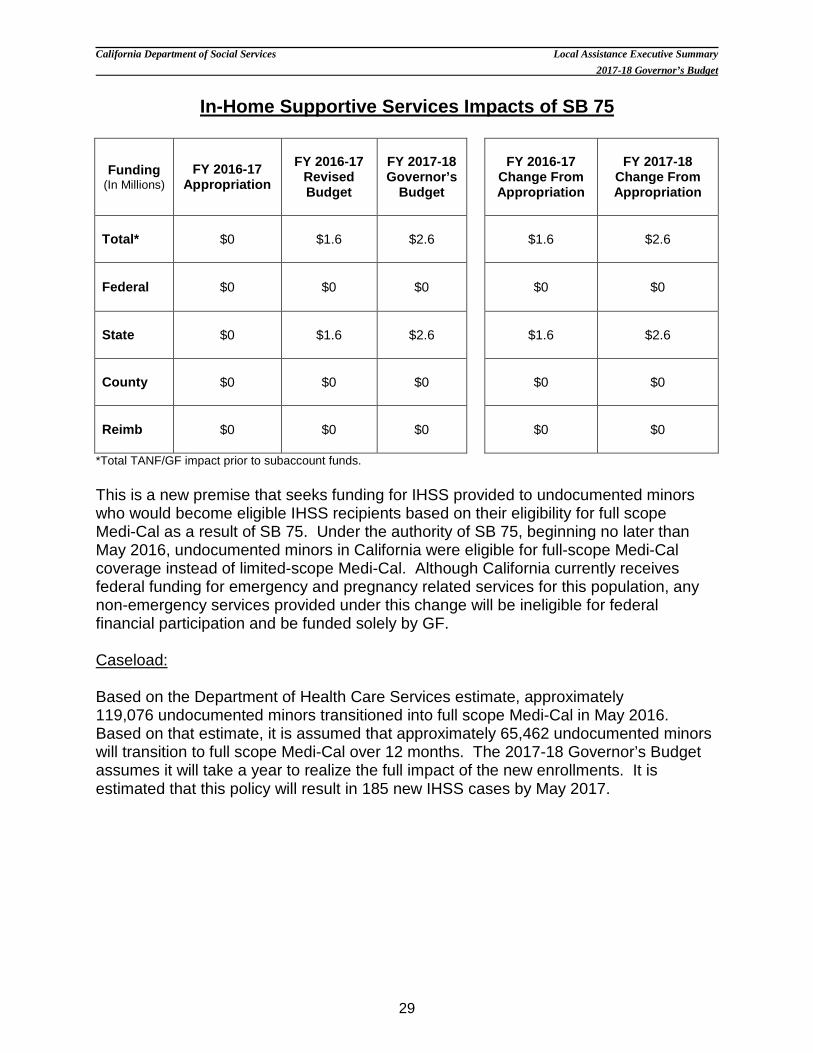
In-Home Supportive Services Impacts of SB 75
Funding (In Millions)
FY 2016-17 Appropriation
FY 2016-17 Revised Budget
FY 2017-18 Governor’s
Budget FY 2016-17
Change From Appropriation
FY 2017-18
Change From Appropriation
Total* $0 $1.6 $2.6 $1.6 $2.6
Federal $0 $0 $0 $0 $0
State $0 $1.6 $2.6 $1.6 $2.6
County $0 $0 $0 $0 $0
Reimb $0 $0 $0 $0 $0
*Total TANF/GF impact prior to subaccount funds. This is a new premise that seeks funding for IHSS provided to undocumented minors who would become eligible IHSS recipients based on their eligibility for full scope Medi-Cal as a result of SB 75. Under the authority of SB 75, beginning no later than May 2016, undocumented minors in California were eligible for full-scope Medi-Cal coverage instead of limited-scope Medi-Cal. Although California currently receives federal funding for emergency and pregnancy related services for this population, any non-emergency services provided under this change will be ineligible for federal financial participation and be funded solely by GF. Caseload: Based on the Department of Health Care Services estimate, approximately 119,076 undocumented minors transitioned into full scope Medi-Cal in May 2016. Based on that estimate, it is assumed that approximately 65,462 undocumented minors will transition to full scope Medi-Cal over 12 months. The 2017-18 Governor’s Budget assumes it will take a year to realize the full impact of the new enrollments. It is estimated that this policy will result in 185 new IHSS cases by May 2017.
California Department of Social Services Local Assistance Executive Summary 2017-18 Governor’s Budget
30
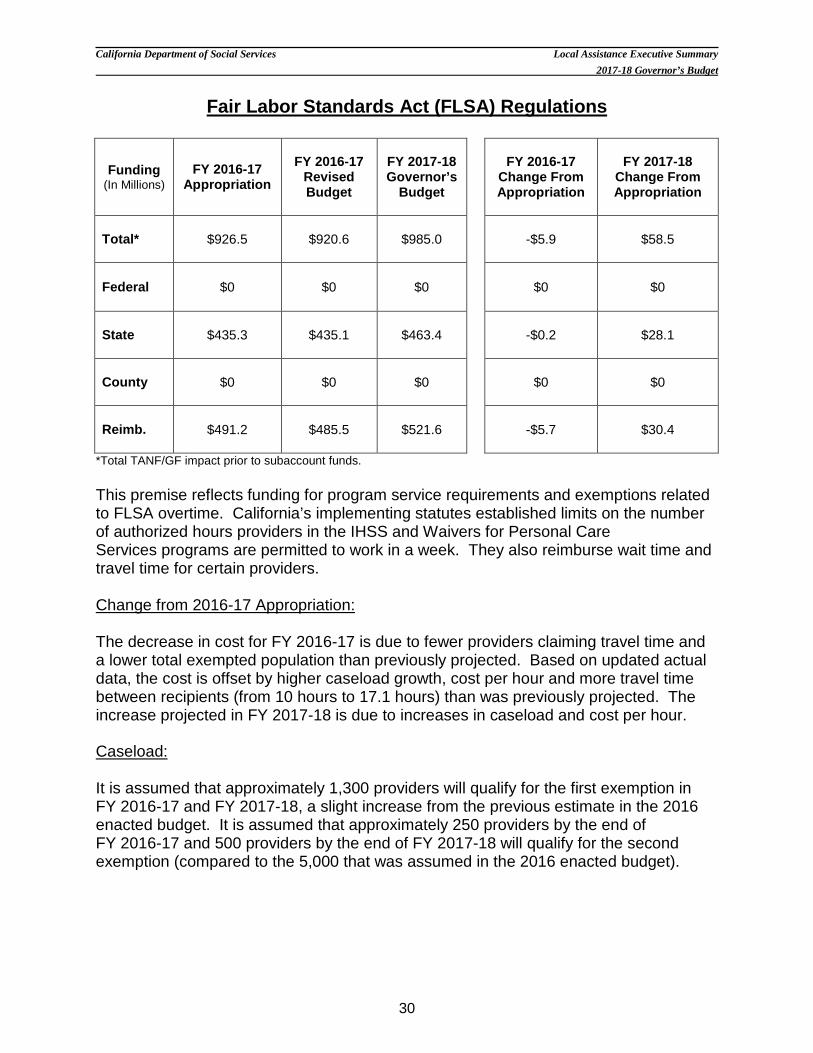
Fair Labor Standards Act (FLSA) Regulations
Funding (In Millions)
FY 2016-17 Appropriation
FY 2016-17 Revised Budget
FY 2017-18 Governor’s
Budget FY 2016-17
Change From Appropriation
FY 2017-18
Change From Appropriation
Total* $926.5 $920.6 $985.0 -$5.9 $58.5
Federal $0 $0 $0 $0 $0
State $435.3 $435.1 $463.4 -$0.2 $28.1
County $0 $0 $0 $0 $0
Reimb. $491.2 $485.5 $521.6 -$5.7 $30.4
*Total TANF/GF impact prior to subaccount funds. This premise reflects funding for program service requirements and exemptions related to FLSA overtime. California’s implementing statutes established limits on the number of authorized hours providers in the IHSS and Waivers for Personal Care Services programs are permitted to work in a week. They also reimburse wait time and travel time for certain providers. Change from 2016-17 Appropriation: The decrease in cost for FY 2016-17 is due to fewer providers claiming travel time and a lower total exempted population than previously projected. Based on updated actual data, the cost is offset by higher caseload growth, cost per hour and more travel time between recipients (from 10 hours to 17.1 hours) than was previously projected. The increase projected in FY 2017-18 is due to increases in caseload and cost per hour. Caseload: It is assumed that approximately 1,300 providers will qualify for the first exemption in FY 2016-17 and FY 2017-18, a slight increase from the previous estimate in the 2016 enacted budget. It is assumed that approximately 250 providers by the end of FY 2016-17 and 500 providers by the end of FY 2017-18 will qualify for the second exemption (compared to the 5,000 that was assumed in the 2016 enacted budget).
California Department of Social Services Local Assistance Executive Summary 2017-18 Governor’s Budget
31
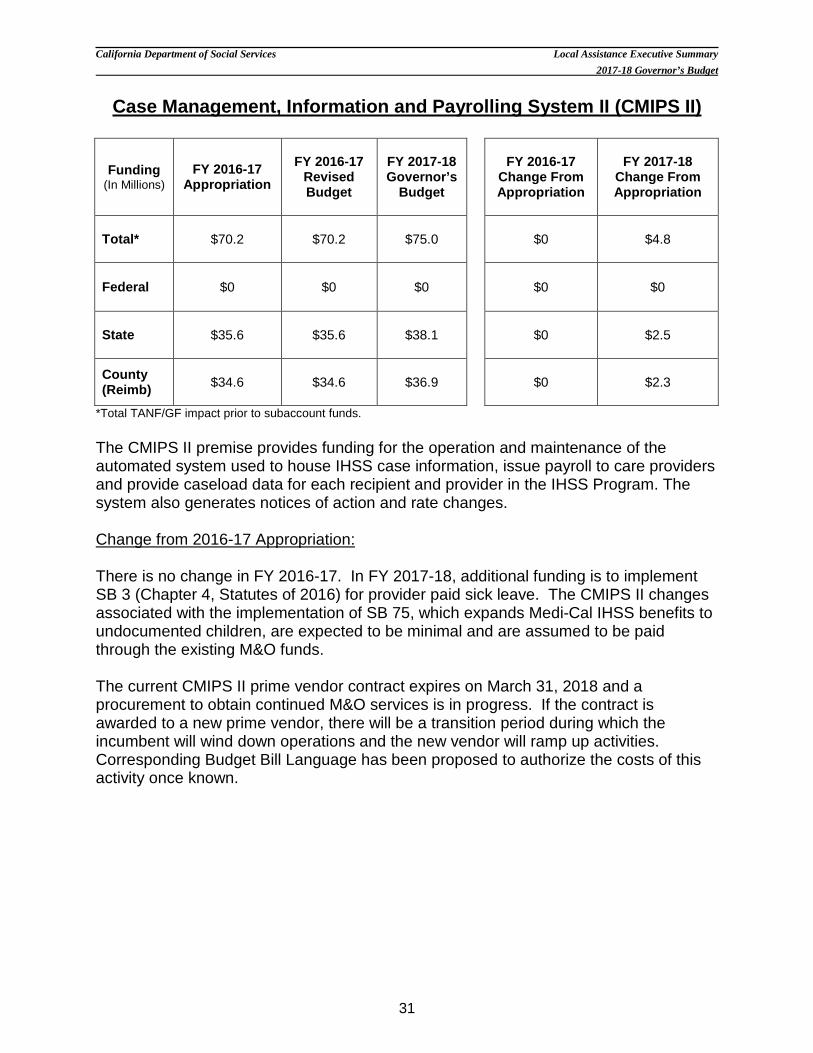
Case Management, Information and Payrolling System II (CMIPS II)
Funding (In Millions)
FY 2016-17 Appropriation
FY 2016-17 Revised Budget
FY 2017-18 Governor’s
Budget FY 2016-17
Change From Appropriation
FY 2017-18
Change From Appropriation
Total* $70.2 $70.2 $75.0 $0 $4.8
Federal $0 $0 $0 $0 $0
State $35.6 $35.6 $38.1 $0 $2.5
County (Reimb) $34.6 $34.6 $36.9 $0 $2.3
*Total TANF/GF impact prior to subaccount funds. The CMIPS II premise provides funding for the operation and maintenance of the automated system used to house IHSS case information, issue payroll to care providers and provide caseload data for each recipient and provider in the IHSS Program. The system also generates notices of action and rate changes. Change from 2016-17 Appropriation: There is no change in FY 2016-17. In FY 2017-18, additional funding is to implement SB 3 (Chapter 4, Statutes of 2016) for provider paid sick leave. The CMIPS II changes associated with the implementation of SB 75, which expands Medi-Cal IHSS benefits to undocumented children, are expected to be minimal and are assumed to be paid through the existing M&O funds. The current CMIPS II prime vendor contract expires on March 31, 2018 and a procurement to obtain continued M&O services is in progress. If the contract is awarded to a new prime vendor, there will be a transition period during which the incumbent will wind down operations and the new vendor will ramp up activities. Corresponding Budget Bill Language has been proposed to authorize the costs of this activity once known.

California Department of Social Services Local Assistance Executive Summary 2017-18 Governor’s Budget
32
This page is intentionally blank
California Department of Social Services Local Assistance Executive Summary 2017-18 Governor’s Budget
33
CHILDREN AND FAMILY SERVICES The Children and Family Services programs include approximately $6.0 billion total funds ($332.2 million GF) in FY 2016-17. In FY 2016-17, there is a net decrease of $4.8 million total funds ($3.6 million GF increase) from the 2016 enacted budget, primarily due to updated Foster Care caseload projections, slightly offset by the one-time payment of the Relative Foster Care Home Disallowance. The average monthly Aid to Families with Dependent Children-Foster Care caseload is projected to decrease 5.7 percent from the previous projection to 43,102 cases in FY 2016-17. The caseload is projected to increase to 43,129 in FY 2017-18. The FY 2017-18 Governor’s Budget includes approximately $6.2 billion total funds, ($408.6 million GF) for children’s programs. There is a net increase from the 2016 enacted budget of $203.8 million total funds ($80.0 million GF) due in large part to the CWDS Project, implementation of the Continuum of Care Reform (CCR) and implementation of the Approved Relative Caregiver (ARC) Program. The FY 2017-18 includes funding for the following programs:
• A total of $0.8 million ($0.3 million GF) associated with compiling and publishing reports and disclosing information on all near fatalities caused by suspected child abuse or neglect as required by AB 1625 (Chapter 320, Statutes of 2016). This includes costs to bring California into compliance with federally mandated child near fatality reporting and disclosure requirements. Additional funding for ten hours of social worker time per case is included to complete the child fatality and child near fatality disclosures.
• A total of $0.02 million ($0.01 million GF) related to AB 1849 (Chapter 609, Statues of 2016) to provide written verification to an eligible non-minor that he or she is enrolled in Medi-Cal prior to exiting foster care. The county is also required to provide eligible non-minors with a Medi-Cal Benefits Identification Card and ensure the eligible non-minor is transitioned into the Medi-Cal program, upon case closure, without interruption in coverage.

California Department of Social Services Local Assistance Executive Summary 2017-18 Governor’s Budget
34
Continuum of Care Reform (CCR)
Funding (In Millions)
FY 2016-17 Appropriation
FY 2016-17 Revised Budget
FY 2017-18 Governor’s
Budget FY 2016-17
Change From Appropriation
FY 2017-18
Change From Appropriation
Total $152.7 $140.2 $161.8 -$12.5 $9.1
Federal $33.3 $32.2 $39.8 -$1.1 $6.5
State $119.3 $107.9 $121.9 -$11.4 $2.6
County (Reimb.) $0.1 $0.1 $0.1 $0 $0
This premise provides funds to implement reform of the State’s current rate-setting system and program services for children and families in foster care placements. The reform also advances California’s long-standing goal to decrease the State’s reliance on long-term group home care by increasing youth placements in family settings.
Change from 2016-17 Appropriation: The CCR assistance costs reflect updates to foster care caseloads, which were previously held to the 2016-17 Governor’s Budget. This includes revised assumptions as to the number of cases that will transition out of group homes. The 2017-18 Governor’s Budget also reflects a phased approach and updated pace of CCR implementation due to the timing limitations of the necessary automation changes. Phase I, which establishes the basic rate, implemented January 1, 2017. Phase II, which will implement the various levels of care for the Home-Based Family Care rate structure, is anticipated to begin December 1, 2017. The FY 2017-18 costs reflect program reinvestments (assistance placement savings beginning July 1, 2017). These CCR assistance placement savings will be used to offset CCR administrative costs. The FY 2017-18 administrative costs reflect a full-year of funding for Child and Family Teams and implementation of the Resource Family Approval process. Caseload: Effective January 1, 2017, the basic level rate of $889 is paid for all new placements in one of the following settings: county foster family homes, relatives (including both federal and non-federal relative cases and regardless of participation in the ARC Program), nonrelative extended family members home, non-minor dependent in a supervised independent living placement Kinship-Guardianship Assistance Payment
California Department of Social Services Local Assistance Executive Summary 2017-18 Governor’s Budget
35
placements, Nonrelated Legal Guardians and Adoption Assistance Program placements. Current placements (cases existing prior to January 1, 2017) identified above that are receiving a basic rate less than the basic level $889, effective January 1, 2017, receive a rate increase up to the basic level rate. In FY 2017-18, it is assumed 115 group home placements will move to an intensive services FC placement; 345 group home placements will move to a short-term residential therapeutic program placement; and 515 group home placements will move to a family-based setting. The remaining 4,630 group home placements will not yet transition.

California Department of Social Services Local Assistance Executive Summary 2017-18 Governor’s Budget
36
Approved Relative Caregiver (ARC) Program
Funding (In Millions)
FY 2016-17 Appropriation
FY 2016-17 Revised Budget
FY 2017-18 Governor’s
Budget FY 2016-17
Change From Appropriation
FY 2017-18
Change From Appropriation
Total $31.4 $21.3 $25.0 -$10.1 -$6.4
Federal $0 $0 $0 $0 $0
State $31.4 $21.3 $25.0 -$10.1 -$6.4
County (Reimb.) $0 $0 $0 $0 $0
This premise provides funding for the rate paid for non-federally eligible foster care children placed with relatives. This program provides an additional amount above the CalWORKs grant to bring the total payment for non-federally eligible children placed with relative caregivers up to the same amount as the rate paid for federally eligible children placed with relative caregivers. Change from 2016-17 Appropriation: Effective January 1, 2017 as outlined in AB 1603 (Chapter 25, Statutes of 2016), counties not participating in the ARC program are required to make payments equal to the foster care basic rate paid to non-relative foster family homes (the same level of payments as those made by ARC opt-in counties). This requirement equalizes support for relative caregivers regardless of whether they live in a county that participates in the ARC program. Caseload: Funding for the ARC Program will be based on updated caseload projections using actual caseload (4,857 cases statewide in FY 2017-18) instead of the 2011 capped caseload projections of 6,252 cases.
California Department of Social Services Local Assistance Executive Summary 2017-18 Governor’s Budget
37
Relative Foster Care Home Disallowance
Funding (In Millions)
FY 2016-17 Appropriation
FY 2016-17 Revised Budget
FY 2017-18 Governor’s
Budget FY 2016-17
Change From Appropriation
FY 2017-18
Change From Appropriation
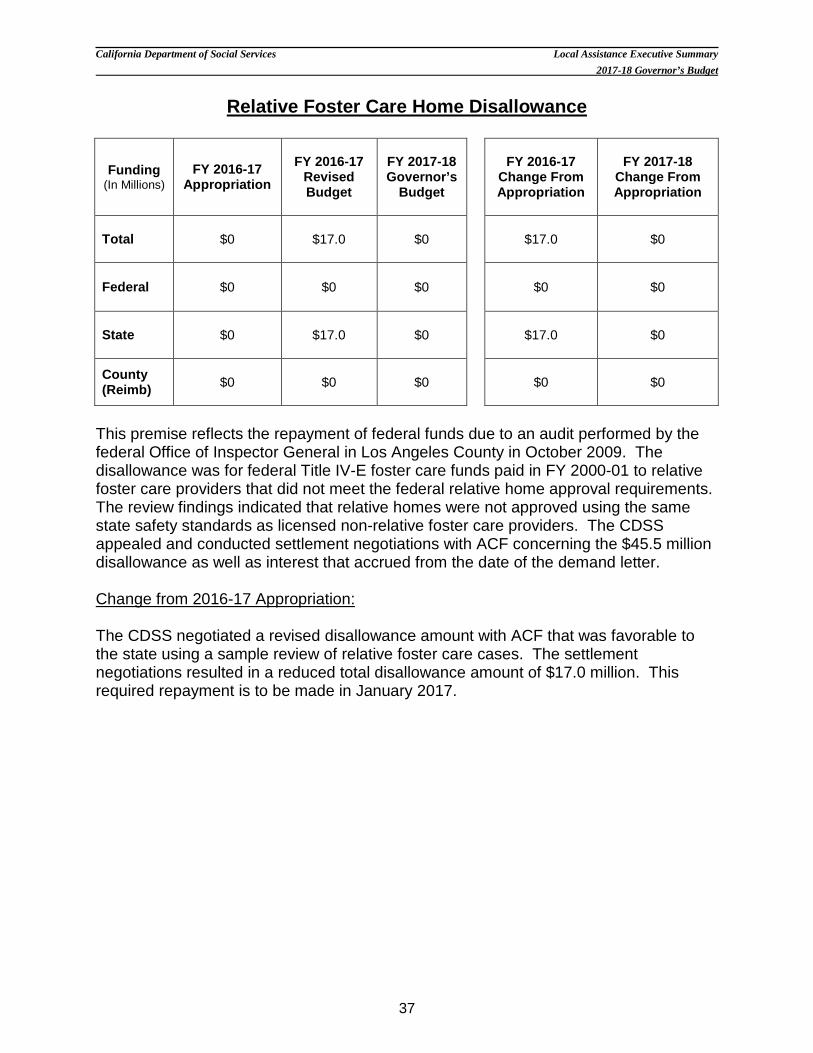
Total $0 $17.0 $0 $17.0 $0
Federal $0 $0 $0 $0 $0
State $0 $17.0 $0 $17.0 $0
County (Reimb) $0 $0 $0 $0 $0
This premise reflects the repayment of federal funds due to an audit performed by the federal Office of Inspector General in Los Angeles County in October 2009. The disallowance was for federal Title IV-E foster care funds paid in FY 2000-01 to relative foster care providers that did not meet the federal relative home approval requirements. The review findings indicated that relative homes were not approved using the same state safety standards as licensed non-relative foster care providers. The CDSS appealed and conducted settlement negotiations with ACF concerning the $45.5 million disallowance as well as interest that accrued from the date of the demand letter. Change from 2016-17 Appropriation: The CDSS negotiated a revised disallowance amount with ACF that was favorable to the state using a sample review of relative foster care cases. The settlement negotiations resulted in a reduced total disallowance amount of $17.0 million. This required repayment is to be made in January 2017.

California Department of Social Services Local Assistance Executive Summary 2017-18 Governor’s Budget
38
Child Welfare Digital Services (CWDS)
Funding (In Millions)
FY 2016-17 Appropriation
FY 2016-17 Revised Budget
FY 2017-18 Governor’s
Budget FY 2016-17
Change From Appropriation
FY 2017-18
Change From Appropriation
Total $55.6 $55.6 $176.0 $0 $120.4
Federal $27.8 $27.8 $88.0 $0 $60.2
State $27.8 $27.8 $88.0 $0 $60.2
County (Reimb) $0 $0 $0 $0 $0
This premise reflects the costs associated with the development and implementation of the CWDS Project, which will replace the aging CWS/CMS. Change from 2016-17 Appropriation: Funding is needed in FY 2017-18 for development services associated with several interfaces, as well as for state resources to extend and enhance the technology platform, begin providing Development and Operations services and fill critical resource gaps existing in the Project’s staffing model. Additional vendor services are required to provide implementation support and software development services. Increased county implementation readiness, project management, data conversion, policy and training activities also will be done in FY 2017-18. The FY 2016-17 and FY 2017-18 costs are consistent with Special Project Report #2 and reflect baseline budget adjustments.