2017-18 budget
TRANSCRIPT

2017-18
Budget
ContentsIntroduction
Annual Blueprint
How is the money spent
Where does the money come from
Where does the money go
Capital WorksRoads Capital Works Program Open Space Capital Works Program Buildings Capital Works Program Drainage Capital Works Program
AccountabilityUnderstanding the Budget Statements
Income StatementBalance SheetCashflow StatementFunding Statement
AppendixA - Budget Detail by Department B - Comparative Budget
1
2
2
2
3
46
101111
1212
13141516
17A1-22
B1-B12
BUDG
ET

The City’s BudgetThe Randwick City Council Budget is one part of the Integrated Planning and Reporting Framework that Council operates under. This framework comprises our 20 year ‘Randwick City Plan’, that guides a four year Delivery Program which produces annually an Operational Plan & Budget.
Underpinning our Integrated Planning Framework is our Resourcing Strategy. This comprises our Workforce Plan, Asset Management Strategy and Plans and our Long Term Financial Plan.
The 2017-18 Budget has been developed using the principles of the plans that make up the Resourcing Strategy, in particular the Long Term Financial Plan.
Contained within that Long Term Financial Plan are six main financial objectives of Randwick City Council.
Those six (6) main objectives include: 1) maintaining existing service levels to the community, 2) maintaining a strong cash position including sufficient cash reserves for employee leave entitlements, 3) ensuring Council continues to deliver a balanced annual budget, 4) ensuring Capital expenditure on asset renewals, upgrades and extensions represents 20% of the annual revenue budget, 5) ensure all plans adopted by Council are incorporated into and integrated with the Long Term Financial Plan and 6) that Randwick City Council remains debt free.
Even though the 2017-18 Budget was prepared during a “merger proposal period”, the budget has been prepared on a ‘business-as-usual’ basis.
Randwick City Council 2017/18 Budget | Page 01

Annual BlueprintThe adopted budget becomes a blueprint for how and where Randwick City spends its money each year. And also where the money comes from to pay for the services that it provides.
The budget sets out what activities are funded in the financial year and at what level. How much it will spend in operating and capital expenses for parks and gardens, roads, public safety, sports fields, and a wide range of other activities.
How is the money spent?Employee Costs 42% - $62.034m
Salaries & Wages, Superannuation, Annual Leave, Long Service Leave, Training and Development, Uniforms, FBT expenses, Workers Compensation.
Materials and Contracts 25% - $36.665mDomestic garbage collection contracts, garbage disposal expenses, IT Software and Hardware maintenance, building maintenance contracts, plumbers, electricians.
Net Capital Expenditure 21% - $31.391mMajor and minor construction contracts for asset renewals and upgrades, planning consultants, plant and fleet purchases, library resources, ICT infrastructure.
Other Expenses 11% - $15.886mInsurance premiums, Street lighting, Electricity, Water & Sewerage Charges, Bank Charges, Fire Service Levy, Council Events, Councillor Expenses, Donations, Telephone
Net Savings for Future Years 1% - $2.084mTransferring funds to reserves for plant replacement programs, employees leave entitlements, s94 plan, contaminated site remediation, future capital works projects.
Where does the money come from?
Rates & Annual Charges 73% - $108.227m
Residential rates, business rates, environment levy, domestic waste management charge, stormwater management charge.
User Fees and Charges 12% - $17.947m
Development applications, regulatory charges, venue hire, learn to swim classes, sportsfield hire.
Investment Interest 1% - $1.806m
Interest earned on Council’s investment portfolio. Interest on overdue annual rates and charges and legal costs recovery.
Other Revenues 6% - $8.542m
Residential rental income, commercial rental income, parking fines, regulatory fines,
Operating Grants & Contributions 4.5% - $6.464m
Financial Assistance Grant, library subsidy, community development funding, child care subsidies.
Capital Grants & Contributions 3.5% - $5.086m
Section 94 Developer Contributions, Roads to Recovery Grant Program. Grants received to fund capital projects.
The budget sets out how much revenue is raised through, for example, different kinds of fees and charges, rates and any grants and contributions from the state and federal governments.
Randwick City Council 2017/18 Budget | Page 02

Where does the money go?At the start of every Council term the service levels are set for every one of the numerous activities undertaken by Randwick City Council. The budget allocations made each year ensure that these activities are sufficiently funded to achieve the service levels that have been set.
These service standards are judged on a regular basis through the conduct of the Community Satisfaction Survey.
Public safety - 6%
Food inspections, building inspections, building regulation enforcement, rangers, fire safety and protection, environment protection enforcement.
Our beaches - 4%
Beach inspectors at Clovelly Beach, Coogee Beach and Maroubra Beaches, beach promenade cleaning and beach cleaning.
State Government charges - 4%
Fire Brigade Levy, State Emergency Services Levy, Street Lighting, Valuation Fees, Department of Planning Levy.
Environmental Sustainability - 3%
Sustaining Our City Program, Community education programs, biodiversity programs, climate protection initiatives, bushland remediation and maintenance.
Parks, recreation & culture - 15%
Council cultural events, parks, sportsfields, park equipment and facilities, Des Renford Leisure Centre, Randwick Environment Park and Community Centre.
Waste Management - 23%
Garbage collection, recycling collection, green waste, scheduled pick ups, on call picks ups, illegal dumping management, waste education programs.
Library and community services - 9%
Bowen Library, Margaret Martin Library, Malabar Library, Moverly Children’s Centre, Youth & Children’s programs, and community partnerships.
Maintain roads, footpaths & drainage - 5%
Street cleaning, street sweeping, road pavement repairs,footpath repairs, line marking, drainage clearing, kerb and gutter repairs.
Engineering & traffic - 2%
Asset planning, construction design, engineering services, asset management services, floodplain management studies and surveys, asset data collection
Governance - 2%
Elections, Councillor fees and expenses, subscriptions to local authority associations, meetings of council and policy making committees, area representation.
Planning & development - 4%
Town planning, development application assessments,strategic planning, local environment planning, development control planning.
Major Works and Construction - 24%
Major and minor construction contracts for asset renewals and upgrades, planning consultants, plant and fleet purchases, library resources, IT purchases.
Randwick City Council 2017/18 Budget | Page 03
Capital WorksThe Capital Works Programs are driven by the Randwick City Council Asset Management Strategy. The objective of the Asset Management Strategy is to establish a framework to guide the planning, construction, maintenance and operation of infrastructure essential for Randwick City Council to provide services to the community.
Each year a list of Capital Works is developed with the guidance of the Asset Management Strategy in conjunction with the Asset Management Plans. In the 2017-18 financial year Randwick City Council will be spending $13.1M on Roads, $8.5M in Open Spaces, $5.75M on Buildings and $1.2M on Drainage.
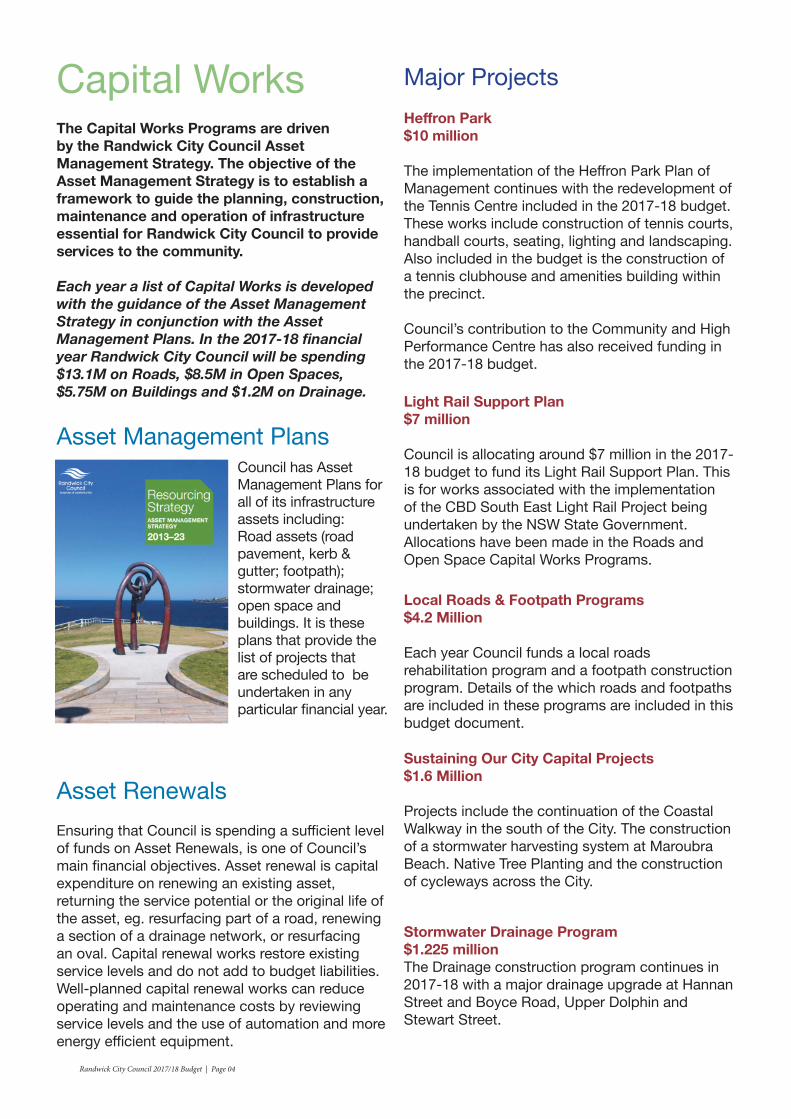
Asset Management Plans
Asset RenewalsEnsuring that Council is spending a sufficient level of funds on Asset Renewals, is one of Council’s main financial objectives. Asset renewal is capital expenditure on renewing an existing asset, returning the service potential or the original life of the asset, eg. resurfacing part of a road, renewing a section of a drainage network, or resurfacing an oval. Capital renewal works restore existing service levels and do not add to budget liabilities. Well-planned capital renewal works can reduce operating and maintenance costs by reviewing service levels and the use of automation and more energy efficient equipment.
Major Projects Heffron Park$10 million
The implementation of the Heffron Park Plan of Management continues with the redevelopment of the Tennis Centre included in the 2017-18 budget. These works include construction of tennis courts, handball courts, seating, lighting and landscaping. Also included in the budget is the construction of a tennis clubhouse and amenities building within the precinct.
Council’s contribution to the Community and High Performance Centre has also received funding in the 2017-18 budget.
Light Rail Support Plan$7 million
Council is allocating around $7 million in the 2017-18 budget to fund its Light Rail Support Plan. This is for works associated with the implementation of the CBD South East Light Rail Project being undertaken by the NSW State Government. Allocations have been made in the Roads and Open Space Capital Works Programs.
Local Roads & Footpath Programs$4.2 Million
Each year Council funds a local roads rehabilitation program and a footpath construction program. Details of the which roads and footpaths are included in these programs are included in this budget document.
Stormwater Drainage Program$1.225 millionThe Drainage construction program continues in 2017-18 with a major drainage upgrade at Hannan Street and Boyce Road, Upper Dolphin and Stewart Street.
Council has Asset Management Plans for all of its infrastructure assets including: Road assets (road pavement, kerb & gutter; footpath); stormwater drainage; open space and buildings. It is these plans that provide the list of projects that are scheduled to be undertaken in any particular financial year.
Sustaining Our City Capital Projects$1.6 Million
Projects include the continuation of the Coastal Walkway in the south of the City. The construction of a stormwater harvesting system at Maroubra Beach. Native Tree Planting and the construction of cycleways across the City.
Randwick City Council 2017/18 Budget | Page 04

Programs 2017/18 Budget Allocation
Roads Program 13,116,495Open Space Program 8,307,000Buildings Program 5,750,000Drainage Program 1,225,000
Total Infrastructure Capital Works Program 28,398,495
Funding Sources
General Revenue 18,684,000Environment Levy 1,605,000Domestic Waste Management Reserve 1,000,000Stormwater Management Charge 913,000s94 Contributions 2,800,000Federal and State Government Grants 2,691,495Other Revenue 705,000
Total Infrastructure Capital Works Program Funding 28,398,495
Capital Works Program Summary
Total Capital Expenditure
The Capital Works Programs are the capital expenditure undertaken on Council’s public infrastructure. That infrastructure includes roads, footpaths, open space assets, drainage and buildings. Other capital expenditure such as the purchase of library resources, plant and equipment replacements, projects included in the Sustaining Our City Program and new or renewed information communication technology is classified as capital expenditure however is not included in the Capital Works Programs.
Randwick City Council 2017/18 Budget | Page 05

Roads Capital Works ProgramProject 2017/18
Budget Allocation
Local Road Rehabilitation Program 2,500,000 Footpath Construction Program 1,700,000 Joint Sealing Program 50,000 Concrete Road Repair Program 225,000 Cycling Facilities 200,000 Kerb & Gutter Reconstruction 150,000 Footpath Defects Program 275,000 Retaining Wall Program 200,000 Area Parking Scheme 30,000 Block Grant Program -Regional Roads 246,000 Road Rehabilitation - Bus Routes 90,000 Roads to Recovery Program 1,445,495 Mobility Improvements 50,000 Traffic Committee Works 100,000 Light Rail Support Plan 5,150,000 Vehicular Access 505,000 Infrastructure Restorations 200,000 Total Roads Capital Works Program 13,116,495
FundingFederal and State Government Grants 2,691,495 Environment Levy 100,000 S94 Contributions 1,500,000 General Revenue 8,120,000Other Revenue 705,000 Total Roads Program Funding 13,116,495
Randwick City Council 2017/18 Budget | Page 06

Local Roads Rehabilitation ScheduleRoad Location - Start/Finish Suburb
Arthur Lane - Silver Street/Waratah Avenue RandwickBaird Avenue - Beauchamp Road/Perry Street MatraviileByng Lane - Byng Street/Haig Street MaroubraCarr Street - Arden Street/Brook Street CoogeeCarr Street - Dudley Street/5 Carr Street RandwickPrince Edward Street - 1216 Anzac Parade/1B Prince Edward Street MalabarSecond Avenue - Malabar Road/The Causeway MaroubraBridges Street - Broome Street/Malabar Road MaroubraClovelly Road - 58 Clovelly Road/42 Clovelly Road RandwickDay Lane - Edward Avenue/See Street KingsfordFitzgerald Lane - Fitzgerald Avenue/Bridge Street MaroubraFitzgerald Lane - Bridge Street/Scott Street MaroubraWalsh Avenue - Paine Street/Wild Street MaroubraHolmes Street - 76 Holmes Street/Cooper Street MaroubraBoyce Road - Anzac Parade/Piccadilly Place MaroubraMount Street - Carr Street/Coogee Bay Road Coogee
Botany Lane - Barker Street/Middle Street KingsfordBotany Lane - Middle Street/Meeks Street KingsfordBotany Street - Anzac Parade/Sturt Street KingsfordNamatjira Place - Little Bay Road ChifleyDove Lane - Douglas Street/Raby Lane RandwickPar Lane - Dove Lane/Raby Lane RandwickSturt Street - Avoca Street/Paton Street KingsfordElphinstone Road - Moverly Road/Roper Avenue South CoogeeElphinstone Road - 18 Elphinstone Road/20 Elphinstone Road South CoogeeElphinstone Road - Iluka Place/Bundock Street South CoogeeGarden Lane - Garden Street/Anzac Parade MaroubraHolmes Street - Avoca Street/Garden Street MaroubraIluka Place - Elphinstone Road South CoogeeJordan Lane - Bunnerong Road/Shirley Crescent MatravilleTram Lane - Church Street/Alison Road RandwickPavement Survey City Wide
Randwick City Council 2017/18 Budget | Page 07

Footpath Construction ScheduleFootpath Location - Start/Finish (Side of Street) Suburb
Abbott Street - Various Locations - 17 Abbott Street/Mount Street - (South) CoogeeAbbott Street - 20 Abbott Street/26 Abbott Street - (North) CoogeeAlexandria Parade - Opposite 8 Alexandria Parade/Opposite 16 Alexandria Pa-rade - (East)
South Coogee
Alison Road - Avoca Street/Lingard Street - (North) RandwickAlison Road - 1 Raleigh Street/Pauling Avenue - (North) CoogeeAlkoo Avenue - 18 Alkoo Avenue/Mirrabrooka Crescent - (Northwest) Little BayArcadia Street - Arden Street/15 Arcadia Street - (South) CoogeeArcadia Street - 11 Arcadia Street/Hill Street - (South) CoogeeArden Street - 140 Arden Street/150 Arden Street - (West) CoogeeAvoca Street - Various Locations - Anzac Parade/Ainslie Avenue - (West) RandwickBalfour Road - Wills Playground/ - (West) KensingtonBalfour Road - 52 Balfour Road/ - (West) KensingtonBalfour Road - 46 Balfour Road/ - (West) KensingtonBalfour Road - 38 Balfour Road/ - (West) KensingtonBalfour Road - 34 Balfour Road/ - (West) KensingtonBega Avenue - 3 Bega Avenue/Woomera Road - (East) Little Bay
Belmore Road - Alison Road/Randwick Shopping Centre RandwickBotany Street - Magill Street/61 Botany Street - (East) RandwickBotany Street - Hay Street/Magill Street - (East) RandwickBotany Street - 127 Botany Street/Hay Street - (East) RandwickBurnie Street - Mundarra Street/Clifton Road (South) ClovellyCarnegie Circuit - Warburton Street/6 Carnegie Circuit - (Northwest to North-east)
Chifley
Carnegie Circuit - 3-3A Carnegie Circuit/Warburton Street - (South) ChifleyClovelly Road - 336 Clovelly Road/350 Clovelly Road Clovelly
Randwick City Council 2017/18 Budget | Page 08
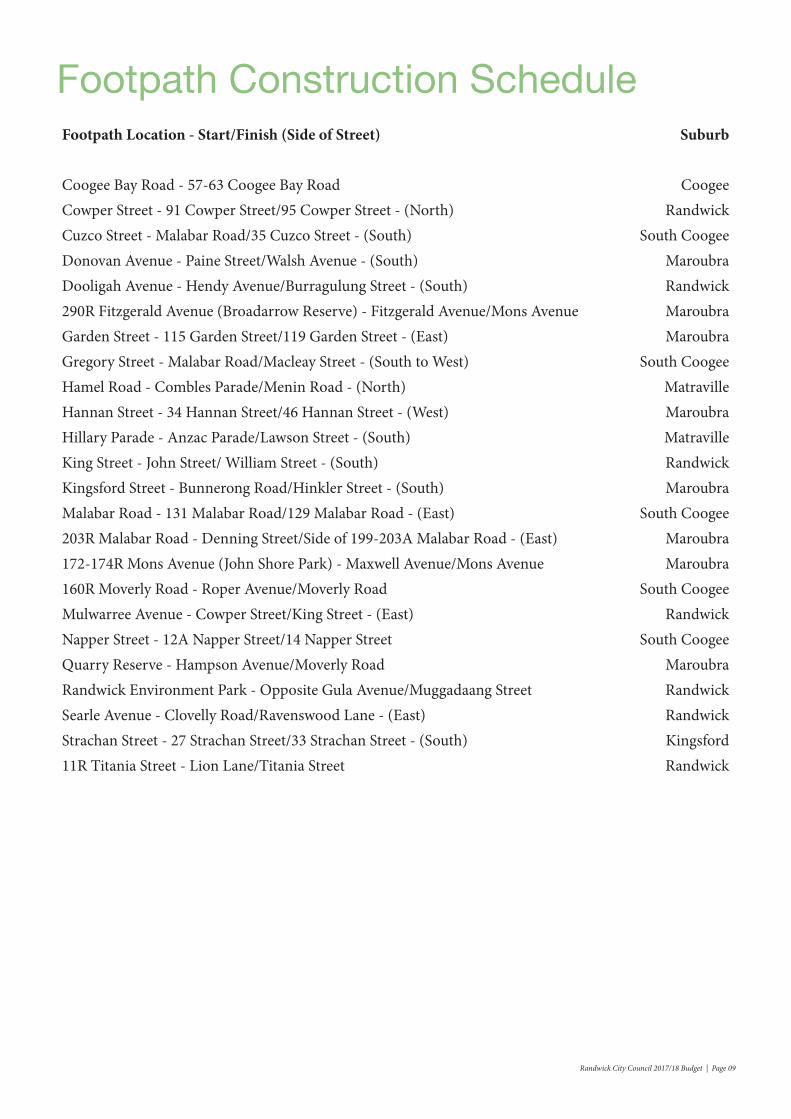
Footpath Construction ScheduleFootpath Location - Start/Finish (Side of Street) Suburb
Coogee Bay Road - 57-63 Coogee Bay Road CoogeeCowper Street - 91 Cowper Street/95 Cowper Street - (North) RandwickCuzco Street - Malabar Road/35 Cuzco Street - (South) South CoogeeDonovan Avenue - Paine Street/Walsh Avenue - (South) MaroubraDooligah Avenue - Hendy Avenue/Burragulung Street - (South) Randwick290R Fitzgerald Avenue (Broadarrow Reserve) - Fitzgerald Avenue/Mons Avenue MaroubraGarden Street - 115 Garden Street/119 Garden Street - (East) MaroubraGregory Street - Malabar Road/Macleay Street - (South to West) South CoogeeHamel Road - Combles Parade/Menin Road - (North) MatravilleHannan Street - 34 Hannan Street/46 Hannan Street - (West) MaroubraHillary Parade - Anzac Parade/Lawson Street - (South) MatravilleKing Street - John Street/ William Street - (South) RandwickKingsford Street - Bunnerong Road/Hinkler Street - (South) MaroubraMalabar Road - 131 Malabar Road/129 Malabar Road - (East) South Coogee203R Malabar Road - Denning Street/Side of 199-203A Malabar Road - (East) Maroubra172-174R Mons Avenue (John Shore Park) - Maxwell Avenue/Mons Avenue Maroubra160R Moverly Road - Roper Avenue/Moverly Road South CoogeeMulwarree Avenue - Cowper Street/King Street - (East) RandwickNapper Street - 12A Napper Street/14 Napper Street South CoogeeQuarry Reserve - Hampson Avenue/Moverly Road MaroubraRandwick Environment Park - Opposite Gula Avenue/Muggadaang Street RandwickSearle Avenue - Clovelly Road/Ravenswood Lane - (East) RandwickStrachan Street - 27 Strachan Street/33 Strachan Street - (South) Kingsford11R Titania Street - Lion Lane/Titania Street Randwick
Randwick City Council 2017/18 Budget | Page 09

Open Space Capital Works ProgramProject 2017/18
Budget Allocation
Coastal Walkway 400,000 Heffron Park Tennis Courts 4,400,000 General Parks Upgrade 100,000 Street Banner Program 75,000 Native Tree Planting 90,000 Maroubra Beach Stormwater Harvesting 1,015,000 Light Rail Support Plan 1,800,000 Latham Park Archery Facilities 55,000Chifley Sports Reserve Baseball Facilities 10,000Coogee Croquet Club Entrance 8,000Kensington Oval Sight Screens 154,000Maroubra Beach Picnic Tables 150,000Coastal Public Safety Risk Assessment Signage 50,000Total Open Space Capital Works Program 8,307,000
FundingS94 Contributions 1,300,000 Domestic Waste Reserve 1,000,000 Environment Levy 1,505,000 General Revenue 4,502,000 Total Open Space Program Funding 8,307,000
Randwick City Council 2017/18 Budget | Page 10

Buildings Capital Works ProgramProject 2017/18
Budget Allocation
The Heffron Centre - Community & High Performance Centre 3,000,000 Heffron Park Tennis Centre Clubhouse and Amenities 2,600,000 Workplace Health and Safety Upgrades 150,000 Total Buildings Capital Works Program 5,750,000
FundingGeneral Revenue 5,750,000 Total Building Program Funding 5,750,000
Drainage Capital Works ProgramProject 2017/18
Budget Allocation
Hannan Street and Boyce Road Drainage Upgrade 500,000Upper Dolphin Street Upgrade 66,000Stewart Street Upgrade 70,000Stormwater Relining - various sites 365,000Minor Drainage Upgrades 137,000CCTV, Design and Investigations 87,000Total Drainage Capital Works Program 1,225,000
FundingStormwater Service Charge 913,000 General Revenue 312,000 Total Drainage Program Funding 1,225,000
Randwick City Council 2017/18 Budget | Page 11
AccountabilityAdministration and Finance Committee Council’s Administration and Finance Committee Meetings, held monthly throughout the year, are the Council’s mechanism to monitor and provide input into financial performance and how Council uses resources to achieve results on a regular basis.
Quarterly Budget ReviewsQuarterly Budget Review Statements (QBRS) are issued three times during the financial year (September, December and March) by Council’s Responsible Accounting Officer.
The budget is not a static document and must be responsive to changing circumstances over the financial year. In many ways the budget process simply begins with Annual Budget adoption in June.
Annual ReportRandwick spends significant amounts of ratepayer dollars to operate city services, so it should be accountable for the performance of its services and the results achieved from year to year.
Council’s main method of communicating this is through the Annual Report. It highlights the achievements made throughout the year with the funds provided in the budget. Council’s complete set of financial statements are also included as part of the Annual Report.
AuditsThe Auditor-General through the Audit Office of NSW performs regular interim audits and provides a final report at the completion of the audit of the year end Financial Reports.
All audit findings, results and reports resulting from the external audit are submitted to Council’s Internal Audit Committee (IAC) for review, with bi-annual meetings held with the IAC and the Audit Office to discuss any matters arising.
Council is obliged to comply with the accounting standards issued by the Australian Accounting Standards Board (AASB), the Accounting Code of Practice issued by the NSW Office of Local Government and the various financial requirements of the Local Government Act 1993 and the Regulations made thereunder.
Income StatementThe Income Statement is a financial statement that measures Council’s financial performance over a specific accounting period. Financial performance is assessed by giving a summary of how Council incurs its revenue and expenses; primarily through its operating activities. It also shows the net profit or loss incurred over a specific accounting period, typically over a financial year.
Balance SheetThe Balance Sheet is a financial statement that summarises Council’s assets, liabilities and the Community equity at a specific point in time. These three balance sheet segments give the community an idea as to what the Council owns and owes, as well as the amount invested by the Community.
Cashflow StatementComplementing the balance sheet and income statement, is the cashflow statement. It records the amounts of cash and cash equivalents entering and leaving the Council.
Funding StatementThe Funding Statement is Council’s main tool for combining the three main financial statements when preparing the budget. It shows the operating result from Council’s day-to-day activities, the movement of cash to and from Council’s reserves, what funding is then available for Capital Works and ultimately a balanced budget bottom line.
Understanding the Budget Statements
Randwick City Council 2017/18 Budget | Page 12

Income Statement$’000 2017/18 Budget 2016/17 Budget
IncomeRates and Annual Charges 108,227 106,081User Fees and Charges 17,947 17,182Interest & Investment Revenue 1,806 2,190Other Revenues 8,542 8,394Operating Grants and Contributions 6,464 6,453Capital Grants and Contributions 5,086 5,086Total Income 148,073 145,386
ExpensesEmployee Costs 62,034 59,882Borrowing Costs 0 0Materials & Contracts 36,665 35,124Depreciation 23,529 22,845Other Expenses 15,886 15,799Total Expenses 138,114 133,649
Net Operating Result - Surplus/(Loss) 9,959 11,737
Net Operating Result before Capital Grants and Contributions - Surplus/(Loss) 4,872 6,650
Randwick City Council 2017/18 Budget | Page 13

Balance Sheet$ ‘000 2017/18 Budget 2016/17 Budget
Assets
Current AssetsCash & Cash Equivalents 1,836 4,074Investments 36,966 30,140Receivables 7,031 6,344Inventories 507 523Other 1,316 846Total Current Assets 47,656 41,928
Non Current AssetsReceivables 479 496Infrastructure, Property, Plant & Equipment 1,471,859 1,464,129Investments accounted for using the equity method 7 7Total Non Current Assets 1,472,345 1,464,632
Total Assets 1,520,001 1,506,560
Liabilities
Current LiabilitiesPayables 15,780 14,550Borrowings 0 0Provisions 18,120 16,562Total Current Liabilities 33,900 31,112
Non Current LiabilitiesPayables 260 260Borrowings 0 0Provisions 202 311Total Non Current Liabilities 462 571
Total Liabilities 34,362 31,683
Net Assets 1,485,639 1,474,877
Community EquityRetained Earnings 1,485,639 1,474,877Total Community Equity 1,485,639 1,474,877
Randwick City Council 2017/18 Budget | Page 14

Cashflow Statement$ ‘000 2017/18 Budget 2016/17 Budget
Cashflows from Operating Activities
ReceiptsRates & Annual Charges 108,122 105,865User Fees & Charges 17,386 17,353Investment & Interest Revenue Received 1,902 2,177Grants & Contributions 11,903 11,569Bonds, Deposits & Retention Amounts Received 89 243Other 8,360 8,102PaymentsEmployee Benefits & On-Costs (61,613) (58,368)Materials and Contracts (36,205) (35,806)Borrowing Costs 0 0Other (17,325) (16,192)Net Cash Provided(or Used in) Operating Activities 32,619 34,943
Cashflows from Investing Activities
ReceiptsSale of Investment Securities 60,100 59,100Sale of Infrastructure, Property, Plant & Equipment 1,321 1,167PaymentsPurchase of Investment Securities (62,280) (62,280)Purchase of Infrastructure, Property, Plant & Equipment (31,587) (32,093)Net Cash Provided (or Used in) Investing Activities (32,447) (34,106)
Cashflows from Financing ActivitiesNil 0 0
Net Increase/(Decrease) in Cash & Cash Equivalents 172 837
Plus: Cash & Cash Equivalents st Beginning of the Year 1,664 3,237
Cash & Cash Equivalents - End of the Year 1,836 4,074
Plus: Investments on Hand - End of Year 36,966 30,140
Total Cash, Cash Equivalents and Investments 38,802 34,214
Randwick City Council 2017/18 Budget | Page 15

Funding Statement$’000 2017/18 Budget 2016/17 Budget
IncomeRates and Annual Charges 108,227 106,081User Fees and Charges 17,947 17,182Interest & Investment Revenue 1,806 2,190Other Revenues 8,542 8,394Operating Grants and Contributions 6,464 6,453Capital Grants and Contributions 5,086 5,086Total Income 148,073 145,386
ExpensesEmployee Costs 62,034 59,882Borrowing Costs 0 0Materials & Contracts 36,665 35,124Depreciation 23,529 22,845Other Expenses 15,885 15,799Total Expenses 138,114 133,649
Net Operating Result - Surplus/(Loss) 9,959 11,737
Add back non-cash items 23,529 22,845
Funding Available for Capital Expenditure 33,488 34,582
Capital Expenditure 32,712 34,181Proceeds from Sale of Non Current Assets (1,321) (1,159)Net Capital Additions 31,391 33,021
Net Transfer to/(from) Reserves 2,084 1,547
Budget Result (Surplus)/Deficit (12) (13)
Randwick City Council 2017/18 Budget | Page 16
Appendix
A - Budget Detail by Department
B - Comparative Budgets
Randwick City Council 2017/18 Budget | Page 17
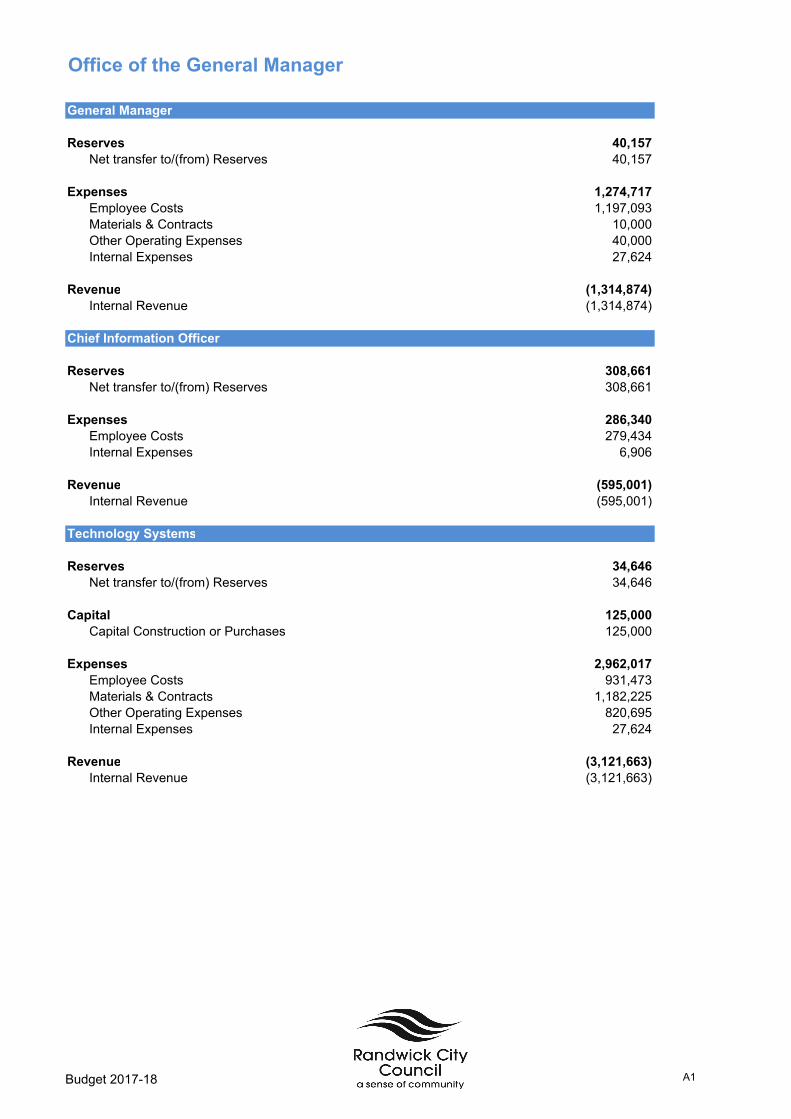
Office of the General Manager
General Manager
Reserves 40,157
Net transfer to/(from) Reserves 40,157
Expenses 1,274,717
Employee Costs 1,197,093
Materials & Contracts 10,000
Other Operating Expenses 40,000
Internal Expenses 27,624
Revenue (1,314,874)
Internal Revenue (1,314,874)
Chief Information Officer
Reserves 308,661
Net transfer to/(from) Reserves 308,661
Expenses 286,340
Employee Costs 279,434
Internal Expenses 6,906
Revenue (595,001)
Internal Revenue (595,001)
Technology Systems
Reserves 34,646
Net transfer to/(from) Reserves 34,646
Capital 125,000
Capital Construction or Purchases 125,000
Expenses 2,962,017
Employee Costs 931,473
Materials & Contracts 1,182,225
Other Operating Expenses 820,695
Internal Expenses 27,624
Revenue (3,121,663)
Internal Revenue (3,121,663)
Budget 2017-18 A1

Business Systems
Expenses 2,176,564
Employee Costs 827,464
Materials & Contracts 1,345,300
Other Operating Expenses 3,800
Revenue (2,176,564)
Internal Revenue (2,176,564)
Spatial Systems
Reserves 8,661
Net transfer to/(from) Reserves 8,661
Capital 120,000
Capital Construction or Purchases 120,000
Expenses 990,446
Employee Costs 645,193
Materials & Contracts 335,347
Other Operating Expenses 3,000
Internal Expenses 6,906
Revenue (1,119,107)
Internal Revenue (1,119,107)
Communications
Reserves 17,323
Net transfer to/(from) Reserves 17,323
Expenses 1,159,401
Employee Costs 612,089
Materials & Contracts 521,000
Other Operating Expenses 12,500
Internal Expenses 13,812
Revenue (1,176,724)
Internal Revenue (1,176,724)
Corporate Improvement
Reserves 43,307
Net transfer to/(from) Reserves 43,307
Expenses 1,014,317
Employee Costs 862,387
Materials & Contracts 105,000
Other Operating Expenses 12,400
Internal Expenses 34,530
Revenue (1,057,624)
Internal Revenue (1,057,624)
Budget 2017-18 A2

Governance and Financial Services
Governance & Financial Services
Reserves 14,173
Net transfer to/(from) Reserves 14,173
Expenses 510,177
Employee Costs 433,271
Materials & Contracts 32,000
Other Operating Expenses 38,000
Internal Expenses 6,906
Revenue (524,350)
Internal Revenue (524,350)
Councillors' Expenses
Expenses 487,852
Employee Costs 8,000
Other Operating Expenses 479,852
Election
Reserves (562,320)
Net transfer to/(from) Reserves (562,320)
Expenses 622,320
Other Operating Expenses 622,320
Revenue (60,000)
User Charges And Fees (60,000)
Financial Operations
Reserves 4,601,488
Net transfer to/(from) Reserves 4,601,488
Expenses 5,564,142
Employee Costs 2,202,459
Materials & Contracts 236,160
Other Operating Expenses 3,111,711
Internal Expenses 13,812
Revenue (84,809,045)
Rates And Annual Charges (75,077,298)
User Charges And Fees (204,500)
Interest (1,533,455)
Other Revenues (88,000)
Contributions And Donations (3,489,774)
Internal Revenue (4,416,018)
Budget 2017-18 A3

Corporate & Financial Planning
Reserves 17,328
Net transfer to/(from) Reserves 17,328
Expenses 704,642
Employee Costs 604,830
Materials & Contracts 86,000
Internal Expenses 13,812
Revenue (721,970)
Internal Revenue (721,970)
Organisational Staff Services
Reserves 17,323
Net transfer to/(from) Reserves 17,323
Expenses 3,199,595
Employee Costs 3,073,783
Materials & Contracts 112,000
Internal Expenses 13,812
Revenue (3,216,918)
Internal Revenue (3,216,918)
Information Management
Reserves 8,661
Net transfer to/(from) Reserves 8,661
Expenses 990,017
Employee Costs 728,111
Materials & Contracts 255,000
Other Operating Expenses 0
Internal Expenses 6,906
Revenue (998,678)
User Charges And Fees (180,000)
Internal Revenue (818,678)
Stores & Purchasing
Reserves 19,550
Net transfer to/(from) Reserves 19,550
Expenses 683,765
Employee Costs 654,518
Materials & Contracts 11,000
Internal Expenses 18,247
Revenue (703,315)
Internal Revenue (703,315)
Budget 2017-18 A4
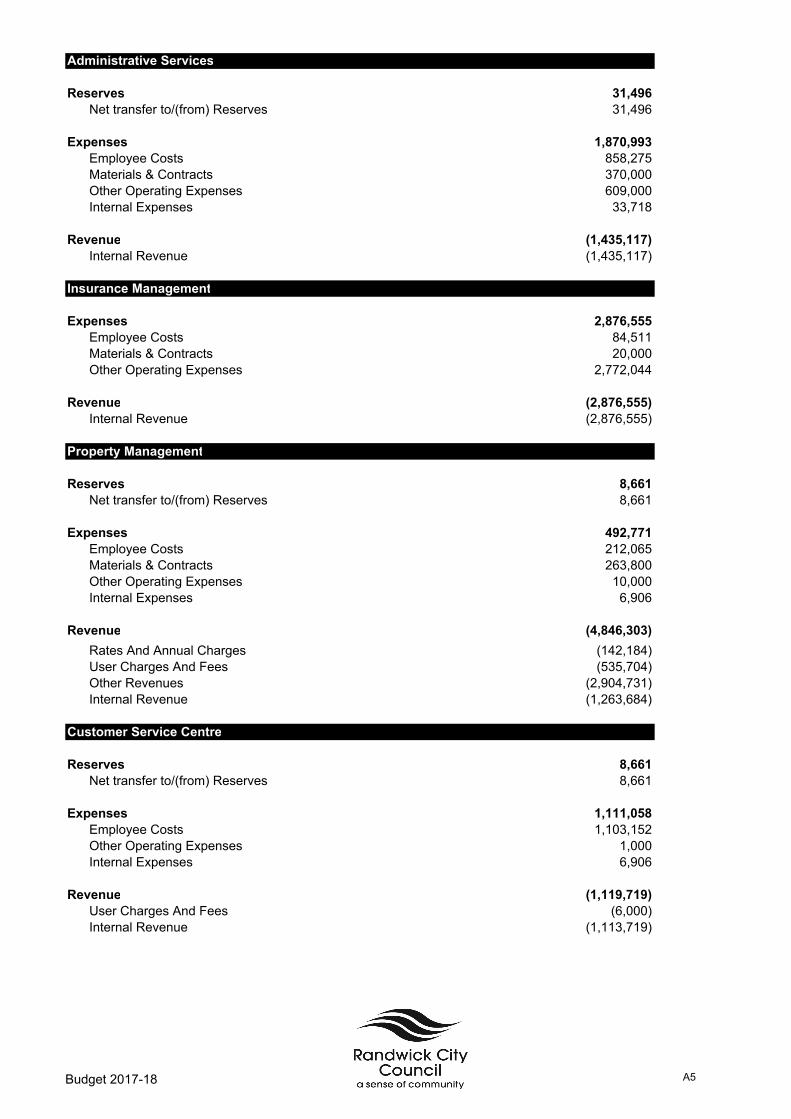
Administrative Services
Reserves 31,496
Net transfer to/(from) Reserves 31,496
Expenses 1,870,993
Employee Costs 858,275
Materials & Contracts 370,000
Other Operating Expenses 609,000
Internal Expenses 33,718
Revenue (1,435,117)
Internal Revenue (1,435,117)
Insurance Management
Expenses 2,876,555
Employee Costs 84,511
Materials & Contracts 20,000
Other Operating Expenses 2,772,044
Revenue (2,876,555)
Internal Revenue (2,876,555)
Property Management
Reserves 8,661
Net transfer to/(from) Reserves 8,661
Expenses 492,771
Employee Costs 212,065
Materials & Contracts 263,800
Other Operating Expenses 10,000
Internal Expenses 6,906
Revenue (4,846,303)
Rates And Annual Charges (142,184)
User Charges And Fees (535,704)
Other Revenues (2,904,731)
Internal Revenue (1,263,684)
Customer Service Centre
Reserves 8,661
Net transfer to/(from) Reserves 8,661
Expenses 1,111,058
Employee Costs 1,103,152
Other Operating Expenses 1,000
Internal Expenses 6,906
Revenue (1,119,719)
User Charges And Fees (6,000)
Internal Revenue (1,113,719)
Budget 2017-18 A5

City Services
City Services Management
Reserves 40,157
Net transfer to/(from) Reserves 40,157
Expenses 1,048,883
Employee Costs 789,659
Other Operating Expenses 3,000
Internal Expenses 256,224
Revenue (67,036)
Internal Revenue (67,036)
Technical Services Mgmt
Reserves 8,661
Net transfer to/(from) Reserves 8,661
Expenses 3,206,702
Employee Costs 273,789
Materials & Contracts 4,500
Other Operating Expenses 2,513,150
Internal Expenses 415,263
Revenue (436,462)
Contributions And Donations (374,000)
Internal Revenue (62,462)
Street Trees and TPO's
Reserves 25,984
Net transfer to/(from) Reserves 25,984
Expenses 1,441,266
Employee Costs 320,978
Materials & Contracts 667,150
Internal Expenses 453,138
Revenue (100,000)
User Charges And Fees (35,000)
Contributions And Donations (65,000)
Parks and Recreation
Reserves 17,323
Net transfer to/(from) Reserves 17,323
Expenses 754,051
Employee Costs 424,972
Internal Expenses 329,079
Revenue (35,000)
User Charges And Fees (35,000)
Budget 2017-18 A6

Engineering
Reserves 51,969
Net transfer to/(from) Reserves 51,969
Expenses 1,336,610
Employee Costs 885,285
Materials & Contracts 3,000
Internal Expenses 448,325
Cemetery
Expenses 102,863
Materials & Contracts 40,000
Internal Expenses 62,863
Revenue (40,000)
User Charges And Fees (40,000)
Assets Depreciation
Expenses 63,221
Internal Expenses 63,221
Des Renford Aquatic Centre
Reserves 120,946
Net transfer to/(from) Reserves 120,946
Expenses 8,879,461
Employee Costs 5,431,425
Materials & Contracts 1,404,571
Other Operating Expenses 668,794
Internal Expenses 1,374,671
Revenue (8,422,221)
User Charges And Fees (7,397,617)
Other Revenues (1,024,604)
Eastern Sydney Football
Reserves 0
Net transfer to/(from) Reserves 0
Expenses 147,980
Employee Costs 61,308
Materials & Contracts 22,900
Other Operating Expenses 1,200
Internal Expenses 62,572
Revenue (248,179)
User Charges And Fees (248,179)
Budget 2017-18 A7

Beach Inspectors
Reserves 44,492
Net transfer to/(from) Reserves 44,492
Expenses 2,503,985
Employee Costs 1,924,220
Materials & Contracts 44,430
Other Operating Expenses 7,122
Internal Expenses 528,213
Revenue (20,300)
User Charges And Fees (20,300)
Integrated Transport
Reserves (48,031)
Net transfer to/(from) Reserves (48,031)
Expenses 1,761,859
Employee Costs 1,026,363
Materials & Contracts 87,500
Other Operating Expenses 1,000
Internal Expenses 646,996
Revenue (1,058,000)
User Charges And Fees (1,000,000)
Contributions And Donations (58,000)
Building Services
Reserves 17,323
Net transfer to/(from) Reserves 17,323
Expenses 3,324,416
Employee Costs 503,862
Materials & Contracts 1,366,000
Other Operating Expenses 1,438,000
Internal Expenses 16,554
Revenue (3,341,739)
Internal Revenue (3,341,739)
State Emergency Service
Reserves 0
Net transfer to/(from) Reserves 0
Expenses 260,788
Other Operating Expenses 260,788
Internal Expenses 0
Budget 2017-18 A8

Works Depot
Reserves 55,028
Net transfer to/(from) Reserves 55,028
Expenses 1,320,572
Employee Costs 753,702
Other Operating Expenses 3,000
Internal Expenses 563,870
Revenue (952,642)
Internal Revenue (952,642)
Mechanical Services
Reserves 31,801
Net transfer to/(from) Reserves 31,801
Expenses 3,791,594
Employee Costs 558,758
Materials & Contracts 1,430,000
Other Operating Expenses 210,000
Internal Expenses 1,592,836
Revenue (3,857,763)
User Charges And Fees (650,000)
Other Revenues (40,000)
Internal Revenue (3,167,763)
Community Nursery
Reserves 17,323
Net transfer to/(from) Reserves 17,323
Expenses 728,322
Employee Costs 347,817
Materials & Contracts 85,000
Other Operating Expenses 15,225
Internal Expenses 280,280
Revenue (410,000)
User Charges And Fees (250,000)
Internal Revenue (160,000)
Horticultural Maintenance
Reserves 163,088
Net transfer to/(from) Reserves 163,088
Expenses 3,984,044
Employee Costs 2,432,713
Materials & Contracts 485,000
Internal Expenses 1,066,331
Budget 2017-18 A9
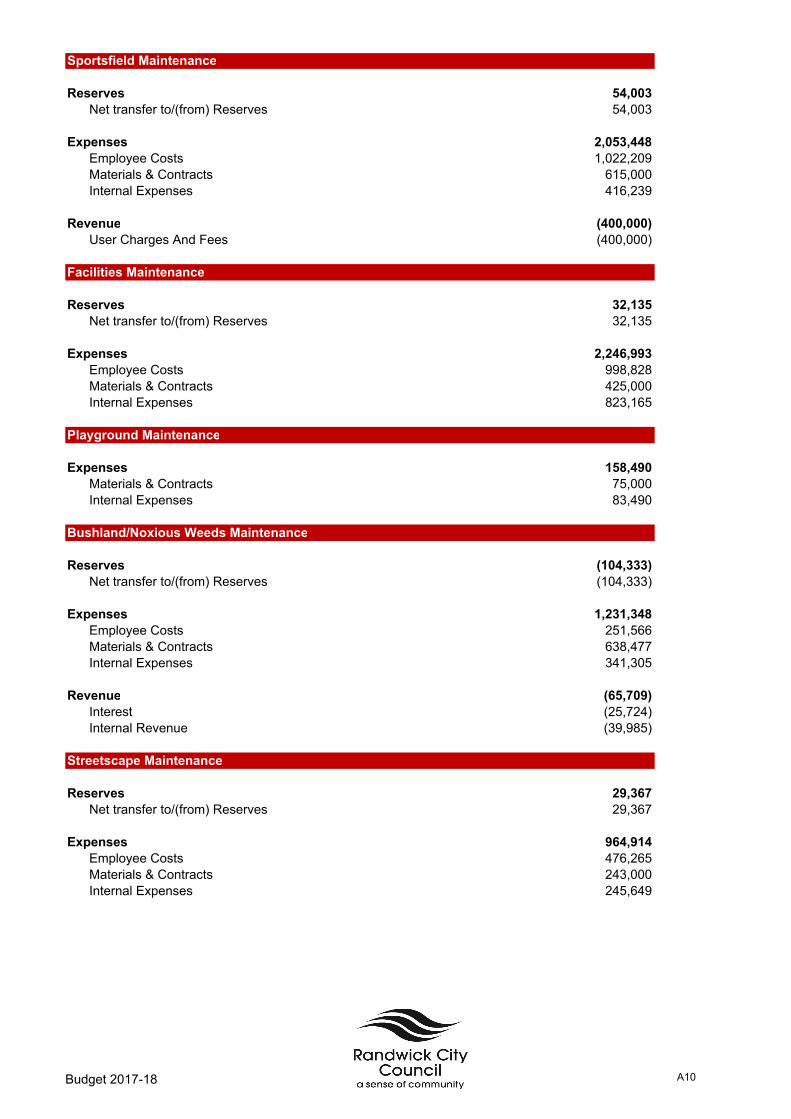
Sportsfield Maintenance
Reserves 54,003
Net transfer to/(from) Reserves 54,003
Expenses 2,053,448
Employee Costs 1,022,209
Materials & Contracts 615,000
Internal Expenses 416,239
Revenue (400,000)
User Charges And Fees (400,000)
Facilities Maintenance
Reserves 32,135
Net transfer to/(from) Reserves 32,135
Expenses 2,246,993
Employee Costs 998,828
Materials & Contracts 425,000
Internal Expenses 823,165
Playground Maintenance
Expenses 158,490
Materials & Contracts 75,000
Internal Expenses 83,490
Bushland/Noxious Weeds Maintenance
Reserves (104,333)
Net transfer to/(from) Reserves (104,333)
Expenses 1,231,348
Employee Costs 251,566
Materials & Contracts 638,477
Internal Expenses 341,305
Revenue (65,709)
Interest (25,724)
Internal Revenue (39,985)
Streetscape Maintenance
Reserves 29,367
Net transfer to/(from) Reserves 29,367
Expenses 964,914
Employee Costs 476,265
Materials & Contracts 243,000
Internal Expenses 245,649
Budget 2017-18 A10

Public & Private Restorations
Reserves 8,661
Net transfer to/(from) Reserves 8,661
Capital 200,000
Capital Construction or Purchases 200,000
Expenses 365,582
Employee Costs 5,572
Materials & Contracts 30,000
Internal Expenses 330,010
Revenue (645,000)
User Charges And Fees (645,000)
Pavement Maintenance
Reserves 73,060
Net transfer to/(from) Reserves 73,060
Expenses 1,514,746
Employee Costs 668,661
Materials & Contracts 415,000
Internal Expenses 431,085
Footpath Maintenance
Reserves 23,593
Net transfer to/(from) Reserves 23,593
Expenses 936,746
Employee Costs 396,015
Materials & Contracts 202,000
Internal Expenses 338,731
Revenue (75,000)
User Charges And Fees (75,000)
Kerb & Gutter Maintenance
Reserves 276
Net transfer to/(from) Reserves 276
Expenses 317,359
Materials & Contracts 203,000
Internal Expenses 114,359
Budget 2017-18 A11

Lines & Signs Maintenance
Reserves 16,682
Net transfer to/(from) Reserves 16,682
Expenses 697,549
Employee Costs 356,154
Materials & Contracts 180,000
Internal Expenses 161,395
Revenue (254,000)
Contributions And Donations (254,000)
Drainage Inspection
Reserves (34,742)
Net transfer to/(from) Reserves (34,742)
Expenses 389,994
Employee Costs 135,517
Materials & Contracts 175,000
Internal Expenses 79,477
Clear Culverts & Pits
Reserves 16,575
Net transfer to/(from) Reserves 16,575
Expenses 322,567
Employee Costs 158,143
Materials & Contracts 16,000
Internal Expenses 148,424
Vehicular Access
Reserves 8,661
Net transfer to/(from) Reserves 8,661
Capital 505,000
Capital Construction or Purchases 505,000
Expenses 234,383
Employee Costs 84,666
Internal Expenses 149,717
Revenue (670,000)
Contributions And Donations (225,000)
Capital Grants & Contributions (445,000)
Budget 2017-18 A12

Parks Construction
Reserves (3,805,000)
Net transfer to/(from) Reserves (3,805,000)
Capital 8,307,000
Capital Construction or Purchases 8,307,000
Expenses 366,014
Internal Expenses 366,014
Roads Construction
Reserves (1,600,000)
Net transfer to/(from) Reserves (1,600,000)
Capital 12,411,495
Capital Construction or Purchases 12,411,495
Expenses 373,359
Internal Expenses 373,359
Revenue (2,691,495)
Operating Grants & Contributions (900,000)
Capital Grants & Contributions (1,791,495)
Drainage Construction
Reserves 43,403
Net transfer to/(from) Reserves 43,403
Capital 1,225,000
Capital Construction or Purchases 1,225,000
Expenses 170,973
Internal Expenses 170,973
Revenue (1,127,376)
Rates And Annual Charges (1,127,376)
Building Construction
Reserves 0
Net transfer to/(from) Reserves 0
Capital 5,750,000
Capital Construction or Purchases 5,750,000
Expenses 221,785
Internal Expenses 221,785
Budget 2017-18 A13

Plant and Fleet
Reserves (2,081,454)
Net transfer to/(from) Reserves (2,081,454)
Capital 3,402,025
Capital Construction or Purchases 3,402,025
Revenue (1,320,571)
Total Gain On Disposal Of Assets (1,320,571)
Public Place Waste Management
Reserves 58,506
Net transfer to/(from) Reserves 58,506
Capital 0
Capital Construction or Purchases 0
Expenses 885,494
Employee Costs 299,364
Materials & Contracts 305,008
Internal Expenses 281,122
Revenue (124,682)
Internal Revenue (124,682)
Beach Services
Reserves 113,816
Net transfer to/(from) Reserves 113,816
Expenses 2,862,943
Employee Costs 1,710,410
Materials & Contracts 241,984
Internal Expenses 910,549
Revenue (150,000)
User Charges And Fees (150,000)
Public Place Cleaning
Expenses 1,658,008
Employee Costs 1,330,453
Materials & Contracts 25,200
Internal Expenses 302,355
Budget 2017-18 A14

Litter Bins Collection
Reserves 51,062
Net transfer to/(from) Reserves 51,062
Expenses 1,467,981
Employee Costs 771,657
Materials & Contracts 407,368
Internal Expenses 288,956
Revenue (189,240)
Internal Revenue (189,240)
Mechanical Street
Reserves 119,306
Net transfer to/(from) Reserves 119,306
Expenses 992,304
Employee Costs 443,539
Materials & Contracts 235,596
Internal Expenses 313,169
Revenue (97,450)
Internal Revenue (97,450)
Footpath Sweeping
Reserves 140,298
Net transfer to/(from) Reserves 140,298
Expenses 731,768
Employee Costs 368,956
Materials & Contracts 25,400
Internal Expenses 337,412
Graffiti Management
Reserves 19,662
Net transfer to/(from) Reserves 19,662
Expenses 943,077
Employee Costs 701,907
Materials & Contracts 50,000
Internal Expenses 191,170
Budget 2017-18 A15

Office Expenses - Domestic Waste
Reserves 798,523
Net transfer to/(from) Reserves 798,523
Expenses 2,506,527
Employee Costs 328,983
Materials & Contracts 21,000
Other Operating Expenses 18,000
Internal Expenses 2,138,544
DWM - Waste Development
Expenses 226,750
Materials & Contracts 95,000
Other Operating Expenses 25,000
Internal Expenses 106,750
DWM - Hazardous Waste
Expenses 239,523
Materials & Contracts 172,500
Internal Expenses 67,023
DWM - Contaminated Site Management
Reserves 958,661
Net transfer to/(from) Reserves 958,661
Expenses 493,211
Employee Costs 120,004
Materials & Contracts 100,000
Internal Expenses 273,207
Revenue (60,002)
Internal Revenue (60,002)
DWM - On-Call Clean Up Collection
Reserves 211,184
Net transfer to/(from) Reserves 211,184
Expenses 1,428,604
Employee Costs 508,642
Materials & Contracts 442,527
Internal Expenses 477,435
DWM - Schedule Clean Up Collection
Reserves 233,786
Net transfer to/(from) Reserves 233,786
Expenses 2,125,798
Employee Costs 937,751
Materials & Contracts 617,968
Internal Expenses 570,079
Budget 2017-18 A16

DWM - Green Waste Collection
Reserves 239,229
Net transfer to/(from) Reserves 239,229
Expenses 2,678,919
Employee Costs 591,441
Materials & Contracts 1,471,193
Internal Expenses 616,285
DWM - Illegal Dumping Management
Reserves 158,506
Net transfer to/(from) Reserves 158,506
Expenses 2,461,603
Employee Costs 1,249,928
Materials & Contracts 370,561
Internal Expenses 841,114
Revenue (101,053)
Internal Revenue (101,053)
DWM - Garbage & Recycling
Reserves 8,661
Net transfer to/(from) Reserves 8,661
Expenses 13,501,525
Employee Costs 423,909
Materials & Contracts 12,752,510
Internal Expenses 325,106
DWM - Dry Recycling
Expenses 2,220,573
Materials & Contracts 2,106,337
Internal Expenses 114,236
DWM - Recycling Centre-Perry Street
Reserves 8,661
Net transfer to/(from) Reserves 8,661
Expenses 885,090
Employee Costs 516,442
Materials & Contracts 146,634
Internal Expenses 222,014
Budget 2017-18 A17
Domestic Waste Levy
Expenses 1,001,343
Internal Expenses 1,001,343
Revenue (32,225,622)
Rates And Annual Charges (31,880,622)
User Charges And Fees (20,000)
Interest (105,000)
Grants (220,000)
General Trade Waste
Reserves 109,636
Net transfer to/(from) Reserves 109,636
Expenses 1,546,131
Employee Costs 325,011
Materials & Contracts 705,000
Internal Expenses 516,120
Revenue (1,365,620)
User Charges And Fees (1,216,000)
Internal Revenue (149,620)
Library Administration
Reserves 46,969
Net transfer to/(from) Reserves 46,969
Capital 421,281
Capital Construction or Purchases 421,281
Expenses 8,339,267
Employee Costs 3,620,507
Materials & Contracts 450,780
Other Operating Expenses 239,979
Internal Expenses 4,028,001
Revenue (469,052)
User Charges And Fees (109,865)
Other Revenues (90,240)
Grants (268,947)
Budget 2017-18 A18

City Planning
Planning & Community Directorate
Reserves 14,173
Net transfer to/(from) Reserves 14,173
Expenses 1,086,644
Employee Costs 431,545
Materials & Contracts 450,000
Other Operating Expenses 3,000
Internal Expenses 202,099
Revenue (83,925)
User Charges And Fees (15,000)
Internal Revenue (68,925)
Biodiversity Strategy
Reserves (157,000)
Net transfer to/(from) Reserves (157,000)
Expenses 157,000
Materials & Contracts 142,000
Internal Expenses 15,000
Sustainability Strategy
Reserves (1,987,919)
Net transfer to/(from) Reserves (1,987,919)
Expenses 1,987,919
Employee Costs 563,142
Materials & Contracts 258,539
Other Operating Expenses 395,000
Internal Expenses 771,238
Climate Protection Strategy
Reserves (260,000)
Net transfer to/(from) Reserves (260,000)
Capital 245,000
Capital Construction or Purchases 245,000
Expenses 15,000
Materials & Contracts 15,000
Budget 2017-18 A19
General Community
Reserves 17,323
Net transfer to/(from) Reserves 17,323
Expenses 3,685,016
Employee Costs 992,196
Materials & Contracts 17,000
Other Operating Expenses 746,500
Internal Expenses 1,929,320
Revenue (148,172)
Grants (148,172)
Moverly Children's Centre
Reserves 8,661
Net transfer to/(from) Reserves 8,661
Expenses 1,152,434
Employee Costs 709,522
Materials & Contracts 106,000
Other Operating Expenses 8,000
Internal Expenses 328,912
Revenue (833,400)
User Charges And Fees (583,380)
Grants (250,020)
Home Maintenance & Modification Services
Reserves 17,323
Net transfer to/(from) Reserves 17,323
Expenses 421,331
Employee Costs 163,641
Materials & Contracts 55,000
Internal Expenses 202,690
Revenue (260,842)
User Charges And Fees (50,000)
Grants (210,842)
Budget 2017-18 A20

Randwick Literary Institute
Expenses 137,202
Employee Costs 52,836
Materials & Contracts 10,000
Internal Expenses 74,366
Revenue (90,000)
User Charges And Fees (90,000)
Events
Reserves 8,661
Net transfer to/(from) Reserves 8,661
Expenses 1,434,127
Employee Costs 471,634
Materials & Contracts 45,000
Other Operating Expenses 696,000
Internal Expenses 221,493
Community Centre Management
Reserves 8,661
Net transfer to/(from) Reserves 8,661
Expenses 407,179
Employee Costs 127,360
Materials & Contracts 60,500
Internal Expenses 219,319
Revenue (250,000)
User Charges And Fees (250,000)
Ranger Services
Reserves 86,614
Net transfer to/(from) Reserves 86,614
Expenses 3,348,419
Employee Costs 1,670,244
Materials & Contracts 643,000
Other Operating Expenses 58,000
Internal Expenses 977,175
Revenue (4,446,000)
User Charges And Fees (40,000)
Other Revenues (4,256,000)
Internal Revenue (150,000)
Budget 2017-18 A21

Health, Building & Regulatory Services
Reserves 190,551
Net transfer to/(from) Reserves 190,551
Expenses 5,244,938
Employee Costs 3,316,238
Materials & Contracts 37,920
Other Operating Expenses 17,400
Internal Expenses 1,873,380
Revenue (1,089,870)
User Charges And Fees (885,000)
Other Revenues (138,750)
Internal Revenue (66,120)
Strategic Planning
Reserves 34,646
Net transfer to/(from) Reserves 34,646
Expenses 2,122,447
Employee Costs 1,324,417
Materials & Contracts 100,000
Other Operating Expenses 6,500
Internal Expenses 691,530
Revenue (250,000)
User Charges And Fees (250,000)
Development Contributions (incl s93/94)
Reserves 2,886,115
Net transfer to/(from) Reserves 2,886,115
Expenses 105,533
Employee Costs 105,533
Revenue (2,991,648)
Interest (141,648)
Contributions And Donations (2,850,000)
Development Assessment Services
Reserves 95,276
Net transfer to/(from) Reserves 95,276
Expenses 4,333,184
Employee Costs 2,250,136
Materials & Contracts 250,000
Other Operating Expenses 5,000
Internal Expenses 1,828,048
Revenue (2,505,136)
User Charges And Fees (2,505,136)
Budget 2017-18 A22
Appendix
A - Budget Detail by Department
B - Comparative Budgets

Budget 2017-18 Budget 2016-17
Office of the General Manager
Expenses
Employee Costs
Chief Information Officer 279,434 278,363
Technology Systems 931,473 896,219
Business Systems 827,464 807,171
Spatial Systems 645,193 622,324
General Manager 1,197,093 1,130,202
Communications 612,089 589,389
Corporate Improvement 862,387 807,350
Materials & Contracts
Technology Systems 1,182,225 1,302,000
Business Systems 1,345,300 979,200
Spatial Systems 335,347 261,700
General Manager 10,000 10,000
Communications 521,000 521,000
Corporate Improvement 105,000 83,000
Depreciation
Technology Systems 1,201,512 1,083,927
Other Operating Expenses
Technology Systems 820,695 537,100
Business Systems 3,800 3,500
Spatial Systems 3,000 2,000
General Manager 40,000 38,000
Communications 12,500 12,500
Corporate Improvement 12,400 12,500
Total Expenses 10,947,912 9,977,445
Budget 2017-18 B1

Budget 2017-18 Budget 2016-17
Governance and Financial Services
Revenue
Rates And Annual Charges
Financial Operations (75,077,298) (73,579,519)
Property Management (142,184) (136,954)
User Charges And Fees
Financial Operations (204,500) (212,500)
Information Management (180,000) (160,000)
Election (60,000) (60,000)
Property Management (535,704) (493,000)
Customer Service Centre (6,000) (5,000)
Interest
Financial Operations (1,533,455) (1,867,000)
Other Revenues
Financial Operations (88,000) (180,000)
Property Management (2,904,731) (2,854,021)
Operating Grants & Contributions
Financial Operations (3,489,774) (3,489,910)
Total Revenue (84,221,646) (83,037,904)
Budget 2017-18 B2

Budget 2017-18 Budget 2016-17
Exenses
Employee Costs
Financial Operations 2,202,459 2,073,920
Corporate & Financial Planning 604,830 589,428
Governance & Financial Services 433,271 401,452
Information Management 728,111 710,523
Insurance Management 84,511 82,450
Stores & Purchasing 654,518 641,581
Organisational Staff Services 3,073,783 2,755,477
Administrative Services 858,275 853,381
Councillors' Expenses 8,000 8,000
Property Management 212,065 206,893
Customer Service Centre 1,103,152 1,055,554
Materials & Contracts
Financial Operations 236,160 323,000
Corporate & Financial Planning 86,000 69,500
Governance & Financial Services 32,000 30,000
Information Management 255,000 226,000
Insurance Management 20,000 20,000
Stores & Purchasing 11,000 11,000
Organisational Staff Services 112,000 45,000
Administrative Services 370,000 390,000
Property Management 263,800 244,806
Depreciation
Property Management 1,487,948 1,459,608
Other Operating Expenses
Financial Operations 3,111,711 3,098,477
Governance & Financial Services 38,000 38,000
Information Management 0 1,000
Insurance Management 2,772,044 2,578,849
Administrative Services 609,000 869,000
Councillors' Expenses 479,852 473,952
Election 622,320 622,320
Property Management 10,000 10,000
Customer Service Centre 1,000 1,000
Total Expenses 20,480,810 19,890,171
Budget 2017-18 B3

Budget 2017-18 Budget 2016-17
City Services
Revenue
Rates And Annual Charges
Drainage Construction (1,127,376) (1,123,006)
Domestic Waste Levy (31,880,622) (31,241,798)
User Charges And Fees
Street Trees and TPO's (35,000) (30,000)
Parks and Recreation (35,000) (18,000)
Des Renford Leisure Centre (7,397,617) (6,933,467)
Eastern Sydney Football (248,179) (467,200)
Cemetery (40,000) (40,000)
Mechanical Services (650,000) (610,000)
Community Nursery (250,000) (250,000)
Integrated Transport (1,000,000) (1,000,000)
Sportsfield Maintenance (400,000) (375,000)
Beach Services (150,000) (150,000)
Beach Inspectors (20,300) (20,300)
Public & Private Restorations (645,000) (645,000)
Footpath Maintenance (75,000) (75,000)
Domestic Waste Levy (20,000) (25,000)
General Trade Waste (1,216,000) (1,220,000)
Library Administration (109,865) (104,700)
Interest
Bushland Maintenance (25,724) (37,040)
Domestic Waste Levy (105,000) (120,000)
Other Revenues
Des Renford Leisure Centre (1,024,604) (874,853)
Mechanical Services (40,000) (40,000)
Library Administration (90,240) (92,000)
Budget 2017-18 B4

Budget 2017-18 Budget 2016-17
Operating Grants & Contributions
Technical Services Management (374,000) (374,000)
Street Trees and TPO's (65,000) (40,000)
Integrated Transport (58,000) (58,000)
Vehicular Access (225,000) (220,000)
Lines & Signs Maintenance (254,000) (240,000)
Roads Construction (900,000) (900,000)
Domestic Waste Levy (220,000) (240,548)
Library Administration (268,947) (268,947)
Capital Grants & Contributions
Vehicular Access (445,000) (445,000)
Roads Construction (1,791,495) (1,791,495)
Total Revenue (51,186,969) (50,070,354)
Expenses
Employee Costs
273,789 271,486
320,978 310,959
424,972 401,893
885,285 852,391
789,659 641,785
503,862 515,919
5,431,425 5,099,825
61,308 185,572
558,758 602,907
347,817 369,010
753,702 692,439
1,026,363 1,040,067
2,432,713 2,517,048
1,022,209 949,763
998,828 956,572
251,566 254,215
476,265 394,108
1,710,410 2,022,900
1,924,220 1,787,963
84,666 82,601
5,572 102,655
668,661 692,055
396,015 368,756
356,154 245,885
135,517 132,212
299,364 322,597
Technical Services Management Street Trees and TPO's
Parks and Recreation Engineering
City Services Management Building Services
Des Renford Leisure Centre Eastern Sydney Football Mechanical Services Community Nursery
Works Depot
Integrated Transport Horticultural Maintenance Sportsfield Maintenance Facilities Maintenance Bushland Maintenance Streetscape Maintenance Beach Services
Beach Inspectors
Vehicular Access
Public & Private Restorations Pavement Maintenance Footpath Maintenance
Lines & Signs Maintenance Drainage Inspection
Public Place Waste Management
Budget 2017-18 B5

Budget 2017-18 Budget 2016-17
Employee CostsPublic Place Cleaning 1,330,453 1,304,403
Litter Bins Collection 771,657 600,155
Mechanical Street 443,539 460,019
Footpath Sweeping 368,956 370,012
Clear Culverts & Pits 158,143 143,188
Graffiti Management 701,907 542,706
Office Expenses - Domestic Waste 328,983 313,771
DWM - Contaminated Site Management 120,004 113,118
DWM - On-Call Clean Up Collection 508,642 566,826
DWM - Schedule Clean Up Collection 937,751 965,028
DWM - Green Waste Collection 591,441 625,976
DWM - Illegal Dumping Management 1,249,928 977,133
DWM - Special Pick Up 0 136,000
DWM - Garbage & Recycling 423,909 272,621
DWM - Recycling Centre-Perry Street 516,442 486,286
General Trade Waste 325,011 318,948
Library Administration 3,620,507 3,522,709
Materials & Contracts
4,500 4,500
667,150 651,000
3,000 3,000
1,366,000 1,366,000
1,404,571 1,238,659
22,900 97,320
40,000 50,000
1,430,000 1,430,000
85,000 86,000
87,500 87,500
485,000 486,500
615,000 618,000
425,000 425,000
75,000 76,500
638,477 637,030
243,000 243,000
241,984 238,000
44,430 47,680
30,000 30,000
415,000 415,000
202,000 202,000
203,000 203,000
180,000 180,000
175,000 175,000
305,008 305,000
25,200 25,000
407,368 406,968
235,596 235,596
25,400 25,000
16,000 16,000
50,000 50,000
Technical Services Management Street Trees and TPO's Engineering
Building Services
Des Renford Leisure Centre Eastern Sydney Football Cemetery
Mechanical Services Community Nursery
Integrated Transport Horticultural Maintenance Sportsfield Maintenance Facilities Maintenance Playground Maintenance Bushland Maintenance Streetscape Maintenance Beach Services
Beach Inspectors
Public & Private Restorations Pavement Maintenance Footpath Maintenance
Kerb & Gutter Maintenance Lines & Signs Maintenance Drainage Inspection
Public Place Waste Management Public Place Cleaning
Litter Bins Collection Mechanical Street
Footpath Sweeping
Clear Culverts & Pits
Graffiti Management
Budget 2017-18 B6

Budget 2017-18 Budget 2016-17
Materials & ContractsOffice Expenses - Domestic Waste 21,000 21,000
DWM - Waste Development 95,000 95,000
DWM - Hazardous Waste 172,500 172,500
DWM - Contaminated Site Management 100,000 100,000
DWM - On-Call Clean Up Collection 442,527 386,089
DWM - Schedule Clean Up Collection 617,968 601,406
DWM - Green Waste Collection 1,471,193 1,471,193
DWM - Illegal Dumping Management 370,561 355,010
DWM - Garbage & Recycling 12,752,510 11,743,715
DWM - Dry Recycling 2,106,337 2,046,444
DWM - Recycling Centre-Perry Street 146,634 94,434
General Trade Waste 705,000 705,000
Library Administration 450,780 445,925
Depreciation
Assets Depreciation 14,906,258 14,711,638
Building Services 2,222,764 2,196,117
Des Renford Leisure Centre 66,000 64,730
Mechanical Services 3,320,500 3,005,769
Library Administration 324,000 323,013
Other Operating Expenses
Technical Services Management 2,513,150 2,453,000
City Services Management 3,000 3,000
Building Services 1,438,000 1,431,000
Des Renford Leisure Centre 668,794 664,859
Eastern Sydney Football 1,200 146,300
Mechanical Services 210,000 210,000
Community Nursery 15,225 15,000
State Emergency Service 260,788 260,788
Works Depot 3,000 3,000
Integrated Transport 1,000 1,000
Beach Inspectors 7,122 8,112
Office Expenses - Domestic Waste 18,000 18,000
DWM - Waste Development 25,000 25,000
Library Administration 239,979 221,044
Total Expenses 90,381,225 87,585,821
Budget 2017-18 B7

Budget 2017-18 Budget 2016-17
City Planning
Revenue
User Charges And Fees
Moverly Children's Centre (583,380) (613,137)
Home Maintenance & Modification Services (50,000) (54,000)
Ranger Services (40,000) (40,000)
Health, Building & Regulatory Services (885,000) (805,500)
City Planning Management (15,000) (15,000)
Strategic Planning (250,000) (250,000)
Development Assessment Services (2,505,136) (2,215,000)
Community Centre Management (250,000) (210,000)
Randwick Literary Institute (90,000) (84,860)
Interest
Development Contributions (incl s93/94) (141,648) (165,684)
Other Revenues
Ranger Services (4,256,000) (4,235,000)
Health, Building & Regulatory Services (138,750) (118,000)
Operating Grants & Contributions
General Community (148,172) (148,172)
Moverly Children's Centre (250,020) (262,773)
Home Maintenance & Modification Services (210,842) (210,842)
Capital Grants & Contributions
Development Contributions (incl s93/94) (2,850,000) (2,850,000)
Total Revenue (12,663,948) (12,277,968)
Budget 2017-18 B8

Budget 2017-18 Budget 2016-17
Expenses
Employee Costs
Sustainability Strategy 563,142 552,950
General Community 992,196 1,001,143
Moverly Children's Centre 709,522 700,010
Home Maintenance & Modification Services 163,641 159,714
Events 471,634 303,670
Ranger Services 1,670,244 1,706,161
Health, Building & Regulatory Services 3,316,238 3,148,016
City Planning Management 431,545 431,665
Strategic Planning 1,324,417 1,134,683
Development Contributions (incl s93/94) 105,533 102,960
Development Assessment Services 2,250,136 2,242,937
Community Centre Management 127,360 281,458
Randwick Literary Institute 52,836 74,860
Materials & Contracts
Biodiversity Strategy 142,000 140,000
Sustainability Strategy 258,539 242,000
Climate Protection Strategy 15,000 235,000
General Community 17,000 5,000
Moverly Children's Centre 106,000 106,000
Home Maintenance & Modification Services 55,000 55,000
Events 45,000 45,000
Ranger Services 643,000 643,000
Health, Building & Regulatory Services 37,920 60,000
City Planning Management 450,000 450,000
Strategic Planning 100,000 100,000
Development Assessment Services 250,000 174,000
Community Centre Management 60,500 60,500
Other Operating Expenses
Sustainability Strategy 133,011
Climate Protection Strategy 395,000 352,914
Water Conservation Strategy 10,000
General Community 746,500 746,500
Moverly Children's Centre 8,000 8,000
Events 696,000 696,000
Ranger Services 58,000 54,000
Health, Building & Regulatory Services 17,400 17,300
City Planning Management 3,000 3,000
Strategic Planning 6,500 6,500
Development Assessment Services 5,000 3,000
Randwick Literary Institute 10,000 10,000
Total Expenses 16,303,803 16,195,952
Budget 2017-18 B9

Budget 2017-18 Budget 2016-17
Capital Expenditure on Assets
Technology Systems 125,000 1,090,000
Business Systems 1,190,000
Spatial Systems 120,000 475,000
Sustainability Strategy 0 42,000
Climate Protection Strategy 245,000 245,000
Water Conservation Strategy 50,000
Eastern Sydney Football 19,000
Vehicular Access 505,000 500,000
Public & Private Restorations 200,000 200,000
Parks Construction 8,307,000 7,136,000
Roads Construction 12,411,495 10,264,455
Drainage Construction 1,225,000 1,219,869
Building Construction 5,750,000 8,099,563
Plant and Fleet 3,402,025 3,194,124
Public Place Waste Management 50,000
Library Administration 421,281 405,698
Total Capital Expenditure on Assets 32,711,801 34,180,709
Proceeds from Sale of Non-Current Assets
Plant and Fleet (1,320,571) (1,159,297)
Total Proceeds from Sale of Non-Current Assets (1,320,571) (1,159,297)
Transfer to / (from) Reserves
Financial Operations 4,601,488 9,829,449
Corporate & Financial Planning 17,328 19,520
Governance & Financial Services 14,173 15,971
Information Management 8,661 9,760
Chief Information Officer 308,661 9,760
Technology Systems 34,646 39,040
Business Systems (1,190,000)
Spatial Systems 8,661
Stores & Purchasing 19,550 21,978
Organisational Staff Services 17,323 19,520
Administrative Services 31,496 35,491
General Manager 40,157 45,251
Election (562,320) (420,000)
Communications 17,323 19,520
Corporate Improvement 43,307 48,800
Biodiversity Strategy (157,000) (288,011)
Budget 2017-18 B10

Budget 2017-18 Budget 2016-17
(1,987,919) (1,968,249)
(260,000) (480,000)
0 (60,000)
8,661 9,760
25,984 29,280
17,323 19,520
51,969 58,559
40,157 45,251
8,661 9,760
17,323 19,520
120,946 23,392
0 100,000
31,801 34,671
17,323 19,520
0 21,756
55,028 61,523
(48,031) (31,441)
163,088 179,037
54,003 54,625
32,135 45,723
(104,333) (88,831)
29,367 32,040
113,816 125,282
44,492 49,219
8,661 9,760
8,661 9,760
73,060 75,069
23,593 26,436
276 245
16,682 17,935
(34,742) (38,739)
(3,805,000) (4,451,000)
(1,600,000) (1,600,000)
43,403 48,499
0 (4,516,076)
(2,081,454) (2,034,827)
58,506 19,520
51,062 76,974
119,306 126,969
140,298 167,021
16,575 17,993
19,662 20,229
798,523 1,144,266
958,661 1,459,760
211,184 264,564
233,786 226,325
239,229 265,442
158,506 163,591
8,661 9,760
8,661 9,760
Transfer to / (from) ReservesSustainability Strategy
Climate Protection Strategy
Water Conservation Strategy
Technical Services Mgmt
Street Trees and TPO's
Parks and Recreation
Engineering
City Services Management
Property Management
Building Services
Des Renford Leisure Centre
Eastern Sydney Football
Mechanical Services
Community Nursery
State Emergency Service
Works Depot
Integrated Transport
Horticultural Maintenance
Sportsfield Maintenance
Facilities Maintenance
Bushland Maintenance
Streetscape Maintenance
Beach Services
Beach Inspectors
Vehicular Access
Public & Private Restorations
Pavement Maintenance
Footpath Maintenance
Kerb & Gutter Maintenance
Lines & Signs Maintenance
Drainage Inspection
Parks Construction
Roads Construction
Drainage Construction
Building Construction
Plant and Fleet
Public Place Waste Management
Litter Bins Collection
Mechanical Street
Footpath Sweeping
Clear Culverts & Pits
Graffiti Management
Office Expenses - Domestic Waste
DWM - Contaminated Site Management
DWM - On-Call Clean Up Collection
DWM - Schedule Clean Up Collection
DWM - Green Waste Collection
DWM - Illegal Dumping Management
DWM - Garbage & Recycling
DWM - Recycling Centre-Perry Street
Budget 2017-18 B11

Budget 2017-18 Budget 2016-17
Transfer to / (from) ReservesGeneral Trade Waste 109,636 (31,991)
Library Administration 46,969 58,559
General Community 17,323 19,520
Moverly Children's Centre 8,661 9,760
Home Maintenance & Modification Services 17,323 19,520
Events 8,661 9,760
Ranger Services 86,614 97,599
Customer Service Centre 8,661 9,760
Health, Building & Regulatory Services 190,551 214,718
City Planning Management 14,173 15,971
Strategic Planning 34,646 48,800
Development Contributions (incl s93/94) 2,886,115 2,912,724
Development Assessment Services 95,276 107,359
Community Centre Management 8,661 9,760
Net Transfer to / (from) Reserves 2,084,278 1,547,021
Budget 2017-18 B12

Randwick City Council 30 Frances Street Randwick NSW 2031 Monday to Friday | 8:30am - 5:00pm Tel: 1300 722 542
www.randwick.nsw.gov.au OGM0280