2016wfbp parti final - utah children...voices for utah children | working families benchmarking...
TRANSCRIPT

June 2016

VOICES FOR UTAH CHILDREN | WORKING FAMILIES BENCHMARKING PROJECT 2016: UT VS. CO
2
ACKNOWLEDGEMENTS
This is the inaugural edition of the Working Families Benchmarking Project. It was authored by
Tess Davis, JD, State Priorities Policy Analyst, and Matthew Weinstein, MPP, State Priorities
Partnership Director at Voices for Utah Children, with support from the rest of the staff at
Voices for Utah Children. The 2016 edition has been written as a two-part series, with this
report representing the first of the two segments. This report is released as part of the State of
Working America series, more information about which is available at
www.stateofworkingamerica.org. Original research for this project was conducted with the
assistance of interns provided by the University of Utah Department of Economics: Courtney
Dean, Holly Hatfield, Curtis Miller, and Guowang Rao.
* * *
VOICES FOR UTAH CHILDREN is the Utah affiliate of the State Priorities Partnership, a 42-state
consortium of independent nonprofit research and policy organizations that use evidence and
analysis to advance public policies and investments that reduce poverty and give all people the
opportunity to achieve the American Dream.
* * *
Find us on social media:
VOICES FOR UTAH CHILDREN
747 E. South Temple, Suite 100, Salt Lake City, UT 84102 | (801) 364-1182 | www.utahchildren.org
3
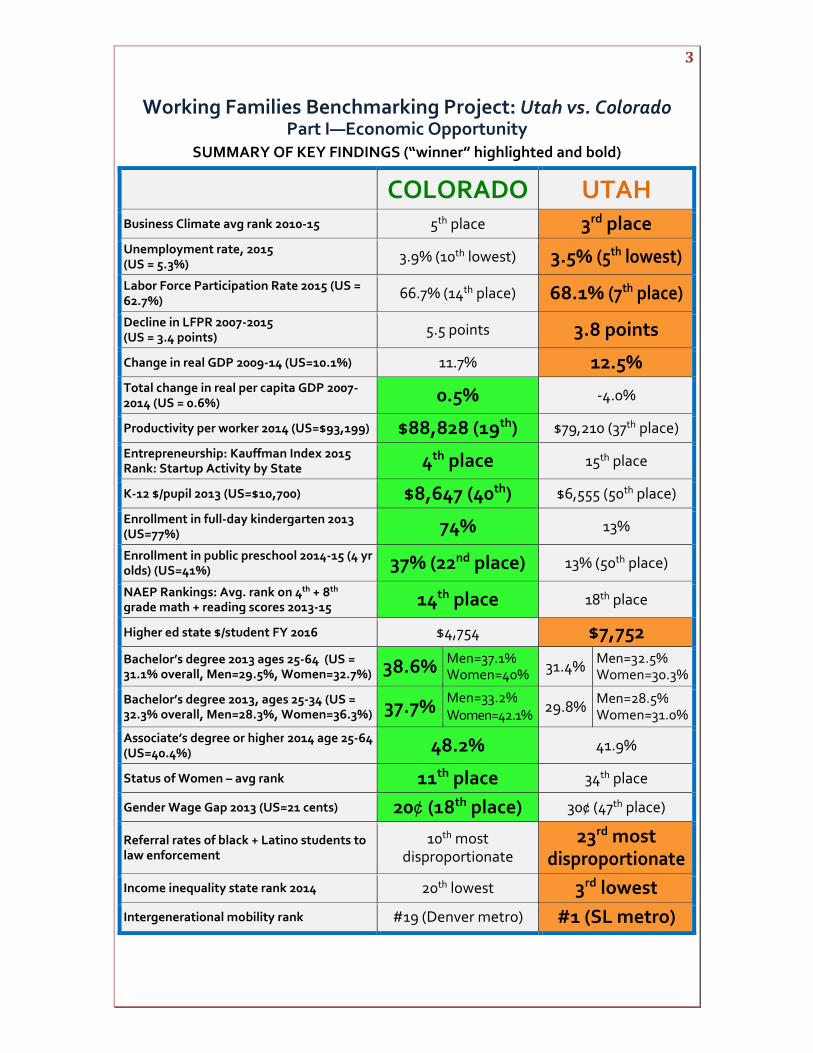
Working Families Benchmarking Project: Utah vs. Colorado Part I—Economic Opportunity
SUMMARY OF KEY FINDINGS (“winner” highlighted and bold)
COLORADO UTAH Business Climate avg rank 2010-15 5th place 3rd place Unemployment rate, 2015 (US = 5.3%)
3.9% (10th lowest) 3.5% (5th lowest)
Labor Force Participation Rate 2015 (US = 62.7%)
66.7% (14th place) 68.1% (7th place)
Decline in LFPR 2007-2015 (US = 3.4 points)
5.5 points 3.8 points
Change in real GDP 2009-14 (US=10.1%) 11.7% 12.5% Total change in real per capita GDP 2007-2014 (US = 0.6%) 0.5% -4.0%
Productivity per worker 2014 (US=$93,199) $88,828 (19th) $79,210 (37th place)
Entrepreneurship: Kauffman Index 2015 Rank: Startup Activity by State 4th place 15th place
K-12 $/pupil 2013 (US=$10,700) $8,647 (40th) $6,555 (50th place)
Enrollment in full-day kindergarten 2013 (US=77%) 74% 13%
Enrollment in public preschool 2014-15 (4 yr olds) (US=41%) 37% (22nd place) 13% (50th place)
NAEP Rankings: Avg. rank on 4th + 8th grade math + reading scores 2013-15 14th place 18th place
Higher ed state $/student FY 2016 $4,754 $7,752
Bachelor’s degree 2013 ages 25-64 (US = 31.1% overall, Men=29.5%, Women=32.7%) 38.6%
Men=37.1% Women=40% 31.4%
Men=32.5% Women=30.3%
Bachelor’s degree 2013, ages 25-34 (US = 32.3% overall, Men=28.3%, Women=36.3%) 37.7%
Men=33.2% Women=42.1% 29.8%
Men=28.5% Women=31.0%
Associate’s degree or higher 2014 age 25-64 (US=40.4%) 48.2% 41.9%
Status of Women – avg rank 11th place 34th place
Gender Wage Gap 2013 (US=21 cents) 20¢ (18th place) 30¢ (47th place)
Referral rates of black + Latino students to law enforcement
10th most disproportionate
23rd most disproportionate
Income inequality state rank 2014 20th lowest 3rd lowest
Intergenerational mobility rank #19 (Denver metro) #1 (SL metro)

VOICES FOR UTAH CHILDREN | WORKING FAMILIES BENCHMARKING PROJECT 2016: UT VS. CO
4
TABLE OF CONTENTS
EXECUTIVE SUMMARY …….………………………………………………………………… 5
I. ECONOMIC GROWTH ……………………………………………………..……………6
Business Climate …………………………………………………….…... 6
Gross Domestic Product ……………………………………………….. 7
II. EMPLOYMENT PROSPECTS ………………………………………………….…… 10
Unemployment ………………………………………..………………... 10
Entrepreneurship …………………………………………………..…… 11
III. EDUCATIONAL OPPORTUNITIES ……………………………………………….. 12
Primary & Secondary Education …………………………..……… 12
Postsecondary Education & Training …………………….……… 14
IV. DEMOGRAPHIC & SOCIAL FACTORS ………………………………………….. 21
Gender ………………………………………………………………….….. 21
Race, Ethnicity, & Disability Status ……………………………... 22
Income Inequality & Social Mobility……………...……………... 25
SOURCES & METHODOLOGY ……………………………………………………..……. 26
APPENDIX ………………………………………………………………………………….…… 27
5
EXECUTIVE SUMMARY
The goal of the Working Families Benchmarking Project is to identify a variety of economic trends affecting Utah families, and then to examine those issues through a comparative lens, evaluating Utah’s achievements by using a peer state as a benchmark. Colorado was chosen for this inaugural edition, in part for its geographic proximity to Utah — and thus relatively similar regional identity — as well as for its comparable rates of economic and population growth and similar demographics.
Many existing economic comparison studies and rankings look at the economy as a whole or at its impact on specific sectors or on employers. This project seeks to augment those very useful comparisons by focusing on how the economy is experienced by average- and lower-income families. In particular, it is these families whose children are most at risk for not achieving their potential in school and later in the workplace and in society in general. Thus, how they experience the economy is of particular interest to Voices for Utah Children.
In Part I of the Project, we focus on economic opportunity. The dynamism, flexibility, and competitiveness of a state’s economy is a major contributor to economic opportunity, so we look at this topic through a wide range of metrics, from business climate and entrepreneurship rankings to educational attainment and demographic gaps. Our most significant findings are as follows:
1) Utah ranks ahead of Colorado in business climate rankings, GDP growth, unemployment, and labor force participation. Utah also invests far more public dollars per student in its higher education system, refers fewer minority youth to its correctional system, and benefits from lower levels of income inequality and higher levels of social mobility.
2) Colorado outpaces Utah in Pre-K and kindergarten enrollment, K-12 investment and performance, higher education attainment, workforce productivity, entrepreneurship, and the status of women in the economy.
The gaps in educational attainment are perhaps the finding of greatest concern for Utah’s long-term future. Utah appears to have reached an unfortunate milestone in 2014, falling behind the national average in the share of the working-age population with a Bachelor’s Degree for the first time, continuing a long-term decline relative to the nation. Since education is the foundation of opportunity and prosperity in a modern economy, Colorado’s success in educating its population and attracting highly educated migrants from other states may well hold lessons for Utah. Utah is wise to invest more than Colorado in higher education to attempt to make up this gap and should apply a similar lesson in its funding of pre-K-12.
These measures of economic opportunity also relate directly to the questions we address in Part 2: Standard of Living.
As Utah builds on its many assets and grapples with its challenges in the years to come, we hope this benchmarking project may contribute in a constructive way to the broader economic policy conversation among experts, policymakers, and the general public.
VOICES FOR UTAH CHILDREN | WORKING FAMILIES BENCHMARKING PROJECT 2016: UT VS. CO
6
I. ECONOMIC GROWTH
By most accounts, Utah and Colorado have two of the nation’s strongest and fastest-growing economies,
including thriving technology sectors and bustling start-up scenes.1 In the subsections below, various
measurements of state economic health — particularly when viewed through the comparative lens set
forth by this benchmarking series — will both highlight Utah’s progress and help to identify those areas in
which lessons from a peer state might be applicable.
Business Climate
Several publications release annual reports on the best (and worst) states for doing business. These
rankings are determined using a variety of indicators: growth prospects, business friendliness, workforce,
cost of living, education, and quality of life, to name a few. In recent years, Forbes’ “Best States for
Business” and CNBC’s “Top States for Business” — two of the most well-known and widely circulated
reports of their kind — have consistently placed both Utah and Colorado among the top ten states for
doing business.
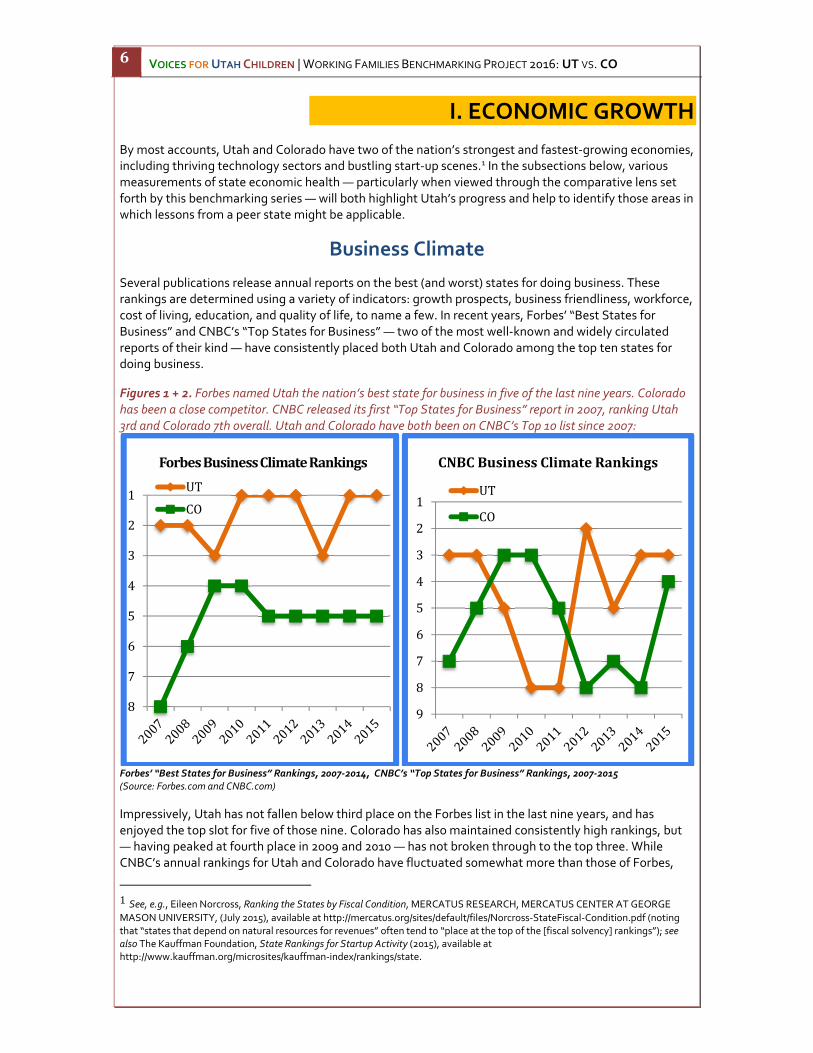
Figures 1 + 2. Forbes named Utah the nation’s best state for business in five of the last nine years. Colorado
has been a close competitor. CNBC released its first “Top States for Business” report in 2007, ranking Utah
3rd and Colorado 7th overall. Utah and Colorado have both been on CNBC’s Top 10 list since 2007:
Forbes’ “Best States for Business” Rankings, 2007-2014, CNBC’s “Top States for Business” Rankings, 2007-2015
(Source: Forbes.com and CNBC.com)
Impressively, Utah has not fallen below third place on the Forbes list in the last nine years, and has
enjoyed the top slot for five of those nine. Colorado has also maintained consistently high rankings, but
— having peaked at fourth place in 2009 and 2010 — has not broken through to the top three. While
CNBC’s annual rankings for Utah and Colorado have fluctuated somewhat more than those of Forbes,
1 See, e.g., Eileen Norcross, Ranking the States by Fiscal Condition, MERCATUS RESEARCH, MERCATUS CENTER AT GEORGE
MASON UNIVERSITY, (July 2015), available at http://mercatus.org/sites/default/files/Norcross-StateFiscal-Condition.pdf (noting
that “states that depend on natural resources for revenues” often tend to “place at the top of the [fiscal solvency] rankings”); see
also The Kauffman Foundation, State Rankings for Startup Activity (2015), available at
http://www.kauffman.org/microsites/kauffman-index/rankings/state.
1
2
3
4
5
6
7
8
Forbes Business Climate Rankings
UT
CO1
2
3
4
5
6
7
8
9
CNBC Business Climate Rankings
UT
CO

7
the most recent report (June 2015) places the two side by side, with Utah ranked 3rd and Colorado
ranked 4th. Notably, neither Colorado nor Utah has come in below 8th place on either list since 2007.
It is important to note that ranking highly overall does not necessarily mean that a state received high
rankings in all of the individual subcategories. For example, CNBC ranked Utah 1st in the nation in 2015 in
its “Economy” subcategory, but 31st for “Education” and 30th for “Infrastructure.” Conversely, while
Colorado ranked 35th in Forbes’ “Business Costs” category in 2014, it came in 1st for “Labor Supply,” 4th for
“Growth Prospects” and 9th for “Quality of Life,” all ahead of Utah. (For a breakdown of each state’s most
recent rankings by category, see Figures A & B in the Appendix.)
Gross Domestic Product
Of the various ways to gauge the overall health of an economy, Gross Domestic Product (GDP) is among
the most common. GDP can also be a fairly reliable indicator of standard of living.
Figure 3. Both Utah and Colorado have experienced rapid growth in real state GDP since the Great
Recession ended in 2009:
Real GDP Growth Rates, 2007-2014 (chained 2009 dollars)—UT, CO, & U.S.
(Source: U.S. Bureau of Economic Analysis, http://www.bea.gov)
Figure 4. In terms of overall GDP growth since the recession ended in 2009, Utah has slightly outperformed
Colorado, and both have outperformed the nation.
Total Real GDP Growth, 2009-2014 (chained 2009 dollars)—UT, CO, & U.S.
(Source: U.S. Bureau of Economic Analysis, http://www.bea.gov)
2.1% 1.8%
-1.4%
1.3% 1.0%
2.1% 2.1%
4.7%
6.0%
-1.5%-1.9%
1.8%
2.7%
0.7%
3.7%
3.1%
1.5%
-0.5%
-2.7%
2.2%
1.4%2.1%
1.9%2.2%
-4%
-2%
0%
2%
4%
6%
2007 2008 2009 2010 2011 2012 2013 2014
Real Annual GDP Growth Rates
CO
UT
U.S.
12.5% 11.7% 10.1%
0%
5%
10%
15%
UT CO U.S.
Total Real GDP Growth 2009-2014

VOICES FOR UTAH CHILDREN | WORKING FAMILIES BENCHMARKING PROJECT 2016: UT VS. CO
8
Adjusting GDP growth for population allows us to see a slightly different comparison of the two state’s
overall economic performance. Utah’s per capita GDP has always been lower than the national level
simply because of our unique demographics – we have the highest share of children in our population of
any state. But looking at how that has changed over time opens a window into whether we are rising or
falling by this metric compared both to Colorado and the nation as a whole.
Figure 5: On a per-capita basis, Utah has struggled to recover to its pre-recession level of GDP. While
Colorado has matched the nation in its growth in per capita economic output, Utah remained 4% below its
pre-recession level in 2014.
Real Per Capita GDP in 2014 Compared to 2007 (chained 2009 dollars)—UT, CO, & U.S.
(Source: U.S. Bureau of Economic Analysis, U.S. Census Bureau)
The same trend is evident if we look at how each state’s per capita economic output compares to the
national level over time.
Figure 6: Utah climbed as high as 92% of the federal level of per capita GDP before the Great Recession but
has remained closer to its 2000-2006 trend level since then. Colorado, on the other hand, has returned to its
pre-recession level of 106% but remains in a longer-term downward trend compared to 15 years ago.
Real Per Capita GDP in 2014 Compared to 2007 (chained 2009 dollars)—UT, CO, & U.S.
(Source: U.S. Bureau of Economic Analysis, U.S. Census Bureau)
0.6% 0.5%
-4.0%-4%
-3%
-2%
-1%
0%
1%
US CO UT
Real Per Capita GDP in 2014 Compared
to 2007 Pre-Recession Peak
113% 112%
110%
109%107%
108%
106% 106%
107% 108%106%
105%104%
104%
106%
87%88%
87%86% 86%
87%
90%
92%
90%90%
88%
89%
87%
88% 88%
85%
90%
95%
100%
105%
110%
115%
20
00
20
01
20
02
20
03
20
04
20
05
20
06
20
07
20
08
20
09
20
10
20
11
20
12
20
13
20
14
CO and UT State Per Capita GDP as a Percent
of the US Per Capita GDP 2000-2014
CO
UT

9
Economic output per worker is another telling indicator of productivity and workforce competitiveness.
In 2014, Colorado ranked 19th highest for this measure of worker productivity, while Utah was much
farther back in 37th place. Utah has made progress relative to Colorado in the last 15 years, but not
relative to the nation.
Figure 7: Utah has closed the productivity gap somewhat over the last 15 years but remains well behind
Colorado in economic output per worker.
Real Per-Worker GDP, 2000-2014 (chained 2009 dollars)—UT, CO, & U.S. (Source: U.S. Bureau of Economic Analysis)
Figure 8: The worker productivity gap between Utah and Colorado has shrunk from about $11,000 in 2000 to
about $9,000 in 2014. But the gap with the national level has remained about the same over that period.
Worker Productivity Gap - Utah vs. Colorado, Utah vs. US, 2000-2014. (Source: U.S. Bureau of Economic Analysis)
$76,345
$82,859
$84,896
$74,747
$79,245$77,675
$80,682 $81,004
$63,448
$70,366
$68,951
$72,015 $71,799
$60,000
$65,000
$70,000
$75,000
$80,000
$85,000
$90,000
Real Per Worker GDP 2000-2014
U.S.
CO
UT
-$15,000
-$14,000
-$13,000
-$12,000
-$11,000
-$10,000
-$9,000
-$8,000
-$7,000
-$6,000
20
00
20
01
20
02
20
03
20
04
20
05
20
06
20
07
20
08
20
09
20
10
20
11
20
12
20
13
20
14
The Worker Productivity Gap:
UT vs CO and UT vs US
UT vs CO
UT vs US
CO 2014 rank = 19th
UT 2014 rank = 37th

VOICES FOR UTAH CHILDREN | WORKING FAMILIES BENCHMARKING PROJECT 2016: UT VS. CO
10
II. EMPLOYMENT PROSPECTS
Unemployment Across the country, unemployment rates peaked in 2010. Colorado’s peak unemployment rate (8.7) was
considerably closer to the national level (9.6) than Utah’s, which peaked at a rate of 7.8%. Since then
rates have fallen steadily, and in 2014 Utah had the 4th lowest unemployment rate in the nation,
compared to 15th place for Colorado.
Figure 9: Utah has consistently enjoyed some of the lowest unemployment rates in the nation.
Unemployment Rates, 2007-2015—UT, CO, & U.S. (Source: U.S. Bureau of Labor Statistics)
Figure 10. Labor Force Participation Rates (LFPR) have declined nationally and at the state level. Utah and
Colorado both enjoy high LFPRs, yet both have experienced LFPR declines even steeper than that at the
national level. More recently, Utah has seen some recovery in its LFPR while Colorado’s continues to decline.
Labor Force Participation Rates: 2006-2015 — UT, CO, & U.S. (Source: U.S. Bureau of Labor Statistics)
4.6
5.8
9.3 9.6
8.9
8.1
7.4
6.2
5.3
3.7
4.8
7.38.7
8.47.9
6.8
5.0
3.9
2.6
3.6
7.37.8
6.7
5.4
4.6
3.8 3.5
2
3
4
5
6
7
8
9
10
2007 2008 2009 2010 2011 2012 2013 2014 2015
UNEMPLOYMENT RATES 2007-2015
U.S.CO
UT
71.8 71.970.9
69.268.8
67.8 67.768.2
68.0(UT) 68.1
72.4 72.2 72.1
70.970.4
69.769.1 68.3
(CO)
67.966.7
66.2 66.1 66.065.4
64.764.1 63.7
63.362.9 62.7
62.0
64.0
66.0
68.0
70.0
72.0
74.0
2006 2007 2008 2009 2010 2011 2012 2013 2014 2015
Labor Force Participation Rates
2006-2015UT
CO
U.S.

11
Colorado’s 5.7 percentage point decline in labor force
participation is 63% larger than that of the nation as a
whole. Utah’s 3.8 point drop, while smaller than
Colorado’s, is larger than that of the nation as a whole.
As the Utah Economic Council wrote in its 2015
Economic Report to the Governor, “While a large portion
of the decline nationally can be attributed to
demographic factors (primarily baby boomers entering
retirement), this is not the case in Utah. Analysis of
participation rates reveals the greatest drop in
participation occurred among younger workers.”
Entrepreneurship
Entrepreneurship is a key component of economic opportunity for families of modest means. A strong
culture of entrepreneurship enables families to have greater control over their own economic destiny
while also fostering conditions for dynamic growth, such as a greater ability for a state economy to
rapidly adapt to changes in technology and consumer demand.
According to the Kauffman Foundation, which publishes annual state rankings for startup activity, both
Utah and Colorado have new entrepreneurship rates3 that are higher than the national average (0.29
percent). Additionally, both states were well within the top 20 on the Kauffman Index in 2014 and 2015.
Utah
Utah ranked 15th on the 2015 Kauffman Index
for startup activity, moving up two places, with a
new entrepreneurship rate of 0.3% and a startup
density of 168 startups per 100,000 residents.
Colorado
Colorado ranks highly in startup activity, climbing
from 7th in 2014 to 4th place in 2015, with a new
entrepreneurship rate of 0.35% and a startup
density of 175 startups per 100,000 residents.
Figure 11. Both states boast above-average entrepreneurship activity:
Kauffman Index 2015: State Rankings for Startup Activity—UT, CO, & U.S.
(Source: Ewing Marion Kauffman Foundation, http://www.kauffman.org/microsites/kauffman-index/rankings/state)
Utah’s opportunity share — the percent of new entrepreneurs who were not unemployed prior to starting
their business — sits at nearly 86%; Colorado’s opportunity share trailed Utah’s by just 1%. With regard to
startup density, roughly 7 more startups per 100,000 residents are being created in Colorado than in Utah.
2 Executive Office of the President of the US, The Labor Force Participation Rate Since 2007: Causes & Policy Implications (July 2014). 3 “Rate of New Entrepreneurs” is the percentage of the adult population that became entrepreneurs in a given month. “Startup
Density” is the number of startup firms (businesses less than one year old, employing at least one person in addition to the owner)
per 100,000 residents.
85
175
86
168
80
131
60
80
100
120
140
160
180
Opportunity Share Startup Density
Kauffman Index 2015: Startup Activity
CO UT U.S.
“Achieving a labor force participation rate
of 100 percent is not the goal, since many
people who leave the labor force are
engaged in important nonmarket activities,
such as schooling, raising children, or
retirement. However, discouraged workers
dropping out of the labor force would be a
cause for concern and would motivate
enacting policies to return these workers to
the labor force.”2
VOICES FOR UTAH CHILDREN | WORKING FAMILIES BENCHMARKING PROJECT 2016: UT VS. CO
12
III. EDUCATIONAL OPPORTUNITIES
An overview of educational attainment shows that Utah matches Colorado in the share of population
that started college, but then Utah falls behind.
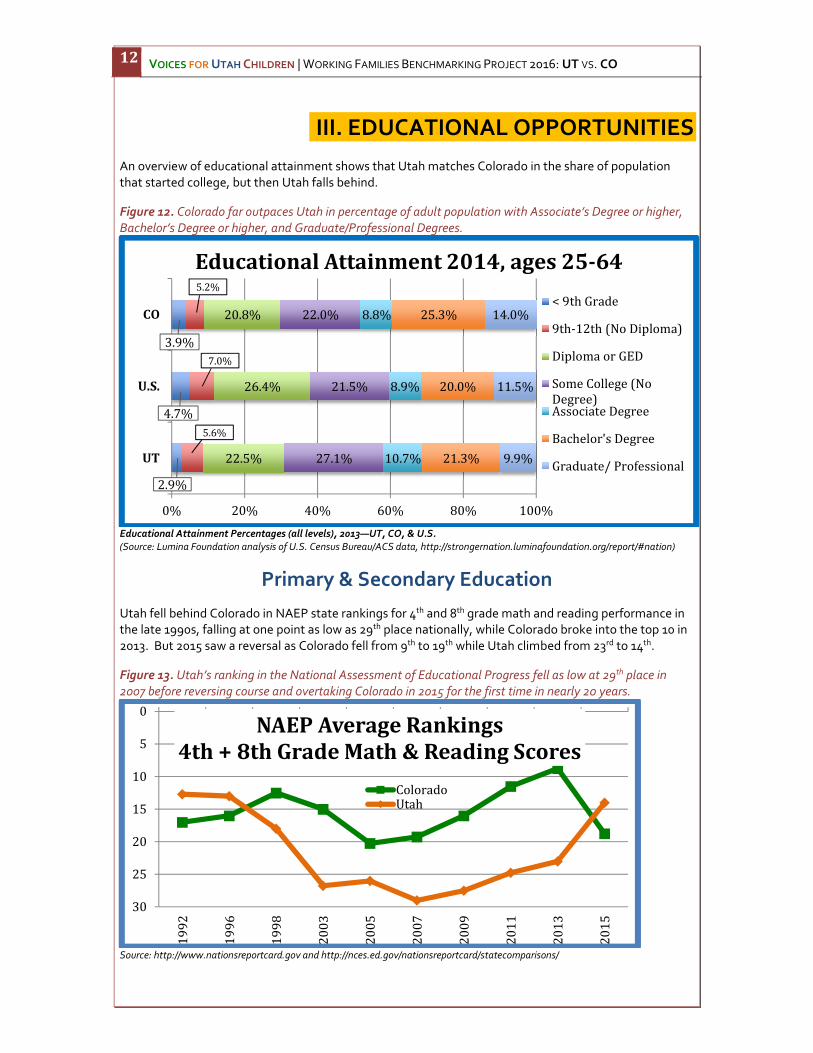
Figure 12. Colorado far outpaces Utah in percentage of adult population with Associate’s Degree or higher,
Bachelor’s Degree or higher, and Graduate/Professional Degrees.
Educational Attainment Percentages (all levels), 2013—UT, CO, & U.S.
(Source: Lumina Foundation analysis of U.S. Census Bureau/ACS data, http://strongernation.luminafoundation.org/report/#nation)
Primary & Secondary Education
Utah fell behind Colorado in NAEP state rankings for 4th and 8th grade math and reading performance in
the late 1990s, falling at one point as low as 29th place nationally, while Colorado broke into the top 10 in
2013. But 2015 saw a reversal as Colorado fell from 9th to 19th while Utah climbed from 23rd to 14th.
Figure 13. Utah’s ranking in the National Assessment of Educational Progress fell as low at 29th place in
2007 before reversing course and overtaking Colorado in 2015 for the first time in nearly 20 years.
Source: http://www.nationsreportcard.gov and http://nces.ed.gov/nationsreportcard/statecomparisons/
2.9%
4.7%
3.9%
5.6%
7.0%
5.2%
22.5%
26.4%
20.8%
27.1%
21.5%
22.0%
10.7%
8.9%
8.8%
21.3%
20.0%
25.3%
9.9%
11.5%
14.0%
0% 20% 40% 60% 80% 100%
UT
U.S.
CO
Educational Attainment 2014, ages 25-64
< 9th Grade
9th-12th (No Diploma)
Diploma or GED
Some College (NoDegree)Associate Degree
Bachelor's Degree
Graduate/ Professional
0
5
10
15
20
25
30
19
92
19
96
19
98
20
03
20
05
20
07
20
09
20
11
20
13
20
15
NAEP Average Rankings
4th + 8th Grade Math & Reading Scores
ColoradoUtah

13
While this apparent turnaround is encouraging news, evidence old and new suggests that Utah continues
to underperform its demographic peers. For example, a 2010 report from the Utah Foundation found
that “Utah is underperforming compared to states with similar demographics.”4 More recently, an
October 2015 analysis compared state NAEP performance while controlling for demographic differences
and found that Utah’s true rank among the states only improved in 2015 from 47th to 44th place.5 This is
of particular concern as Utah rapidly diversifies, with its minority population already exceeding 20%
among the general population and 25% among children.
Figure 14. Demographically-adjusted NAEP ranking finds that Utah continues to underperform its
demographic peers.
State NAEP Rank When Adjusted
for Demographic Differences
2013 2015
Colorado 12th place 22nd place
Utah 47th place 44th place
Urban Institute, “Breaking the Curve: Promises and Pitfalls of Using NAEP Data to Assess the State Role in Student
Achievement,” October 2015.
(Source: Urban Institute: http://www.urban.org/sites/default/files/alfresco/publication-pdfs/2000484-Breaking-the-Curve-Promises-
and-Pitfalls-of-Using-NAEP-Data-to-Assess-the-State-Role-in-Student-Achievement.pdf and http://www.urban.org/urban-wire/how-
do-states-really-stack-2015-naep )
The section below details Colorado and Utah’s status, improvement efforts, and challenges in the area of
educational opportunity.
Utah
Here are several notable facts about Utah’s public
education system:
• Utah’s per-pupil spending during the 2012-2013
school year (data released June 2015) was the
nation’s lowest, amounting to $6,555 annually;
nationally, the average amount spent per pupil that
year was $10,700.
o In the 2015 and 2016 General Sessions, the Utah
legislature voted to raise per-pupil spending
substantially, which should contribute to closing
the gap with Idaho, currently ranked 49th for per-
pupil spending.
• 13% of Utah 4-year-olds attended public preschool
in 2014-15.
o During the 2014 General Session, the Utah
legislature passed House Bill 96, which allowed
private investors to finance preschool and receive
results-based reimbursements from the state.
This innovative approach makes high-quality
Pre-K available to just a few hundred children
each year. The encouraging initial results led the
Colorado
Colorado’s educational rankings saw fairly consistent
improvement from the late 1990s through 2013. A
recent Utah Foundation report7 identified those
policies that played a role:
1) Per-Pupil Spending
o While still well below the national average,
Colorado’s per-pupil spending — $8,647 — is close
to 30 percent higher than the amount spent per
pupil in Utah.
2) Early Childhood Interventions
o On average, Colorado students entering 3rd grade
have received nearly 18 months more instructional
time than their Utah counterparts:
� 34 percent of Colorado’s 4-year-olds are
enrolled in public preschool (compared to only
13 percent in Utah). Another 15 percent attend
private preschool, bringing combined total
enrollment to 49 percent.
� 74 percent of 5-year-olds in Colorado are
enrolled in full-day kindergarten (compared,
again, to 13 percent in Utah); the nationwide
4 Source: http://www.utahfoundation.org/reports/school-testing-results-how-utah-compares-to-states-with-similar-
demographics/ 5 Source: http://www.urban.org/sites/default/files/alfresco/publication-pdfs/2000484-Breaking-the-Curve-Promises-and-Pitfalls-of-
Using-NAEP-Data-to-Assess-the-State-Role-in-Student-Achievement.pdf and http://www.urban.org/urban-wire/how-do-states-
really-stack-2015-naep 7 See http://www.utahfoundation.org/reports/lessons-from-our-neighbor/

VOICES FOR UTAH CHILDREN | WORKING FAMILIES BENCHMARKING PROJECT 2016: UT VS. CO
14
legislature in 2016 to enact SB 101, allocating
$11 million to expand high-quality programs
statewide, which will make the myriad benefits
of preschool available to an additional 4,000
children in the intergenerational poverty cohort.
• Kindergarten is not mandatory in Utah; of those 5-
year-olds who do attend, only 13 percent were
enrolled in full-day kindergarten as of 2013 (down
from 18 percent in 2010). 6
o In 2013, legislators approved a $7.5 million
initiative to fund optional extended-day
kindergarten on an ongoing basis.
o In 2016, HB 42 would have allocated an
additional $10 million in ongoing funds to create
or expand optional extended day kindergarten.
The bill passed the House but not the Senate.
• As of 2013, less than 40 percent of Utah 4th graders
were able to read at proficient levels.
o Gov. Herbert has set an ambitious goal to have
90 percent of Utah third-graders achieve reading
proficiency by 2020.
• Utah came in at # 29 for education on the Annie E.
Casey Foundation’s annual Kids Count state rankings
in both 2014 and 2015 (see Figure D in the Appendix).
average for full-day kindergarten enrollment is
77 percent.
3) Rigorous Standards & Frequent Assessment
o In 1993, Colorado passed the Standards-Based
Education Reform Bill requiring district standards
to be at least as stringent as the state’s. Districts
then had the choice of either:
� Designing their own, equally stringent
standards; or
� Adopting/incorporating the Colorado Model
Content Standards
o Colorado then crafted assessments that aligned
with the standards, and—upon request from
districts—developed a method to measure
performance (called the Colorado Growth Model).
� Roughly half of U.S. states use some variation
of the Colorado Growth Model.
The most recent Kids Count rankings also suggest
improvement (see Figure D in the Appendix); between
2014 and 2015, Colorado moved up 2 places in the
education category, from 11th to 9th.
Postsecondary Education & Training
Opportunities to pursue higher education are important in securing a bright economic future, at
individual, state, and national levels alike. It is projected that by 2020, 65 percent of all jobs nationwide
will require some form of postsecondary education—up from a mere 28 percent in 1973.8
Figure 15. In response to predicted future workforce demands, Utah9 and Colorado have set similarly
ambitious statewide higher education attainment goals. Unlike Utah, however, Colorado has made
narrowing demographic gaps in educational attainment a stated priority:
States with Higher Education Attainment Goals as of September 2014 (Source: Strategy Labs/Lumina Foundation,
strategylabs.luminafoundation.org/wp-content/uploads/2013/10/State-Attainment-Goals.pdf)
Much like early childhood education programming, however, achieving these laudable higher education
6 See http://www.utahfoundation.org/reports/lessons-from-our-neighbor/ 8 See Anthony Carnevale et al., Recovery: Job Growth & Education Requirements Through 2020 (2013) ( “[a]t the current production
rate in higher education, we will fall 5 million short of the workers with postsecondary credentials we will need by 2020”). 9 Figure E in the Appendix contains more recent revisions to Utah’s degree attainment goals.
15
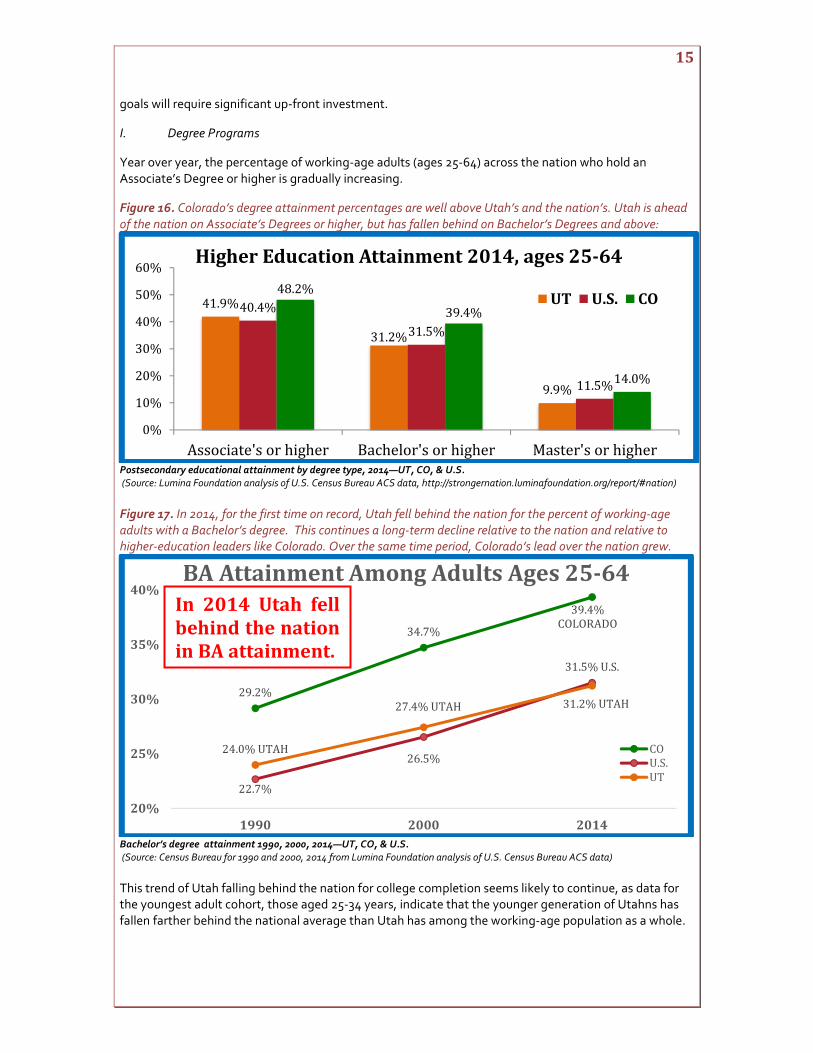
goals will require significant up-front investment.
I. Degree Programs
Year over year, the percentage of working-age adults (ages 25-64) across the nation who hold an
Associate’s Degree or higher is gradually increasing.
Figure 16. Colorado’s degree attainment percentages are well above Utah’s and the nation’s. Utah is ahead
of the nation on Associate’s Degrees or higher, but has fallen behind on Bachelor’s Degrees and above:
Postsecondary educational attainment by degree type, 2014—UT, CO, & U.S.
(Source: Lumina Foundation analysis of U.S. Census Bureau ACS data, http://strongernation.luminafoundation.org/report/#nation)
Figure 17. In 2014, for the first time on record, Utah fell behind the nation for the percent of working-age
adults with a Bachelor’s degree. This continues a long-term decline relative to the nation and relative to
higher-education leaders like Colorado. Over the same time period, Colorado’s lead over the nation grew.
Bachelor’s degree attainment 1990, 2000, 2014—UT, CO, & U.S.
(Source: Census Bureau for 1990 and 2000, 2014 from Lumina Foundation analysis of U.S. Census Bureau ACS data)
This trend of Utah falling behind the nation for college completion seems likely to continue, as data for
the youngest adult cohort, those aged 25-34 years, indicate that the younger generation of Utahns has
fallen farther behind the national average than Utah has among the working-age population as a whole.
41.9%
31.2%
9.9%
40.4%
31.5%
11.5%
48.2%
39.4%
14.0%
0%
10%
20%
30%
40%
50%
60%
Associate's or higher Bachelor's or higher Master's or higher
Higher Education Attainment 2014, ages 25-64
UT U.S. CO
29.2%
34.7%
39.4%COLORADO
22.7%
26.5%
31.5% U.S.
24.0% UTAH
27.4% UTAH 31.2% UTAH
20%
25%
30%
35%
40%
1990 2000 2014
BA Attainment Among Adults Ages 25-64
COU.S.UT
In 2014 Utah fell
behind the nation
in BA attainment.
VOICES FOR UTAH CHILDREN | WORKING FAMILIES BENCHMARKING PROJECT 2016: UT VS. CO
16
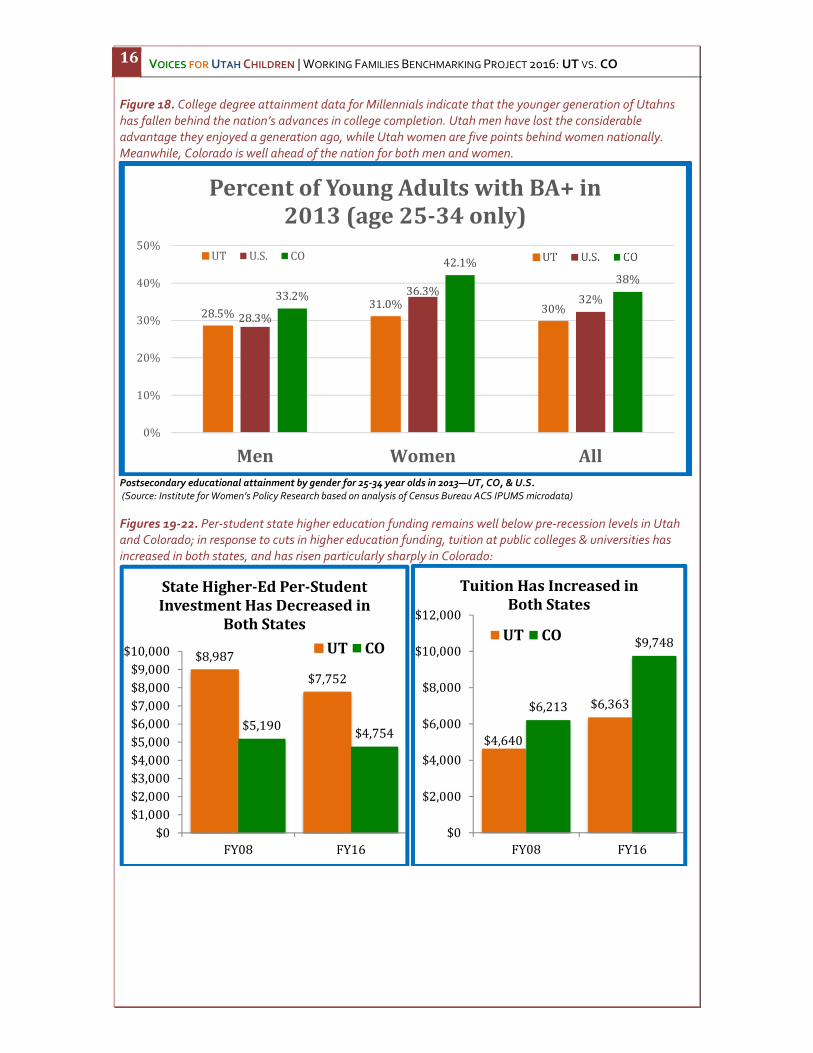
Figure 18. College degree attainment data for Millennials indicate that the younger generation of Utahns
has fallen behind the nation’s advances in college completion. Utah men have lost the considerable
advantage they enjoyed a generation ago, while Utah women are five points behind women nationally.
Meanwhile, Colorado is well ahead of the nation for both men and women.
Postsecondary educational attainment by gender for 25-34 year olds in 2013—UT, CO, & U.S.
(Source: Institute for Women’s Policy Research based on analysis of Census Bureau ACS IPUMS microdata)
Figures 19-22. Per-student state higher education funding remains well below pre-recession levels in Utah
and Colorado; in response to cuts in higher education funding, tuition at public colleges & universities has
increased in both states, and has risen particularly sharply in Colorado:
28.5%31.0% 30%
28.3%
36.3%32%33.2%
42.1%
38%
0%
10%
20%
30%
40%
50%
Men Women All
Percent of Young Adults with BA+ in
2013 (age 25-34 only)
UT U.S. CO
$8,987
$7,752
$5,190$4,754
$0
$1,000
$2,000
$3,000
$4,000
$5,000
$6,000
$7,000
$8,000
$9,000
$10,000
FY08 FY16
State Higher-Ed Per-Student
Investment Has Decreased in
Both States
UT CO
$4,640
$6,363$6,213
$9,748
$0
$2,000
$4,000
$6,000
$8,000
$10,000
$12,000
FY08 FY16
Tuition Has Increased in
Both States
UT CO

17
Inflation-adjusted change in state higher education spending per student and average tuition at 4-year public colleges, FY08-
FY16 (in constant 2015 $) — UT vs. CO. (Source: Center on Budget & Policy Priorities (CBPP), http://www.cbpp.org/research/state-
budget-and-tax/years-of-cuts-threaten-to-put-college-out-of-reach-for-more-students)
Although spending per student has decreased in both states, these figures do indicate that while
Colorado spends more per pupil than Utah on PK-12 education, Utah spends considerably more per
student on higher education. Utah’s lower tuition costs are due in no small part to this additional per-
student funding.
Utah
Despite the financial obstacles many students have
been facing, state institutions across Utah have
nonetheless seen significant increases in enrollment
since the recession.10 The average Utah college
student now pays over $1,700 more per year than their
pre-recession counterparts.11 Furthermore, the state is
supporting students with over $1,200 less than at the
beginning of the recession — a cut of 14%.12
To compensate for such financial challenges, at least
some institutions have implemented programs to help
students afford — and complete — their degrees:
� Weber State University’s Dream Weber program
combines need-based aid with performance
metrics, propelling students toward college
completion by tying student aid to factors such as
course loads and grades.13
Colorado
Colorado’s higher education spending cuts have
led not only to tuition hikes, but to reductions in
faculty and staff and elimination of programs,
as well: Colorado State University–Fort Collins,
for example, cut more than 350 faculty and staff
positions between 2009 and 2013.15
Unlike Utah, however, Colorado has continued
year over year to maintain or increase the
amount of need-based financial aid available to
students enrolling in state colleges and
universities.16 (For a comparative look at
changes in need-based aid, see Figure F in the
Appendix.)
As illustrated in Figure 23 below, Colorado will
add a yearly “retention increase” to a student’s
10 See also Bryan Schott, Dream Weber—A Model for Improving College Access and Completion, UTAH PULSE, (Jul. 22, 2015),
available at http://utahpulse.com/index.php/features/business/2499-dream-weber-a-model-for-improving-college-access-and-
completion. 11 Id. 12 Id. 13 Id. 15 See Jeff Tucker, Fort Collins Campus has Suffered Cutbacks, THE PUEBLO CHIEFTAIN, (Jan. 17, 2014), available at
http://www.chieftain.com/news/region/2196652-120/csu-pueblo-budget-million.
-$436
$3,535
-$1,235
$1,723
-$2,000 -$1,000 $0 $1,000 $2,000 $3,000 $4,000
Spending
Tuition
Tuition Increases and State
Spending Cuts 2008-2016 by
Dollar Amounts
UT
CO -8%
57%
-14%
37%
-20% 0% 20% 40% 60%
Spending
Tuition
Tuition Increases and State
Spending Cuts 2008-2016 by
Percent
UT
CO

VOICES FOR UTAH CHILDREN | WORKING FAMILIES BENCHMARKING PROJECT 2016: UT VS. CO
18
� Another new initiative, SLCC Promise, aims to
“remove economic barriers and to provide a
pathway” for Salt Lake Community College
students to complete their degrees. The goal of
the Promise initiative is to help cover educational
expenses for eligible students — Utah residents
who have received federal Pell grants and are
enrolled full-time at SLCC — by making up the
difference between the amount of the grant and
the total cost of attendance.14
financial aid base rate, provided that the
recipient continues to accumulate the requisite
number of academic credit hours. The stated
objective behind Colorado’s “Completion
Incentives” model is to “directly support the
master plan goals of increased credit hour
accumulation, timely degree completion, and
improving outcomes for historically
underserved students.”17
Figure 23. Under Colorado’s need-based aid framework, financial aid awards increase alongside credit
accumulation:
Colorado Commission on Higher Education (CCHE)—Financial Aid Completion Incentives
(Source: Colorado Department of Higher Education, Strategic Plan FY 2013-14
http://highered.colorado.gov/Publications/General/StrategicPlanning/201314_HED_Strategic_Plan.pdf)
II. Trade Certification
Economies with significant manufacturing sectors require large numbers of skilled-trades workers—such
as welders, electricians, and machinists18—to meet their labor demands. In recent years, however,
workers have been “aging out” of these fields at a rate more rapid than those coming in at entry level.19
Moreover, in addition to the reality that people are entering the skilled-trades sector at a lower rate than
they are retiring from it, the over-45 age group accounts for more than half of the nation’s total skilled-
trades workforce.20 As a result, meeting these labor demands is becoming increasingly difficult
nationwide, and analysts predict that the “skills gap is likely to become more acute.”21
16 See Colorado Dept. of Higher Educ., Higher Education Strategic Plan FY 2013-14, (Jan. 2013), at 13 (“While recent year budget cuts
have resulted in tuition increases, such revenues have allowed institutions to maintain operations and increase institution-based
financial aid.”). 14 https://www.slcc.edu/promise/ 17 Id. at 14. 18 The accepted definition of “skilled trades occupations” was set forth by the Virginia Manufacturers Association; for the complete
list, see Figure G in the Appendix. 19 Joshua Wright, America’s Skilled Trades Dilemma: Shortages Loom As Most-In-Demand Group Of Workers Ages, FORBES, (Mar. 7,
2013), available at http://www.forbes.com/sites/emsi/2013/03/07/americas-skilled-trades-dilemma-shortages-loom-as-most-in-
demand-group-of-workers-ages/ (noting also that the “skills gap” problem is compounded by the fact that the physical demands
associated with jobs in this sector often necessitate earlier-than-average retirement). 20 See id. 21 Id. Wright also indicates that the skills gap has deepened in part because “American high schools have largely shifted their focus
to preparing students for four-year colleges rather than vocational school.”

19
Figure 24. As of 2013, workers under age 45 made up more than half of the skilled-trades workforce in both
Utah and Colorado, indicating that both states enjoy an advantage over the nation in addressing the
challenge of a possible future skills shortage:22
2012 Skilled-Trade Employment Demographics—UT, CO, & U.S. (Source: EMSI)
Utah
Because Utah has a younger-than-average
population, its over-45 share of the skilled-trades
labor force is considerably lower than in both
Colorado and the nation. Realizing, however, that
employers in this sector will find it increasingly
difficult to acquire the skilled talent their
companies need if the trend continues unabated,
Utah is taking steps to avoid a future skills gap.
In 2010, the State Board of Regents adopted its 66
by 2020 goal (see Figure 15 on page 14). That 66
percent was then broken down by certificate and
degree type, based on projected workforce
demands; these individual category percentages
are revisited annually and revised as needed (see
Figure E in the Appendix).
In the context of trade certification, Utah has
begun implementing initiatives geared toward
workforce training based on both current and
projected local demand:
� The Custom Fit Training Program—funded via
legislative appropriation and administered by
the Utah College of Applied Technology
(UCAT)—provides customized training to
employees based on the needs of employers, as
a way to “attract new businesses and aid in the
Colorado
In Colorado, workers over age 45 make up almost
exactly half of the skilled-trades labor force. Aware
of the potential long-term consequences of such a
trend, then-Governor Bill Ritter, Jr., signed
Executive Order B 2010-012—Reconstituting the
Colorado Workforce Development Council. In it,
he wrote:
Our ability to grow the economy, support
businesses and industry, and create quality
jobs hinges on the knowledge, productivity,
and ingenuity of our people. Over time,
silos have arisen, making it difficult to align
the interests of the business community
with those of the workforce development
and education communities. The future of
our workforce system depends on our
ability to create a demand-driven system
by working with business to determine the
upcoming workforce needs.
Executive Order B 2010-012 directed the CWDC to
develop strategic workforce plans, at both
statewide and regional levels, so as “to more
effectively align current initiatives in education,
workforce training and economic development in
order to … meet the needs of a growing and
changing economy during the next ten years.”
22 It merits additional mention that a fair percentage of these skilled-trades workers are, in fact, over the age of 55 — 15.7 percent in
Utah and 17.9 percent in Colorado, compared to 20.6 percent nationwide. See id.
VOICES FOR UTAH CHILDREN | WORKING FAMILIES BENCHMARKING PROJECT 2016: UT VS. CO
20
retention and expansion of existing
businesses.”23 The Custom Fit program, through
which UCAT provides participating companies
with a 50 percent funds match for on-the-job
employee training, served 14,029 trainees and
1,421 businesses across the state during fiscal
year 2014.24
� In response growing labor force demands within
Utah’s sizeable aerospace industry, the
Governor’s Office of Economic Development has
been collaborating with a variety of private- and
public-sector partners to launch an Aerospace
Manufacturing Certificate pilot program.25
Beginning in 2015, high school seniors in Davis
and Granite School Districts are eligible to enter
the program with the expectation of receiving an
aerospace manufacturing certificate upon
graduation.26 Students who earn this certificate
during their senior year can qualify for entry level
positions at:
o Boeing
o Harris
o Hexcel
o Janicki Industries
o Orbital ATK
o Hill Air Force Base
Though targeted toward high school seniors during
the pilot phase, the eligibility criteria for this
program may ultimately be extended to include
unemployed or underemployed adults as well).27
With similar objectives in mind, the Colorado
legislature passed the Skills for Jobs Act in 2012.
Designed to align Colorado’s job openings with
education and training outcomes and reduce the
state’s skills gap, a key objective of the Act was to
highlight “the workforce needs that are not being
met by colleges and identify institutions that can
expand or create programs to address those
needs.”28
In the FY2014-15 Colorado Skills for Jobs Report,
analysts projected that 74 percent of Colorado jobs
will require some form of postsecondary education
by 2020, ranking the state third nationally in terms
of anticipated postsecondary training needs.29
Colorado’s response to these projections has been
broad, and has utilized public-private partnerships
similar to Utah’s Custom Fit training program.
Currently, Colorado has:
� 5 active manufacturing sector partnerships
� 5 active healthcare sector partnerships
� Additional emerging partnerships in progress
such as the Greater Metro Denver Healthcare
Partnership “serves as a pilot for the creation of
Career Pathway templates in building out a
statewide Career Pathway System.”30
23 Key State Economic Development Incentives & Programs, July 2015, available at http://le.utah.gov/interim/2015/pdf/00003250.pdf. 24 See id. 25 See Michael Sullivan, Aerospace Manufacturing Takes Off in Utah, UTAH GOVERNOR’S OFFICE OF ECONOMIC DEVELOPMENT,
(Jul. 22, 2015), available at http://business.utah.gov/news/aerospace-manufacturing-takes-off-in-utah/. 26 For more information on program specifics, contact Sandra Hemmert (Granite School District) at
[email protected], or Neil Hancey (Davis School District) at [email protected]. 27 Based on statements made during a presentation by GOED to the Utah Legislature’s Economic Development & Workforce
Services Interim Committee on July 15, 2015. 28 Ed Sealover, New law seeks to match Colorado workforce needs, skills, DENVER BUSINESS JOURNAL, (Apr. 2, 2012), available at
http://www.bizjournals.com/denver/news/2012/04/02/new-law-seeks-to-match-colorado.html. 29 See Lauren Victor, Legislative Report on the Skills for Jobs Act, (Jan. 2015), prepared on behalf of the Colorado Department of
Higher Education (breaking down the 74 percent projection into “baccalaureate or higher” (42 percent of jobs) and “associate’s
degree or certificate award” (32 percent of jobs) by 2020). 30 See id. at 25.

21
IV. DEMOGRAPHIC AND SOCIAL FACTORS
Certain demographic and social factors — gender, ethnicity, or disability status, for example — are
associated with varying degrees of diminished economic opportunity due to challenges including
educational disparities, reduced social capital, underrepresentation in government, and employment
discrimination.
Gender
Figure 25. Women in Colorado fare better than in Utah in all but one of the five categories below:
The Status of Women in the States (2015) (Source: Institute for Women’s Policy Research, www.statusofwomendata.org)
According to the 2015 Status of Women in the States report, published by the Institute for Women’s
Policy Research, Utah ranked in the bottom 50 percent in 4 out of 5 specified categories, ranking dead
last in 2 of them: Political Participation31 and Work & Family.32 Utah’s strongest category was Health &
Well-Being,33 in which it currently ranks 2 places higher than Colorado, at number 4. Colorado received its
lowest ranking in the Political Participation category, coming in at 19th overall, but was ranked within the
top 10 in both Health & Well-Being (6th) and Poverty & Opportunity34 (8th).
I. Political Participation
Women in Utah are underrepresented in public office at all levels. Several organizations have formed a
collaborative nonpartisan initiative called Real Women Run, the goal of which is to inspire and assist
women in running for all levels of public office across the state. 35
Colorado has some room for improvement in this category, as well, and a number of organizations are
making efforts to increase political participation among Colorado women. The Colorado Women’s
Agenda, for example, “is a statewide network that champions economic security, social justice and
political power for all Colorado women through public education, political advocacy, communications
and grassroots activism.”36
31 The report’s Political Participation category is based upon (1) voter registration and turnout, (2) female state and federal elected
and appointed representation, and (3) state-based institutional resources for women. 32 The category of Work & Family is based upon available supports for work and family at the state level, including: (1) paid leave, (2)
elder and dependent care, (3) motherhood and work, (4) female breadwinners, and (5) childcare and preschool education. 33 The Status of Women in the States report determines rankings in the Health & Well-Being category using nine component
indicators: mortality rates from (1) heart disease, (2) breast cancer, and (3) lung cancer; incidence of (4) diabetes, (5) chlamydia, and
(6) AIDS; average number of days per month (7) that mental health was not good, and/or (8) that activities were limited due to
health status; and (9) suicide mortality rates. 34 The Poverty & Opportunity category is discussed at greater length in Part II of this report. 35 Participating organizations include YWCA Utah; University of Utah Hinckley Institute of Politics; AAUW of Utah; League of
Women Voters; Utah Women & Leadership Project; Zions Bank; Salt Lake Community College; Weber State University’s Walker
Institute; Vision 2o2o; and SpringBoard Utah. For more information, visit www.realwomenrun.org. 36 Information about the Colorado Women’s Agenda, and other recommended resources for women seeking political office in
Colorado, is listed on the Democratic Women of Boulder County website: http://www.dw-bc.org/#!run-for-office/c1ji5.

VOICES FOR UTAH CHILDREN | WORKING FAMILIES BENCHMARKING PROJECT 2016: UT VS. CO
22
II. Work & Family
Work and family are top priorities for most Utahns; thus, being ranked 50th in this particular category
should be a matter of concern for state policymakers.
III. Employment & Earnings
Utah ranked 39th in the nation in terms of women’s employment and earnings. New research with regard
to the gender wage gap published in 2015 by Voices for Utah Children found the disparity between men’s
and women’s wages in Utah to be much larger than the same disparity at both national and regional
levels. While discrimination was found to be the largest contributor to the wage gap both nationally and
in Utah, the research also found that Utah’s gap is so much larger than the nation’s because of how
women’s qualifications and characteristics – such as educational disparities – put them at a much larger
disadvantage in Utah than elsewhere.
Race, Ethnicity & Disability Status
Across the United States, people of color face a disproportionate number of obstacles to achieving
educational and economic success—often beginning even before kindergarten37 and frequently
persisting well into adulthood.38 In a number of contexts, many of the same obstacles faced by
racial/ethnic minorities hold true for individuals with disabilities as well.
Figure 26. Across the U.S., students of color and students with disabilities are disproportionately referred to
police and courts as a result of in-school disciplinary issues; in Utah and Colorado, K-12 public schools refer
minority and special-needs students to law enforcement with above-average frequency:
Rate of referral to law enforcement per 1,000 students—UT, CO, & U.S.
(Source: Center for Public Integrity analysis of U.S. Dept. of Education Civil Rights Data Collection 2011-12 enrollment & discipline
data, http://www.publicintegrity.org/2015/04/10/17074/state-state-look-students-referred-law-enforcement)
37 See, e.g., Lindsey Cook, U.S. Education: Still Separate and Unequal, U.S. NEWS & WORLD REPORT, (Jan. 28, 2015), available at
http://www.usnews.com/news/blogs/data-mine/2015/01/28/us-education-still-separate-and-unequal (“By age 2, disparities already
show between black and white children. Fewer black children demonstrate proficiency in development skills such as receptive
vocabulary, expressive vocabulary, matching, early counting, math, color knowledge, numbers and shapes.”). 38 See, e.g., Janell Ross, African Americans With College Degrees Are Twice As Likely to Be Unemployed as Other Graduates, THE
NATIONAL JOURNAL, (May 27, 2014), available at http://www.nationaljournal.com/next-america/education/african-americans-
with-college-degrees-are-twice-as-likely-to-be-unemployed-as-other-graduates-20140527 (“A new study [found] that 12.4 percent
of black college graduates were unemployed. For all college graduates, the unemployment rate stood at just 5.6 percent.”).
5.6
17.4
9.1
4.1
10.3
5.8
9.8
5.94.6
10.9
8.1
15.8
10.2
6
15.3
0
2
4
6
8
10
12
14
16
18
20
All Black Hispanic White Disabled
Rates of referral to law
enforcement per 1,000 students
UT U.S. CO
23
Postsecondary credential attainment is regarded as a key solution for reducing poverty, and for
narrowing the disparities of wealth faced by people of color in the United States.39 This solution,
however, first requires completion of high school (or its equivalent), and students who are subject to law
enforcement referrals at school are significantly less likely to achieve this milestone.40
Utah
According to enrollment and discipline statistics
from the U.S. Department of Education Civil Rights
Data Collection, the overall rate of referral to law
enforcement in Utah public schools is 5.6 referrals
per 1,000 students; the Center for Public Integrity
has ranked Utah 23rd in terms of disproportionality
of referrals to police and courts.41
Utah’s data is on par with the national average in
terms of overall referral rate, as well as referral rates
of white students and students with disabilities.
Rates of referral for black and Latino students in
Utah, however, are significantly higher than the
national average.42 As of the 2011-2012 school year:
� White students made up 77 percent of Utah’s K-12
public school population, but accounted for only
56.9 percent of referrals to law enforcement.
� Black students made up only 1.4 percent of Utah’s
K-12 public school population, but accounted for
4.5 percent of referrals to law enforcement.
� Latino students made up 15.3 percent of Utah’s K-
12 public school population, but accounted for
24.8 percent of referrals to law enforcement.
� Students with disabilities made up 13 percent of
Utah’s K-12 public school population, but
accounted for 23.9 percent of referrals to law
enforcement.
Colorado
According to the Center for Public Integrity,
Colorado public schools’ referrals to police and
courts are the nation’s 10th most
disproportionate. The overall rate of referral to
law enforcement in Colorado’s public schools is
8.1 referrals per 1,000 students.
Across the board, Colorado’s law enforcement
referral rates exceed the national averages, a fact
that should prompt state policymakers to take a
serious look at the problem in order to identify
and address the root causes. As of the 2011-2012
school year:
� White students made up 56.1 percent of
Colorado’s K-12 public school population, but
accounted for only 41.5 percent of referrals to
law enforcement.
� Black students made up only 4.8 percent of
Colorado’s K-12 public school population, but
accounted for 9.4 percent of referrals to law
enforcement.
� Latino students made up 31.7 percent of
Colorado’s K-12 public school population, but
accounted for 39.8 percent of referrals to law
enforcement.
� Students with disabilities made up 10.8 percent
of Colorado’s K-12 public school population, but
accounted for 20.4 percent of referrals to law
enforcement.
Unfortunately, to factor out such discipline concerns still would not level the educational playing field.
Far too many minority high school students graduate without being adequately prepared for the rigors of
the postsecondary experience.
39 See Rhonda Bryant, College Preparation for African American Students: Gaps in the High School Educational Experience, CENTER
FOR LAW & SOCIAL POLICY, (Feb. 2015) (on file with author). 40 According to research by the Public Policy Institute at U of U’s S.J. Quinney College of Law, a single suspension in 9th grade
doubles the likelihood that a student will drop out of high school (see Figure H in the Appendix). 41 Just prior to the publication of this report, local media announced that the Salt Lake City School District is presently under federal
investigation by the U.S. Department of Education due to “allegations of discrimination, retaliation, and unfair treatment of
minority students.” See Benjamin Wood, Feds investigating claims of racial discrimination in Salt Lake City schools, THE SALT LAKE
TRIBUNE, (Aug. 19, 2015), available at http://www.sltrib.com/home/2855172-155/federal-education-managers-looking-into-claims
(“Included in [school board member Michael Clara’s] complaint were allegations that students of color are targeted for disciplinary
action and that school-based police officers are disproportionately assigned to areas with high racial diversity.”). 42 For additional information on the “school-to-prison pipeline” in Utah, see Figure H in the Appendix.

VOICES FOR UTAH CHILDREN | WORKING FAMILIES BENCHMARKING PROJECT 2016: UT VS. CO
24
Figure 27. Between 2003 and 2013, Advanced Placement (AP) test participation rates increased in both
Colorado and Utah for both white and Latino students. But while pass rates (defined as the share of students
scoring 3 or higher) held steady for white students, they declined in both states for Latino students, though
Utah continues to have a higher AP pass rate for Latino students.
AP® Participation & Success Across Racial/Ethnic Demographics—Utah vs. Colorado
(Source: The College Board 10th Annual AP® Report to the Nation (UT & CO Supplements), 2014)
Another area worth examining in this regard would be the varying rates at which different groups
graduate from high school, enroll in college, and complete college. But comparisons of college
enrollment and completion rates are difficult because of the missionary phenomenon in Utah, where a
large portion of the young adult population delays post-secondary education for 1.5-2 years in order to
complete an LDS mission.
23%27%
67% 71%
42%36%
67% 71%
0%
10%
20%
30%
40%
50%
60%
70%
80%
Partic. Rate CO Partic. Rate UT Pass Rate CO Pass Rate UT
White AP Participation & Performance
CO vs UT, 2003 + 2013
2003 2013
14%18%
58%
74%
26% 25%
50%
61%
0%
10%
20%
30%
40%
50%
60%
70%
80%
Partic. Rate CO Partic. Rate UT Pass Rate CO Pass Rate UT
Latino AP Participation & Performance
CO vs UT, 2003 + 2013
2003 2013

25
Income Inequality & Social Mobility
In recent years social scientists have begun to draw a link between increased income inequality and
reduced social mobility.
Figure 28. As measured by the Gini Index, income inequality has grown rapidly in the US. Even in Utah,
which had the 3rd lowest Gini inequality score among the 50 states in 2014 (vs 20th for Colorado), the level
has risen to where the nation was in the 1980s.
Gini Index of Household Income—Utah vs. Colorado vs. U.S.
(Source: 1979, 1989, 1999 data from, 1980, 1990, and 2000 Censuses of Population accessed at
www.census.gov/hhes/www/income/data/historical/state/state4.html. 2014 data from 2014 ACS 1-year estimates accessed at
factfinder.census.gov/faces/tableservices/jsf/pages/productview.xhtml?pid=ACS_14_1YR_B19083&prodType=table )
Utah has important advantages that promote greater social mobility, including:
• Low poverty rates
• A history of avoiding geographic concentration of poverty
• Effective public and private institutions that help keep lower-income families from becoming
socially and economically isolated
Figure 29. Among the top 50 metro areas in the nation, Salt Lake ranks at the very top for upward mobility,
while Denver ranks 19th.
Upward Mobility
Ranking among the
largest 50 metro areas
Metro Area/
”Commuting
Zone”
Population in
2000 Census
“Absolute
Upward Mobility”
Score
#1 Salt Lake City 1,426,729 46.2
#19 Denver 2,449,044 42.2
Upward Mobility Ranking/ Absolute Upward Mobility Score “is a measure of the average economic outcome of a child from a
below-median income family. Statistically, we define absolute upward mobility as the average percentile in the national income
distribution of a child who is born to parents at the 25th percentile in the national income distribution. In areas with higher
absolute upward mobility, children from low-income parents earn higher incomes on average as adults.”
(Source: Chetty, Hendren, Kline, and Saez, “Where is the Land of Opportunity? The Geography of Intergenerational Mobility in the
United States,” Quarterly Journal of Economics 129(4): 1553-1623, June 2014, Table III: Intergenerational Mobility in the 50 Largest
Commuting Zones. Accessible at http://www.equality-of-opportunity.org/index.php/papers .)
0.36
0.38
0.4
0.42
0.44
0.46
0.48
1979 1989 1999 2014
Gini Index of Inequality 1979, 1989, 1999, 2014
U.S.
CO
UT
VOICES FOR UTAH CHILDREN | WORKING FAMILIES BENCHMARKING PROJECT 2016: UT VS. CO
26
SOURCES & METHODOLOGY
Most of the information presented in this report is based on the two nationwide surveys conducted by
the U.S. Census Bureau – the Current Population Survey (CPS) and the American Community Survey
(ACS). Most of the state-level data is from the ACS because it surveys about one percent of the U.S.
population each year, which is a large enough sample to reduce the margin of error to a very low level. In
many instances we have relied on calculations and microdata analysis of these data sources conducted
by Voices for Utah Children, Economic Policy Institute, Institute for Women’s Policy Research, the Kids
Count Data Center of the Annie E. Casey Foundation, and others as noted in the text.
Sources for Summary of Key Findings on page 3:
1) Business Climate Rankings: see Appendix below
2) Unemployment Rates: U.S. Bureau of Labor Statistics
3) LFPR: U.S. Bureau of Labor Statistics
4) GDP data: U.S. Bureau of Economic Analysis
5) Kauffman Index: Ewing Marion Kauffman Foundation,
http://www.kauffman.org/microsites/kauffman-index/rankings/state
6) K-12 $/pupil: U.S. Census Bureau: https://www.census.gov/govs/school/
7) Enrollment in kindergarten: Utah Foundation: “Lessons from Our Neighbor: Learning from
Colorado’s Educational Success,” 2015 http://www.utahfoundation.org/reports/lessons-from-
our-neighbor/
8) Enrollment in public preschool: National institute for Early Education Research, “The State of
Preschool 2015,” 2016 http://nieer.org/research/state-preschool-2015
9) NAEP Rankings: http://www.nationsreportcard.gov and
http://nces.ed.gov/nationsreportcard/statecomparisons/
10) Higher education state $/student: Center on Budget & Policy Priorities www.CBPP.org
11) Bachelor’s degree % 2013: Voices for Utah Children analysis of Census ACS microdata
12) Associates Degree % 2014: Lumina Foundation analysis of U.S. Census Bureau ACS microdata,
http://strongernation.luminafoundation.org/report/#nation
13) Status of Women rank: Institute for Women’s Policy Research: “The Status of Women in the
States 2015” www.IWPR.org or http://statusofwomendata.org/
14) Gender Wage Gap: Voices for Utah Children: “Utah’s Gender Opportunity: An examination of
the difference between the earnings of Utah men and women,” 2015
http://www.utahchildren.org/newsroom/press-releases/item/553-utah-s-gender-opportunity-
an-examination-of-the-difference-between-the-earnings-of-utah-men-and-women
15) Referral rates of black + Latino students to law enforcement: Center for Public Integrity analysis
of U.S. Dept. of Education Civil Rights Data
16) Income inequality: Census Bureau. 1979, 1989, 1999 data from
https://www.census.gov/hhes/www/income/data/historical/state/state4.html from 1970, 1980,
and 1990 Censuses of Population. 2014 data from
http://factfinder.census.gov/faces/tableservices/jsf/pages/productview.xhtml?pid=ACS_14_1YR
_B19083&prodType=table from 2014 ACS 1-year estimates
17) Social mobility: Chetty, Hendren, Kline, and Saez, “Where is the Land of Opportunity? The
Geography of Intergenerational Mobility in the United States,” Quarterly Journal of Economics
129(4): 1553-1623, June 2014, Table III: Intergenerational Mobility in the 50 Largest Commuting
Zones. Accessible at http://www.equality-of-opportunity.org/index.php/papers .
27
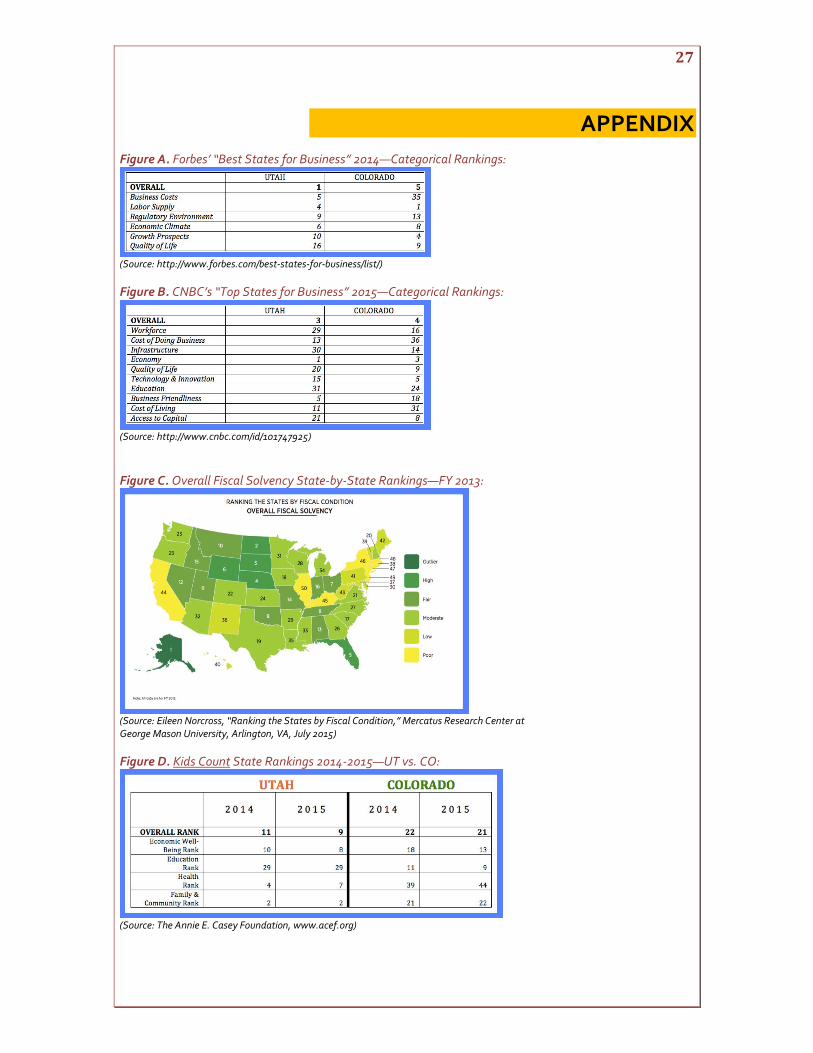
APPENDIX
Figure A. Forbes’ “Best States for Business” 2014—Categorical Rankings:
(Source: http://www.forbes.com/best-states-for-business/list/)
Figure B. CNBC’s “Top States for Business” 2015—Categorical Rankings:
(Source: http://www.cnbc.com/id/101747925)
Figure C. Overall Fiscal Solvency State-by-State Rankings—FY 2013:
(Source: Eileen Norcross, “Ranking the States by Fiscal Condition,” Mercatus Research Center at
George Mason University, Arlington, VA, July 2015)
Figure D. Kids Count State Rankings 2014-2015—UT vs. CO:
(Source: The Annie E. Casey Foundation, www.acef.org)

VOICES FOR UTAH CHILDREN | WORKING FAMILIES BENCHMARKING PROJECT 2016: UT VS. CO
28
Figure E. In 2014, the Utah System of Higher Education (USHE) refined its educational attainment goals
based on both national projections and state-specific workforce demands:
Refining Degree Allocation within the 2020 Goal of 66 Percent College Attainment
(Source: Memorandum to the State Board of Regents from the Commissioner of Higher Education, May 7, 2014)
Figure F. Undergraduate & graduate students in Colorado saw an overall increase in need-based aid
between 2003-04 and 2011-12, whereas Utah cut need-based aid by 30 percent or more43 during the same
period:
GAO analysis of Nat’l Assoc. of State Student Grant & Aid Programs (NASSGAP) data, 2003-2012
(Source: U.S. Government Accountability Office, http://www.gao.gov/assets/670/667557.pdf)
Figure G. List of Virginia Manufacturers Association (VMA) traditional skilled trades occupations:
VMA Skilled Trades Occupational Survey of Manufacturers
(Source: VMA Skilled Trades Gap Analysis Report, 2007)
43 See also Schott, supra note 7 (“According to data from 2011-2012, Utah provides only $50 in state [need-based] aid per full time
equivalent undergraduate student, far below the national average of $482.”).

29
Figure H. By criminalizing behavior better dealt with outside the legal system, zero tolerance policies and
school policing are helping to create a “school-to-prison pipeline,” both in Utah and around the country:
Utah’s School-to-Prison Pipeline: Facts & Statistics (2014)
(Source: Utah Public Policy Clinic, The Univ. of Utah S.J. Quinney College of Law, https://uofu.app.box.com/s/go9jxdhozxcnctf4w44e)
Figure I. Advanced Placement (AP) testing statistics show that inclusion in college prep courses is increasing
among historically underserved minority populations:44
Equity Gaps in Participation & Success Among Traditionally Underserved Students, 2003-2013—UT, CO, & U.S.
(Source: The College Board 10th Annual AP® Report to the Nation, 2014)
44 In this context, the phrase “historically underserved minority populations” refers to students who are Black/African American,
Hispanic/Latino, and American Indian/Alaska Native.