2016 urisa track: ring pattern of older adult population in urban areas by yu zhou
TRANSCRIPT

Ring-Pattern of Older Adult Population in Urban Areas
Yu Zhou (Department of Geography)
Jie Wu (Office of Institutional Research)
Bowling Green State University
Bowling Green, OH 43403
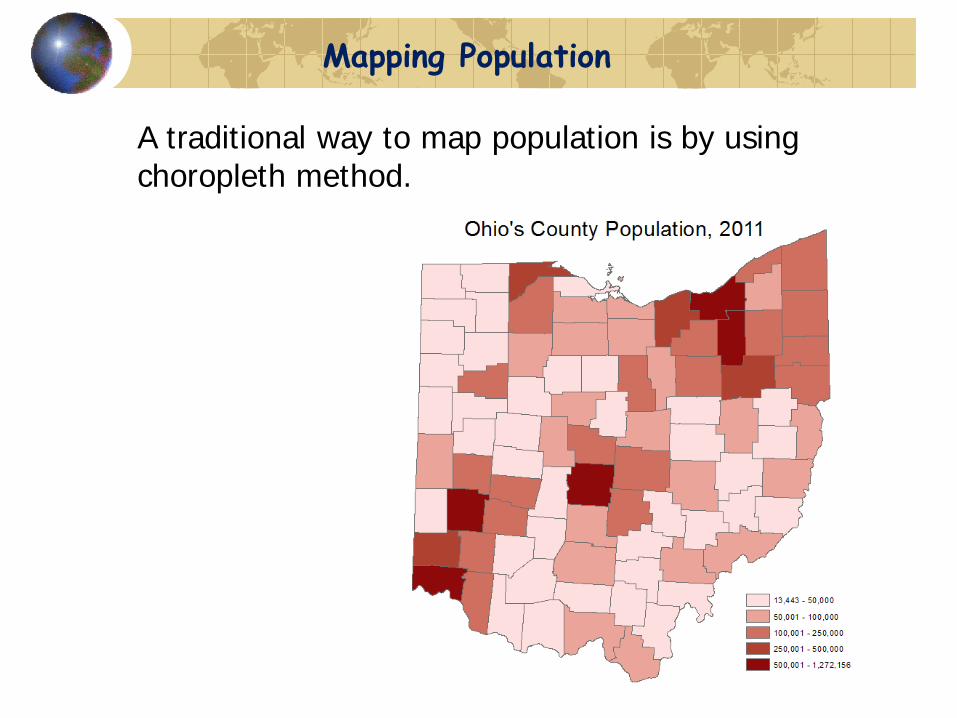
Mapping Population
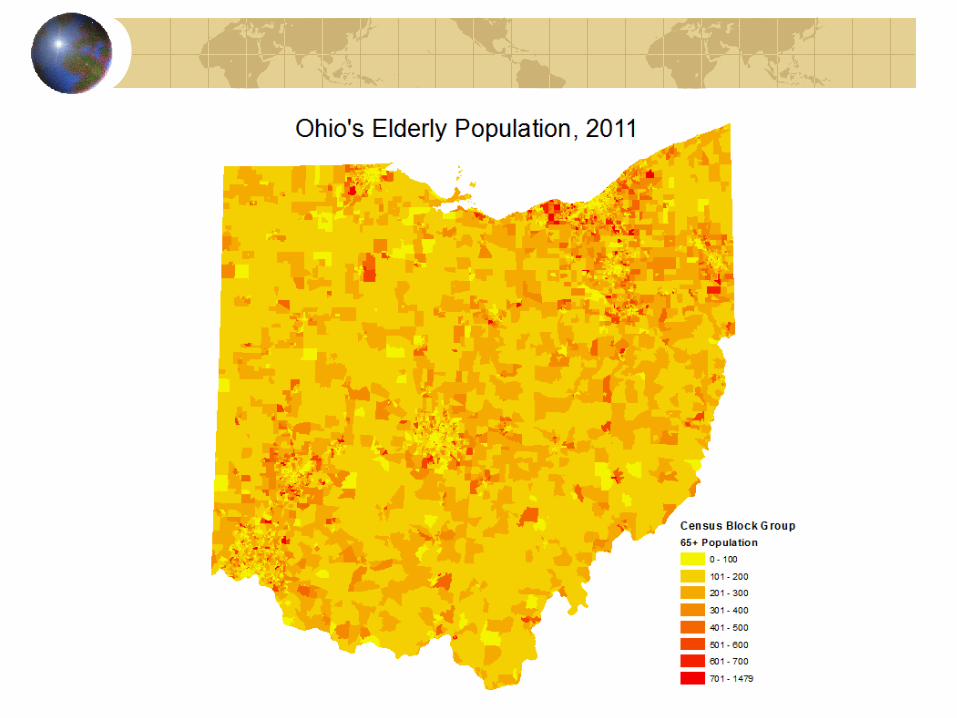
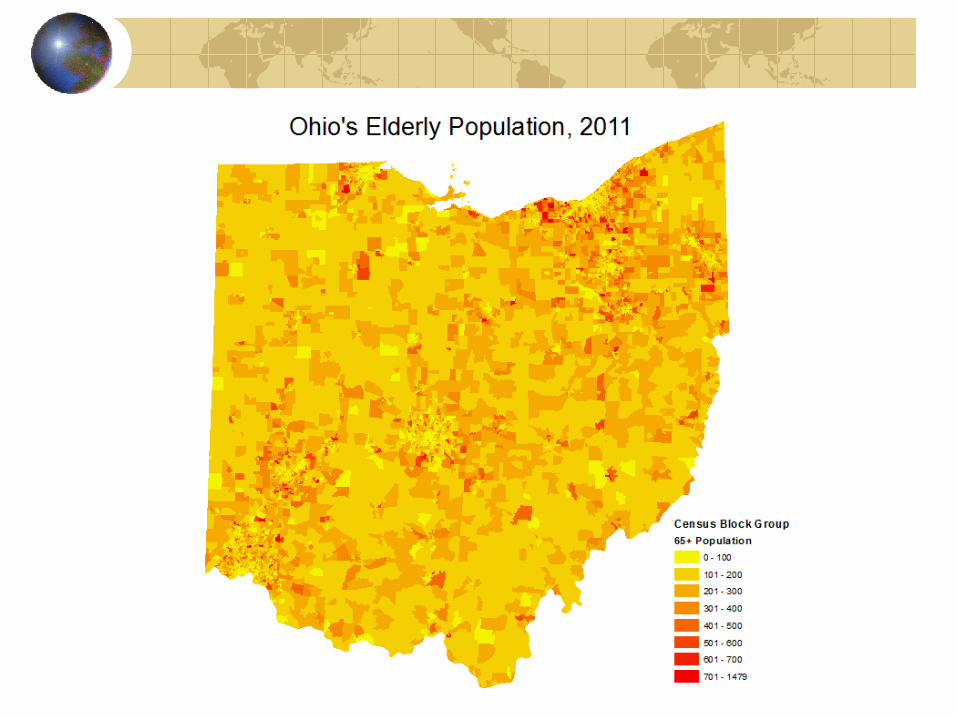
A traditional way to map population is by using choropleth method.
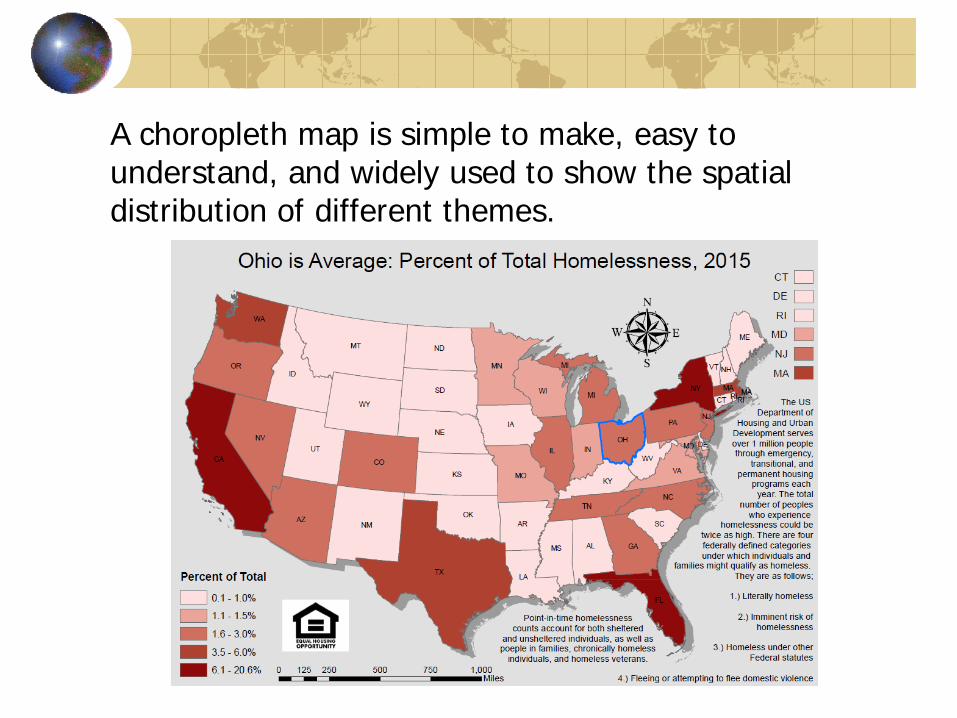
A choropleth map is simple to make, easy to understand, and widely used to show the spatial distribution of different themes.
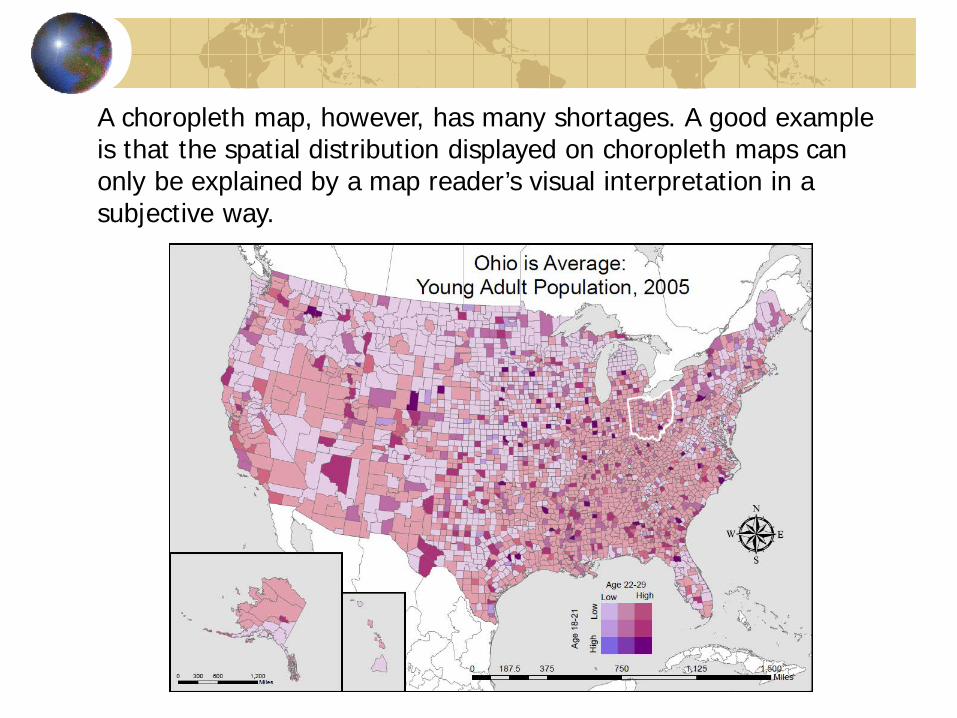
A choropleth map, however, has many shortages. A good example is that the spatial distribution displayed on choropleth maps can only be explained by a map reader’s visual interpretation in a subjective way.
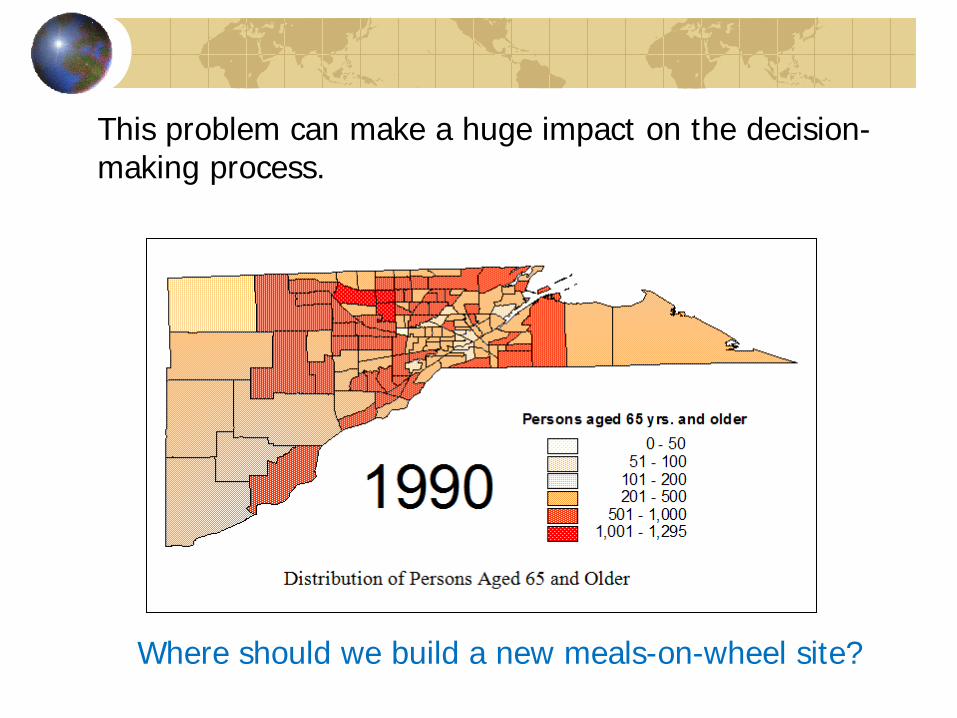
This problem can make a huge impact on the decision-making process.
Where should we build a new meals-on-wheel site?
Pattern Analysis
Pattern analysis is the study of the spatial arrangements of features in 2D space (Chang, 2015).
At the general level, a pattern analysis can reveal if a distribution pattern is random, dispersed, or clustered.
Pattern analysis can answer the question of “what is the probability that the distribution of these features is occurring due to random chance?”
Spatial statistics quantify the spatial pattern.

Pattern Analysis in ArcGIS
ArcGIS provides many pattern analysis tools. The toolset, however, is kind of confusing.
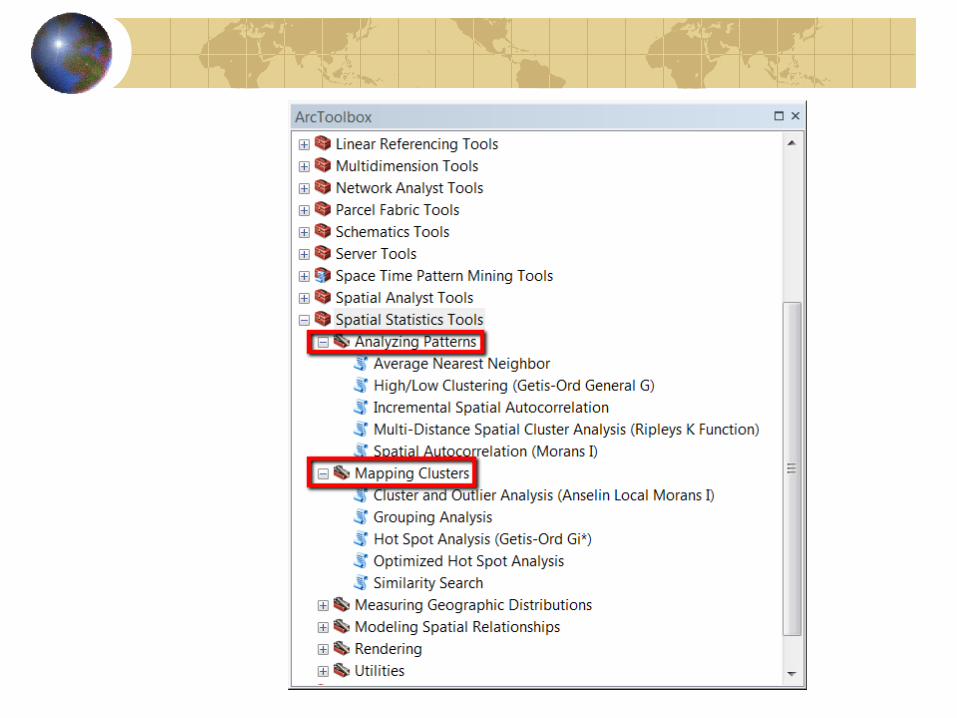
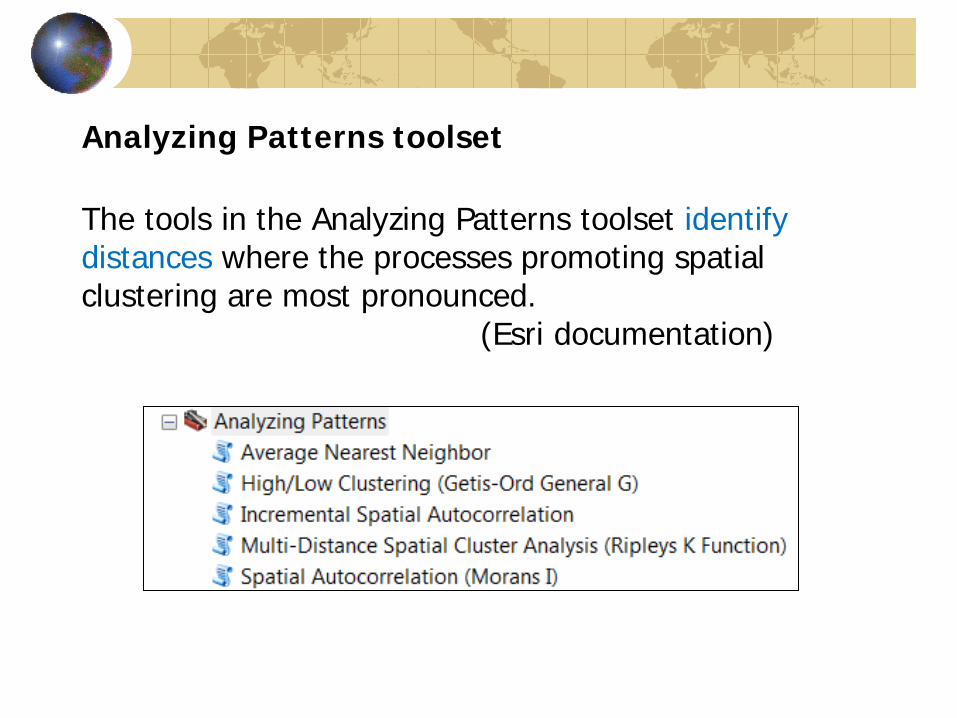
Analyzing Patterns toolset
The tools in the Analyzing Patterns toolset identify distances where the processes promoting spatial clustering are most pronounced. (Esri documentation)

Analyzing Patterns tools start with the null hypothesis that the features, or the values associated with the features, exhibit a spatially random pattern.
They then compute a p-value representing the probability that the null hypothesis is correct.

Analyzing Patterns tools provide statistics that quantify broad spatial patterns. These tools answer question such as, "Are the features in the dataset, or the values associated with the features in the dataset, spatially clustered?" Analyzing Patterns tools do not generate maps!
Mapping Clusters toolset
Unlike the Analyzing Patterns tools (which answer the question “is there spatial clustering?" with yes/no), the Mapping Clusters tools allow visualization of the cluster locations and extent (meaning, produce maps).

These tools answer the questions of: "Where are the clusters (hot spots/cold spots)?“ "Where are the spatial outliers?” "Which features are most alike?"
Hot Spot Analysis
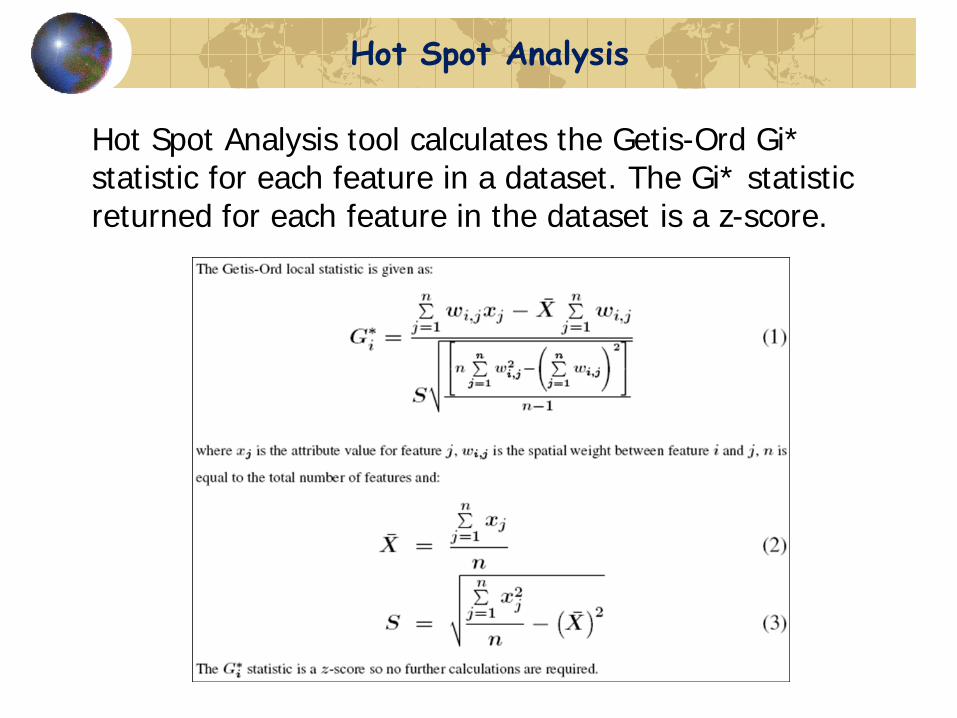
Hot Spot Analysis tool calculates the Getis-Ord Gi* statistic for each feature in a dataset. The Gi* statistic returned for each feature in the dataset is a z-score.
The calculated z-scores (with p-values) indicate where features with either high or low values cluster spatially. The tool works by looking at each feature within the context of neighboring features. The local sum for a feature and its neighbors is compared proportionally to the sum of all features. If the local sum is very different from the expected local sum, and that difference is too large to be the result of random, a statistically significant z-score results.
For statistically significant positive z-scores, the larger the z-score is, the more intense the clustering of high values (hence, the hot spots). For statistically significant negative z-scores, the smaller the z-score is, the more intense the clustering of low values (cold spots).

Hot Spot Analysis tool creates a new feature class with a z-score, p-value, and confidence level bin (Gi_Bin) for each feature in the input feature class. The new output feature class is automatically added to the table of contents with default symbology applied to the Gi_Bin field.
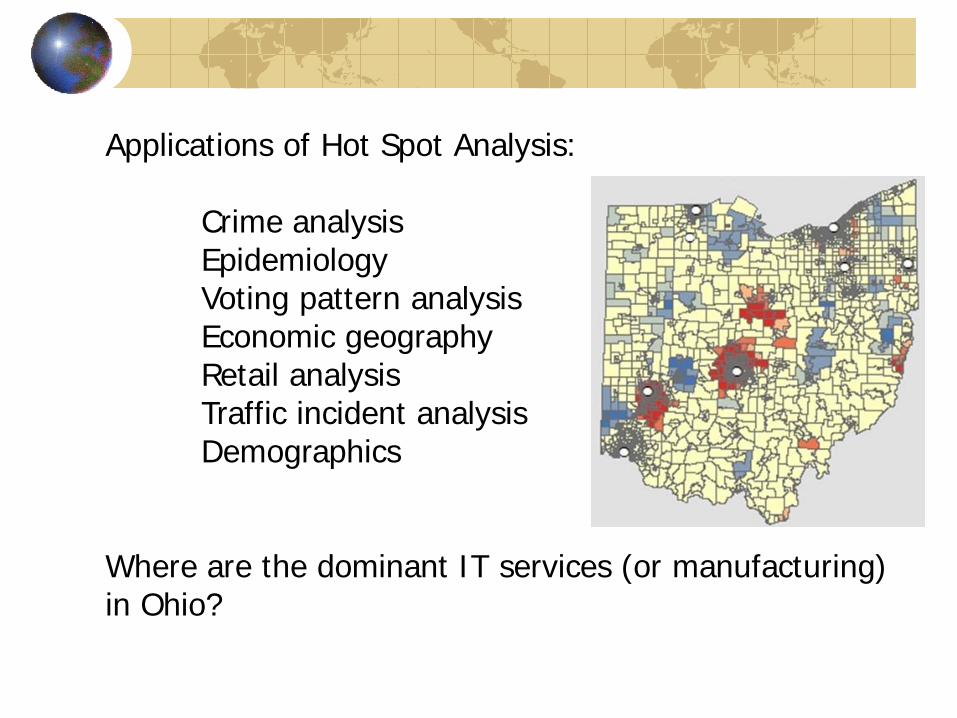
Applications of Hot Spot Analysis: Crime analysis Epidemiology Voting pattern analysis Economic geography Retail analysis Traffic incident analysis Demographics Where are the dominant IT services (or manufacturing) in Ohio?
Mapping of Ohio’s Elderly Population
Data: Esri Community Dataset Updated 2001 Demographics
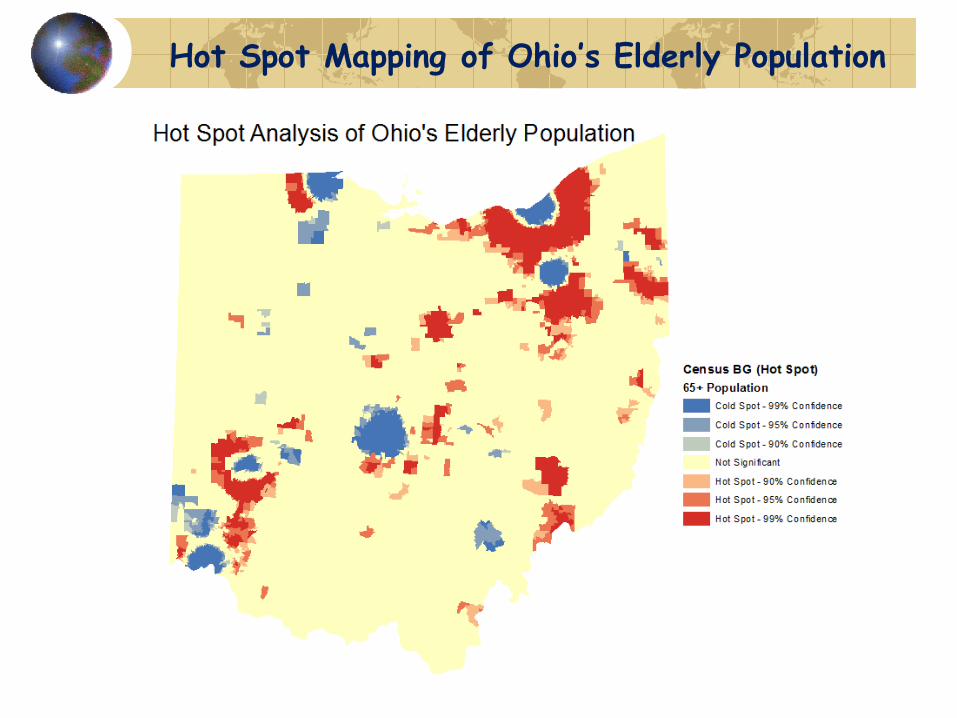
Hot Spot Mapping of Ohio’s Elderly Population
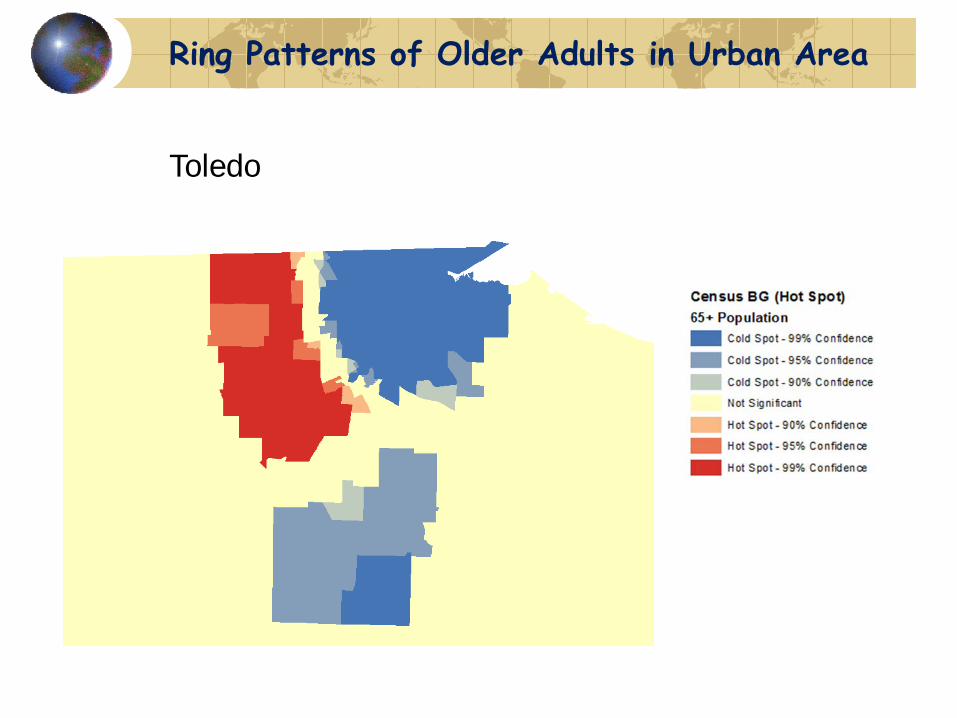
Toledo
Ring Patterns of Older Adults in Urban Area
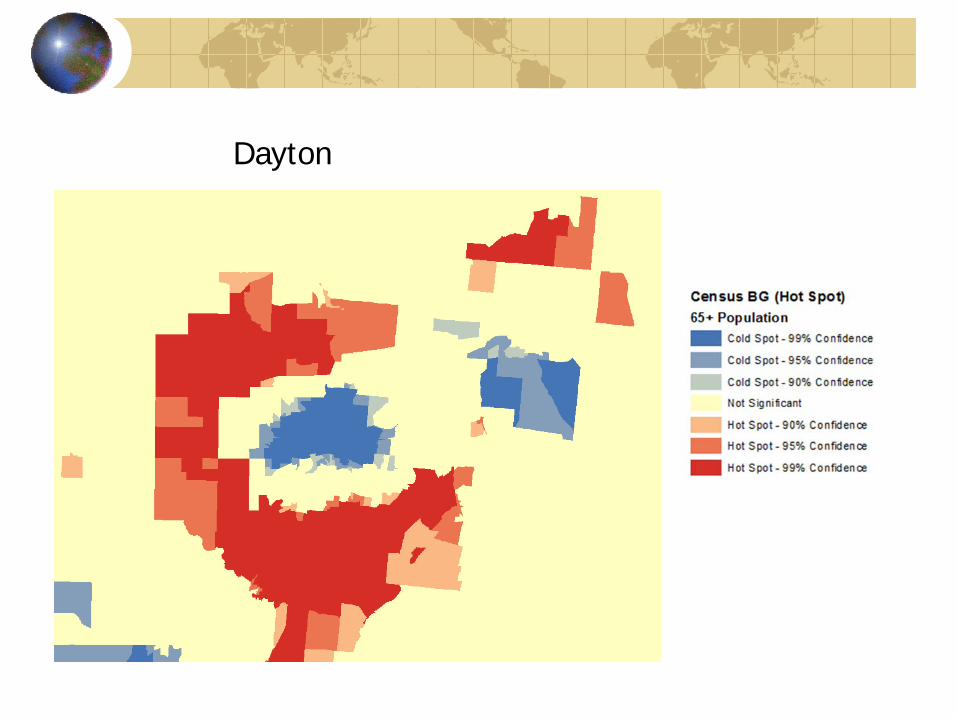
Dayton
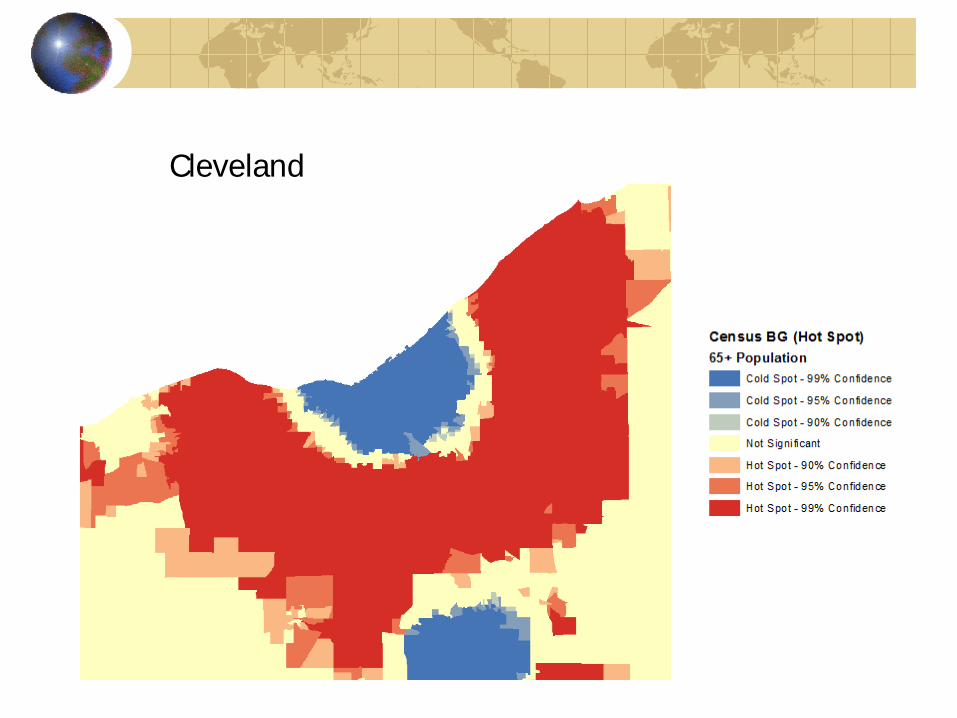
Cleveland
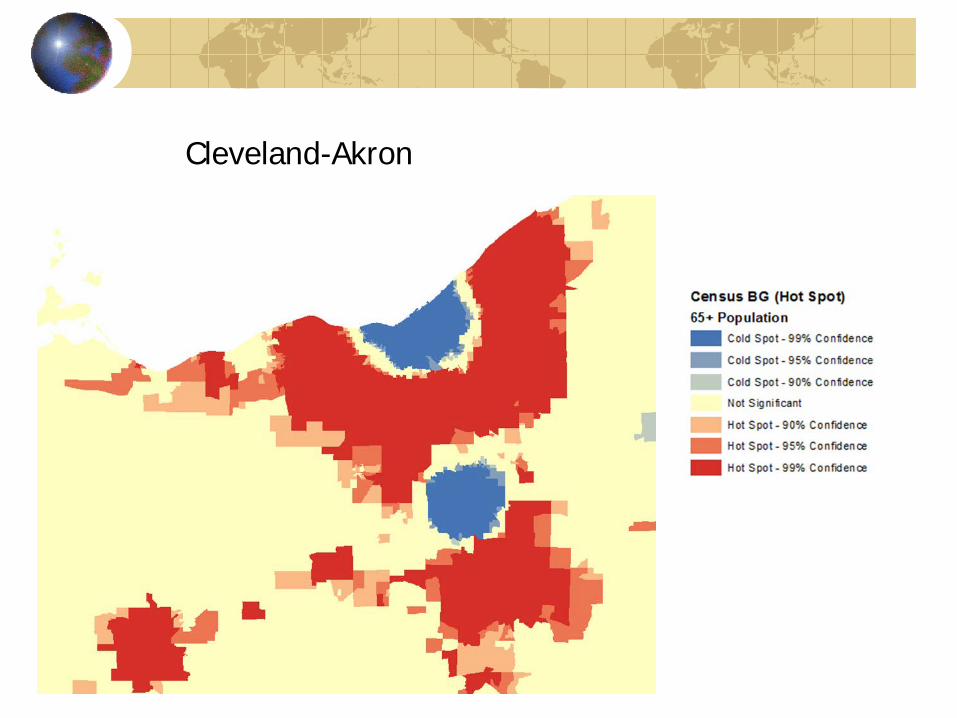
Cleveland-Akron

Cincinnati

Columbus

Conclusion
A choropleth population map displays visual spatial pattern, which is subjective.
Hot spot population map reveals spatial pattern based on spatial statistics.
Hot spot map of Ohio’s elderly population shows a ring-pattern for most urban areas.
This ring-pattern can be a good reference for the future decision making.

Thank You!