2016 social responsibility report of business conduct ... tesoro is committed to ethical business...
TRANSCRIPT

1
2016 Social Responsibility Report
SAFET Y
COMMUNIT Y
ENVIRONMENT
PEOPLE
CONTENTS
Message from the CEO . . . . . . . . . . . . . . . . . . . . . . . . . . . . . . . . . . . . . . . . . . . . . . . . . . 1
Report Highlights . . . . . . . . . . . . . . . . . . . . . . . . . . . . . . . . . . . . . . . . . . . . . . . . . . . . . . 2
Continuous Improvement . . . . . . . . . . . . . . . . . . . . . . . . . . . . . . . . . . . . . . . . . . . . . . . . 3
Our Approach . . . . . . . . . . . . . . . . . . . . . . . . . . . . . . . . . . . . . . . . . . . . . . . . . . . . . . . .4-5
Safety . . . . . . . . . . . . . . . . . . . . . . . . . . . . . . . . . . . . . . . . . . . . . . . . . . . . . . . . . . . . . 6-7
Community . . . . . . . . . . . . . . . . . . . . . . . . . . . . . . . . . . . . . . . . . . . . . . . . . . . . . . . . . . 8
Environment . . . . . . . . . . . . . . . . . . . . . . . . . . . . . . . . . . . . . . . . . . . . . . . . . . . . . . . . 9-10
Environmental Performance . . . . . . . . . . . . . . . . . . . . . . . . . . . . . . . . . . . . . . . . . 11-12
People . . . . . . . . . . . . . . . . . . . . . . . . . . . . . . . . . . . . . . . . . . . . . . . . . . . . . . . . . . . . . 13
Our Performance . . . . . . . . . . . . . . . . . . . . . . . . . . . . . . . . . . . . . . . . . . . . . . . . . . . 14-17
About this Report . . . . . . . . . . . . . . . . . . . . . . . . . . . . . . . . . . . . . . . . . . . . . . . . . . . 18-19

1
Message f rom the CEO
In 2016, Tesoro experienced meaningful growth across our refining, marketing and logistics business, and we announced our intention to acquire Western Refining, a strategic acquisition that complements our business . As we work to capitalize on these exciting opportunities, we have remained committed to creating value not only for our shareholders, but also for the varied stakeholders we serve . Our Guiding Principles continue to be at the core of how we conduct business, operating with the highest levels of integrity and respect, and with a steadfast dedication to safety and the environment .
This Social Responsibility Report is an opportunity to reflect on the accomplishments of 2016:
Safety: For both personal and process safety, we once again surpassed our own targets in pursuit of our ultimate goal of reaching an incident-free workplace . We are continuing with the implementation and rollout of our Operations Excellence Management System, which helps enable the ongoing improvement of our safety processes .
Oil spill prevention and response: Over the past year, we conducted more than 78 emergency response drills and equipment deployments to practice, review and improve our emergency response capabilities as part of our ongoing commitment to environmental stewardship . We worked with federal, state, local and tribal stakeholders to share best practices and test emergency response technologies and incident management plans .
Air emissions: We’ve effectively reduced air emissions in our facilities by 17 percent since 2014, and we remain committed to continuing these efforts . Last year, we advanced operational efficiencies and installed new equipment, such as flare gas recovery units and ultra-low nitrogen oxide burners, as part of long-term investments that we expect will further reduce emissions .
The Company has also identified and is pursuing a number of significant projects that would benefit our communities and the environment . Proposed improvements include substantially reducing local emissions in the Los Angeles, California area, delivering lower carbon intensity crude oil to the West Coast, and voluntarily producing lower sulfur gasoline in Salt Lake City, Utah .
Our achievements from the past year serve as inspiration for our path ahead and our efforts to continue to set new, even more ambitious targets as our Company grows . Shared Value will remain a major influence on how we operate, and we will evaluate opportunities for growth by considering what’s best for our diverse stakeholders, including employees, communities, business partners and the environment .
We know that access to clean, affordable and reliable energy improves the quality of life, and we take great pride in responsibly working toward that goal every day .
Sincerely,
Greg J . Goff Chairman, President and Chief Executive Officer Tesoro Corporation

2
SAFETY
• Maintained personal safety performance, surpassing the Company’s continuous improvement target
• 22% reduction in process safety incidents, remaining in top quartile of industry
ENVIRONMENT
• 17% reduction in air emissions from our facilities since 2014
• 36% reduction in environmental incidents (see Environmental Continuous Improvement chart below for further detail)
• An overall 5% decrease in refinery water consumption as a result of efforts at our Los Angeles Refinery
• A decrease of 33% in nonhazardous waste and of 43% in hazardous waste compared to 2014
COMMUNITY
• Invested $12 .3 million in community organizations and local schools
• 17,000 hours and $1 .4 million in employee contributions to community organizations and local schools
PEOPLE
• 8% increase in minority employees in an executive or senior officer role
• 30% of total supply spending with diverse and small businesses*
• 10% increase in the number of employees participating in our educational assistance program
*Does not include feedstock or marine charters
2016 Social Responsibil i t y Repor t
In 2016, we made progress on our commitments to our people and communities, with our drive to create a safe, incident-free workplace, and to continually improve our environmental performance .
An increase or decrease indicated in the summary bullets above, unless otherwise noted, is a comparison of our 2016 performance to our 2015 performance.

3
PERSONAL SAFETY Actual Target
OSHA RECORDABLE INCIDENT RATE
2014 2015 2016 2017 Target
.70
.60
.50
.40
.30
.20
.10
0
PROCESS SAFETY Actual Target
2014 2015 2016 2017 Target
.20
.18
.16
.14
.12
.10
.08
.06
.04
.02
0
COMBINED API TIER 1 AND 2 INCIDENT RATE
ENVIRONMENTAL
2014 20152 2016 2017 Target
ENVIRONMENTAL INCIDENTS1
30
25
20
15
10
5
0
1 Tesoro determines the significance of environmental incidents by measuring the level of environmental or community impact. Environmental incidents included in this annual target include those that are determined to be of the highest significance. Examples may include, a release that: is of a reportable quantity; results in activation of a community warning system; or results in harmful impact to wildlife or habitat.
2 In 2015, Tesoro adjusted its Environmental Incident targets to reflect updated parameters for how events are measured. The 2017 target represents a 15 percent improvement over the adjusted three-year average.
Actual Target
1 Tesoro determines the significance of environmental incidents by measuring the level of environmental or community impact. Environmental incidents included in this annual target include those that are determined to be of the highest significance. Examples may include, a release that: is of a reportable quantity; results in activation of a community warning system; or results in harmful impact to wildlife or habitat.
2 In 2015, Tesoro adjusted its Environmental Incident targets to reflect updated parameters for how events are measured. The 2017 target represents a 15 percent improvement over the adjusted three-year average.
Continuous Improvement
As part of our business plan, we set ambitious targets to improve our safety and environmental performance . In 2016, we exceeded all our performance targets and set equally ambitious targets for 2017 .

4
Our Approach
At Tesoro, our Vision, Strategic Priorities and Guiding Principles inform the way we conduct business and act as a good corporate citizen and successful Company .
VISION
Every day create a safer and cleaner future as efficient providers of reliable transportation fuel solutions
STRATEGIC PRIORITIES
• Improving operational efficiency and effectiveness with a focus on:
• Safety and reliability
• Cost leadership
• Business improvements
• Driving optimization of our integrated value chain
• Exercising financial discipline
• Delivering value-driven growth
• Creating a high-performing culture
GUIDING PRINCIPLES
• Always abiding by our Core Values:
• Safety and Environment
• Respect
• Integrity
• Attracting, developing and retaining Exceptional People
• Aligning with a Shared Purpose
• Fostering Powerful Collaboration
• Focusing on Superior Execution
GOVERNANCE
We hold ourselves to the highest standards of business conduct . We foster accountability in all areas of the Company, especially at the board and executive levels, and have established processes to uphold ethical behavior by our employees .
Tesoro Corporation’s Board of Directors represents the Company’s shareholders and has the ultimate oversight responsibility for the Company . At 2016 year end, the Board comprised 10 independent directors and our CEO .
The Board of Directors oversees four standing committees that consist of independent directors and adhere to written charters outlining the purpose and principal responsibilities for each committee . For detailed information about each committee, please visit www .tsocorp .com/investors .

5
HUMAN RIGHTS
We respect human rights throughout our operations, supply chain and engagement with communities . As such, we provide human rights training for all our employees and a supplemental training for those with direct supply chain responsibilities . We also ask employees to report any violations in their work or with suppliers through an annual compliance certification and other internal reporting channels . There were no reported grievances, nor were we subject to any human rights reviews last year .
Suppliers are held to the same human rights standards as our workforce . We require verification that suppliers follow all child labor, forced labor and human trafficking laws, and we reserve the right to conduct compliance audits .
Nondiscrimination is an important element of human rights, and we have a specific policy to guide us . This policy extends to equal treatment of union-represented and non-union-represented employees, and we work to make sure they receive the same training, safety, and health and wellness programs . We also support employee inclusion teams that focus on women, veteran, LGBTQ, multicultural and multigenerational issues to promote diversity, foster inclusion, and help prevent discrimination and bias .
CODE OF BUSINESS CONDUCT
Our Code of Business Conduct provides clear guidelines for responsible and ethical conduct expected of everyone who represents Tesoro . Each year, all employees are required to complete Business Conduct training . Our CEO and senior officers are held to additional standards relevant to their duties and commitments to the Company . We also expect certain of our suppliers, contractors and business partners to be familiar with our Code of Business Conduct and to require similar compliance guidelines within their own organizations .
Employees are empowered to report possible Code of Business Conduct violations and seek guidance through multiple channels, including an anonymous third-party helpline . We believe strongly in protecting individuals who raise concerns and will protect them from retaliation .
ANTI -CORRUPTION
Tesoro is committed to ethical business conduct and acting in compliance with all applicable U .S . and foreign anti-bribery and anti-corruption laws, including the Foreign Corrupt Practices Act .
Through our anti-corruption program, we adhere to strict policies and procedures regarding third-party due diligence, gifts, entertainment, travel, charitable contributions and record keeping . Employees – as well as certain contractors, agents and others who work on our behalf – are held to the standards and behaviors detailed in the program . Employees who interact with foreign government officials on our behalf are required to complete our anti-corruption training .
ADVOCACY AND PUBLIC POLICY
Tesoro operates in a highly regulated and often politicized environment . We believe it is our responsibility as an industry leader to advocate for sound energy policies and actively engage in the political process . For more about how we do this, please visit www .tsocorp .com/advocacy .
SHARED VALUE
At Tesoro, we aim to conduct business in a way that creates value for our communities, our partners and our Company . This is called Shared Value, and it enables us to build strong stakeholder relationships, identify and address risks and opportunities, reduce costs, innovate, and earn our license to operate and grow .
Our Shared Value strategy focuses on five key stakeholder groups: employees, customers and partners, communities, the environment, and government, and is supported by a comprehensive governance structure that ensures an appropriate level of oversight, direction and accountability .

6
Safety
The safety of our employees, our contractors and the communities where we operate is of the highest priority for Tesoro . By cultivating a culture that holds safety as a Core Value, we aim to achieve an incident-free workplace . Our efforts are focused on providing training and tools that address safety and compliance; collaborating with industry experts to develop best practices; and identifying, evaluating and continually learning from the few accidents that do occur .
EHS&S MANAGEMENT
Our Environmental, Health, Safety and Security (EHS&S) policy establishes standards, responsibilities and metrics for operating in a way that reduces risks, protects the environment, and promotes health and safety . At the center of our EHS&S management is the Operations Excellence Management System (OEMS) – a comprehensive and consistent management approach focused on safe, compliant, reliable and efficient operations .
As we’ve deployed OEMS across our business, we have worked to establish a baseline for performance against which we can continually improve . In 2016, we reached a baseline across 81 percent of our company, with the remainder to be completed in 2018 . From here, we can direct additional focus toward improving broader systems that present an inherent risk for our business, in addition to equipment and task-specific actions .
This past year we also launched Destination Zero, a program to engage and inspire employees around Tesoro’s mission to achieve an incident-free workplace . We believe that creating an incident-free workplace is possible for ever-increasing periods of time and that high-level performance is a never-ending journey requiring a daily commitment from everyone .
In 2016, the Tesoro Tanker Fleet in Colton, California completed its 10th consecutive year and nearly 8 million miles without a single Preventable On-Road Accident .* We’re also proud to share that Tesoro’s Anacortes Refinery received the American Fuel & Petrochemical Manufacturers Association Elite Gold Safety Award, which recognized the top 1 percent of facilities in the U .S . for their 2016 safety performance .
*The fleet defines an accident as any preventable or at-fault on-road incident involving an impact with a Company vehicle where damage can be assessed at greater than $0.01 or where injury occurs.
PERSONAL SAFETY
Everyone who works with us or for us has an important role to play in maintaining Tesoro’s safety commitments . We set rigorous safety standards that comply with and often exceed federal, state and local regulations . We use these standards to measure and audit ourselves, train our employees and contractors, and empower everyone to be part of the responsibility of a safe workplace . Our focus over the past year has been on standardizing best practices for authorizing work in operational areas and better engaging contractors in safety practices .
In 2016, we maintained a combined OSHA recordable incident rate of 0 .27 incidents per 100 full-time workers . Our performance in 2016 was consistent with our commendable 2015 personal safety record and exceeded our 2016 target of 0 .33 . We remain focused on making incremental improvement toward our ultimate goal of zero incidents .

7
PROCESS SAFETY
In assuring process safety and asset integrity, we focus on reducing the risk of incidents by using industry-recognized methodologies and safety practices throughout our operations . We use the American Petroleum Institute’s (API’s) guidelines to classify incidents and, through API, voluntarily share lessons learned with the industry . Our management systems are designed to address the types of incidents inherent to our industry, and we also address a broad range of potential risk areas through our safety processes .
This past year we focused on updating our mechanical integrity programs, hosting process safety training for hourly union workers and conducting a process safety culture survey, the results of which will help us continue to improve in the years to come . Additionally, three of our refineries — Salt Lake City, Martinez and Dickinson — along with our Rockies business unit, which comprises five natural gas processing plants, achieved zero API Tier 1 or Tier 2 incidents .
We exceeded our process safety performance target for 2016, achieving an API Tier 1 and 2 event rate per 100 full time workers of 0 .07, which was a 22 percent reduction in process safety incidents from 2015 .
TRANSPORTATION SAFETY
To safely operate our transportation facilities and assets – such as rail, trucks and pipelines – we rely on industry best practices, internal policies, and persistent evaluation and improvement . Tesoro has proactively led the industry in the safe shipment of crude oil via rail .
Last year we continued to modernize our tank car fleet by adding 525 DOT120J200 tank cars – a safer tank car model that exceeds federal regulations – as well as phasing out 500 older cars and retrofitting another 250 cars . We also updated internal governance guidelines to improve consistency in how the Company approaches rail operations and safety . This has been particularly important with the growth in our transportation business, and we will remain committed to safety as we grow .
As a result of these efforts, 2016 marked four years without a reportable spill at our Anacortes Crude by Rail Offloading Facility, during which time we moved 70 million barrels of crude oil using more than 1,000 trains .
7

8
Communit y
We strive to be a valued member of the communities where we live and work . Our community investments harness employee passions and align with our business goals and objectives to create Shared Value for us and our communities . We listen to and collaborate with our neighbors, local stakeholders and nonprofit organizations to help create cleaner, safer and well-educated communities .
COMMUNITY INVESTMENTS PROGRAMS
We focus our community investments in the areas of STEM (science, technology, engineering and math) education, public safety and environmental conservation . Due to growth in the Company, we were able to increase our community giving by more than 50 percent last year . Here are some of our notable community programs from 2016:
• The Tesoro STEM Academies is a three-year, $3 .24 million after-school initiative focused on fostering STEM knowledge and proficiency, and increasing awareness of and interest in post-secondary STEM opportunities among middle school students . Nearly 1,000 students participated in hands-on STEM activities and field trips and received high-quality academic support last year .
• With a $300,000 grant, Tesoro Foundation expanded the Vehicle Repair Assistance Program (VRAP) in Salt Lake County, Utah, to 400 additional residents . VRAP helps low-income families afford to fix older vehicles so they pass environmental emissions inspections . This funding will repair approximately 450 vehicles over the next three years – equivalent to removing 5,000 cars from Utah’s roads .
• The North Dakota Safety Council broke ground on a safety training campus in Bismarck, North Dakota, which will be completed in 2017 . Tesoro is the largest contributor to the project, granting $750,000 that will be used to construct, equip and staff the Tesoro Safety Training Center, a 5,000-sq . ft . state-of-the-art facility . At the center, students from across the region will receive hands-on, real-life safety training applicable to their industries .
EMPLOYEE GIVING
Employee participation in community giving has significant impact . We supported our employees’ efforts with an updated online giving portal, a fall giving campaign and expanded coordination of volunteer opportunities .
Approximately 1,600 employees took advantage of Tesoro’s workplace giving and volunteerism programs in 2016, totaling 17,000 hours of employee time and supporting nearly 1,500 nonprofits, schools, and colleges and universities . Employees contributed $1 .4 million to community organizations and local schools last year . Through our Matching Gift Program, the Tesoro Foundation contributed an additional $1 .5 million .
8

9
Environment
At Tesoro, we are committed to being stewards of the environment . We strive to operate in a way that limits our environmental impact on our communities and their surrounding ecosystems . We work to continually improve our procedures, programs, tools and systems to mitigate risks and advance our environmental performance . We also engage stakeholders to garner feedback and hold ourselves to a high standard as a responsible corporate citizen .
As environmental metrics for Tesoro Logistics do not significantly change our overall performance indicators, this report does not include metrics for standalone Logistics assets, except regarding environmental spills and incidents .
AIR EMISSIONS
To reduce our environmental impact, we carefully manage air emissions from our operations – including nitrogen oxides, sulfur dioxide, carbon monoxide, carbon dioxide, volatile organic compounds and particulate matter . We monitor, track and report emissions data on a regular basis in accordance with federal and state laws and regulations, which allows us to take specific actions to improve air quality and mitigate our impact on the environment .
In 2016, we implemented operational efficiencies and installed new equipment, such as flare minimization, flare gas recovery, ultra-low nitrogen oxide burners, and sulfuric acid plant improvements, as part of long-term investments that we expect will further reduce emissions .
GREENHOUSE GAS EMISSIONS
We recognize that climate change is an important global issue of interest to many key stakeholders, and we work to proactively reduce both direct and indirect greenhouse gas emissions throughout our operations . We manage our GHG emissions by focusing on energy and process efficiencies, reducing flare activity where safely possible, monitoring for steam leaks and repairing them promptly, and minimizing energy loss through equipment insulation . We also closely review all new projects and evaluate potential impacts, including energy usage and associated emissions .
There are many factors that can influence GHG emissions, such as planned and unplanned maintenance throughout the year . In 2016, our GHG emissions increased slightly, due in large part to lower refinery utilization in the first half of the year, but remained within a normal range of fluctuation for our operations .
We work closely with several renewable energy companies to assist in the commercialization of technologies that produce less carbon-intensive fuels . In 2016, we acquired Virent, an innovative renewable fuels and chemicals company, as part of our broader renewable fuels strategy . We aim to foster the development of high-quality, lower-carbon renewable feedstocks and blendstocks that can either be co-processed in existing refineries or blended seamlessly with traditional fuels .
10
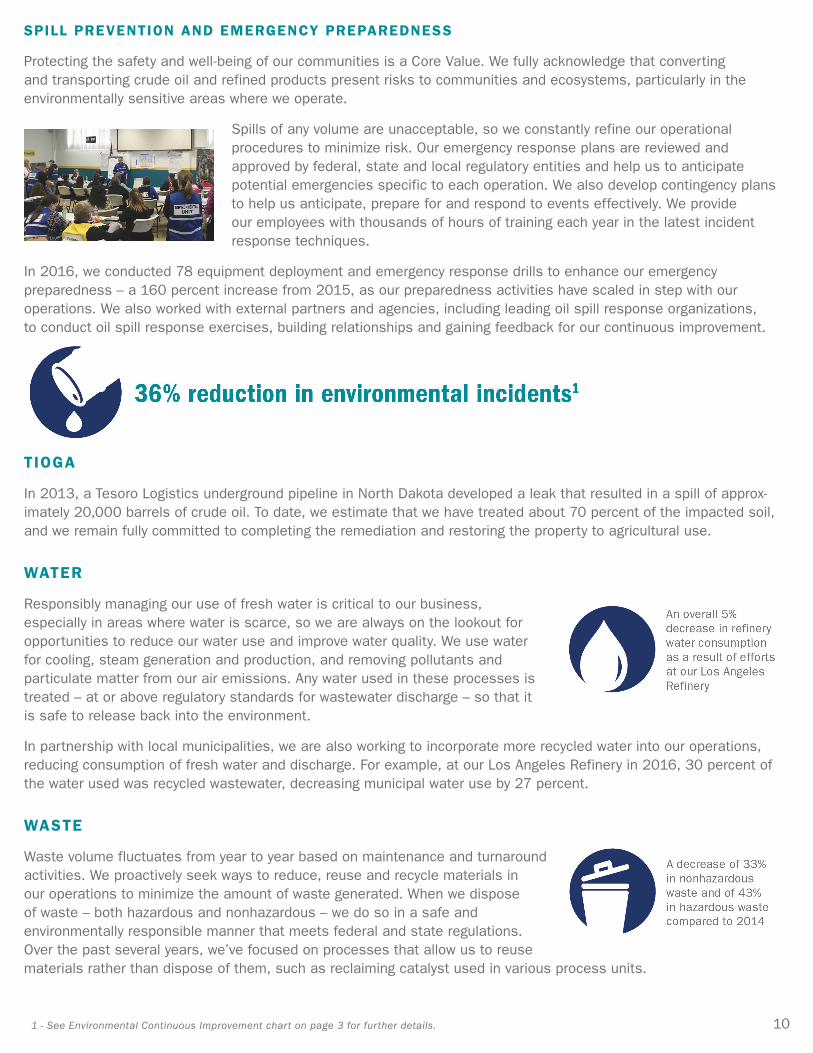
SPILL PREVENTION AND EMERGENCY PREPAREDNESS
Protecting the safety and well-being of our communities is a Core Value . We fully acknowledge that converting and transporting crude oil and refined products present risks to communities and ecosystems, particularly in the environmentally sensitive areas where we operate .
Spills of any volume are unacceptable, so we constantly refine our operational procedures to minimize risk . Our emergency response plans are reviewed and approved by federal, state and local regulatory entities and help us to anticipate potential emergencies specific to each operation . We also develop contingency plans to help us anticipate, prepare for and respond to events effectively . We provide our employees with thousands of hours of training each year in the latest incident response techniques .
In 2016, we conducted 78 equipment deployment and emergency response drills to enhance our emergency preparedness – a 160 percent increase from 2015, as our preparedness activities have scaled in step with our operations . We also worked with external partners and agencies, including leading oil spill response organizations, to conduct oil spill response exercises, building relationships and gaining feedback for our continuous improvement .
TIOGA
In 2013, a Tesoro Logistics underground pipeline in North Dakota developed a leak that resulted in a spill of approx-imately 20,000 barrels of crude oil . To date, we estimate that we have treated about 70 percent of the impacted soil, and we remain fully committed to completing the remediation and restoring the property to agricultural use .
WATER
Responsibly managing our use of fresh water is critical to our business, especially in areas where water is scarce, so we are always on the lookout for opportunities to reduce our water use and improve water quality . We use water for cooling, steam generation and production, and removing pollutants and particulate matter from our air emissions . Any water used in these processes is treated – at or above regulatory standards for wastewater discharge – so that it is safe to release back into the environment .
In partnership with local municipalities, we are also working to incorporate more recycled water into our operations, reducing consumption of fresh water and discharge . For example, at our Los Angeles Refinery in 2016, 30 percent of the water used was recycled wastewater, decreasing municipal water use by 27 percent .
WASTE
Waste volume fluctuates from year to year based on maintenance and turnaround activities . We proactively seek ways to reduce, reuse and recycle materials in our operations to minimize the amount of waste generated . When we dispose of waste – both hazardous and nonhazardous – we do so in a safe and environmentally responsible manner that meets federal and state regulations . Over the past several years, we’ve focused on processes that allow us to reuse materials rather than dispose of them, such as reclaiming catalyst used in various process units .
1 - See Environmental Continuous Improvement chart on page 3 for further details.

11
ENVIRONMENTAL PERFORMANCE
2014 2015 2016
MET
RIC
TONN
ES C
O2e
PER
THOU
SAND
BA
RREL
S OF
THR
OUGH
PUT
1.6
1.4
1.2
1.0
0.8
0.6
0.4
0.2
0
2014 2015 2016
MIL
LION
BTU
s PER
THO
USAN
D BA
RREL
S OF
THR
OUGH
PUT 600
500
400
300
200
100
0
2015
MET
RIC
TONN
ES C
O2e
PER
THOU
SAND
BA
RREL
S OF
THR
OUGH
PUT
40
35
30
25
20
15
10
5
02014 2016
20162014 2015
TONS
PER
MIL
LION
BAR
RELS
OF
THRO
UGHP
UT70
65
60
55
50
45
40
35
30
25
20
15
10
5
0
DIRECT GREENHOUSE GAS EMISSIONS
There are many factors that can influence GHG emissions, such as planned and unplanned maintenance throughout the year . In 2016, our GHG emissions increased by approximately 3 percent, due in large part to lower refinery utilization in the first half of the year, but remained within a normal range of fluctuation for our operations . 2014 2015 2016
EPA Subpart: Stationary Combustion 21.28 21.59 22.01 EPA Subpart: Hydrogen Production 4.82 4.59 4.99 EPA Subpart: Petroleum Refining 9.47 8.84 9.13
Total Direct Greenhouse Gas 35.57 35.02 36.13
INDIRECT GREENHOUSE GAS EMISSIONS
Total indirect GHG emissions from our refineries was unchanged at 1 .33 metric tonnes of CO2 per thousand barrels of throughput in 2015 and 2016 . 2014 2015 2016
Source: Purchased Electricity 1.37 1.33 1.33
Total Indirect Greenhouse Gas Emissions 1.37 1.33 1.33
ENERGY USE
Our energy use increased by 2 .5 percent from 2015 to 2016 . In 2016, our total energy use from all sources was 533 .46 MBTUs per one thousand barrels of throughput, compared to 520 .34 MBTUs in 2015 . 2014 2015 2016
Fuel Gas and other internal energy sources 342.08 342.13 353.81 Purchased Electricity 14.64 14.34 14.16 Purchased Natural Gas 174.96 163.87 165.48
Total Energy Use 531.68 520.34 533.46
AIR EMISSIONS
In 2016, we produced 50 .01 tons of emissions per million barrels of throughput, a 1 .6% decrease from 50 .81 in 2015 . In 2016, we imple- mented operational efficiencies and installed new equipment as part of long-term investments that we expect will further reduce emissions . 2014 2015 2016
Sulfur Dioxide (SO2) 8.59 6.89 6.24 Nitrogen Oxides (NOx) 17.83 17.86 18.56 Carbon Monoxide (CO) 18.91 11.30 10.23 Volatile Organic Compounds (VOC) 9.93 9.86 10.48 Particulate Matter (PM10) 4.79 4.89 4.50 Particulate Matter (PM2.5) 1.50 1.29 1.22
Total Air Emissions 60.05 50.81 50.01

12
ENVIRONMENTAL PERFORMANCE
WASTE
Waste volume fluctuates from year to year based on maintenance and turnaround activities . In 2016, our refineries produced a total of 66 .59 thousand tons of waste compared to 63 .48 in 2015, which represents a slight increase . 2014 2015 2016
Non-Hazardous Waste 92.26 59.07 62.11 Hazardous Waste 7.90 4.41 4.48
Total Waste 100.16 63.48 66.59
WASTEWATER
In 2016, our wastewater discharge increased slightly from 83 .40 cubic meters per one thousand barrels of throughput in 2015 to 86 .10 in 2016 . Wastewater volumes fluctuate year to year based on throughput and maintenance activities . 2014 2015 2016
Destination: Publicly Owned 48.97 42.85 46.27 Treatment Works (POTW)
Destination: Injection Well 2.32 2.55 2.14 Destination: Surface Water 38.12 38.00 37.68
Total Wastewater Discharge 89.41 83.40 86.10
WATER WITHDRAWAL
Water consumption at our refineries decreased slightly in 2016 from 154 .23 cubic meters per one thousand barrels of throughput in 2015 to 146 .44 in 2016 . Responsibly managing our use of fresh water is critical to our business, so we are always on the lookout for oppor- tunities to reduce our water use . 2014 2015 2016
Source: Groundwater 15.83 34.75 34.03 Source: Surface Water 9.22 9.45 9.54 Source: Municipal 130.04 110.03 102.87
Total Water Withdrawal 155.09 154.23 146.44
SPILL VOLUME
Our spill volume decreased in 2016, and we had no spills greater than one barrel to water . A total of 115 barrels of hydrocarbon were spilled in 2016, versus 185 barrels in 2015 . Spills of any volume are unaccept- able, so we constantly refine our operational procedures to minimize risk . 2014 2015 2016
Spills > 1 barrel to land 708.98 185.04 114.80 Spills > 1 barrel to water 0 0.5 0
Volume Hydrocarbon Spilled (barrels) 708.98 185.54 114.80
2014 2015 2016
CUBI
C M
ETER
S PE
R TH
OUSA
ND B
ARRE
LS O
F TH
ROUG
HPUT 90
80
70
60
50
40
30
20
10
0
2014 2015 2016
THOU
SAND
TON
S
105
90
75
60
45
30
15
0
2014 2015 2016
CUBI
C M
ETER
S PE
R TH
OUSA
ND
BARR
ELS
OF T
HROU
GHPU
T
160
140
120
100
80
60
40
20
0
2014 2015 2016
VOLU
ME
HYDR
OCAR
BON
SPIL
LED
1K
900
800
700
600
500
400
300
200
100
0

13
People
Our employees play a critical role in every aspect of our business . We believe they carry forward and enable our success, so we focus our efforts on establishing programs that emphasize well-being, development and growth . Providing employees with the right opportunities and support is key to fostering a collaborative, productive and safe work environment .
DIVERSITY, INCLUSION AND EQUAL OPPORTUNITY
We believe that a diversity of employees and business partners helps us to be a better business . We are committed to hiring employees and working with suppliers who reflect the communities in which we operate and the markets from which we recruit .
We focused on expanding our employee inclusion teams in 2016 to foster a broad range of experiences, backgrounds and views, which deepens our collective knowledge and our ability to innovate .
Though the overall number of female and minority employees has remained static over the past few years, we remain focused on increasing diversity and are committed to building an inclusive workforce . Through targeted policies, we are also focused on working with suppliers who have been classified and/or certified as small business enterprises and diversity businesses, including those owned and operated by people who are minorities, women, veterans, and/or physically challenged or disadvantaged .
EMPLOYEE DEVELOPMENT
We provide training, workshops and classes – as well as support for external higher education through our educational assistance program – to employees at all levels so that they can better hone their leadership, management and technical skills . In 2016, we recommitted to our focus on professional growth by empowering employees to be engaged in their own development and career path planning . And because stand-out performance deserves to be recognized, we’ve evolved our Recognition & Rewards program in the past year to encourage and support above-and-beyond efforts .
Nearly 700 employees participated in six Tesoro leadership development programs and our multi-year rotational development programs . Last year 154 employees participated in our educational assistance program, which provided nearly $600,000 in higher education assistance .
Scholarship Program
The Tesoro Scholarship Program helps dependents of our employees pursue higher education . Last year, the program awarded $200,000 in new scholarships, supporting 50 students . Because these scholarships are renewable for up to four years, Tesoro provided an additional $300,000 in scholarship renewals for 77 students .
Compensation, Health and Wellness
Competitive compensation and rewards packages are key to how Tesoro attracts, engages and retains top talent . We incentivize achievement in the workplace through a pay-for-performance structure that aligns employee and business goals .
Employee medical benefits include coverage for preventative measures and subsidies for many medical costs, empowering employees to proactively manage their overall health . We also provide wellness resources that focus on physical, emotional and financial topics to help employees lead healthier, more secure lives . We provide exercise, blood pressure and tobacco cessation programs, as well as a points-based incentive program for participating in wellness activities .

14
OUR PERFORMANCE
FINANCIAL UNIT OF MEASURE 2014 2015 2016 GRI INDICATOR
Revenues1 $ Millions 40,633 28,711 24,582 EC1
Operating Income $ Millions 1,632 2,827 1,481 EC1
Capital Expenditures $ Millions 779 1,006 948 EC1
Turnaround Expenditures $ Millions 196 290 334 EC1
1 – Includes excise taxes collected by our retail segment (excluding credits). For more information on our Financial performance, please refer to our annual and quarterly financial reports.
OPERATIONS UNIT OF MEASURE 2014 2015 2016 GRI
Refineries Number 6 6 7 G4-9
Crude Throughput Number of barrels per day 825,000 787,000 825,000 G4-9
Crude Oil Source – Domestic1 % 59 59 57 G4-9
Crude Oil Source – Foreign2 % 41 41 43 G4-9
1 – We purchase domestic crude oil primarily from North Dakota, Alaska, California, Utah and Wyoming. 2 – We purchase foreign crude oil produced in South America, the Middle East, Canada, western Africa and other locations. For more information on our Operations, please refer to our website and our annual and quarterly financial reports.
OUR PEOPLE UNIT OF MEASURE 2014 2015 2016 GRI
Total Number of Employees Number 5,642 6,000 6,308 G4-10
Minority Employees % of employees 33 34 34 G4-10
Executive or Senior Officers % of role 0 0 8 G4-10
First- or Mid-Level Managers % of role 18 19 20 G4-10
Supervisors % of role 30 31 31 G4-10
Female Employees % of employees 20 20 20 G4-10
Executive or Senior Officers % of role 17 14 15 G4-10
First- or Mid-Level Managers % of role 16 17 18 G4-10
Supervisors % of role 19 19 19 G4-10
Employees Represented % of employees 36 35 33 G4-11 by Independent Trade Unions
SAFETY UNIT OF MEASURE 2014 2015 2016 GRI
Combined Hours Worked Million Hours 23.6 24.60 23.30 LA6 (Employee and Contractor)
Combined OSHA Recordable Number of injuries 0.35 0.27 0.27 LA6 Incident Rate1 and illnesses per 100 full-time workers
OSHA Recordable Number of injuries 0.31 0.16 0.28 LA6 Incident Rate – Employee and illnesses per 100 full-time workers
OSHA Recordable Number of injuries 0.39 0.38 0.24 LA6 Incident Rate - Contractor and illnesses per 100 full-time workers

15
SAFETY UNIT OF MEASURE 2014 2015 2016 GRI
Combined Days Away From Number of injuries 0.08 0.05 0.08 LA6 Work (DAFW) Case Rate2 and illnesses per 100 full-time workers
DAFW Case Rate Number of injuries 0.09 0.06 0.09 LA6 - Employee and illnesses per 100 full-time workers
DAFW Case Rate Number of injuries 0.06 0.03 0.08 LA6 - Contractor and illnesses per 100 full-time workers
Combined Fatalities Number 0 0 0 LA6
Fatalities - Employee Number 0 0 0 LA6
Fatalities - Contractor Number 0 0 0 LA6
Combined Process Safety Number of events per 0.13 0.09 0.07 LA6/OG13 API Tier 1 and 2 Event Rate3 100 full-time workers
Process Safety - API Tier 1 Number of events per 0.03 0.045 0.010 LA6/OG13 100 full-time workers
Process Safety - API Tier 2 Number of events per 0.10 0.045 0.060 LA6/OG13 100 full-time workers
Joint Health and % of refinery locations 100 100 100 LA6 Safety Committees
1 – Occupational Safety and Health Administration (OSHA) is a division of the Department of Labor that sets and enforces occupational health and safety rules. OSHA Recordable Incident Rate represents the number of injuries or illnesses that met the criteria to become a recordable incident per 29 CFR 1904. 2 – Days Away From Work (DAFW) represents the number of OSHA recordable injuries or illnesses that resulted in time away from work. 3 – American Petroleum Institute’s RP 754 identifies the leading and lagging process safety indicators for driving performance improvement, and classifies Tier 1 and Tier 2 process safety events.
ENVIRONMENT 1 UNIT OF MEASURE 2014 2015 2016 GRI
Total Direct Metric tonnes CO2e 35.57 35.02 36.13 EN15 Greenhouse Gas Emissions2 per thousand barrels of throughput
EPA Subpart: Metric tonnes CO2e 21.28 21.59 22.01 EN15 Stationary Combustion per thousand barrels of throughput
EPA Subpart: Metric tonnes CO2e 4.82 4.59 4.99 EN15 Hydrogen Production per thousand barrels of throughput
EPA Subpart: Metric tonnes CO2e 9.47 8.84 9.13 EN15 Petroleum Refining per thousand barrels of throughput
Total Indirect Metric tonnes CO2e 1.37 1.33 1.33 EN16 Greenhouse Gas Emissions per thousand barrels of throughput
Source: Metric tonnes CO2e 1.37 1.33 1.33 EN16 Purchased Electricity per thousand barrels of throughput
OUR PERFORMANCE (CONT. )

16
ENVIRONMENT 1 UNIT OF MEASURE 2014 2015 2016 GRI
Total Energy Use Million BTUs per thousand 531.68 520.34 533.46 EN3 barrels of throughput
Source: Fuel Gas and Million BTUs per thousand 342.08 342.13 353.81 EN3 Other Internal Energy Sources barrels of throughput
Source: Million BTUs per thousand 14.64 14.34 14.16 EN3 Purchased Electricity barrels of throughput
Source: Million BTUs per thousand 174.96 163.87 165.48 EN3 Purchased Natural Gas barrels of throughput
Total Air Emissions Tons per million barrels 60.05 50.81 50.01 EN21 of throughput
Sulfur Dioxide (SO2) Tons per million barrels 8.59 6.89 6.24 EN21 of throughput
Nitrogen Oxides (NOx) Tons per million barrels 17.83 17.86 18.56 EN21 of throughput
Carbon Monoxide (CO) Tons per million barrels 18.91 11.30 10.23 EN21 of throughput
Volatile Organic Tons per million barrels 9.93 9.86 10.48 EN21 Compounds (VOC) of throughput
Particulate Matter (PM10) Tons per million barrels 4.79 4.89 4.50 EN21 of throughput
Particulate Matter (PM2.5)3 Tons per million barrels 1.50 1.29 1.22 EN2 of throughput
Total Water Withdrawal Cubic meters per thousand 155.09 154.23 146.44 EN8 barrels of throughput
Source: Groundwater Cubic meters per thousand 15.83 34.75 34.03 EN8 barrels of throughput
Source: Surface Water Cubic meters per thousand 9.22 9.45 9.54 EN8 barrels of throughput
Source: Municipal Cubic meters per thousand 130.04 110.03 102.87 EN8 barrels of throughput
Total Wastewater Discharge Cubic meters per thousand 89.41 83.40 86.10 EN22 barrels of throughput
Destination: Publicly Owned Cubic meters per thousand 48.97 42.85 46.27 EN22 Treatment Works (POTW) barrels of throughput
Destination: Cubic meters per thousand 2.32 2.55 2.14 EN22 Injection Well barrels of throughput
Destination: Cubic meters per thousand 38.12 38.00 37.68 EN22 Surface Water barrels of throughput
Nonhazardous Waste Thousand tons 92.26 59.07 62.11 EN23
Hazardous Waste Thousand tons 7.90 4.41 4.48 EN23
Volume Hydrocarbon to Water4 Barrels 0.00 0.05 0 EN24
Spills > 1 Barrel to Water Number 0 0 0 EN24
OUR PERFORMANCE (CONT. )
17
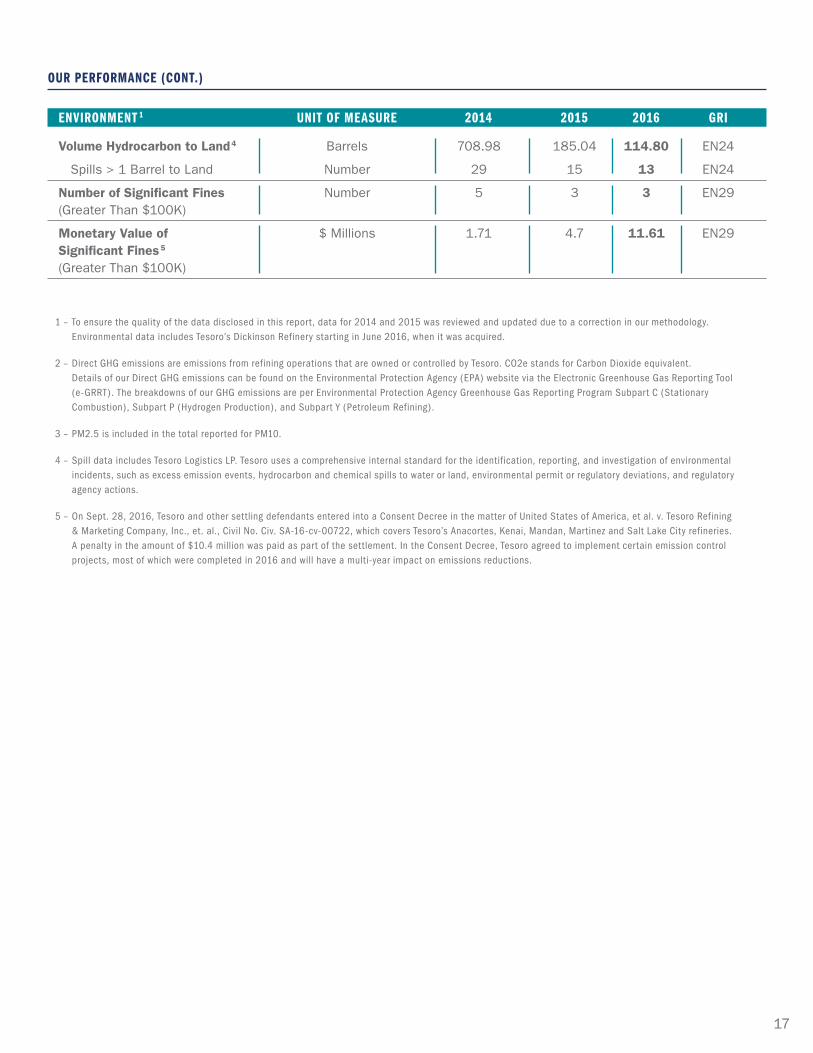
ENVIRONMENT 1 UNIT OF MEASURE 2014 2015 2016 GRI
Volume Hydrocarbon to Land4 Barrels 708.98 185.04 114.80 EN24
Spills > 1 Barrel to Land Number 29 15 13 EN24
Number of Significant Fines Number 5 3 3 EN29 (Greater Than $100K)
Monetary Value of $ Millions 1.71 4.7 11.61 EN29 Significant Fines5
(Greater Than $100K)
1 – To ensure the quality of the data disclosed in this report, data for 2014 and 2015 was reviewed and updated due to a correction in our methodology. Environmental data includes Tesoro’s Dickinson Refinery star ting in June 2016, when it was acquired.
2 – Direct GHG emissions are emissions from refining operations that are owned or controlled by Tesoro. CO2e stands for Carbon Dioxide equivalent. Details of our Direct GHG emissions can be found on the Environmental Protection Agency (EPA) website via the Electronic Greenhouse Gas Reporting Tool (e-GRRT). The breakdowns of our GHG emissions are per Environmental Protection Agency Greenhouse Gas Reporting Program Subpart C (Stationary Combustion), Subpart P (Hydrogen Production), and Subpart Y (Petroleum Refining).
3 – PM2.5 is included in the total reported for PM10.
4 – Spill data includes Tesoro Logistics LP. Tesoro uses a comprehensive internal standard for the identification, reporting, and investigation of environmental incidents, such as excess emission events, hydrocarbon and chemical spills to water or land, environmental permit or regulatory deviations, and regulatory agency actions.
5 – On Sept. 28, 2016, Tesoro and other settling defendants entered into a Consent Decree in the matter of United States of America, et al. v. Tesoro Refining & Marketing Company, Inc., et. al., Civil No. Civ. SA-16-cv-00722, which covers Tesoro’s Anacortes, Kenai, Mandan, Martinez and Salt Lake City refineries. A penalty in the amount of $10.4 million was paid as part of the settlement. In the Consent Decree, Tesoro agreed to implement certain emission control projects, most of which were completed in 2016 and will have a multi-year impact on emissions reductions.
OUR PERFORMANCE (CONT. )

18
About This Repor t
REPORT PROFILE
The information in this report is from the 2016 calendar year .
• We published our 2015 Social Responsibility Report in June 2016 .
• We will continue to report annually for each calendar year .
• The framework for defining the content of this report was determined using guidelines set by the Global Reporting Initiative (GRI) G4, Oil and Gas Sector Supplement .
• This year’s report is different in format from previous years, as it was produced for online viewing .
DEFINING REPORT CONTENT
• Tesoro conducted a materiality assessment in 2015 to identify the environmental and social issues that are most important to our stakeholders and to our continued success as a business .
• As our material issues had not substantively changed since this assessment, we used these same material issues to inform our report content for 2016 . To read more about the materiality and stakeholder engagement process in 2015, please read the 2015 Social Responsibility Report .
• Per Tesoro’s materiality assessment and stakeholder engagement conducted in 2015, the following have been identified as priority issues:
• High priority issues are safety and asset integrity, oil spill prevention and response, air emissions, and business ethics and transparency .
• Moderate priority issues are hazardous and nonhazardous waste, water usage, climate change, community impacts, social investment, the extent to which Tesoro is an attractive employer, supply chain, workforce development, shared benefits, biodiversity and ecosystems, diversity and inclusion, renewable energy and human rights .
FORWARD -LOOKING STATEMENTS
This 2016 Social Responsibility Report includes forward-looking statements within the meaning of the federal securities laws, including without limitation statements concerning: our operational, financial and growth strategies, including driving significant business improvements, achieving improvements in operations to mitigate risks and advance environmental performance, efforts to implement a comprehensive and consistent management approach focused on safe, compliant, reliable and efficient operations; creating significant shareholder value, creating Shared Value with our communities, partners and our Company, driving continuous improvement, and strategic projects and investments; our financial and operational outlook; our ability to execute on our strategic priorities and the expected timing and results thereof, including operational efficiency and effectiveness, safety improvements, environmental performance, value chain optimization, financial discipline, value-driven growth and high performing culture, as well as the potential impact of such execution; our financial position, liquidity and capital resources; and other aspects of future performance .
Although we believe the assumptions concerning future events are reasonable, a number of factors could cause results to differ materially from those projected . Our operations involve risks and uncertainties, many of which are outside of our control and could materially affect our results . For more information concerning factors that could affect these statements, see our annual report on Form 10-K, quarterly reports on Form 10-Q, and other SEC filings, available at http://www .tsocorp .com . We undertake no obligation to revise or update any forward-looking statements as a result of new information, future events or otherwise .

19
ENSURING REPORT QUALITY
• We are committed to providing a report that is transparent, understandable, consistent and reliable .
• We continue to build processes to improve the quality of our social, environmental and economic disclosure .
• This report has not been assured by an external assurance provider, and there are no plans to seek external assurance at this time .
DATA IN THIS REPORT
• Data included in this report is believed to be accurate at the time the report was published .
• Any updates to data reflected in this report will be identified in future reports .
• We report the previous three years of data for comparison purposes .
• Normalization of certain data, based on refinery throughput, is identified when used to assist in year-to-year comparison .
• We recognize any limitations to disclosed data in this report where applicable .
REPORT BOUNDARY
• The information in this report consists of all Tesoro entities, including Tesoro Logistics LP, for calendar year 2016, unless otherwise indicated .
• This report does not provide environment metrics for Tesoro Logistics assets, unless otherwise indicated .
REPORT AVAILABILITY AND CONTACT METHOD
• This report and past reports are available through our website: tsocorp .com/responsibility .
• Requests for further information or feedback can be sent to:
Social Responsibility Reporting, Corporate Affairs Department
19100 Ridgewood Parkway, San Antonio, Texas 78259
Email: socialresponsibility@tsocorp .com
GRI INDICATOR INDEX
Tesoro utilizes two sources as the primary framework for reporting its sustainability performance: 1) the Global Reporting Initiative’s (GRI) General Guidelines and Oil and Gas Sector Supplement (version 3 .1) and 2) “Oil and Gas Industry Guidance on Voluntary Sustainability Reporting” (2015), developed by the International Petroleum Industry Environmental Conservation Association (IPIECA), the International Oil and Gas Producers Association (OGP) and the American Petroleum Institute (API) . These guidelines are used as a basis for selection of specific disclosures intended to provide stakeholders with relevant information on topics of concern . For a full listing of GRI indicators, visit: www .tsocorp .com/socialresponsibilityreport