2016 school accountability report card · 2016-17 school accountability report card for charter...
TRANSCRIPT
2016-17 School Accountability Report Card for Charter Alternative Program (CAP) Page 1 of 12
Charter Alternative Program (CAP)
School Accountability Report Card
Reported Using Data from the 2016-17 School Year
Published During 2017-18
By February 1 of each year, every school in California is required by state law to publish a School Accountability Report Card (SARC). The SARC contains information about the condition and performance of each California public school. Under the Local Control Funding Formula (LCFF) all local educational agencies (LEAs) are required to prepare a Local Control and Accountability Plan (LCAP), which describes how they intend to meet annual school-specific goals for all pupils, with specific activities to address state and local priorities. Additionally, data reported in an LCAP is to be consistent with data reported in the SARC. • For more information about SARC requirements, see the California Department of Education (CDE) SARC Web page at
http://www.cde.ca.gov/ta/ac/sa/. • For more information about the LCFF or LCAP, see the CDE LCFF Web page at http://www.cde.ca.gov/fg/aa/lc/. • For additional information about the school, parents/guardians and community members should contact the school principal or
the district office. DataQuest DataQuest is an online data tool located on the CDE DataQuest Web page at http://dq.cde.ca.gov/dataquest/ that contains additional information about this school and comparisons of the school to the district and the county. Specifically, DataQuest is a dynamic system that provides reports for accountability (e.g., test data, enrollment, high school graduates, dropouts, course enrollments, staffing, and data regarding English learners). Internet Access Internet access is available at public libraries and other locations that are publicly accessible (e.g., the California State Library). Access to the Internet at libraries and public locations is generally provided on a first-come, first-served basis. Other use restrictions may include the hours of operation, the length of time that a workstation may be used (depending on availability), the types of software programs available on a workstation, and the ability to print documents.
About This School Contact Information (School Year 2017-18)
School Contact Information
School Name------- Charter Alternative Program (CAP)
Street------- 6767 Green Valley Road
City, State, Zip------- Placerville, CA 95667
Phone Number------- 530-295-2259
Principal------- David Publicover
E-mail Address------- [email protected]
Web Site------- http://charter.edcoe.org/
CDS Code 09100900123521
2016-17 School Accountability Report Card for Charter Alternative Program (CAP) Page 2 of 12
District Contact Information
District Name------- Charter Alternative Program (CAP)
Phone Number------- 530-622-7130
Superintendent-------
Ed Manansala, Ed.D.
E-mail Address------- [email protected]
Web Site------- www.edcoe.org
School Description and Mission Statement (School Year 2017-18)
El Dorado County is 10,000 square miles of vastly diverse and rugged geography, communities, and lifestyles just northeast of Sacramento. It is the heart of California’s “Gold Rush Country” and is intersected from west to east by scenic State Highway 50 and north to south by historic Highway 49 in the City of Placerville, the county seat. Amid this backdrop, the Charter Alternative Program serves students in grades K-8 who are seeking an alternative educational program. Our Charter develops programs to address unique educational needs within El Dorado County. Charter Home Study Academy K-8 (CHSA) provides kindergarten through eighth-grade students with the academic skills to meet California’s grade-level standards and the social development and strong foundation for life-long learning. We honor and support a family’s choice to educate their children in both a home and school environment. We are committed to collaborating with families to provide a nurturing, safe, and creative educational experience. Each student is valued as a unique learner. Through communication and partnership with families, our school community fosters the success of each child. Our Charter Alternative Program provides an outstanding home study program for students in grades K-8. The program was created as a public school option to provide resources and support for those families choosing to educate their children at home. Staff and parents work together collaboratively to ensure that each student’s academic needs are met. Families meet regularly with a credentialed teacher, whose responsibilities include providing resources and support, and assisting in assessing student academic progress. Each student’s academic progress is carefully reviewed on a regular basis, and an individualized academic plan is created and monitored by a highly qualified teacher. Charter Alternative Program was granted a six-year term accreditation by the Western Association of Schools and Colleges in June, 2009. The Charter Alternative Program follows the California State Content Standards in the core academic areas of language arts, math, science, and social studies, ensuring that students are prepared for 8th-grade graduation and a successful transition to high school. We are a forerunner in the educational application of technology-embedded curriculum design, work within our community to extend real and relevant learning environments, and develop staff training identifying safe and invitational educational environments. Charter Home Study Academy K-8 - Mission Statement 2017-20: Charter Home Study Academy K-8 supports and invests in families who choose to be active participants in their children’s education. Staff, students, and their families use a team approach to recognize, encourage, and develop individual potential as a limitless resource. We build foundational skills, empowering students to find solutions and adapt to the challenges of an ever-changing world. Together we educate the whole child in an inspiring and nurturing environment where students have an opportunity to flourish.
2016-17 School Accountability Report Card for Charter Alternative Program (CAP) Page 3 of 12
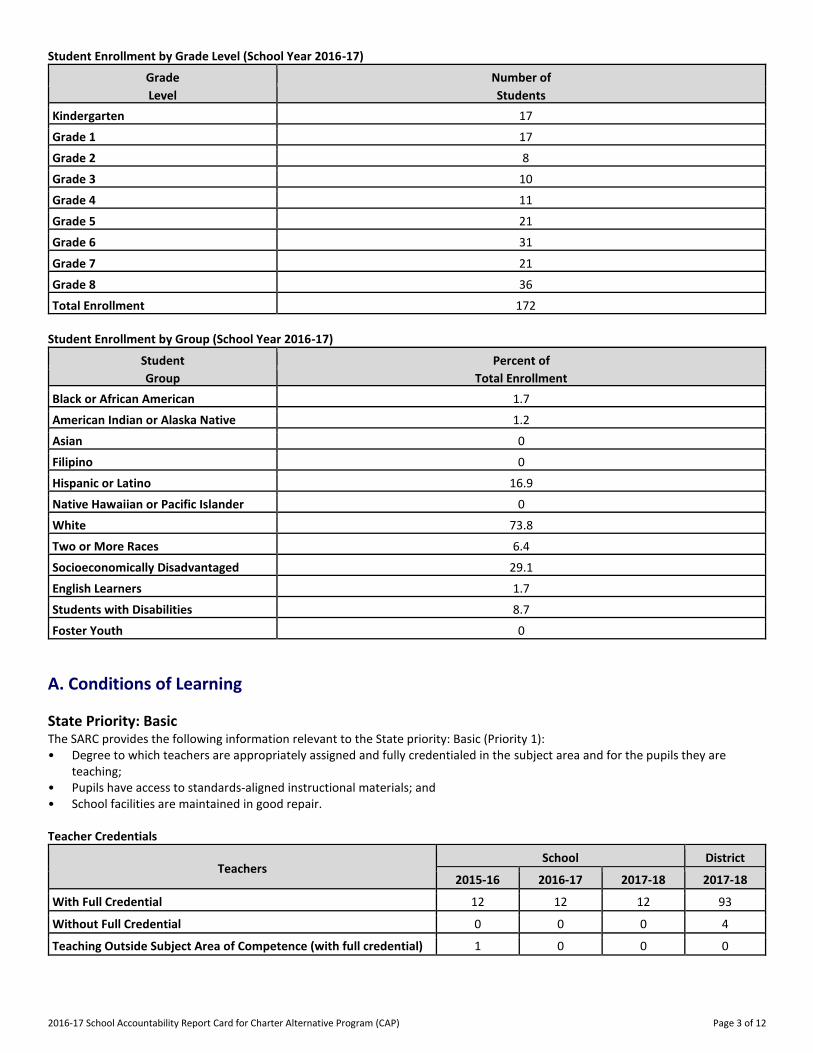
Student Enrollment by Grade Level (School Year 2016-17)
Grade Number of
Level Students
Kindergarten 17
Grade 1 17
Grade 2 8
Grade 3 10
Grade 4 11
Grade 5 21
Grade 6 31
Grade 7 21
Grade 8 36
Total Enrollment 172
Student Enrollment by Group (School Year 2016-17)
Student Percent of
Group Total Enrollment
Black or African American 1.7
American Indian or Alaska Native 1.2
Asian 0
Filipino 0
Hispanic or Latino 16.9
Native Hawaiian or Pacific Islander 0
White 73.8
Two or More Races 6.4
Socioeconomically Disadvantaged 29.1
English Learners 1.7
Students with Disabilities 8.7
Foster Youth 0
A. Conditions of Learning
State Priority: Basic The SARC provides the following information relevant to the State priority: Basic (Priority 1): • Degree to which teachers are appropriately assigned and fully credentialed in the subject area and for the pupils they are
teaching; • Pupils have access to standards-aligned instructional materials; and • School facilities are maintained in good repair. Teacher Credentials
Teachers School District
2015-16 2016-17 2017-18 2017-18
With Full Credential 12 12 12 93
Without Full Credential 0 0 0 4
Teaching Outside Subject Area of Competence (with full credential) 1 0 0 0
2016-17 School Accountability Report Card for Charter Alternative Program (CAP) Page 4 of 12
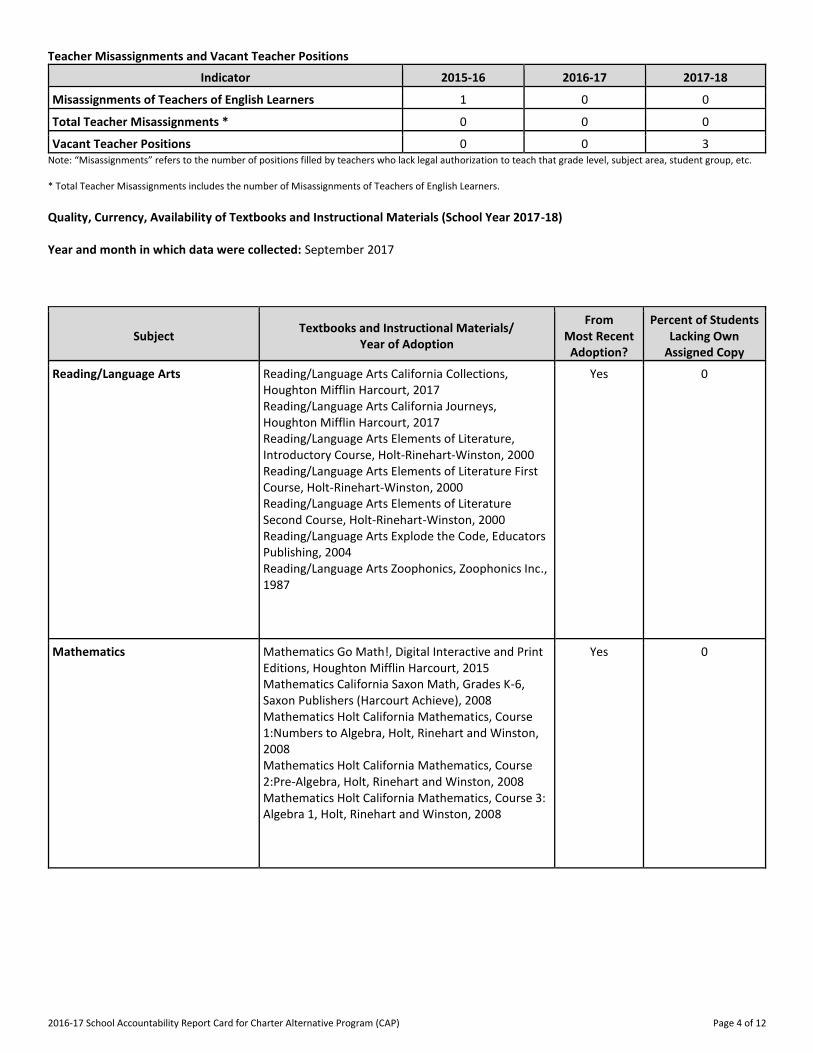
Teacher Misassignments and Vacant Teacher Positions
Indicator 2015-16 2016-17 2017-18
Misassignments of Teachers of English Learners 1 0 0
Total Teacher Misassignments * 0 0 0
Vacant Teacher Positions 0 0 3 Note: “Misassignments” refers to the number of positions filled by teachers who lack legal authorization to teach that grade level, subject area, student group, etc. * Total Teacher Misassignments includes the number of Misassignments of Teachers of English Learners. Quality, Currency, Availability of Textbooks and Instructional Materials (School Year 2017-18) Year and month in which data were collected: September 2017
Subject Textbooks and Instructional Materials/
Year of Adoption
From Most Recent
Adoption?
Percent of Students Lacking Own
Assigned Copy
Reading/Language Arts Reading/Language Arts California Collections, Houghton Mifflin Harcourt, 2017
Reading/Language Arts California Journeys, Houghton Mifflin Harcourt, 2017
Reading/Language Arts Elements of Literature, Introductory Course, Holt-Rinehart-Winston, 2000
Reading/Language Arts Elements of Literature First Course, Holt-Rinehart-Winston, 2000
Reading/Language Arts Elements of Literature Second Course, Holt-Rinehart-Winston, 2000
Reading/Language Arts Explode the Code, Educators Publishing, 2004
Reading/Language Arts Zoophonics, Zoophonics Inc., 1987
Yes 0
Mathematics Mathematics Go Math!, Digital Interactive and Print Editions, Houghton Mifflin Harcourt, 2015
Mathematics California Saxon Math, Grades K-6, Saxon Publishers (Harcourt Achieve), 2008
Mathematics Holt California Mathematics, Course 1:Numbers to Algebra, Holt, Rinehart and Winston, 2008
Mathematics Holt California Mathematics, Course 2:Pre-Algebra, Holt, Rinehart and Winston, 2008
Mathematics Holt California Mathematics, Course 3: Algebra 1, Holt, Rinehart and Winston, 2008
Yes 0
2016-17 School Accountability Report Card for Charter Alternative Program (CAP) Page 5 of 12
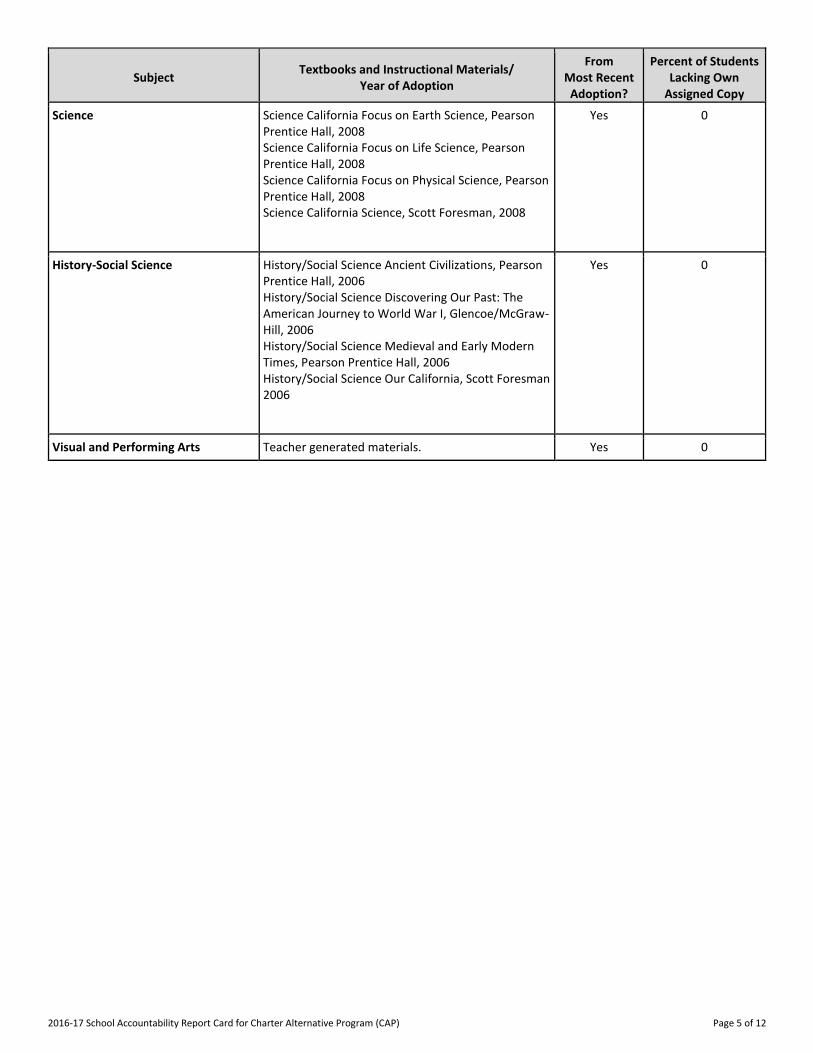
Subject Textbooks and Instructional Materials/
Year of Adoption
From Most Recent
Adoption?
Percent of Students Lacking Own
Assigned Copy
Science Science California Focus on Earth Science, Pearson Prentice Hall, 2008
Science California Focus on Life Science, Pearson Prentice Hall, 2008
Science California Focus on Physical Science, Pearson Prentice Hall, 2008
Science California Science, Scott Foresman, 2008
Yes 0
History-Social Science History/Social Science Ancient Civilizations, Pearson Prentice Hall, 2006
History/Social Science Discovering Our Past: The American Journey to World War I, Glencoe/McGraw-Hill, 2006
History/Social Science Medieval and Early Modern Times, Pearson Prentice Hall, 2006
History/Social Science Our California, Scott Foresman 2006
Yes 0
Visual and Performing Arts Teacher generated materials. Yes 0

2016-17 School Accountability Report Card for Charter Alternative Program (CAP) Page 6 of 12
School Facility Conditions and Planned Improvements (Most Recent Year)
The Charter Alternative Program operates at a (former) elementary school that EDCOE leases from a local school district. Due to the design of the facility, the program is able to use several traditional classrooms for direct instruction, as well as a large conference room for teachers to meet with parents and students. Facilities are regularly inspected, cleaned, and maintained through close coordination with the school district that owns the facility. The District provides full maintenance and repairs due to normal wear and tear or aging of the facility, as necessary to keep all grounds in good order, repair and neat condition. Restrooms, floors, walls, roof, plumbing, and electrical systems are maintained in good condition. Recent improvements include new carpet and/or paint, HVAC upgrades, sidewalk repair, and new play equipment (swings), door mats are regularly replaced, and playground bark/fiber is inspected and replaced regularly. EDCOE provides full custodial services on a daily basis, including but not limited to restrooms, classrooms, and office cleaning. Significant improvements have been made to the facility in the areas of safety, communications, and power since we began using the site in 2010, including improving the security of all exterior doors and adding blinds to all classrooms. EDCOE has made significant technology infrastructure improvements as well, including increasing broadband speeds ten-fold, adding a Voice Over IP phone system, adding cell boosters to improve communications, adding facility-wide connectivity / Wi-Fi (including for home school families), adding network drops, and providing wireless iPads/monitors/devices for instructional staff/students. Safety and emergency procedures are updated annually in the Safe School Plan, and regular training and drills are held. School Facility Good Repair Status (Most Recent Year) Using the most recently collected FIT data (or equivalent), provide the following:
• Determination of repair status for systems listed • Description of any needed maintenance to ensure good repair • The year and month in which the data were collected • The overall rating
School Facility Good Repair Status (Most Recent Year) Year and month of the most recent FIT report: November, 2017
System Inspected Repair Status Repair Needed and
Action Taken or Planned Good Fair Poor
Systems: Gas Leaks, Mechanical/HVAC, Sewer
X
Interior: Interior Surfaces X
Cleanliness: Overall Cleanliness, Pest/ Vermin Infestation
X
Electrical: Electrical X
Restrooms/Fountains: Restrooms, Sinks/ Fountains
X
Safety: Fire Safety, Hazardous Materials X
Structural: Structural Damage, Roofs X
External: Playground/School Grounds, Windows/ Doors/Gates/Fences
X
Overall Facility Rating (Most Recent Year)
Year and month of the most recent FIT report: November, 2017
Overall Rating Exemplary Good Fair Poor
X
2016-17 School Accountability Report Card for Charter Alternative Program (CAP) Page 7 of 12
B. Pupil Outcomes
State Priority: Pupil Achievement The SARC provides the following information relevant to the State priority: Pupil Achievement (Priority 4): • Statewide assessments (i.e., California Assessment of Student Performance and Progress [CAASPP] System, which includes the
Smarter Balanced Summative Assessments for students in the general education population and the California Alternate Assessments [CAAs] for English language arts/literacy [ELA] and mathematics given in grades three through eight and grade eleven. Only eligible students may participate in the administration of the CAAs. CAAs items are aligned with alternate achievement standards, which are linked with the Common Core State Standards [CCSS] for students with the most significant cognitive disabilities); and
• The percentage of students who have successfully completed courses that satisfy the requirements for entrance to the University of California and the California State University, or career technical education sequences or programs of study.
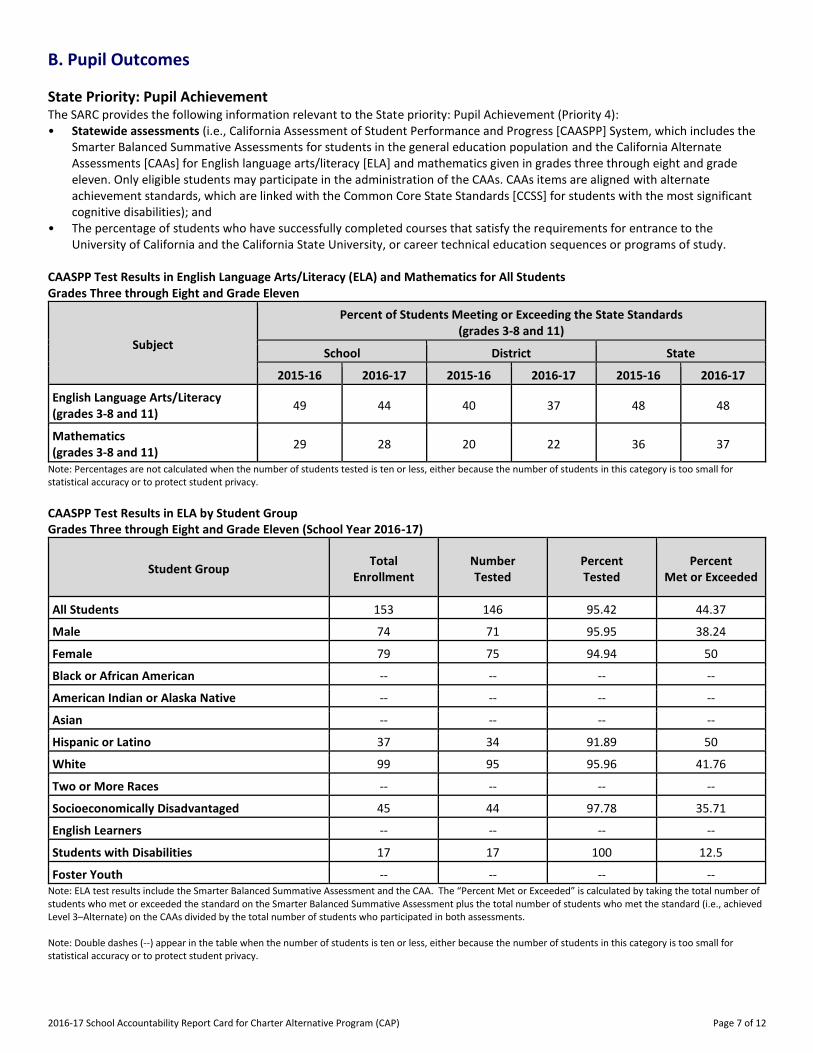
CAASPP Test Results in English Language Arts/Literacy (ELA) and Mathematics for All Students Grades Three through Eight and Grade Eleven
Subject
Percent of Students Meeting or Exceeding the State Standards (grades 3-8 and 11)
School District State
2015-16 2016-17 2015-16 2016-17 2015-16 2016-17
English Language Arts/Literacy (grades 3-8 and 11)
49 44 40 37 48 48
Mathematics (grades 3-8 and 11)
29 28 20 22 36 37
Note: Percentages are not calculated when the number of students tested is ten or less, either because the number of students in this category is too small for statistical accuracy or to protect student privacy.
CAASPP Test Results in ELA by Student Group Grades Three through Eight and Grade Eleven (School Year 2016-17)
Student Group Total
Enrollment Number Tested
Percent Tested
Percent Met or Exceeded
All Students 153 146 95.42 44.37
Male 74 71 95.95 38.24
Female 79 75 94.94 50
Black or African American -- -- -- --
American Indian or Alaska Native -- -- -- --
Asian -- -- -- --
Hispanic or Latino 37 34 91.89 50
White 99 95 95.96 41.76
Two or More Races -- -- -- --
Socioeconomically Disadvantaged 45 44 97.78 35.71
English Learners -- -- -- --
Students with Disabilities 17 17 100 12.5
Foster Youth -- -- -- -- Note: ELA test results include the Smarter Balanced Summative Assessment and the CAA. The “Percent Met or Exceeded” is calculated by taking the total number of students who met or exceeded the standard on the Smarter Balanced Summative Assessment plus the total number of students who met the standard (i.e., achieved Level 3–Alternate) on the CAAs divided by the total number of students who participated in both assessments. Note: Double dashes (--) appear in the table when the number of students is ten or less, either because the number of students in this category is too small for statistical accuracy or to protect student privacy.
2016-17 School Accountability Report Card for Charter Alternative Program (CAP) Page 8 of 12
Note: The number of students tested includes all students who participated in the test whether they received a score or not; however, the number of students tested is not the number that was used to calculate the achievement level percentages. The achievement level percentages are calculated using only students who received scores.
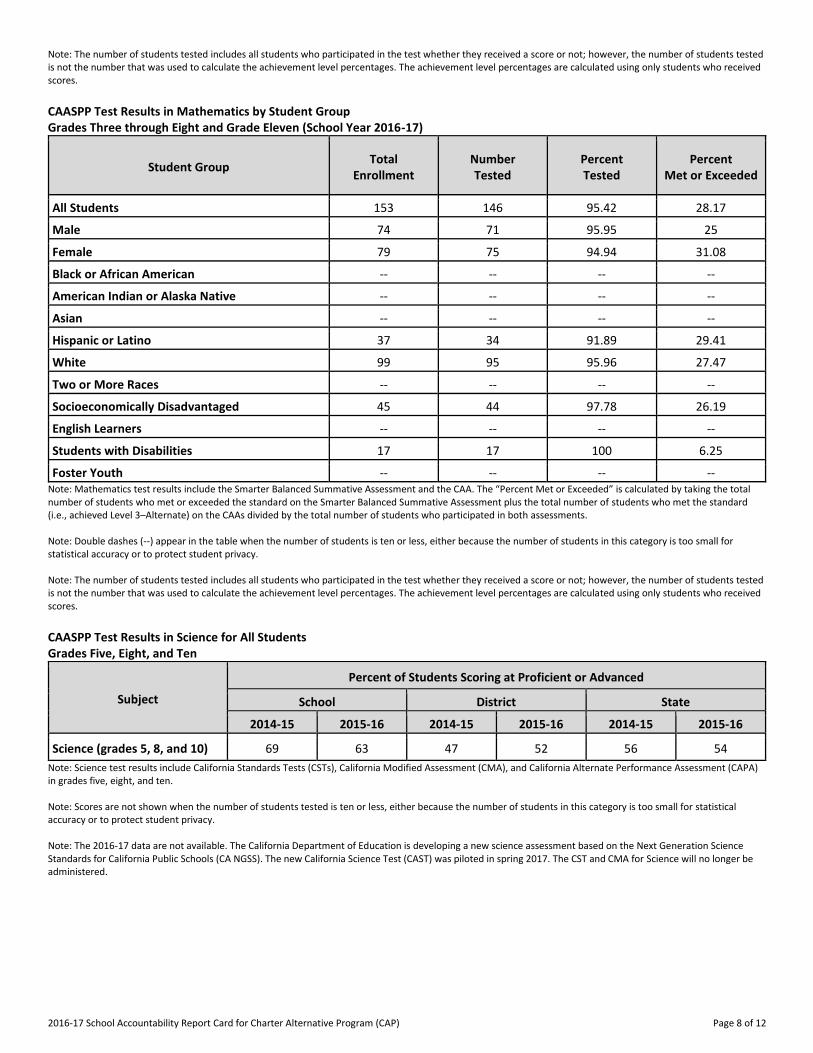
CAASPP Test Results in Mathematics by Student Group Grades Three through Eight and Grade Eleven (School Year 2016-17)
Student Group Total
Enrollment Number Tested
Percent Tested
Percent Met or Exceeded
All Students 153 146 95.42 28.17
Male 74 71 95.95 25
Female 79 75 94.94 31.08
Black or African American -- -- -- --
American Indian or Alaska Native -- -- -- --
Asian -- -- -- --
Hispanic or Latino 37 34 91.89 29.41
White 99 95 95.96 27.47
Two or More Races -- -- -- --
Socioeconomically Disadvantaged 45 44 97.78 26.19
English Learners -- -- -- --
Students with Disabilities 17 17 100 6.25
Foster Youth -- -- -- -- Note: Mathematics test results include the Smarter Balanced Summative Assessment and the CAA. The “Percent Met or Exceeded” is calculated by taking the total number of students who met or exceeded the standard on the Smarter Balanced Summative Assessment plus the total number of students who met the standard (i.e., achieved Level 3–Alternate) on the CAAs divided by the total number of students who participated in both assessments. Note: Double dashes (--) appear in the table when the number of students is ten or less, either because the number of students in this category is too small for statistical accuracy or to protect student privacy. Note: The number of students tested includes all students who participated in the test whether they received a score or not; however, the number of students tested is not the number that was used to calculate the achievement level percentages. The achievement level percentages are calculated using only students who received scores.
CAASPP Test Results in Science for All Students Grades Five, Eight, and Ten
Subject
Percent of Students Scoring at Proficient or Advanced
School District State
2014-15 2015-16 2014-15 2015-16 2014-15 2015-16
Science (grades 5, 8, and 10) 69 63 47 52 56 54
Note: Science test results include California Standards Tests (CSTs), California Modified Assessment (CMA), and California Alternate Performance Assessment (CAPA) in grades five, eight, and ten. Note: Scores are not shown when the number of students tested is ten or less, either because the number of students in this category is too small for statistical accuracy or to protect student privacy. Note: The 2016-17 data are not available. The California Department of Education is developing a new science assessment based on the Next Generation Science Standards for California Public Schools (CA NGSS). The new California Science Test (CAST) was piloted in spring 2017. The CST and CMA for Science will no longer be administered.
2016-17 School Accountability Report Card for Charter Alternative Program (CAP) Page 9 of 12
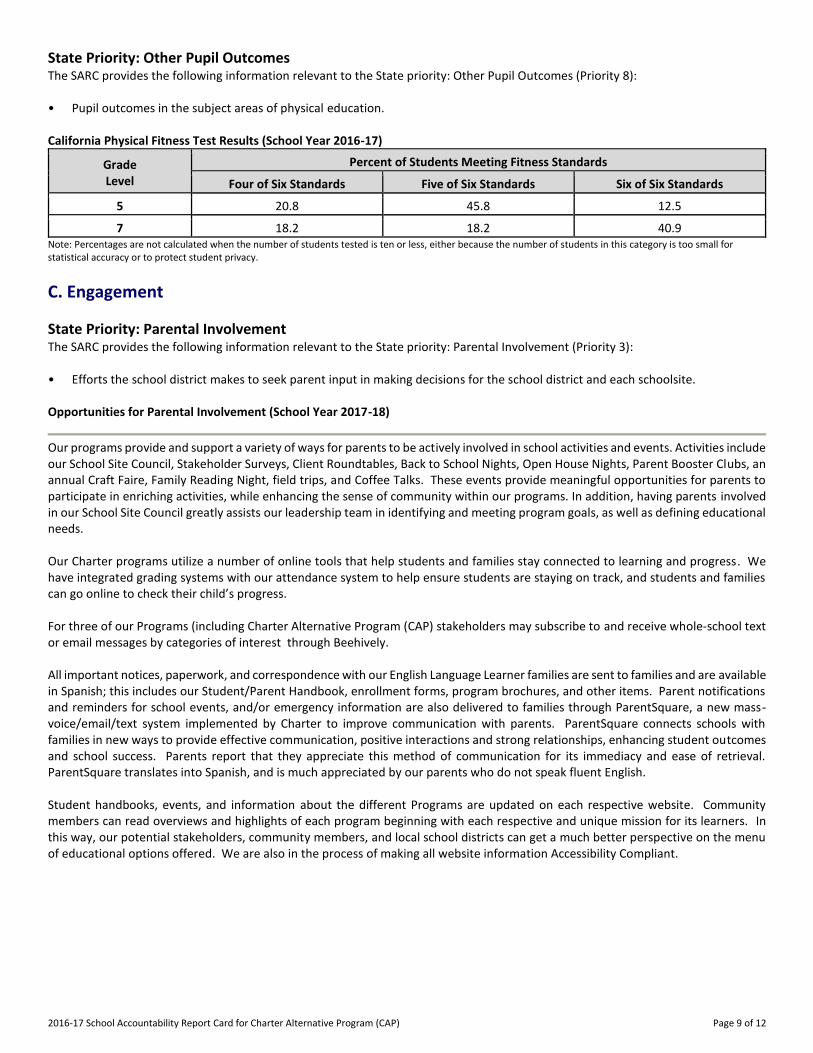
State Priority: Other Pupil Outcomes The SARC provides the following information relevant to the State priority: Other Pupil Outcomes (Priority 8): • Pupil outcomes in the subject areas of physical education. California Physical Fitness Test Results (School Year 2016-17)
Grade Level
Percent of Students Meeting Fitness Standards
Four of Six Standards Five of Six Standards Six of Six Standards
---5--- 20.8 45.8 12.5
---7--- 18.2 18.2 40.9 Note: Percentages are not calculated when the number of students tested is ten or less, either because the number of students in this category is too small for statistical accuracy or to protect student privacy.
C. Engagement
State Priority: Parental Involvement The SARC provides the following information relevant to the State priority: Parental Involvement (Priority 3): • Efforts the school district makes to seek parent input in making decisions for the school district and each schoolsite. Opportunities for Parental Involvement (School Year 2017-18)
Our programs provide and support a variety of ways for parents to be actively involved in school activities and events. Activities include our School Site Council, Stakeholder Surveys, Client Roundtables, Back to School Nights, Open House Nights, Parent Booster Clubs, an annual Craft Faire, Family Reading Night, field trips, and Coffee Talks. These events provide meaningful opportunities for parents to participate in enriching activities, while enhancing the sense of community within our programs. In addition, having parents involved in our School Site Council greatly assists our leadership team in identifying and meeting program goals, as well as defining educational needs. Our Charter programs utilize a number of online tools that help students and families stay connected to learning and progress. We have integrated grading systems with our attendance system to help ensure students are staying on track, and students and families can go online to check their child’s progress. For three of our Programs (including Charter Alternative Program (CAP) stakeholders may subscribe to and receive whole-school text or email messages by categories of interest through Beehively. All important notices, paperwork, and correspondence with our English Language Learner families are sent to families and are available in Spanish; this includes our Student/Parent Handbook, enrollment forms, program brochures, and other items. Parent notifications and reminders for school events, and/or emergency information are also delivered to families through ParentSquare, a new mass-voice/email/text system implemented by Charter to improve communication with parents. ParentSquare connects schools with families in new ways to provide effective communication, positive interactions and strong relationships, enhancing student outcomes and school success. Parents report that they appreciate this method of communication for its immediacy and ease of retrieval. ParentSquare translates into Spanish, and is much appreciated by our parents who do not speak fluent English. Student handbooks, events, and information about the different Programs are updated on each respective website. Community members can read overviews and highlights of each program beginning with each respective and unique mission for its learners. In this way, our potential stakeholders, community members, and local school districts can get a much better perspective on the menu of educational options offered. We are also in the process of making all website information Accessibility Compliant.
2016-17 School Accountability Report Card for Charter Alternative Program (CAP) Page 10 of 12
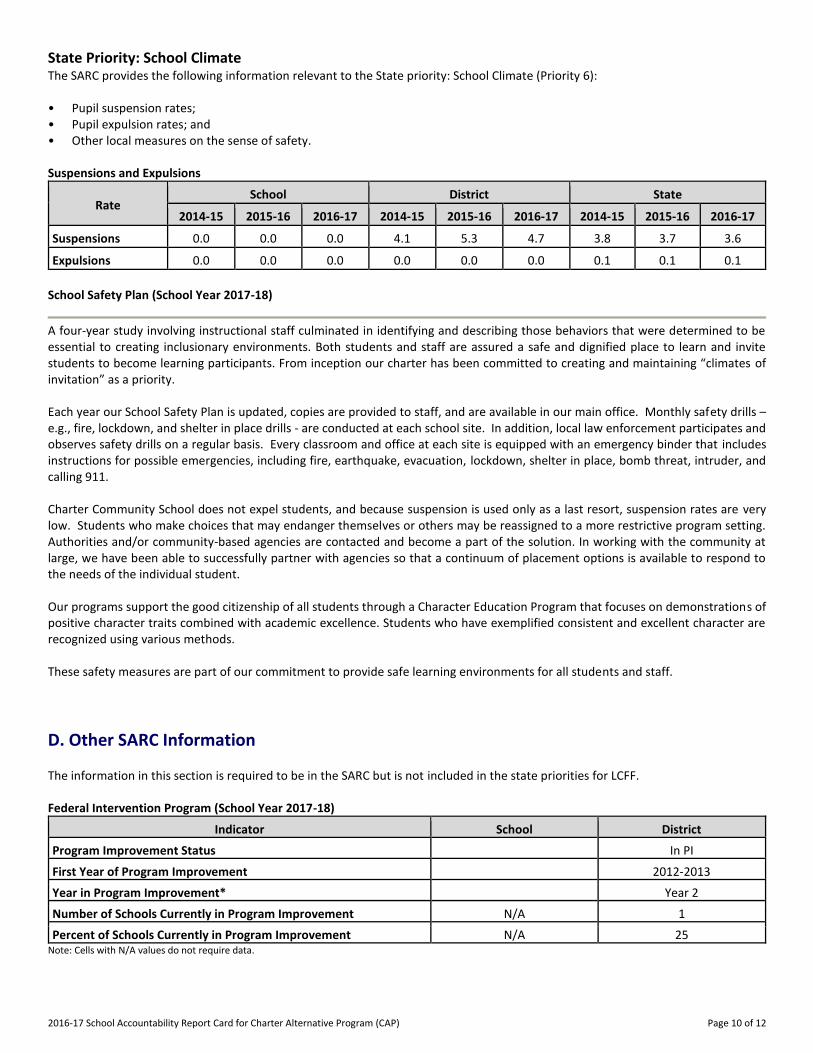
State Priority: School Climate The SARC provides the following information relevant to the State priority: School Climate (Priority 6): • Pupil suspension rates; • Pupil expulsion rates; and • Other local measures on the sense of safety. Suspensions and Expulsions
Rate School District State
2014-15 2015-16 2016-17 2014-15 2015-16 2016-17 2014-15 2015-16 2016-17
Suspensions------- 0.0 0.0 0.0 4.1 5.3 4.7 3.8 3.7 3.6
Expulsions------- 0.0 0.0 0.0 0.0 0.0 0.0 0.1 0.1 0.1
School Safety Plan (School Year 2017-18)
A four-year study involving instructional staff culminated in identifying and describing those behaviors that were determined to be essential to creating inclusionary environments. Both students and staff are assured a safe and dignified place to learn and invite students to become learning participants. From inception our charter has been committed to creating and maintaining “climates of invitation” as a priority. Each year our School Safety Plan is updated, copies are provided to staff, and are available in our main office. Monthly safety drills – e.g., fire, lockdown, and shelter in place drills - are conducted at each school site. In addition, local law enforcement participates and observes safety drills on a regular basis. Every classroom and office at each site is equipped with an emergency binder that includes instructions for possible emergencies, including fire, earthquake, evacuation, lockdown, shelter in place, bomb threat, intruder, and calling 911. Charter Community School does not expel students, and because suspension is used only as a last resort, suspension rates are very low. Students who make choices that may endanger themselves or others may be reassigned to a more restrictive program setting. Authorities and/or community-based agencies are contacted and become a part of the solution. In working with the community at large, we have been able to successfully partner with agencies so that a continuum of placement options is available to respond to the needs of the individual student. Our programs support the good citizenship of all students through a Character Education Program that focuses on demonstrations of positive character traits combined with academic excellence. Students who have exemplified consistent and excellent character are recognized using various methods. These safety measures are part of our commitment to provide safe learning environments for all students and staff.
D. Other SARC Information
The information in this section is required to be in the SARC but is not included in the state priorities for LCFF. Federal Intervention Program (School Year 2017-18)
Indicator School District
Program Improvement Status In PI
First Year of Program Improvement 2012-2013
Year in Program Improvement* Year 2
Number of Schools Currently in Program Improvement N/A 1
Percent of Schools Currently in Program Improvement N/A 25 Note: Cells with N/A values do not require data.
2016-17 School Accountability Report Card for Charter Alternative Program (CAP) Page 11 of 12
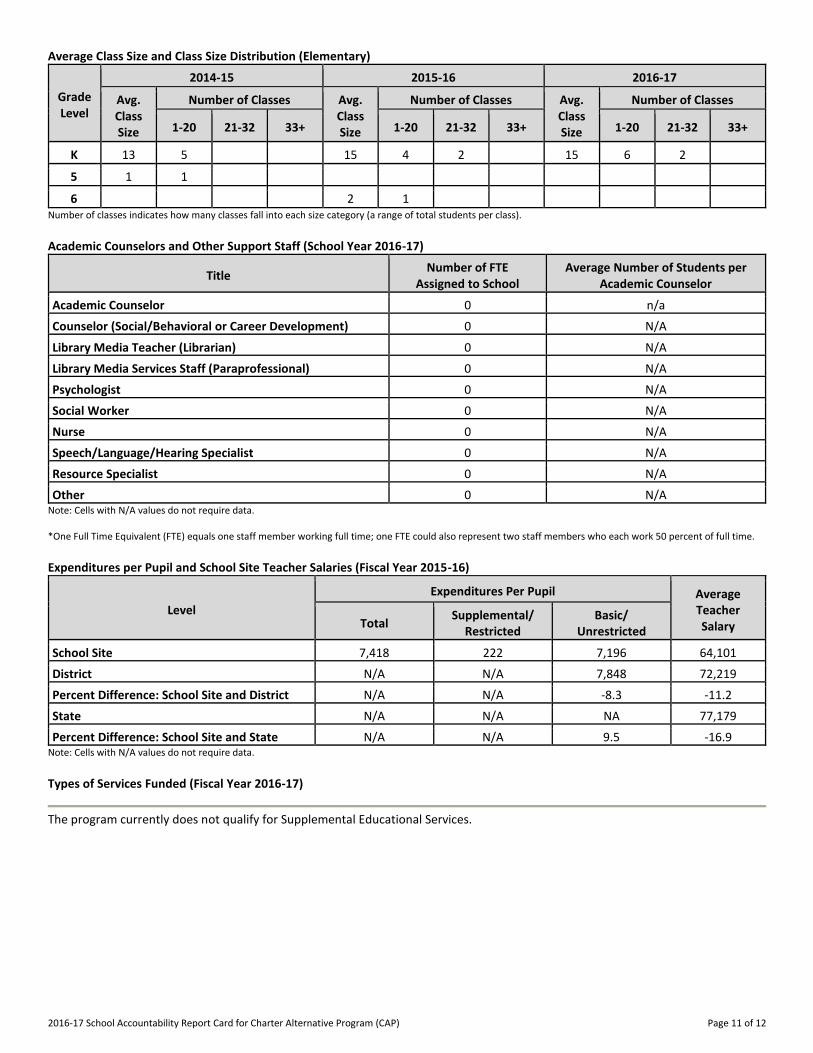
Average Class Size and Class Size Distribution (Elementary)
Grade Level
2014-15 2015-16 2016-17
Avg. Class Size
Number of Classes Avg. Class Size
Number of Classes Avg. Class Size
Number of Classes
1-20 21-32 33+ 1-20 21-32 33+ 1-20 21-32 33+
K
13 5 15 4 2 15 6 2
5
1 1
6
2 1 Number of classes indicates how many classes fall into each size category (a range of total students per class).
Academic Counselors and Other Support Staff (School Year 2016-17)
Title Number of FTE
Assigned to School Average Number of Students per
Academic Counselor
Academic Counselor------- 0 n/a
Counselor (Social/Behavioral or Career Development) 0 N/A
Library Media Teacher (Librarian) 0 N/A
Library Media Services Staff (Paraprofessional) 0 N/A
Psychologist------- 0 N/A
Social Worker------- 0 N/A
Nurse------- 0 N/A
Speech/Language/Hearing Specialist 0 N/A
Resource Specialist------- 0 N/A
Other------- 0 N/A Note: Cells with N/A values do not require data. *One Full Time Equivalent (FTE) equals one staff member working full time; one FTE could also represent two staff members who each work 50 percent of full time.
Expenditures per Pupil and School Site Teacher Salaries (Fiscal Year 2015-16)
Level
Expenditures Per Pupil Average Teacher Salary Total
Supplemental/ Restricted
Basic/ Unrestricted
School Site------- 7,418 222 7,196 64,101
District------- N/A N/A 7,848 72,219
Percent Difference: School Site and District N/A N/A -8.3 -11.2
State------- N/A N/A NA 77,179
Percent Difference: School Site and State N/A N/A 9.5 -16.9 Note: Cells with N/A values do not require data.
Types of Services Funded (Fiscal Year 2016-17)
The program currently does not qualify for Supplemental Educational Services.
2016-17 School Accountability Report Card for Charter Alternative Program (CAP) Page 12 of 12
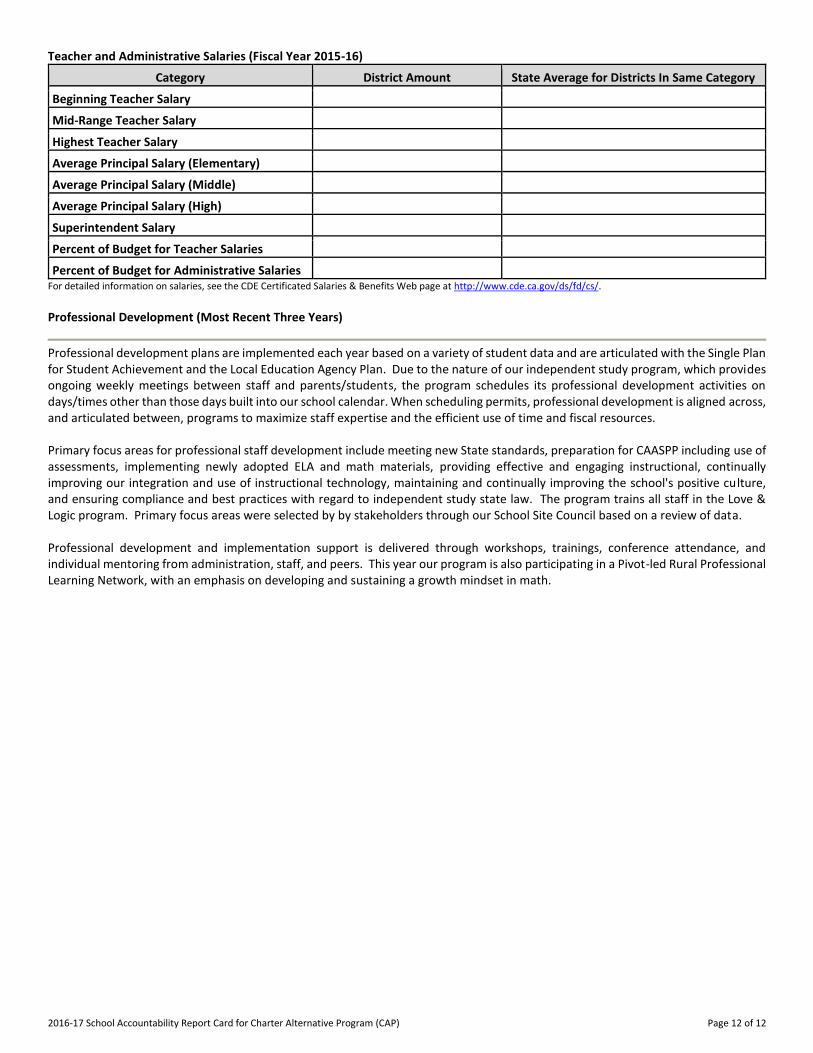
Teacher and Administrative Salaries (Fiscal Year 2015-16)
Category District Amount State Average for Districts In Same Category
Beginning Teacher Salary
Mid-Range Teacher Salary
Highest Teacher Salary
Average Principal Salary (Elementary)
Average Principal Salary (Middle)
Average Principal Salary (High)
Superintendent Salary
Percent of Budget for Teacher Salaries
Percent of Budget for Administrative Salaries For detailed information on salaries, see the CDE Certificated Salaries & Benefits Web page at http://www.cde.ca.gov/ds/fd/cs/. Professional Development (Most Recent Three Years)
Professional development plans are implemented each year based on a variety of student data and are articulated with the Single Plan for Student Achievement and the Local Education Agency Plan. Due to the nature of our independent study program, which provides ongoing weekly meetings between staff and parents/students, the program schedules its professional development activities on days/times other than those days built into our school calendar. When scheduling permits, professional development is aligned across, and articulated between, programs to maximize staff expertise and the efficient use of time and fiscal resources. Primary focus areas for professional staff development include meeting new State standards, preparation for CAASPP including use of assessments, implementing newly adopted ELA and math materials, providing effective and engaging instructional, continually improving our integration and use of instructional technology, maintaining and continually improving the school's positive culture, and ensuring compliance and best practices with regard to independent study state law. The program trains all staff in the Love & Logic program. Primary focus areas were selected by by stakeholders through our School Site Council based on a review of data. Professional development and implementation support is delivered through workshops, trainings, conference attendance, and individual mentoring from administration, staff, and peers. This year our program is also participating in a Pivot-led Rural Professional Learning Network, with an emphasis on developing and sustaining a growth mindset in math.