2016 nanocarbon foam/polymer composite
TRANSCRIPT
Florida State University Libraries
2016
Nanocarbon Foam/Polymer CompositeMuhamad Shahrizan Jamal
Follow this and additional works at the FSU Digital Library. For more information, please contact [email protected]

FLORIDA STATE UNIVERSITY
COLLEGE OF ENGINEERING
NANOCARBON FOAM/POLYMER COMPOSITE
By
MUHAMAD SHAHRIZAN JAMAL
A Thesis submitted to the
Department of Industrial and Manufacturing Engineering
in partial fulfillment of the
requirements for the degree of
Master of Science
2016

ii
Muhamad Shahrizan Jamal defended this thesis on June 7, 2016.
The members of the supervisory committee were:
Mei Zhang
Professor Directing Thesis
Okenwa Okoli
Committee Member
Abhishek Shrivastava
Committee Member
The Graduate School has verified and approved the above-named committee members, and
certifies that the thesis has been approved in accordance with university requirements.

iii
ACKNOWLEDGMENTS
I would first like to thank my thesis advisor Dr. Mei Zhang for the continuous support of
my graduate study. The door to her office was always open whenever I had a question about my
research. Her guidance helped me in all the time of research and writing of this thesis
Next, I would to thank my thesis committee members: Dr. Okenwa Okoli and Dr.
Abshishek Shrivastava, for their astute comments and suggestions in helping me complete my
research. Their suggestions helped me to gain a different perspective of my research.
I thank my fellow coworkers at the High-Performance Materials Institute for the exciting
discussions, continuous help and fun that we have had working together in the past two years.
Last and most importantly, I would like to thank my family and friends for their moral
support throughout my graduate studies and my life in general.

iv
TABLE OF CONTENTS
List of Tables ...................................................................................................................................v
List of Figures ................................................................................................................................ vi
List of Symbols .............................................................................................................................. ix
Abstract ............................................................................................................................................x
1. INTRODUCTION ......................................................................................................................1
2. PROBLEM STATEMENT AND RESEARCH OBJECTIVES .................................................4
2.1 Problem Statement ...............................................................................................................4
2.2 Research Objectives .............................................................................................................5
3. LITERATURE REVIEW............................................................................................................7
3.1 Carbon Foam ........................................................................................................................7
3.2 Composite Foam ................................................................................................................13
3.3 Summary ............................................................................................................................17
4. FABRICATION PROCESS .....................................................................................................18
4.1 Nanocarbon Foam ..............................................................................................................18
4.2 Nanocarbon Foam/Polymer Composite .............................................................................20
5. RESULTS AND DISCUSSIONS .............................................................................................24
5.1 Nanocarbon Foam ..............................................................................................................24
5.2 Nanocarbon Foam/PMMA Composite ..............................................................................30
5.3 Nanocarbon Foam/SEBS Composite .................................................................................46
6. CONCLUSION .........................................................................................................................51
References ......................................................................................................................................52
Biographical Sketch .......................................................................................................................57

v
LIST OF TABLES
Table 1: Summary of reported strength by various authors in literature ...................................... 17
Table 2: Resistance of composite foams with varying density ..................................................... 44
Table 3: Resistivity of composite foams with varying density ..................................................... 45

vi
LIST OF FIGURES
Figure 1: Traditional honeycomb structure ..................................................................................... 1
Figure 2: Graphical illustration on the difference between open cell foam and closed cell foam .. 2
Figure 3: Ashby plot of strength against density of various materials available to date. The
unattainable material space is defined by Hashin bound. Adapted from Youssef.[15] .................. 4
Figure 4: Stress-strain curves and Transmission Electron Microscopy (TEM)images for foams
made by Bradford et.al with varying post growth treatment time [18] .......................................... 8
Figure 5: Stress strain curve of multi cycle compression and the SEM image of the ultra-
lightweight foam by Sun et.al [21] ................................................................................................. 9
Figure 6: (a – c)SEM images of foam fabricated using dichlorobenzene supply rate of 0.1
mL/min, 0.3 mL/min and 0.7 mL/min. (d) Different types of welded junction within the foam
[22] ................................................................................................................................................ 10
Figure 7: The aerogel being compressed up to 90% strain and the resulting stress strain curve
[25] ................................................................................................................................................ 12
Figure 8: Graphical illustration of the infiltration process in foam composite fabrication .......... 14
Figure 9: PAN oxidation process during the heat treatment at 300oC in air................................. 18
Figure 10: Graphical summary of the nanocarbon foam fabrication process ............................... 19
Figure 11: Graphical summary of the composite foam fabrication process ................................. 21
Figure 12: Foam infiltration process ............................................................................................. 22
Figure 13: Rotational drying to ensure uniformity in polymer infiltration ................................... 23
Figure 14: A) Illustration on how the CNTs are held together at the joint by PAN in the
nanocarbon foam and how polymer coats the CNTs in the composite foam B) Image of two
nanocarbon foam stacked on top of one another .......................................................................... 23
Figure 15: SEM images at different magnification level showing the structure of the nanocarbon
foam. The magnification levels are: A) X350 B) X2000 C) X5000 D) X10000 .......................... 24

vii
Figure 16: Stress-strain curve of the nanocarbon foam with a density of 26.42 mg/cm3 at
different strain ............................................................................................................................... 26
Figure 17: The strength of the nanocarbon foam as compared to other materials ........................ 26
Figure 18: The fatigue test of the nanocarbon foam after multiple consecutive compression to
70% strain. .................................................................................................................................... 27
Figure 19: The heating and cooling between room temperature and 130°C of a curved
nanocarbon foam to demonstrate its heat transfer effectiveness. ................................................. 28
Figure 20: Temperature change of nanocarbon foams with varying thickness when placed on
surface heated to 200°C ................................................................................................................ 29
Figure 21: SEM images showing the structure of the foam before and after polymer infiltration 30
Figure 22: SEM images showing polymer concentration at different location within the
composite foam ............................................................................................................................. 31
Figure 23 : Stress-strain curve for composite foam made from 1 wt% polymer concentration
which has a density of 41 mg/cm3 ................................................................................................ 32
Figure 24 : Stress-strain curve for composite foam made from 3 wt% polymer concentration
which has a density of 60 mg/cm3 ................................................................................................ 33
Figure 25: Stress-strain curve for composite foam made from 5 wt% polymer concentration
which has a density of 88 mg/cm3 ................................................................................................ 33
Figure 26: Stress-strain curve for composite foam made from 10 wt% polymer concentration
which has a density of 118 mg/cm3 .............................................................................................. 34
Figure 27: Stress-strain curve for composite foam made from 15 wt% polymer concentration
which has a density of 206 mg/cm3 .............................................................................................. 34
Figure 28: Stress-strain curve for composite foam made from 20 wt% polymer concentration
which has a density of 332 mg/cm3 .............................................................................................. 35
Figure 29: Strength at 50% strain versus density plot of multiple replications of the composite
foam at different density ............................................................................................................... 36
Figure 30: Strength of nanocarbon foam and composite foams at varying density and strain. .... 36

viii
Figure 31: Specific strength at 50% strain versus density plot for the composite foam ............... 38
Figure 32: Specific strength at 70% strain versus density plot for the composite foam ............... 38
Figure 33: Strength at 50% strain versus density for composite samples against other available
materials ........................................................................................................................................ 39
Figure 34: DSC analysis for PMMA polymer to determine its glass transition temperature ....... 40
Figure 35: TGA analysis of PMMA polymer to determine its decomposition temperature ........ 40
Figure 36: Rigidity of the composite foam at different temperature. At room temperature, the
composite foam is able to withstand the mass of 900 g while at 30°C but undergoes recoverable
deformation at temperature beyond the Tg of PMMA. ................................................................. 41
Figure 37: Stress-strain curve for compression tests on composite foam made from 5 wt%
polymer concentration at 140°C and nanocarbon foam at room temperature and at 140°C ........ 42
Figure 38: Compression test on composite foam with density of 332mg/cm3 after being healed
with the use of heat ....................................................................................................................... 42
Figure 39 : Graphical illustration of electrical testing .................................................................. 43
Figure 40 : Conductivity of nanocarbon foams and composite foams at varying density ............ 46
Figure 41: Stress-strain curve for composite foam made from 20 wt% SEBS concentration which
has a density of 172 mg/cm3 ......................................................................................................... 47
Figure 42: Strength at 50% strain versus density plot of multiple replications of the SEBS
composite foam at different density .............................................................................................. 48
Figure 43: Stress-strain curve of SEBS polymer which has a density of 1231 mg/cm3 ............... 49

ix
LIST OF SYMBOLS
σ Stress/Strength
F Force
A Area
ε Strain
L Length
Lo Initial Length
ρ Density
m Mass
V Volume
SS Specific Strength
R Resistance
r Resistivity
κ Conductivity
Ec Elastic Modulus of Composite
Ef Elastic Modulus of Fiber
Em Elastic Modulus of Matrix
f Fiber Volume Fraction

x
ABSTRACT
Weight of a material and the system formed by such material is a critical factor for many
applications. Traditionally, engineering designed porous structures, typically honeycomb
structures, have been utilized for weight critical applications. The goal of this thesis work is to
utilize the material with the lightest weight to fabricate a new type of foam that is not only
lightweight and strong, but also electrically as well as thermally conductive and with tunable
elasticity. A carbon nanotube (CNT) based nanocarbon foam was fabricated by using poly
(methyl methacrylate) spheres as a template to create engineered pores. The junctions between
the CNTs are secured using nanocarbon via the oxidation and carbonization of polyacrylonitrile.
The resulting low density foam exhibits robustness in structure, high elasticity, thermal stability,
corrosion resistance and is also electrically as well as thermally conductive. The strength of the
foam is further boosted with the infiltration of PMMA polymer. The resulting composite foam is
still porous and has higher mechanical strength. The electrical conductivity of the composite
foam is not affected despite the presence of PMMA.

1
CHAPTER 1
INTRODUCTION
The increasing demand for lightweight and strong material especially for applications in
which weight is a critical factor such as aerospace and automotive has resulted in the invention
of various new materials and structures. One of those inventions is the honeycomb structure
which is made up of parallel and prismatic cells.[1] It has been traditionally used in the sandwich
panel construction due to its lightweight and high strength.[2] As recent as last year, NASA was
seeking a new material to replace the traditional honeycomb structure (shown in Figure 1) for its
future missions.[3] One of the structures that has attracted interest and has great potential to
replace the honeycomb structure is the porous aerogel or foam structure.
Solid foam is a material which has gaseous voids that is enclosed by matrix with a higher
density. Foam can be classified into two types which are rigid and flexible depending on its
Figure 1: Traditional honeycomb structure

2
structure and morphology.[4] Besides that, foam can also be categorized as open cell or closed
cell. Closed cell foam has pores which are completely surrounded by the walls which the foam is
made of resulting in no gas or liquid transport from one cell to another. On the contrary, the
walls of open cell foams are incomplete. These differences are illustrated in graphical form in
Figure 2. In general, all foams exhibit attributes such as lightweight, highly porous and large
surface area. Some are also good thermal and/or electrical conductor. Due to this, foam not only
fits the bill for various aviation and automotive applications but it is also suitable for many
industrial applications such as packaging, buoyancy, thermal insulation, acoustic attenuation,
vibration damping, absorbent and energy storage.[5, 6] Investigators have developed various
foams from different kind of materials such as metal, polymer and ceramic. [4, 7, 8] On the other
hand, nano foam has also been fabricated by the means of graphene and carbon nanotubes
(CNT).[5, 9]
Figure 2: Graphical illustration on the difference between open cell foam and closed cell foam
CNT, which is one of the allotropes of carbon, has been subjected to an extensive
research ever since it was re-discovered by IIjima in 1991.[10] This is due to its superior
mechanical, physical, thermal and electrical properties resulting from its symmetrical
structure.[11] The mechanical properties of CNT, specifically the strength and stiffness are
expected to be higher than that of an ideal carbon fiber, which has the impeccable orientation of

3
a perfect graphene layers in the direction of the fiber axis.[12] CNT can be divided into two
types; single wall carbon nanotube (SWCNT) and multiwalled carbon nanotube (MWCNT). The
tensile strength of SWCNT and MWCNT has been reported to be around 50 GPa to 500 GPa and
10 to 60 GPa respectively while the modulus is in the region of 1.5 TPa for SWCNT and 1 TPa
for MWCNT.[13] CNT is highly anisotropic which means the properties are directionally
dependent.[14] It is strong in its axial direction due to the carbon-carbon double bond (C=C) and
weaker in the radial direction. Besides having excellent mechanical properties, CNT is also
lightweight which makes it desirable for lightweight application.
In this work, CNT based nanocarbon foam has been fabricated by utilizing poly (methyl
methacrylate) (PMMA) microspheres as template to create the micro-scale pores.
Polyacrylonitrile (PAN) is used to hold the CNTs together by forming crosslinks between the
tubes. The nanocarbon foam is lightweight, conductive, highly porous and also exceptionally
elastic. To further improve the compressive strength of the nanocarbon foam without increasing
the weight considerably, the walls of the foam was reinforced by the means of thermoplastic
polymer infiltration while keeping the porous structure of the nanocarbon foam intact. In this
work, PMMA was used for this purpose due to its high strength and low density. The resulting
nanocarbon foam/polymer composite exhibits improved mechanical performance while being
lightweight and conductive.

4
CHAPTER 2
PROBLEM STATEMENT AND RESEARCH OBJECTIVES
2.1. Problem Statement
Throughout the years, various materials have been developed ranging from low density to
high density spanning a wide range of strength. These materials density and strength properties
can be summarized in the Ashby Plot[15, 16] shown in Figure 3.
Figure 3: Ashby plot of strength against density of various materials available to date. The
unattainable material space is defined by Hashin bound. Adapted from Youssef.[15]
The continuous and persistent yearning for a better material that eclipses the existing
materials in terms or properties and performance to fulfill the demand of various industries such
as aerospace and automotive has result in an extensive research to develop the next high
performance material. Various investigations have been carried out by researchers all over the
Room For
Improvement

5
world to develop a material that fulfills the requirement of having a high strength while keeping
the weight low. However, as can be seen in the Ashby Plot, there still exist a large gap in
literature, especially in the region of lower densities (yellow region) which is still left
undiscovered today.
2.2. Research Objectives
The goal of this research is to explore a three-dimensional material that can be mass
produced cheaply and exhibits the following characteristics:
1. Light weight
2. High specific strength
3. Electrically conductive
The definition of lightweight varies from literature to literature. To avoid ambiguities, in
this literature, lightweight is defined as having a density of less than 400 mg/cm3. In order to
achieve this, a porous structure fabricated using CNT is proposed. Porous structure is able to
retain the properties of a solid structure but at the same time being lightweight and cheaper due
to the less amount of materials used. In addition to that, utilizing CNT also help this cause.
As discussed earlier CNT has exceptional properties. Besides being light weight, CNT
also has excellent mechanical properties and is also a good electrical conductor. To further boost
the strength of the foam, polymers will be used as reinforcement to the CNT based foam. The
addition of polymers will not disrupt the already present network of CNT but instead will
compliment it by making it more rigid. As a result, the conductivity of the foam will be
preserved. In addition to this, the materials are also readily available in the current market.

6
The objectives of this work are to:
1. Fabricate a light weight, strong, conductive and porous nanocarbon foam/polymer
composite.
2. Study the effect of polymer concentration in the composite on the mechanical
performance of the composite foam.
3. Understand the structure-property relationship of the nanocarbon foam/polymer
composite.

7
CHAPTER 3
LITERATURE REVIEW
3.1. Carbon Foam
Large number of publications has been reported in the fabrication of foam or aerogel
structures using different materials such as metal, polymer and ceramics. A specific portion of
this massive knowledge base, which is carbon based foam, will be reviewed in this section.
Numerous methods and techniques have been employed to fabricate different carbon foam with
varying properties. Here, the different fabrication techniques and the resulting foams’ structure
and properties will be reviewed and summarized.
A team of researchers led by Worsley fabricated a low density, stiff and conductive CNT
foam. The foam was made by using carbon based nanoparticles to lock the single walled CNT
together. Organic sol-gel was used to incur polymerization between the junctions of CNT. These
organic binders are then converted to carbon through pyrolysis. The reported density of the foam
varies from 10 mg/cm3
to 100 mg/cm3 depending on the amount of materials used. The author
reports the stiffness modulus of the material ranging from 1 MPa to 10 MPa. However, the
strength of the material was not reported in this literature. The foam exhibits elastic behavior up
to 80% strain.[17]
Bradford et.al transformed a CNT arrays into a strong and flexible CNT foam via post
growth chemical vapor deposition (CVD). The fabrication of the CNT arrays were made via
nano-particle catalyzed synthesis on a silicon wafer using Al2O3 as the buffer and thick iron as
the catalyst in a tube furnace. The temperature was ramped and kept at 750oC for 25 minutes
while the flow of the growth gases; argon (Ar), hydrogen (H2) and ethylene (C2H4); were

8
regulated.
Then, the growth gases were replaced with just ethylene for 30 seconds. This step
increases the buildup of amorphous carbon which in turn inhibits the CNT growth within 30
seconds. The growth gases flow was resumed to ensure the CNT growth is stopped and the
furnace was cooled to room temperature under argon environment. Post CVD treatment was
carried out at different time span and the resulting foam exhibits flexibility and also high
strength. Depending on the post growth treatment time, the resulting density and strength varies.
A foam with post growth time of 155 minutes has a density of 179 mg/cm3. The strength at a
compression strain of 90% was reported to be 4.3 MPa.[18]
Figure 4: Stress-strain curves and Transmission Electron Microscopy (TEM)images for foams
made by Bradford et.al with varying post growth treatment time [18]
CNT foam with tunable size and shape were fabricated by Liu et.al through the low
temperature chemical fusion method using dextrose and citric acid.[19] Ammonium carbonate
which act as the foam forming agent were added to the mechanically crushed mixture of CNT,
dextrose and citric acid which were then mixed mechanically to obtain a homogenous solid

9
mixture. During this process, dextrose act as a carbon source while the carboxyl groups in citric
acid react with the hydroxyl groups in dextrose. Heat treatment results in the decomposition of
ammonium carbonate and also the citric acid and dextrose to create the porosity within the
structure. The foam strength was reported to be 1.39 MPa but the strain at which the stress value
was obtained was not reported in this literature. The foam also has a high accessible surface area
which makes it a good candidate for organic absorbers in waste management treatment.
A group led by Sun et.al fabricated a lightweight foam with a very low density of 56
mg/cm3. The foam was created by freeze drying CNT in an aqueous solution with giant
graphene oxide (GGO). Hydrazine vapor was introduced to convert the GGO into graphene
through chemical reduction. The mechanical testing result shows the foam being extremely
flexible. The stress value reported at 50% stain is in the region close to 7 kPa. Even though the
strength is rather low in general, the specific strength of the foam is high given its very low
density.[20]
Figure 5: Stress strain curve of multi cycle compression and the SEM image of the ultra-
lightweight foam by Sun et.al [21]
Lin et.al demonstrated the fabrication of CNT foam using nanoscale welding process.[21]
Precisely, CVD was used to synthesize this structure with ferrocene acting as the catalyst while

10
dichlorobenzene and methane act as the carbon source. During the CVD process, amorphous
carbon is deposited in situ generating amorphous carbon (AC) - CNT core shell structures and
welding at inter-CNT junctions. The resulting foam has a significantly higher density as
compared to other foams. The density of the foam was reported at 210 mg/cm3 and has a
compressive strength close to 13.5 MPa.
Figure 6: (a – c)SEM images of foam fabricated using dichlorobenzene supply rate of 0.1
mL/min, 0.3 mL/min and 0.7 mL/min. (d) Different types of welded junction within the foam [22]
An aerogel made from graphene and CNT were prepared by a group led by Zhang.
Hydrothermal reduction of graphene oxide and CNTs in the presence of ferrous ions (FeSO4
solution) was used in the preparation of this aerogel. The aerogel contains micron-sized pores
within the network of carbon and also the α-FeOOH nano rods within the matrix. The density of
this aerogel was reported to be ranging from 11 mg/cm3 to 87 mg/cm
3 depending on the amount
of ferrous ions used during the fabrication process. Mechanical testing shows that the aerogel is
not rigid. However, they are brittle and break at a certain strain. This is due to presence of rigid

11
α-FeOOH which decreases the ductility of the graphene-CNT aerogel. The compressive strength
of the aerogel was reported to be slightly less than 0.3 MPa for the aerogel with a density of 87
mg/cm3 at a strain of 50%.[22]
Sui et.al also fabricated a graphene-CNT aerogel but using a different technique. In this
case, super critical drying was employed. Two types of CNT were used in this work; pristine
MWCNT and acid treated MWCNT. In a typical simplified fabrication methodology, MWCNT
and graphene oxide (GO) suspension are mixed in distilled water and sonicated. Ascorbic acid
and hydrochloric acid were then added to the mixture with the latter helping to reduce the
reaction time between GO and ascorbic acid. The mixture is the heated to form the aerogel
precursors before being super critically dried with CO2 to form the graphene-CNT aerogel. The
density of the hybrid aerogel and the acid treated hybrid aerogel was reported to be 54.4 mg/cm3
and 31.8 mg/cm3 respectively. Compression test were carried out to determine the mechanical
properties of the aerogel. The result shows that the acid treated aerogel has a compressive
strength of 0.3 MPa while the regular aerogel has a compressive strength of close to 0.8
MPa.[23]
An ultralight weight graphene aerogel which has an average density of 4 mg/cm3 was
synthesized by Hu et.al. The foam was made by functionalizing the colloidal graphene oxide
using a weak reducing agent, ethylene diamine at an elevated temperature. The mixture is then
freeze dried to produce the functionalized graphene hydrogel which was subsequently exposed to
microwave irradiation in an inert environment to produce the final ultralight graphene aerogel.
The strength of the aerogel was reported to be 20 kPa at a stain level of 90%. The structure
shows good recoverability up to a strain of 90%.[24]

12
Figure 7: The aerogel being compressed up to 90% strain and the resulting stress strain curve
[25]
Qiu et.al fabricated a graphene-based cellular monolith structure imitating the hierarchal
structure of a cork. The fabrication process is similar to the one synthesized by Hu et.al except
that instead of microwave irradiation, dialysis in water was used to remove the soluble species.
The structure has a density of 5.1 mg/cm3 and strength value close to 20 kPa at a strain of 80%.
Similar to other foam structures discussed, this structure is also very elastic.[25]
On the other hand, Zhang et.al shows that graphene aerogel which is conductive and
mechanically strong can be synthesized using both supercritical drying and freeze drying of
hydrogel precursor derived from the reduction of graphene oxide and ascorbic acid. A variation
of aerogel exhibiting different densities were fabricated. The highest strength reported is 0.66
MPa for the aerogel with a bulk density of 96.1 mg/cm3.[26]
A high strength compact graphene macrostructure were developed by Bi et.al via a pH
mediated hydrothermal reduction coupled with the moulding method. The reported compressive
strength of this structure is 381 MPa but the strain at which the stress value is obtained is

13
unknown. Although the strength value is high, the density of this compact graphene is also high
at 1600 mg/cm3. [27]
3.2. Composite Foam
The first CNT/polymer composite was reported by Ajayan et.al whereby a mechanical
mixing technique was used to randomly disperse the CNT into a liquid epoxide-base resin.[28]
Thereafter, various other works pertinent to CNT/polymer composite have been reported. In
general, these works can be categorized into two parts; mixing and infiltration. Mixing can be
further subdivided into different processes which are solution process, melt blending and in-situ
polymerization of the monomers.[29]
In the solution process, polymers and CNT are dispersed in a solvent before being formed
into the desired shape. One of the earliest polymer-CNT composite foam was fabricated by Yang
et.al using this process. In their work, the CNT was dispersed in a polystyrene (PS) /toluene
solution which contains 5% foaming agent.[30] The solution is sprayed and heat treated before
being hot pressed resulting in the release of nitrogen gas within the composite due to the
decomposition of the foaming agent. These bubbles eventually create the CNT/PS composite.
The composite foam, which has a density of 560 mg/cm3, shows great potential as an
electromagnetic interference (EMI) shielding.[31] However, the mechanical properties of the
foam were not reported in this work. Similar approach using other different polymers such as
PMMA, nafion and polypropylene has also been reported.[6, 32-34]
The melt blending process is used only with thermoplastic polymers. In this process,
CNT is added and dispersed in the molten form of the thermoplastic polymer. One of the major
challenges of this process is achieving CNT uniformity due to the high viscosity of the molten

14
polymer. Park et.al demonstrated this process using ethylene vinyl acetate copolymer (EVA)
with MWCNT. The MWCNT is added to the molten EVA before being mixed in a two-roll mill
while the chemical blowing agent and crosslinking agent were added. The mixture is the put into
a mold before being foamed using the compression molding method.[35] Many other
CNT/polymer has been fabricated using the melt blending process. Some of the polymers that
has been reported are polycaprolacton, PMMA, polyethylene, polypropylene and poly[styrene-b-
(ethyleneco-butylene)-b-styrene] to list a few. [36-40] The emphasis of the composite foams
fabricated in this manner is more towards applications as transparent conductive coatings,
electrostatic dissipation, electrostatic painting and electromagnetic interference shielding.[41] As
a result the compressive strengths are not reported.
Figure 8: Graphical illustration of the infiltration process in foam composite fabrication
In situ polymerization is favorable for thermoset polymer but this method has also been
used extensively for thermoplastic. This method allows for uniform distribution of CNT due to
the low viscosity of the monomers.[4] Lee et.al used this process to fabricate a carbon nanofiber
(CNF)/MWCNT/polystyrene composite. This is prepared by adding the CNF/MWCNT to the PS
monomer and azobisisobutyronitrile (AIBN) which act as polymerization initiator. After the
completion of polymerization, batch foaming process was used to foam the mixture using
supercritical carbon dioxide as the blowing agent. The system were heated and pressurized for a

15
day before being rapidly cooled and depressurized to fix the foam cells.[42] The same method
was utilized by Kong et.al to fabricate a MWCNT/polyaniline (PANI).[43]
On the other hand, the infiltration process requires a CNT scaffold which allows the polymer to
fil the spaces within the scaffold as illustrated in Figure 8. To date, buckypaper and foams has
been used comprehensively for this purpose.[28] A group led by Gui developed an epoxy/CNT
composite using a CNT foam fabricated through chemical vapor deposition (CVD) as the
scaffold. Epoxy resin is used to fill all the spaces within the CNT foam resulting in a structure
that is dominated by epoxy in terms of weight. The resulting composite has a compressive
strength of 3 MPa at a strain rate of 7%. The density is not explicitly expressed in the literature
but calculation estimates the density to range from 800 mg/cm3
to 4000 mg/cm3.[44] Similar
apporaoch was implemented by Li et.al.[45] However, the weight percentage of CNT in this
method is very low resulting in a composite with high density.
Gui and co-workers used polydimethylsiloxane (PDMS) to create the composite.
Droplets of PDMS resin containing harderner were added to the CNT scaffold drop by drop. It
was carried out until saturation is achieved whereby all the pores are filled with PDMS. The
system were then cured to obtain the PDMS/CNT foam composite.[46] A team led by Worsley
used the same polymer but instead of adding droplets of PDMS, they immerse the foam into the
PDMS resin before curing the system.[47] The resulting composite show increased stiffness as
opposed to the neat foam.
Apart from CNT foam, graphene foam composite has also been widely studied by many
researchers. A group led by Feng produced a graphene oxide – epoxy composite aerogel via
freeze drying method.[48] Water soluble epoxy was added into the graphene oxide solution. The

16
mixture then undergoes freeze drying before being cured. The resulting composite exhibits a
very low density at 90 mg/cm3 and a compressive strength of 0.231 MPa at a strain of 75%.
Similar method was employed by using polyvinyl alcohol (PVA) by Zhang et.al and the resulting
composite which has a density of 102.89 mg/cm3 exhibits tensile strength of 3.48 MPa at
failure.[49]
Fan et.al fabricated a graphene aerogel - PMMA composite using the in situ bulk
polymerization.[50] The graphene aerogel was prepared using the Hummers Method followed by
the chemical reduction using L-ascorbic acid. The aerogel is then made into a graphene aerogel –
PMMA composite via in-situ bulk polymerization. The density and mechanical properties of
these composite aerogel is not reported in the literature. Similar techniques were employed by
other research groups to create graphene aerogel – PMMA composite.[50-53] The composites
exhibit improved thermal and electrical properties compared to the graphene aerogel by itself.
However, the mechanical properties were not reported.
Tang and co-workers fabricated an epoxy/graphene aerogel composite using the vacuum
impregnation process. The aerogel was prepared by in situ reduction-assembly method whereby
paraphenylene diamine (PPD) was utilized as the reducing agent and functionalization agent of
the graphene oxide. At a 0.95 epoxy volume percentage, the strength of the foam was increased
from 0.146 MPa to 0.75 MPa. This is also accompanied by a large increase in density due to the
high volume percentage of the epoxy. However, the density value is not reported explicitly in
this literature.[54]

17
3.3. Summary
Even though there are a lot of aerogel-polymer composite reported in the literature, the
applications of these reports are mostly for electromechanical interference (EMI) shielding,
sensors, actuators and electrodes. However, there are limited numbers of literatures or studies
that is directed towards developing CNT based foam or aerogel as a light weight and strong
material. This goes to show that, this idea of developing light weight and strong material using
foam and aerogel is novel and still unexplored. Table 1 summarizes the mechanical properties of
selected foams that have been discussed. As can be seen, the specific strength of the current
foams that have been reported is not very high compared to the currently available materials. The
only exception here is the in-situ welded foam fabricated by Lin et.al. The drawback for this
foam on the other hand is the fact that it was grown using CVD and as a result will not be
suitable for large sized fabrication. Thus, this method is not feasible for real world application.
Table 1: Summary of reported strength by various authors in literature
Type of Foam Density
(mg/cm3)
Compressive
Strength
Strain at
Reported
Strength
Specific
Strength
(kPa/(mg/cm3))
Author
(MPa) (%)
CNT 179 4.3 90 24.02 Bradford [18]
CNT N/A 1.39 Max N/A Liu [19]
Carbon 5.6 0.007 50 0.13 Sun [20]
CNT 210 13.5 50 64.29 Lin [21]
Graphene 4 0.02 90 5 Hu [24]
Graphene 5.1 0.02 80 3.92 Qiu 25]
Graphene 96.1 0.66 40 6.87 Zhang [26]
Graphene 1600 361 Max 238.13 Bi [27]
Graphene/CNT 87 0.3 47 3.45 Zhang [22]
CNT/Graphene 54.4 0.8 50 14.71 Sui [23]
CNT/Epoxy 4000 3 7 0.75 Gui [44]
Graphene/Epoxy N/A 0.75 10 N/A Tang [54]

18
CHAPTER 4
FABRICATION PROCESS
4.1. Nanocarbon Foam
The CNT foam is fabricated by using PMMA microspheres as template to create the
porous structure. Specifically, PMMA spheres are added together with the CNT during the
fabrication of the foam. After that, the spheres will be removed leaving spherical pores within
the foam. PAN is used to further reinforce the wall by locking the CNT in place and preventing
them from sliding.
The solid three-dimensional structure is subjected to two different heat treatments to form
the final foam. The first heat treatment is at 300oC in air. During this process, the PMMA spheres
are evaporated leaving empty spaces behind. This allows PAN to undergo oxidation by releasing
hydrogen and adding less volatile oxygen atoms. As a result a ladder structure is formed as can
be seen in Figure 9.
Figure 9: PAN oxidation process during the heat treatment at 300oC in air
This is followed by another heat treatment at a higher temperature of 1200oC in inert
environment. In this case, nitrogen gas is used to create the inert environment. During this step,

19
the carbonization process takes place whereby the oxygen and nitrogen are removed leaving only
carbon atoms behind.
The following graphic illustrates the fabrication process of the foam.
Figure 10: Graphical summary of the nanocarbon foam fabrication process
The detailed fabrication process is described below.
1. CNT is weighed and added into a beaker.
2. The required amount of PAN which was already dissolved in dimethylformamide
(DMF) to form a 1 wt% concentration solution is added into the beaker using a pipette.
3. Isopropyl alcohol (IPA) is added to the mixture to act as a medium for sonication.
4. The beaker is immersed into a bowl filled with iced water to keep the mixture from
overheating during sonication.
5. The mixture is sonicated using the Qsonica Q500 Sonicator for a total time of 20
minutes.
6. The mixture is taken out from the bowl and placed into a bath sonicator to ensure the
CNT is fully dispersed.

20
7. PMMA is weighed and added into the mixture and the mixture is sonicated for 10
minutes for the PMMA to be uniformly distributed in the mixture.
8. A vacuum filtration system is set up as shown in step 3 of Figure 10.
9. The mixture is poured into the filter and the vacuum valve is slowly turned on.
10. After most of the IPA has been removed, the vacuum valve is turned off and the filter
paper holding the sample is removed and covered up by another piece of filter paper.
11. The samples are left to dry overnight.
12. The sample is heated at 300oC in air for 3 hours using the MTI Corporation GSL-1700X
furnace.
13. The sample is heated at 1200oC in inert environment for an hour using the same furnace.
4.2. Nanocarbon Foam/Polymer Composite
The nanocarbon foam has a very low density. However, the strength is not as high as
expected. These will be further discussed in Chapter 5. To further boost the strength of the foam,
the walls of the foam are reinforced with the infiltration of polymer. The addition of polymer
will act as a stiff coating around the CNTs which prevents the CNTs from buckling when
subjected to external force. The density of the foam is expected to increase but the notion is to
increase the strength of the foam more than the increase in weight.
The amount of polymer being infiltrated into the foam and ultimately the density of the
composite foam is controlled by using polymer solution with different concentration. The
polymer is transported into the foam by the solvent through capillarity or capillary forces.
Getting a uniform distribution of polymer can be a challenge especially with higher
concentration polymer solution due to the high viscosity.

21
The polymer used thus far in the research is PMMA. PMMA is chosen because it
possesses good mechanical properties in terms of strength. The ultimate tensile strength of
PMMA typically ranges from 47MPa to 70MPa [57] On top of that, it also has a relatively low
density as compared to other polymers at around 1150mg/cm3 to 1190mg/cm
3. Besides that, the
cost of PMMA is also low making it ideal for mass production.
The following graphic provides an overview of the nanocarbon foam/polymer composite
foam fabrication process.
Figure 11: Graphical summary of the composite foam fabrication process
The fabrication of the nanocarbon foam/polymer composite is described in detail here.
1. The required amount of the polymer is weighed and added into a glass jar.
2. The required amount of solvent is added into the glass jar to form a 5 wt%, 10 wt%, 15
wt% and 20 wt% polymer concentration.

22
3. The mixture is stirred continuously using a magnetic stir bar at different temperature
dependent upon the polymer and solvent used.
4. The foam is cut into a 5 mm x 5 mm size sample using the Universal Versalaser VLS
2.30 laser machine.
5. The sample is immersed into the polymer solution for an hour to coat polymers around
the CNTs.
Figure 12: Foam infiltration process
6. The sample is removed from the solution and the surface is cleaned using a dry tissue
paper.
7. The composite sample is left to dry for 3 hours inside a tube which is attached to the shaft
of a motor rotating at speed of 20 rpm to ensure uniform distribution of polymer and
prevent the polymer from settling down due to gravity.

23
Figure 13: Rotational drying to ensure uniformity in polymer infiltration
8. The composite sample is heated using Thermo Scientific Lab-Line Vacuum oven in a
vacuum environment to a temperature below the boiling point of the solvent for a time
period dependent upon the solvent used.
Figure 14: A) Illustration on how the CNTs are held together at the joint by PAN in the
nanocarbon foam and how polymer coats the CNTs in the composite foam B) Image of
nanocarbon foam cut into various size and shapes.
Nano Carbon Foam Composite Foam

24
CHAPTER 5
RESULTS AND DISCUSSIONS
5.1. Nanocarbon Foam
The structure and morphology of the nanocarbon foam was characterized with scanning
electron microscopy (SEM). The SEM images at different magnification are shown in Figure 15.
Figure 15: SEM images at different magnification level showing the structure of the nanocarbon
foam. The magnification levels are: A) X350 B) X2000 C) X5000 D) X10000
As can be seen in the SEM images, the foam is extremely porous. The pores in the foam
were created by the PMMA spheres which have been burnt off resulting in the porous structure.

25
The size of the pores ranges from 8 to 11 micrometer. This is the size of the PMMA sphere used
in the fabrication of the foam. The size of the pores can be engineered to be larger or smaller by
using PMMA spheres of a different size.
Mechanical test was carried out on the nanocarbon foam using the Shimadzu AGS-J
mechanical test machine. A load cell with a maximum capacity of 500N was used in the testing.
The foam is compressed initially to 60% strain. After that, compression test at strain ranging
from 10% to 70% with increment of 20% is performed on the foam sample. The stress, strain and
density are calculated using the following formulas.
� = �
� = � − �ₒ�ₒ
� = ��
The result of the test is shown in the stress-strain curve in Figure 16. The density of the
foam is 26.42 mg/cm3. As can be seen, the foam shows very high compressibility and flexibility.
Even when subjected to a very high strain, the foam is able to recover back to its initial state. The
stress at 70% strain is a little above 0.6 MPa while the stress at 50% is 0.25 MPa which could be
further improved comparing to other materials and structures available today..

26
Figure 16: Stress-strain curve of the nanocarbon foam with a density of 26.42 mg/cm
3 at different
strain
The strength of the foam with respect to other materials in term of density is shown as the
red star in the Ashby Plot in Figure 17. The strength reported here is at 50% strain.
Figure 17: The strength of the nanocarbon foam as compared to other materials
27
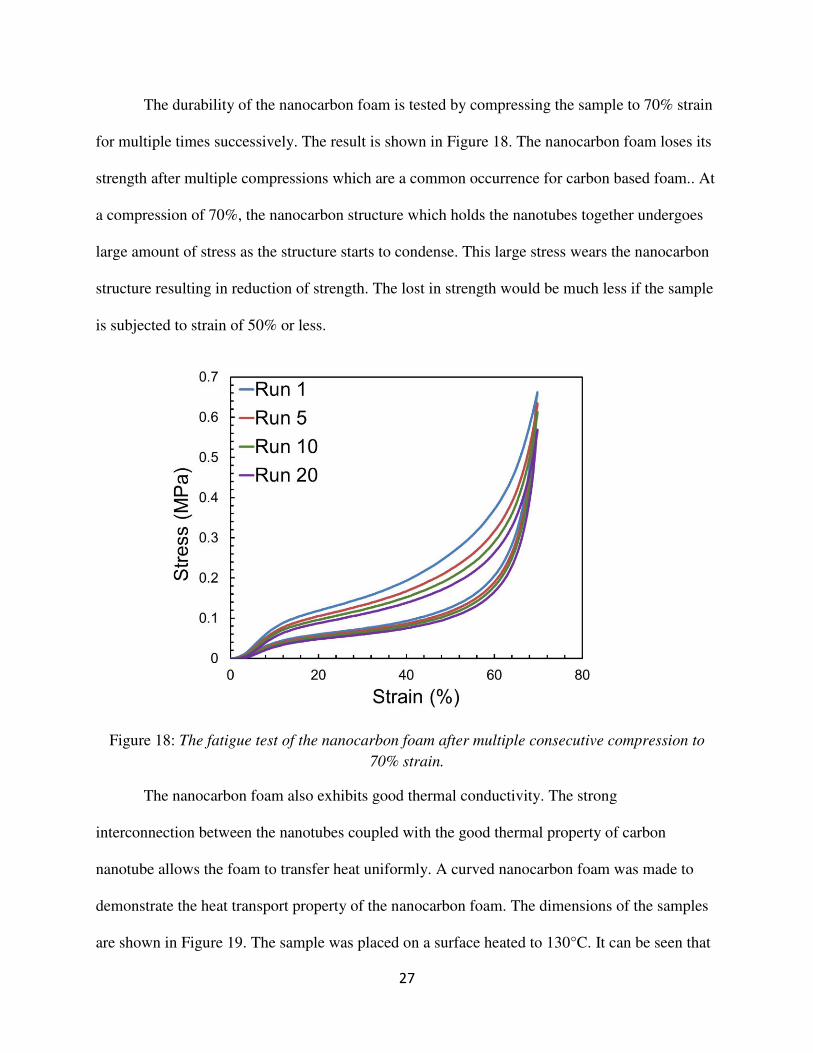
The durability of the nanocarbon foam is tested by compressing the sample to 70% strain
for multiple times successively. The result is shown in Figure 18. The nanocarbon foam loses its
strength after multiple compressions which are a common occurrence for carbon based foam.. At
a compression of 70%, the nanocarbon structure which holds the nanotubes together undergoes
large amount of stress as the structure starts to condense. This large stress wears the nanocarbon
structure resulting in reduction of strength. The lost in strength would be much less if the sample
is subjected to strain of 50% or less.
Figure 18: The fatigue test of the nanocarbon foam after multiple consecutive compression to
70% strain.
The nanocarbon foam also exhibits good thermal conductivity. The strong
interconnection between the nanotubes coupled with the good thermal property of carbon
nanotube allows the foam to transfer heat uniformly. A curved nanocarbon foam was made to
demonstrate the heat transport property of the nanocarbon foam. The dimensions of the samples
are shown in Figure 19. The sample was placed on a surface heated to 130°C. It can be seen that

28
it takes slightly more than one second for the heat to transfer from the edge of the sample to the
whole sample uniformly. The cooling effect is also similar as demonstrated.
Figure 19: The heating and cooling between room temperature and 130°C of a curved
nanocarbon foam to demonstrate its heat transfer effectiveness.

29
Square nanocarbon foams with varying thickness was made and was placed on the
surface of a heater at a temperature of 200°C and the temperature change of the foam was
observed. The result is shown in Figure 20. All the foam was able to heat up and stabilize very
quickly. Thinner foams were able to reach temperature closer to that of the surface compared to
thicker foams. This is due to the cooling that is taking place on the sides of the thicker foams due
to the larger surface area resulting from the thickness in addition to the top surface cooling which
is taking place for all the foams.
Being very lightweight, the contact between the foam and the heater surface is not good.
This is another factor that contributes to the temperature difference between the heater and the
foam. The temperature can also be seen to be fluctuating around a mean temperature. This is
because the temperature reading is taken over a range of area covering the nanocarbon foam
which is being cooled by the air and heated by the surface simultaneously.
Figure 20: Temperature change of nanocarbon foams with varying thickness when placed on
surface heated to 200°C

30
5.2. Nanocarbon Foam/PMMA Composite
To boost the mechanical properties of the nanocarbon foam, polymer is introduced into it.
The most important aspect in keeping the density of the composite foam low is maintaining the
presence of porosity. In fabricating the composite, it is important to ensure that polymer does not
fill up the pores within the nanocarbon foam.
The SEM images in Figure 21 show the structure change of the nanocarbon foam after
the infiltration of PMMA. As can be observed, the pores of the foam are preserved while this
wall of the pores has become visibly thicker upon the infiltration. This is precisely the kind of
final outcome that was intended.
Figure 21: SEM images showing the structure of the foam before and after polymer infiltration
To check for uniformity in the infiltration, the sample was cut into half in the thickness
direction and the cross section was analyzed using SEM. Figure 22 shows the SEM images of the
foam at different location on the cross sectional area at a varying magnification level.

31
Figure 22: SEM images showing polymer concentration at different location within the
composite foam
As can be seen, the infiltration is uniform across the cross sectional area. Although
getting the polymer through the center of the foam was an issue initially for high concentration
polymer solution due to high viscosity, the problem was mitigated with the use of heat during the
infiltration process. The presence of heat excites the molecules by inducing kinetic energy
resulting in the solution being less viscous.
A
B
C

32
Mechanical tests were carried out on the composite foam. The tests follow a procedure
similar to the one carried out on the nanocarbon foam whereby the composite foam is subjected
to compression test at varying strain ranging from 10% to 70% with increment of 20%. Again,
the Shimadzu AGS-J mechanical test machine was used to carry out the testing using a load cell
with a maximum capacity of 500N.
Figure 23 to Figure 28 show the stress-strain curve derived from the mechanical test
results for the composite foam prepared by using different PMMA solution with concentration
of; 1 wt%, 3 wt%, 5wt%, 10 wt%, 15 wt% and 20 wt% respectively. The axis of the plot is
scaled equally to explicitly show the difference in the stress values for each sample. Different
concentration results in different density of the composite foam. The density values are labelled
in the figure caption.
Figure 23 : Stress-strain curve for composite foam made from 1 wt% polymer concentration
which has a density of 41 mg/cm3

33
Figure 24 : Stress-strain curve for composite foam made from 3 wt% polymer concentration
which has a density of 60 mg/cm3
Figure 25: Stress-strain curve for composite foam made from 5 wt% polymer concentration
which has a density of 88 mg/cm3

34
Figure 26: Stress-strain curve for composite foam made from 10 wt% polymer concentration
which has a density of 118 mg/cm3
Figure 27: Stress-strain curve for composite foam made from 15 wt% polymer concentration
which has a density of 206 mg/cm3

35
Figure 28: Stress-strain curve for composite foam made from 20 wt% polymer concentration
which has a density of 332 mg/cm3
The plots show that the composite foam has changed from elastic behavior to a more
rigid and deformable behavior. When subjected to an external force, the composite foam does
not return to initial shape or specifically height in this case. This is due to the presence of PMMA
enclosing the CNTs. The PMMA make the structure stiffer by preventing the CNTs from
bending when being compressed.
From the plots, it can also be deduced that the stress increases as the density increases.
This means that as more and more polymers are being infiltrated into the foam, the strength of
the foam keep increases as a result of thicker polymer coating around the CNTs. This result is
expected and also repeatable. The strength against density plot for multiple replications is shown
in Figure 29.
36
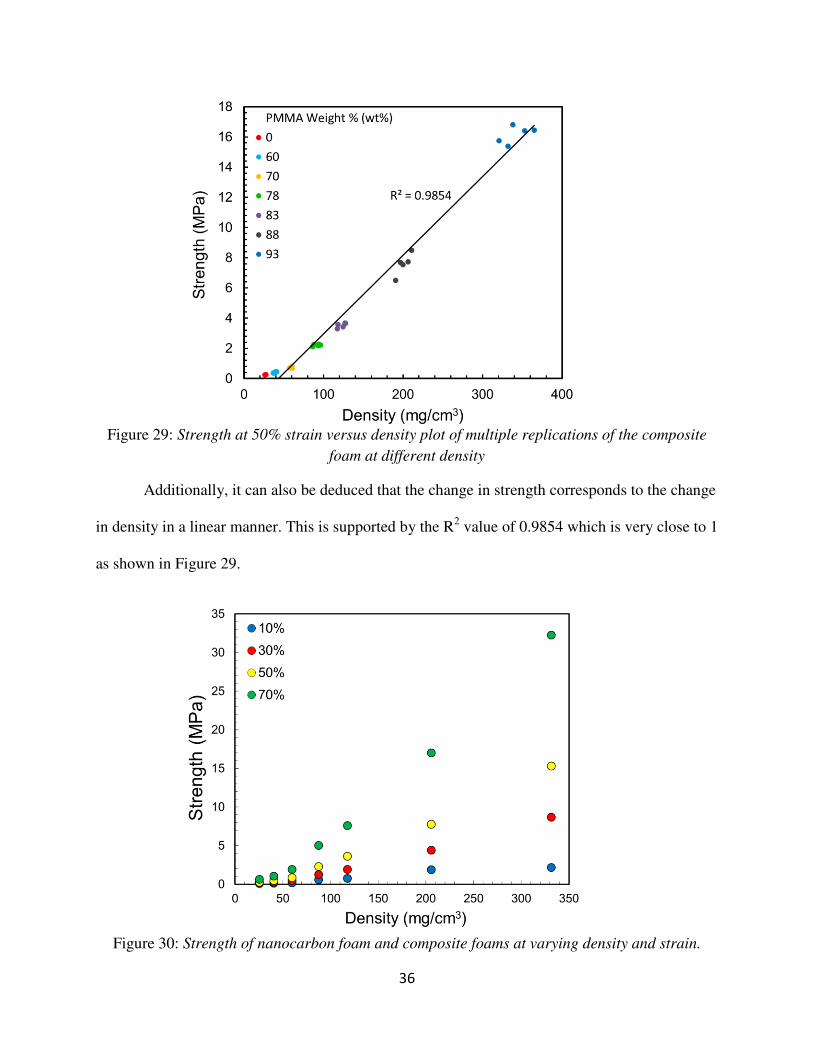
Figure 29: Strength at 50% strain versus density plot of multiple replications of the composite
foam at different density
Additionally, it can also be deduced that the change in strength corresponds to the change
in density in a linear manner. This is supported by the R2 value of 0.9854 which is very close to 1
as shown in Figure 29.
Figure 30: Strength of nanocarbon foam and composite foams at varying density and strain.

37
The strength of the nanocarbon foam and composite foams at different densities are
plotted explicitly at different strain level in Figure 30. As expected, the strength increases with
density and also strain.
However, the more important question to address is how much of an increase in strength
is acquired for a unit increase in mass. In order to fully understand this phenomenon, the specific
strength of the material needs to be calculated. The formula is as follow.
= ��
The specific strength of the nanocarbon foam, the composite foam and all its replicates
are plotted against density and is shown in Figure 31. The specific strength increases gradually as
the density increases up to 200 mg/cm3. Thereafter, the increase is not as rapid and the specific
strength seems to flatten.
To prove this, a trendline to fit all the data points are added. As shown in the plot, a
polynomial trendline has a R2 value of 0.9762. On the other hand, a logarithmic trendline has a
R2 value of 0.9574 when fitted to the same data points. A logarithmic trendline corresponds to
data points that increase quickly to a certain extent before flattening or levelling out. On the
other hand, a second degree polynomial resembles data that increases to a certain point before it
starts to decrease.
Therefore, based on the R2 values for both logarithmic and second degree polynomial, it
can be predicted that the specific strength of the composite foam will decrease upon further
infiltration of polymer.
.

38
Figure 31: Specific strength at 50% strain versus density plot for the composite foam
Similar trend can be observed when looking at the stress data at 70% strain. This plot is
shown in Figure 32.
Figure 32: Specific strength at 70% strain versus density plot for the composite foam

39
The strength at 50% compression versus density of the composite samples are plotted
against other materials and shown in Figure 33.
Figure 33: Strength at 50% strain versus density for composite samples against other available
materials
The results plotted in Figure 33 would be even higher if the strength data are plotted at
70% strain. It can be seen that, nanocarbon foam/polymer composite demonstrates its ability to
be used as a lightweight and strong material.
PMMA is a thermoplastic polymer. Heating the composite sample to around the glass
transition temperature range of PMMA would theoretically allow the composite sample to return
to its initial state. Differential scanning calorimeter (DSC) was carried out on the PMMA to
determine its glass transition temperature. Thermogravimetric analysis (TGA) was used to
determine the decomposition temperature of the PMMA so that the temperature applied on the
composite sample does not exceed this temperature.

40
Figure 34: DSC analysis for PMMA polymer to determine its glass transition temperature
Figure 34, it can be seen that the glass transition temperature is around 130oC. The TGA
results displayed in Figure 35 show the decomposition temperature of PMMA is around 320oC.
Figure 35: TGA analysis of PMMA polymer to determine its decomposition temperature

41
The composite foam demonstrates full strain recovery when heated to a temperature
above 130oC. Beyond the glass transition temperature, PMMA assumes a soft and rubbery
behavior. The nanotubes, which are still surrounded by PMMA are able to rebound and exhibits
its elasticity by overcoming the force applied by the enclosing PMMA upon the reduction in
Young’s modulus of PMMA.
Figure 36: Rigidity of the composite foam at different temperature. At room temperature, the
composite foam is able to withstand the mass of 900 g while at 30°C but undergoes recoverable
deformation at temperature beyond the Tg of PMMA.
Compression test was carried out on the composite foam at 140°C. The result is plotted
together with the compression test result for the nanocarbon foam at room temperature in Figure
37. As can be seen, the strength of the composite of foam is similar to the nanocarbon foam. The
slight difference could be the result of the rubbery PMMA which is still surrounding the
nanotubes. The difference gets larger at higher strain as the composite foam densified much
quicker due to the larger volume of material present within the structure.
Besides that, the hystereses are also different for both of the foams. The energy lost in the
composite foam is larger compared the nanocarbon foam. This is due to the larger internal
friction resulting from the presence of more in the composite foam.

42
Figure 37: Stress-strain curve for compression tests on composite foam made from 5 wt%
polymer concentration at 140°C and nanocarbon foam at room temperature and at 140°C
Figure 38: Compression test on composite foam with density of 332mg/cm3 after being healed
with the use of heat

43
A composite sample with a density of 332mg/cm3 was compressed to 70% strain. The
deformed sample is healed using heat and the sample is retested to the same strain while the
stress values are recorded. The result for two consecutive healing is shown in Figure 38. The
composite foam loses its strength each time it is compressed. One possible reason is the
formation of stress induced micro-crack which is formed when the PMMA layer deform under
the compression. The presence of micro crack decreases the stiffness of the material.[55]
Another factor that contributes to the reduction in strength is fatigue of the nanocarbon foam
itself. As shown in Figure 18, the nanocarbon foam loses its strength over time upon multiple
compressions.
The electrical property of the composite foam with varying amount of polymers is tested
using a multimeter via the two probe resistivity test. The foam is cut into a cuboid and infiltrated
with PMMA. After drying, the sides of the samples are painted with silver paste to form
electrical contacts as shown in
Figure 39. The resistance of each sample with it corresponding density are shown in Table 2.
Figure 39 : Graphical illustration of electrical testing

44
Table 2: Resistance of composite foams with varying density
Remark Area
(mm2)
Length
(mm)
Weight
(mg)
Density
(mg/cm3)
Resistance
Ω
Nano Carbon
Foam 3.612 5.74 0.49 23.63 5.8
Nano Carbon
Foam 3.8243 5.74 0.6 27.33 5.9
Nano Carbon
Foam 3.4496 5.8 0.48 23.99 6.4
Composite
Foam 3.6936 5.71 1.61 76.34 5.8
Composite
Foam 3.8304 5.27 1.86 92.14 5
Composite
Foam 3.8586 5.69 1.78 81.07 6
Composite
Foam 3.4776 5.63 2.58 131.77 6
Composite
Foam 3.5588 5.62 3.12 156 6
Composite
Foam 3.4475 5.68 2.84 145.03 6.1
Composite
Foam 3.69 5.59 3.95 191.5 6.1
Composite
Foam 3.11043 5.1 4.34 273.59 5.4
Composite
Foam 3.5119 5.75 4.43 219.38 6.1
Resistance of a material varies with its physical dimension. A same material with
different sizes will have different resistance. To be able to compare the PMMA effect on the
electrical property of the foam, resistivity which is an intrinsic property of material will be
calculated. Resistivity, r is defined as:
� = ��
where R, A and L corresponds to the resistance of the material in Ω, area of the material in m2
and length of the material in m.

45
Having calculated the resistivity, the conductivity, κ which is a more commonly used
parameter in comparing the electrical property of materials could be determined using the
following relationship.
� = 1�
The resistivity and conductivity for the samples are calculated and displayed in Table 3.
Table 3: Resistivity of composite foams with varying density
Remark Density (mg/cm3) Resistivity (Ohm·m) Conductivity (Siemens/m)
Nano Carbon Foam 23.63395727 0.003649756 273.9909115
Nano Carbon Foam 27.33300649 0.003930901 254.3946228
Nano Carbon Foam 23.99078754 0.003806455 262.7116187
Composite Foam 76.33784684 0.003751818 266.537459
Composite Foam 92.14212001 0.003634156 275.1670844
Composite Foam 81.07332335 0.004068822 245.7713506
Composite Foam 131.7745931 0.003706146 269.8220995
Composite Foam 155.9964433 0.003799431 263.1973324
Composite Foam 145.0326323 0.003702421 270.0935579
Composite Foam 191.4956538 0.004026655 248.3451064
Composite Foam 273.5893083 0.003293396 303.6379036
Composite Foam 219.3783373 0.003725668 268.408255
The averages of the tabulated data are plotted in Figure 40. As can be seen from the
result, the amount of PMMA infiltrated into the foam has little effect on the conductivity. The
variations in conductivity that is presence in the result are induced by the error in the
measurement of the physical dimension of the samples. As the dimensions are in the millimeter
scale, getting an exact dimension of the sample is hard to achieve. An error in 0.1 mm in the
measurement of either one side of the area contributes to an approximately 5% change in the
conductivity value while and error of 0.1 mm in the length measurement could bring about a

46
change in about 2% of the conductivity value. Besides that, the presence of contact resistant is
another factor that contributes to the discrepancies.
Figure 40 : Conductivity of nanocarbon foams and composite foams at varying density
The conductivity does not change with the addition of polymers due to the fact that the
infiltrated polymer does not disrupt the network of CNT formed during the foam fabrication. The
polymer added does not break the networked formed but encloses the surface of the network
resulting in the conductivity being unaltered
.
5.3. Nanocarbon Foam/SEBS Composite
The possibility of improving the mechanical strength of the nanocarbon foam keeping it
elastic is explored in this section. Lightweight, strong, conductive, and highly elastic properties
are desired for applications such as pressure sensors, strain sensors, wearable electronics, energy
absorptions and many more. As has been discussed, the nanocarbon foam is elastic and highly

47
compressible. In order to preserve and compliment this, a polymer that is also elastic should be
used. The PMMA composite foam is stiff because PMMA forms a stiff layer around the CNTs.
Replacing PMMA with a highly elastic polymer would increase the mechanical strength and at
the same time preserve the elasticity of the foam. An ideal polymer for this purpose is styrene-
ethylene-butylene-styrene copolymer (SEBS). SEBS which is widely used in medical devices,
sports equipment, toys and many others is strong and highly elastic.[56, 57]
Figure 41: Stress-strain curve for composite foam made from 20 wt% SEBS concentration which
has a density of 172 mg/cm3
To achieve the goal of increasing the strength of the nanocarbon foam while maintaining
its elasticity, SEBS will be infiltrated into the nanocarbon foam using the same techniques as the
PMMA composite foam. The stress-strain plot for a SEBS composite foam with a density of 172
mg/cm3 is shown in Figure 41.
As can be seen, the composite foam exhibits elasticity. Although it does not return to its
initial height in real time, the thickness is recoverable over a period of time. The next plot shows

48
how the mechanical strength of the SEBS composite compares with the strength of the
nanocarbon foam at 50% strain.
Figure 42: Strength at 50% strain versus density plot of multiple replications of the SEBS
composite foam at different density
Based on the strength against density plot, the addition of SEBS does not increase the
strength of the composite right away which is opposite to the initial hypothesis. To understand
this, the mechanical property of the SEBS polymer is analyzed. The stress-strain curve is shown
in Figure 43.
The elastic modulus for the SEBS polymer is 0.14 MPa which is smaller than the elastic
modulus of the nanocarbon foam which is close to 0.5 MPa. To plateau in the strength could be
explained by the Rule of Mixture. It is important to note that this rule is best catered for a fiber
matrix composite. However, we could use it to theoretically illustrate how the elastic modulus of
a composite is dictated by the modulus of its constituent starting materials.

49
Figure 43: Stress-strain curve of SEBS polymer which has a density of 940 mg/cm
3
According to the rule of mixture, the elastic modulus of the composite can go as high as;
� = �( �) + 1 − � �
where Ec, Ef, Em are the elastic modulus of the composite, fiber and matrix respectively while f is
the volume fraction of the fiber. In this case, the nanocarbon foam can be assumed to be the fiber
while SEBS can be assumed as the matrix. Since we know Ef is larger than Em, hence Ec is
maximized when f is equal to one. Physically, it means the composite will have the highest
elastic modulus when there is not any SEBS. Despite the addition of SEBS, nanocarbon foam
still act as the load carrying member in this composite system due to its higher elastic modulus.
However, as more and more SEBS are added, the pores within the foam start to fill up
resulting in a smaller space. As a result, the foam begins to densify earlier when compressed.

50
This is why we can see that the strength of the composite foam increases going from SEBS
weight percentage of 65% to 85% as seen in Figure 42.

51
CHAPTER 6
CONCLUSION
The need for lightweight materials which are strong and exhibits additional desirable
properties for application in fields such as aerospace and automotive has prompt researchers to
create a new, improved structure. In this work, a unique and ultra-light weight nanocarbon foam
with tunable properties such porosity and density were fabricated using CNT. Polymer spheres
were used to act as a template to generate the pores. The nanocarbon foam holds various
advantages compared to aerogels fabricated using other materials like metals, ceramics and
polymer. Some of the advantages include its structure being stable up to 500oC, it is not
corrosive over time, it is electrically and thermally conductive and it is extremely elastic. The
nanocarbon foam has a mechanical strength which is high in comparison with other available
material within the same density range.
To further boost the mechanical strength or more precisely the specific strength of the
nanocarbon foam, PMMA was infiltrated into the nanocarbon foam to create a new composite
foam. By depositing PMMA onto the walls of the nanocarbon foam, the foam was able to keep
the weight low and at the same time increase the mechanical strength of the structure. The
composite sample loses its elasticity but remarkably, the deformation undergone by the
composite foam is recoverable with the use of heat. The electrical conductivity of the composite
foam is unaltered despite the presence of the nonconductive polymer. Hence, we have devised
and proved the feasibility of fabricating a lightweight, strong, conductive healable structure using
carbon nanomaterial and polymer.

52
REFERENCES
1. Gibson, L.J. and M.F. Ashby, Cellular solids: structure and properties. 1997: Cambridge
university press.
2. Allen, H.G., Analysis and Design of Structural Sandwich Panels: The Commonwealth
and International Library: Structures and Solid Body Mechanics Division. 2013:
Elsevier.
3. Ramsey, S., NASA Selects Proposals for Ultra-Lightweight Materials for Journey to
Mars and Beyond.
4. Lee, L.J., et al., Polymer nanocomposite foams. Composites science and technology,
2005. 65(15): p. 2344-2363.
5. Dong, X., et al., 3D graphene foam as a monolithic and macroporous carbon electrode
for electrochemical sensing. ACS applied materials & interfaces, 2012. 4(6): p. 3129-
3133.
6. Zeng, C., et al., Synthesis and processing of PMMA carbon nanotube nanocomposite
foams. Polymer, 2010. 51(3): p. 655-664.
7. Han, X.-H., et al., A review of metal foam and metal matrix composites for heat
exchangers and heat sinks. Heat Transfer Engineering, 2012. 33(12): p. 991-1009.
8. Zhao, C., Review on thermal transport in high porosity cellular metal foams with open
cells. International Journal of Heat and Mass Transfer, 2012. 55(13): p. 3618-3632.
9. Studart, A.R., et al., Processing routes to macroporous ceramics: a review. Journal of the
American Ceramic Society, 2006. 89(6): p. 1771-1789.
10. Iijima, S., Helical microtubules of graphitic carbon. nature, 1991. 354(6348): p. 56-58.
11. Thostenson, E.T., Z. Ren, and T.-W. Chou, Advances in the science and technology of
carbon nanotubes and their composites: a review. Composites science and technology,
2001. 61(13): p. 1899-1912.
12. Mittal, V., Polymer Nanotubes Nanocomposites: Synthesis, Properties and Applications.
2014: John Wiley & Sons.
13. Al-Saleh, M.H. and U. Sundararaj, Review of the mechanical properties of carbon
nanofiber/polymer composites. Composites Part A: Applied Science and Manufacturing,
2011. 42(12): p. 2126-2142.

53
14. What Are The Physical Properties Of Carbon Nanotubes?
. [cited 2015 9/15/2015]; Available from: http://nanogloss.com/nanotubes/what-are-the-
physical-properties-of-carbon-nanotubes/#axzz3oWW47uos.
15. Youssef, K.M., et al., A novel low-density, high-hardness, high-entropy alloy with close-
packed single-phase nanocrystalline structures. Materials Research Letters, 2015. 3(2):
p. 95-99.
16. Ashby, M.F., Materials Selection in Mechanical Design. 2010: Butterworth-Heinemann.
17. Worsley, M.A., et al., Mechanically robust and electrically conductive carbon nanotube
foams. Applied Physics Letters, 2009. 94(7): p. 073115.
18. Bradford, P.D., et al., Tuning the compressive mechanical properties of carbon nanotube
foam. Carbon, 2011. 49(8): p. 2834-2841.
19. Liu, Y., et al., Synthesis of porous carbon nanotubes foam composites with a high
accessible surface area and tunable porosity. Journal of Materials Chemistry A, 2013.
1(33): p. 9508-9516.
20. Sun, H., Z. Xu, and C. Gao, Multifunctional, ultra‐flyweight, synergistically assembled
carbon aerogels. Advanced Materials, 2013. 25(18): p. 2554-2560.
21. Lin, Z., et al., In-Situ Welding Carbon Nanotubes into a Porous Solid with Super-High
Compressive Strength and Fatigue Resistance. Scientific reports, 2015. 5.
22. Zhang, M., et al., Synthesis of a multifunctional graphene–carbon nanotube aerogel and
its strong adsorption of lead from aqueous solution. Rsc Advances, 2013. 3(43): p.
21099-21105.
23. Sui, Z., et al., Green synthesis of carbon nanotube–graphene hybrid aerogels and their
use as versatile agents for water purification. Journal of Materials Chemistry, 2012.
22(18): p. 8767-8771.
24. Hu, H., et al., Ultralight and highly compressible graphene aerogels. Advanced
materials, 2013. 25(15): p. 2219-2223.
25. Qiu, L., et al., Biomimetic superelastic graphene-based cellular monoliths. Nature
communications, 2012. 3: p. 1241.
26. Zhang, X., et al., Mechanically strong and highly conductive graphene aerogel and its
use as electrodes for electrochemical power sources. journal of materials chemistry,
2011. 21(18): p. 6494-6497.
27. Bi, H., et al., Low temperature casting of graphene with high compressive strength.
Advanced Materials, 2012. 24(37): p. 5124-5129.

54
28. Ajayan, P., et al., Aligned carbon nanotube arrays formed by cutting a polymer resin—nanotube composite. Science, 1994. 265(5176): p. 1212-1214.
29. Sun, X., et al., Developing polymer composite materials: carbon nanotubes or graphene?
Advanced Materials, 2013. 25(37): p. 5153-5176.
30. Yang, Y., et al., Novel carbon nanotube-polystyrene foam composites for electromagnetic
interference shielding. Nano letters, 2005. 5(11): p. 2131-2134.
31. Xu, X.B., et al., Ultralight Conductive Carbon‐Nanotube–Polymer Composite. Small,
2007. 3(3): p. 408-411.
32. Yang, Y., et al., Conductive carbon nanofiber–polymer foam structures. Advanced
materials, 2005. 17(16): p. 1999-2003.
33. Luo, C., et al., Flexible carbon nanotube− polymer composite films with high
conductivity and superhydrophobicity made by solution process. Nano letters, 2008.
8(12): p. 4454-4458.
34. Manchado, M.L., et al., Thermal and mechanical properties of single-walled carbon
nanotubes–polypropylene composites prepared by melt processing. Carbon, 2005. 43(7):
p. 1499-1505.
35. Park, K.W. and G.H. Kim, Ethylene vinyl acetate copolymer (EVA)/multiwalled carbon
nanotube (MWCNT) nanocomposite foams. Journal of applied polymer science, 2009.
112(3): p. 1845-1849.
36. Thomassin, J.-M., et al., Foams of polycaprolactone/MWNT nanocomposites for efficient
EMI reduction. Journal of Materials Chemistry, 2008. 18(7): p. 792-796.
37. Jin, Z., et al., Poly (vinylidene fluoride)-assisted melt-blending of multi-walled carbon
nanotube/poly (methyl methacrylate) composites. Materials Research Bulletin, 2002.
37(2): p. 271-278.
38. McNally, T., et al., Polyethylene multiwalled carbon nanotube composites. Polymer,
2005. 46(19): p. 8222-8232.
39. Seo, M.-K. and S.-J. Park, Electrical resistivity and rheological behaviors of carbon
nanotubes-filled polypropylene composites. Chemical Physics Letters, 2004. 395(1): p.
44-48.
40. Li, Y. and H. Shimizu, Toward a stretchable, elastic, and electrically conductive
nanocomposite: morphology and properties of poly [styrene-b-(ethylene-co-butylene)-b-
styrene]/multiwalled carbon nanotube composites fabricated by high-shear processing.
Macromolecules, 2009. 42(7): p. 2587-2593.

55
41. Spitalsky, Z., et al., Carbon nanotube–polymer composites: chemistry, processing,
mechanical and electrical properties. Progress in polymer science, 2010. 35(3): p. 357-
401.
42. Shen, J., C. Zeng, and L.J. Lee, Synthesis of polystyrene–carbon nanofibers
nanocomposite foams. Polymer, 2005. 46(14): p. 5218-5224.
43. Kong, L.-B., et al., MWNTs/PANI composite materials prepared by in-situ chemical
oxidative polymerization for supercapacitor electrode. Journal of Materials Science,
2008. 43(10): p. 3664-3669.
44. Gui, X., et al., A facile route to isotropic conductive nanocomposites by direct polymer
infiltration of carbon nanotube sponges. ACS nano, 2011. 5(6): p. 4276-4283.
45. Li, Y., et al., Preparation of carbon nanotubes/epoxy composites using novel aerogel
substrates. Materials Letters, 2015. 160: p. 432-435.
46. Gui, X., et al., Soft, highly conductive nanotube sponges and composites with controlled
compressibility. ACS nano, 2010. 4(4): p. 2320-2326.
47. áSatcher Jr, J.H., Stiff and electrically conductive composites of carbon nanotube
aerogels and polymers. Journal of Materials Chemistry, 2009. 19(21): p. 3370-3372.
48. Ye, S., J. Feng, and P. Wu, Highly elastic graphene oxide–epoxy composite aerogels via
simple freeze-drying and subsequent routine curing. Journal of Materials Chemistry A,
2013. 1(10): p. 3495-3502.
49. Zhang, L., et al., High strength graphene oxide/polyvinyl alcohol composite hydrogels.
Journal of Materials Chemistry, 2011. 21(28): p. 10399-10406.
50. Fan, Z., et al., Advanced multifunctional graphene aerogel–Poly (methyl methacrylate)
composites: Experiments and modeling. Carbon, 2015. 81: p. 396-404.
51. Yuan, X., et al., Improved properties of chemically modified graphene/poly (methyl
methacrylate) nanocomposites via a facile in-situ bulk polymerization. Express Polymer
Letters, 2012. 6(10): p. 847-858.
52. Kuila, T., et al., Characterization and properties of in situ emulsion polymerized poly
(methyl methacrylate)/graphene nanocomposites. Composites Part A: Applied Science
and Manufacturing, 2011. 42(11): p. 1856-1861.
53. Aldosari, M.A., A.A. Othman, and E.H. Alsharaeh, Synthesis and characterization of the
in situ bulk polymerization of PMMA containing graphene sheets using microwave
irradiation. Molecules, 2013. 18(3): p. 3152-3167.

56
54. Tang, G., et al., Three dimensional graphene aerogels and their electrically conductive
composites. Carbon, 2014. 77: p. 592-599.
55. Caiulo, A. and M. Kachanov, On absence of quantitative correlations between strength
and stiffness in microcracking materials. International Journal of Fracture, 2010. 164(1):
p. 155-158.
56. Dynasol. HYDROGENATED RUBBER STYRENE-ETHYLENE/BUTYLENE-STYRENE
(SEBS). 2013; Available from:
http://www.dynasolelastomers.com/products/hydrogenated-rubber-styrene-ethylene-
butylene-styrene/.
57. Kraton. KRATON® G SEBS/SEPS. 2015; Available from:
http://www.kraton.com/products/kraton_g_sebs_seps.php.

57
BIOGRAPHICAL SKETCH
The author, Muhamad Shahrizan Jamal, was born on July 28
th 1990 at Penang, Malaysia as the
youngest child to Jamal Vita and Hatijah Bee Abdul Hai.
He attended the Methodist High School in Nibong Tebal where he was awarded the best student
in his class for his achievement in the Malaysian Public Examination. He is not only successful
academic wise, he also actively took part in extra-curricular activities representing his school in
the state level debate competition, the scout team and also the school soccer and handball team.
Upon his graduation, he was awarded a full scholarship to pursue a bachelor degree in Aerospace
Engineering at Purdue University by the Malaysian government. At Purdue, he was actively
involved in the Malaysian student body in promoting Malaysian culture to Purdue community
through various events. Besides that, he was also part of Sigma Gamma Tau, the national
aerospace honor society.
After graduating from Purdue University, he worked as a Test Engineer at Proeight Offshore
Engineering at Kuala Lumpur, Malaysia. While working there, he received an offer to pursue a
master’s degree in Industrial Engineering at Florida State University and is currently working to
finish his master’s degree.