2016 graduate retention study - association of atlantic universities grad… · online survey email...
TRANSCRIPT

2016‐06‐24
1
2016 Graduate Retention StudySummary of Results
June 2016
Margaret Brigley CMRP
www.cra.ca | [email protected] | 1.888.414.1336
Margaret Brigley, CMRPPresident & COO, CRA
Study Objectives
Assess graduates’ overall education experience and understand what their plans are following graduation
Determine what is compelling graduates to leave Atlantic Canada
Identify what factors influence the ability to stay within the region
2
Understand how opinions vary by student type

2016‐06‐24
2
Research Methodology
Online SurveyEmail invitations distributed by institutions to 2016 graduating students
21214 6434 643
Field DatesMarch 29 – April 6, 2016
99days
3
21 21 of 22 institutions took part
4,6434,643Completed Surveys
16 universities16 universities5 colleges5 colleges
Location of Respondents
10% 55%
7%
4
10%29%

2016‐06‐24
3
Graduate Profile
5
Graduate Profile
College grads29%
University grads71%
vs. 67% FemaleUndergraduate
Degree
Masters’Degree
Doctoral Degree 22%%
1313%%
7777%%
University graduate breakdown
College graduate breakdown
Diploma
Certificate
Other
5858%%
3737%%
55%%
29%
1 1 inin 1010
71%
are international
students
32% Male
6
Language
English 90%French 10%
students

2016‐06‐24
4
Where Family Lives
More likely to have family ties
2x2xmore likely to have family ties
7
yelsewhere in Canada
have family ties in another Atlantic Province
Graduates’ Experience
8

2016‐06‐24
5
Satisfaction with Education
8787% % Of graduates are satisfiedwith the quality of their
education86%89%
9
UniversityGraduates
College Graduates
Work‐Integrated Learning
Participation in Work‐Integrated Learning
66% Overall
3434%%did not participate in any form of work‐integrated learning
85%
58%
College Graduates
University Graduates
10
Grads who did not participate in such learning are less highly
satisfied with overall education.

2016‐06‐24
6
Likelihood to Recommend
70707070% %
would recommendtheir province of study as a place to live and
work7474% %
11
7171% %
6464% % 7373% %
Plans After Graduation
12

2016‐06‐24
7
2323%%have a job lined up
Post‐Graduation Plans
5858%%2929%%
will go back to school 1515% %
other things(i.e. travel, work
part‐time)
3333%%will look for a full‐time job
plan to enter the workforce
13
22%%plan to start their own business
Only...
Desired Location of Business
14

2016‐06‐24
8
Post‐Graduation Plans
5858%%plan to enter the workforcethe workforce
15
Preferred Location to Work
16

2016‐06‐24
9
Post‐Graduation Plans
2929%%will go back to
school
3535%% 1616%%
17
Choosing a Place to Live
18

2016‐06‐24
10
What’s Important When Considering Location?Importance of Factors
(Top 4 Box)
19
Post‐Graduation Plans
8282% %
College Graduates9292%%
EnglishF h
would remain in their province of study if they had
UniversityGraduates7878%%
7777% %
8282% %
20
8181%%
French
8989%%
an attractive job offer in field
8282% % 8282% %

2016‐06‐24
11
Reason for Accepting an Attractive Job Offer in
Post‐Graduation Plans
Reason for Not Accepting an Attractive Job Offer in
6464%%Where I live/am from/Close to home/family/
Attractive Job Offer in Province of Study
5252%%Want to live elsewhere/
move closer to
an Attractive Job Offer in Province of Study
21
friends family
International Students (n=468)
22
2016‐06‐24
12
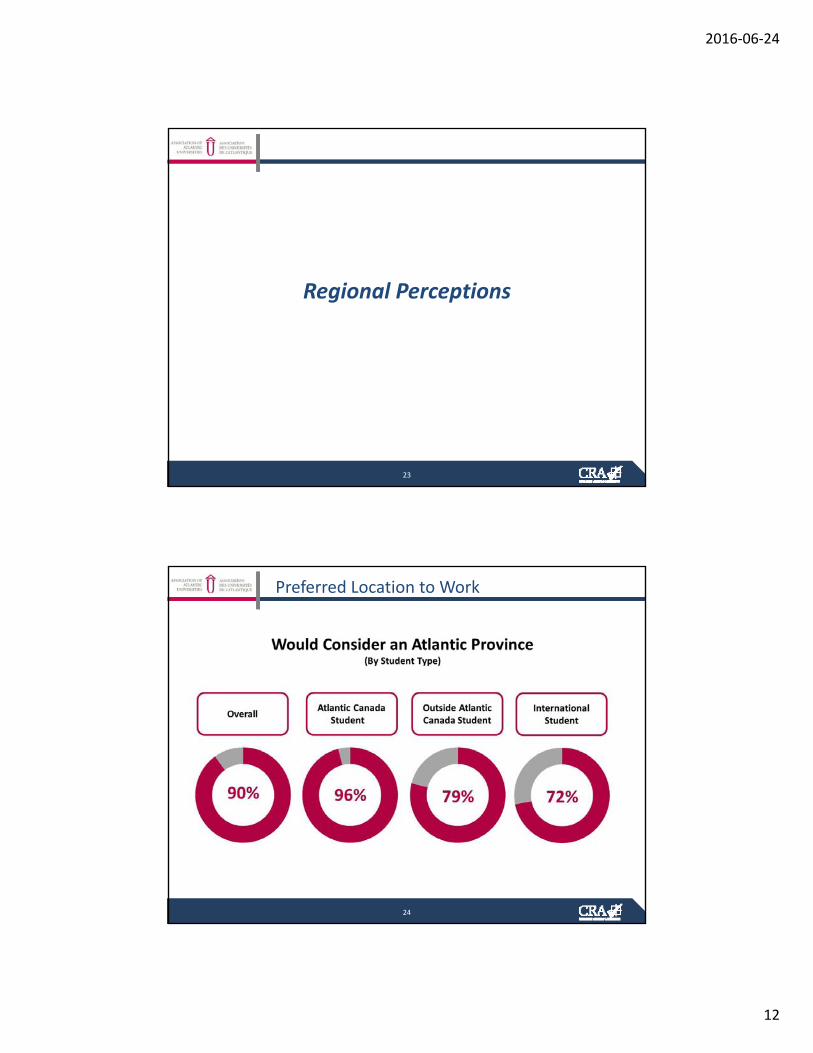
Regional Perceptions
23
Preferred Location to Work
24

2016‐06‐24
13
Recommendation
25
How Does Atlantic Canada Compare?Importance of Factors
(Top 4 Box)
Better
Worse
SameSame
26
Climate/ Weather

2016‐06‐24
14
Financial Considerations
27
Student Loan Debt
28

2016‐06‐24
15
Student Loan Debt
$28.8K$28.8KAverage amount owed
(Median $25K)
77years
UniversityGraduates
College Graduates
$16,536$16,536 $33,$33,976976vs.vs.
29
$16,536$16,536(Median $13K)
$33,$33,976976(Median $30K)
2x2xThe amount owed The amount owed by College Gradsby College Grads
vs.vs.
Salary Expectations
$46,285$46,285Average salary
expected
Universityd
College G d
p
30
GraduatesGraduates
$$39.5K39.5K $$49.1K49.1Kvs.vs.

2016‐06‐24
16
International Students (n=468)
31