2016 general election survey results -...
TRANSCRIPT
2016 General ElectionSurvey Results
Matt Grossmann, IPPSR Director

StateoftheStateSurveyRound73EarlyRelease
Sample Size MarginofErrorMichiganAdults 866 3.3%LikelyVoters 746 3.6%CertainVoters 663 3.8%
September1st – October30th

HorseRace
Clinton Trump Johnson SteinLikelyVoters2 candidates 52% 32%
LikelyVoters4 candidates 47% 28% 11% 4%
CertainVoters2 candidates 54% 32%
Certain Voters4 candidates 50% 28% 9% 4%

PresidentialVote– 2candidatesLikelyVoters,7-DayWindows
0
10
20
30
40
50
60
70
80
12-Sep
14-Sep
16-Sep
18-Sep
20-Sep
22-Sep
24-Sep
26-Sep
28-Sep
30-Sep
2-Oct
4-Oct
6-Oct
8-Oct
10-Oct
12-Oct
14-Oct
16-Oct
18-Oct
20-Oct
22-Oct
24-Oct
26-Oct
28-Oct
30-Oct
Clinton Trump
1st Debate 2nd Debate 3rd Debate

PresidentialVote– 4candidatesLikelyVoters,7-DayWindows
0
10
20
30
40
50
60
70
12-Sep
14-Sep
16-Sep
18-Sep
20-Sep
22-Sep
24-Sep
26-Sep
28-Sep
30-Sep
2-Oct
4-Oct
6-Oct
8-Oct
10-Oct
12-Oct
14-Oct
16-Oct
18-Oct
20-Oct
22-Oct
24-Oct
26-Oct
28-Oct
30-Oct
Clinton Trump Johnson Stein
1st Debate 2nd Debate 3rd Debate
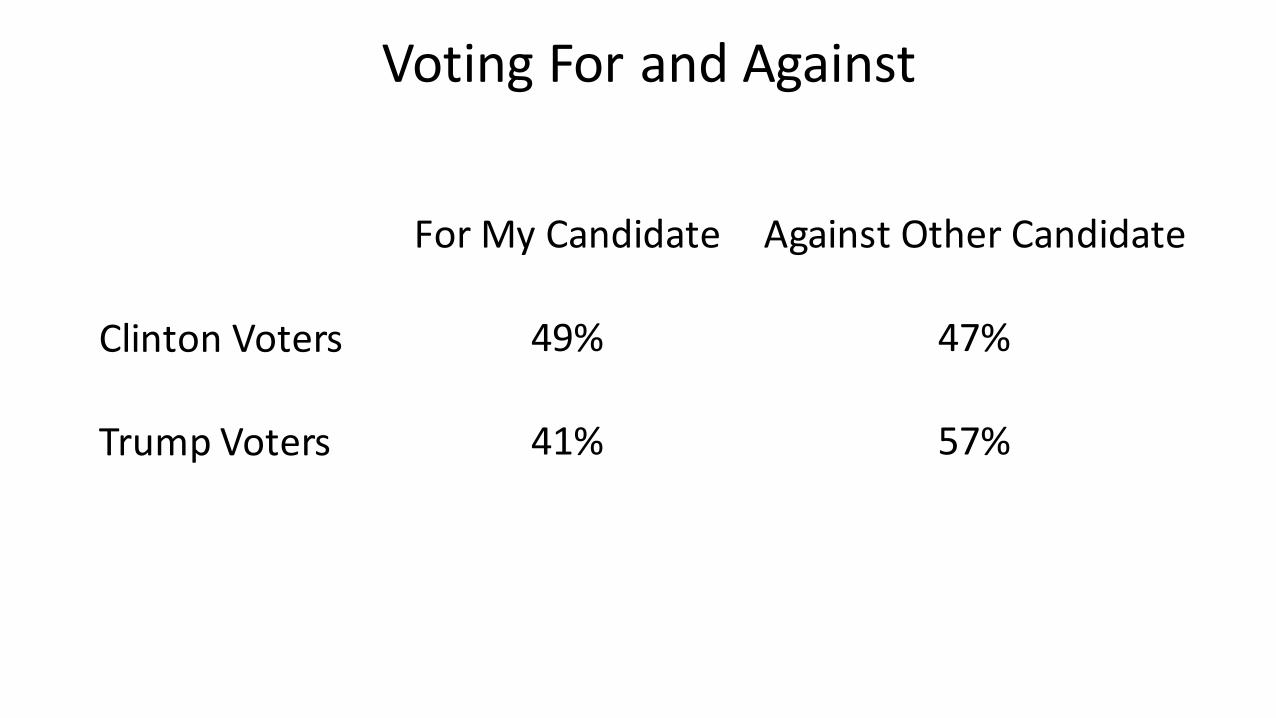
VotingForandAgainst
ForMyCandidate AgainstOtherCandidate
Clinton Voters 49% 47%
Trump Voters 41% 57%

PartyIdentification95
74
57
31
116
129
18
31
70
8996
0
10
20
30
40
50
60
70
80
90
100
StrongRepublican
NotStrongRepublican
LeanRepublican Neither LeanDemocrat NotStrongDemocrat
StrongDemocrat
Trump Clinton

PoliticalIdeology
72
61
46
20
7 85
14
24
35
6672
8691
0
10
20
30
40
50
60
70
80
90
100
VeryConservative
SomewhatConservative
LeanConservative
Middle LeanLiberal SomewhatLiberal
VeryLiberal
Trump Clinton

Race
Non-White White,Non-Hispanic
Clinton 80% 45%
Trump 9% 39%

Gender
Male Female
Clinton 44% 60%
Trump 42% 23%

EducationHighSchoolor
LessSomeCollege
CollegeGrad
GradSchool
Clinton 49% 51% 48% 66%
Trump 40% 34% 33% 23%
Clinton 32% 45% 42% 58%
Trump 54% 38% 40% 27%
OnlyWhiteNon-Hispanic
AllVoters

Age
18-29 30-64 65+
Clinton 50% 55% 49%
Trump 26% 32% 37%

MichiganRegion
Clinton TrumpDetroit 77% 5%Southeast Michigan 54% 32%SouthwestMichigan 56% 35%East Central 25% 43%WestCentral 52% 33%NorthernMichigan 48% 36%UpperPeninsula 42% 33%

Income
58%
71%68%
50%
34%
62%
46%
55%
48%52%
44%39%
19%22%
28%
44%
28%
36%31%
37%31%
40%
0%
10%
20%
30%
40%
50%
60%
70%
80%Lessth
an$10,000
$10,000-19,999
$20,000-29,999
$30,000-39,999
$40,000-49,999
$50,000-59,999
$60,000-69,999
$70,000-89,999
$90,000-99,999
$100,000-149,999
$150,000orM
ore
Clinton
Trump

ByPrimaryCandidateSupported
HillaryClinton
BernieSanders
DonaldTrump
OtherRepublican
Clinton 97% 72% 2% 15%
Trump 2% 15% 92% 60%

AversiontoSocialChange
32
53 53
72
84
52
30 28
14
4
0
10
20
30
40
50
60
70
80
90
StronglyAgree:41% Agree24% Neither7% Disagree13% StronglyDisagree17%
OurCountryisChangingTooFast,UnderminingAmericanValues
Clinton Trump

AcceptanceofSocialChange
74
51
35
25 23
11
31
46
63 63
0
10
20
30
40
50
60
70
80
StronglyAgree:37% Agree:32% Neither7% Disagree:11% StronglyDisagree:12%
ByAcceptingDiverseCultures&Lifestyles,OurCountryisImproving
Clinton Trump

RacialResentment
25
37
54
69
86
62
42
2619
6
0
10
20
30
40
50
60
70
80
90
100
StronglyAgree:24% Agree:25% Neither:13% Disagree:17% StronglyDisagree:21%
ManyMinoritiesOvercamePrejudice,BlacksShouldDoSameWithoutFavors
Clinton Trump

PerceivedRacialDisadvantage
74
59
49
39
25
10
28 27
46
59
0
10
20
30
40
50
60
70
80
StronglyAgree:27% Agree28% Neither:9% Disagree:19% StronglyDisagree:18%
GenerationsofSlavery/DiscriminationMakeitHardforBlackstoRise
Clinton Trump

WhiteEthnocentrismLikelyVoters,WhiteNon-HispanicsOnly
21% 19%
31%
53%
72% 74%
56%
27%
0%
10%
20%
30%
40%
50%
60%
70%
80%
PreferWhitestoBlacks:16% PreferWhitestoLatinos:16% PreferWhitestoMuslims:56% NotEthnocentric:43%
Clinton Trump

VoteforCongress
DemocratforCongress
RepublicanforCongress
TrumpVoters 9% 76%
ClintonVoters 79% 6%
AllVoters 45% 32%

HowManyKnowVicePresidentialCandidates?
32%
55%
37%
61%
0%
10%
20%
30%
40%
50%
60%
70%
TimKaine MikePence
AllAdults LikelyVoters

MichiganPublicvs.MichiganInsiders63%
18%
27%
14%
3%
31%
43%
49%52%
32%27%
17% 16%
3%
32%
45%
0%
10%
20%
30%
40%
50%
60%
70%
Clinton Trump Clinton Sanders Trump Kasich Republican Democrat
PresidentialPreference PrimarySupportRecall VoteforCongress
Insiders Public

Expectations92%
8%
93%
7%
61%
23%
63%
24%
0%
10%
20%
30%
40%
50%
60%
70%
80%
90%
100%
Clinton Trump Clinton Trump
WhoWillWinNationwide? WhoWillWinMichigan?
MichiganInsiders MichiganPublic

InsiderExpectations
#ofElectoralVotesforClinton
#ofRepublicanSeatsinMIHouse
MichiganInsidersForecast
330/538 57/110
402MichiganInsiders,MichiganPolicyInsidersPanel,October19-31
