2016 cost of cyber crime study & the risk of business ... hpe ccc...2016 cost of cyber crime...
TRANSCRIPT

2016 Cost of Cyber Crime Study & the Risk of Business Innovation
Ponemon Institute© Research Report
Sponsored by Hewlett Packard Enterprise Independently conducted by Ponemon Institute LLC Publication Date: October 2016
Ponemon Institute © Research Report Page 1
2016 Cost of Cyber Crime Study & the Risk of Business Innovation Benchmark Study of 237 Global Companies
Ponemon Institute October 2016 Part 1. Executive Summary We are pleased to present the 2016 Cost of Cyber Crime Study & the Risk of Business Innovation sponsored by Hewlett Packard Enterprise. This year’s study on the annual cost of cyber crime is based upon a representative sample of 237 organizations in six countries.
Ponemon Institute conducted the first Cost of Cyber Crime study in the United States seven years ago. This is the fifth year we have conducted the study in the United Kingdom, Germany, Australia and Japan and the second year in Brazil.
Cyber attacks are a reality for all organizations. In this year’s cost of cyber crime research we focus on the importance of thriving and innovating while simultaneously reducing the financial and reputational consequences of a cyber attack. An important finding of this research is that a high security profile, as determined by the deployment of specific practices and technologies, will support business innovation and reduce the cost of cyber crime.
For purposes of this study, we define cyber attacks as criminal activity conducted via the Internet. These attacks can include stealing an organization’s intellectual property, confiscating online bank accounts, creating and distributing viruses on other computers, posting confidential business information on the Internet and disrupting a country’s critical national infrastructure.
The goal of this study is to provide guidance to security professionals on how to focus their finite security resources on those solutions that most effectively protect organizations as they innovate and change. We do this by comparing the business innovations of companies participating in the research to the usage of specific security practices and technologies. Examples of innovation we include in this report are: taking on a new supplier or business partner, launching a significant new customer-facing application or reorganizing the company to achieve greater efficiencies.
Nine characteristics of innovative and cyber secure organizations. Findings reveal the following characteristics of organizations that both innovate their operations to meet business objectives and minimize the financial and reputational consequences of a cyber crime. 1. Security posture. Overall, these organizations, prior to engaging in new business
opportunities and changes in operations, assess potential security risks in order to improve their security posture. This includes the persistent use of security technologies such as advanced access management systems, extensive deployment of encryption technologies and enterprise deployment of GRC tools.
2. Information management. Information loss is now the biggest financial impact of a cyber
attack. Consequently, organizations with advanced backup and recovery were able to reduce the impact and ensure business continuity and data protection.
3. Information governance. These companies deploy advanced procedures for backup and
recovery operations, share threat intelligence, collaborate with industry partners on security issues and integrate security operations with enterprise risk management activities.
Global Study at a Glance
237 companies in 6 countries
1,278 interviews with company personnel
465 total attacks used to measure total cost
$9.5 million average annualized cost
21 percent net increase in the total cost over the past year

Ponemon Institute © Research Report Page 2
4. Data protection. These organizations make investing in technologies and processes that
reduce information loss a priority because they understand it is the most costly cyber attack to remediate. They are also shifting budget to the application and data layers rather than the network layers, to fortify the areas most vulnerable to information loss.
5. Application security. Prior to the launch of customer-facing applications, these
organizations do not rush to release. They ensure the necessary security is built into the applications and vulnerabilities are addressed. These companies use several application security controls such as penetration testing, security patch management and dynamic and static scanning.
6. Detection and recovery. To reduce the time to determine the root cause of the attack and
control the costs associated with a lengthy time to detect and contain the attack, these organizations are increasing their investment in technologies to help facilitate the detection process.
7. Third-party risk. These organizations are able to reduce the risk of taking on a significant
new supplier or partner by conducting thorough audits and assessments of the third party’s data protection practices.
8. Insider threat. A possible negative consequence of reorganization or acquisition of a new
company can be disgruntled or negligent employees. These organizations ensure processes and technologies are in place to manage end user access to sensitive information. Further, there are training and awareness programs in place to address risks to sensitive data caused by changes in organizational structure and new communication channels.
9. SIEM. These companies deploy advanced security information and event management
(SIEM) with features such as the ability to monitor and correlate events in real-time to detect critical threats and detect unknown threats through user behavior analytics.
Following are key takeaways from this study.
Information loss or theft is now the most expensive consequence of a cyber crime. In this research we look at four primary consequences of a cyber attack: business disruptions, loss of information, loss of revenue and damage to equipment. The largest cost impact from cyber crime is information loss (an average of 39 percent) followed by business disruption at 36 percent. Applying information management and governance practices reduces the cost of cyber crime. While only 39 percent of companies represented in this research reported they deploy advance backup and recovery operations, its use reduced the average cost of cyber crime by nearly $2 million. Similarly, only 28 percent of companies reported having a formal information governance program and this was shown to reduce the cost of cyber crime by nearly $1 million. Certain technologies enable a high level of information management and governance. The persistent use of security technologies such as advanced access management systems (49 percent of companies), extensive deployment of encryption technologies (46 percent of companies) and enterprise deployment of encryption technologies (41 percent of companies) were shown to reduce the cost of cyber crime. Companies in this study that relied on seven of the listed security tools, saw the cost of cyber crime reduced by an average of $3 million. Business innovation impacts the cost of cyber crime and certain innovations are costlier. The acquisition or divestiture of a company was shown to increase the cost of cyber crime by 20 percent, and the launch of a significant new customer-facing application increased the cost by 18 percent. In addition, costlier attacks resulted when there was more innovation. Companies that

Ponemon Institute © Research Report Page 3
engaged in more than five different sets of innovation experienced a cost of cyber crime greater than the $9.5 million average.
A strong security profile enabled companies to innovate and control the cost of cyber crime. Although business innovation puts companies at risk for costlier cyber attacks, companies with a high security profile can decrease the cost of cyber crime when the risk of cyber attacks increases due to innovation. In this research, innovative companies that self-reported a high security profile had an average $7.9 million cost of cyber crime, considerably lower than the average cost.
Companies that used application security controls reduced the cost of cyber crime. In this study, we asked companies to indicate the application security controls used. We found that if companies deployed between eight and nine of the application controls included, they saved almost $2 million on total cyber crime cost. If only one to three controls are used, the cost increases by an average of $2 million. Building security into application and data protection in addition to a layered approach with multiple tools can reduce the risk. Dynamic testing, static testing and run-time application self-protection were also shown to reduce costs and support innovation. The persistent use of advanced SIEM resulted in an average savings of $2.77 million. Despite the findings that the use of advanced SIEM features resulted in an average savings of nearly $3 million, our research revealed that most SIEM features are not widely deployed. These are the ability to monitor and correlate events in real-time to detect critical threats (only 35 percent of organizations) and to detect unknown threats through user behavior analytics (only 33 percent of organizations).
Ponemon Institute © Research Report Page 4
Part 2. Key Findings
The rising cost of cyber crime In this annual study, our goal is to quantify the economic impact of cyber attacks and observe cost trends over time. We believe a better understanding of the cost of cyber crime will help organizations determine the appropriate amount of investment and resources needed to prevent or mitigate the consequences of an attack.
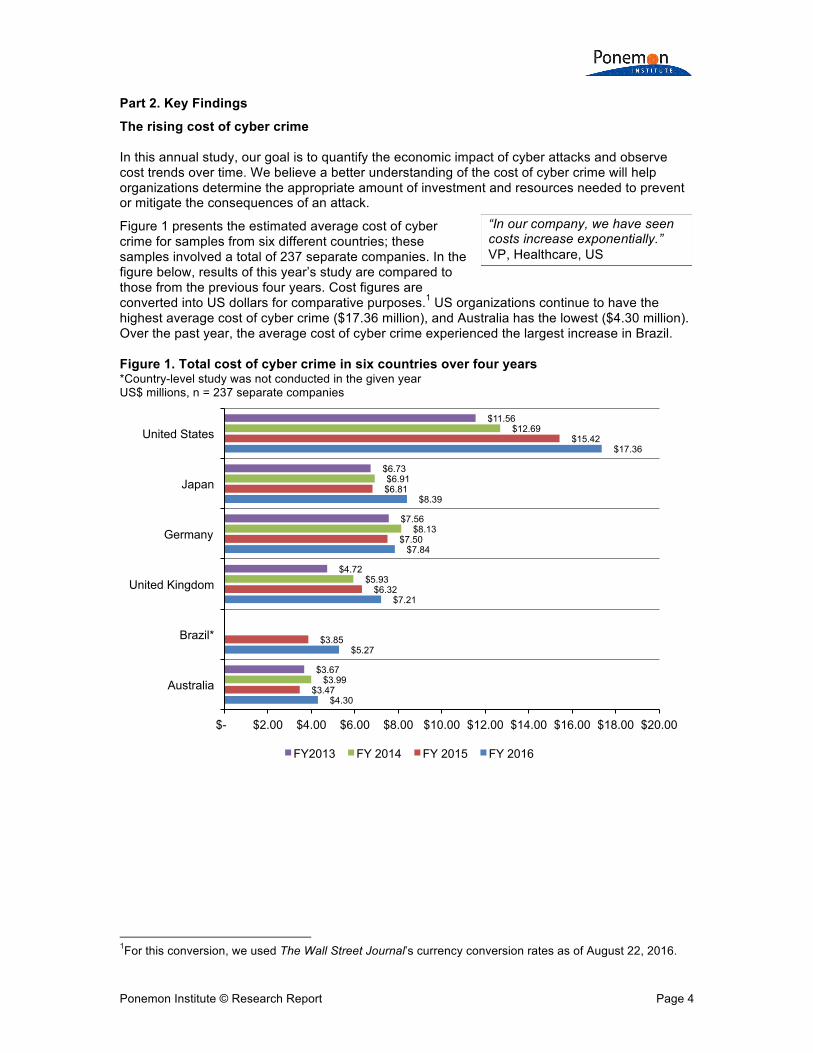
Figure 1 presents the estimated average cost of cyber crime for samples from six different countries; these samples involved a total of 237 separate companies. In the figure below, results of this year’s study are compared to those from the previous four years. Cost figures are converted into US dollars for comparative purposes.1 US organizations continue to have the highest average cost of cyber crime ($17.36 million), and Australia has the lowest ($4.30 million). Over the past year, the average cost of cyber crime experienced the largest increase in Brazil. Figure 1. Total cost of cyber crime in six countries over four years *Country-level study was not conducted in the given year US$ millions, n = 237 separate companies
1For this conversion, we used The Wall Street Journal’s currency conversion rates as of August 22, 2016.
$4.30
$5.27
$7.21
$7.84
$8.39
$17.36
$3.47
$3.85
$6.32
$7.50
$6.81
$15.42
$3.99
$5.93
$8.13
$6.91
$12.69
$3.67
$4.72
$7.56
$6.73
$11.56
$- $2.00 $4.00 $6.00 $8.00 $10.00 $12.00 $14.00 $16.00 $18.00 $20.00
Australia
Brazil*
United Kingdom
Germany
Japan
United States
FY2013 FY 2014 FY 2015 FY 2016
“In our company, we have seen costs increase exponentially.” VP, Healthcare, US
Ponemon Institute © Research Report Page 5
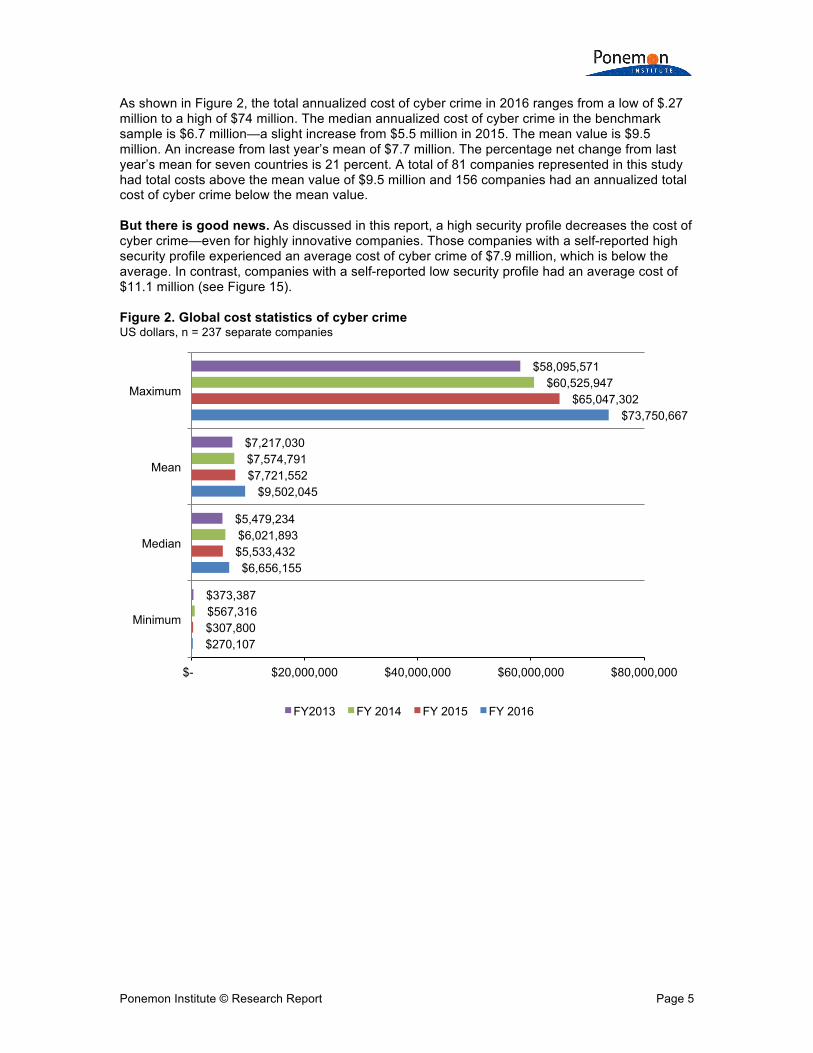
As shown in Figure 2, the total annualized cost of cyber crime in 2016 ranges from a low of $.27 million to a high of $74 million. The median annualized cost of cyber crime in the benchmark sample is $6.7 million—a slight increase from $5.5 million in 2015. The mean value is $9.5 million. An increase from last year’s mean of $7.7 million. The percentage net change from last year’s mean for seven countries is 21 percent. A total of 81 companies represented in this study had total costs above the mean value of $9.5 million and 156 companies had an annualized total cost of cyber crime below the mean value. But there is good news. As discussed in this report, a high security profile decreases the cost of cyber crime—even for highly innovative companies. Those companies with a self-reported high security profile experienced an average cost of cyber crime of $7.9 million, which is below the average. In contrast, companies with a self-reported low security profile had an average cost of $11.1 million (see Figure 15).
Figure 2. Global cost statistics of cyber crime US dollars, n = 237 separate companies
$270,107
$6,656,155
$9,502,045
$73,750,667
$307,800
$5,533,432
$7,721,552
$65,047,302
$567,316
$6,021,893
$7,574,791
$60,525,947
$373,387
$5,479,234
$7,217,030
$58,095,571
$- $20,000,000 $40,000,000 $60,000,000 $80,000,000
Minimum
Median
Mean
Maximum
FY2013 FY 2014 FY 2015 FY 2016

Ponemon Institute © Research Report Page 6
The size of an organization and its industry can affect the cost of cyber crime The cost of cyber crime varies by organizational size. As shown in Figure 3, organizational size, as measured by the number of enterprise seats or nodes, is positively correlated to annualized cyber crime cost. This positive correlation is indicated by the upward sloping regression line. The number of seats ranges from a low of 673 to a high of 129,000. Moreover, smaller organizations (less than the median number of seats) experienced a higher proportion of cyber crime costs related to malware, web-based attacks and phishing/social engineering. In contrast, larger organizations (more than the median number of seats) experienced a higher proportion of costs relating to denial of services, malicious insiders, malicious code and stolen devices.
Figure 3. Annualized cost in ascending order per number of enterprise seats US dollars, n = 237 separate companies
$-
$10,000,000
$20,000,000
$30,000,000
$40,000,000
$50,000,000
$60,000,000
$70,000,000
$80,000,000
Ascending order by the number of enterprise seats (size)
2016 Annualized Total Cost Regression
Ponemon Institute © Research Report Page 7
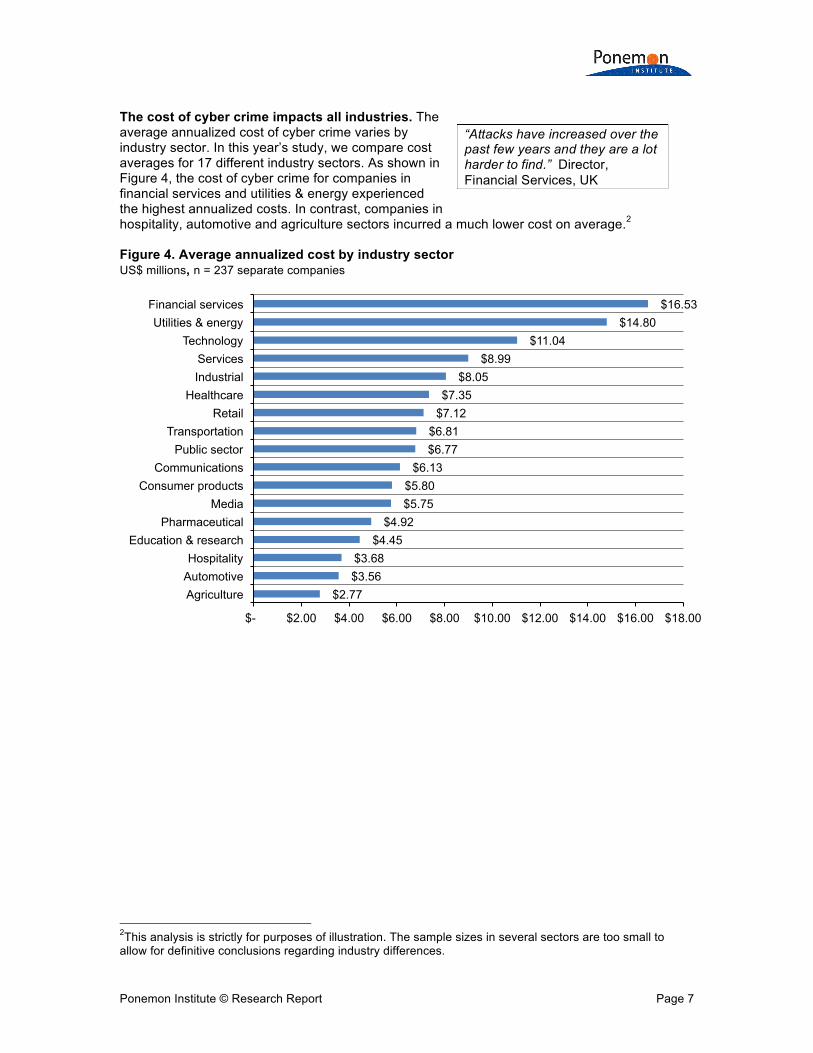
The cost of cyber crime impacts all industries. The average annualized cost of cyber crime varies by industry sector. In this year’s study, we compare cost averages for 17 different industry sectors. As shown in Figure 4, the cost of cyber crime for companies in financial services and utilities & energy experienced the highest annualized costs. In contrast, companies in hospitality, automotive and agriculture sectors incurred a much lower cost on average.2 Figure 4. Average annualized cost by industry sector US$ millions, n = 237 separate companies
2This analysis is strictly for purposes of illustration. The sample sizes in several sectors are too small to allow for definitive conclusions regarding industry differences.
$2.77 $3.56 $3.68
$4.45 $4.92
$5.75 $5.80
$6.13 $6.77 $6.81
$7.12 $7.35
$8.05 $8.99
$11.04 $14.80
$16.53
$- $2.00 $4.00 $6.00 $8.00 $10.00 $12.00 $14.00 $16.00 $18.00
Agriculture Automotive Hospitality
Education & research Pharmaceutical
Media Consumer products
Communications Public sector
Transportation Retail
Healthcare Industrial Services
Technology Utilities & energy
Financial services
“Attacks have increased over the past few years and they are a lot harder to find.” Director, Financial Services, UK
Ponemon Institute © Research Report Page 8
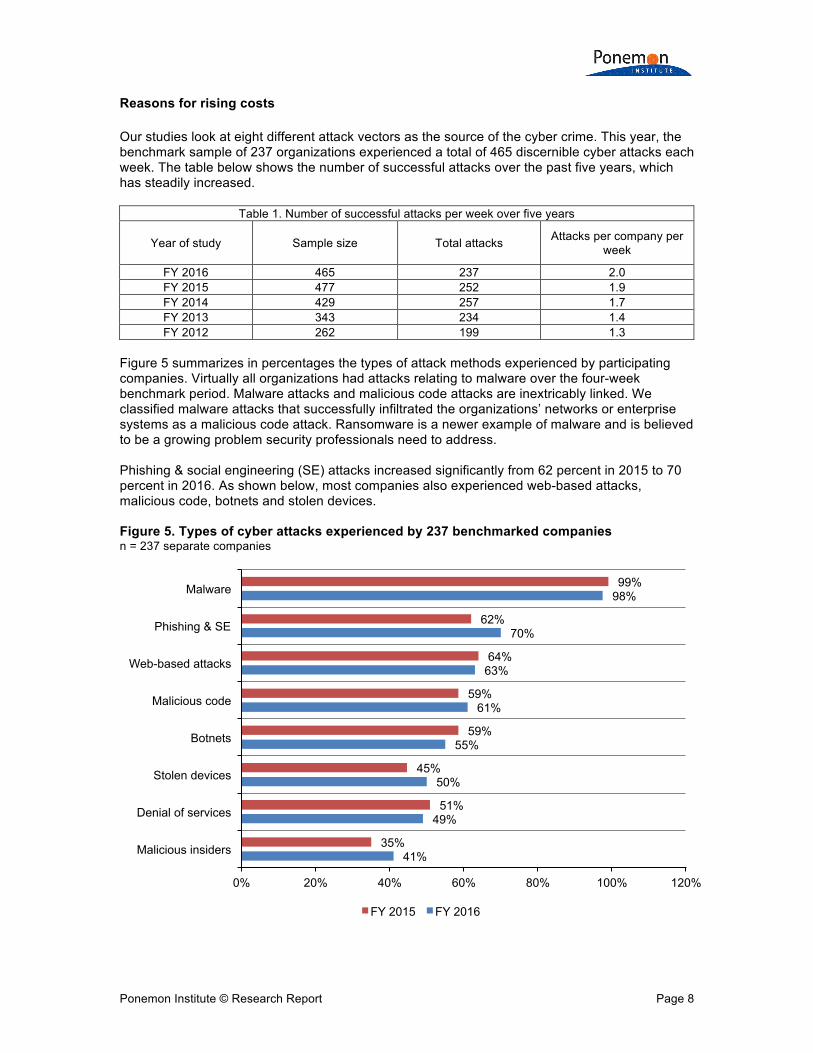
Reasons for rising costs Our studies look at eight different attack vectors as the source of the cyber crime. This year, the benchmark sample of 237 organizations experienced a total of 465 discernible cyber attacks each week. The table below shows the number of successful attacks over the past five years, which has steadily increased.
Table 1. Number of successful attacks per week over five years
Year of study Sample size Total attacks Attacks per company per week
FY 2016 465 237 2.0 FY 2015 477 252 1.9 FY 2014 429 257 1.7 FY 2013 343 234 1.4 FY 2012 262 199 1.3
Figure 5 summarizes in percentages the types of attack methods experienced by participating companies. Virtually all organizations had attacks relating to malware over the four-week benchmark period. Malware attacks and malicious code attacks are inextricably linked. We classified malware attacks that successfully infiltrated the organizations’ networks or enterprise systems as a malicious code attack. Ransomware is a newer example of malware and is believed to be a growing problem security professionals need to address. Phishing & social engineering (SE) attacks increased significantly from 62 percent in 2015 to 70 percent in 2016. As shown below, most companies also experienced web-based attacks, malicious code, botnets and stolen devices. Figure 5. Types of cyber attacks experienced by 237 benchmarked companies n = 237 separate companies
41%
49%
50%
55%
61%
63%
70%
98%
35%
51%
45%
59%
59%
64%
62%
99%
0% 20% 40% 60% 80% 100% 120%
Malicious insiders
Denial of services
Stolen devices
Botnets
Malicious code
Web-based attacks
Phishing & SE
Malware
FY 2015 FY 2016
Ponemon Institute © Research Report Page 9
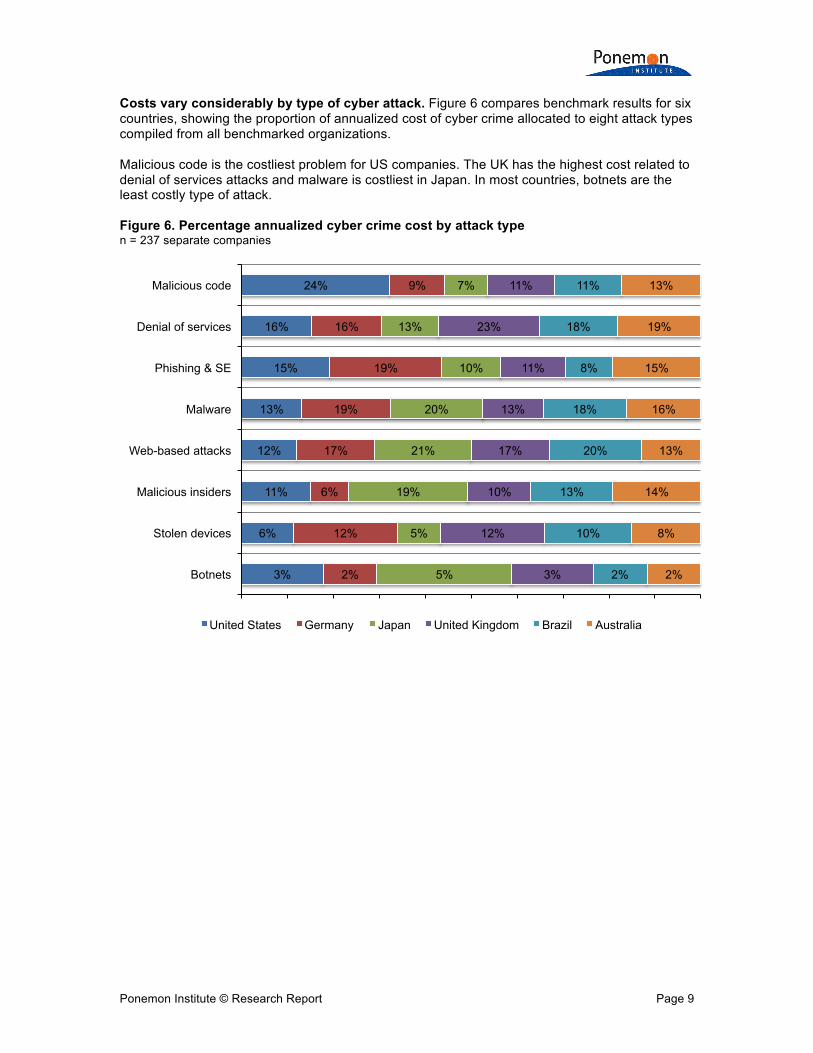
Costs vary considerably by type of cyber attack. Figure 6 compares benchmark results for six countries, showing the proportion of annualized cost of cyber crime allocated to eight attack types compiled from all benchmarked organizations. Malicious code is the costliest problem for US companies. The UK has the highest cost related to denial of services attacks and malware is costliest in Japan. In most countries, botnets are the least costly type of attack. Figure 6. Percentage annualized cyber crime cost by attack type n = 237 separate companies
3%
6%
11%
12%
13%
15%
16%
24%
2%
12%
6%
17%
19%
19%
16%
9%
5%
5%
19%
21%
20%
10%
13%
7%
3%
12%
10%
17%
13%
11%
23%
11%
2%
10%
13%
20%
18%
8%
18%
11%
2%
8%
14%
13%
16%
15%
19%
13%
Botnets
Stolen devices
Malicious insiders
Web-based attacks
Malware
Phishing & SE
Denial of services
Malicious code
United States Germany Japan United Kingdom Brazil Australia
Ponemon Institute © Research Report Page 10
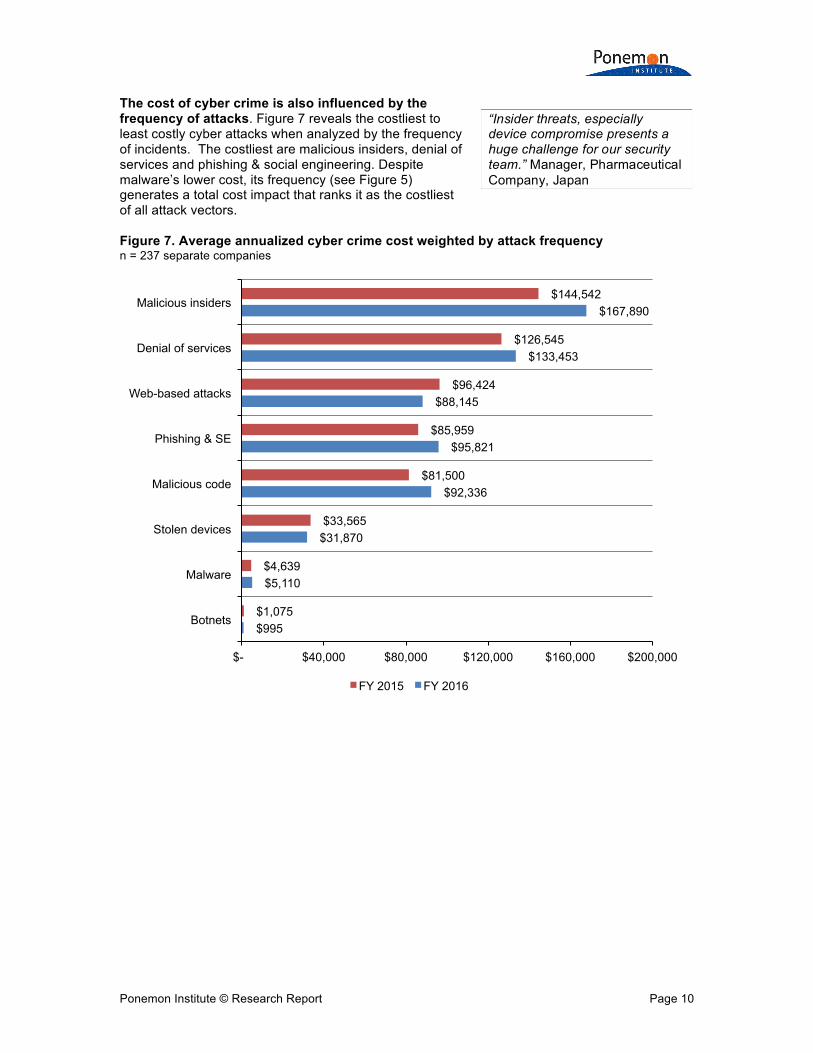
The cost of cyber crime is also influenced by the frequency of attacks. Figure 7 reveals the costliest to least costly cyber attacks when analyzed by the frequency of incidents. The costliest are malicious insiders, denial of services and phishing & social engineering. Despite malware’s lower cost, its frequency (see Figure 5) generates a total cost impact that ranks it as the costliest of all attack vectors. Figure 7. Average annualized cyber crime cost weighted by attack frequency n = 237 separate companies
$995
$5,110
$31,870
$92,336
$95,821
$88,145
$133,453
$167,890
$1,075
$4,639
$33,565
$81,500
$85,959
$96,424
$126,545
$144,542
$- $40,000 $80,000 $120,000 $160,000 $200,000
Botnets
Malware
Stolen devices
Malicious code
Phishing & SE
Web-based attacks
Denial of services
Malicious insiders
FY 2015 FY 2016
“Insider threats, especially device compromise presents a huge challenge for our security team.” Manager, Pharmaceutical Company, Japan
Ponemon Institute © Research Report Page 11
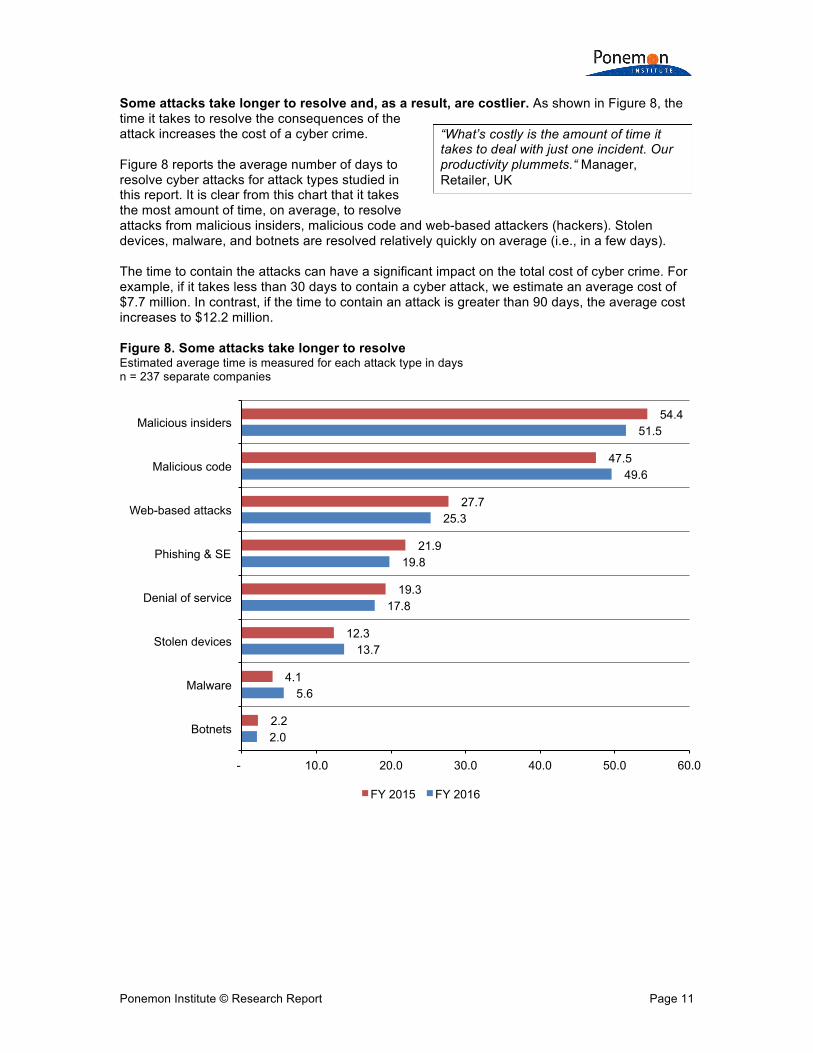
Some attacks take longer to resolve and, as a result, are costlier. As shown in Figure 8, the time it takes to resolve the consequences of the attack increases the cost of a cyber crime. Figure 8 reports the average number of days to resolve cyber attacks for attack types studied in this report. It is clear from this chart that it takes the most amount of time, on average, to resolve attacks from malicious insiders, malicious code and web-based attackers (hackers). Stolen devices, malware, and botnets are resolved relatively quickly on average (i.e., in a few days). The time to contain the attacks can have a significant impact on the total cost of cyber crime. For example, if it takes less than 30 days to contain a cyber attack, we estimate an average cost of $7.7 million. In contrast, if the time to contain an attack is greater than 90 days, the average cost increases to $12.2 million. Figure 8. Some attacks take longer to resolve Estimated average time is measured for each attack type in days n = 237 separate companies
2.0
5.6
13.7
17.8
19.8
25.3
49.6
51.5
2.2
4.1
12.3
19.3
21.9
27.7
47.5
54.4
- 10.0 20.0 30.0 40.0 50.0 60.0
Botnets
Malware
Stolen devices
Denial of service
Phishing & SE
Web-based attacks
Malicious code
Malicious insiders
FY 2015 FY 2016
“What’s costly is the amount of time it takes to deal with just one incident. Our productivity plummets.“ Manager, Retailer, UK

Ponemon Institute © Research Report Page 12
An analysis of the cost components of cyber crime Information loss or theft is now the most expensive consequence of a cyber crime. In this research we look at four primary consequences of a cyber attack: business disruptions, the loss of information, loss of revenue and damage to equipment. As shown in Figure 9, among the organizations represented in this study, information loss is the costliest consequence of an attack in FY 2016. In the context of this research, information loss is defined as the loss or theft of sensitive and confidential information, including high-value information assets. The costly nature of this type of attack is not surprising given the increasing frequency of malware attacks and phishing & social engineering. The cost of business disruption includes diminished employee productivity and business process failures in the wake of a cyber attack; this represents 36 percent of cost. Revenue loss and equipment damages follow at 20 percent and 4 percent, respectively. Figure 9. Percentage cost for external consequences n = 237 separate companies
36% 39%
20%
4% 1%
39% 35%
21%
4% 2%
0%
5%
10%
15%
20%
25%
30%
35%
40%
45%
Business disruption Information loss Revenue loss Equipment damages
Other costs
FY 2016 FY 2015
“Because of the cost of downtime, we have escalated the priority for backup and recovery practices.” VP Technology Company, US
Ponemon Institute © Research Report Page 13
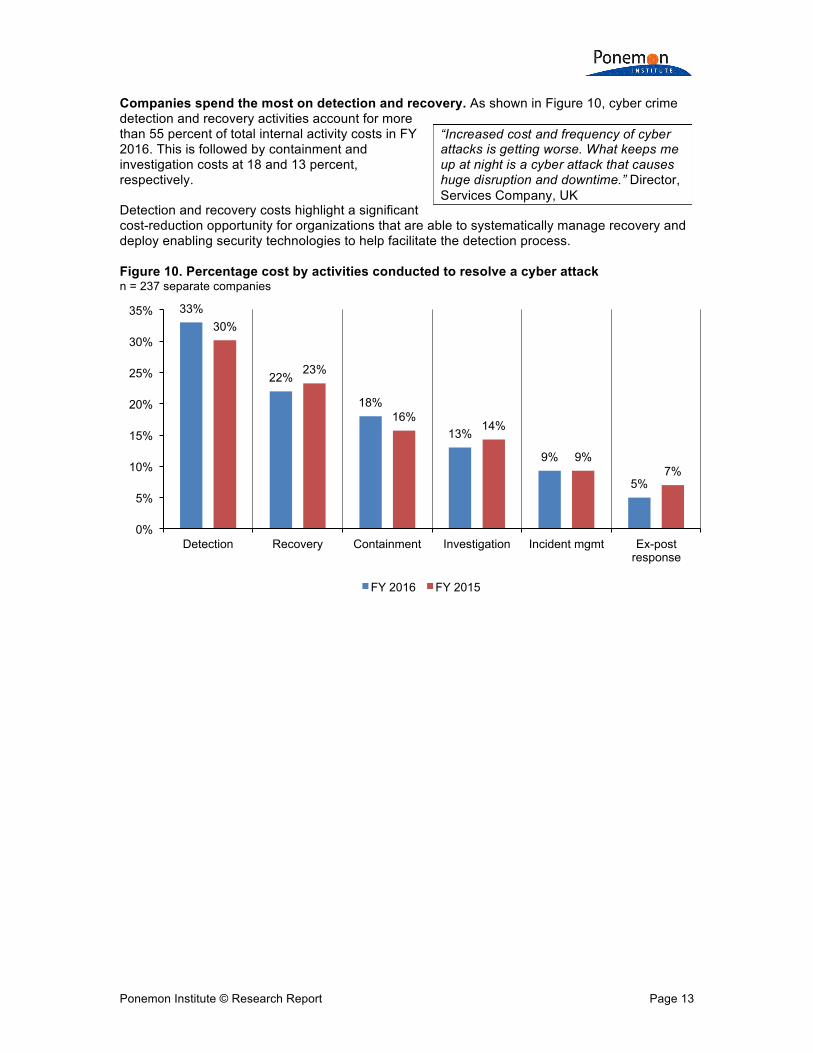
Companies spend the most on detection and recovery. As shown in Figure 10, cyber crime detection and recovery activities account for more than 55 percent of total internal activity costs in FY 2016. This is followed by containment and investigation costs at 18 and 13 percent, respectively. Detection and recovery costs highlight a significant cost-reduction opportunity for organizations that are able to systematically manage recovery and deploy enabling security technologies to help facilitate the detection process. Figure 10. Percentage cost by activities conducted to resolve a cyber attack n = 237 separate companies
33%
22%
18%
13%
9%
5%
30%
23%
16% 14%
9% 7%
0%
5%
10%
15%
20%
25%
30%
35%
Detection Recovery Containment Investigation Incident mgmt Ex-post response
FY 2016 FY 2015
“Increased cost and frequency of cyber attacks is getting worse. What keeps me up at night is a cyber attack that causes huge disruption and downtime.” Director, Services Company, UK
Ponemon Institute © Research Report Page 14
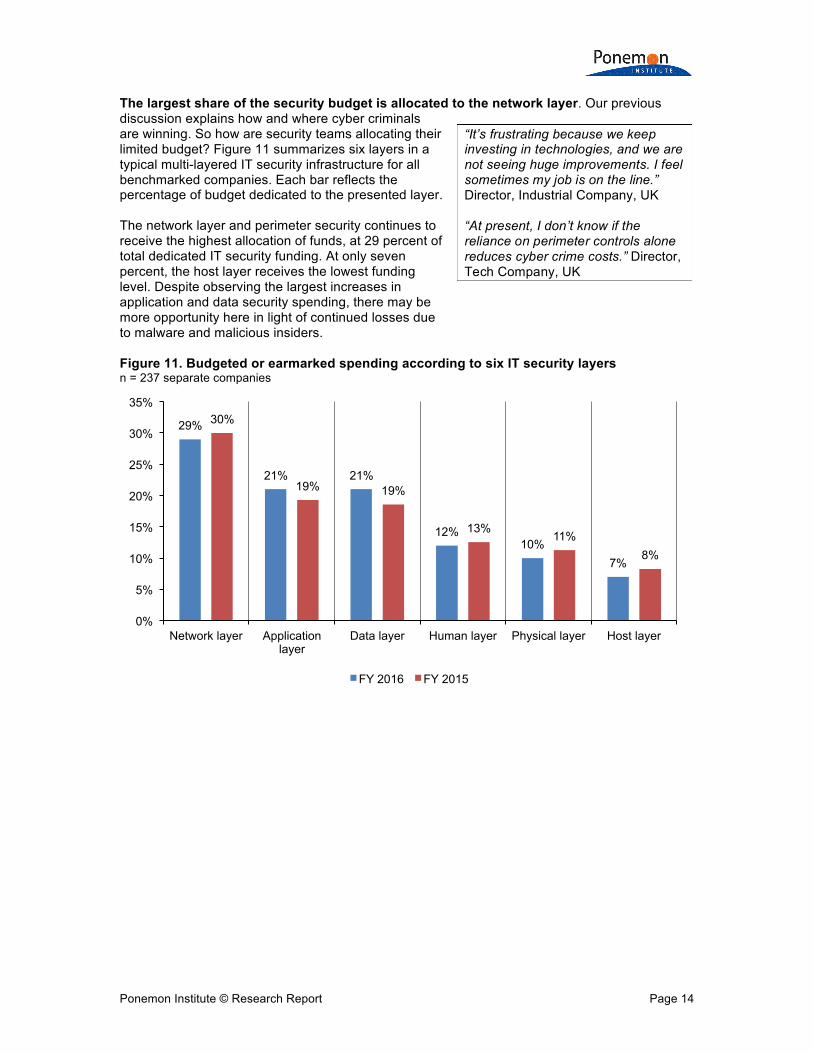
The largest share of the security budget is allocated to the network layer. Our previous discussion explains how and where cyber criminals are winning. So how are security teams allocating their limited budget? Figure 11 summarizes six layers in a typical multi-layered IT security infrastructure for all benchmarked companies. Each bar reflects the percentage of budget dedicated to the presented layer. The network layer and perimeter security continues to receive the highest allocation of funds, at 29 percent of total dedicated IT security funding. At only seven percent, the host layer receives the lowest funding level. Despite observing the largest increases in application and data security spending, there may be more opportunity here in light of continued losses due to malware and malicious insiders. Figure 11. Budgeted or earmarked spending according to six IT security layers n = 237 separate companies
29%
21% 21%
12% 10%
7%
30%
19% 19%
13% 11%
8%
0%
5%
10%
15%
20%
25%
30%
35%
Network layer Application layer
Data layer Human layer Physical layer Host layer
FY 2016 FY 2015
“It’s frustrating because we keep investing in technologies, and we are not seeing huge improvements. I feel sometimes my job is on the line.” Director, Industrial Company, UK “At present, I don’t know if the reliance on perimeter controls alone reduces cyber crime costs.” Director, Tech Company, UK

Ponemon Institute © Research Report Page 15
Business innovations and cyber risk In this year’s cost of cyber crime study, we study the relationship between the most common innovations of companies as they relate to costs of cyber crime. In the past, experts in the security industry have commented that a more sophisticated and stealthier adversary is behind the growing cyber risk and the associated costs. However, our research reveals that business innovations also increase the costs associated with cyber crime. As shown in Figure 12, more than half (51 percent) of organizations engaged a significant new supplier or partner and 49 percent launched a significant new customer-facing application. On average, organizations in this study were involved in four of the innovations studied. This demonstrates that business innovation is a fact of life for security, one for which planning must be done. Figure 12. Eight business innovations experienced by benchmarked organizations Percentage of companies that experienced each given innovation over the past year n = 237 separate companies
30%
32%
35%
37%
42%
46%
49%
51%
0% 10% 20% 30% 40% 50% 60%
Moved into a new geography
Launched a significant new service offering
Acquired or divested a company
Moved into a new market (new customer segment)
Launched a significant new product
Experienced a significant reorganization
Launched a significant new customer-facing application
Taken on a significant new supplier or partner
“The rush to release new business apps has increased our vulnerability.” Manager, FSI, Australia
Ponemon Institute © Research Report Page 16
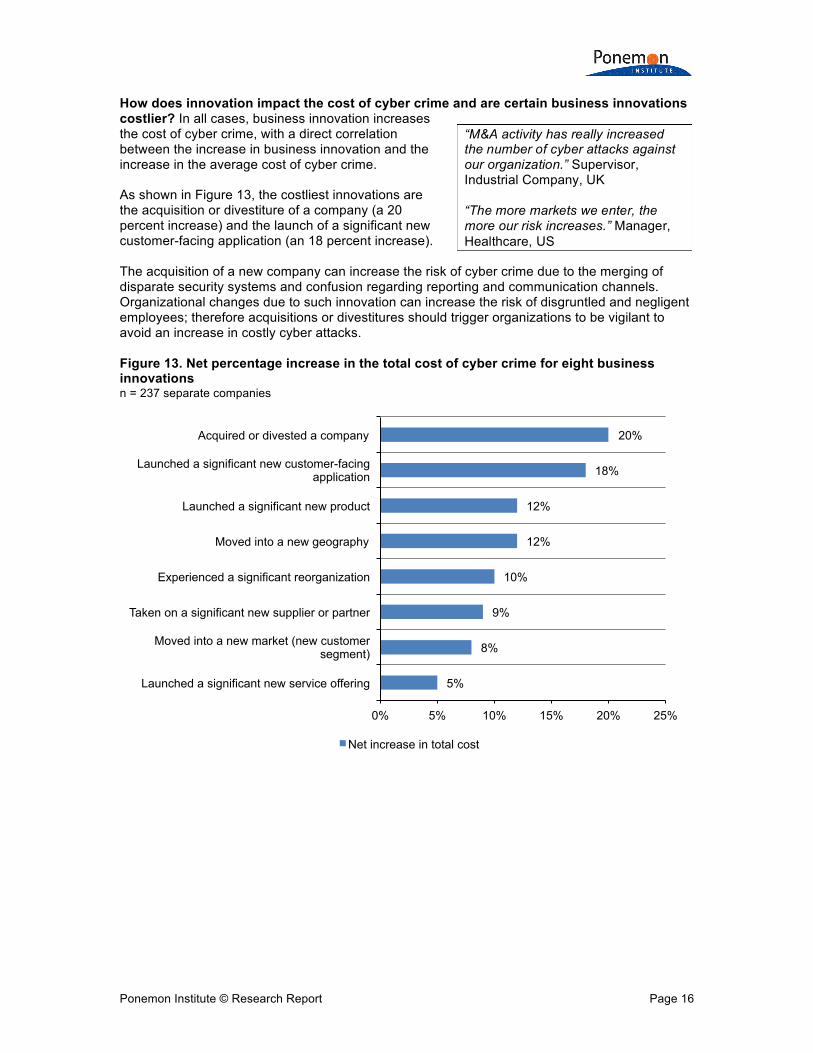
How does innovation impact the cost of cyber crime and are certain business innovations costlier? In all cases, business innovation increases the cost of cyber crime, with a direct correlation between the increase in business innovation and the increase in the average cost of cyber crime. As shown in Figure 13, the costliest innovations are the acquisition or divestiture of a company (a 20 percent increase) and the launch of a significant new customer-facing application (an 18 percent increase). The acquisition of a new company can increase the risk of cyber crime due to the merging of disparate security systems and confusion regarding reporting and communication channels. Organizational changes due to such innovation can increase the risk of disgruntled and negligent employees; therefore acquisitions or divestitures should trigger organizations to be vigilant to avoid an increase in costly cyber attacks. Figure 13. Net percentage increase in the total cost of cyber crime for eight business innovations n = 237 separate companies
5%
8%
9%
10%
12%
12%
18%
20%
0% 5% 10% 15% 20% 25%
Launched a significant new service offering
Moved into a new market (new customer segment)
Taken on a significant new supplier or partner
Experienced a significant reorganization
Moved into a new geography
Launched a significant new product
Launched a significant new customer-facing application
Acquired or divested a company
Net increase in total cost
“M&A activity has really increased the number of cyber attacks against our organization.” Supervisor, Industrial Company, UK “The more markets we enter, the more our risk increases.” Manager, Healthcare, US

Ponemon Institute © Research Report Page 17
The more business innovations an organization pursues, the costlier the attacks. Organizations that engaged in more than five innovations experienced a cost of cyber crime above the average of $9.5 million, as shown in Figure 14. Figure 14. Total cost of cyber crime by the number of innovations experienced US$ millions, n = 237 separate companies
$7.0 $7.2 $8.2 $8.1
$9.4 $10.4
$11.5 $11.0
$12.8
$-
$2.0
$4.0
$6.0
$8.0
$10.0
$12.0
$14.0
Zero One Two Three Four Five Six Seven Eight
Total cost (US$ millions) Average
“The more markets we enter, the more our risk increases.” Manager, Healthcare Company, US

Ponemon Institute © Research Report Page 18
How to reduce risk and continue to innovate This study’s findings show that a high security profile decreases the cost of cyber crime for innovative companies. Organizations that have a high security profile experienced an average cost of cyber crime of $7.9 million, which is below the average. In contrast, organizations with a low security profile have an average cost of $11.1 million, as shown in Figure 15. Figure 15. Total cost of cyber crime for low versus high security profiles US dollars, n = 237 separate companies
$11,113,960
$7,890,130
$-
$2,000,000
$4,000,000
$6,000,000
$8,000,000
$10,000,000
$12,000,000
Low security profile (at or below 10 items) High security profile (above 10 items)

Ponemon Institute © Research Report Page 19
Business innovation risk can be successfully mitigated by a strong security posture. As shown in Figure 16, companies with a low security profile that are actively innovating face a cost of cyber crime well above the average. This is a positive finding for security professionals because the cost of cyber crime can be quantifiably reduced even in a highly innovative organization. The key is to focus on the right solutions, anticipate the impact of innovation on the company’s security profile and treat business innovation as a standard operating procedure, rather than an exception. Figure 16. The total cost interrelationship between business innovation and security profile US$ millions, n = 237 separate companies
$9.35
$6.63
$13.45
$9.40
$-
$2.00
$4.00
$6.00
$8.00
$10.00
$12.00
$14.00
$16.00
Low security profile High security profile
Low business innovation High business innovation
“Our company recently entered a new market overseas with a new customer base. Fortunately, they involved our team in assessing potential cyber risks.” Director, Services Company, US

Ponemon Institute © Research Report Page 20
Part 3. Three Key Security Capabilities 1. Information management and governance practices As shown in Figure 17, the majority of organizations are not adopting information management and governance practices that could reduce the cost of cyber crime. Only 39 percent of companies have advanced procedures for backup and recovery. Only 28 percent of companies have a formal information governance program. Figure 17. Eight steps taken to ensure information management and governance n = 237 separate companies
25%
27%
28%
39%
40%
40%
41%
43%
0% 10% 20% 30% 40% 50%
The company has a formal approach or strategy for securing the IoT
The company has a formal approach or strategy for the new EU General Data Privacy Regulation
The company has a formal information governance program
The company has advanced procedures for backup and recovery operations
The company shares threat intelligence and/or collaborates with industry partners/competitors on
security issues
Within the company, physical and logical security functions are integrated
Within the company, security policies and procedures are audited for compliance
Within the company, security operations are integrated with enterprise risk management
activities
Ponemon Institute © Research Report Page 21
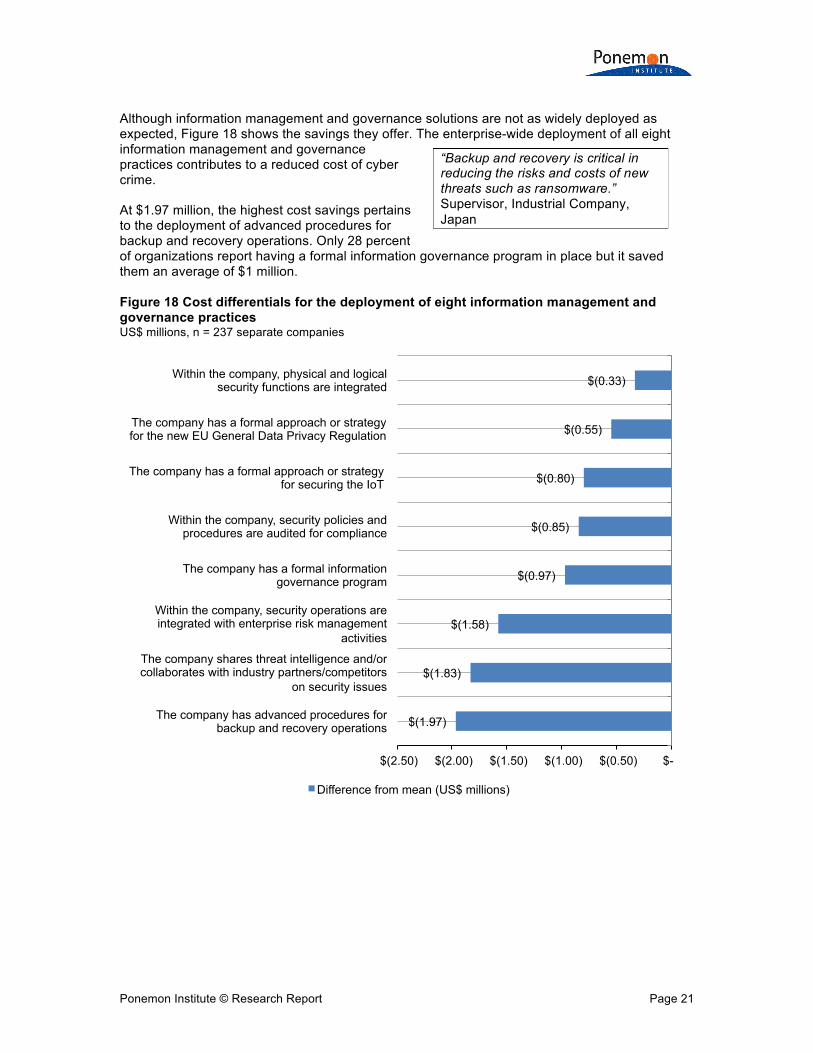
Although information management and governance solutions are not as widely deployed as expected, Figure 18 shows the savings they offer. The enterprise-wide deployment of all eight information management and governance practices contributes to a reduced cost of cyber crime. At $1.97 million, the highest cost savings pertains to the deployment of advanced procedures for backup and recovery operations. Only 28 percent of organizations report having a formal information governance program in place but it saved them an average of $1 million. Figure 18 Cost differentials for the deployment of eight information management and governance practices US$ millions, n = 237 separate companies
$(1.97)
$(1.83)
$(1.58)
$(0.97)
$(0.85)
$(0.80)
$(0.55)
$(0.33)
$(2.50) $(2.00) $(1.50) $(1.00) $(0.50) $-
The company has advanced procedures for backup and recovery operations
The company shares threat intelligence and/or collaborates with industry partners/competitors
on security issues
Within the company, security operations are integrated with enterprise risk management
activities
The company has a formal information governance program
Within the company, security policies and procedures are audited for compliance
The company has a formal approach or strategy for securing the IoT
The company has a formal approach or strategy for the new EU General Data Privacy Regulation
Within the company, physical and logical security functions are integrated
Difference from mean (US$ millions)
“Backup and recovery is critical in reducing the risks and costs of new threats such as ransomware.” Supervisor, Industrial Company, Japan

Ponemon Institute © Research Report Page 22
Following are seven technologies used to enable a high level of information management and governance. Figure 19 shows 49 percent of companies deploy advanced access management systems across the enterprise. Forty-six percent say their company deploys encryption technologies across the enterprise, and 41 percent are persistent users of GRC tools. Only 25 percent of companies utilize automated policy management tools. Figure 19. Seven security technologies used to enable information management and governance n = 237 separate companies
25%
38%
40%
40%
41%
46%
49%
0% 10% 20% 30% 40% 50% 60%
Automated policy management tools
File and document-level control tools (i.e., DRM)
Extensive use of data loss prevention tools
Threat intelligence systems
Enterprise deployment of GRC tools
Extensive deployment of encryption technologies
Advanced access management systems

Ponemon Institute © Research Report Page 23
Does the persistent use of security technologies contribute to a reduced cost of cyber crime? According to Figure 20, if all seven technologies are deployed, an organization can save an average of $3.17 million. Not using any of these technologies may increase cyber crime costs by $2.85 million. Figure 20. Cost differentials for the persistent use of security tools that enable information management and governance US$ millions, n = 237 separate companies
$2.85
$0.99
$0.28
$(0.62)
$(1.16)
$(1.65)
$(2.19)
$(3.17)
$(4.00) $(3.00) $(2.00) $(1.00) $- $1.00 $2.00 $3.00 $4.00
None
One
Two
Three
Four
Five
Six
Seven
Difference from mean (US$ millions)

Ponemon Institute © Research Report Page 24
2. Application security For the first time, we measure the use of nine application security controls in the reduction of the cost of cyber crime. As shown in Figure 21, the application security controls most often used are penetration testing (53 percent of organizations), security patch management (47 percent of organizations), dynamic scanning (44 percent of organizations) and static scanning (44 percent of organizations). Figure 21. Percentage use of nine application security controls n = 237 separate companies
Based on the findings of this study, it is surprising application security controls are not more widely deployed. The pressure to “rush to release” is a huge risk because, as shown in Figure 13, the launch of major customer-facing applications increases the average cost of cyber crime by 18 percent.
21%
29%
30%
34%
40%
44%
44%
47%
53%
0% 10% 20% 30% 40% 50% 60%
Run-time application self protection
Code review and debugging system
Security testing throughout the SDLC
Data masking or redaction of live data (during testing)
Educate developers on safe coding
Static scanning
Dynamic scanning
Security patch management
Penetration testing
Percentage of companies that implement control
“We need to tighten up our SDLC in order to reduce the risk and costs.” Manager, Industrial Company, Germany
Ponemon Institute © Research Report Page 25
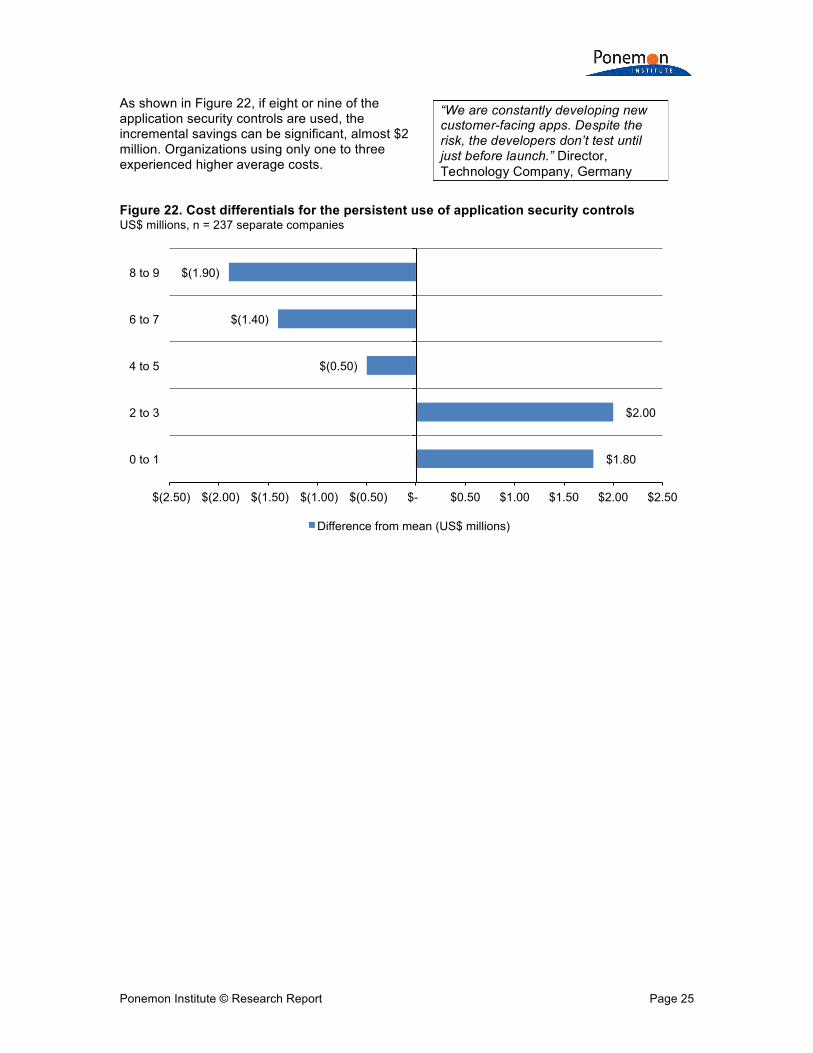
As shown in Figure 22, if eight or nine of the application security controls are used, the incremental savings can be significant, almost $2 million. Organizations using only one to three experienced higher average costs. Figure 22. Cost differentials for the persistent use of application security controls US$ millions, n = 237 separate companies
$1.80
$2.00
$(0.50)
$(1.40)
$(1.90)
$(2.50) $(2.00) $(1.50) $(1.00) $(0.50) $- $0.50 $1.00 $1.50 $2.00 $2.50
0 to 1
2 to 3
4 to 5
6 to 7
8 to 9
Difference from mean (US$ millions)
“We are constantly developing new customer-facing apps. Despite the risk, the developers don’t test until just before launch.” Director, Technology Company, Germany
Ponemon Institute © Research Report Page 26
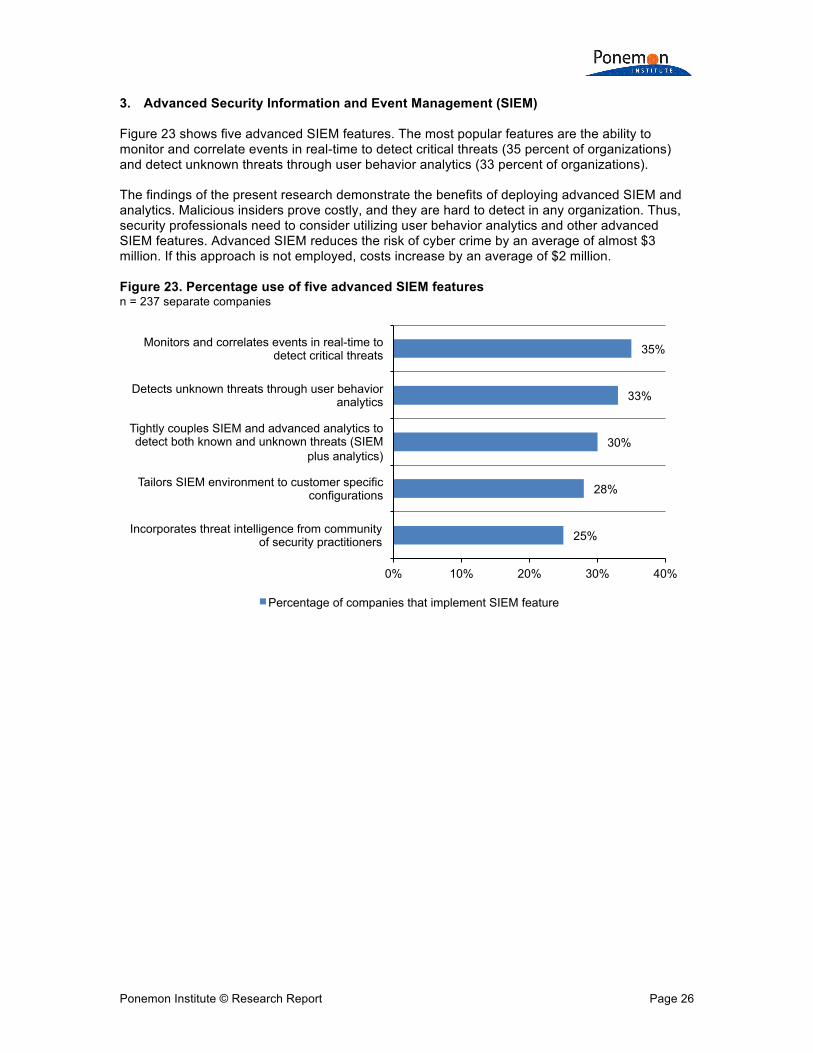
3. Advanced Security Information and Event Management (SIEM) Figure 23 shows five advanced SIEM features. The most popular features are the ability to monitor and correlate events in real-time to detect critical threats (35 percent of organizations) and detect unknown threats through user behavior analytics (33 percent of organizations). The findings of the present research demonstrate the benefits of deploying advanced SIEM and analytics. Malicious insiders prove costly, and they are hard to detect in any organization. Thus, security professionals need to consider utilizing user behavior analytics and other advanced SIEM features. Advanced SIEM reduces the risk of cyber crime by an average of almost $3 million. If this approach is not employed, costs increase by an average of $2 million. Figure 23. Percentage use of five advanced SIEM features n = 237 separate companies
25%
28%
30%
33%
35%
0% 10% 20% 30% 40%
Incorporates threat intelligence from community of security practitioners
Tailors SIEM environment to customer specific configurations
Tightly couples SIEM and advanced analytics to detect both known and unknown threats (SIEM
plus analytics)
Detects unknown threats through user behavior analytics
Monitors and correlates events in real-time to detect critical threats
Percentage of companies that implement SIEM feature
Ponemon Institute © Research Report Page 27
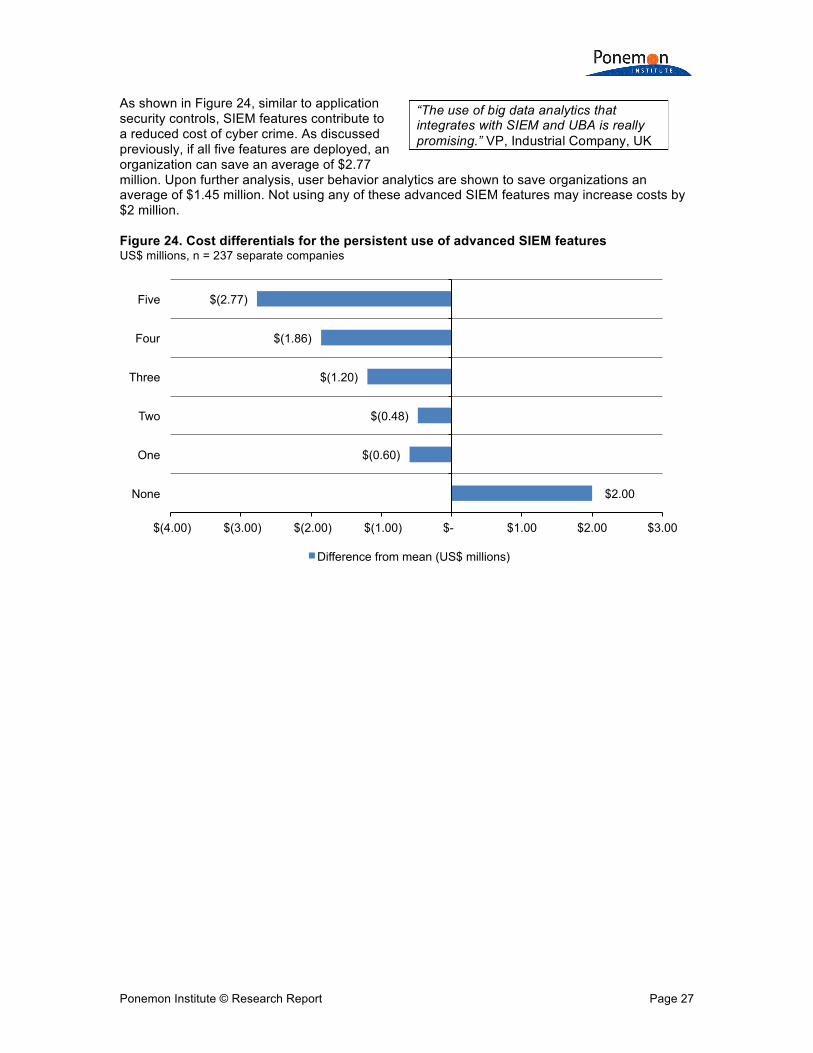
As shown in Figure 24, similar to application security controls, SIEM features contribute to a reduced cost of cyber crime. As discussed previously, if all five features are deployed, an organization can save an average of $2.77 million. Upon further analysis, user behavior analytics are shown to save organizations an average of $1.45 million. Not using any of these advanced SIEM features may increase costs by $2 million. Figure 24. Cost differentials for the persistent use of advanced SIEM features US$ millions, n = 237 separate companies
$2.00
$(0.60)
$(0.48)
$(1.20)
$(1.86)
$(2.77)
$(4.00) $(3.00) $(2.00) $(1.00) $- $1.00 $2.00 $3.00
None
One
Two
Three
Four
Five
Difference from mean (US$ millions)
“The use of big data analytics that integrates with SIEM and UBA is really promising.” VP, Industrial Company, UK
Ponemon Institute © Research Report Page 28
Part 4. Framework To determine the average cost of cyber crime, the 237 organizations in the study were asked to report what they spent to deal with cyber crimes experienced over four consecutive weeks. Once costs over the four-week period were compiled and validated, these figures were then grossed-up to determine the annualized cost.3 In our experience, a traditional survey approach does not capture the necessary details required to extrapolate cyber crime costs. Therefore, we conduct field-based research that involves interviewing senior-level personnel about their organizations’ actual cyber crime incidents. Approximately 10 months of effort is required to recruit companies, build an activity-based cost model to analyze the data, collect source information and complete the analysis.
For consistency purposes, our benchmark sample consists of only larger-sized organizations (i.e., a minimum of approximately 1,000 enterprise seats4). The study examines the total costs organizations incur when responding to cyber crime incidents. These include the costs to detect, recover, investigate and manage the incident response. Also covered are the costs that result in after-the-fact activities and efforts to contain additional costs from business disruption and the loss of customers. These costs do not include the plethora of expenditures and investments made to sustain an organization’s security posture or compliance with standards, policies and regulations. The purpose of this research is to provide guidance on what a successful cyber attack can cost an organization. Our cost of cyber crime study is unique in addressing the core systems and business process-related activities that drive a range of expenditures associated with a company’s response to cyber crime. In this study, we define a successful attack as one that results in the infiltration of a company’s core networks or enterprise systems. It does not include the plethora of attacks stopped by a company’s firewall defenses.
3The gross-up statistic: Annualized revenue = [cost estimate]/[4/52 weeks]. 4 Enterprise seats refer to the number of direct connections to the network and enterprise systems.
Ponemon Institute © Research Report Page 29
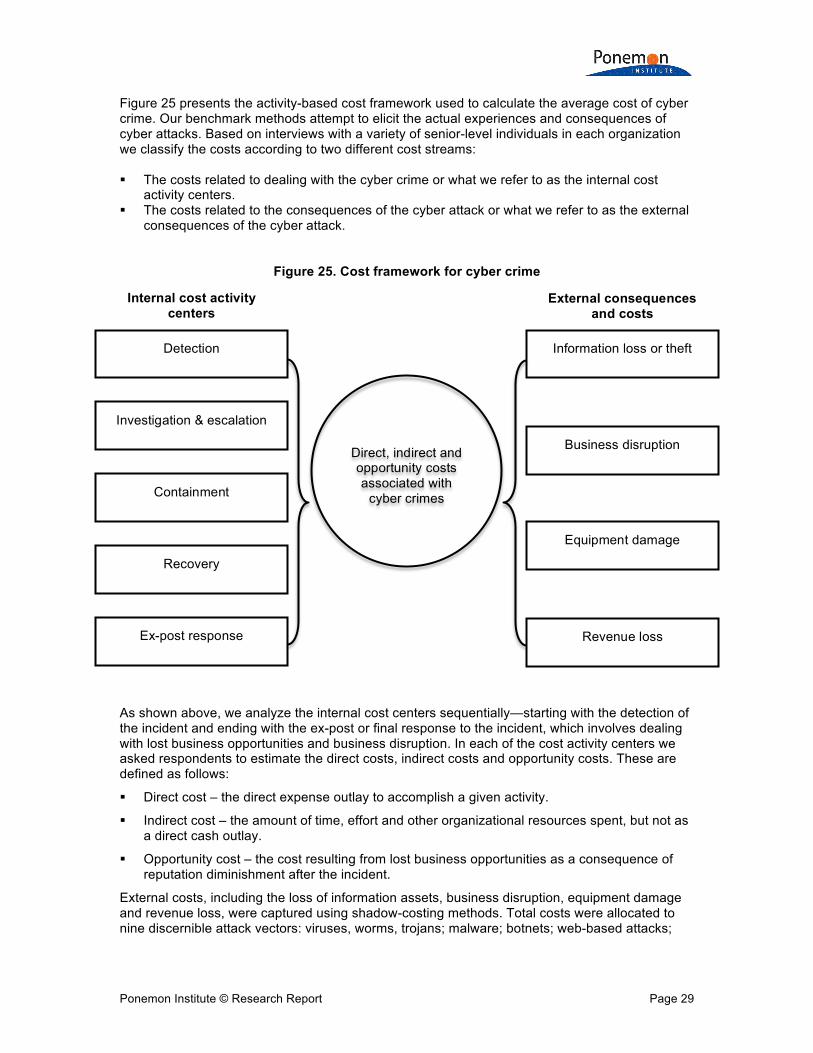
Figure 25 presents the activity-based cost framework used to calculate the average cost of cyber crime. Our benchmark methods attempt to elicit the actual experiences and consequences of cyber attacks. Based on interviews with a variety of senior-level individuals in each organization we classify the costs according to two different cost streams: ! The costs related to dealing with the cyber crime or what we refer to as the internal cost
activity centers. ! The costs related to the consequences of the cyber attack or what we refer to as the external
consequences of the cyber attack.
Figure 25. Cost framework for cyber crime
As shown above, we analyze the internal cost centers sequentially—starting with the detection of the incident and ending with the ex-post or final response to the incident, which involves dealing with lost business opportunities and business disruption. In each of the cost activity centers we asked respondents to estimate the direct costs, indirect costs and opportunity costs. These are defined as follows:
! Direct cost – the direct expense outlay to accomplish a given activity.
! Indirect cost – the amount of time, effort and other organizational resources spent, but not as a direct cash outlay.
! Opportunity cost – the cost resulting from lost business opportunities as a consequence of reputation diminishment after the incident.
External costs, including the loss of information assets, business disruption, equipment damage and revenue loss, were captured using shadow-costing methods. Total costs were allocated to nine discernible attack vectors: viruses, worms, trojans; malware; botnets; web-based attacks;
Detection
Investigation & escalation
Containment
Recovery
Ex-post response
Information loss or theft
Business disruption
Equipment damage
Revenue loss
Direct, indirect and opportunity costs associated with
cyber crimes
Internal cost activity centers
External consequences and costs

Ponemon Institute © Research Report Page 30
phishing and social engineering; malicious insiders; stolen or damaged devices; malicious code (including SQL injection); and denial of services.5 This study addresses activities related to the core processes that drive a range of expenditures associated with a company’s cyber attack. The five internal cost activity centers in our framework include:6 ! Detection: Activities that enable an organization to reasonably detect and possibly deter
cyber attacks or advanced threats. This includes allocated (overhead) costs of certain enabling technologies that enhance mitigation or early detection.
! Investigation and escalation: Activities necessary to thoroughly uncover the source, scope, and magnitude of one or more incidents. The escalation activity also includes the steps taken to organize an initial management response.
! Containment: Activities that focus on stopping or lessening the severity of cyber attacks or advanced threats. These include shutting down high-risk attack vectors such as insecure applications or endpoints.
! Recovery: Activities associated with repairing and remediating the organization’s systems and core business processes. These include the restoration of damaged information assets and other IT (data center) assets.
! Ex-post response: Activities to help the organization minimize potential future attacks. These include containing costs from business disruption and information loss as well as adding new enabling technologies and control systems.
In addition to the above process-related activities, organizations often experience external consequences or costs associated with the aftermath of successful attacks – which are defined as attacks that infiltrate the organization’s network or enterprise systems. Accordingly, our research shows that four general cost activities associated with these external consequences are as follows: ! Cost of information loss or theft: Loss or theft of sensitive and confidential information as a
result of a cyber attack. Such information includes trade secrets, intellectual property (including source code), customer information and employee records. This cost category also includes the cost of data breach notification in the event that personal information is wrongfully acquired.
! Cost of business disruption: The economic impact of downtime or unplanned outages that prevent the organization from meeting its data processing requirements.
! Cost of equipment damage: The cost to remediate equipment and other IT assets as a result
of cyber attacks on information resources and critical infrastructure. ! Lost revenue: The loss of customers (churn) and other stakeholders because of system
delays or shutdowns as a result of a cyber attack. To extrapolate this cost, we use a shadow costing method that relies on the “lifetime value” of an average customer as defined for each participating organization.
5 We acknowledge that these nine attack categories are not mutually independent and they do not represent an exhaustive list. Classification of a given attack was made by the researcher and derived from the facts collected during the benchmarking process. 6 Internal costs are extrapolated using labor (time) as a surrogate for direct and indirect costs. This is also used to allocate an overhead component for fixed costs such as multiyear investments in technologies.
Ponemon Institute © Research Report Page 31
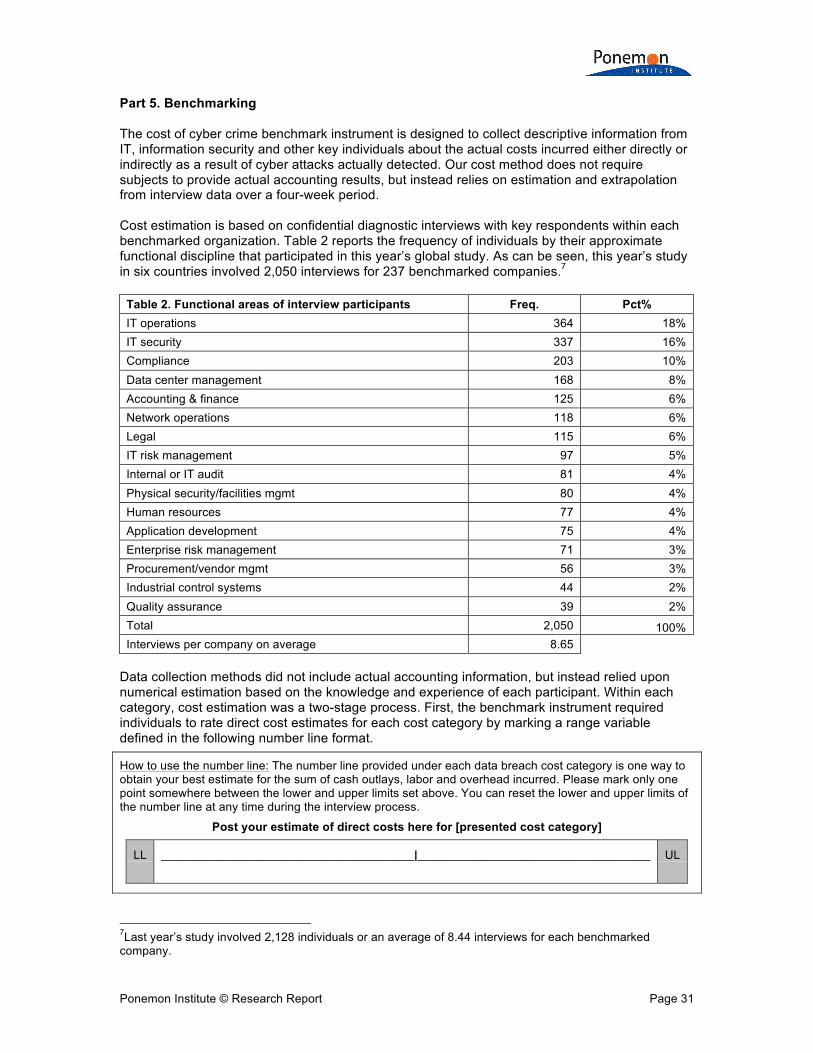
Part 5. Benchmarking The cost of cyber crime benchmark instrument is designed to collect descriptive information from IT, information security and other key individuals about the actual costs incurred either directly or indirectly as a result of cyber attacks actually detected. Our cost method does not require subjects to provide actual accounting results, but instead relies on estimation and extrapolation from interview data over a four-week period. Cost estimation is based on confidential diagnostic interviews with key respondents within each benchmarked organization. Table 2 reports the frequency of individuals by their approximate functional discipline that participated in this year’s global study. As can be seen, this year’s study in six countries involved 2,050 interviews for 237 benchmarked companies.7
Table 2. Functional areas of interview participants Freq. Pct% IT operations 364 18% IT security 337 16% Compliance 203 10% Data center management 168 8% Accounting & finance 125 6% Network operations 118 6% Legal 115 6% IT risk management 97 5% Internal or IT audit 81 4% Physical security/facilities mgmt 80 4% Human resources 77 4% Application development 75 4% Enterprise risk management 71 3% Procurement/vendor mgmt 56 3% Industrial control systems 44 2% Quality assurance 39 2% Total 2,050 100% Interviews per company on average 8.65
Data collection methods did not include actual accounting information, but instead relied upon numerical estimation based on the knowledge and experience of each participant. Within each category, cost estimation was a two-stage process. First, the benchmark instrument required individuals to rate direct cost estimates for each cost category by marking a range variable defined in the following number line format.
How to use the number line: The number line provided under each data breach cost category is one way to obtain your best estimate for the sum of cash outlays, labor and overhead incurred. Please mark only one point somewhere between the lower and upper limits set above. You can reset the lower and upper limits of the number line at any time during the interview process.
Post your estimate of direct costs here for [presented cost category]
LL ______________________________________|___________________________________ UL
7Last year’s study involved 2,128 individuals or an average of 8.44 interviews for each benchmarked company.

Ponemon Institute © Research Report Page 32
The numerical value obtained from the number line, rather than a point estimate for each presented cost category, preserved confidentiality and ensured a higher response rate. The benchmark instrument also required practitioners to provide a second estimate for indirect and opportunity costs, which was done separately. Cost estimates were then compiled for each organization based on the relative magnitude of these costs in comparison to a direct cost within a given category. Finally, we administered general interview questions to obtain additional facts, including estimated revenue losses as a result of the cyber crime. The size and scope of survey items was limited to known cost categories that cut across different industry sectors. In our experience, a survey focusing on process yields a higher response rate and higher quality of results. We used a paper instrument, rather than an electronic survey, to provide greater assurances of confidentiality. To maintain complete confidentiality, the survey instrument did not capture company-specific information of any kind. Subject materials contained no tracking codes or other methods that could link responses to participating companies. We carefully limited items to only those cost activities we considered crucial to the measurement of cyber crime cost to keep the benchmark instrument to a manageable size. Based on discussions with learned experts, the final set of items focused on a finite set of direct or indirect cost activities. After collecting benchmark information, each instrument was examined carefully for consistency and completeness. In this study, a few companies were rejected because of incomplete, inconsistent or blank responses. Field research was conducted over several months concluding in August 2016. To maintain consistency for all benchmark companies, information was collected about the organizations’ cyber crime experience was limited to four consecutive weeks. This time frame was not necessarily the same time period as other organizations in this study. The extrapolated direct, indirect and opportunity costs of cyber crime were annualized by dividing the total cost collected over four weeks (ratio = 4/52 weeks).

Ponemon Institute © Research Report Page 33
Part 6. Benchmark Sample Recruitment for the annual study started with a personalized letter, with a follow-up phone call to 1,688 contacts for possible participation. Of these, 237 organizations permitted Ponemon Institute to perform the benchmark analysis. Pie Chart 1 summarizes the current sample of participating companies based on 17 primary industry classifications. As can be seen, financial services (16 percent) represent the largest segment. This includes retail banking, insurance, brokerage and credit card companies. The second and third largest segments include industrial (12 percent) and technology (12 percent). The technology segment includes companies in software, hardware and IT management. Pie Chart 1. Industry sectors of participating organizations Consolidated view, n = 237 separate companies
16%
12%
12%
10% 10%
9%
7%
5%
4%
4% 2%
2% Financial services Technology Industrial Public sector Services Retail Consumer products Utilities & energy Transportation Healthcare Media Hospitality Communications Education & research Pharmaceutical Automotive Agriculture
Ponemon Institute © Research Report Page 34
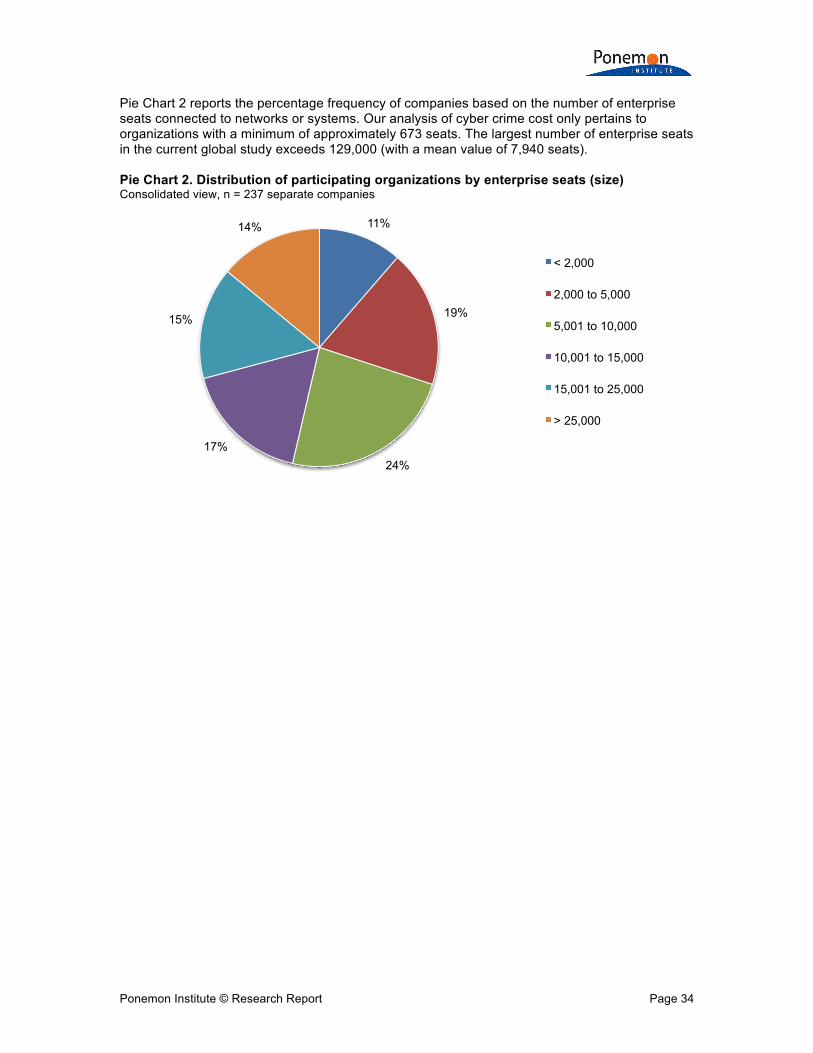
Pie Chart 2 reports the percentage frequency of companies based on the number of enterprise seats connected to networks or systems. Our analysis of cyber crime cost only pertains to organizations with a minimum of approximately 673 seats. The largest number of enterprise seats in the current global study exceeds 129,000 (with a mean value of 7,940 seats). Pie Chart 2. Distribution of participating organizations by enterprise seats (size) Consolidated view, n = 237 separate companies
11%
19%
24% 17%
15%
14%
< 2,000
2,000 to 5,000
5,001 to 10,000
10,001 to 15,000
15,001 to 25,000
> 25,000

Ponemon Institute © Research Report Page 35
Part 7. Limitations & Conclusions This study utilizes a confidential and proprietary benchmark method that has been successfully deployed in earlier Ponemon Institute research. However, there are inherent limitations to benchmark research that need to be carefully considered before drawing conclusions from findings. ! Non-statistical results: The purpose of this study is descriptive rather than normative
inference. The current study draws upon a representative, non-statistical sample of organizations of mostly larger entities experiencing one or more cyber attacks during a four-week fielding period. Statistical inferences, margins of error and confidence intervals cannot be applied to these data given the nature of our sampling plan.
! Non-response: The current findings are based on a small representative sample of completed
case studies. Benchmark surveys were initially mailed to a targeted group of organizations, all believed to have experienced one or more cyber attacks. A total of 252 companies provided usable benchmark surveys. Non-response bias was not tested which means it is possible that companies that did not participate are substantially different in terms of the methods used to manage the cyber crime containment and recovery process, as well as the underlying costs involved.
! Sampling-frame bias: Given that our sampling frame is judgmental, the quality of results is
influenced by the degree to which the frame is representative of the population of companies being studied. It is our belief that the current sampling frame is biased toward companies with more mature information security programs.
! Company-specific information: The benchmark information is sensitive and confidential.
Thus, the current instrument does not capture company-identifying information. It also allows individuals to use categorical response variables to disclose demographic information about the company and industry category. Industry classification relies on self-reported results.
! Unmeasured factors: To keep the survey concise and focused, we decided to omit other
important variables from our analysis such as leading trends and organizational characteristics. The extent to which omitted variables might explain benchmark results cannot be estimated at this time.
! Estimated cost results. The quality of survey research is based on the integrity of confidential
responses received from companies. While certain checks and balances can be incorporated into the survey process, there is always the possibility that respondents did not provide truthful responses. In addition, the use of a cost estimation technique (termed shadow costing methods) rather than actual cost data could create significant bias in presented results.

Ponemon Institute © Research Report Page 36
If you have questions or comments regarding this research report, or if you would like to obtain additional copies of the document (including permission to quote or reuse this report), please contact the institute by letter, phone or email:
Ponemon Institute LLC Attn: Research Department
2308 US 31 North Traverse City, Michigan 49629 USA
1.800.887.3118 [email protected]
Ponemon Institute
Advancing Responsible Information Management
Ponemon Institute is dedicated to independent research and education that advances responsible information and privacy management practices within business and government. Our mission is to conduct high quality, empirical studies on critical issues affecting the management and security of sensitive information about people and organizations. As a member of the Council of American Survey Research Organizations (CASRO), we uphold strict data confidentiality, privacy and ethical research standards. We do not collect any personally identifiable information from individuals (or company identifiable information in our business research). Furthermore, we have strict quality standards to ensure that subjects are not asked extraneous, irrelevant or improper questions.