2016 biodiversity surveys of the cod grounds and pimpernel ... · 2016 biodiversity surveys of the...
TRANSCRIPT
2016 Biodiversity Surveys of the
Cod Grounds and Pimpernel Rocks
Commonwealth Marine Reserves
Rick D Stuart-Smith, Daniela Ceccarelli, Graham J Edgar, Antonia T Cooper
Report to Parks Australia, Department of the Environment
2017
Citation
Stuart-Smith RD, Ceccarelli D, Edgar GJ, Cooper AT (2017) 2016 Biodiversity surveys of the Cod Grounds and Pimpernel Rocks Commonwealth Marine Reserves. Report for Parks Australia, Department of the Environment. Reef Life Survey Foundation Incorporated.
Copyright and disclaimer
© 2017 RLSF To the extent permitted by law, all rights are reserved and no part of this publication covered by copyright may be reproduced or copied in any form or by any means except with the written permission of The Reef Life Survey Foundation.
Important disclaimer
The RLSF advises that the information contained in this publication comprises general statements based on scientific research. The reader is advised and needs to be aware that such information may be incomplete or unable to be used in any specific situation. No reliance or actions must therefore be made on that information without seeking prior expert professional, scientific and technical advice. To the extent permitted by law, The RLSF (including its volunteers and consultants) excludes all liability to any person for any consequences, including but not limited to all losses, damages, costs, expenses and any other compensation, arising directly or indirectly from using this publication (in part or in whole) and any information or material contained in it.
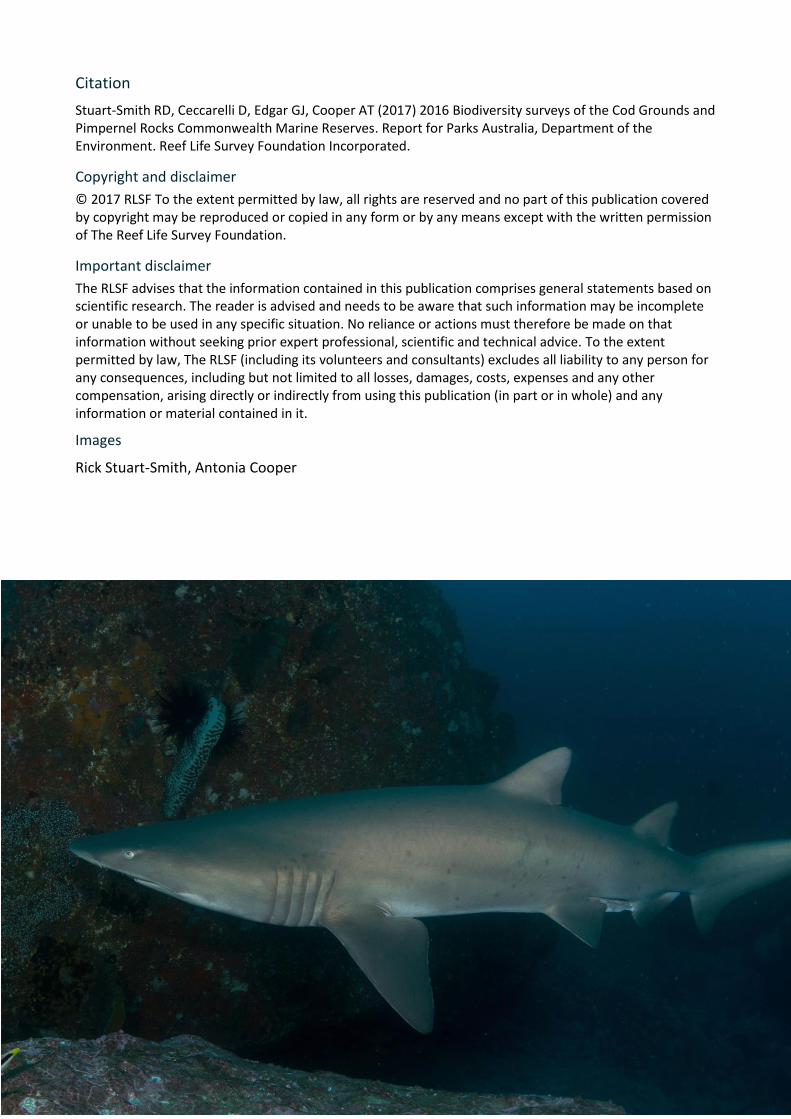
Images
Rick Stuart-Smith, Antonia Cooper

ii | 2016 biodiversity surveys of the Cod Grounds and Pimpernel Rocks Commonwealth Marine Reserves
Contents
Executive summary ................................................................................ vi
1 Introduction ................................................................................... 1
2 Methods ........................................................................................ 3
3 Results ......................................................................................... 10
4 Discussion .................................................................................... 31
5 Recommendations ....................................................................... 34
6 Acknowledgements ..................................................................... 35
7 References ................................................................................... 36
8 Appendices .................................................................................. 38
2016 biodiversity surveys of the God Grounds and Pimpernel Rocks Commonwealth Marine Reserves| iii
Figures Figure 1. Map of Cod Grounds (a), Pimpernel Rocks and Solitary Islands (b) sites surveyed from 2009 - 2016. ............................................................................................................................................................. 3
Figure 2. Stylised representation of method 1 survey technique ................................................................ 7
Figure 3. Stylised representation of method 2 survey technique ................................................................ 8
Figure 4. Multidimensional Scaling (MDS) plot of reef fish biomass in the Cod Grounds and Solitary Islands CMRs and reference sites, performed on the Bray-Curtis similarity matrix of the square-root transformed data. a) Analysis of the Cod Grounds CMR by year and CMR status, with vectors shown if they had a correlation of at least 0.5; b) analysis of both CMRs and reference sites, with years pooled for the Cod Grounds CMR, with vectors shown if they had a correlation value of at least 0.6. ANOSIM results are given for the Global R and for individual significant comparisons. ...................................................... 13
Figure 5. Total a) abundance, b) species richness and c) biomass of fishes per 500 m2 recorded in the Cod Grounds CMR and reference sites in 2009 and 2016, and in the Solitary Islands CMR (Pimpernel Rock) and reference sites. Letters group sites that were similar, analysed by ANCOVA (with depth as a covariate) and Tukey HSD test on the log(x+1) transformed data. ............................................................ 14
Figure 6. Biomass per 500 m2 of a) species larger than 40 cm TL, and b) biomass of exploited species recorded in the Cod Grounds CMR and reference sites in 2009 and 2016, and in the Solitary Islands CMR (Pimpernel Rock) and reference sites. Letters group sites that were similar, analysed by ANCOVA (with depth as a covariate) and Tukey HSD test on the log(x+1) transformed data. .......................................... 15
Figure 7. Variation in the species richness, abundance and biomass of the fish community recorded on transects at different depths, inside the CMRs and at reference sites. Data have been binned into depth categories, with sample sizes as follows: 1, 5 and 3 transects for Cod Grounds reference sites; 9, 8, 5, 3 and 5 transects for CGCMR; 8 and 21 transects at the SI reference sites; and 1, 1 and 2 transects in the SICMR. Y-axes represent mean values (+SE) per transect (500 m2). .......................................................... 16
Figure 8. Distribution of trophic groups (per 500 m2) among a) the Cod Grounds and reference sites, and the Solitary Islands and reference sites, and b) variability in the Cod Grounds CMR and reference sites between 2009 and 2016. Letters group locations with similar biomass (see relevant analysis results in Table 3); letters are omitted for trophic groups with no significant differences. Values plotted are the log(x+1) +/- 1 SE of the biomass of the groups, to visualise groups with lower biomass. There were no corallivores in the Cod Grounds; this group is omitted from b). ................................................................ 17
Figure 9. Multidimensional Scaling (MDS) plot of mobile invertebrate abundance in the Cod Grounds and Solitary Islands CMRs and reference sites, performed on the Bray-Curtis similarity matrix of the square-root transformed data. a) Analysis of the Cod Grounds CMR by year and CMR status, with vectors shown if they had a correlation of at least 0.5; b) analysis of both CMRs and reference sites, with years pooled for the Cod Grounds CMR, with vectors shown if they had a correlation value of at least 0.6. ANOSIM results are given for the Global R and for individual significant comparisons; for a), all comparisons were significant. .................................................................................................................................................. 22
Figure 10. Total a) abundance, b) species richness and c) urchin abundance and d) Centrostephanus rodgersii abundance recorded in the Cod Grounds CMR and reference sites in 2009 and 2016, and in the Solitary Islands CMR (Pimpernel Rock) and reference sites (per 100 m2). Letters group sites that were similar, analysed by ANCOVA (with depth as a covariate) and Tukey HSD test on the log(x+1) transformed data. ....................................................................................................................................... 23
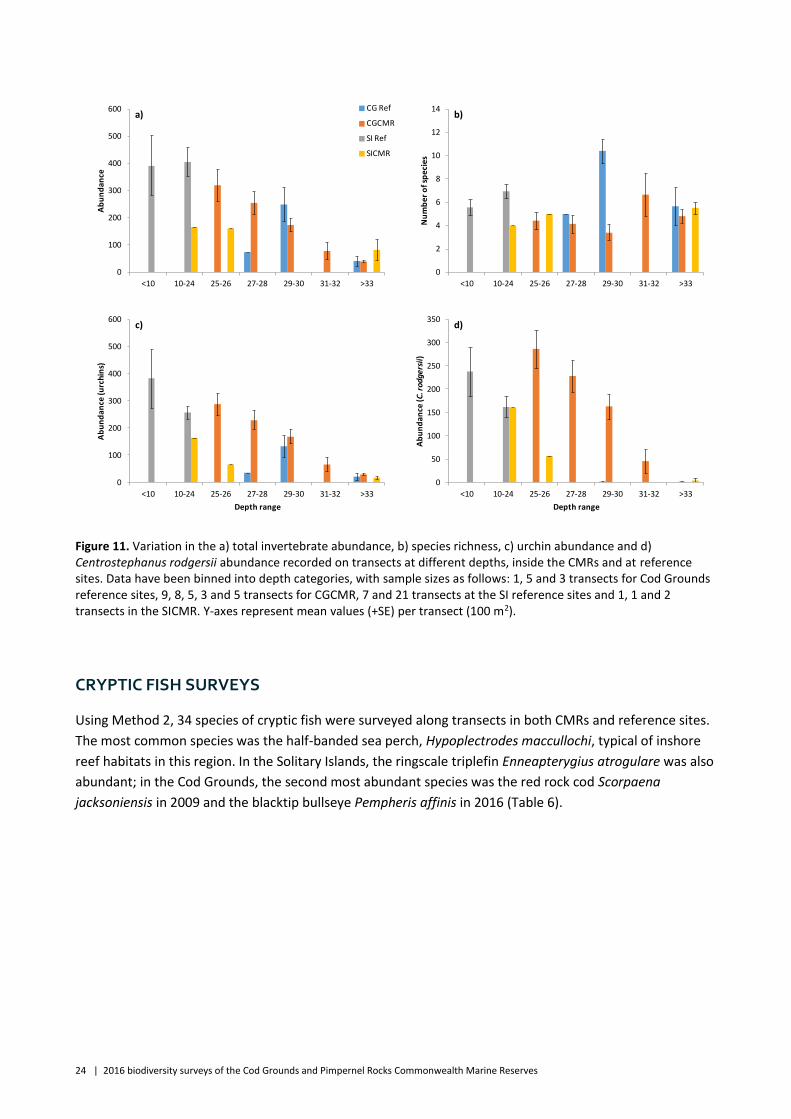
Figure 11. Variation in the a) total invertebrate abundance, b) species richness, c) urchin abundance and d) Centrostephanus rodgersii abundance recorded on transects at different depths, inside the CMRs and at reference sites. Data have been binned into depth categories, with sample sizes as follows: 1, 5 and 3 transects for Cod Grounds reference sites, 9, 8, 5, 3 and 5 transects for CGCMR, 7 and 21 transects at the SI reference sites and 1, 1 and 2 transects in the SICMR. Y-axes represent mean values (+SE) per transect (100 m2). ....................................................................................................................................... 24

iv | 2016 biodiversity surveys of the Cod Grounds and Pimpernel Rocks Commonwealth Marine Reserves
Figure 12. Multidimensional Scaling (MDS) plot of benthic community % cover in the Cod Grounds and Solitary Islands CMRs and reference sites, performed on the Bray-Curtis similarity matrix of the square-root transformed data. a) Analysis of the Cod Grounds CMR by year and CMR status, with vectors shown if they had a correlation of at least 0.5; b) analysis of both CMRs and reference sites, with years pooled for the Cod Grounds CMR, with vectors shown if they had a correlation value of at least 0.5. ANOSIM results are given for the Global R. .............................................................................................................. 28
Figure 13. Percentage cover of a) total cover of live biota, b) number of benthic categories, c) crustose corralline algae, d) live hard coral, e) turf and f) macroalgae recorded on transects inside the CMRs and at reference sites, with Cod Grounds sites divided by survey year. Y-axes represent mean values (+SE) per transect (100 random points). ............................................................................................................. 29
Tables Table 1. Site details including marine park zone (CGCMR: Cod Grounds Commonwealth Marine Reserve; SICMR: Solitary Islands Commonwealth Marine Reserve; Ref: Reference site outside reserve), geographical coordinates (datum = WGS84), depth of transect line, for each site surveyed. For the Cod Grounds, Date and Depth columns separate the original baseline surveys from the more recent follow-up surveys. .................................................................................................................................................... 4
Table 2. Results of ANCOVAs of fish community metrics, combining location CGCMR, SICMR and reference sites for both, and time (2009 and 2016 for the CGCMR and reference sites as an independent factor and depth as a continuous covariate. Analyses were conducted on the log(x+1) transformed data. .................................................................................................................................................................... 15
Table 3. Results of two ANCOVAs of trophic groups, comparing location CGCMR, SICMR and reference sites, and Year x CMR (only for the CGCMR). CMR and Depth results are only shown for the first analysis. Analyses were conducted on the log(x+1) transformed data. There were no corallivores in the Cod Grounds; this group is omitted from the second analysis. Significant results are shown in bold. ............ 17
Table 4. Total frequency of occurrence (transects) and total abundance (sum across all surveys undertaken) of mobile macroinvertebrates recorded on 71 transects (18 in the CGCMR and 6 at reference sites in 2009; 12 in the CGCMR and 3 at reference sites in 2016; 4 in the SICMR and 28 at reference sites). .......................................................................................................................................... 20
Table 5. Results of ANCOVAs of invertebrate community metrics, combining location CGCMR, SICMR and reference sites for both, and time (2009 and 2016 for the CGCMR and reference sites as an independent factor and depth as a continuous covariate. Analyses were conducted on the log(x+1) transformed data. .................................................................................................................................................................... 23
Table 6. Total frequency of occurrence (transects) and total abundance of cryptic fishes recorded on 71 transects (18 in the CGCMR and 6 at reference sites in 2009; 12 in the CGCMR and 3 at reference sites in 2016; 4 in the SICMR and 28 at reference sites). ....................................................................................... 25
Table 7. Results of ANCOVAs of sessile community metrics, combining location CGCMR, SICMR and reference sites as an independent factor and depth as a continuous covariate. Analyses were conducted on the log(x+1) transformed data. Significant results are highlighted in bold........................................... 29

2016 biodiversity surveys of the God Grounds and Pimpernel Rocks Commonwealth Marine Reserves| v
List of acronyms ACRONYM EXPANDED
AMP/CMR Australian Marine Park/ Commonwealth Marine Reserve
RLSF The Reef Life Survey Foundation
MPA Marine Protected Area
IUCN International Union for Conservation of Nature
RLS Reef Life Survey
EEZ Exclusive Economic Zone
CTI Community Temperature Index

vi | 2016 biodiversity surveys of the Cod Grounds and Pimpernel Rocks Commonwealth Marine Reserves
Executive summary
The Cod Grounds Commonwealth Marine Reserve (CMR) is located in Commonwealth waters
approximately four nautical miles off the coast of New South Wales, encompassing three underwater
pinnacles rising to ~18 m depth from a seabed 40 m deep. This CMR is highly protected by a Marine
National Park Zone (IUCN II). The Solitary Islands are protected within NSW State waters within the
boundaries of the Solitary Islands Marine Park, with areas further than 3 nautical miles from the islands
protected by the Solitary Islands Commonwealth Marine Reserve. Most of this CMR is classified as Multiple
Use or Special Purpose Zone (IUCN VI), but Pimpernel Rock is highly protected by a Marine National Park
Zone (IUCN II).
Pimpernel Rock is a submerged pinnacle that rises from the ocean floor to within 10 m of the surface. It is
an extremely significant feature of the Solitary Islands CMR, as it attracts large pelagic fishes, marine
mammals, grey nurse sharks Carcharias taurus, black cod Epinephelus daemelii, and marine turtles. Both
the Cod Grounds and Pimpernel Rock CMRs are primarily recognised for providing key habitat for grey
nurse sharks and black cod, which are protected under both NSW State and Commonwealth legislation.
This report describes patterns of reef biodiversity in the Cod Grounds and Pimpernel Rock CMRs and at a
number of external reference sites. It follows the 2009 baseline survey on the condition and biodiversity
values of the Cod Grounds CMR.
The surveys of the Cod Grounds and Solitary Islands revealed:
- a dominance of temperate species in deeper areas, with more subtropical species in the shallows;
- distinct depth stratification;
- very high fish biomass, including exploited fish species; and
- a high abundance of grey nurse sharks during recent surveys of the CGCMR.
Depth stratification was found across all surveyed communities, including fishes, invertebrates and
benthos. Previous studies, including the Cod Grounds baseline survey, have also noted depth structuring
along narrow bands, driven to some degree by the distribution and abundance of grazing sea urchins.
Spatial differences were also apparent between the Cod Grounds, Pimpernel Rock and the Solitary Islands
sites. The Solitary Islands sites chosen as reference sites for the CMR (Pimpernel Rock) were as similar as
possible in wave exposure and underlying habitat structure, however, they were much shallower than the
Cod Grounds and Pimpernel Rock sites. The fish community at the Solitary Islands reference sites were
more similar to those found in subtropical and tropical waters further north than to the largely temperate
species found at depth in the CMRs. Ultimately, given the strong effects of depth on reef communities in
this region, deeper sites would be ideal to provide reference sites for Pimpernel Rock. However, the
pinnacles of Pimpernel Rock and the Cod Grounds are geomorphologically unique, also making it difficult to
find appropriate reference sites outside the CMR, and meaning that trends through time within these CMRs
will need to be carefully interpreted in light of broader regional change.

2016 biodiversity surveys of the God Grounds and Pimpernel Rocks Commonwealth Marine Reserves| vii
Pimpernel Rock and some of the Cod Grounds sites had very high biomass of fishes; in a number of cases
this was driven by very large schools of planktivores, and in some cases also high abundances of carnivores
and sharks. In the Cod Grounds, the highest biomass values were recorded at the reference sites in 2009,
but in the CMR sites in 2016. Although possible, it is unlikely that successful protection of the CMR has
displaced fishing effort to areas outside the CMR, because analysis of large and exploited fish species
indicated that both had marginally higher biomass in the CMR than at reference sites, but not significantly
so. The high abundance of the grey nurse sharks, especially during the 2016 surveys, suggests that the east
coast population is benefiting from national regulations for no-take protection.
RECOMMENDATIONS
• Undertake ongoing ecological monitoring at intervals of 1-3 years to build up a temporal
dataset to assess changes relative to data provided by this survey, with results reported using a
logistically manageable set of sensitive biodiversity indicators;
• Incorporate additional sites for monitoring, especially additional control sites outside the
CMRs, in comparable habitats and depths;
• Include timed swims around the pinnacles for more accurate assessment of the grey nurse
shark population;
• Undertake monitoring of potential impacts, including dedicated surveys of fishing catch and
effort in the general area by recreational and commercial fishers, (e.g. AFMA data) and
reporting mechanisms for pollution, shipping, interactions with megafauna and plastic marine
debris;
• Undertake regular monitoring of physical characteristics – seasonal reporting of water quality,
nutrients, turbidity, light and other physical parameters that support ecological processes;
• Through the longer term, consider establishing a buffer zone around the CMR boundaries.

2016 biodiversity surveys of the God Grounds and Pimpernel Rocks Commonwealth Marine Reserves| 1
1 Introduction
The Cod Grounds Commonwealth Marine Reserve (CMR) is located in Commonwealth waters
approximately four nautical miles off the coast of Laurieton, New South Wales, Australia, encompassing
three underwater pinnacles rising to ~18 m depth from a seabed approximately 40 m deep (Davies et al.
2008). The Cod Grounds CMR was established primarily due to its value as habitat for grey nurse sharks
(Carcharias taurus) and black cod (Epinephelus daemelii), which are protected under both NSW State and
Commonwealth environmental legislation. The complex geomorphology within the Cod Grounds CMR
forms a variety of distinctive habitats including steep outcrops, shallow gutters, boulder/cobble slopes, and
sand expanses; four substratum types (solid consolidated bedrock outcrop, unconsolidated boulder and
cobble, cobbles partially covered by sand, and rippled fine sand with variable amounts of shell grit), and at
least two geological facies have been classified from habitat mapping of the area (Davies et al. 2008).
The Solitary Islands are protected within NSW State waters within the boundaries of the Solitary Islands
Marine Park, with areas further than 3 nautical miles from the islands protected by the Solitary Islands
CMR. Most of this CMR is classified as Multiple Use or Special Purpose Zone (IUCN VI), but Pimpernel Rock
is highly protected by a Marine National Park Zone (IUCN II). Pimpernel Rock is a submerged pinnacle that
rises from the ocean floor to within a few meters of the surface, and is the most significant feature of the
Solitary Islands CMR, as it attracts large pelagic fish, grey nurse sharks Carcharias taurus, black cod
Epinephilus daemelii, marine mammals and turtles (Commonwealth of Australia 2001b). Similarly to the
Cod Grounds CMR, the deeper areas of the Solitary Islands CMR have steep slopes and deeply scoured
gutters, with a variety of geomorphological features (Ingleton et al. 2007).
The highly complex habitats of the Cod Grounds and Pimpernel Rocks interact with the East Australian
Current (EAC), the largest ocean current along the east coast of Australia. The EAC is the southern arm of
the bifurcation of the westward-flowing Southern Equatorial Current, which enters the Coral Sea region
from the Pacific Ocean. The EAC flows southwards in a series of eddies and areas of upwelling, drawing
nutrient rich water from a depth of at least 200 m. The EAC, its upwellings, interactions with the
structurally complex seabed, and transport of warmer waters and tropical larvae, promote a rich flora and
fauna within the Cod Grounds and Solitary Islands CMRs (Oke and Middleton 2001; Brewer et al. 2007).
Offshore reefs are low outcrops made of rubble and broken rock in waters deeper than 35m, dominated by
sponges, soft corals and encrusting algae. Deep midshelf reefs in the Solitary Islands CMR host a high
diversity of marine life. Three submerged pinnacles with steep slopes are encrusted with algae, sponges
and ascidians (Commonwealth of Australia 2001b).
Prior to the establishment of the Cod Grounds CMR in 2007, this area supported a multi-species fishery for
a number of decades. Of the 20 main target species in the region, the highest catches were reported for
snapper (Chrysophrys auratus), bonito (Sarda australis), sweep (Scorpis lineolata) and silver trevally
(Pseudocaranx dentex); commercial catches were high and recreational catches, albeit unrecorded, were
also thought to be high (Schirmer et al. 2004). Grey nurse sharks are thought to have been part of the
recreational catch in the past (Commonwealth of Australia 2001a).
The Cod Grounds CMR is now managed as a no-take zone, or an International Union for Conservation of
Nature (IUCN) Category 1a Sanctuary Zone. Unfortunately, there has been evidence of illegal fishing, which
is of concern because of the small size of the Reserve, as the removal of even a few individuals of important
species may have large ecological repercussions. For instance, the removal of large predators of urchins,

2 | 2016 biodiversity surveys of the Cod Grounds and Pimpernel Rocks Commonwealth Marine Reserves
such as blue groper (Achoerodus viridis) and pink snapper (Chrysophrys auratus), may cause increasing
abundances of urchins, which in turn can affect densities of algae and invertebrates and create ‘urchin
barrens’ (Stuart-Smith et al. 2009).
Previous studies have focused on the grey nurse shark (Otway et al. 2003); together with Pimpernel Rocks,
the Cod Grounds CMR is thought to attract over 16% of the grey nurse shark population off the coast of
NSW (Commonwealth of Australia 2001a). In 2009, Reef Life Survey (RLS) conducted the most
comprehensive biodiversity survey in the Cod Grounds CMR to that time, laying down a baseline from
which future changes and dynamics can be measured. The baseline survey documented and described the
key ecological features of the Cod Grounds CMR and surrounding habitats, including the dominance of cool
temperate species, distinct depth zonation of benthos, the general paucity of benthic biota, very high fish
biomass and abundance of large pelagic fishes exploited elsewhere, and the presence of a number of rare
and threatened species (Stuart-Smith et al. 2009).
The shallowest benthic communities were typical of urchin barrens found elsewhere in NSW, with a high
abundance of the barrens-forming urchin Centostephanus rodgersii (Rule and Smith 2007); deeper areas
hosted at least 48 taxa or cover categories of sponges, ascidians, soft corals and hard corals. Urchin grazing
was considered the key driver of the distinctive zonation of the benthic community into depth bands
(Stuart-Smith et al. 2009). The fish community was also partitioned between shallow and deep
assemblages. Species encountered primarily in the Cod Grounds CMR, apart from rare species, include
those typically aggregating around prominent undersea features, such as highfin amberjack (Seriola
rivoliana), yellowtail kingfish (Seriola lalandi) and rainbow runner (Elagatis bipinnulata). High densities of
large wobbegong sharks (Orectolobus halei and O. maculatus) were also recorded. Average abundance and
biomass of fishes, especially exploited species, were significantly higher inside the Cod Grounds CMR than
at nearby fished reference sites.
The shallow habitats of the Solitary Islands have been subject to abundant research, but the deeper areas
and Pimpernel Rock itself have received less attention. The NSW Marine Park Authority and others have
classified the habitats around Pimpernel Rock into three broad depth-related zones: 1) 10 m to 18 m water
depth: dominated by barnacles and sea urchins, with patches of cunjevoi (Pyura stolonifera), encrusting
sponges and filamentous algae; 2) 18 m to 30 m: high percent cover of P. stolonifera, with hydrozoan
epiphytes and some gorgonians; and 3) > 30 m depth: dominated by the stalked ascidian Pyura spinifera,
sponges and sea whips (The Ecology Lab 2006). More recently, small patches were found to be dominated
by specific biota, whereas at broader scales the benthic community was dominated by either coral and/ or
other mixed invertebrate communities or macroalgae, in particular the kelp Ecklonia radiata (Malcolm et al.
2010). Species richness, taxonomic composition and diversity were found to increase with depth, with the
highest species richness recorded at the 50 m depth contour within the Solitary Islands CMR. Fish
communities were also found to be diverse, with a combination of reef-associated and pelagic species
(Malcolm et al. 2010).
This report describes patterns of reef biodiversity in the Cod Grounds CMR and at a number of external
reference sites. It follows from the 2009 baseline survey on the condition and biodiversity values of the Cod
Grounds CMR. The survey is part of the ongoing performance assessment program for the Cod Grounds
CMR, which will determine its effectiveness in protecting key species and ecological communities within its
boundaries. Additionally, this report describes ecological communities at Pimpernel Rock and associated
external reference sites.

2016 biodiversity surveys of the God Grounds and Pimpernel Rocks Commonwealth Marine Reserves| 3
2 Methods
Field surveys at the Cod Grounds and Pimpernel Rock were conducted from 18th to 21st April 2016 by a
team of skilled divers from the Reef Life Survey program (www.reeflifesurvey.com) and the University of
Tasmania. Geographical coordinates of sites (in WGS84) were recorded using handheld Garmin GPS units
(Table 1). Ecological surveys were conducted at varying depths along 18 transects at seven sites in the
CGCMR, where no fishing is allowed, along six transects at four sites outside the CGCMR, and four transects
at Pimpernel Rock (Figure 1). Additional data from 29 previously surveyed transects at five sites in the
State-managed Solitary Islands Marine Park were used as reference sites for Pimpernel Rock, chosen for
similar habitat (although at shallower depths). Data collected from each site consisted of abundance and
size of fishes, abundance of mobile macroinvertebrates and cryptic fishes, and percentage cover of sessile
biota. These are described separately below. Sites were selected to encompass the range of reef types and
depths both inside and outside the CGCMR and around the Pimpernel Rock pinnacle, but with the depth
range limited by dive safety considerations and bottom time restrictions. One pair of closed-circuit (re-
breather) divers was able to survey reef in depths > 32 m, while depths between 26 and 32 m were
surveyed using standard open circuit SCUBA. Depth (as displayed on SCUBA gauges) and underwater
visibility (measured along the transect line) were also recorded at each site.
Figure 1. Map of a) Cod Grounds and Pimpernel Rocks, and b) Solitary Islands sites surveyed from 2009 - 2016.
a) b)

4 | 2016 biodiversity surveys of the Cod Grounds and Pimpernel Rocks Commonwealth Marine Reserves
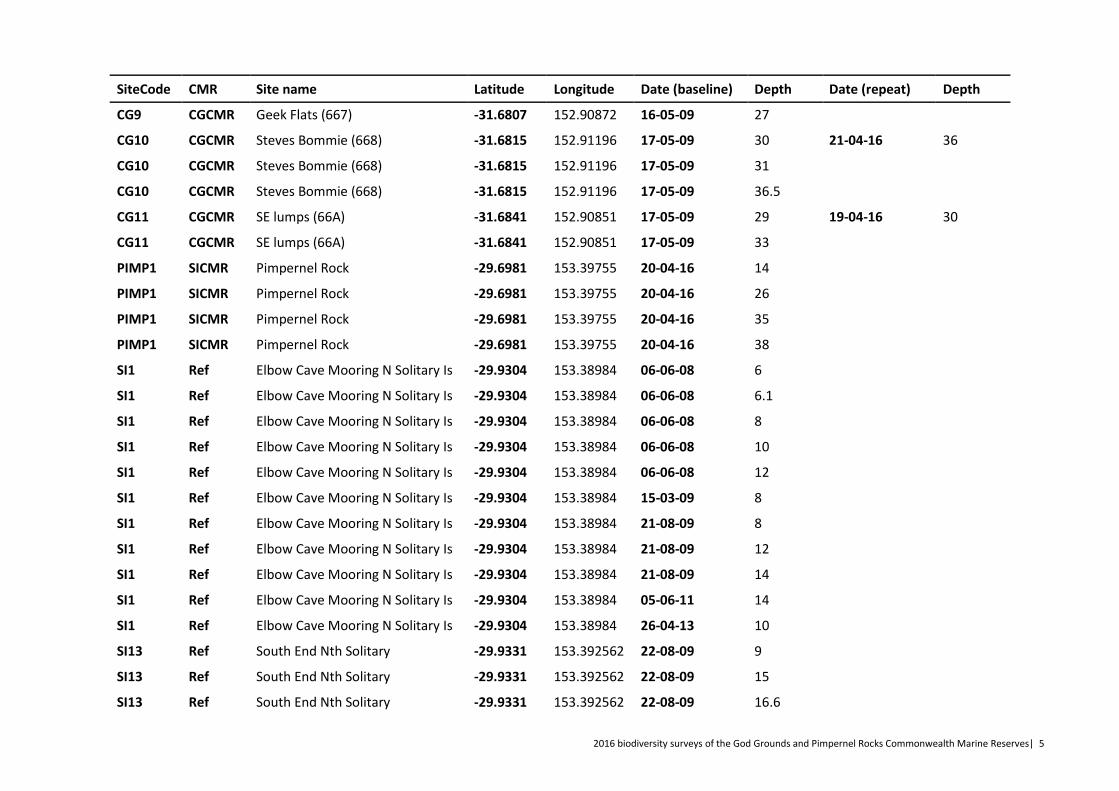
Table 1. Site details including marine park zone (CGCMR: Cod Grounds Commonwealth Marine Reserve; SICMR: Solitary Islands Commonwealth Marine Reserve; Ref: Reference site outside reserve), geographical coordinates (datum = WGS84), depth of transect line, for each site surveyed. For the Cod Grounds, Date and Depth columns separate the original baseline surveys from the more recent follow-up surveys.
SiteCode CMR Site name Latitude Longitude Date (baseline) Depth Date (repeat) Depth
CG1 CGCMR Nth of Pinnacles (662) -31.6821 152.90948 14-05-09 27 21-04-16 26
CG1 CGCMR Nth of Pinnacles (662) -31.6821 152.90948 14-05-09 31 21-04-16 27
CG2 CGCMR Cod Gardens (CODGAR) -31.6813 152.91078 12-05-09 29 18-04-16 28
CG2 CGCMR Cod Gardens (CODGAR) -31.6813 152.91078 14-05-09 28 18-04-16 29
CG2 CGCMR Cod Gardens (CODGAR) -31.6813 152.91078 14-05-09 36
CG3 CGCMR SW flats (66B) -31.6831 152.90585 14-05-09 26 19-04-16 25
CG3 CGCMR SW flats (66B) -31.6831 152.90585 14-05-09 27 19-04-16 26
CG4 Ref Z - 3 (666) -31.708 152.90093 15-05-09 29
CG4 Ref Z - 3 (666) -31.708 152.90093 15-05-09 29.5
CG5 Ref Deep Wall (665) -31.6934 152.90375 15-05-09 42
CG5 Ref Deep Wall (665) -31.6934 152.90375 15-05-09 29
CG5 Ref Deep Wall (665) -31.6934 152.90375 15-05-09 29.5
CG6 Ref Z - 1 - 28 (M2-28) -31.717 152.88254
19-04-16 28
CG6 Ref Z - 1 - 28 (M2-28) -31.717 152.88254
19-04-16 29
CG7 Ref Leahs Lumps (L-BUMP) -31.7258 152.86517 15-05-09 35 19-04-16 38
CG8 CGCMR Cod Grounds Pinnacles -31.6821 152.90948 16-05-09 25 21-04-16 25
CG8 CGCMR Cod Grounds Pinnacles -31.6821 152.90948 16-05-09 32
CG8 CGCMR Cod Grounds Pinnacles -31.6821 152.90948 16-05-09 36
CG8 CGCMR Cod Grounds Pinnacles -31.6821 152.90948 17-05-09 26
CG8 CGCMR Cod Grounds Pinnacles -31.6825 152.90945
18-04-16 27
CG9 CGCMR Geek Flats (667) -31.6807 152.90872 16-05-09 26 21-04-16 28
2016 biodiversity surveys of the God Grounds and Pimpernel Rocks Commonwealth Marine Reserves| 5
SiteCode CMR Site name Latitude Longitude Date (baseline) Depth Date (repeat) Depth
CG9 CGCMR Geek Flats (667) -31.6807 152.90872 16-05-09 27
CG10 CGCMR Steves Bommie (668) -31.6815 152.91196 17-05-09 30 21-04-16 36
CG10 CGCMR Steves Bommie (668) -31.6815 152.91196 17-05-09 31
CG10 CGCMR Steves Bommie (668) -31.6815 152.91196 17-05-09 36.5
CG11 CGCMR SE lumps (66A) -31.6841 152.90851 17-05-09 29 19-04-16 30
CG11 CGCMR SE lumps (66A) -31.6841 152.90851 17-05-09 33
PIMP1 SICMR Pimpernel Rock -29.6981 153.39755 20-04-16 14
PIMP1 SICMR Pimpernel Rock -29.6981 153.39755 20-04-16 26
PIMP1 SICMR Pimpernel Rock -29.6981 153.39755 20-04-16 35
PIMP1 SICMR Pimpernel Rock -29.6981 153.39755 20-04-16 38
SI1 Ref Elbow Cave Mooring N Solitary Is -29.9304 153.38984 06-06-08 6
SI1 Ref Elbow Cave Mooring N Solitary Is -29.9304 153.38984 06-06-08 6.1
SI1 Ref Elbow Cave Mooring N Solitary Is -29.9304 153.38984 06-06-08 8
SI1 Ref Elbow Cave Mooring N Solitary Is -29.9304 153.38984 06-06-08 10
SI1 Ref Elbow Cave Mooring N Solitary Is -29.9304 153.38984 06-06-08 12
SI1 Ref Elbow Cave Mooring N Solitary Is -29.9304 153.38984 15-03-09 8
SI1 Ref Elbow Cave Mooring N Solitary Is -29.9304 153.38984 21-08-09 8
SI1 Ref Elbow Cave Mooring N Solitary Is -29.9304 153.38984 21-08-09 12
SI1 Ref Elbow Cave Mooring N Solitary Is -29.9304 153.38984 21-08-09 14
SI1 Ref Elbow Cave Mooring N Solitary Is -29.9304 153.38984 05-06-11 14
SI1 Ref Elbow Cave Mooring N Solitary Is -29.9304 153.38984 26-04-13 10
SI13 Ref South End Nth Solitary -29.9331 153.392562 22-08-09 9
SI13 Ref South End Nth Solitary -29.9331 153.392562 22-08-09 15
SI13 Ref South End Nth Solitary -29.9331 153.392562 22-08-09 16.6

6 | 2016 biodiversity surveys of the Cod Grounds and Pimpernel Rocks Commonwealth Marine Reserves
SiteCode CMR Site name Latitude Longitude Date (baseline) Depth Date (repeat) Depth
SI14 Ref Fish Soup -29.9127 153.38342 22-08-09 7
SI14 Ref Fish Soup -29.9127 153.38342 22-08-09 8
SI14 Ref Fish Soup -29.9127 153.38342 22-08-09 10.1
SI2 Ref Anemone Bay N Solitary Is -29.9231 153.38809 06-06-08 10
SI2 Ref Anemone Bay N Solitary Is -29.9231 153.38809 06-06-08 11
SI2 Ref Anemone Bay N Solitary Is -29.9231 153.38809 06-06-08 11.1
SI2 Ref Anemone Bay N Solitary Is -29.9231 153.38809 06-06-08 12
SI2 Ref Anemone Bay N Solitary Is -29.9231 153.38809 06-06-08 13.5
SI2 Ref Anemone Bay N Solitary Is -29.9231 153.38809 21-08-09 10
SI2 Ref Anemone Bay N Solitary Is -29.9231 153.38809 21-08-09 11
SI2 Ref Anemone Bay N Solitary Is -29.9231 153.38809 21-08-09 14
SI2 Ref Anemone Bay N Solitary Is -29.9231 153.38809 23-06-11 11
SI2 Ref Anemone Bay N Solitary Is -29.9231 153.38809 01-10-11 10
SI2 Ref Anemone Bay N Solitary Is -29.9231 153.38809 26-04-13 12
SI23 Ref Canyons North Solitary -29.9251 153.38679 15-03-09 14

2016 biodiversity surveys of the God Grounds and Pimpernel Rocks Commonwealth Marine Reserves| 7
FISH SURVEYS (METHOD 1)
Fish census protocols involved a diver laying out a 50 m transect line along a depth contour on reef. The
number and estimated size-category of all fishes sighted within 5 m blocks either side of the transect line
were recorded on waterproof paper as the divers swam slowly along opposite sides of the line. Size-classes
of total fish length (from snout to tip of tail) used were 25, 50, 75, 100, 125, 150, 200, 250, 300, 350, 400,
500, 625 mm, and above. Lengths of fish larger than 500 mm were estimated to the nearest 12.5 cm and
individually recorded.
Figure 2. Stylised representation of method 1 survey technique
MACROINVERTEBRATE AND CRYPTIC FISH SURVEYS (METHOD 2)
Large macro-invertebrates (molluscs, echinoderms and crustaceans > 2.5 cm) and cryptic fishes (i.e.
inconspicuous fish species closely associated with the seabed that were likely to be overlooked during
general fish surveys) were censused along the same transect lines set for fish surveys. Divers swam along
the bottom, up then down each side of the transect line, recording all mobile macroinvertebrates and
cryptic fishes on exposed surfaces of the reef within 1 m of the line.

8 | 2016 biodiversity surveys of the Cod Grounds and Pimpernel Rocks Commonwealth Marine Reserves
Figure 3. Stylised representation of method 2 survey technique
MACROALGAL AND SESSILE INVERTEBRATE SURVEYS
Information on the percentage cover of sessile animals and seaweeds along the transect lines set for fish
and invertebrate censuses was recorded using photo-quadrats taken sequentially each 2.5 m (or 5 m, see
below) along the 50 m transect. Digital photo-quadrats were taken vertically-downward from a height
sufficient to encompass an area of at least 0.3 m x 0.3 m. The percentage cover of different macroalgal,
coral, sponge and other attached invertebrate species in photo-quadrats was digitally quantified in the
laboratory using the Coral Point Count with Excel extensions (CPCe) software (Kohler and Gill 2006). A grid
of 5 points was overlaid on each image and the taxon lying directly below each point recorded.
Identification was to the lowest possible taxonomic resolution, with taxa for which identification was
uncertain grouped with congeners or other members of the family or order.
STATISTICAL ANALYSES
At most sites, multiple transects were surveyed at different depths (see Table 1). Because of clear depth
stratification over the large range of depths covered (community types encountered along individual
transects within a site generally matched more closely with transects at similar depths at other sites),
rather than transects at other depths within the same site, each transect was regarded as an independent
sample in analyses. Thus, the unit of replication was the summed value(s) of the two blocks per transect
(i.e. giving values per 500 m2 for fishes and per 100 m2 for mobile macroinvertebrates).
Separate univariate analyses and data exploration techniques were used for fish, mobile macroinvertebrate
communities, cryptic fishes and sessile communities. Univariate metrics that described important

2016 biodiversity surveys of the God Grounds and Pimpernel Rocks Commonwealth Marine Reserves| 9
community characteristics were calculated for each transect and compared between transects surveyed
inside and outside the CGCMR and with transect depth. Metrics examined for fishes were: relative
abundance, estimated total biomass (see below for biomass estimation), biomass of fishes > 40 cm TL,
biomass of exploited (recreational or commercial) species, and number of species. Mobile invertebrate
metrics were: total relative abundance of mobile invertebrates, relative abundance of Centrostephanus
rodgersii, relative abundance of all sea urchins, and number of species.
Univariate metrics were applied in separate ANCOVAs, with reserve status (inside CGCMR vs. external
reference sites) as a fixed factor and transect depth as a continuous covariate. Depth was included as a
covariate as it was evident during surveys and from preliminary data exploration that fish, invertebrate and
sessile communities differed according to the depth at which transects were surveyed. All dependent
variables were log(x+1) transformed.
To explore patterns in fish community trophic structure, the abundance and biomass of fishes in different
trophic groups (planktivores, grazers, farmers, carnivores, piscivores, benthic invertivores and corallivores)
were estimated. Biomass estimates were made for each species on each transect using fish abundance
counts, size estimates, and the length-weight relationships presented for each species (in some cases genus
and family) in Fishbase (Froese and Pauly 2016). Community characteristics and relationships between
transects were explored using Multidimensional Scaling (MDS) plots based on Bray-Curtis similarity
matrices. Data for fish, mobile macroinvertebrate and sessile communities were considered separately,
with a square root transformation applied to all data.

10 | 2016 biodiversity surveys of the Cod Grounds and Pimpernel Rocks Commonwealth Marine Reserves
3 Results
FISH SURVEYS
Overall, 218 species of fish were recorded on the transects; 186 of these occurred in the SICMR and its
reference sites. Similar numbers of species were recorded in the CGCMR in 2009 and 2016: 66 and 65,
respectively (APPENDIX 1). The five most abundant species in the CGCMR in 2009 were Chromis hypsilepis
(one-spot puller), Scorpis lineolata (silver sweep), Trachinops taeniatus (eastern hulafish), Atractoscion
aequidens (teraglin) and Atypichthys strigatus (mado). Similar species were among the most abundant in
2016 (with Parma unifasciata), but abundances were approximately three times as high for the top two
species. The reference sites were also dominated by the same species, but abundance was higher in 2009
than 2016. Pimpernel Rock in the SICMR had similar dominant species (top five: Scorpis lineolata,
Atypichthys strigatus, Trachinops taeniatus, Pempheris affinis (black-tipped bullseye) and Pseudanthias
rubrizonatus (lilac-tipped basslet)), whilst its reference sites hosted a mixed subtropical/temperate
assemblage (top five: Dascyllus trimaculatus (three-spot damsel), Thalassoma lunare (moon wrasse),
Amphiprion akindynos (Barrier Reef anemonefish), Scorpis lineolata, Parma unifasciata (girdled parma)).
The fish community varied both spatially and temporally; spatial differences occurred primarily between
the CMRs and reference sites and between the Cod Grounds and Solitary Islands, and the community
shifted in the CGCMR between 2009 and 2016 (Figure 4). In 2009, sites inside and outside the CGCMR were
distinguished by higher proportional biomass of Scorpis lineolata, Atypichthys strigatus, Pempheris
compressa (small-scale bullseye), and Anoplocarpus inermis outside the CMR, and higher biomass of
Orectolobus maculatus (spotted wobbegong), Coris dorsomacula (pale-barred coris), Seriola lalandi (yellow-
tail kingfish) and Scorpaena jacksoniensis (eastern red scorpionfish) inside the CMR.
Changes in the CGCMR between 2009 and 2016 reflected a shift in the community inside the CMR towards
the community structure recorded at the shallowest reference sites outside the reserve (which were most
comparable in habitat). These changes were driven by increasing dominance of the species previously
dominant outside the CMR, combined with other species such as Chromis hypsilepis, Prionurus
microlepidotus (sawtail), Pagrus auratus (pink snapper) and Parma unifasciata. Despite these changes, the
similarity of most sites between years tended to be greater than between sites in any year, which is quite
remarkable given the close proximity of the majority of sites inside the CGCMR. This can be interpreted as
suggesting relative stability between years in overall community structure at many of the sites (although
note changes in biomass outlined below).
The Cod Grounds and Pimpernel Rock sites had significantly different fish assemblages from those recorded
in the Solitary Islands reference sites, and were more similar to each other, despite being >200 km apart.
The Solitary Islands reference sites were characterised by a mixed community of subtropical and temperate
reef fishes typical of shallow water, with some tropical species also driving the difference. In contrast, the
Pimpernel Rock site (SICMR) was similar to the Cod Grounds sites (both CMR and reference sites) in the
dominance of temperate species such as Orectolobus halei, Atypichthys strigatus and Scorpis lineolata. The
key reason for greater similarity of Cod Grounds and Pimpernel surveys than between Pimpernel Rock and

2016 biodiversity surveys of the God Grounds and Pimpernel Rocks Commonwealth Marine Reserves| 11
the Solitary Islands reference sites is likely a lack of suitable reference sites in the Solitaries with surveys
done in water deeper than ~16 m. A number of the shallow water species at the Solitaries sites were absent
or not common along the deeper transects at Pimpernel Rock and the Cod Grounds.
Fish abundance and biomass were significantly higher at Pimpernel Rock than at the Solitary Islands
reference sites, but species richness was similar (Figure 5). There were significant changes in the Cod
Grounds CMR and reference sites between survey years. Abundance and biomass declined between 2009
and 2016 at reference sites, and increased at CMR sites. The change was only significant for abundance at
the CMR sites, due to the high variability between transects. Species richness was similar between the Cod
Grounds CMR and reference sites, and between years. The Pimpernel Rock site also stood out in its
biomass of large fishes (>40 cm total length) and species commonly exploited by commercial and
recreational fisheries (Figure 6). The Solitary Islands reference sites had the lowest biomass of both
categories. Biomass in the CGCMR was slightly higher than its reference sites, but the high variability
precluded significant results, and no clear temporal patterns were evident.
Depth was a significant factor for most of the fish metrics (Table 2). This may have been most strongly
driven by the fact that the Solitary Islands reference transects were much shallower (<17 m) than all but
one of the other transects (>25 m). The difference in reef community structure between the Solitary Islands
sites and all other sites must be viewed with the effects of depth in mind. There was a trend of higher
abundance at intermediate depths, and higher biomass with increasing depth, but no depth-related pattern
in fish species richness. The biomass trend was driven by large-bodied fishes and exploited species,
especially in the CMRs. In contrast, the highest numbers of species were recorded at depths shallower than
25 m, which were surveyed only at the SI reference sites and one transect at Pimpernel Rock. There were
no consistent differences in species richness between the CGCMR and reference sites (Figure 7).
No clear differences were detected in trophic groups between CMRs and their reference sites, with high
variability in trophic group biomass between transects (Table 3). CMR was a significant factor only for
planktivores and carnivores. In the Cod Grounds, there was a significant CMR x Year interaction for
planktivores. Planktivores, carnivores and piscivores dominated fish biomass throughout the CGCMR,
SICMR and reference sites; they were especially important in the SICMR (Figure 8a). The CGCMR tended
towards higher biomass of almost all groups than the reference sites, but variability was too high for any
differences to be significant. The SI reference sites tended to have the lowest biomass of most groups,
except for invertivores, omnivores and farmers, for which biomass was roughly even across the locations.
Fish biomass of the different trophic groups did not change significantly over time in the Cod Grounds,
except for planktivores, which increased significantly in the CGCMR between 2009 and 2016 (Figure 8b).
The key differences in biomass between 2009 and 2016 in the Cod Grounds and in relation to changes
between CMR and reference sites appeared to be related to huge schools of planktivores, which dominate
by biomass, being more common on reference sites in 2009 and at CMR sites in 2016. Thus, the largest
biomass differences observed do not likely represent a reserve effect, but most probably shifting or patchy
schools of planktivores (which may be driven by current direction and flow), rather than trends in targeted
species recovery or loss. An exception is the reduced biomass of carnivores at reference sites between
surveys – less than half the biomass of this trophic group was recorded at sites outside the reserve in 2016
than in 2009. This was most likely driven by changes in the biomass of Orectolobus halei (banded carpet

12 | 2016 biodiversity surveys of the Cod Grounds and Pimpernel Rocks Commonwealth Marine Reserves
shark, declined by 223 kg or 58%), O. maculatus (spotted wobbegong, declined by 67 kg or 66%), and to a
lesser degree by Pagrus auratus (silver seabream, declined by 4 kg or 53%) and Acanthopagrus australis
(surf bream, declined by 7 kg or 32%).
The two key species targeted for protection by the Cod Grounds CMR and Pimpernel Rock, the grey nurse
shark and black cod, were sighted on multiple transects during the surveys. Solitary Islands reference sites
were the most depauperate in this regard; only one black cod was recorded, and no grey nurse sharks. In
contrast, transects at Pimpernel Rock yielded 3 black cod and 8 grey nurse sharks. A similar pattern
occurred in the Cod Grounds; only one grey nurse shark was recorded on the transects at reference sites in
2009, and no black cod. In the CGCMR, there were 2 records of black cod in 2009, but none in 2016. Three
grey nurse sharks were sighted in 2009, and 12 in 2016. Black cod and grey nurse sharks were also recorded
when they were seen outside of the transects. This revealed an additional two grey nurse sharks at the
Solitary Islands reference sites, one black cod in the SICMR, and 21 grey nurse sharks in the CGCMR.
The pipehorse Solegnathus dunckeri was recorded once in 2016, as it was during the 2009 surveys, along a
transect within the CGCMR (Stuart-Smith et al. 2009). All records of this species in and outside the CMR
have been much shallower than its usual recorded depth range, which is 75-140 m (Kuiter 2009). A second
record from this area warrants further investigation, as it may be using these shallower habitats during
specific parts of its life cycle. It is also possible that this species more frequently occurs in these depths, but
is typically missed on the usual video surveys undertaken at these depths (dive surveys are not frequently
undertaken deeper than 20 m by any agency).

2016 biodiversity surveys of the God Grounds and Pimpernel Rocks Commonwealth Marine Reserves| 13
Figure 4. Multidimensional Scaling (MDS) plot of reef fish biomass in the Cod Grounds and Solitary Islands CMRs and reference sites, performed on the Bray-Curtis similarity matrix of the square-root transformed data. a) Analysis of the Cod Grounds CMR by year and CMR status, with vectors shown if they had a correlation of at least 0.5; b) analysis of both CMRs and reference sites, with years pooled for the Cod Grounds CMR, with vectors shown if they had a correlation value of at least 0.6. ANOSIM results are given for the Global R and for individual significant comparisons.

14 | 2016 biodiversity surveys of the Cod Grounds and Pimpernel Rocks Commonwealth Marine Reserves
Figure 5. Total a) abundance, b) species richness and c) biomass of fishes per 500 m2 recorded in the Cod Grounds CMR and reference sites in 2009 and 2016, and in the Solitary Islands CMR (Pimpernel Rock) and reference sites. Letters group sites that were similar, analysed by ANCOVA (with depth as a covariate) and Tukey HSD test on the log(x+1) transformed data.
0
2000
4000
6000
8000
10000
12000
14000
16000
2009 2016 2009 2016
CG Ref CGCMR SI Ref SICMR
Ab
un
dan
ce
a)
b
aac
bcb
a
0
5
10
15
20
25
30
35
40
45
2009 2016 2009 2016
CG Ref CGCMR SI Ref SICMR
Spec
ies
rich
nes
s
b)
a
a
aa
b
b
0
200
400
600
800
1000
1200
1400
1600
1800
2000
2009 2016 2009 2016
CG Ref CGCMR SI Ref SICMR
Bio
mas
s (k
g)
CMR status / Year
c)
a
abab
aa
b

2016 biodiversity surveys of the God Grounds and Pimpernel Rocks Commonwealth Marine Reserves| 15
Figure 6. Biomass per 500 m2 of a) species larger than 40 cm TL, and b) biomass of exploited species recorded in the Cod Grounds CMR and reference sites in 2009 and 2016, and in the Solitary Islands CMR (Pimpernel Rock) and reference sites. Letters group sites that were similar, analysed by ANCOVA (with depth as a covariate) and Tukey HSD test on the log(x+1) transformed data.
Table 2. Results of ANCOVAs of fish community metrics, combining location CGCMR, SICMR and reference sites for both, and time (2009 and 2016 for the CGCMR and reference sites as an independent factor and depth as a continuous covariate. Analyses were conducted on the log(x+1) transformed data.
Factor Variable df MS F p Error MS
CMR-Year Abundance 5,65 2.20 9.24 <0.001 0.24
Species richness 5,65 0.09 5.98 <0.001 0.02
Biomass (total) 5,65 1.75 5.01 <0.001 0.35
Biomass (>40cm) 5,65 2.54 4.49 0.001 0.57
Biomass (exploited) 5,65 1.41 3.26 0.010 0.43
Depth Abundance 1,65 0.48 2.01 0.161 0.24
Species richness 1,65 0.95 60.03 <0.001 0.02
Biomass (total) 1,65 3.83 10.98 0.002 0.35
Biomass (>40cm) 1,65 7.33 12.95 <0.001 0.57
Biomass (exploited) 1,65 8.89 20.56 <0.001 0.43
0
50
100
150
200
250
300
350
400
450
500
2009 2016 2009 2016
CG Ref CGCMR SI Ref SICMR
Bio
ma
ss (
kg
)
CMR status / Year
a)
aab
a
a
a
b
0
50
100
150
200
250
300
350
2009 2016 2009 2016
CG Ref CGCMR SI Ref SICMR
Bio
mas
s (k
g)
CMR status / Year
b)
ac
a
ad
bc
ad
d

16 | 2016 biodiversity surveys of the Cod Grounds and Pimpernel Rocks Commonwealth Marine Reserves
Figure 7. Variation in the species richness, abundance and biomass of the fish community recorded on transects at different depths, inside the CMRs and at reference sites. Data have been binned into depth categories, with sample sizes as follows: 1, 5 and 3 transects for Cod Grounds reference sites; 9, 8, 5, 3 and 5 transects for CGCMR; 8 and 21 transects at the SI reference sites; and 1, 1 and 2 transects in the SICMR. Y-axes represent mean values (+SE) per transect (500 m2).
0
5000
10000
15000
20000
25000
<10 10-20 21-24 25-26 27-28 29-30 31-32 >33
Ab
un
dan
ce
a)
0
5
10
15
20
25
30
35
40
45
50
<10 10-20 21-24 25-26 27-28 29-30 31-32 >33
Spe
cie
s ri
chn
ess
b) CG Ref
CGCMR
SI Ref
SICMR
0
500
1000
1500
2000
2500
3000
<10 10-20 21-24 25-26 27-28 29-30 31-32 >33
Bio
mas
s
Depth range
c)
0
100
200
300
400
500
600
<10 10-20 21-24 25-26 27-28 29-30 31-32 >33
Bio
mas
s >4
0cm
Depth range
d)
0
100
200
300
400
500
600
<10 10-20 21-24 25-26 27-28 29-30 31-32 >33
Bio
mas
s e
xplo
ite
d
Depth range
e)

2016 biodiversity surveys of the God Grounds and Pimpernel Rocks Commonwealth Marine Reserves| 17
Figure 8. Distribution of trophic groups (per 500 m2) among a) the Cod Grounds and reference sites, and the Solitary Islands and reference sites, and b) variability in the Cod Grounds CMR and reference sites between 2009 and 2016. Letters group locations with similar biomass (see relevant analysis results in Table 3); letters are omitted for trophic groups with no significant differences. Values plotted are the log(x+1) +/- 1 SE of the biomass of the groups, to visualise groups with lower biomass. There were no corallivores in the Cod Grounds; this group is omitted from b).
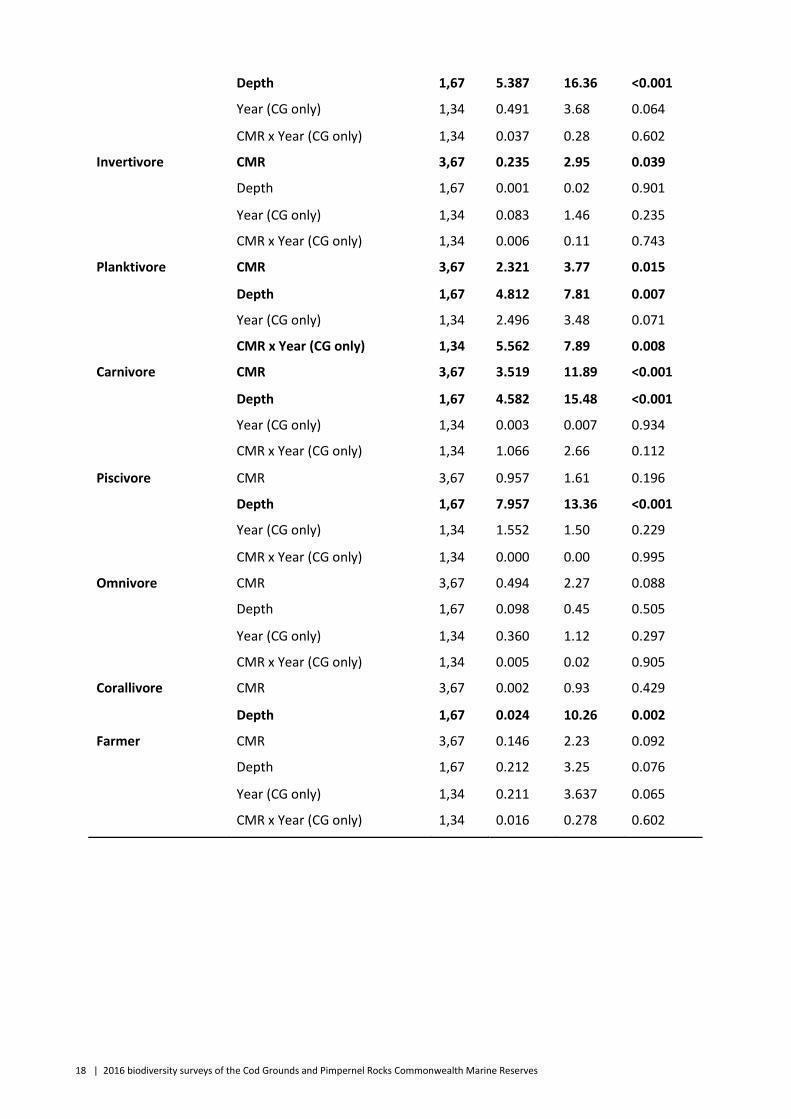
Table 3. Results of two ANCOVAs of trophic groups, comparing location CGCMR, SICMR and reference sites, and Year x CMR (only for the CGCMR). CMR and Depth results are only shown for the first analysis. Analyses were conducted on the log(x+1) transformed data. There were no corallivores in the Cod Grounds; this group is omitted from the second analysis. Significant results are shown in bold.
Trophic group Factor df MS F p
Cropper CMR 3,67 0.003 0.74 0.531
Depth 1,67 0.038 10.21 0.002
Year (CG only) 1,34 0.001 3.45 0.072
CMR x Year (CG only) 1,34 0.000 0.81 0.375
Browser CMR 3,67 0.547 1.66 0.183
0
0.5
1
1.5
2
2.5
3
Cropper Browser Invertivore Planktivore Carnivore Piscivore Omnivore Corallivore Farmer
log
(Bio
mas
s +1
)
Trophic group
a)CG Ref
CGCMR
SI Ref
SICMRa
a
ab
b
a
a
a
b
a
bab ab
0
0.5
1
1.5
2
2.5
3
Cropper Browser Invertivore Planktivore Carnivore Piscivore Omnivore Farmer
log(
Bio
mas
s +
1)
Trophic group
b)CG Ref 2009
CG Ref 2016
CG CMR 2009
CG CMR 2016
a
b
ab
ab
18 | 2016 biodiversity surveys of the Cod Grounds and Pimpernel Rocks Commonwealth Marine Reserves
Depth 1,67 5.387 16.36 <0.001
Year (CG only) 1,34 0.491 3.68 0.064
CMR x Year (CG only) 1,34 0.037 0.28 0.602
Invertivore CMR 3,67 0.235 2.95 0.039
Depth 1,67 0.001 0.02 0.901
Year (CG only) 1,34 0.083 1.46 0.235
CMR x Year (CG only) 1,34 0.006 0.11 0.743
Planktivore CMR 3,67 2.321 3.77 0.015
Depth 1,67 4.812 7.81 0.007
Year (CG only) 1,34 2.496 3.48 0.071
CMR x Year (CG only) 1,34 5.562 7.89 0.008
Carnivore CMR 3,67 3.519 11.89 <0.001
Depth 1,67 4.582 15.48 <0.001
Year (CG only) 1,34 0.003 0.007 0.934
CMR x Year (CG only) 1,34 1.066 2.66 0.112
Piscivore CMR 3,67 0.957 1.61 0.196
Depth 1,67 7.957 13.36 <0.001
Year (CG only) 1,34 1.552 1.50 0.229
CMR x Year (CG only) 1,34 0.000 0.00 0.995
Omnivore CMR 3,67 0.494 2.27 0.088
Depth 1,67 0.098 0.45 0.505
Year (CG only) 1,34 0.360 1.12 0.297
CMR x Year (CG only) 1,34 0.005 0.02 0.905
Corallivore CMR 3,67 0.002 0.93 0.429
Depth 1,67 0.024 10.26 0.002
Farmer CMR 3,67 0.146 2.23 0.092
Depth 1,67 0.212 3.25 0.076
Year (CG only) 1,34 0.211 3.637 0.065
CMR x Year (CG only) 1,34 0.016 0.278 0.602

2016 biodiversity surveys of the God Grounds and Pimpernel Rocks Commonwealth Marine Reserves| 19
MOBILE MACROINVERTEBRATE SURVEYS
A total of 70 mobile invertebrate species were recorded during the combined 2009 and 2016 surveys,
including 2 species of crustaceans, 36 species of echinoderms and 26 species of molluscs; 6 species were
unidentified (Table 4). The most abundant species were all echinoderms, and the community was
dominated by the spiny sea urchin Centrostephanus rodgersii. Other species that were particularly
abundant in the Solitary Islands were the collector urchin Tripneustes gratilla and the difficult sea
cucumber Holothuria difficilis. In the Cod Grounds, the second most abundant species was also the
collector urchin, but this was followed by the slate pencil urchin Phyllacanthus parvispinus.
Community-level analysis of mobile invertebrates revealed clear groupings of sites by CMR status and year
(Figure 9). CMR sites shifted slightly between 2009 and 2016 towards higher abundance of C. rodgersii and
T. gratilla. Reference sites were more diverse in their invertebrate assemblages, so that changes between
2009 and 2016 were masked by high inter-site variability. CG5 and CG7 tended towards high abundance of
nudibranchs, hermit crabs and pencil urchins in 2009; CG7 in 2016 and CG6 in both years had a
combination of the blue dragon Pteraeolidia ianthina, the crinoid Comanthus trichoptera, the pencil urchin
Phyllacanthus parvispinus and the sea star Ophidiaster confertus. This sea star species also drove a
separation between the CMR site CG10 in 2016 from the other CMR sites in that year.
Most Solitary Islands reference sites were characterised by a diverse assemblage of invertebrates that was
distinct from that recorded in the Cod Grounds. The exceptions were the Pimpernel Rock site in the SICMR,
which was similar to the Cod Grounds, and SI23, which appeared to have relatively low abundance of most
species (Figure 9). The Cod Grounds were characterised by relatively high abundance of P. ianthina,
Plectaster decanus, P. parvispinus, C. trichoptera and Astralium tentoriiforme. The Cod Grounds reference
sites were set apart from the CMR sites by a higher abundance and inter-site diversity than the CMR sites,
which formed a tighter grouping, indicating a more similar assemblage.
The general pattern of invertebrate abundance and species richness was for lower density and diversity
inside the CMRs, and for lower density and diversity in 2016 compared to 2009 (Figure 10). Most of these
differences were not significant, due to high variability between transects and a strong effect of depth; only
species richness was not significantly affected by depth (Table 5). Invertebrate abundance was highest at
the Solitary Islands reference sites; Pimpernel Rock had abundances similar to the Cod Grounds. In the Cod
Grounds, total abundance was similar between the CMR and reference sites in 2009, but slightly higher in
the CMR than at reference sites in 2016. Species richness, on the other hand, was lower in the CMRs than
at reference sites in both years, and declined in the Cod Grounds between 2009 and 2016. Urchin
abundance followed the pattern observed in the total abundance. The most common species, C. rodgersii,
was almost absent from Cod Grounds reference sites and had low abundance in the SICMR, but very high
densities elsewhere (between 150 and 200 individuals / 100m2).
Abundance values (total, urchins and C. rodgersii) tended to be higher overall on shallower transects, whilst
species richness did not show specific depth-related trends (Figure 11). The trend of declining abundance
with increasing depth was strongest in the CGCMR; for urchins and C. rodgersii it was also evident in the
SICMR. There was no such trend apparent at the CG and SI reference sites, although these results must be
interpreted with caution due to the limited depth range at the SI reference sites, and the smaller sample
size at the CG reference sites.

20 | 2016 biodiversity surveys of the Cod Grounds and Pimpernel Rocks Commonwealth Marine Reserves
Table 4. Total frequency of occurrence (transects) and total abundance (sum across all surveys undertaken) of mobile macroinvertebrates recorded on 71 transects (18 in the CGCMR and 6 at reference sites in 2009; 12 in the CGCMR and 3 at reference sites in 2016; 4 in the SICMR and 28 at reference sites).
Species Transects Abundance CG 2009 CG 2016 SI CG 2009 CG 2016 SI
Crustaceans
Arctides antipodarum 0 0 1 0 0 1
Pagurus sinuatus 1 0 0 3 0 0
unidentified hermit crab 6 1 7 9 1 12
unidentified crab 0 0 2 0 0 2
Echinoderms
Acanthaster planci 1 0 0 1 0 0
Antedon loveni 0 0 1 0 0 9
Antedon sp. 0 2 1 0 14 40
Centrostephanus rodgersii 13 13 31 3511 1845 7135
Cladolabes schmeltzii 0 0 1 0 0 245
Comanthus sp. 1 1 4 1 7 111
Comanthus trichoptera 19 9 6 803 98 124
Conocladus australis 2 0 0 2 0 0
Coscinasterias muricata 0 0 1 0 0 1
Diadema savignyi 0 0 8 0 0 19
Echinaster colemani 2 0 0 5 0 0
Echinometra mathaei 0 0 2 0 0 2
Echinostrephus spp. 2 0 2 2 0 3
Echinothrix calamaris 0 0 2 0 0 2
Fromia polypora 9 0 0 15 0 0
Heliocidaris tuberculata 0 0 1 0 0 2
Himerometra magnipinna 0 0 1 0 0 2
Himerometra robustipinna 0 1 2 0 10 75
Holothuria difficilis 0 0 15 0 0 2482
Holothuria hilla 0 0 1 0 0 1
Holothuria sp. 0 0 1 0 0 1
Ophidiaster confertus 2 2 24 2 2 130
Pentagonaster dubeni 9 6 4 15 7 14
Petricia vernicina 3 1 0 3 1 1
Phyllacanthus parvispinus 13 5 10 715 100 172
Plectaster decanus 7 6 0 9 15 15
Prionocidaris callista 12 0 0 175 0 0
Pseudoboletia indiana 1 0 2 1 0 3
Pseudoboletia maculata 0 0 1 0 0 4
Tamaria sp. 0 0 1 0 0 2
Temnopleurus toreumaticus 1 0 0 1 0 0
Toxopneustes pileolus 0 0 2 0 0 3
Tripneustes gratilla 4 3 27 4 4 2911
Tropiometra afra 1 1 12 2 2 27
unidentified sea cucumber 0 0 3 0 0 252
unidentified crinoid 2 1 2 37 6 21
Molluscs

2016 biodiversity surveys of the God Grounds and Pimpernel Rocks Commonwealth Marine Reserves| 21
Species Transects Abundance CG 2009 CG 2016 SI CG 2009 CG 2016 SI
Agnewia tritoniformis 0 0 1 0 0 3
Aplysia sp. 0 0 3 0 0 4
Astralium tentoriiforme 16 1 4 183 1 8
Cabestana spengleri 0 0 1 0 0 5
Chromodoris sp. 0 1 0 0 1 1
Conus miles 0 0 1 0 0 1
Cuthona sibogae 0 1 0 0 1 1
Cymbiola magnifica 1 0 0 1 0 0
Dicathais orbita 1 0 0 1 0 0
Doriprismatica atromarginata 1 0 2 1 0 3
Doris chrysoderma 3 0 0 3 0 0
Goniobranchus splendidus 1 0 2 1 0 3
Hexabranchus sanguineus 0 0 1 0 0 1
Hypselodoris bennetti 1 0 1 1 0 1
Hypselodoris bertschi 1 0 0 1 0 0
Mancinella alouina 0 0 1 0 0 1
Micromelo guamensis 0 0 1 0 0 1
Monoplex parthenopeus 0 0 1 0 0 1
Octopus tetricus 0 0 2 0 0 2
Ovula ovum 0 0 1 0 0 1
Pteraeolidia ianthina 5 2 0 13 2 2
Ranella australasia 1 0 1 3 0 1
Sagaminopteron ornatum 3 1 0 3 1 1
Sassia parkinsonia 2 0 0 6 0 0
Thais ambustulatus 0 0 1 0 0 3
Turbo militaris 0 0 1 0 0 1
Unidentified gastropod 1 0 1 2 0 2
Unidentified nudibranch 2 0 1 2 0 1

22 | 2016 biodiversity surveys of the Cod Grounds and Pimpernel Rocks Commonwealth Marine Reserves
Figure 9. Multidimensional Scaling (MDS) plot of mobile invertebrate abundance in the Cod Grounds and Solitary Islands CMRs and reference sites, performed on the Bray-Curtis similarity matrix of the square-root transformed data. a) Analysis of the Cod Grounds CMR by year and CMR status, with vectors shown if they had a correlation of at least 0.5; b) analysis of both CMRs and reference sites, with years pooled for the Cod Grounds CMR, with vectors shown if they had a correlation value of at least 0.6. ANOSIM results are given for the Global R and for individual significant comparisons; for a), all comparisons were significant.

2016 biodiversity surveys of the God Grounds and Pimpernel Rocks Commonwealth Marine Reserves| 23
Figure 10. Total a) abundance, b) species richness and c) urchin abundance and d) Centrostephanus rodgersii abundance recorded in the Cod Grounds CMR and reference sites in 2009 and 2016, and in the Solitary Islands CMR (Pimpernel Rock) and reference sites (per 100 m2). Letters group sites that were similar, analysed by ANCOVA (with depth as a covariate) and Tukey HSD test on the log(x+1) transformed data.
Table 5. Results of ANCOVAs of invertebrate community metrics, combining location CGCMR, SICMR and reference sites for both, and time (2009 and 2016 for the CGCMR and reference sites as an independent factor and depth as a continuous covariate. Analyses were conducted on the log(x+1) transformed data.
Factor Variable df MS F p Error MS
CMR-Year Abundance 5,64 0.32 3.02 0.016 0.11
Species richness 0.16 6.57 <0.001 0.02
Abundance (urchins) 0.82 9.97 <0.001 0.08
Abundance (C. rodgersii) 4.66 15.51 <0.001 0.30
Depth Abundance 1,64 4.40 42.05 <0.001 0.11
Species richness 0.07 2.75 0.102 0.02
Abundance (urchins) 5.62 68.09 <0.001 0.08
Abundance (C. rodgersii) 20.31 67.57 <0.001 0.30
0
50
100
150
200
250
300
350
400
450
500
2009 2016 2009 2016
CG Ref CGCMR SI Ref SICMR
Ab
un
dan
ce
a)
0
2
4
6
8
10
12
2009 2016 2009 2016
CG Ref CGCMR SI Ref SICMR
Spe
cie
s ri
chn
ess
b)
a
b
a
ab
a
ab
0
50
100
150
200
250
300
350
2009 2016 2009 2016
CG Ref CGCMR SI Ref SICMR
Ab
un
da
nce
(urc
hin
s)
c)
a
bc
abcabc
c
ab
0
50
100
150
200
250
2009 2016 2009 2016
CG Ref CGCMR SI Ref SICMR
Ab
un
dan
ce (
C. r
odge
rsii
)
d) a
a
b b
a
a
24 | 2016 biodiversity surveys of the Cod Grounds and Pimpernel Rocks Commonwealth Marine Reserves
Figure 11. Variation in the a) total invertebrate abundance, b) species richness, c) urchin abundance and d) Centrostephanus rodgersii abundance recorded on transects at different depths, inside the CMRs and at reference sites. Data have been binned into depth categories, with sample sizes as follows: 1, 5 and 3 transects for Cod Grounds reference sites, 9, 8, 5, 3 and 5 transects for CGCMR, 7 and 21 transects at the SI reference sites and 1, 1 and 2 transects in the SICMR. Y-axes represent mean values (+SE) per transect (100 m2).
CRYPTIC FISH SURVEYS
Using Method 2, 34 species of cryptic fish were surveyed along transects in both CMRs and reference sites.
The most common species was the half-banded sea perch, Hypoplectrodes maccullochi, typical of inshore
reef habitats in this region. In the Solitary Islands, the ringscale triplefin Enneapterygius atrogulare was also
abundant; in the Cod Grounds, the second most abundant species was the red rock cod Scorpaena
jacksoniensis in 2009 and the blacktip bullseye Pempheris affinis in 2016 (Table 6).
0
100
200
300
400
500
600
<10 10-24 25-26 27-28 29-30 31-32 >33
Ab
un
dan
ce
a)CG Ref
CGCMR
SI Ref
SICMR
0
2
4
6
8
10
12
14
<10 10-24 25-26 27-28 29-30 31-32 >33
Nu
mb
er
of
spe
cie
s
b)
0
100
200
300
400
500
600
<10 10-24 25-26 27-28 29-30 31-32 >33
Ab
un
dan
ce (u
rchi
ns)
Depth range
c)
0
50
100
150
200
250
300
350
<10 10-24 25-26 27-28 29-30 31-32 >33
Ab
un
dan
ce (
C. r
odge
rsii
)
Depth range
d)

2016 biodiversity surveys of the God Grounds and Pimpernel Rocks Commonwealth Marine Reserves| 25
Table 6. Total frequency of occurrence (transects) and total abundance of cryptic fishes recorded on 71 transects (18 in the CGCMR and 6 at reference sites in 2009; 12 in the CGCMR and 3 at reference sites in 2016; 4 in the SICMR and 28 at reference sites).
Transects
Abundance
Species CG 2009 CG ref 2009 CG 2016 CG ref 2016 SI SI ref CG 2009 CG ref 2009 CG 2016 CG ref 2016 SI SI ref
Acanthistius ocellatus 2 0 2 1 0 0 2 0 2 1 0 0
Aspasmogaster costata 1 0 0 0 0 0 1 0 0 0 0 0
Aulopus purpurissatus 0 0 0 0 2 1 0 0 0 0 2 1
Blenniidae 0 0 0 0 1 1 0 0 0 0 1 1
Cheilodipterus macrodon 0 0 0 0 1 1 0 0 0 0 1 1
Cirrhitichthys aprinus 1 0 4 1 14 12 1 0 6 2 31 27
Cirrhitichthys falco 0 0 0 0 1 1 0 0 0 0 1 1
Cirripectes alboapicalis 0 0 0 0 1 1 0 0 0 0 1 1
Cochleoceps orientalis 1 0 0 0 0 0 2 0 0 0 0 0
Cyprinocirrhites polyactis 0 0 1 0 0 0 0 0 6 0 0 0
Dendrochirus zebra 0 0 0 0 1 1 0 0 0 0 1 1
Enchelycore sp. 0 0 0 0 2 2 0 0 0 0 2 2
Enneapterygius atrogulare 0 0 0 0 14 14 0 0 0 0 177 177
Epinephelus undulatostriatus 0 0 1 0 2 0 0 0 1 0 2 0
Gobiidae 2 0 0 0 0 0 4 0 0 0 0 0
Gymnothorax eurostus 0 0 0 0 3 3 0 0 0 0 8 8
Gymnothorax prasinus 6 1 2 1 2 1 10 1 2 1 6 5
Gymnothorax thrysoideus 0 0 0 0 2 2 0 0 0 0 10 10
Heteropriacanthus cruentatus 0 0 0 0 1 1 0 0 0 0 1 1
Hypoplectrodes maccullochi 18 6 11 2 4 1 223 114 65 26 203 2

26 | 2016 biodiversity surveys of the Cod Grounds and Pimpernel Rocks Commonwealth Marine Reserves
Transects
Abundance
Species CG 2009 CG ref 2009 CG 2016 CG ref 2016 SI SI ref CG 2009 CG ref 2009 CG 2016 CG ref 2016 SI SI ref
Lotella rhacina 3 1 5 2 0 0 5 1 6 2 0 0
Orectolobus halei 4 2 1 0 3 3 4 2 1 0 5 5
Ostorhinchus aureus 0 0 0 0 1 1 0 0 0 0 2 2
Ostorhinchus properuptus 0 0 0 0 1 1 0 0 0 0 2 2
Pempheris affinis 0 0 4 1 0 0 0 0 41 8 0 0
Plagiotremus laudandus 0 0 0 0 1 1 0 0 0 0 2 2
Plagiotremus tapeinosoma 0 0 1 0 0 0 0 0 1 0 0 0
Pterois volitans 1 0 0 0 0 0 1 0 0 0 0 0
Scorpaena cardinalis 12 5 0 0 12 12 25 16 0 0 26 26
Scorpaena jacksoniensis 0 0 5 0 2 0 0 0 10 0 5 0
Scorpaenodes evides 0 0 0 0 3 3 0 0 0 0 5 5
Solegnathus dunckeri 0 0 1 1 0 0 0 0 1 1 0 0
Synodus variegatus 1 0 2 1 0 0 1 0 2 1 0 0
Trachichthys australis 0 0 1 0 0 0 0 0 2 0 0 0
Trachypoma macracanthus 0 0 0 0 1 1 0 0 0 0 2 2
Trinorfolkia clarkei 0 0 0 0 1 1 0 0 0 0 6 6
Tripterygiidae 0 0 0 0 1 1 0 0 0 0 6 6

2016 biodiversity surveys of the God Grounds and Pimpernel Rocks Commonwealth Marine Reserves| 27
SESSILE BIOTA
In 2016, Sessile biota were examined with photoquadrats along 28 transects; nine in the Cod Grounds CMR,
three at Cod Grounds reference sites, three at Pimpernel Rock and 13 at the Solitary Islands reference sites.
Crustose coralline algae dominated the sessile communities overall, with an average of 43% across all
transects, followed by low-lying turf at 15%.
There was a significant shift in the benthic community in the Cod Grounds CMR between 2009 and 2016,
from high cover of crustose coralline algae and bare rock, to a combination of turf and bare rock. Most of
the CMR sites exhibited this change, but the reference sites less so – a more diverse sessile community
characterised the reference sites, and the temporal change was from a combination of algae, sponges,
ascidians and soft corals to greater proportions of turf and corals. The increase in corals was driven by an
increase in the temperate encrusting corals Culcita spp.
Among the CMRs and reference sites (with years pooled for the CGCMR), there appeared to be four distinct
groups. Cod Grounds CMR sites were dominated by crustose coralline algae, Cod Grounds reference sites
had higher cover of ascidians, soft corals and calcified algae. The Solitary Islands reference sites were
characterised by live corals and abiotic substrata such as rock and rubble. There was only one site at
Pimpernel Rock, but it was separated from the other groups by a greater proportion of macroalgae, turf
and sponges (Figure 12). Separation across the x-axis is most probably driven by the depth gradient, with
more diverse sessile benthos on the deeper transects to the left, and more CCA and urchin barrens to the
right, in shallower habitats. The y-axis separation between years appears to reflect an increase in corals.
There was slightly higher cover of live sessile biota in the SICMR than at reference sites, and higher live
cover in the CGCMR in 2016 than 2009 (Figure 13, Table 7). Differences were slight but significant, and CMR
was a more important factor than depth. Benthic categories were less abundant in the CGCMR than at
reference sites, and declined both in the CMR and at reference sites between 2009 and 2016. Crustose
coralline algae dominated in the Cod Grounds, but decline significantly at the reference sites in 2016. Live
hard coral increased at the Cod Grounds, both in the CMR and at reference sites, but only by a small
amount, and this was dominated by the temperate encrusting coral Culcita sp. Turf and macroalgae were
highly variable in cover, but turf was particularly prevalent in the SICMR (Pimpernel Rock). Depth was a
significant factor only for crustose coralline algae and live hard coral cover.

28 | 2016 biodiversity surveys of the Cod Grounds and Pimpernel Rocks Commonwealth Marine Reserves
Figure 12. Multidimensional Scaling (MDS) plot of benthic community % cover in the Cod Grounds and Solitary Islands CMRs and reference sites, performed on the Bray-Curtis similarity matrix of the square-root transformed data. a) Analysis of the Cod Grounds CMR by year and CMR status, with vectors shown if they had a correlation of at least 0.5; b) analysis of both CMRs and reference sites, with years pooled for the Cod Grounds CMR, with vectors shown if they had a correlation value of at least 0.5. ANOSIM results are given for the Global R.

2016 biodiversity surveys of the God Grounds and Pimpernel Rocks Commonwealth Marine Reserves| 29
Figure 13. Percentage cover of a) total cover of live biota, b) number of benthic categories, c) crustose corralline algae,
d) live hard coral, e) turf and f) macroalgae recorded on transects inside the CMRs and at reference sites, with Cod
Grounds sites divided by survey year. Y-axes represent mean values (+SE) per transect (100 random points).
Table 7. Results of ANCOVAs of sessile community metrics, combining location CGCMR, SICMR and reference sites as
an independent factor and depth as a continuous covariate. Analyses were conducted on the log(x+1) transformed
data. Significant results are highlighted in bold.
Factor Variable df MS Error MS F p
CMR Total cover 3,47 0.0130 0.0015 8.66 <0.001
Number of categories 0.1588 0.0191 8.31 <0.001
CCA 1.4874 0.0599 24.83 <0.001
LHC 0.0580 0.2140 0.27 0.845
0
10
20
30
40
50
60
70
80
90
100
2009 2016 2009 2016
CG Ref CGCMR SI Ref SICMR
% C
ove
r
a) Total live cover
0
2
4
6
8
10
12
14
16
18
20
2009 2016 2009 2016
CG Ref CGCMR SI Ref SICMR
% C
ove
r
b) Benthic categories
0
5
10
15
20
25
2009 2016 2009 2016
CG Ref CGCMR SI Ref SICMR
% C
ove
r
c) CCA
0
0.2
0.4
0.6
0.8
1
1.2
2009 2016 2009 2016
CG Ref CGCMR SI Ref SICMR
% C
ove
r
d) Live hard coral
0
10
20
30
40
50
60
2009 2016 2009 2016
CG Ref CGCMR SI Ref SICMR
% C
ove
r
e) Turf
0.0
0.5
1.0
1.5
2.0
2.5
3.0
3.5
4.0
4.5
5.0
2009 2016 2009 2016
CG Ref CGCMR SI Ref SICMR
% C
ove
r
f) Macroalgae

30 | 2016 biodiversity surveys of the Cod Grounds and Pimpernel Rocks Commonwealth Marine Reserves
Factor Variable df MS Error MS F p
Turf 1.8377 0.2199 8.36 <0.001
Macroalgae 0.0850 0.1073 0.79 0.504
Depth Total cover 1,47 0.0020 0.0015 1.33 0.254
Number of categories 0.0816 0.0191 4.27 0.044
CCA 3.0310 0.0599 50.60 <0.001
LHC 3.5690 0.2140 16.64 0.002
Turf 0.1511 0.2199 0.69 0.411
Macroalgae 0.1969 0.1073 1.84 0.182

2016 biodiversity surveys of the God Grounds and Pimpernel Rocks Commonwealth Marine Reserves| 31
4 Discussion
The surveys of the Cod Grounds and Solitary Islands revealed some key attributes of reef communities in
the CMRs and at reference sites, including:
i. a dominance of temperate species in deeper areas, with more tropical species in the shallows;
ii. distinct depth stratification;
iii. very high fish biomass, including exploited fish species;
iv. a decline at reference sites that is unlikely to be a consequence of displaced fishing effort; and
v. a high abundance of grey nurse sharks during more recent surveys of the CGCMR, suggesting a
successful role in the protection of this species.
Depth stratification was found across all surveyed communities, including fishes, invertebrates and
benthos. Previous studies, including the Cod Grounds baseline survey, have also noted depth structuring
along narrow bands, driven largely by the distribution and abundance of different species of sea urchins
(Stuart-Smith et al. 2009). On inshore reefs of NSW, sea urchins are often the dominant grazers, acting as a
structuring force for populations of habitat forming organisms such as kelp (Bennett et al. 2016). Certain
species, such as the dominant spiny sea urchin (C. rodgersii), can overgraze macroalgae to the point where
they form “barrens”, which creates a bottom-up effect on the whole community (Andrew and O'Neil 2000;
Ling et al. 2015).
This study detected a small reduction in urchins in the CGCMR and a shift in sessile communities, but it is
unclear whether the two are related. Much of the survey effort took place at depths beyond the reach of
grazing sea urchins, which have their highest densities in shallower waters (Stuart-Smith et al. 2009).
However, in deeper waters, where sea urchin density is already low, a small reduction in sea urchins may
be enough to lead to changes in the sessile community. It is also possible that the sessile community shift
was largely affected by warming, with a higher cover of corals, but the deeper reference sites also showed
a change towards less CCA and more turf and macroalgae.
Spatial differences were also apparent between the Cod Grounds, Pimpernel Rock and the Solitary Islands
sites. The Solitary Islands sites chosen as reference site for the CMR (Pimpernel Rock) were as similar as
possible in exposure and underlying habitat structure, however, they were much shallower than the Cod
Grounds and Pimpernel Rock sites. Ultimately, given the strong effects of depth on reef communities in this
region, deeper sites may be required as reference sites for Pimpernel Rock. Additionally, the pinnacles of
Pimpernel Rock and the Cod Grounds are geomorphologically unique, making it difficult to find appropriate
reference sites outside the CMRs. The fish community at the Solitary Islands reference sites were much

32 | 2016 biodiversity surveys of the Cod Grounds and Pimpernel Rocks Commonwealth Marine Reserves
more similar to those found in subtropical and tropical waters further north than to the largely temperate
species found at depth in the CMRs.
Pimpernel Rock and some of the Cod Grounds sites had very high biomass of fishes; some transects had
over 2.5 tonnes of fish. In a number of cases this was driven by very large schools of planktivores such as
mado (Atypichthys strigatus) and silver sweep (Scorpis lineolata), and in some cases also high abundances
of carnivores and sharks. In the Cod Grounds, the highest biomass values were recorded at the reference
sites in 2009, but in the CMR sites in 2016. This could indicate that the successful protection of the CMR has
displaced fishing effort to areas outside the CMR, but the CMR was already in place during the baseline
survey (Stuart-Smith et al. 2009). However, this is not supported by the analysis of large and exploited fish
species; both had marginally higher biomass in the CMR than at reference sites, but not significantly so. The
high variability between transects – especially when large schools of planktivores are stochastically
distributed – could mask the effect of protection. It is also possible that it will take longer to detect the
effects of the CMR; large, long-lived fish species require many years of protection for detectable population
recovery (Russ and Alcala 2004). Studies of MPA protection have found both rapid and delayed responses
of exploited fish populations, in part depending on compliance with no-take regulations, the life history of
the exploited species, and the size, age and habitat structure of the CMR (Graham et al. 2011; Green et al.
2013; Edgar et al. 2014). Furthermore, suspected illegal fishing in the Cod Grounds CMR may be delaying
recovery (Stuart-Smith et al. 2009).
Illegal fishing is the major potential threat affecting communities in the CGCMR and SICMR. The CMRs lie
some kilometres offshore, are small, and their boundaries may be difficult to acknowledge and police. The
baseline survey in 2009 recorded fishing activities within the Cod Grounds CMR and derelict fishing gear
along the transects. These CMRs encompass unique and small-scale features that are significant in the
context of the surrounding habitat; they serve to aggregate fauna from a large “catchment area” and
fishing impacts could therefore have wide repercussions. Given the concentration of large-bodied
predators, even small amounts of fishing could result in significant biomass being removed from the
system. Surveillance, enforcement and education are therefore crucial in protecting these CMRs.
The removal of top predators from a system can have top-down repercussions throughout the food web,
and in extreme cases can lead to the alteration of the habitat-forming organisms themselves (Mumby et al.
2006). For instance, common target species in NSW include the urchin predators blue groper (Achoerodus
viridis) and pink snapper (Chrysophrys auratus). Removing these species may cause an increase in grazing
urchins, potentially leading to urchin barrens replacing habitat-forming macroalgae.
Despite similar depths, Pimpernel Rock had a more diverse sessile biota than the CGMR, including higher
cover of macroalgae and turf than any of the other sites, including the shallower Solitary Island sites.
Pimpernel Rock also hosts a higher biomass of large predators of both invertebrates and fishes, such as the
blue groper, various snapper species, and wrasses that prey on sea urchins, especially in their juvenile
stages. The longer history of protection at Pimpernel Rock may have led to a natural balance of larger fishes
than the CGMR, where planktivorous and pelagic species dominate over larger reef-dwelling predators; this
balance is likely to have flow-on effects down the food web to lower trophic levels and the sessile
community. Additionally, Pimpernel Rock is a smaller, more isolated habitat, and the aggregations of fishes
frequenting the pinnacle are likely to feed more heavily in the small area. The greater availability of habitat
surrounding the CGCMR allows a greater dispersion of fishes, and lighter feeding pressure in any one area.
2016 biodiversity surveys of the God Grounds and Pimpernel Rocks Commonwealth Marine Reserves| 33
The typical human footprint on coastal reefs in this region, where overfishing of large fishes has probably
led to larger urchin populations and the resulting urchin barrens, is reflected in the CGCMR (Ling et al.
2015).
The high abundance of the grey nurse shark C. taurus, especially during the most recent surveys, suggests
that this population is benefiting from no-take protection. The Cod Grounds and Pimpernel Rock are well-
known aggregation sites for this species, and this is one case where even a relatively small CMR appears
useful in protecting a key habitat of a large-bodied predator. Known aggregations sites for this species on
the east coast of Australia have seen declining numbers of individuals and lower occupancy than expected
(Otway et al. 2003); this site appears to retain a significant population of grey nurse sharks, and recurring
surveys will reveal whether numbers are stable or increasing. These results indicate a successful outcome
of general protection for this species, both inside and outside CMRs, with a beneficial additional layer of
protection added by the no-take zone.

34 | 2016 biodiversity surveys of the Cod Grounds and Pimpernel Rocks Commonwealth Marine Reserves
5 Recommendations
• Undertake regular monitoring of physical characteristics – monthly or seasonal reporting of
water quality, nutrients, turbidity, light and other physical parameters that support ecological
processes;
• Undertake ongoing ecological monitoring at intervals of 1-3 years to build up a temporal
dataset to assess changes relative to data provided by this survey, with results reported using a
comprehensive suite of sensitive environmental indicators;
• Incorporate additional sites for monitoring, especially additional control sites outside the
CMRs, in comparable habitats and depths;
• Include timed swims around the pinnacles for more accurate assessment of the grey nurse
shark population;
• Undertake monitoring of potential impacts, including dedicated surveys of fishing catch and
effort in the general area by recreational and commercial fishers, and reporting mechanisms
for pollution, shipping, interactions with megafauna and plastic marine debris;
• Through the longer term, consider establishing a buffer zone around the CMR boundaries.

2016 biodiversity surveys of the God Grounds and Pimpernel Rocks Commonwealth Marine Reserves| 35
6 Acknowledgements
The contributions of all divers and charter operators who contributed their time and expertise to field data collection are gratefully acknowledged: Antonia Cooper, Marty Filleul, Scott Ling, German Soler, Simon Talbot, also collated reef area data used in analyses. Just Berkhout provided database support.

36 | 2016 biodiversity surveys of the Cod Grounds and Pimpernel Rocks Commonwealth Marine Reserves
7 References
Andrew NL, O'Neil AL (2000) Large-scale patterns in habitat structure on subtidal rocky reefs in New South Wales. Marine and Freshwater Research 51:255-263 Bennett S, Wernberg T, Connell SD, Hobday AJ, Johnson CR, Poloczanska ES (2016) The ‘Great Southern Reef’: social, ecological and economic value of Australia’s neglected kelp forests. Marine and Freshwater Research 67:47-56 Brewer DT, Flynn A, Skewes TD, Corfield J, Pearson B, Alawo J, Young JW (2007) Ecosystems of the East Marine Planning Region. Report to Department of Environment and Water Resources by CSIRO, Cleveland Commonwealth of Australia (2001a) Recovery plan for the grey nurse shark (Carcharias taurus) in Australia. Environment Australia, Canberra Commonwealth of Australia (2001b) Solitary Islands Marine Reserve (Commonwealth Waters) Management Plan. Environment Australia, Canberra Davies P, Jordan A, Ingleton T, Neilson J, Mesley E, Pritchard T (2008) Cod Grounds Commonwealth Marine Reserve: Swath survey and habitat classification. Final report to the Department of the Environment, Water, Heritage and the Arts, Canberra Edgar GJ, Stuart-Smith RD, Willis TJ, Kininmonth S, Baker SC, Banks S, Barrett NS, Becerro MA, Bernard ATF, Berkhout J, Buxton CD, Campbell SJ, Cooper AT, Davey M, Edgar SC, Forsterra G, Galvan DE, Irigoyen AJ, Kushner DJ, Moura R, Parnell PE, Shears NT, Soler G, Strain EMA, Thomson RJ (2014) Global conservation outcomes depend on marine protected areas with five key features. Nature 506:216-228 Froese R, Pauly D (eds.) (2016) FishBase. World Wide Web electronic publication. www.fishbase.org, version (04/2009). Graham NAJ, Ainsworth TD, Baird AH, Ban NC, Bay LK, Cinner JE, De Freitas DM, Diaz-Pulido G, Dornelas M, Dunn SR, Fidelman PIJ, Foret S, Good TC, Kool J, Mallela J, Penin L, Pratchett MS, Williamson DH (2011) From microbes to people: tractable benefits of no-take areas for coral reefs. Oceanography and Marine Biology: an Annual Review 49:105-136 Green A, White A, Kilarski S (eds.) (2013) Designing marine protected area networks to achieve fisheries, biodiversity, and climate change objectives in tropical ecosystems: A practitioner guide. The Nature Conservancy, and the USAID Coral Triangle Support Partnership, Cebu City, Philippines Ingleton T, Davies P, Gardiner R, Pritchard T, Jordan A (2007) Solitary Islands Marine Reserves Commonwealth Waters - Underwater data capture and habitat classification. Report to the Department of the Environment, Water, Heritage and the Arts by HABMP, New South Wales Department of Environment and Climate Change, Sydney Kohler KE, Gill SM (2006) Coral Point Count with Excel extensions (CPCe): A Visual Basic program for the determination of coral and substrate coverage using random point count methodology. Computational Geosciences 32:1259-1269 Kuiter RH (2009) Seahorses and their relatives. Aquatic Photographics, Seaford, Australia.

2016 biodiversity surveys of the God Grounds and Pimpernel Rocks Commonwealth Marine Reserves| 37
Ling SD, Scheibling RE, Rassweiler A, Johnson CR, Shears NT, Connell SD, Salomon AK, Norderhaug KM, Perez-Matus A, Hernandez JC, Clemente S, Blamey LK, Hereu B, Ballesteros E, Sala E, Garrabou J, Cebrian E, Zabala M, Fujita D, Johnson LE (2015) Global regime shift dynamics of catastrophic sea urchin overgrazing. Philosophical Transactions of the Royal Society B - Biological Sciences 370:30269-30269 Malcolm HA, Smith SDS, Jordan A (2010) Using patterns of reef fish assemblages to refine a Habitat Classification System for marine parks in NSW, Australia. Aquatic Conservation: Marine and Freshwater Ecosystems 20:83-92 Mumby PJ, Dahlgren CP, Harborne AR, Kappel CV, Micheli F, Brumbaugh DR, Holmes KE, Mendes JM, Broad K, Sanchirico JN, Buch K, Box S, Stoffle RW, Gill AB (2006) Fishing, trophic cascades, and the process of grazing on coral reefs. Science 311:98–101 Oke PR, Middleton JH (2001) Nutrient enrichment off Port Stephens: the role of the East Australian Current. Continental Shelf Research 21:587-606 Otway NM, Burke AL, Morrison NS, Parker PC (2003) Monitoring and identification of NSW Critical Habitat Sites for conservation of Grey Nurse Sharks. EA Project No. 22499. NSW Fisheries Final Report Series, No. 47 Rule MJ, Smith SDA (2007) Depth-associated patterns in the development of benthic assemblages on artificial substrata deployed on shallow, subtropical reefs. Journal of Experimental Marine Biology and Ecology 345:38-51 Russ GR, Alcala AC (2004) Marine reserves: long-term protection is required for full recovery of predatory fish populations. Oecologia 138:622-627 Schirmer J, Casey AM, Mazur N (2004) Socio-economic impact assessment of the proposed Cod Grounds Marine Protected Area. Report prepared for the Department of the Environment and Heritage, Canberra Stuart-Smith R, Stuart-Smith J, Cooper A, Edgar G (2009) Baseline biodiversity survey of the Cod Grounds Commonwealth Marine Reserve, May 2009. Report to the Department of the Environment, Water, Heritage and the Arts by Reef Life Survey, Tasmanian Aquaculture and Fisheries Institute, Hobart The Ecology Lab (2006) Solitary Islands Marine Reserve baseline survey of the benthic environment, description of fish and habitat relationships; and assessment of mooring code of conduct at Pimpernel Rock. Report to the Department of the Environment and Heritage by the Ecology Lab Pty Ltd Sydney

38 | 2016 biodiversity surveys of the Cod Grounds and Pimpernel Rocks Commonwealth Marine Reserves
8 Appendices
APPENDIX 1 – SPECIES LIST OF FISHES RECORDED DURING SURVEYS IN THE CGCMR, SICMR AND REFERENCE SITES, INCLUDING FREQUENCY AND AVERAGE BIOMASS (KG).
Species Transects
Biomass
CG09 CG09 ref CG16 CG16 ref SI SI ref CG09 CG09 ref CG16 CG16 ref SI SI ref
Abudefduf bengalensis 0 0 0 0 0 1 0 0 0 0 0 7.115
Abudefduf vaigiensis 0 0 0 0 1 0 0 0 0 0 25.208 0
Acanthistius ocellatus 1 1 5 0 1 0 10.617 50.901 201.551 0 110.163 8.309
Acanthopagrus australis 6 0 3 0 0 3 429.490 0 299.844 0 0 447.509
Acanthurid spp. 0 0 0 0 0 1 0 0 0 0 0 24.022
Acanthurus dussumieri 0 0 0 0 0 1 0 0 0 0 0 0.245
Acanthurus nigrofuscus 0 0 1 0 0 2 0 0 0.996 0 0 5.590
Acanthurus olivaceus 0 0 0 0 0 3 0 0 0 0 0 76.590
Acanthurus triostegus 0 0 0 0 0 1 0 0 0 0 0 1.957
Achoerodus viridis 6 1 4 1 4 3 1029.944 172.107 2300.811 344.214 5377.686 666.716
Alectis ciliaris 0 0 0 0 1 0 0 0 0 0 669.537 0
Alectis indica 0 0 0 0 0 0 0 0 0 0 0 0
Amphiprion akindynos 0 0 0 0 0 13 0 0 0 0 0 1791.119
Amphiprion latezonatus 0 0 0 0 0 13 0 0 0 0 0 204.611
Amphiprion melanopus 0 0 0 0 0 4 0 0 0 0 0 27.065
Anampses caeruleopunctatus 0 0 0 0 0 3 0 0 0 0 0 7.489
Anampses neoguinaicus 0 0 0 0 0 6 0 0 0 0 0 6.190
Anoplocapros inermis 0 2 0 0 0 0 0 34.804 0 0 0 0
Aplodactylus lophodon 0 0 1 0 0 0 0 0 17.198 0 0 31.706
Apogon limenus 0 0 1 0 0 0 0 0 2.456 0 0 0
Argyrosomus japonicus 1 0 0 0 0 0 38366.860 0 0 0 0 0

2016 biodiversity surveys of the God Grounds and Pimpernel Rocks Commonwealth Marine Reserves| 39
Species Transects
Biomass
CG09 CG09 ref CG16 CG16 ref SI SI ref CG09 CG09 ref CG16 CG16 ref SI SI ref
Arothron stellatus 0 0 0 0 0 0 0 0 0 0 0 0
Atractoscion aequidens 1 0 1 1 0 0 26259.970 0 12351.720 49406.900 0 0
Atypichthys strigatus 3 5 6 3 4 4 2559.769 414992.500 45833.380 23758.250 279277.100 321.522
Aulopus purpurissatus 2 1 1 0 0 1 60.670 236.313 44.818 0 0 34.919
Aulostomus chinensis 0 0 0 1 2 2 0 0 0 10.958 196.662 16.929
Bodianus axillaris 0 0 1 0 0 2 0 0 0.077 0 0 8.231
Bodianus frenchii 1 1 0 1 1 0 56.381 169.142 0 701.254 95.687 0
Bodianus perditio 0 0 0 0 3 0 0 0 0 0 243.662 8.180
Bodianus unimaculatus 0 0 1 0 0 0 0 0 17.222 0 0 0
Brachaelurus waddi 0 0 0 1 0 0 0 0 0 96.095 0 44.864
Caesio caerulaurea 0 0 0 0 0 1 0 0 0 0 0 34.191
Caesio teres 0 0 0 0 1 1 0 0 0 0 108.468 643.715
Caesioperca lepidoptera 1 0 0 0 0 0 32.973 0 0 0 0 0
Cantherhines pardalis 0 0 0 0 0 1 0 0 0 0 0 4.535
Canthigaster callisterna 0 0 0 0 0 2 0 0 0 0 0 9.270
Canthigaster valentini 0 0 0 0 0 0 0 0 0 0 0 0.352
Carangid spp. 1 0 0 0 2 0 68.852 0 0 0 15646.650 0
Carangoides chrysophrys 0 0 0 0 2 0 0 0 0 0 640.608 0
Carangoides orthogrammus 0 0 1 0 0 0 0 0 5.912 0 0 0
Caranx sexfasciatus 0 0 0 0 0 0 0 0 0 0 0 77.129
Carcharias taurus 1 1 4 0 3 0 12596.410 16662.820 81332.530 0 109949.500 0
Centroberyx affinis 1 0 0 0 0 0 62.186 0 0 0 0 0
Centropyge bicolor 0 0 0 0 0 1 0 0 0 0 0 3.215
Centropyge tibicen 0 0 0 0 0 9 0 0 0 0 0 52.472
Centropyge vrolikii 0 0 0 0 0 1 0 0 0 0 0 4.144
Cephalopholis miniata 0 0 0 0 0 1 0 0 0 0 0 32.821
Cephalopholis urodeta 0 0 0 0 0 1 0 0 0 0 0 18.676
Chaetodon auriga 0 0 0 0 0 1 0 0 0 0 0 25.313

40 | 2016 biodiversity surveys of the Cod Grounds and Pimpernel Rocks Commonwealth Marine Reserves
Species Transects
Biomass
CG09 CG09 ref CG16 CG16 ref SI SI ref CG09 CG09 ref CG16 CG16 ref SI SI ref
Chaetodon citrinellus 0 0 0 0 0 2 0 0 0 0 0 4.086
Chaetodon flavirostris 0 0 0 0 0 3 0 0 0 0 0 22.336
Chaetodon guentheri 1 0 5 1 4 9 2.934 0 43.909 17.603 376.970 96.815
Chaetodon kleinii 0 0 0 0 2 8 0 0 0 0 50.086 88.853
Chaetodon lunulatus 0 0 0 0 0 1 0 0 0 0 0 2.296
Chaetodon mertensii 0 0 0 0 0 1 0 0 0 0 0 0.954
Chaetodon pelewensis 0 0 0 0 0 2 0 0 0 0 0 8.156
Chaetodon plebeius 0 0 0 0 0 1 0 0 0 0 0 3.247
Chaetodon rainfordi 0 0 0 0 0 1 0 0 0 0 0 2.296
Chaetodon spp. 0 0 0 0 0 1 0 0 0 0 0 7.700
Chaetodon tricinctus 0 0 0 0 0 1 0 0 0 0 0 4.505
Chaetodon trifascialis 0 0 0 0 0 4 0 0 0 0 0 24.487
Chaetodon unimaculatus 0 0 0 0 0 2 0 0 0 0 0 17.052
Cheilodactylus fuscus 13 4 7 1 3 7 12049.750 788.577 10230.620 5462.589 1154.886 756.756
Cheilodactylus vestitus 1 0 2 0 1 5 10.585 0 74.840 0 218.606 169.538
Cheilodipterus macrodon 0 0 0 0 0 0 0 0 0 0 0 19.142
Chelmonops truncatus 1 0 0 0 0 0 17.490 0 0 0 0 0
Chironemus marmoratus 0 0 0 0 0 0 0 0 0 0 0 26.829
Chromis flavomaculata 0 0 0 0 1 3 0 0 0 0 9.650 5.675
Chromis hypsilepis 15 4 10 0 1 6 8233.215 8172.660 72713.370 0 40.271 503.543
Chromis margaritifer 0 0 1 0 1 3 0 0 0.028 0 0.644 2.505
Chromis viridis 0 0 0 0 0 1 0 0 0 0 0 3.374
Chromis weberi 0 0 0 0 0 1 0 0 0 0 0 0.927
Chromis xanthura 0 0 0 0 1 0 0 0 0 0 8.729 0
Cirrhilabrus punctatus 0 0 0 0 1 0 0 0 0 0 9.585 0.015
Cirrhitichthys aprinus 0 0 0 0 3 8 0 0 0 0 55.578 26.021
Cirrhitichthys falco 0 0 0 0 0 2 0 0 0 0 0 2.228
Coris aygula 0 0 0 0 0 2 0 0 0 0 0 5.958

2016 biodiversity surveys of the God Grounds and Pimpernel Rocks Commonwealth Marine Reserves| 41
Species Transects
Biomass
CG09 CG09 ref CG16 CG16 ref SI SI ref CG09 CG09 ref CG16 CG16 ref SI SI ref
Coris dorsomacula 2 0 2 0 1 6 14.789 0 14.304 0 47.719 45.590
Coris gaimard 0 0 0 0 0 1 0 0 0 0 0 8.299
Coris picta 17 3 9 0 3 5 671.862 314.321 651.270 0 462.670 95.493
Ctenochaetus binotatus 0 0 0 0 0 3 0 0 0 0 0 31.469
Cyprinocirrhites polyactis 0 0 2 0 0 0 0 0 1.508 0 0 0
Dascyllus reticulatus 0 0 0 0 0 11 0 0 0 0 0 262.169
Dascyllus trimaculatus 0 0 0 0 1 13 0 0 0 0 3.3705 11995.790
Dendrochirus zebra 0 0 0 0 0 1 0 0 0 0 0 4.859
Dicotylichthys punctulatus 0 1 0 0 0 2 0 144.317 0 0 0 116.182
Dinolestes lewini 3 0 1 0 0 0 4910.969 0 1009.955 0 0 0
Diodon hystrix 0 0 0 0 0 3 0 0 0 0 0 408.101
Elagatis bipinnulata 1 0 0 0 0 0 133.427 0 0 0 0 41.769
Enoplosus armatus 10 5 9 1 1 0 219.204 143.393 363.873 29.915 223.600 0
Epinephelus daemelii 1 0 0 0 1 1 137.174 0 0 0 5729.582 105.330
Epinephelus fasciatus 0 0 0 0 1 2 0 0 0 0 48.369 28.166
Epinephelus undulatostriatus 1 0 1 0 2 0 38.771 0 89.357 0 939.676 0
Eubalichthys bucephalus 1 0 0 0 0 0 27.729 0 0 0 0 0
Eubalichthys mosaicus 1 0 1 0 0 0 6.082 0 47.989 0 0 0
Fistularia commersonii 1 1 0 0 0 0 3.245 9.734 0 0 0 1.007
Fistularia petimba 1 0 0 0 0 0 0.431 0 0 0 0 1.220
Forcipiger flavissimus 0 0 0 0 0 0 0 0 0 0 0 0.357
Glaucosoma scapulare 0 2 0 0 2 0 0 2679.215 0 0 6228.212 0
Gnathodentex aureolineatus 0 0 0 0 0 1 0 0 0 0 0 18.437
Gomphosus varius 0 0 0 0 0 1 0 0 0 0 0 0.623
Halichoeres chrysus 0 0 0 0 0 1 0 0 0 0 0 2.604
Halichoeres hortulanus 0 0 0 0 0 2 0 0 0 0 0 1.063
Halichoeres margaritaceus 0 0 0 0 0 2 0 0 0 0 0 4.964
Halichoeres nebulosus 0 0 0 0 2 10 0 0 0 0 11.830 50.411

42 | 2016 biodiversity surveys of the Cod Grounds and Pimpernel Rocks Commonwealth Marine Reserves
Species Transects
Biomass
CG09 CG09 ref CG16 CG16 ref SI SI ref CG09 CG09 ref CG16 CG16 ref SI SI ref
Hemigymnus fasciatus 0 0 0 0 0 3 0 0 0 0 0 21.543
Heniochus acuminatus 0 0 0 0 0 0 0 0 0 0 0 0
Heniochus chrysostomus 0 0 0 0 0 0 0 0 0 0 0 0.242
Heniochus diphreutes 0 0 0 0 0 3 0 0 0 0 0 99.034
Heterodontus portusjacksoni 1 0 2 0 0 0 285.806 0 452.127 0 0 0
Heteropriacanthus cruentatus 0 0 0 0 0 1 0 0 0 0 0 8.146
Hologymnosus doliatus 0 0 0 0 0 1 0 0 0 0 0 4.515
Hypoplectrodes annulatus 0 1 0 0 0 0 0 31.851 0 0 0 0
Hypoplectrodes maccullochi 15 5 8 3 4 3 175.462 103.849 207.401 88.864 105.484 11.054
Kyphosus sydneyanus 0 0 0 0 1 1 0 0 0 0 1149.455 2958.805
Labrid spp. 1 0 0 0 0 1 2.130 0 0 0 0 4.683
Labroides dimidiatus 0 0 2 0 2 15 0 0 4.661 0 24.145 35.537
Latridopsis forsteri 0 0 1 0 0 0 0 0 259.439 0 0 0
Lotella rhacina 7 2 4 2 0 0 115.501 315.282 74.400 249.612 0 0
Lutjanid spp. 0 0 0 0 0 1 0 0 0 0 0 439.470
Lutjanus adetii 0 0 0 0 0 0 0 0 0 0 0 0
Lutjanus bohar 0 0 0 0 0 0 0 0 0 0 0 2.338
Lutjanus kasmira 0 0 0 0 0 0 0 0 0 0 0 0.111
Lutjanus russellii 0 0 3 0 4 0 0 0 438.212 0 6197.014 0
Macropharyngodon meleagris 0 0 0 0 0 2 0 0 0 0 0 1.286
Macropharyngodon negrosensis 0 0 0 0 0 0 0 0 0 0 0 0.113
Mecaenichthys immaculatus 3 3 4 1 1 0 18.499 55.496 197.692 24.438 18.943 0
Meuschenia freycineti 4 0 0 0 0 0 214.940 0 0 0 0 0
Meuschenia scaber 5 2 0 0 0 0 81.330 76.377 0 0 0 0
Meuschenia trachylepis 1 0 0 0 0 1 16.391 0 0 0 0 3.704
Microcanthus strigatus 0 0 2 0 0 0 0 0 320.163 0 0 0
Mulloidichthys vanicolensis 0 0 0 0 0 1 0 0 0 0 0 51.712
Myripristis kuntee 0 0 0 0 0 1 0 0 0 0 0 9.857

2016 biodiversity surveys of the God Grounds and Pimpernel Rocks Commonwealth Marine Reserves| 43
Species Transects
Biomass
CG09 CG09 ref CG16 CG16 ref SI SI ref CG09 CG09 ref CG16 CG16 ref SI SI ref
Myripristis murdjan 0 0 0 0 0 2 0 0 0 0 0 47.927
Naso unicornis 0 0 0 0 0 3 0 0 0 0 0 39.103
Nelusetta ayraudi 1 0 0 0 0 0 56.997 0 0 0 0 0
Nemadactylus douglasii 5 4 3 2 0 0 536.698 1155.326 184.966 459.938 0 0
Notolabrus gymnogenis 12 5 6 2 4 2 447.448 391.823 342.349 890.037 829.357 31.624
Ophthalmolepis lineolatus 16 6 12 3 1 0 1374.925 752.165 1653.691 1799.352 285.414 0
Orectolobus halei 4 2 6 1 3 1 17574.030 12032.420 8877.352 1249.964 13677.210 441.728
Orectolobus maculatus 2 1 1 0 1 0 5056.389 1977.446 2640.489 0 937.473 0
Orectolobus spp. 0 0 0 0 0 1 0 0 0 0 0 223.674
Ostorhinchus aureus 0 0 0 0 0 1 0 0 0 0 0 1.112
Ostorhinchus properuptus 0 0 0 0 0 1 0 0 0 0 0 0.476
Pagrus auratus 12 2 7 1 1 0 1113.369 40.650 968.350 55.189 494.201 0
Paracaesio xanthura 1 0 1 0 3 6 768.784 0 67.429 0 5485.334 723.320
Paracanthurus hepatus 0 0 0 0 0 6 0 0 0 0 0 137.344
Parachaetodon ocellatus 0 0 0 0 0 0 0 0 0 0 0 0
Paracirrhites arcatus 0 0 0 0 0 0 0 0 0 0 0 0.566
Paracirrhites forsteri 0 0 0 0 0 0 0 0 0 0 0 2.780
Paraluteres prionurus 0 0 0 0 0 1 0 0 0 0 0 0.443
Parapercis stricticeps 0 0 1 0 0 0 0 0 1.446 0 0 0
Paraplesiops bleekeri 0 0 1 0 0 0 0 0 35.380 0 0 0
Parma microlepis 8 2 1 2 0 0 821.484 92.030 19.603 880.677 0 0
Parma oligolepis 0 0 0 0 0 2 0 0 0 0 0 15.386
Parma polylepis 0 0 0 0 0 5 0 0 0 0 0 51.867
Parma unifasciata 16 4 12 3 4 14 1711.205 1359.332 4169.764 1383.406 1165.971 2111.834
Parupeneus multifasciatus 0 0 0 0 0 2 0 0 0 0 0 7.460
Parupeneus spilurus 15 1 12 2 4 12 1036.939 68.129 1013.602 299.160 1022.676 1095.750
Pempheris affinis 5 0 4 1 1 6 34.655 0 99.431 99.756 4387.119 75.644
Pempheris analis 0 0 0 0 0 0 0 0 0 0 0 13.506

44 | 2016 biodiversity surveys of the Cod Grounds and Pimpernel Rocks Commonwealth Marine Reserves
Species Transects
Biomass
CG09 CG09 ref CG16 CG16 ref SI SI ref CG09 CG09 ref CG16 CG16 ref SI SI ref
Pempheris compressa 3 2 3 1 2 0 1736.040 3687.752 135.694 49.878 413.514 9.3679
Pempheris multiradiata 0 0 0 1 0 0 0 0 0 171.310 0 0
Pempheris oualensis 0 0 0 0 0 1 0 0 0 0 0 53.035
Platax teira 0 0 0 0 0 1 0 0 0 0 0 84.151
Plectorhinchus flavomaculatus 0 0 0 0 0 4 0 0 0 0 0 305.106
Plectorhinchus gibbosus 0 0 0 0 0 1 0 0 0 0 0 134.237
Plectorhinchus picus 0 0 0 0 0 1 0 0 0 0 0 105.374
Plectroglyphidodon dickii 0 0 0 0 0 8 0 0 0 0 0 20.121
Plectroglyphidodon johnstonianus 0 0 0 0 0 1 0 0 0 0 0 3.324
Pomacanthus semicirculatus 0 0 0 0 0 0 0 0 0 0 0 38.039
Pomacentrus australis 0 0 0 0 0 2 0 0 0 0 0 1.398
Pomacentrus bankanensis 0 0 0 0 0 2 0 0 0 0 0 0.050
Pomacentrus coelestis 0 0 0 0 1 12 0 0 0 0 15.444 110.001
1Prionurus maculatus 1 0 1 0 1 5 128.635 0 193.576 0 180.861 2146.256
Prionurus microlepidotus 4 0 5 1 3 13 681.924 0 4944.698 444.582 22107.580 7801.993
Pseudanthias fasciatus 0 0 0 0 4 1 0 0 0 0 4594.649 4.479
Pseudanthias hypselosoma 0 0 0 0 2 0 0 0 0 0 573.145 0
Pseudanthias pictilis 0 0 0 0 0 1 0 0 0 0 0 2.552
Pseudanthias rubrizonatus 0 0 0 0 2 0 0 0 0 0 3158.795 0
Pseudanthias spp. 0 0 0 0 0 0 0 0 0 0 0 0.528
Pseudanthias squamipinnis 0 0 4 0 2 2 0 0 1.204 0 143.849 46.965
Pseudocaranx georgianus 3 0 0 0 0 3 137.124 0 0 0 0 1063.874
Pseudocoris yamashiroi 1 0 0 0 0 0 0.475 0 0 0 0 0
Pseudolabrus guentheri 0 0 0 0 1 3 0 0 0 0 66.854 36.536
Pseudolabrus luculentus 0 0 1 0 1 5 0 0 5.460 0 34.096 20.860
Pterocaesio chrysozona 0 0 0 0 0 1 0 0 0 0 0 16.734
Pterocaesio digramma 0 0 0 0 0 6 0 0 0 0 0 235.465
Pterois volitans 0 0 1 0 0 0 0 0 17.825 0 0 0

2016 biodiversity surveys of the God Grounds and Pimpernel Rocks Commonwealth Marine Reserves| 45
Species Transects
Biomass
CG09 CG09 ref CG16 CG16 ref SI SI ref CG09 CG09 ref CG16 CG16 ref SI SI ref
Rhabdosargus sarba 5 1 8 0 0 0 521.253 148.033 553.818 0 0 0
Sarda australis 0 0 1 0 0 0 0 0 4457.053 0 0 0
Scarus chameleon 0 0 0 0 0 1 0 0 0 0 0 26.805
Schuettea scalaripinnis 0 0 0 0 0 0 0 0 0 0 0 0
Scolopsis bilineata 0 0 0 0 0 1 0 0 0 0 0 9.438
Scorpaena cardinalis 4 1 0 0 0 1 114.478 207.076 0 0 0 17.785
Scorpaena jacksoniensis 0 0 5 0 2 0 0 0 273.580 0 165.100 0
Scorpaenodes evides 0 0 0 0 0 1 0 0 0 0 0 1.960
Scorpaenodes littoralis 0 0 0 0 0 0 0 0 0 0 0 1.351
Scorpaenopsis spp. 0 0 0 0 1 0 0 0 0 0 53.476 0
Scorpis lineolata 13 5 12 2 4 12 7515.154 140647.900 372407.200 11950.840 522993.00 3069.208
Seriola dumerili 0 0 3 0 2 0 0 0 1868.785 0 3497.543 0
Seriola hippos 2 0 0 0 0 0 1005.771 0 0 0 0 0
Seriola lalandi 3 0 8 1 4 1 2888.953 0 2737.158 320.620 195589.700 17.402
Seriola rivoliana 1 0 0 0 0 1 113.565 0 0 0 0 14.163
Siganus fuscescens 0 0 0 0 0 1 0 0 0 0 0 14.328
Stegastes apicalis 0 0 0 0 0 1 0 0 0 0 0 6.450
Stegastes gascoynei 0 0 0 0 0 13 0 0 0 0 0 532.628
Stethojulis bandanensis 0 0 0 0 0 6 0 0 0 0 0 9.314
Stethojulis interrupta 0 0 0 0 0 6 0 0 0 0 0 38.226
Stethojulis strigiventer 0 0 0 0 0 1 0 0 0 0 0 2.003
Suezichthys arquatus 1 0 0 0 0 1 2.211 0 0 0 0 1.575
Sufflamen chrysopterum 0 0 0 0 0 5 0 0 0 0 0 111.949
Sufflamen fraenatum 0 0 0 0 0 3 0 0 0 0 0 46.218
Syngnathid spp. 0 0 0 0 0 1 0 0 0 0 0 0.209
Synodus variegatus 0 0 0 1 0 0 0 0 0 41.343 0 1.226
Thalassoma amblycephalum 0 0 0 0 2 8 0 0 0 0 123.849 56.784
Thalassoma jansenii 0 0 0 0 0 2 0 0 0 0 0 3.965

46 | 2016 biodiversity surveys of the Cod Grounds and Pimpernel Rocks Commonwealth Marine Reserves
Species Transects
Biomass
CG09 CG09 ref CG16 CG16 ref SI SI ref CG09 CG09 ref CG16 CG16 ref SI SI ref
Thalassoma lunare 0 0 0 0 2 16 0 0 0 0 71.747 2102.408
Thalassoma lutescens 0 0 0 0 2 15 0 0 0 0 627.662 958.078
Thalassoma nigrofasciatum 0 0 0 0 2 0 0 0 0 0 103.445 4.128
Thalassoma quinquevittatum 0 0 0 0 1 0 0 0 0 0 1.501 0
Thalassoma spp. 0 0 0 0 0 0 0 0 0 0 0 0
Trachichthys australis 1 0 0 0 0 0 3.612 0 0 0 0 0
Trachinops taeniatus 13 4 10 3 4 2 117.204 359.503 179.662 329.095 1218.406 43.713
Trachurus novaezelandiae 2 0 0 0 0 1 216.187 0 0 0 0 908.714
Trachypoma macracanthus 0 0 0 0 0 3 0 0 0 0 0 25.354
Upeneichthys lineatus 3 1 1 0 0 0 31.250 21.327 25.548 0 0 0
Zanclus cornutus 0 0 0 0 1 3 0 0 0 0 62.449 33.633