2016 - petrosa.co.za ar 2016 final.pdf · 000 report of the board audit and risk committee ......
TRANSCRIPT

2016INTEGRATED ANNUAL REPORT

CONTENTS
OUR BUSINESS PetroSA BOARD
0 About us0 Our mandate0 Highllights of 2015/20160 Organisational structure0 What we do00 Performance
against objectives00 Stakeholder engagement
00 Interim Chairman’s statement
00 Board of Directors
00 Framework for corporate governance
00 King III application and conformance
00 Remuneration philosophy
00 Directors and Executive remuneration
00 Governance processes
00 Enterprise risk management
00 Internal audit
PetroSA LEADERSHIP
00 Report from the Acting Group Chief Executive Officer (Group CEO)
00 Executive management team
00 Report from the Acting Group Chief Financial Officer (Group CFO)

PetroSA Integrated Annual Report 2016 | 1
FINANCIAL PERFORMANCE
00 Report of the Independent Auditors
00 Directors’ Responsibilities and Approval
00 Performance against Objectives
000 Directors’ Report
000 Report of the Board Audit and Risk Committee
000 Statement of the Company Secretary
000 Statement of Financial Position
000 Statement of Profit or Loss and Other Comprehensive Income
000 Statement of Changes in Equity
000 Statement of Cash Flows
000 Accounting Policies
000 Notes to the Audited Annual Financial Statements
The following supplementary information does not form part of the audited annual financial statements and is unaudited:
000 Fields in production and under development
000 Definition of financial terms
REVIEW OF THE 2015/2016 FINANCIAL YEAR
00 Our strategy
00 Strategic Focus Area 1: Business sustainability
00 Strategic Focus Area 2: Growth
00 Strategic Focus Area 3: SHEQ
00 Strategic Focus Area 4: Transformation

2 | PetroSA Integrated Annual Report 2016
ABBREVIATIONS AND ACRONYMS
BAC Board Audit Committee BBBEE Broad Based Black Economic EmpowermentCEF CEF SOC Limited COD Conversion of Olefins to DistillateCOE Centre Of Excellence COO Chief Operating Officer CSI Corporate Social Investment CTICC Cape Town International Convention CentreDEDAT Department of Economic Development and TourismDIB De-isobutaniser DIH De-isohexaniser DoE Department of Energy DRP Divisional Risk Profiles ECB European Central Bank EE Employment Equity EEF Employment Equity Forum EMAC Executive Management Assurance CommitteeERM Enterprise Risk Management ESD Enterprise Supplier DevelopmentEXCO Executive Committee FEED Front End Engineering DesignFPSO Floating Production Storage and Off-loadingGCEO Group Chief Executive OfficerGCFO Group Chief Financial Officer GIT Graduate In Training GTL Gas-To-Liquid HC Human Capital HCC Human Capital Committee HSE Health Safety and EnvironmentIDC Industrial Development CorporationIFRS International Financial Reporting StandardsJV Joint Venture KPI Key Performance Indicator LNG Liquefied Natural Gas LPG Liquefied Petroleum Gas LTI Lost Time Incidents LTIFR Lost Time Injury Frequency RateMPRDA Mineral and Petroleum Resources Development Act NDP National Development Plan NOC National Oil Company NPAT Net Profit After Tax OCGT Open Gas Cycle Turbines OPASA Offshore Petroleum Association of South AfricaPASA Petroleum Agency of South AfricaPetroSA The Petroleum Oil and Gas Corporation of South Africa (SOC) LimitedPSM Process Safety ManagementQMS Quality Management System RMCC Risk Management and Compliance CommitteeSAPIA South African Petroleum Industries AssociationSEAS Sustainable Education and SkillsSEC Social and Ethics Committee SEFA Small Enterprise Finance AgencySFF Strategic Fuel Fund SHEQ Safety, Health, Environment and QualitySOC State Owned Company SPI Sasol Petroleum International SST Sustainable SEAS Trust STIP Short Term Incentive Plan ULP Unleaded Petrol VP Vice President VSP Voluntary Severance Package

PetroSA Integrated Annual Report 2016 | 3
Scope and boundaryThe integrated report provides information on PetroSA’s main business operations, functions, projects, investments and joint ventures. The report narrative (pages XX to XX) combined with the consolidated annual financial statement’s (pages XX to XXX) provide all information relevant to our S takeholders and required to comply with the reporting standards we subscribe to.
MaterialityTo ensure that this report is accurate, relevant and consistent, the reporting process is informed by the key material issues impacting on, or impacted by our business. The responsibility for determining such materiality is ultimately held by the PetroSA Board.
The process is informed by:
• comprehensive collaboration and input involving relevant internal and external Stakeholders;
• business and operational priorities; • key strategic focus areas; and • detailed and ongoing assessment
of risks and opportunities.
AssuranceAssurance regarding the contents of this report is achieved through an internal assurance process. At an internal level, the Group Chief Executive Officer (Group CEO) takes ultimate responsibility for the correctness and relevance of the contents of the report, however, the Executive Management provides assurance that it has implemented, monitored and managed all relevant controls, compliance, governance and reporting requirements. This ensures the reliability and integrity of the information presented in this report. External assurance of our financials is provided by the Group’s external auditors, and their audit opinion can be found on page XX of this integrated report.
Reporting structure and frameworksEvery effort has been made to align with the integrated reporting requirements of the King III Code of Good Practice. The report also conforms to the standards and requirements of the South African Companies Act No 71 of 2008.
ABOUT THIS REPORT
The 2016 PetroSA Integrated Annual Report (or “integrated report”) offers a comprehensive review of our Company’s performance, challenges and opportunities during the 2015/16 financial year. This report provides our Stakeholders with insights into our recent financial, operational, social and environmental performance as well as ongoing efforts to create sustainable value going forward.

4 | PetroSA Integrated Annual Report 2016
PIONEERING INNOVATION.CHANGING MINDS.

PetroSA Integrated Annual Report 2016 | 5
About us 0Our mandate 0Highlights of the 2015/16 financial year 0Our Vision 0Our Mission 0Our Values 0Organisational structure 0What we do 0Performance against objectives 00Stakeholder engagement 00
OUR BUSINESS

6 | PetroSA Integrated Annual Report 2016
OUR BUSINESS
The petroleum oil and gas corporation of South Africa SOC Limited (PetroSA) was formed in 2002 through the merger of Soekor E and P (PTY) Limited, Mossgas (PTY) Limited and parts of the Strategic Fuel Fund (SFF), a subsidiary of CEF SOC limited.
PetroSA is registered as a commercial entity under South African law. CEF SOC Limited (PetroSA’s shareholder), is wholly owned by the Government of South Africa and reports to the Department of Energy (DoE).
PetroSA is mandated to operate as an integrated commercial entity and create value for its shareholder and all its Stakeholders. Delivering on the mandate goes beyond contributing to the national economy through tax and dividend payments. Our mandate includes making a significant contribution towards advancing the broader national objectives of the South African Government such as economic growth, job creation and industry transformation for the ultimate benefit of all the country’s citizens.
ABOUT US OUR MANDATE
We own the world’s first GTL refinery The Mossel Bay GTL refinery is now the world’s third largest Our business spans the entire petroleum value chain We produce ultra-clean, low-sulphur, low-aromatic synthetic fuels and high-value products We are industry leaders in transformation, championing national objectives in the petroleum industry Our strategy is consistent with the National Development Plan (NDP) Our talent for innovation is recognised globally, as we continue to develop and own award-winning GTL technology

PetroSA Integrated Annual Report 2016 | 7
To be the leading African energy company
Stewardship Honesty Integrity Respect Transparency
HIGHLIGHTS FOR THE 2015/2016 FINANCIAL YEAR
OUR VISION
OUR MISSION
OUR VALUES
The Group posted a net loss of R449 million as opposed to 2015’s R14.574 billion loss.
The Group is a going concern with adequate financial resources to continue operations into the future.
The BBBEE procurement expenditure was 84.7% of total procurement spend.
The company achieved a saving of 18.7% of total annual budget.
PetroSA will be the leading provider of hydrocarbons and related quality products, by leveraging its proven technologies and harnessing its human capital for the benefit of its Stakeholders

8 | PetroSA Integrated Annual Report 2016
ORGANISATIONAL STRUCTURE
OFFICE OF THE CEOGroup Chief Executive Officer
FINANCEGroup Chief
Financial Officer
HUMAN CAPITALVP: Human Capital
CORPORATE AFFAIRS AND
SHARED SERVICESVP: Corporate Affairs and Shared Services
NEW VENTURES UPSTREAM
VP: New Ventures Upstream
OPERATIONSVP: Operations
NEW VENTURES MIDSTREAM
VP: New Ventures Midstream
TRADING, SUPPLY AND LOGISTICSVP: Trading, Supply
and Logistics
OUR BUSINESS
OFFICE OF THE COOChief Operating Officer

PetroSA Integrated Annual Report 2016 | 9
WHAT WE DO
• Exploration and production of oil and natural gas resources locally and internationally. Locally, we operate the FA-EM, South Coast and F-O gas fields. In addition, we have exploration acreage on the west coast of South Africa. Internationally, we have producing and development assets in Ghana.
• The participation in, and acquisition of local, as well as international upstream petroleum ventures.
• Production of synthetic fuels from offshore gas. The GTL refinery produces ultra-clean, low-sulphur, low-aromatic synthetic fuels and high-value products converted from
natural methane-rich gas and condensate using the unique GTL FischerTropsch technology. Key commodities we produce include unleaded petrol, diesel, kerosene, fuel oil, propane, LPG, export distillates and alcohols.
• Development of domestic refining capacity, liquid fuels logistical infrastructure and technology.
• Marketing and trading of oil and petroleum products locally and internationally. We sell most of our fuel and fuel-related products to major oil companies operating in South Africa. These also include high-value speciality chemicals sold in the local and international markets.

10 | PetroSA Integrated Annual Report 2016
OUR BUSINESS
OUR GLOBAL FOOTPRINT
PetroSA has formed multiple partnerships with international players across the value chain
SOUTH AMERICA
NORTH AMERICA

PetroSA Integrated Annual Report 2016 | 11
PetroSA Ghana
PetroSA Equatorial
Guinea
RSA West Coast Development
South Coast Development
Tzaneen Depot
Bloemfontein Depot
FAR EASTMIDDLE EAST
EUROPE
Office in Rotterdam The Netherlands
Cape Town Head Office
E&P
Offices
Depots
GTL Mossel Bay Refinery and Depot
Johannesburg Office
GTL Refinery

12 | PetroSA Integrated Annual Report 2016
OUR BUSINESS
PERFORMANCE AGAINST OBJECTIVES
PetroSA’s Key Performance Indicators (KPIs) are important in assessing the overall health and performance of the business and they include a range of operational, financial and non-financial targets. Each year, targets within the scorecard may change to reflect the most material strategic objectives to deliver on our long-term strategy and the associated risks the Company faces. In 2015, 38% of our KPIs were achieved. This under-performance reflects the challenging year the Company faced.
BBBEE procurement expenditure
was
84.7%
Indigenous production volumes
from the GTL refinery were
26% below target
Upstream Partnership strategies
were developed and approved by
the Board
Targets for the sustainability projects
were not achieved due to re-prioritisation
of projects during current low oil price
environment
Net margin for Downstream business had met its target of
3%
7 environmental
incidents reported vs. a target of
6
Cost savings of
17.3% were achieved
Lost Time Injury Frequency Rate
increased to
0.42 from 0.23 in the previous
financial year

PetroSA Integrated Annual Report 2016 | 13
The 2015/2016 financial year was another challenging one for us.
Mr BW Ngubane Interim Chairman PetroSA Board

14 | PetroSA Integrated Annual Report 2016
PetroSA is committed to engaging with all its Stakeholders, because such engagements are critical to the attainment of our strategic goals and long-term sustainability. The Company values all its Stakeholders and understands that it is imperative to communicate with all of them across the value chain.
OUR BUSINESS
STAKEHOLDER ENGAGEMENT
TABLE 1 The Stakeholder Engagement Strategy entailed the execution of the following activities
STAKEHOLDER ENGAGEMENT CHANNELS KEY CONCERNS COMPANY RESPONSE
1GOVERNMENT, DEPARTMENTS AND MINISTRIES, PARLIAMENT, REGULATORY BODIES
– Parliamentary Briefings– One-on-one meetings
– Sustainability of business– Regulatory adherence– Financial performance– Socio-economic responsibility– Non-performance of key
projects
PetroSA and CEF, its main shareholder, outlined that a multi-disciplinary team has been established to conceptualise a turnaround strategy.
2EMPLOYEES
– EXCO Roadshows– Email Bulletin– Intranet– Employee Relations Forum (ERF)
Staff Imbizo
– Business sustainability– Head count reduction (VSP)
In an effort to sustain the business, PetroSA embarked on a a voluntary severance process. This resulted in significant savings for the Company.
3COMMUNITIES (MOSSEL BAY)
– Community Stakeholder Forum – Sustainability of business– Corporate social responsibility
R8.7 million in CSI spend in Mossel Bay during 2015/2016.
4MEDIA
– Press Briefings– Interviews– Press Statements– Media Enquiry
– Business sustainability– Transparency– Integrity
In the period under review PetroSA communicated in a transparent and truthful manner about its challenges.
5INDUSTRY BODIES (SAPIA)
– Meetings – Consensus on industry issues– Update projects such as the
TNPP Project of Transnet
As a member of the Board of Governors at SAPIA, PetroSA participated and made inputs relating to security of national fuel supply issues.
Stakeholder Engagement Strategy
PetroSA developed an integrated stakeholder engagement strategy based on King III, the International Integrated Reporting Council (IIRC), with input from senior management, as well as the Social and Ethics Committee of the PetroSA Board of Directors (the Board).

PetroSA Integrated Annual Report 2016 | 15
Our focus during the next financial year will be on ensuring that we find a long-term sustainable solution for our Company.
Mapula Modipa, Acting Group CEO

16 | PetroSA Integrated Annual Report 2016
PUSHING BOUNDARIES.EXPLORING POSSIBILITIES.

PetroSA Integrated Annual Report 2016 | 17
PetroSA BOARDInterim Chairman’s statement 00
Board of Directors 00
Corporate governance statement 00
King III application and conformance 00
Remuneration philosophy 00
Director’s and Executive’s remuneration 00
Governance processes 00
Enterprise risk management 00
Internal audit 00

18 | PetroSA Integrated Annual Report 2016
PetroSA BOARD
INTERIM CHAIRMAN’S STATEMENT
Strategic interventions
The Board continues to respond to these challenges in order to turn the Company around to a profitable entity and remain a going concern. The immediate task of the Board was to ensure that there was a deliberate focus by the entire Company on cost containment and asset optimisation. We intensified our cost saving drive under the BillionPlus project resulting in actual operating costs for the period falling to R929 million against a budget of R951 million. As part of this project, we also embarked on a head count reduction process in December 2015, by incentivising Staff to take up the Voluntary Severance Package (VSP) thus reducing overall operational costs while avoiding retrenchments. We are happy to report that this process has so far yielded positive results with savings to the tune of R120 million realised during the financial year. We are hoping to conclude this process in the next financial year.
With regard to the challenge of depleting feedstock at our GTL refinery in Mosel Bay, a number of solutions were investigated during the year including, amongst others, the Enhanced Condensate Processing project, the EBK upstream project and the Liquid Feedstock Process project. The Board joined hands with the Executives in the establishment of the Sustainability and Integration team tasked with developing an Integrated Sustainability Plan (ISP) for the business. The main focus of the ISP was to ensure that we have a long term solution for our GTL refinery and that such a solution is integrated with all other short-to-medium solutions. Significant progress has been achieved during the year and the S&I team is expected to produce their final report in the next financial year.
In addition, the Board decided to change the production mode of the
The 2015/2016 financial year was another challenging one for us as we closed the year with a loss on the back of low crude oil prices, low feedstock levels for the GTL refinery, exchange rate volatility and fragile global economic growth. We recorded a net loss of R449 million, a marked improvement from last year’s R14.6 billion loss. This includes an impairment charge of R254 million booked against onshore and offshore production assets. Our gross revenue amounted to R15.7 billion, a 13% decline from last year, as a result of lower product prices and declining production volumes at our GTL refinery in Mossel Bay.
refinery and reduce it to sub-optimal levels in order to prolong its operational life. This change gave us time to investigate all the various ISP solutions, including that of finding alternative sources of feedstock for our GTL refinery. In support of these efforts, the Board approved a Funding and Strategic Partnership Strategy which allowed us to pursue strategic partners, particularly from hydrocarbon-rich countries in Africa, the Middles East and within the BRICS alliance (Brazil, Russia, India, China and South Africa). In addition, we also issued an Expression of Interest aimed at inviting industry players to participate in our asset farm-out process where potential partners were requested to submit bids to take up equity in some of our upstream assets. The main objective of the farm-out process was to mitigate against exposure to exploration and production risks, whilst raising project funding in order to unlock the value of our upstream assets. This process is proceeding well with the target to finalise during the 2017 financial year.
Our Board participated actively in the Project Apollo Steering Committee, initiated by CEF during the financial year. The main focus of Project Apollo was to investigate and develop a turnaround plan for the long-term sustainability of the entire PetroSA business. The Board will apply its mind to the recommendations of Project Apollo once the report has been submitted.
Health, Safety and the EnvironmentDespite our high regard for maintaining world class health, safety and environmental (HSE) standards, it is with regret that we report that PetroSA suffered a fatality in September 2015, the first since the last recorded fatality in 2009. We investigated the incident and implemented corrective measures. Our deepest condolences go to the Vanqa family and the PetroSA Staff for their loss. HSE matters continue
The immediate task of the Board was to ensure that there was a deliberate focus by the entire Company on cost containment and asset optimisation.

PetroSA Integrated Annual Report 2016 | 19
to be of paramount importance to us. As a result, we revisited our HSE culture immediately after the incident and resuscitated our drive towards strengthening it across the Company. Operational safety and integrity are an integral part of the PetroSA business and we will not compromise on these fundamental principles. In terms of quality, our ISO9001 certification, which covers all our branches and depots, remained valid throughout the financial year.
Corporate governance
The governance framework of the Company is aligned with all relevant legislation and in particular with the requirements of the Corporate Practices and Conduct Framework as outlined in King III. The Board is committed to ensure that all the policies and procedures adopted by the Company remain the standard for the protection of all our Stakeholders. The composition of the Board and its operations remained intact during the financial year. It is, however, with great regret to report that the Board parted ways with Group Chief Executive Officer and the Group Chief Financial Officer during the year. The shareholder
has filled all the vacancies of the non-executive independent Board members.
Advancing transformation
PetroSA remains committed to sustainable transformation in the oil and gas industry within its scope of operations. In this regard, we doubled our efforts in ensuring that we achieve all our targets during the financial year. We achieved 84.7% on preferential procurement against a target of 60% during the financial year. We are also happy to announce that our Enterprise Supplier Development programme provided support to about 14 black-owned beneficiaries situated in the Western Cape, Eastern Cape, KwaZulu-Natal and Gauteng, during the financial year.
Forging ahead
Going forward, we do not expect our operating environment to improve rapidly especially in the near term and the resolution of our key challenges may take longer than expected. The implementation of our strategic interventions and our turnaround plans will therefore need to be expedited.
This calls for commitment and increased stakeholder support especially from our employees, the labour unions and Shareholders. Our focus in the next financial year will be to ensure the successful implementation of the recommendations of the Apollo Project alongside that of our turnaround plan and various ISP initiatives. We look forward to the ramp up of production from our Ghana asset which should boost our income during the next financial year.
Gratitude
On behalf of the Board, I would like to express my sincere gratitude to all our clients, our Shareholders, the management team and PetroSA’s employees for the support and hard work in building of PetroSA’s business during the 2015/2016 financial year. Your continued commitment and fortitude during difficult times will see us prosper in the future.
Bhekabantu Wilfred Ngubane Interim Chairman
20 | PetroSA Integrated Annual Report 2016
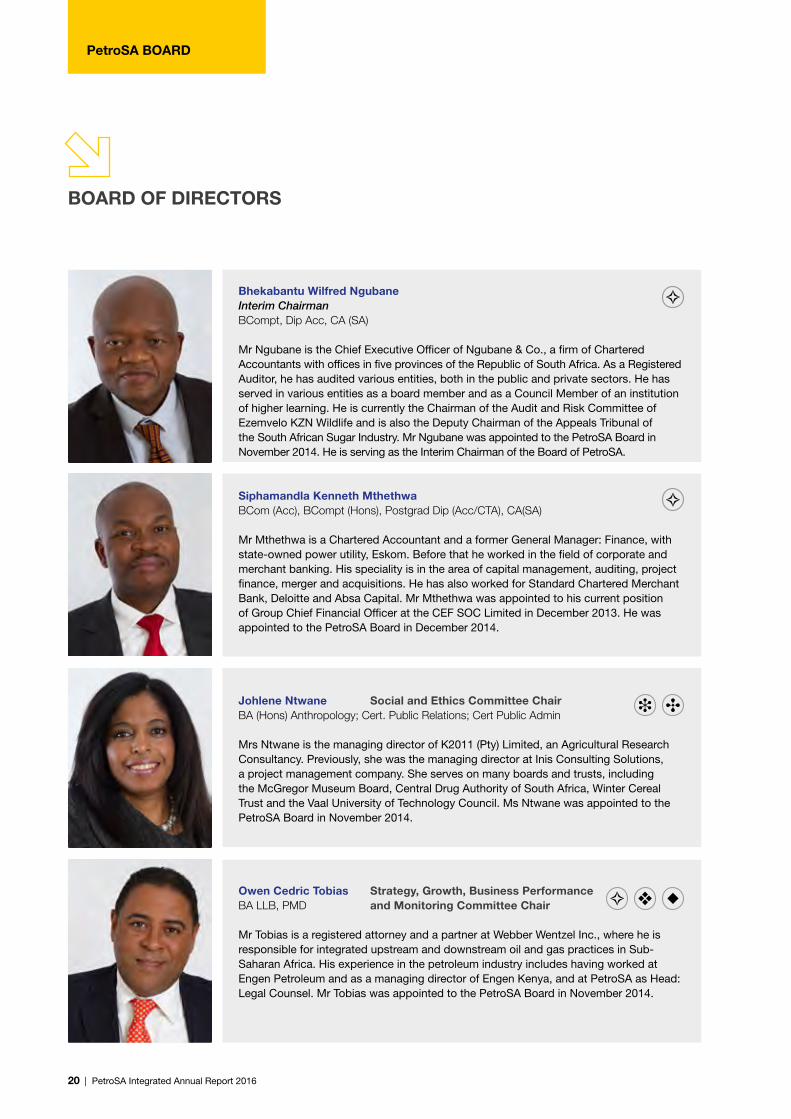
Bhekabantu Wilfred Ngubane Interim ChairmanBCompt, Dip Acc, CA (SA)
Mr Ngubane is the Chief Executive Officer of Ngubane & Co., a firm of Chartered Accountants with offices in five provinces of the Republic of South Africa. As a Registered Auditor, he has audited various entities, both in the public and private sectors. He has served in various entities as a board member and as a Council Member of an institution of higher learning. He is currently the Chairman of the Audit and Risk Committee of Ezemvelo KZN Wildlife and is also the Deputy Chairman of the Appeals Tribunal of the South African Sugar Industry. Mr Ngubane was appointed to the PetroSA Board in November 2014. He is serving as the Interim Chairman of the Board of PetroSA.
Siphamandla Kenneth MthethwaBCom (Acc), BCompt (Hons), Postgrad Dip (Acc/CTA), CA(SA)
Mr Mthethwa is a Chartered Accountant and a former General Manager: Finance, with state-owned power utility, Eskom. Before that he worked in the field of corporate and merchant banking. His speciality is in the area of capital management, auditing, project finance, merger and acquisitions. He has also worked for Standard Chartered Merchant Bank, Deloitte and Absa Capital. Mr Mthethwa was appointed to his current position of Group Chief Financial Officer at the CEF SOC Limited in December 2013. He was appointed to the PetroSA Board in December 2014.
Johlene Ntwane Social and Ethics Committee ChairBA (Hons) Anthropology; Cert. Public Relations; Cert Public Admin Mrs Ntwane is the managing director of K2011 (Pty) Limited, an Agricultural Research Consultancy. Previously, she was the managing director at Inis Consulting Solutions, a project management company. She serves on many boards and trusts, including the McGregor Museum Board, Central Drug Authority of South Africa, Winter Cereal Trust and the Vaal University of Technology Council. Ms Ntwane was appointed to the PetroSA Board in November 2014.
Owen Cedric Tobias Strategy, Growth, Business Performance BA LLB, PMD and Monitoring Committee Chair Mr Tobias is a registered attorney and a partner at Webber Wentzel Inc., where he is responsible for integrated upstream and downstream oil and gas practices in Sub-Saharan Africa. His experience in the petroleum industry includes having worked at Engen Petroleum and as a managing director of Engen Kenya, and at PetroSA as Head: Legal Counsel. Mr Tobias was appointed to the PetroSA Board in November 2014.
PetroSA BOARD
BOARD OF DIRECTORS

PetroSA Integrated Annual Report 2016 | 21
Muzi W MkhizeBSc (Chem Eng), BCom, MBL Mr Mkhize is Chief Director: Hydrocarbons at the Department of Energy. He has more than 10 years’ working experience in the energy industry, which he accumulated after his engineering studies. He joined the Department of Minerals and Energy in 2005. Mr Mkhize previously served on the CEF, iGas and SFF Boards. He joined the PetroSA Board in January 2015.
Frans BaleniBA Dev. Studies Cert. HR, Cert. Politics and Trade Unionism, Cert. BOT Mr Baleni is currently on the Board of Directors of the Development Bank of Southern Africa (Deputy Chairperson), ADC Cable (Chairman), a Council Member and past Deputy Chairman of the University of Johannesburg. Mr Baleni has a BA degree in Development Studies from the University of Johannesburg, and studied Political Science and Trade Unionism at Whitehall College (England), and Build on Talent (BOT), (Switzerland). He was appointed to the PetroSA Board in September 2015.
William Solomon Steenkamp Human Capital Committee ChairCertificate of Management MANCOSA Mr Steenkamp is Managing Owner of Eagle Services, which is a fibre optic infrastructure company, as well as a socio-economic research consulting business. He is one of the founders and a shareholder of Nexus Connexion which is the BEE company partner of NEOTEL. He serves on the Perishable Products Export Control Board and chairs its ICT Committee. He also serves on the Board of PRASA. A former Northern Cape Provincial Secretary and National Executive Committee member of the African National Congress, he has also served as South Africa’s Consul General to Milan, Italy. He was appointed to the PetroSA Board in November 2014.
Banothile CE MakhubelaBSc. (Chem & Mathematics), BSc. (Hons.) Chem., MSc. (Chem.), PhD, PDM Dr Makhubela holds a PhD in Chemistry from the University of Cape Town, and is currently a Senior Lecturer and Researcher in the Department of Chemistry at the University of Johannesburg. She is an academic and scientist researching in renewable energy and green chemicals processing/generation as well as petrochemical industry catalytic technologies. Dr Makhubela is a current member of the Ministerial Advisory Council on Energy, a young affiliate member of The World Academy of Sciences (TWAS), amongst other roles she has occupied. She was appointed to the PetroSA Board in September 2015.
Board Audit Committee
Risk Management and Compliance Committee
Human Capital Committee
Strategy, Growth, Business Performance and Monitoring Committee
Social and Ethics Committee

22 | PetroSA Integrated Annual Report 2016
PetroSA BOARD
BOARD OF DIRECTORS/CONTINUED
Thamsanqa Hlongwa Board Audit Committee and Risk BCom Honors Accounting, Management and Compliance ChairCA (SA)
Mr Hlongwa is currently the Chief Financial Officer at Umgeni Water. He is a Chartered Accountant and has a BCom Honours in Accounting (CTA) from the University of Natal. He has worked for Deloitte in South Africa and New York. Other roles he has held include Chief Financial Officer at the Department of Cooperative Governance and Traditional Affairs in the KwaZulu Natal Provincial Government. He also previously worked as a Senior Manager at Siyaya Management Services. Mr Hlongwa was appointed to the PetroSA Board in September 2015.
Tebogo Isaac RakgoaleBJuris, LLB
Adv. Rakgoale is currently the Executive Manager of Corporate Services at the Limpopo Economic Development Corporation (LEDA). Other positions he has held include that of Special advisor to the Premier of the Limpopo Provincial Government. He has also held a similar position in the Northern Cape Provincial Government. Other positions he has occupied, include a period as Chief State Law Advisor, Premier’s Office, Northern Cape Provincial Government, among others. He is an Advocate of the High Court of South Africa. Adv. Rakgoale was appointed to the PetroSA Board in January 2016.
Xoliswa Mpongoshe-Makasi Company SecretaryB.Proc, Dip Juris
Ms Xoliswa Mpongoshe-Makasi’s career spans over 20 years, most of which have been as an in-house General Counsel, Compliance Officer and Company Secretary (all combined) for various types of entities, including public, private, voluntary associations, listed and unlisted companies, such as Telkom, Mittal Steel SA Limited, Gensec Bank and Sanlam Group. She holds a B.Proc degree and a Dip Juris qualification from the University of the Western Cape. Ms Mpongoshe-Makasi joined PetroSA as Company Secretary on 1 December 2015.
Board Audit Committee
Risk Management and Compliance Committee
Human Capital Committee
Strategy, Growth, Business Performance and Monitoring Committee
Social and Ethics Committee

PetroSA Integrated Annual Report 2016 | 23
The Board is committed to ensure that all the policies and procedures adopted by the Company remain the standard for the protection of all our Stakeholders.

24 | PetroSA Integrated Annual Report 2016
PetroSA BOARD
CORPORATE GOVERNANCE STATEMENT
PetroSA’s framework for Corporate Governance
This statement outlines the main corporate governance policies and practices in place throughout the financial year ended 31 March 2016, which comply with the principles espoused in the King Report on Corporate Governance for South Africa 2009 (King III), unless otherwise stated.
The high-level structure chart outlined below provides an overview of PetroSA’s Corporate Governance structure:
The Board
Board compositionPetroSA has a unitary Board structure. The Board comprises 10 non-executive directors, eight of whom are independent, and two of whom are shareholder nominees viz. CEF and DoE (ultimate shareholder). The Board acts as the focal point and custodian of Corporate Governance and directs, governs and is in effective control of the affairs of the Group.
All members are appointed by the shareholder. Non-executive directors are appointed on a three-year cycle
and re-appointment is not automatic. Executive director’s appointment is linked to their employment contract as executives in the organisation. The Memorandum of Incorporation of the Company provides that the Board of the Company comprise a minimum of eight directors, one of whom should be a representative of the shareholder (CEF) and at least one Executive Director. With the termination of the employment contracts of the Group Chief Executive Officer and Group Chief Financial Officer respectively, the Executive Director positions on the Board are vacant. (Although this is not consistent with the provisions of the MOI, however such position does not render the decision of the Board invalid in terms of the Company’s Act of 2008). Although the Board has appointed an Acting Group Chief Executive Officer and an Acting Group Chief Financial Officer to manage the day to day operations of the business, the officers acting in these positions have not been appointed as directors. The Board has initiated the necessary process for recruiting a Group Chief Executive Officer and a Group Chief Financial Officer respectively.
The Board composition is appropriate and the directors possess reasonable skills and experience necessary for the proper supervision and leadership of the Group. As a team, the Board brings together a broad range of qualifications, with experience and expertise in finance, accounting, risk management, sustainability, chemistry, law, government relations and political affairs.
Details regarding the Group’s directors, including their relevant skills, experience and expertise can be found on pages [XX] to [XX] of the Integrated Annual Report.
PetroSA Board
Delegated Authority
CEO Company Secretary
Audit Committee
DoE
CEF
Human Capital
Committee
Strategy & Growth
Committee
Risk Management & Compliance
Committee
Internal and
External Audit
Group Risk and
Compliance
Ass
uran
ce a
nd o
vers
ight
thr
oug
h re
po
rtin
g t
o t
he B
oar
d
Social and Ethics
Committee
Executive Committee

PetroSA Integrated Annual Report 2016 | 25
TABLE 2 Board matrix
Skills and experienceNumber of directors
Executive leadershipSenior executive leadership experience 8
Board experienceExperience as a Board member or member of a governance body 7
Financial acumenSenior executive or equivalent experience in financial accounting and reporting, corporate finance, risk and internal controls
5
GovernanceSenior executive experience in a major organisation that is subject to regulated controls 6
Strategy and riskExperience in developing, implementing and challenging the long term strategy of an organisation 6
Oil and gasSenior executive experience in a large domestic or international oil and gas businesses in a competitive market 2
Health, safety, environment and sustainabilitySenior executive experience in health, safety, environment, social responsibility or sustainability initiatives 3
Capital managementSenior executive experience in capital management strategies, including capital partnerships, debt financing and capital raising
3
Human resourcesSenior executive experience in human resource management of a diverse workforce 3
ConsumerSenior executive experience in consumer businesses, retail, sales or marketing 6
Government relationsSenior executive or political experience in public and regulatory policy 8
Board movements during 2015/2016
TABLE 3 Composition of and movements on the Board during the course of the 2015/2016 financial year
Name Category Appointment date Resignation date
Ms GN Jiyane Interim Chairman (Resigned) 14 November 2014 27 July 2015
Mr LED Hlatshwayo Independent Non-Executive Director (Resigned) 01 April 2013 19 June 2015
Mr S Mokoena Independent Non-Executive Director (Term expired) 01 January 2013 31 December 2015
Mr W Ngubane Independent Non-Executive DirectorAppointed as Interim Chairman
14 November 2014
Mr W Steenkamp Independent Non-Executive Director and Chairperson of Human Capital Committee
14 November 2014
Mr O Tobias Independent Non-Executive Director and Chairperson of Strategy, Growth, Business Performance and Monitoring Committee
14 November 2014
Ms J C Ntwane Independent Non-Executive Director and Chairperson of Social & Ethics Committee
14 November 2014
Mr TB Hlongwa Independent Non-Executive Director and Chairperson of Board Audit Committee and the Risk and Compliance Committee
14 September 2015
Dr BCE Makhubela Independent Non-Executive Director 14 September 2015
Mr MF Baleni Independent Non-Executive Director 14 September 2015
Adv TI Rakgoale Independent Non-Executive Director 15 January 2016
Mr S Mthethwa Non-Executive Director (Shareholder Rep.) 01 December 2014
Mr MW Mkhize Non-Executive Director (Shareholder Rep.) 30 January 2015
Ms K Kekana Company Secretary 01 December 2013 31 May 2015
Ms M Sebothoma Acting Company Secretary 01 June 2015 30 November 2015
Ms X Mpongoshe Company Secretary 01 December 2015

26 | PetroSA Integrated Annual Report 2016
PetroSA BOARD
CORPORATE GOVERNANCE STATEMENT/CONTINUED
Board charterThe Board has a Charter which clearly establishes its role and responsibilities and also sets out the decisions which could have a material impact on the business and which the Board has reserved for itself. The primary role of the Board is to provide strategic guidance for the Group as well as effective oversight of Management.
Board meetings are held at least once a quarter, as far as possible, with briefing material required to be provided to each director at least seven days prior to each meeting. The Company Secretary is responsible for coordinating the timely completion and dispatch of Board meeting agendas and briefing material. Senior executives are invited to make presentations at Board meetings, thereby providing the opportunity for directors to engage in discussions and request additional information on relevant topics. The Board held 22 meeting during the period under review, 17 more than scheduled. This was mainly driven by the Board’s focus on resolving the disciplinary processes relating to the then Group Chief Executive Officer, Group Chief Financial Officer and VP Upstream and the formulation of the Turnaround Plan to sustain the Company.
Board focusDuring the course of the financial year, the Board and its Committees focused their attention on the following key issues, amongst others:
• The development of a plan aimed at turning the business around for long-term sustainability;
• Monitoring of the sustainability and integration plan on an ongoing basis;
• Resolution of disciplinary processes involving the Group CEO, Group CFO and VP Upstream;
• Strengthening of the governance environment (Internal Controls, ERM, Policies etc);
• Engaging with the Company’s shareholder on a range of issues, with a view to finding common ground on the best ways of turning the business around;
• Monitoring the implementation of the Voluntary Severance Package programme;
• Engaging with Stakeholders e.g. unions, communities and the media;
• Balanced pursuit of its triple mandate – development, transformation and profitability;
The Board recognises the enormity of the work ahead and will continue to focus on finding solutions which will culminate in the long-term sustainability of PetroSA.
Independent adviceSubject to prior consultation with the Chairman and Company Secretary, directors may seek independent professional advice (including legal advice) from a suitably qualified advisor at the Company’s expense.
Board independenceThe Board is considered to be independent given that the majority of its members are independent-non executive directors. The Chairman is an independent director and the roles of Chairman and CEO are not exercised by the same individual. All directors, whether independent or not, are required to bring independent judgement to bear during Board deliberations and on Board decisions. The Board considers that, fundamentally, the independence of directors is based on their capacity to put the best interests of the Company ahead of all other interests, so that directors are capable of exercising objective independent judgement. The capacity for individual directors to add value to the Board is very important.
The Board has regard to the potential for conflicts of interest, whether actual or perceived, in the ongoing assessment
of director independence. In this respect, the Board has regard to the definition of independence contained in King III. Additional policies, such as the requirement for directors to declare their interests on an ongoing basis, as well as directors being required to recuse themselves during discussions or decision-making on matters in which they have or could be seen to potentially have a conflict of interest, provide further separation and safeguards to independence.
Director induction, training and developmentThe Company has in place induction procedures which allow new directors to participate fully and actively in decision-making at the earliest opportunity. Directors are able to access continuing education to update and enhance their skills and knowledge and have the right of access to all relevant Company information and senior executives, including the Company Secretary, to provide them with information regarding key developments in the Company and the industry.
Board committees
To assist in the performance of its role, the Board has established a number of Committees which have specific roles and responsibilities in key areas. During the 2015/2016 financial year, the Board had five committees: the Board Audit Committee, the Risk and Compliance Committee, the Human Capital Committee, the Strategy, Growth, Business Performance and Monitoring Committee as well as the Social and Ethics Committee. Each Committee has documented Terms of Reference approved by the Board, copies of which can be obtained from the Company Secretary on request.
The composition of Committees is designed such that Board members are placed where their skills,

PetroSA Integrated Annual Report 2016 | 27
experience, expertise can be brought to bear to best serve the interests of the Company. Diversity is also an important consideration in the composition of Board Committees.
Board Audit Committee (BAC)The primary objective of the Committee is to assist the Board in fulfilling its oversight responsibilities in terms of the Companies Act No 71 of 2008, the Public Finance Management Act No 1 of 1999, to assist the Board in discharging its responsibilities with regard to matters relating to Audit, Finance, Combined Assurance, Internal Audit, Appointment of External Audit and Reporting e.g. Financial Misconduct, Integrated Reports and Annual General Meeting.
The Committee consists of three independent non-executive directors, elected by the shareholder at each annual general meeting (AGM), who are suitably skilled and collectively have sufficient qualifications and experience to fulfil their duties. The Board recommends the appointment of the Chairman of the Committee. The Committee has formal terms of reference approved annually by the Board. The effectiveness of the Committee is assessed annually. The Group Chief Executive Officer (GCEO), Group Chief Financial Officer (GCFO), Chief Audit Executive, Chief Risk and Compliance Officer, External Auditors and other assurance providers are permanent invitees to the committee meetings. Other executive managers are invited to the committee meetings when appropriate.
Board Human Capital Committee (HCC)This committee is chaired by a non-executive director and comprises four non-executive directors appointed by the Board. The Group CEO and the Vice President Human Capital attend the committee meetings by invitation.This committee reviews and recommends annual remuneration increases, terms and conditions of employment, the payment of incentives and bonuses, general fringe benefits, human capital related policies and the appointment of senior Staff at an executive level.
TABLE 4 Committee composition and key roles and responsibilities as at publication date
COMMITTEE MEMBERS COMPOSITION RESPONSIBILITIES
BOARD AUDIT COMMITTEE
T Hlongwa (Chairman) W Steenkamp T Rakgoale
Consists of 3 independent non-executive directors
Chairman of the Board is not a member
The Chairman of the Committee is a Chartered Accountant and all members are financially literate
Review and assessment of the integrity of financial reporting.
Monitoring the performance of internal and external audit, including oversight of qualifications and independence.
Approval of fees of the external auditor.
Review of financial information required by regulators.
RISK MANAGEMENT AND COMPLIANCE COMMITTEE
T Hlongwa (Chairman)Dr Makhubela T Rakgoale O Tobias
Consists of 4 independent non-executive directors
Review of risk management policies, processes and profile, including the adequacy of insurance cover.
Review of the compliance framework.
Monitoring of performance in relation to the Group’s Ethics programme.
HUMAN CAPITAL COMMITTEE
W Steenkamp (Chairman) J Ntwane O Tobias F Baleni
Consists of 4 non-executive directors, 3 of whom are independent
Remuneration of employees.
Review of performance assessment processes.
Agree policies for the recruitment, retention and termination of employees.
Agree policies for employee incentive schemes.
Monitor performance in regard to diversity objectives.
STRATEGY, GROWTH, BUSINESS PERFORMANCE AND MONITORING COMMITTEE
O Tobias (Chairman) M Mkhize* S MthethwaW Ngubane
Consists of 4 non-executive directors
Two directors are shareholder ‘representatives’
The Chairman of the Board is a member
Monitor performance on Corporate Plan.
Review progress with sustainability initiatives.
Monitor implementation of terms of Shareholder Compact.
SOCIAL AND ETHICS COMMITTEE
M Ntwane (Chairman) Dr Makhubela F Baleni M Mkhize
Consists of 4 non-executive directors
Monitor compliance with the requirements of the Companies Act in relation to Social, Ethical and Environmental issues, with particular reference to BEE, Employment Equity, Health and Safety.
Report to the Shareholder and other Stakeholders on performance.
* DoE Representative

28 | PetroSA Integrated Annual Report 2016
PetroSA BOARD
Growth, Strategy and Business Performance and Monitoring CommitteeThe primary objective of the Committee is to assist the Board in:
• the formulation of the corporate vision, mission statement and strategy;
• the formulation of the Corporate Plan in line with the Group’s mandate and overarching strategy;
• prioritising and developing new business ideas, innovations and initiatives which impact the Group at a strategic level;
• reviewing project and programme portfolio regularly and ensuring alignment to strategic objectives;
• ensuring that the following Company processes are aligned with the Group’s overall mandate and strategic direction:
• Strategy management;• Business management;• Capital investment; and• Joint venture formations;
• reviewing Projects, Programmes and, taking into account the Capital Allocation Model, funding requirements and due diligence findings; and
• tracking and monitoring key performance indicators of the strategic projects and programmes:
• receiving and reviewing quarterly reports and recommending to the Board submission of these to the Shareholder in compliance with the PFMA and the Shareholder’s Compact;
• monitoring the implementation of the Shareholder’s Compact.
This Committee is chaired by a non-executive director and comprises four non-executive directors appointed by the Board. The Group CEO, Group CFO and relevant EXCO members attend committee meetings by invitation.
Social and Ethics CommitteeThe Companies Act No 71 of 2008 requires that companies falling within specific categories appoint a Social and Ethics Committee to report on the non-financial aspects of the Company’s performance, in particular those relating to social and environmental governance. In terms of section 72(4) of the Companies Act, 2008 and regulation 43(2), every state owned company (SOC) is required to establish this Committee.
The purpose of the Committee is to monitor the Company’s activities, having regard to any legislation, other legal requirements or prevailing codes of best practice, with regard to employment equity, BEE, Health and Safety, good corporate citizenship, consumer relationship, labour and employment and environmental issues.
The Committee comprises of four non-executive directors and is chaired by an independent non-executive director. The Group CEO, Group CFO and relevant EXCO members attend committee meetings by invitation. Risk Management and Compliance Committee (RMCC)The Board has delegated responsibility for risk management, compliance with laws and regulations, and safety, to this committee to ensure the quality, integrity and reliability of the Group’s risk management process. The Committee’s roles and responsibilities as per Board delegation include:
• To review and monitor the Enterprise Risk Management Policy at least annually, on behalf of the Board of Directors. Any proposed changes should be approved by the Board;
• To review and approve the PetroSA risk appetite and tolerance levels and statement;
• To fulfil an oversight role on the implementation of the fraud and corruption policy;
• To review the status of litigations and related exposures within the Company;
• To ensure that Information Technology risks are adequately addressed;
• To review, formulate and revise with Management the organisation’s Health Safety and Environment (HSE), Quality and Security Policies; and
• To oversee the PetroSA Group’s compliance with applicable laws, regulations and non-binding rules, codes and standards.
This committee is chaired by a non-executive director and comprises three non-executive directors appointed by the Board. The Group CEO, Group CFO and relevant Executives attend the committee meetings by invitation.
Board performance evaluationThe Board conducts regular self-assessments of the performance of the Board, its committees and individual directors. In addition, externally facilitated performance evaluations are undertaken on a periodic basis, with the most recent externally facilitated performance evaluation having been conducted during the 2014 financial year. The results of the previous evaluation are no longer relevant though, as PetroSA has a new Board. Another evaluation is therefore planned during the 2016/2017 financial year.
Group Chief Executive Officer and Executive Committee (EXCO)The Board has delegated to the Group Chief Executive Officer (Group CEO) authority over the day to day manage-ment of the Group. Specific areas of responsibility which have been delegated to the Group CEO are set out in the Company’s Levels of Authority Framework. The Group CEO
CORPORATE GOVERNANCE STATEMENT/CONTINUED

PetroSA Integrated Annual Report 2016 | 29
Board and Committee Chairpersons
Mr W Ngubane Interim Chairman Appointed as Chairman on 04 August 2015
Mr W Steenkamp Chairperson of Human Capital Committee Appointed on 14 November 2014
Mr O Tobias Chairperson of Strategy & Growth Appointed on 14 November 2014
Ms C Ntwane Chairperson of Social & Ethics Committee Appointed on 25 January 2015
Mr TB Hlongwa Chairperson of Board Audit Committee Appointed on 14 September 2015
Other Non-Executive Directors
Dr BCE Makhubela Independent Non-Executive Director Appointed on 14 September 2015
Mr MF Baleni Independent Non-Executive Director Appointed on 14 September 2015
Adv TI Rakgoale Independent Non-Executive Director Appointed on 15 January 2016
Mr S Mthethwa Non-Executive Director Appointed on 01 December 2014
Mr MW Mkhize Non-Executive Director Appointed on 30 January 2015
TABLE 5 Board and Committee attendance 01 April 2015—31 March 2016
Name Category BoardBoard Audit
Human Capital
Strategy & Growth
Risk Management & Compliance
Social & Ethics
Board Ad Hoc Committee
(Turnaround)
Ad Hoc Committee (SNG Impl.) TOTAL
22 9 7 6 4 4 5 3 60
Ms GN Jiyane* Non-executive 10/10 n/a n/a 2/2 1/1 n/a n/a n/a 13
Mr W Ngubane
Non-executive 19/22 7/7 n/a 1 2/2 n/a n/a n/a 29
Mr W Steenkamp
Non-executive 20/22 7/8 7/7 n/a n/a 1/1 4/5 n/a 39
Mr O Tobias Non-executive 16/22 n/a 5/7 5/6 3/4 n/a n/a n/a 29
Ms J Ntwane Non-executive 21/22 n/a 7/7 n/a n/a 4/4 3/5 n/a 35
Mr S Mthethwa
Non-executive 17/22 n/a n/a 5/6 n/a n/a 5/5 n/a 27
Mr MW Mkhize**
Non-executive 19/22 n/a 2/7 2/6 n/a 3*/4 n/a 2/3 28
Mr S Mokoena # #
Non-executive 20/22 7/8 n/a 5/6 1/1 n/a 5/5 3/3 41
Mr LED Hlatshwayo #
Non-executive 4/4 n/a n/a n/a 1/1 1/1 n/a n/a 5
Dr BCE Makhubela
Non-executive 7/10 n/a n/a n/a 2/2 2/2 n/a 3/3 14
Mr MF Baleni Non-executive 9/10 n/a 3/3 n/a n/a 2/2 n/a 3/3 17
Mr TB Hlongwa*
Non-executive 5/10 2/2 n/a n/a 1/2 n/a n/a n/a 8
Adv TI Rakgoale
Non-executive 1/1 1/1 n/a n/a n/a n/a n/a n/a 2
NOTES* Ms GN Jiyane (Interim Chairman) resigned on 27 July 2015# Mr LED Hlatshwayo resigned on 19 June 2015## Mr S Mokoena’s term expired on 31 December 2015
**Mr Mkhize’s alternate Mr Nandkishore attended the following meetings:Board: 27 Aug 2015, 10 Nov 2015 and 12 December 2015Social and Ethics: 13 April 2015, 22 October 2015, 3 Feb 2016
is authorised to delegate the powers conferred on him/her as he/she deems appropriate. In discharging his/her responsibilities, the Group Chief Executive Officer is assisted by an Executive Committee.
Company Secretary
The Company Secretary is accountable directly to the Board, through the Chairman, on all matters to do with the
proper functioning of the Board. Each director has the ability to communicate with the Company Secretary. Decisions to appoint or remove the Company Secretary are made or approved by the Board.
All the directors have unrestricted access to the advice and services of the Company Secretary, whose office is accountable to the Board for ensuring that procedures are complied
with and that sound corporate governance and ethical principles are adhered to.
Ethical leadership
The Board has adopted a number of policies which promote ethical and responsible decision making.
The Company has a Code of Ethics which applies to all directors,

30 | PetroSA Integrated Annual Report 2016
PetroSA BOARD
employees and contractors working for the Group and formalises the Group’s belief that business objectives are best achieved through acting at all times fairly, honestly and with integrity. The Code of Ethics clearly articulates what the Company regards as acceptable business practices for its directors, senior executives and employees. In addition to the Code of Ethics the Company also has the following policies:
• The Employment Equity Policy makes team members accountable for creating an environment in which all people are treated fairly and equitably and with dignity, courtesy and respect.
• The Group has a Gift Register Procedure and Declarations of Related Party Interests Policy which clearly defines and communicates the parameters for accepting gifts. The policy outlines prohibited gifts and the approval process for accepting gifts.
• The Group has a Whistleblower Hotline for Ethics/Fraud reporting which can be used by employees to report any conduct which may be unethical or improper. All reports to the Ethics/Fraud Hotline, which is provided by an external independent provider, are able to be made confidentially and anonymously and are thoroughly investigated.
• The Group has also established a Prevention of Fraud and Corruption Policy to ensure that employees who make a report are protected from adverse behaviour as a result of making a report.
SOCIAL AND ETHICS COMMITTEE REPORT
The Social and Ethics Committee (SEC) assists the Board to monitor PetroSA’s levels of corporate citizenship, with the aim of promoting high standards and ensuring that the business is accounting for its conduct, not only in terms of its financial performance, but also in terms of its environmental, social and governance impact and performance.
The Committee met three times during the period under review and considered matters within its ambit as codified in the approved Social and Ethics Committee Terms of Reference. The SEC is constituted as a statutory committee of the Board under section 72(4) of the Companies Act (read together with Regulation 43 of the Companies Regulations). The SEC additionally fulfils the role of a Group committee and therefore no other PetroSA Holdings subsidiaries have established social and ethics committees.
A Social and Ethics Member Hand-book, together with a three-year work plan was developed and approved to serve as a basis for the work to be undertaken by this committee. The purpose of this handbook is to clarify some of the issues relating to the role, responsibilities and operations of PetroSA’s Social & Ethics Committee. It is split into four main sections:
• Part one provides a context for the Social and Ethics Committee within the PetroSA Group. It focuses on the specific role of the committee within the wider governance structure and the areas of emphasis it should cover.
• Part two gives a summary of the responsibilities of the committee with reference to the existing Terms of Reference.
• Part three details the criteria for
monitoring and reporting. As the statutory responsibilities of the committee revolve around these activities, it is important to have clarity over the various laws, regulations and policies it will monitor and on which it will report.
• Part four seeks to assist members by providing a clear framework, or work plan, designed to ensure that the committee covers all its responsibilities over a planned timeframe.
Whilst the South African context reflects a developmental stage in so far as the work of such Committees are concerned, PetroSA has nevertheless provided a clear growth path to ensure that the SEC is effective and efficient. The work plan depicted below takes this into account and spans a period of three years and aims to achieve full coverage of all reporting elements. PetroSA is now in the final year of the three year work plan. The SEC has completed the tasks set out in the three year work plan and will in the coming financial year focus on embedding the principles, reporting and continued effectiveness of the Committee. Social and Ethics Committee work planThe SEC’s approved Social and Ethics Work plan required that performance against the 12 principles set out in OECD, as wel as its related recommendations, be monitored and reported to the SEC. Group Compliance was tasked with reporting to the SEC on progress of implementing OECD principles and recommendations by Management.
The SEC received and considered the following reports by Management during the period under review:
• the Group’s compliance with the principles of the UN Global Compact Principles and the OECD Guidelines;
CORPORATE GOVERNANCE STATEMENT/CONTINUED

PetroSA Integrated Annual Report 2016 | 31
• skills and other development programmes aimed at the educational development of employees;
• corporate social investment programmes, including details of charitable giving;
• employment equity plans for the Group;
• labour practices and policies; • compliance with the Group’s
Code of Ethics management and performance;
• performance in respect of Black Economic Empowerment as measured against the Department of Trade and Industry’s generic Broad Based Black Economic Empowerment Scorecard;
• confirmation that the Group adheres to South African legislation aligned to and in compliance with the International Labour Protocol on decent work and working conditions;
• fraud and anti-corruption trends, legislation and information; and quality, environmental, health and safety performance.
ConclusionThe SEC believes the Group has continued to maintain an acceptable balance between its financial performance on the one hand and its social, economic, governance, employment and environmental responsibilities on the other.
All non-compliance with legislation and regulations relevant to the areas within the SEC’s mandate have been brought to its attention through the compliance reporting mechanisms and protocol of PetroSA.
The SEC therefore has discharged its mandate in accordance with the Companies Act, 2008 and operated throughout the year in accordance with the approved Terms of Reference as approved by the PetroSA Board.
J Ntwane (Chairman)Social and Ethics Committee
TABLE 6 Year-end progress status
OECD Principle Status
Visible support from senior management in the prevention of corruption and bribery
Clear policy on corruption
Existence of financial procedures to prevent/detect foreign bribery
Communication and training on Ethics and Compliance Programmes
Internal compliance with the Anti Bribery and Corruption (ABC) policy and procedure
Oversight of Ethics and Compliance Programmes Execution of Ethics and Compliance Programmes
Measures to support the observance of Ethics and Compliance Programmes
Existence of disciplinary procedures to address corruption
Execution of Ethics and Compliance Programmes
Programme to prevent and detect foreign bribery
Existence and guidance for directors, employees and business partners on complying with the Group’s ethics compliance programme periodic review
Periodic review of Ethics and Compliance Programmes
In place In progress Overdue
PHASE
% OPERATIONAL EFFECTIVENESS
KEY ACTIONS
CURRENT POSITION
TIMELINE
Foundation
10% 20% 30% 40% 50% 60% 70% 80% 90% 100%
Appointment Operational phase
YEAR 1 YEAR 2 YEAR 3+
Confirmation
Appointments made and responsibilities confirmed
S&E Committee commences and standardised agenda developed and tested
Operations of committee reviewed and appraised
Decision made to appoint S&E Com- mittee
FIGURE 1 Social and Ethics Committee work plan
The Group has continued to maintain an acceptable balance between its financial performance and its social, economic, governance, employment and environmental responsibilities.

32 | PetroSA Integrated Annual Report 2016
PetroSA BOARD
For any business to run efficiently there needs to be a clear commitment to sound corporate governance. In our case, this requires that processes must be effective and make it easier for clients to do business with us, and that Board members are independent and skilled enough to make the right decisions to ensure a sustainable and profitable business. Sound corporate governance underpins PetroSA’s ability to function with integrity and accountability; to systematically and independently review risks and opportunities; and to make decisions that will assist the Company to build sustainable value.
We endeavour at all times to apply the principles of King III in such a way that these requirements are met. King III is applied in all the group operations. In this regard, the King III assessment conducted in the
2013/2014 financial year continues to be the focal point for the Board to ensure that PetroSA reaches the desired levels of compliance to the King III recommendations and principles.
There has been positive movement from non-compliance to full compliance on some of the King III principles which were assessed as non-compliant in the 2013/2014 financial year. A full report on the Board performance is available on the corporate website: www.petrosa.co.za.
A concerted effort by Management and the Board to ensure compliance is achieved remains a key item on the Board’s agenda. Some of the matters which were deemed non-compliant require lengthy processes to be engaged in and thus will remain in progress for a period extending beyond just one financial year.
King IV
With the advent of the King IV code issued in the current financial year for Public Comment, a re-assessment of the state of compliance to the new code will be required in the coming financial year to ensure that PetroSA remains aligned with the new King IV Code provisions. The PetroSA Board will again have to express itself on the readiness and the extent to which it wants to comply with King IV.
King IV builds on King III, and its underpinning philosophies remain aligned with King III. The King IV Code is aimed at reinforcing corporate governance as a holistic set of arrangements governing ethical leadership, attitude, mind-set and behaviour.
KING III APPLICATION AND CONFORMANCE
TABLE 7 Feedback on the areas of non-compliance
Governance element King Code Principle reference
Assessment 2013/2014 Current status/response
2Role and function of the Board
2.12 The Board should ensure the integrity of the Company’s integrated report
Non-Compliant PetroSA is on a journey towards full integrated reporting. A fully fledged integrated report assured independently and approved by the Board is expected by 2019/2020 financial year.
3Audit Committees
3.5 The audit committee should ensure that a combined assurance model is applied to provide a coordinated approach to all assurance activities
Non-Compliant PetroSA has an approved combined assurance framework. There is still however a gap in implementation in that the Board is yet to be provided with an Integrated Assurance Plan for consideration and approval. Whilst this remains a key challenge and constraint, PetroSA Board continues to use specialist Board Committees to provide oversight and give comfort to the Board of Directors through the individual Chairman’s reports of various Committees for Board. The Board will need to commit resources to achieve combined assurance. The Board is yet to provide direction regarding the required level of compliance to King III.
9Integrated reporting and disclosure
9.1 The Board should ensure the integrity of the Company’s integrated report
Non-Compliant PetroSA is on a journey towards full integrated reporting. A fully fledged integrated report assured independently and approved by the Board is expected by 2019/2020 financial year.
9.3 Sustainability reporting and disclosure should be independently assured
Non-Compliant PetroSA is on a journey towards full integrated reporting. A fully fledged integrated report assured independently and approved by the Board is expected by 2019/2020 financial year.
PetroSA Integrated Annual Report 2016 | 33
The Company’s remuneration policy has been designed to achieve the following objectives:
• Attract and retain talented people with the optimum mix of skills, competencies, values and behaviours.
• Aggressively drive a distinction between high performers and low performers by offering high potential remuneration/reward for high performance.
• Drive the Company’s performance and the creation of shareholder value.
• Encourage and remunerate team and individual performance.
• Pay people relative to their specific market and their individual contribution.
• Offer people choice in terms of the structuring of their remuneration and benefits to meet individual needs and lifestyle requirements.
• Encourage the development and application of skills and
competencies required to meet current and future organisational objectives.
• Remunerate individuals differentially based on their market value, competence and level of performance.
• Enable high achievers to share in the financial success of the organisation.
• Enable people to have a stake in the long-term future of the organisation.
• Reflect the Company’s approach to its people as being fair, transparent and equitable.
Remuneration at PetroSA is based on a total reward strategy, which aims to achieve the right mix between guaranteed and variable pay as well as a positive work environment with opportunities for learning and growth.
Remuneration will be linked to business goals and objectives via organisational value drivers and balanced scorecard measures.
The following is a summary of the abovementioned remuneration components:
Guaranteed remuneration
Guaranteed remuneration is designed to ensure that individuals are paid equitably internally and externally relative to their worth in the market and their contribution to the success of the Company.
Guaranteed remuneration consists of the following components and represents that portion of remuneration that is payable for achieving targets:
• Basic salary• Retirement funding• Medical aid• Car Allowances• Group life assurance• Disability insurance
Market comparisons are based on total guaranteed remuneration and in order to calculate the market values, the most relevant and appropriate remuneration surveys produced by reputable remuneration consultants are used.
Where it is required from an employee to act in a higher position, the following allowances are paid in addition to the employees Guaranteed Remuneration:
• Employees who occupy positions below that of Departmental Manager – 10% of pensionable remuneration after an acting period of 15 consecutive working days (i.e. acting for 15 days or more), payable from day one.
• Departmental Managers and higher levels – 10% of pensionable remuneration after an acting period of 2 months.
• Employees who are required to act in positions at Executive Level – 20% of pensionable remuneration after an acting period of 15 days to ensure that they are adequately compensated for taking on the additional responsibilities and risks associated with positions at this level. In the case of employees who are required to act in the position of Group CEO, an allowance of up to 30% of pensionable remuneration is be paid.
REMUNERATION PHILOSOPHY
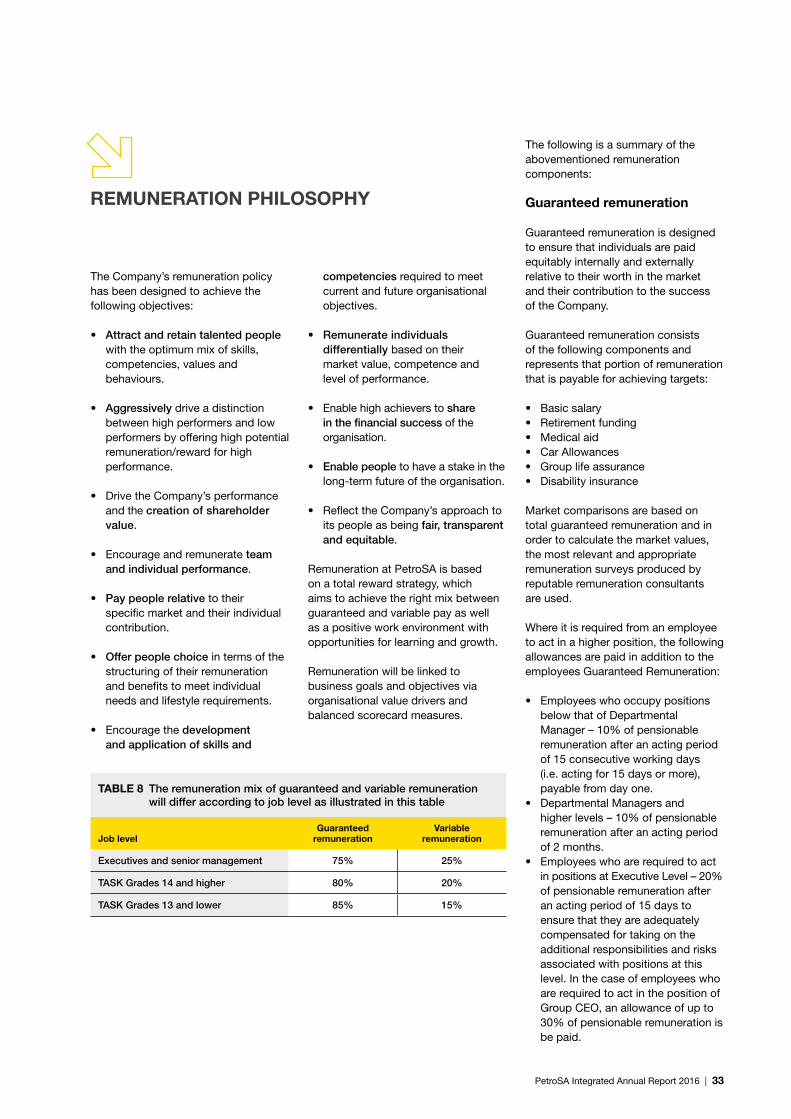
TABLE 8 The remuneration mix of guaranteed and variable remuneration will differ according to job level as illustrated in this table
Job levelGuaranteed
remuneration Variable
remuneration
Executives and senior management 75% 25%
TASK Grades 14 and higher 80% 20%
TASK Grades 13 and lower 85% 15%

34 | PetroSA Integrated Annual Report 2016
PetroSA BOARD
REMUNERATION PHILOSOPHY/CONTINUED
Variable remuneration
In PetroSA’s case, the variable component of its remuneration structure consists of a short term incentive plan (STIP) which was designed with the following objectives in mind:
• To drive organisation, team/departmental and individual performance;
• To encourage and reward participants for achieving and exceeding targeted performance levels annually, i.e. to foster a performance culture; and
• To attract and retain critical/scarce skills.
In terms of the short term incentive plan (STIP) adopted by PetroSA, employees who qualify for participation in the scheme, are categorised into bonus leagues.
The bonus leagues have been categorised into an A, B and C League. The definitions of these leagues and the on-target incentive bonuses applicable to each league are listed in Table 9.
Incentive bonuses payable under the STIP are not guaranteed and payment will be dependent on PetroSA’s performance against its Corporate Balanced Scorecard. Bonuses declared will be paid differentially to teams and individuals based on performance against specified Divisional Balanced Scorecard measures. Individual Performance management results are used to differentiate between individuals.
In terms of the rules of the STIP, bonuses of up to 200% of On-Target Bonuses could be earned if the performance targets that are defined in the Corporate Balanced Scorecard are exceeded by a significant margin.
Annual salary reviews General increases, which are subject to approval by the Board having taken into account the Company’s overall performance, salary market movements and the Company’s parity against the external salary markets, are effected on 1 July of each year.
For the purpose of salary adjustments, employees have been categorised as follows:
Bargaining Unit (TASK Grade 14 and lower)The level of annual increases of all employees that fall within the Bargaining Unit are determined at national level through negotiations at the National Bargaining Council for the Chemical Industry (NBCCI).
Non- Bargaining Unit (TASK Grades 15 and higher, including Executives)The level of the annual increases to be awarded to employees that fall within the Non-Bargaining Unit are determined by the Board. Performance based increases apply to this category of employees and for this purpose a linear scale, with a minimum and maximum that is determined on an annual basis after the quantum of the average increase that may be awarded becomes known, is used to calculate individual increases.
The level of increases to be awarded to this category of employees is based on following factors and indicators:
• Affordability of Increases• Consumer Price Index• Movements in the Salary Market • Comparative Ratios
Board decisions
The following decisions need to be made by the Board on an annual basis with regard to the remuneration policy:
• Quantum of increase to be given to employees that falls outside the bargaining unit i.e. employees on TASK job Grades 15 and higher;
• Approval of discretionary increases in excess of the quantum of increases awarded to bargaining unit employees, i.e. employees on TASK Grades 14 and lower, as agreed and approved from time to time by the National Bargaining Council for Chemical Industries (NBCCI);
• Determination of the level of Executive’s remuneration;
• Approval of the payment or non-payment of annual incentives; and
• The quantum increases awarded to bargaining unit employees are as agreed and approved from time to time by the National Bargaining Council for Chemical Industries (NBCCI).
The Human Capital Committee is the governance structure that monitors adherence to the remuneration strategy and policy.
TABLE 9 Definition of bonus leagues
League Definition On-target bonus
A TASK Grades 13 and Lower 20% of TGR
B TASK Grades 14 and Higher 25% of TGR
C Executives and Senior Management 30% of TGR

PetroSA Integrated Annual Report 2016 | 35
Non-executive remuneration
The remuneration of non-executive directors is determined by of the shareholder and consists of a fixed monthly fee. Non-executive directors are reimbursed for company-related expenses.
Pertinent facts in relation to 2015/2016 executive remuneration and senior management remuneration
• With the exception of one member of the Executive Team (EXCO) who was awarded an increase of 6% to address an internal anomaly, an
increase of 4.5% was awarded to all the other members of the Executive Team (EXCO) and Senior Managers on TASK Grades 20 and higher.
• Due to PetroSA’s poor performance as measured against the targets that were set in its Corporate Scorecard, no bonuses were paid in terms of the Company’s short term incentive plan (STIP)
• In order to retain, motivate and reward the executives and selected senior managers who are able to influence the performance of PetroSA, on a basis which aligns their interests with those of the Company’s shareowners, and
provides them with competitive, performance-based remuneration, the Board has approved the implementation of a Long Term Incentive Plan (LTIP). The LTIP provides for executives and selected senior managers to receive on an annual basis a combination of performance vesting units and performance allocated restricted units which on aggregate ranges between 30% and 60% of TGR. Both awards have a vesting period of 5 years. Due to financial constraints the roll out of the plan was however restricted to two individuals at Executive Level and one at Senior Management Level.
The Company’s remuneration policy has been designed to attract and retain talented people with the optimum mix of skills, competencies, values and behaviours.

36 | PetroSA Integrated Annual Report 2016
PetroSA BOARD
DIRECTORS AND EXECUTIVES REMUNERATION
The remuneration of the directors and the group executives is disclosed as follows:
Year ended 31 March 2016
Executive directors Salary/Fee
Bonuses and performance
paymentsPension
contributionsOther
contributionsActing
allowance Leave paySpecial payout Total
NN Nokwe 2 631 – 324 82 – 165 2 346 5 548
LE Bakoro 1 942 875 322 85 – 241 3 545 7 010
Total 4 573 875 646 167 – 406 5 891 12 558
Non-executive directors Salary/Fee
Bonuses and performance
paymentsPension
contributionsOther
contributions Expenses
Compensation for loss of office Other Total
BW Ngubane 1 047 – – – 240 – – 1 287
S Mokoena 1 136 – – – 96 – – 1 232
S Hlatshwayo 215 – – – 6 – – 21
GN Jiyane 710 – – – 50 – – 760
W Steenkamp 1 068 – – – 247 – – 1 315
O Tobias 861 – – – 246 – – 1 107
J Ntwane 1 043 – – – 261 – – 1 304
S Mthethwa – – – – 27 – – 27
MW Mkhize – – – – 39 – – 39
BCE Makhubela 283 – – – 45 – – 328
MF Baleni 372 – – – 49 – – 421
TB Hlongwa 232 – – – 41 – – 273
TI Rakgoale 65 – – – 2 – – 67
Total 7 032 – – – 1 349 – – 8 381
Executive management Salary/Fee
Bonuses and performance
paymentsPension
contributionsOther
contributionsActing
allowance Leave pay Other Total
JEP Falbe (1) 1 017 – – 46 – – – 1 063
B Zwane (2) 1 360 – 246 181 354 – – 2 141
P Luthuli (1) 413 – 50 28 – 136 – 627
M Modipa 2 091 – 242 146 292 – 25 2 796
K Zono (2) 1 683 – 263 149 196 – – 2 291
A Dippenaar (2) 1 773 – 262 162 291 247 – 2 735
W Fanadzo (2) 922 – 158 59 161 – – 1 300
O Mohapanele (2) 751 – 156 96 163 – – 1 166
N Ramchander (2) 1 005 – 119 82 191 – – 1 397
T Manne (2) 1 073 – 153 59 204 – – 1 489
Total 12 088 – 1 649 1 008 1 852 383 25 17 005
1 – Resigned2 – Acting Vice-Presidents appointed during the year

PetroSA Integrated Annual Report 2016 | 37
The remuneration of the directors and the group executives is disclosed as follows:
Year ended 31 March 2015
Executive directors Salary/Fee
Bonuses and performance
paymentsPension
contributionsOther
contributionsActing
allowance Leave paySpecial payout Total
NN Nokwe 3 694 – 424 151 – – – 4 269
LE Bakoro 2 780 – 464 114 – – – 3 358
Total 6 474 – 888 265 – – – 7 627
Non-executive directors Salary/Fee
Bonuses and performance
paymentsPension
contributionsOther
contributions Expenses
Compensation for loss of office Other Total
S Mncwango – – – – 51 – – 51
ACG Molusi 376 – – – 5 – – 381
FE Letlape 529 – – – 64 – – 593
MM Zwane 467 – – – 20 – – 487
V Sibiya – – – – 37 – – 34
GC Smith 272 – – – 37 – – 309
B Madumise 710 – – – 58 – – 768
S Mokoena 825 – – – 93 – – 918
S Hlatshwayo 679 – – – 66 – – 745
GN Jiyane 287 – – – 28 – – 315
BW Ngubane 186 – – – 21 – – 207
W Steenkamp 229 – – – 72 – – 301
O Tobias 159 – – – 9 – – 168
J Ntwane 200 – – – 45 – – 245
S Mthethwa – – – – 5 – – 5
MW Mkhize – – – – 6 – – 6
Total 4 919 – – – 617 – – 5 536
Executive management Salary/Fee
Bonuses and performance
paymentsPension
contributionsOther
contributionsActing
allowance Leave pay Other Total
JEP Falbe (1) 2 827 – 138 161 – – 1 359 4 485
D Arendse (1) – 439 – – – – – 439
T Kgogo (2) 391 – 26 18 – 90 – 525
B Zwane (3) 1 226 209 228 202 354 – – 2 309
G Griessel (2) 553 (921) 78 24 – – – (266)
X Hewu (3) 716 – 80 14 62 – – 872
P Luthuli 1 558 – 181 160 – – – 1 899
M Modipa 1 167 – 117 70 – – – 1 354
K Zono (3) 1 269 68 152 115 128 – – 1 732
A Dippenaar (3) 1 691 414 250 149 166 – – 2 670
Total 11 398 299 1 250 913 710 90 1 359 16 019
1 – Contract expired2 – Resigned3 – Acting Vice Presidents appointed during the year

38 | PetroSA Integrated Annual Report 2016
S
H
I
R
T
PetroSA BOARD
Code of Conduct and Business Ethics
In today’s competitive and rapidly changing business environment, doing the right thing has never been more important. The success of PetroSA is dependent upon the highest ethical conduct of its Board, Executive Management, employees and contractors.
In support of ethical conduct, an employee Group Compliance Manual was developed and distributed to all Staff. This manual is a condensed summation of the code of ethics policy, gift register procedure and declaration of related party interests, prevention of fraud and corruption policies and other conduct related policies and procedures.
As the National Oil Company of South Africa, ethical behaviour underpins the trust placed in us by our customers, suppliers, shareholder, communities and employees and is thus a non-negotiable element of the way in which we behave and conduct ourselves. The implementation of the envisaged compliance and conduct culture is achieved by developing tools such as the Group Compliance Manuals and methodologies contained in the compliance risk management frame-work. The Group Compliance Manager is the second line of defence, monitoring the business and business unit compliance champions to ensure that there is consistent application of the policy, manual and methodology so that compliance risks can be uniformly identified, assessed, monitored and escalated.
A formal governance framework exists and it is supplemented with sets of policies that are regularly reviewed, but PetroSA places high premium in actual behaviour, that which shapes our approach to our business dealings.
With the Social and Ethics plan in its third year of implementation, significant progress was made in embedding awareness and appreciation of ethical behaviour within PetroSA via specific educational and communication programmes. The Board leads in this regard, and a regular review of behaviour and attitudes is a key item on the agenda of the Social and Ethics Committee.
Values are integral to our operations and to the building of a compliance culture. We place a high value on stewardship, honesty, integrity, respect and transparency dealing in the environment we operate in.
Through the Employee Group Compliance Manual and Code of Ethics and the associated Group-wide attestation process, employees are made aware of compliance-related policies as well as the conduct expected of all employees, as described in PetroSA’s Code of Ethics.
All our employees are required to acknowledge they have read and understood the Manual on first joining PetroSA and every year thereafter. Quarterly Group Compliance and Ethics Reports are tabled to EXCO and the Board in which key risks, ethical issues, major regulatory developments and issues relating to compliance incidents are brought to their attention in line with the defined materiality levels. As part of inculcating the PetroSA values to all employees and Stakeholders, a values moment is now a standing agenda item for all PetroSA meetings. PetroSA uses the values moment for consistent meaningful, practical and helpful reflection on our values as an organisation and demonstrates PetroSA’s leadership commitment to the “SHIRT” values that all are expected to wear and exhibit at all times.
Awareness and training
Governance roadshowsDuring the financial year under review, the various PetroSA internal assurance providers conducted training and awareness campaigns directed at ensuring that risk management, assurance, internal controls, fraud risk management, ethics and compliance are embedded in the organisation. In this regard, all Divisions of PetroSA were trained leading to the establishment and operationalisation of Governance Management Committees across the Company. The primary focus was to equip the first line of defence with the necessarily skills to discharge their fiduciary duties, and by so doing create an enabling culture of good governance across the Company.
A number of key issues raised at Governance Roadshows and various Governance Management Committees included leadership, finances, company strategy, vision and concerns on labour matters. These issues have been submitted to various appropriate structures, including the Board, for resolution.
STEWARDSHIP
HONESTY
INTEGRITY
RESPECT
TRANSPARENCY
GOVERNANCE PROCESSES

PetroSA Integrated Annual Report 2016 | 39
Annual declaration:Acknowledgement of policies
Our annual declaration of policies and procedures, acts and other prescripts governing business units areas of responsibility, remains key and integral to our ethics awareness and education efforts among Staff members.
Declarations of outside interests and gifts are also captured on the SAP system and reported to the Group CEO and the Board quarterly. These declarations and acknowledgements are monitored by Group Compliance and the Divisional Business Unit Compliance Champions. Figure 2 provides the various declarations and percentages per category for the year under review.
Software trainingPetroSA utilises risk management software across the group to capture and report on group risks. Training on the use of the risk management software continues to be a focal point of embedding Enterprise Risk Management (ERM) and in this regard all divisions attended requisite training including the GCEO and Executive Committee Members. During the period under review, the ERM Dashboard Module (see Figure 3 for example) was provided to management and used to monitor all aspects of the Company’s risk profile. ERM Dashboards introduced full web user functionality without the requirement for users to navigate long lists of risks. It was designed to make interaction with the risk management framework more accessible and user-friendly. The rollout of the risk management dashboards has empowered the business to do proactive real-time management and monitoring of the Company’s risk exposures.
Online media communicationThe consistent documenting of “fraud messages” in the quarterly forensic bulletin “Shifting Sands” continues to serve to awaken and heighten the moral conscience of all PetroSA employees. Shifting Sands is a regular reminder of the work done by the forensic investigative function and the potential consequences of illegal activities. The main thrust of the bulletin is to communicate results of anti-fraud initiatives, provide feedback on the status of forensic matters under review or concluded, and to share learnings on control breakdowns
and how these can be prevented in the future.
A number of compliance and ethics topics were produced and disseminated through PetroSA Today, an online daily platform of communication for all employees. This effort was geared to raise the level of awareness of ethics and compliance for the 2015/2016 financial year. The papers written and distributed serve as a preventative control measure, and being informative and educative in nature, they served to ensure robust ethics and compliance.
As part of its quest for excellence, the organisation continues to educate employees on the contents of the Employee Group Compliance Manual. To ensure accountability and responsibility by all employees, this was distributed to, and acknowledged by, all employees in the organisation.
The following core frameworks continue to be the focal point of the work executed by assurance providers.
• Enterprise Risk Management Integrated Documentation: This document is designed to provide a complete guide to the Enterprise Risk Management (ERM) Framework for the PetroSA Group. It contains the full range of ERM documentation including policy, processes and procedures and clarification of roles and responsibilities, together with key templates to assist in implementation.
• Group Compliance Integrated
Documentation: This document is designed to provide a complete guide to the Group Compliance Framework. It contains the full range of Group Compliance documentation including policies,
FIGURE 2 Annual declaration percentages for 2015
FIGURE 3 ERM Dasboard Module monitoring all aspects of the Company’s risk profile
• Conflict of interest
• Board Audit Committee members
• Charitable organisations
• Gifts

40 | PetroSA Integrated Annual Report 2016
Enterprise Risk
Management
Management
Integrated
Documentation
PetroSA Guidelines for Group
Compliance
Group Compliance
Integrated Documentation
PetroSA BOARD
GOVERNANCE PROCESSES/CONTINUED
processes and procedures and clarification of roles and responsibilities.
• Group Forensics Integrated
Documentation: This document is designed to provide a complete guide to the Group Forensics Management Framework. It contains the full range of forensics-related documentation including policies, processes and procedures and clarification of roles and responsibilities. The Board and Group Chief Executive Officer of PetroSA have committed the Company to a process of Fraud and Corruption Risk Management that is aligned to the principles contained in the Public Finance Management Act, 1999.
Anti-bribery and corruption
The purpose of regulating the anti-bribery and corruption framework in PetroSA is amongst others to:
• Ensure that the Company and its subsidiaries have appropriate systems and procedures in place to prevent bribery and corruption;
• Detail the rules for the Company, including its subsidiary companies, its officers and employees pertaining to the recognition and prevention of bribery and corruption.
The Company continues to implement the approved policy by entrenching a culture and environment where anti-bribery and corruption behaviour is not tolerated. The anti-bribery policy is the cornerstone of the Group’s anti-bribery and corruption programme. Specific guidance is tailored to meet the needs of different business units while ensuring alignment of global regulatory and best practice requirements.
Declarations of interestThe Board has overseen the implementation of the process to improve declarations of interest by employees via the Group Compliance Function platform available online. The electronic declaration of interest allows for easy and reliable declaration of gifts and ownership interests by employees and has been rolled out to the rest of the Group.
Prevention of fraud and corruptionPetroSA is committed to fighting fraudulent behaviour at all levels of the organisation. PetroSA manages fraud risk exposure through the implementation of its Fraud Prevention Plan. In addition to fighting fraud and corruption and promoting ethical conduct within PetroSA, the Fraud Prevention Plan is also intended to assist in proactively preventing, detecting, investigating and responding to fraud and corruption within PetroSA. The plan reinforces the role of the first line of defence in establishing and maintaining a culture intolerant of fraud and unethical behaviour. It builds the competencies and capabilities to prevent and mitigate against fraud within an area of responsibility.
PetroSA has an outsourced whistle blower hotline, which is available to all Staff, various Stakeholders and members of the public. A Fraud Response Committee established by the Risk Management and Compliance Committee provides oversight over the resolution of matters reported to the confidential hotline. The primary objective of the Committee is to ensure that all fraud allegations from sources are recorded and investigated in accordance with the Prevention of Fraud and Corruption Policy. At its quarterly meeting all matters are interrogated and progress relating to the implementation of report recommendations discussed. Any matters not adequately dealt with are
Enterprise Risk Management Management Integrated Documentation
PetroSA Guidelines for Group Compliance
Group Compliance Integrated Documentation
As the National Oil Company of South Africa, ethical behaviour underpins the trust placed in us by our customers, suppliers, shareholder, communities and employees and is thus a non-negotiable element of the way in which we behave and conduct ourselves.
Enterprise Risk Management Management
Integrated Documentation
PetroSA Guidelines for Group Compliance
Group Compliance Integrated Documentation

PetroSA Integrated Annual Report 2016 | 41
appropriately escalated. All reported matters are treated with utmost confidentiality in order to protect the rights of both the whistle blower and the alleged implicated party. Group ComplianceThe PetroSA Board of Directors is accountable for ensuring compliance with laws, regulations, policies and procedures and any adopted standards applicable to the Company. Our Board-approved Risk Tolerance and Appetite statement and the Group Compliance Policy are founded on a zero tolerance approach to compliance risk. The policy mandates Group Compliance to monitor and report the state of compliance Company-wide with all regulatory requirements and effectiveness of measures put in place by Management and report such through the RMCC, a properly constituted Board Committee.
Compliance Risk Management Strategy
The Group’s approach to regulatory compliance remains risk-based and aligned with best practice. Its methodology is guided by the Generally Accepted Compliance Practice, as endorsed by the Compliance Institute of Southern Africa.
The function of compliance has been delegated throughout the Company based on specialist areas. In addition, Group Compliance assists Management in discharging its responsibility to comply with statutory, regulatory and supervisory requirements by facilitating the development, establishment and maintenance of an efficient and effective compliance risk management process. Group Compliance continues to monitor the reporting on key controls implemented by Management and to a large degree found the control environment to be satisfactory.
PetroSA’s compliance risk manage-ment process and its various gates concerning regulatory compliance, can best be illustrated as in Figure 4.
Over and above the ongoing advisory and monitoring responsibilities, the changing regulatory landscape remains a key focus area for Group Compliance. Several Group-wide projects relating to the requirements of various items of legislation were
undertaken by Group Compliance in the current financial year. Shortcomings identified were communicated to Management and the Board and integrated into the respective control environments. The business processes where required were updated to take effect of the control weaknesses and control improvements.
Regulatory Compliance Universe
PetroSA’s Regulatory Compliance Universe contains a list of 76 Acts and Regulations which are applicable to the Company. The PetroSA regulatory universe is continuously reviewed, and where necessary the required remedial action is implemented. Our regulatory
requirements are also benchmarked against sector-specific best practices. This results in a proactive and cohesive management of our relationships with all our Regulators.The graphs below depict the universe per risk rating and per category (see Figure 5).
PetroSA concerns itself with proactive compliance risk management. All legislation is continuously identified and assessed for applicability to the PetroSA Group, in all jurisdictions where we have a business footprint. Pieces legislation, deemed applicable legislation are assessed and risk-rated. Where required, controls are implemented in order to mitigate exposing the group to fines, penalties and other criminal sanction.
FIGURE 4 PetroSA’s compliance risk management process
FIGURE 5 PetroSA’s compliance risk management process
FIGURE 6 Number of Acts and Regulations per risk rating and per category
RISK INDENTIFICATION
COMPLIANCERISK
ASSESSMENT
COMPLIANCERISK
MANAGEMENT
COMPLIANCEREPORTING
COMPLIANCEMONITORING
Extreme (16)
High (26)
Medium (15)
Low (19)
PetroSA Regulatory Compliance Universe (76) Acts and Regulations
Enviro
nmen
tal
Busin
ess
Fina
nce
Health
Info
rmat
ion
Regul
atio
ns
Oil and
gas
Secur
ity
Labo
ur
Just
ice
Low
Moderate
High
Extreme

42 | PetroSA Integrated Annual Report 2016
The Regulatory Compliance Universe was reviewed and approved by the Board during the 2014/2015 financial year. In line with the Group Compliance Policy, a review of the Universe was performed by Group Compliance in the year under review and no changes were recorded.
By 2015/2016 financial year end, the 60 (79%) of the Acts and Regulations within the Universe had been profiled. The Acts/Regulations are at various stages within the Profiling Process and below are highlights relating to the number of Acts and Regulations per stage in the profiling exercise:
• 73% (56): mitigations implemented by Management to ensure Compliance have been identified and assessed for adequacy;
• 29% (22): inadequate mitigations have been followed up to assess implementation of corrective action; and
• 22% (16): entire Acts/Regulations assessed for effectiveness of mitigations implemented by Management to ensure Compliance.
Non-compliance reportingIt remains an apex principle that PetroSA does not tolerate non-compliance with laws, regulations and any of its own standards (policies, procedures and work instructions issued by Management and the Board). Through Group Compliance, the recording of non-compliance, using the materiality levels (quantitative and qualitative) defined in the Group Compliance Policy, is designed to provide the Group CEO and the Board with an on-going view of the compliance landscape.
Management Attestation on complianceAs part of inculcating a culture of compliance within the group, the Executive Management signs off a Management Attestation Letter to
PetroSA BOARD
GOVERNANCE PROCESSES/CONTINUED
PetroSA’s Regulatory Compliance Universe contains a list of 76 Acts and Regulations which are applicable to the Company. This is continuously reviewed.

PetroSA Integrated Annual Report 2016 | 43
the Group CEO and the Board every quarter. This letter declares and attests to, the presence or absence of any issues of conflict of interest; compliance to laws, policies and procedures; the status and knowledge of fraudulent activities within the various divisions; and the application of risk management techniques in discharge of their duties.
Ensuring business continuityBusiness Continuity Management, as a discipline within PetroSA, maintains a collection of plans that are readily accessible and available for use in the event of a disaster
or major disruptions to business activities. These plans are informed by an approved Business Continuity Management policy and accompanying procedures, which require that all Business Continuity Plans across the organisation be kept in ready mode for execution and are updated at least annually or as and when material changes to business processes occur.
PetroSA BCM programme is derived from the International Standard ISO-22301and complies with all applicable regional BCM standards and regulatory requirements. Senior
Management provides programme sponsorship and governance at corporate level.
The PetroSA Business Continuity Programme incorporates:
• Crisis Management procedures to direct recovery activities during any significant business disruption
• Documented procedures to back up and recover critical systems and data.
• Documented strategies to sustain critical functions using a variety of applicable business strategies including relocation to alternate workplace facilities, process transference and split production.
• Processes to communicate with key Stakeholders, including employees and clients.
A team of business continuity professionals ensures that recovery plans are documented, reviewed and tested across PetroSA in line with the global minimum standards contained within BCM Policy. Group Compliance in the current financial year has been tasked with the updating of Business Continuity Plans in light of the impact on business processes resulting from the voluntary severance process effected during the year.
Combined assuranceKing III advocates that the Audit Committee should ensure that a combined assurance model is applied to provide a coordinated approach to all assurance activities. In response to this principle, the PetroSA group has formulated a combined assurance framework for use by all PetroSA assurance providers to ensure a broader coverage of risks facing the organisation.
During the year the respective delegated Board Committees approved the respective assurance provider plans and reviewed individual quarterly reports.
In the previous financial year a number of key recommendations were made, aimed at improving the control environment. Limited progress on combined assurance was recorded for the current financial year.

44 | PetroSA Integrated Annual Report 2016
PetroSA BOARD
ENTERPRISE RISK MANAGEMENT
The primary role of the Risk Management function is to design, implement and monitor the process of enterprise risk management and its integration into the day-to-day activities of the organisation. In line with integrating and embedding a culture of risk awareness, risk management plays an instrumental role in decision making processes taken at all levels of the organisation.
PetroSA’s philosophy on enterprise risk management is that of proactive management of risks, accompanied by the exploitation of any related opportunities. To this end, the Risk Management and Compliance Department, under the guidance of the Group CEO, has put in place a number of governance structures and policies. These are subject to review and updated to ensure alignment with good practices and include the following:
• Group Compliance Policy• Anti-Bribery and Anti-Corruption
Policy• Enterprise Wide Risk Management
Policy• Business Continuity Management
Policy• Prevention of Fraud and Corruption
Policy• Gift Register Procedure and
Declarations of Related Party Interests
• Code of Ethics
Key risks and mitigating activities
A key objective of Risk Management is to ensure that all potentially significant risks facing PetroSA are identified, proactively assessed, and managed in such a way that the impact of these risks are maintained in accordance with the Group’s appetite and tolerance for risk.
Key risks associated with Company strategic initiatives and objectives are identified and assessed on an ongoing basis. These risks are subject to a continuous update management cycle in line with the Enterprise Risk Management process. Integral to this is the ongoing assessment of PetroSA’s risk exposures and mitigation strategies. As a result, Risk Owners continually consider the risks and control strategies which underpin the PetroSA Risk Profile.
This strategic risk report focusses on aligning PetroSA’s strategic risk profile to the Company’s Corporate Strategy. The principle risks that may impact PetroSA ability to achieve its objectives are described in Table 10.

PetroSA Integrated Annual Report 2016 | 45
TABLE 10 Principle risks that may impact PetroSA ability to achieve its objectives
Risks Response measures Strategic focus
Failure to achieve budgeted indigenous landed gas rate at the GTL Refinery
• Ongoing management of landed gas rates.
• Improve efficiency by converting boiler to allow for Heavy Fuel
Oil firing.
• Improve stability of the tail gas loop.
• Well Management Plan in place.
• Complete project studies and required modifications to allow
for the processing of increased quantities of Heavy Condensate
to supplement indigenous gas.
SUSTAINABILITYFailure to execute Heavy Condensate Processing
• Ongoing plant stability and maintenance strategy being reviewed
and developed based on new mode of operation.
Failure to achieve and maintain GTL reliability and availability targets
• Ongoing production management and engagements with partners
and Stakeholders.
• Dedicated Asset Management team.
• Implementation and ongoing monitoring of price risk management
strategies.
PetroSA Ghana does not yield budgeted Production and Revenue
Failure to add additional feedstock and non-feedstock reserves to PetroSA portfolio
• Progress appropriate opportunities in line with the Project Gated
Framework requirements.
• Implement Board approved funding strategy and plan to support
reserve addition.GROWTHFailure to identify and
develop a sustainable long term solution for the GTL Refinery
• Investigate, assess and progress appropriate and timely feedstock
solutions in accordance with Project Gated Framework requirements.
• Competent and dedicated teams to investigate and develop a long
term solution for the GTL Refinery.
Failure to achieve transformation targets
• Transformational goals are key performance areas at Divisional
and Corporate level.
• Employment equity forums to monitor progress and regulatory
submissions to Labour Department.
• Database of agencies that focus on appointment of target groups
is in place and is consulted.
TRANSFORMATION
Insufficient provision and funding for the environmental decommissioning liability
• Project team to develop a technical basis for the abandonment
calculation and cost estimate.
• Provision for the abandonment liability provided for on the
Balance Sheet.
• Board approved funding strategy.
• Ongoing Stakeholder and Regulatory engagements.
FINANCE
Failure to achieve Corporate Objectives due to a lack of funding for key strategic projects
• Board approved funding and partnership strategy.
• Continuous and stringent cost management.
• Optimisation of Balance Sheet.
• Refinance acquisitions or existing assets with debt or reserve
based funding.
• Ongoing stakeholder engagement to allocate state participation
to PetroSA.
Failure to achieve targeted profits during the period
• Ongoing management of production and operating budgets.
• Continuous and prudent discretionary cost management and
revenue enhancement initiatives.
• Continuous financial performance review.
• Active investment management.
• Trade finance facility to fund and support trading business.

46 | PetroSA Integrated Annual Report 2016

PetroSA Integrated Annual Report 2016 | 47
PetroSA BOARD
INTERNAL AUDIT
The Internal Audit activity is governed by the Internal Audit Charter which is reviewed and approved annually by the Board. To provide for the independence of the Internal Audit activity, the Chief Audit Executive reports functionally to the Chairperson of the Board Audit Committee and administratively to the GCEO. The Chief Audit Executive has unrestricted access to the GCEO and Chairman of the Board and has a standing invitation to attend meetings of the Executive Committee and other committees made up of a majority of executives, but is not a member of these committees.
The Internal Audit Department is responsible for providing independent, objective assurance on the adequacy and effectiveness of the Group’s governance, risk management and internal control processes to Executive Management and the Board. The Internal Audit activity includes the provision of consulting services which are designed to add value and improve the Company’s business systems.
The work of the Internal Audit Department focuses primarily on areas that present the greatest risk to the Group. This is achieved by following a risk based approach in formulating its annual and strategic internal audit plans which are approved by the BAC. The annual plan is reviewed on a quarterly basis for material changes in the Group’s risk profile; revisions to the annual plan are approved by the BAC.
The Chief Audit Executive submits formal quarterly reports to the BAC summarising the results of the internal audit activity, the progress made by Management in addressing exceptions previously raised by Internal Audit and other significant issues.
The Chief Audit Executive maintains a quality assurance and improvement programme to ensure that a continuously effective level of performance, compliant with The Institute of Internal Auditors’ mandatory guidance, is upheld. An improvement plan is maintained and monitored to address the deficiencies noted during quality assurance reviews. The most recent annual periodic assessment was conducted in March 2016 and identified a number of process improvements. Action plans have been introduced to enhance the effectiveness of the internal audit activity and address the deficiencies resulting from the assessment. The internal audit activity was subjected to an external independent quality assessment review in 2011 where it achieved general conformance to the IIA standards.

48 | PetroSA Integrated Annual Report 2016
EXPANDING CHOICE.IMPROVING PERFORMANCE.

PetroSA Integrated Annual Report 2016 | 49
Report from the Acting Group Chief Executive Officer (Group CEO) 0
Executive management team 0
Report from the Acting Group Chief Financial Officer (Group CFO) 0
PetroSA LEADERSHIP

50 | PetroSA Integrated Annual Report 2016
PetroSA LEADERSHIP
REPORT FROM THE ACTING GROUP CHIEF EXECUTIVE OFFICER (GROUP CEO)
The financial year saw a deliberate focus on implementing various initiatives aimed at sustainability.
The 2015/2016 financial year was a critical year for PetroSA to turnaround its business following a difficult period in the previous year where it recorded a net loss of R14.6 billion. The Company has made great strides in addressing the performance in the previous year despite challenges posed by critical leadership departures, the low crude oil prices, extremely volatile exchange rate and lacklustre global economic growth. Though the implementation of the turnaround plan is not complete, we are well on our way to ensure that the PetroSA business is one
predicated on sustainability, and the ability to contribute positively to the national objectives of the country.
Performance
The Group recorded a net loss of R449 million (2015: R14.6 billion) on the back of a R254 million net impairment that was booked against overvalued onshore and offshore production assets. The group impairment of R1.5 billion (2015: R14.4 billion) was offset by a reversal of a portion of the Ghana investment which amounted to R1.27 billion. This
loss is mainly attributable to lower production volumes from our Mossel Bay GTL refinery, lower selling prices and an impairment charge. By the end of the financial year, the Company had a cash balance of R3.7 billion with total assets amounting to R20.8 billion.Whilst the sustainability of our GTL refinery continued to be constrained during the year by depleting gas supply from our South Coast gas fields, the rand depreciation alleviated most of the negative impact on overall company profitability. In the meantime, the F-O gas fields did not perform as expected because the F-O10 well
Mapula Modipa

PetroSA Integrated Annual Report 2016 | 51
remained shut for entire year. As a result, overall production from F-O wells (F-O9, F-O11) decreased to 45 kNm3/h in December 2015 and to 27 kNm3/h by the end of the financial year.
PetroSA suffered a fatality in September 2015 with the last recorded fatality being in 2009. This has resulted in PetroSA reviving its HSE culture and resuscitating a drive towards strengthening this within the organisation. This remains an integral part of the PetroSA business and continues to be at the heart of our operations to be valued by every employee. Our deepest condolences go to the Vanqa family for their loss as well as the employees that worked closely with him.
Sustaining and growing our business
In response to the challenges highlighted above, the PetroSA Strategic Plan 2015/2019 focused on the immediate stabilisation and sustainability of the organisation, consistent with the Company’s mandate of being a sustainable commercial entity, advancing the broader national objectives of ensuring security of supply and industry transformation. As a result, the financial year saw a deliberate focus on implementing various initiatives aimed at sustainability which resulted in the development of a Turnaround Plan for the business. This plan prioritises the sustainability of the GTL Refinery in the short-to-medium term, inclusive of the revival of production wells.
The company also decided to reduce the operating mode of its GTL Refinery to sub-optimal levels in response to the challenge of depleting gas reserves. As a result, the cumulative total production of the refinery was reduced by 13% below budget (7.933 MMbbls actual vs. 9.102 MMbbls budget) and the Gasloop was operated at a 2 X 2 (2 Reformers 2 Synthols) mode for the greater part of the year. However, this was further reduced to a 1 X 1 production mode by the end of the financial year in line with the strategic imperatives of the Integrated Sustainability Plan which seeks to sustain gas optimisation over the next two years whilst allowing for
test runs of crude carbonyls and propane reforming.
Notwithstanding the high reliance on Project Ikhwezi given its inherent risks and the extreme financial exposure during the past financial year, the Company has embarked on a process of evaluating other upstream prospects in close proximity to the project with a view to increase gas feedstock supply to the refinery and extract more value from mature fields. With respect to Project Ikhwezi interventions, the company is currently investigating several options including the F-O10 well remedial action which is planned for the new financial year. The failed start-up attempts have already been analysed with preliminary results indicating that the well is loaded with liquid. Having investigated various remedial options, I am confident that one of them will be successful and the well will produce gas during the next financial year.
In addition, the Company took a decision to focus on other revenue generating assets such as its trading business and to increase the value of all existing assets through an Integrated Asset Optimisation project. Alongside this project, the Company continues to develop a medium- to long-term solution for the Mossel Bay GTL Refinery, including the investigation of Liquid Feedstock options and Enhanced Condensate Processing.
The need to grow our business while, at the same time, addressing the sustainability of our refinery over the medium to long-term has resulted in a renewed focus on our LNG project. Whilst did not proceed into the FEED phase during the financial year, engagements with critical Stakeholders such as the Department of Energy, the IPP Office, Eskom and Transnet are ongoing.
I am happy to report that key Stakeholders in this project such as the CEF, Eskom and Transnet achieved alignment during the year especially with regards to roles and responsibilities that State Owned Company (SOC) can play in the implementation of an LNG importation project. Several policy intervention initiatives have been identified and actioned through my office to sustain and grow the Company. With many years of experience and know-how,
participation in, and acquisition of local as well as international upstream petroleum ventures; production of synthetic fuels from offshore gas; the development of domestic refining and liquid fuels logistical infrastructure; and marketing, sales and trading of oil and finished petroleum products. To date, PetroSA is the only state owned entity that has the sought-after technical, legal and commercial proficiency to manage, and generate value from petroleum operations for the interest of South Africa. PetroSA views itself as the National Oil Company (NOC) and in line with this has recommended that PetroSA be formally adopted
the Company continues to play a pivotal role across the entire petroleum value chain in its quest for security of liquid fuel supply for South Africa.
To this end and having retained the petroleum exploration and production knowledge base and experience gained since 1965, the Company remains involved in the exploration and production of oil and natural gas,

52 | PetroSA Integrated Annual Report 2016
PetroSA LEADERSHIP
through policy and legislation as the National Oil Company of South Africa. This process has started.
Further to this, PetroSA has been engaging the relevant areas of government to ensure that PetroSA be designated as the custodian of the State’s allocation for all Petroleum Rights in line with the amendments of the MPRDA or in the proposed Upstream Gas Bill. The strength of NOC’s are established through commercial discoveries in their home country and this cannot be understated. State allocation to PetroSA will benefit South Africa extensively as gas development will benefit feedstock to the GTL refinery and have a significant impact on the power landscape. We are working tirelessly to ensure that the designation can be formalised in the Government Gazette.
PetroSA’s major response to the security of supply has been the proposal for the increase of refining capacity through building a 360 barrels per day (bpd) world-class refinery at Coega; and the option of converting the Mossel Bay Gas to Liquid Refinery into a 120 bpd crude Refinery. This best addressed a range of security of supply issues facing South Africa and fully addresses the Energy Security Master Plan (ESMP).
The Company also intensified its cost saving drive under the BillionPlus project that it implemented during the previous financial year. As part of this drive, the Company embarked
on a head count reduction where employees were incentivised to apply for Voluntary Severance Packages (VSP). This is a continuous process.Project Apollo, a CEF initiative began in September 2015 with the objective of supporting efforts to ensure the long term sustainability of PetroSA.
The project was a six month initiative and a final report has been presented to Management in May 2016. Key recommendations are being considered in the context of initiatives described above to ensure a sustainable NOC for the country destined for further growth and job creation.
Transformation
With regard to transformation, we performed well during the financial year achieving 84.7% on preferential procurement compared to a target of 60%. However, challenges were encountered on the implementation of the new organisational structure and related policies due to the headcount reduction process and the introduction of Project Apollo by the shareholder.
We are proud of our Enterprise Supplier Development programme which is an integral part of PetroSA’s business and continues to make a meaningful contribution towards building the capacity of PetroSA suppliers and transformation of the Oil and Gas industry. In 2015/2016, 14 black owned beneficiaries situated in various provinces including the Western Cape, Eastern Cape, KwaZulu-Natal and Gauteng were supported. Due to
the financial performance of the Company, employment equity has not performed well for this financial year.
Looking ahead
The current challenging global economic environment is expected to remain for some time. It is widely expected that crude oil prices will remain low until the end of the 2017 financial period. The rand exchange rate is expected to continue to be under pressure at the back of heightened political risks and negative investor confidence. Increased stakeholder support and commitment will therefore be required to ensure that we implement our Turnaround Plan initiatives successfully. Our focus during the next financial year will be on ensuring that we find a long-term sustainable solution for our Company.
Appreciation
On behalf of the Executive Management, I would like to thank our shareholder, the DoE, Minister Tina Joemat-Pettersson, the Parliamentary Portfolio Committee on Energy, PetroSA Board of Directors, and the Executive team for their full support, the labour union, our employees and suppliers for their diligence and commitment, and our external Stakeholders for continuing to support and believe in PetroSA.
Mapula ModipaActing Group CEO
STATEMENT FROM THE CEO/CONTINUED

PetroSA Integrated Annual Report 2016 | 53

54 | PetroSA Integrated Annual Report 2016
PetroSA LEADERSHIP
EXECUTIVE MANAGEMENT TEAM
Mapula ModipaActing Group Chief Executive Officer (Group CEO) Ms Modipa holds a BA degree, an SEP certificate from Harvard University as well as an MBA. Over the years, she has accumulated a wealth of experience in the Human Resources environment, dating back to 1997, when she was Chief Director HR at GSSC in the Gauteng Provincial Government. She also served as Deputy Director-General of Corporate Services at the Department of Water Affairs and Forestry before moving to the National Intelligence Agency (NIA) where she served as Deputy Director General of Corporate Services. During her five year career at the NIA she received an award from the State President for Best Financial Management and Savings in 2006. Ms Modipa later joined the Department of Infrastructure as the Head of Department and Accounting Officer. She also worked at Rotek Roshcon as a Human Capital Executive. She is a registered Masters Practitioner at the South African Board of People Practice. Ms Modipa was appointed Vice President of Human Capital at PetroSA on 1 October 2014.
Webster Fanadzo Acting Chief Finance Officer
Mr Fanadzo has over 25 years’ experience in financial management spanning various sectors that include the mining, manufacturing, logistics and oil and gas industries. He is qualified as a Fellow Chartered Management Accountant. He joined PetroSA in 2000 as a Group Financial Manager. At PetroSA, he has assumed various senior management roles including, recently, leading the “Billion Plus” cost optimisation project. Mr Fanadzo holds a B. Acc. (Hons) degree, an MBA and is also a Fellow Chartered Secretary. He was appointed Acting Group Chief Financial Officer in June 2015.
Kholly ZonoActing Vice President: Operations
Mr Zono holds a BSc Honours degree in Chemistry as well as an MBA and recently a BTheo degree. He has worked as a Lecturer and Research Associate at the Nelson Mandela Metropolitan University. He joined PetroSA as a Research Scientist in 1998 and has served in various internal roles such as a Chemist, Scheduler, Production Planner and LP Modeller. He also held key roles in strategic projects. He was appointed to the role of Acting Vice-President: Operations in June 2014.

PetroSA Integrated Annual Report 2016 | 55
Thabiso Manne Acting Vice President: New Ventures Midstream
Mr Manne obtained BSc degrees in Chemistry and Chemical Engineering from the University of Cape Town. He also holds a Masters in Business Leadership from UNISA. Mr Manne has previously worked for petrochemical company Sasol in various capacities from 1996 to 2009. These included roles in Research and Development, Technical and Operations Management for the listed petrochemical company’s Sasolburg and Secunda operations. In 2009 he joined PetroSA as Operations Manager responsible for Project Mthombo, the initiative to establish a mega crude refinery to support South Africa’s security of fuel supplies. Mr Manne assumed the role of Acting Vice-President: New Ventures Midstream in May 2015.
Baxolile J. Zwane Acting Vice President: Trade Supply and Logistics (TS&L) Ms Zwane began her career in the Finance field and has worked for several years at large FCMG companies, including Unilever. She joined PetroSA in 1998. Over the years she has held different positions, such as Management Accountant, Assurance and Administration Manager and Marketing Manager at PetroSA Europe, among others. She holds a BCom degree in Finance and Auditing from the University of Zululand and a Post Graduate Diploma in Business Management from the University of Natal. She was appointed Acting Vice-President: TS&L in May 2011.
Omphile Mohapanele Acting Vice President: Human Capital
Mr Mohapanele has over 20 years Human Resource generalist experience gained in industries spanning the Mining, Cement and Lime and Petrochemical industries. He graduated with a Bachelor of Public Administration degree from the University of the North West. He also possesses a BA Honours degree in Industrial and Organisational Psychology from the University of Cape Town. He is currently employed by PetroSA as Human Capital Client Manager responsible for the Operations division. He was appointed Acting Vice-President: Human Capital in June 2015.
Navin Ramchander Acting Vice President: Corporate Affairs and Shared Services
Mr Ramchander is a Chemical Engineering graduate with corporate and management consulting experience at South African Breweries, Deloitte Strategy & Innovation, and Accenture. He also holds an MBA (Cum Laude) from the Wits University Business School. Mr Ramchander has worked across a range of industries and has experience in the Resources, Education, Banking, Oil and Gas, FMCG and Public sectors, among others. He joined PetroSA in 2014 as Corporate Strategy and Planning Manager. In July 2015 he was appointed the Acting Vice-President: Corporate Affairs and Shared Services.
Neil Robertson Acting Vice President: New Ventures Upstream
Mr Robertson is a Reservoir Engineer, who graduated with a BSc degree in Chemical Engineering from the University of Cape Town. He also possesses a Management Development Programme certificate awarded by the University of Stellenbosch and a Senior Management Development Programme certificate from Duke Executive Education. He joined PetroSA in 2003 and has risen through the ranks. He has served stints as Reservoir Engineer, Implementation Manager, Technical Manager and recently as Subsurface & Integration Manager, during his time with PetroSA. In November 2015 Mr Robertson was appointed Acting Vice-President: New Ventures Upstream.

56 | PetroSA Integrated Annual Report 2016
PetroSA LEADERSHIP
REPORT FROM THE ACTING GROUP CHIEF FINANCIAL OFFICER (GROUP CFO)
TABLE 11 The salient performance indicators for the Group
Summary of financial information2016 Rm % change
2015 Rm
Turnover 15 734 -13% 18 048
EBITDA 2 142 -3% 2 203
Net operating loss before impairment (195) >100% (125)
Operating loss 34 100% (14 551)
Loss for the year (449) 97% (14 574)
Cash generated by operations 2 503 -36% 3 900
Total assets 20 920 5% 19 831
Capital expenditure 3 688 13% 4 223
Total debt 1 201 -39% 865
Net asset value 4 136 0% 4 137
Year-end exchange rates
ZAR/USD 14.78 -21% 12.20
ZAR/EURO 16.78 -28% 13.09
CRUDE OIL ANNUAL AVERAGE 47.57 -44% 85.44
The Board believes that the group is a going concern and has adequate resources to continue operations into the future.
Webster Fanadzo

PetroSA Integrated Annual Report 2016 | 57
Introduction
The Group experienced a challenging financial year, with sales volumes not living up to the expectations of the corporate plan and the price of crude falling by 44% year on year. GTL sales volumes was 17% less than budget and purchased product 4% less than budget. Although PetroSA Ghana sales volumes were 35% higher than the previous year, the fall in crude prices significantly eroded this asset’s revenue performance in Dollar terms. Similarly, the 24% year-on-year weakness of the Rand against the Dollar was not enough to arrest the decline in overall group revenues in the reporting period.
The Group recorded a loss of R449 million on the back of a R254 million impairment that was booked against overvalued onshore and offshore production assets (R1 billion) offset by a reversal of a portion of the Ghana investment impairment of the previous year (R757 million). The reversal arose from a successful infill well drilling programme in one of our licensed fields. Financial performance
The Group achieved an EBITDA of R2.142 billion compared to R2.203 billion the previous year, a decline of 3%. Lower sales volumes in all three revenue generating areas were experienced in an environment where the bulk of the operating costs are semi-fixed and thus could not be timely leveraged in the short term.
The Group achieved an operating loss before impairment of R195 million (2015: R125 million operating loss) in the year under review. A net loss of R449 million (2015: R14.574 billion loss) was recorded for the year.Gross revenue decreased 13% from R18 billion to R15.7 billion this year and was the result of lower product
prices driven by the fall of the price of crude oil worldwide and lower volumes. The fall in the crude oil affected the Group negatively across all operational units, necessitating the total impairment of the Oribi/Oryx crude oil production division. The weakness of the rand against all major currencies, normally a positive influence on revenue, could not compensate for the reduction in crude oil prices and volumes.
The Group posted a net operating loss of 449 million (2015: R14.574 billion loss) after booking an impairment charge of R1 billion in the year to onshore and offshore production assets largely due to an increase in the rand value of the dollar-based cost of provision for abandonment emanating from the weakness of the rand against the dollar (28% weaker). This charge was partially offset by an impairment reversal of R757 million following a successful infill well drilling programme in Ghana that yielded more reserves than was originally estimated. Investment income was R327 million compared to R409 million in 2015 due to a reduction in cash reserves from R4.3 billion at 31 March 2015 to R3.7 billion at 31 March 2016.
Lower finance costs of R512 million were recorded for the year compared to R1.3 billion in 2015 due to a decrease in amortisation charge after the previous year’s impairment. Cost management
Operating costs (cash) continued to be a focal area during the year and saw a decline of 13 % compared to the previous year. Notwithstanding the volumetric challenges cited above, the initiatives identified under the BillionPlus cost optimisation project last year have now been entrenched in the company and will require continuous scrutiny and discipline to ensure sustained benefits going forward.
Financial position
The Group’s financial position is an area for concern even though total assets increased to R20.9 billion (2015: R19.8 billion) as the available cash balance decreased to R3.7 billion (2015: R4.3 billion). Whilst a variety of options are under consideration including a review of our partnership strategy, our ability to fund any expansionary projects is stunted by the reduced cash position.
Total interest bearing debt of R1.2 billion at 31 March 2016 reflects an increase from R865 million in 2015 – this resulted from the weakening of the rand as well as an additional US$10 million draw-down by the subsidiary on the Reserves Based Lending facility.
Property, plant and equipment increased by only R1.1 billion which mainly related to developed fields. At 31 March 2016 the carrying value of the onshore and offshore production assets were evaluated against the recoverable amount, taking into consideration economic conditions, operating budgets and available hydrocarbon reserves. As a result a net impairment amount of R254 million was charged against income. This constituted the reversal of impairment of the Ghana investment of R757 million. Of the R1 billion impairment, R366 million relates to the local GTL assets and resulted from a combination of the increased abandonment provision and lower crude. The balance of R645 million relates to the Oribi/Oryx crude oil assets that became uneconomical because of the low oil price.
The Group’s balance sheet has a current gearing of 31% at 31 March 2016, presented as a ratio of gross interest bearing debt to equity (2015: 21%). Gearing has increased mainly due to the larger debt in rand
There are long-term sustainability plans under development for the GTL plant and related offshore assets.

58 | PetroSA Integrated Annual Report 2016
terms after the rand lost 28% of its value against the dollar. The only other contributor was an additional drawdown of US$10 million. The Group is ungeared when presented as a ratio of net debt (comprising gross debt net of cash and cash equivalents) to equity. The optimal funding structure for the Group has been considered, with a targeted long-term gearing ratio of 30% to 40%, in line with the Group’s long-term strategy and growth initiatives.
Going concern
The Board believes that the group is a going concern and has adequate financial resources to continue operations into the future. In spite of the diminished reserves outlook as reported in these financial statements, the company does not intend to liquidate or cease trading.
There are long term sustainability plans under development for the GTL plant and related offshore assets. The purchased product trading and PetroSA Ghana activities are unaffected and continue to expand. The Board is not aware of any new and potential changes that may have an adverse material effect on the Group.
Dividends No dividends were declared in this financial year.
Cashflow
Cash generated by operations decreased to R2.5 billion (2015: 3.9 billion). This was mainly due to negative working capital movements of R 89 million versus the positive movement of R1.5 billion in 2015, and constitutes a negative R1.6 billion turnaround in working capital. Investing activities were financed from cash generated in the current year and own reserves.
Capital expenditureThe Group invested R2 billion in property plant and equipment, which is mainly made up of spend on the Ten Development in Ghana (R1.5 billion).
Liquidity and Interest Rate Risk Management The Group manages its cash and cash equivalents in line with Board-approved policies. The cash portfolio is split into a core and liquid portfolio to ensure that short-term liquidity needs are met, whilst maximising the return on surplus cash. Investment counterparties are approved based on their assessed ratings and are actively monitored.
Cash under management for the Group decreased from R3.7 billion in the previous year to R3.077 billion as at 31 March 2016, mainly due to the funding of the rehabilitation liability and operational activities. As at 31 March 2016, South African Rand cash and cash equivalents were invested at a floating rate of 7.51% (2015: 5.51%). At 31 March 2016 there were no fixed rate investments in the portfolio. The rate of return achieved on investments is in line with rising market rates, contributing R327 million in interest income generated by the Treasury department in the period under review, down from R409 million the previous year.
Foreign currency risk managementThe Group is exposed to foreign currency fluctuations as it raises funding on the offshore financial markets, imports raw material and spares, and then exports finished product and crude oil. All local sales of finished products are sold on a foreign currency denominated basis.The Group hedges foreign exchange transactions where there is a future currency exposure. The Group also enjoys both natural and synthetic hedges (via foreign currency accounts) to manage foreign currency exposure.
FundingA limited recourse RBL facility, which is ring-fenced at the PetroSA Ghana asset level, for an amount of up to US$150 million, was concluded during the prior financial year. At 31 March 2016 the available facility was US$100 million of which US$85 million has been utilised. Subsequent to year end a further US$15 million was drawn down to fund PetroSA Ghana capital commitments.
In addition, the group is negotiating trade finance facilities of up to R1 billion, to support the increasing trading business of the Trading, Supply and Logistics division and to ease pressure on the working capital.
The group’s funding strategy that supports the pipeline of projects and investments, has been to raise bridging finance in the short-term, thereafter convert to longer-term debt at the asset level. A number of options are being explored in conjunction with the funding community and potential partners to optimise the balance sheet in order to fund sustainability projects.
The PetroSA Ghana acquisition and its further development, and investment in Project Ikhwezi in prior years have largely utilised cash reserves available to fund future projects in the short to medium-term. Consequently, in order for the group to achieve its sustainability and growth strategy initiatives, support from the shareholder in the form of a recapitalisation or shareholder guarantees will be required for significant projects in addition to the current areas of focus and commitments contained in the corporate plan.
Accounting standards
For all periods up to and including the year ended 31 March 2014, the group prepared its financial statements in
PetroSA LEADERSHIP
ACTING GCFO REPORT/CONTINUED

PetroSA Integrated Annual Report 2016 | 59
accordance with South African Statements of Generally Accepted Accounting Practices (GAAP). These financial statements for the year ended 31 March 2016 are the second the group has prepared in accordance with International Financial Reporting Standards (IFRS).
Preferential procurement
For the period under review (i.e. April 2015 to March 2016), payments made to suppliers of goods and services totalled R16 billion. In terms of the B-BBEE codes of good practice, certain expenditure may be excluded from total procurement spend (i.e. procurement from other organs of state, imported goods and services that cannot be sourced locally, as well as specific branded sole-source procurement). The total procurement expenditure from organs of state, sole-source suppliers and foreign entities equalled R10.6 billion. The Group’s total discretionary
procurement for the period under review, in terms of the codes (i.e. level 1–8), was thus R5.3 billion. Total BEE procurement expenditure of R4.5 billion equates to 84.71% of discretionary spend for the period under review.
Areas of focus in the next financial year
Cost OptimisationThe cost optimisation ideas hatched under the BillionPlus project will require to be entrenched in the ensuing periods to ensure continued realisation thereof. The ongoing asset optimisation and revenue enhancement initiatives continue unabated and will require concerted focus given the serious challenges currently being faced.
Sustainability planThe Group is in the process of executing a sustainability plan that will ensure long-term supply of feedstock to the GTL Refinery beyond the end-of
plateau of the indigenous reserves. This will require the development and implementation of a suitable funding plan which will include recapitalisation and sourcing commercial funding to support exploration and development activities across the Group.
Appreciation
My thanks go to our finance team for their diligence and unwavering support during a very challenging year beset by a volatile economic environment. The Group underwent extreme financial pressure occasioned by the significant impairments of its operating assets. Under these trying circumstances the finance team rose to the challenge of delivering appropriate financial management and governance systems across the Group.
Webster FanadzoActing GROUP CFO
Total BBBEE procurement expenditure of R4.5 billion equates to 84.71% of discretionary spend for the period under review.

60 | PetroSA Integrated Annual Report 2016
DRIVING CHANGE. CREATING OPPORTUNITIES.

PetroSA Integrated Annual Report 2016 | 61
REVIEW OF THE 2015/2016FINANCIAL YEAROur strategy 00
Strategic Focus Area 1: Business sustainability 00
Strategic Focus Area 2: Growth 00
Strategic Focus Area 3: SHEQ 00
Strategic Focus Area 4: Transformation 00

62 | PetroSA Integrated Annual Report 2016
The short- to medium-term strategy of the Company is based on the following objectives:
• Competitively operate PetroSA in a sustainable commercial manner by ensuring sustainability of the GTL Refinery and creating alternative revenue streams.
• Assist in attaining security of supply of Liquid Fuels for South Africa.
• Support and drive transformation in the Liquid Fuels sector.
• Ensure that PetroSA operates in a safe, healthy, and environmentally responsible manner, whilst upholding SHEQ imperatives.
Project Ikhwezi Gas-to-powerCost optimisationPetroSA Ghana – JubileeLogistics baseTrading ADP
PetroSA Ghana – TEN DevelopmentLiquefied Natural GasBlock 9/11a ProspectsCommitments in RSA (West Coast)Downstream entryShale Gas
SustainabilitySustain, stabilise, execute and build confidence
GrowthAdd reserves; add refining capacity; increase cleaner fuels; enter downstream; grow market share; diversify income streams
TransformationAchieve organisational and societal transformation position organisation for competitive growth
B-BBEE (includingEnterprise andSupplier Development;Employment Equity)Corporate Social Investment
SHEQOperating safely and in an environmentally and socially responsible manner
Adhere to world-class SHEQ standards
HUMAN CAPITAL / GOVERNANCE / TECHNOLOGY
OUR STRATEGY
REVIEW OF THE 2015/2016 FINANCIAL YEAR

PetroSA Integrated Annual Report 2016 | 63
THE VISIONTO BE THE LEADING AFRICAN ENERGY COMPANY

64 | PetroSA Integrated Annual Report 2016
PetroSA’s strategy is to become a fully integrated, commercially competitive, National Oil Company (NOC), supplying at least 25% of South Africa’s liquid fuel needs by the year 2020. PetroSA’s current focus is on the immediate stabilisation and sustainability of the organisation.
In order to achieve this, PetroSA is changing the planned operating mode of the GTL refinery to perform below its design capacity. This is aimed at prolonging its lifespan, and enhancing liquid condensate processing. The business is also continuing to improve the performance of PetroSA’s trading business, including the further implementation of cost control measures.
1/ Feedstock supply to the GTL refinery
PetroSA’s activities on the South Coast were focused on the following strategic objectives:
• Execution of the F-O field develop-ment project (Project Ikhwezi) which involved the drilling of five horizontal development wells.
• On-going assessment of the Southern Cape’s offshore hydrocarbon potential to supply feedstock to the GTL refinery, as well as provide non-feedstock (oil) sources of revenue through the re-utilisation of the Orca FPSO (Floating Production, Storage and Offloading) facility.
Project Ikhwezi
The F-O Field Development project (Project Ikhwezi) aimed to extend the indigenous gas feedstock supply to the Mossel Bay Gas-to-Liquids (GTL) refinery, thus extending its life and benefitting the local, regional and national economy. The drilling and completion of the wells were found to be challenging, given that the F-O
REVIEW OF THE 2015/2016 FINANCIAL YEAR
as well as the E-CB oil field is ongoing. These opportunities are being subjected to PetroSA’s internal quality assurance process and are currently in the Framing/Opportunity Identification phase of the gated process. Business cases will be developed for each opportunity that passes the feasibility phase with the aim of making a Final Investment Decision (FID) on those that are deemed to be technically and commercially viable.
2 / West Africa assets: Ghana
PetroSA Ghana Limited is a wholly-owned subsidiary of PetroSA. PetroSA Ghana is party to the Deepwater Tano and West Cape Three Points Petroleum Agreements (WCTP), as well as the Jubilee Unitization and Unit Operating Agreement and has working interest partnerships with recognised Independent Oil Companies such as Tullow Oil, Kosmos and Anadarko, as well as with the Ghana National Petroleum Corporation (GNPC).
The assets and the minority equity held in these assets by PetroSA Ghana, are depicted in the Figure 6. Jubilee has estimated mid-case reserves of 510 MMbbls, with 13.9 MMbbls due to PetroSA. The average monthly production from the Jubilee field for the 2015/2016 year was 96 909 bbl. Since inception, Jubilee has produced 169.24 MMbbl of oil, of which PetroSA’s entitlement has amounted to 4.62 MMbbls.
The last phase of the Jubilee field development, referred to as the Greater Jubilee Full Field Development Plan, which includes the Mahogany and Teak fields from West Cape Three Points Block, is pending approval from the Government of the Republic of Ghana. The Mahogany and Teak fields were integrated into the Jubilee full field development plan as
STRATEGIC
FOCUS AREA 1 / Business sustainability
reservoir is a structurally complex, high-temperature, high-pressure reservoir, with variable reservoir quality.
The project came to an end in October 2015, with a total of four wells being drilled. Of these, three have been tied back to the FA platform; the fourth well has not been completed. At the time of this report, one of the three tied back wells (F-010) was shut-in with plans being developed to get it restarted in 2016. The project did not achieve its objectives to sustain production at the Mossel Bay GTL refinery in the medium term, necessitating the implementation of supplementary feedstock solutions. These are described in more detail in the report.
Assessment of additional offshore feedstock options
The 2016 Corporate Plan to extend the life of the GTL refinery identifies the E-BK project including one other new development opportunity. Progress is as follows:
E-BK ProjectE-BK is a discovered condensate-rich gas field located in Block 9. The proposed development plan consists of one horizontal production well tied back through a new 21 km subsea pipeline to a tie-in point on the South Coast Gas pipeline. The project objective is to provide timely commercial feedstock to the GTL refinery. At the time of this report the feasibility phase of the project was approaching completion, having proved the technical and commercial viability of pursuing the development of the E-BK field. Approval and commencement of the Front End Engineering Design (FEED) is planned for the second quarter of 2016/2017.
New development opportunitiesThe subsurface evaluation of further infill potential in the F-A, E-M, South Coast Gas and F-O producing fields

PetroSA Integrated Annual Report 2016 | 65
some of the reservoirs are hydraulically connected to the Jubilee field.
The Deepwater Tano (TEN field) and the West Cape Three Points (Akasa field) blocks have known oil and gas discoveries and are currently in the development and appraisal phases respectively. The Development of the Tweneboa, Enyenra and Ntomme Fields (TEN Fields), located in the Deepwater Tano Block, was approved by the Government of the Republic of Ghana in May 2013. First oil from the TEN fields is expected in August 2016. Reserves for TEN are estimated at:
• Oil: 238 MMbbls (9 MMbbls Net to PetroSA)
• Gas: 362 Bcf (13.8 Bcf Net to PetroSA)
The partnership has since requested that the Government of the Republic of Ghana approve the extension of the TEN development to include the newly appraised Wawa area. Another application to the Government of Ghana was sent with regards to the Akasa Field in WCTP, this application was to extend the appraisal period of the Akasa field by a further two years.
To date, the Exploration Centre has catalogued more than 100 new leads in the “syn-rift” and “Drift” sequences, ranking and prioritising the most promising for development into “drill-ready” prospects.
3/ Refinery optimisation: Operations
Following the challenges related to feedstock supply from the F-O field development project (Project Ikhwezi), the strategy has been to operate the refinery below its minimum design capacity in order to prolong its lifespan, while making use of advanced technology to further develop enhanced processing of liquid condensates.
The cumulative total production from the GTL Refinery was 13% below budget at 7.877 MMbbls, largely attributable to lower than budgeted indigenous production, as well as from unplanned outages and a dip in the Eskom power supply in March 2016.
Refinery sustainability
PetroSA continued with a number of initiatives to improve overall octane values and product margins, including the blending of light alcohols into the petrol pool, and increasing alkylate throughput.
Following a feasibility study, the Company embarked on a project to revamp the isomerate unit to further
FIGURE 6 These areas and the minority equity in the assets held by PetroSA Ghana, are depicted in the figure
50 km
PetroSA Ghana Assets
Deep Water Tano
Tullow Oil (Operator)PetroSA Ghana – 3.83%
Jubilee Oil Field
Tullow Oil (Operator)PetroSA Ghana – 2.73%
West Cape Three Points
Kosmos Energy (Operator)PetroSA Ghana – 1.8%

66 | PetroSA Integrated Annual Report 2016
improve gasoline octane. This involves converting the existing De-isobutaniser (DIB) to a De-isohexanizer column (DIH). Engineering design work was initiated early in April 2015, and the aim is to commission the unit by 2017.
In the light of dwindling gas feedstock, PetroSA focused on increasing the utilisation of the refinery through enhanced condensate processing. The Company has successfully introduced the processing of imported heavy condensate towards the end of the second quarter of 2016. This enabled the GTL Refinery to remove the constraints that limited the processing of condensate to 12 000 bpd. The condensate processing rates of 18 000 bpd can now be achieved. The returns on this investment will be fully realised in 2017, and PetroSA is confident it can increase condensate throughput by a further 28% to 25 000 bpd. In the 2016/2017 financial year, PetroSA aims to process at least 18 000 barrels per day of condensate through the GTL Refinery.
Due to decreasing feedstock and depressed oil prices, the Company has continued to manage costs not related to the Brent crude oil price. PetroSA transformed the way its operations manages costs, including the introduction of a new approach to procuring services. Overall, the Operations division’s fixed and variable costs were 7% and 1.03% below budget respectively for the 2015/2016 financial year.
Gas to Power – The gas to power initiative is of significant importance to PetroSA. The aim of the project is to add value to PetroSA’s tailgas reserves, as well as to reduce Eskom’s generation cost from its Gourikwa OCGT power station. Following a review of the Company’s gas reserves and operating horizon, a strategic decision was taken to allocate all remaining gas to the operation of the
In the 2016/2017 financial year, PetroSA aims to process at least 18 000 barrels per day of condensate through the GTL Refinery.
GTL Refinery. As a result of this decision the Gourikwa Gas to Power project was deferred until further gas reserves are brought into production.
Risk management – In 2014, the Operations Division focused on risks associated with strategy and execution, governance and values. In response to the shift in the business vision, Operations focused on production and financial risks in order to improve the unit’s risk management capability, in line with the PetroSA strategic risk profile. A significant drive is to ensure that employees are exposed to governance issues and understand their responsibility as the first line of defence against such risks. This has resulted in an improvement in the identification, measurement and monitoring of risks, as well as in more effective risk assurance.
Logistics business – In the year under review the Operations Division provided critical logistics services to both PetroSA’s Project Ikhwezi drilling campaign and to Total E&P South Africa B.V. for their crude oil exploration well. Both projects provided the Logistics Base the opportunity to showcase its logistics service offering and to prepare for the expansion of the Logistics Base Services, as well as to support the South African Government’s Operation Phakisa.
4/ Sales and marketing activities
The total sales volumes achieved for the 2015/2016 financial year was 2 539 570 m3, which is 11% lower than budget. Revenue for the same period was R15 billion, 15% lower than budget. This was mainly due to lower product prices, as well as lower sales volumes associated with supply challenges and reduced demand in some economic sectors.
REVIEW OF THE 2015/2016 FINANCIAL YEAR
BUSINESS SUSTAINABILITY/CONTINUED

PetroSA Integrated Annual Report 2016 | 67
Key drivers for product prices is the direction of the crude oil price and the ZAR/USD exchange rate. Brent crude oil averaged the year at US$47.57 bbl, 29% lower than the budget estimate of US$66.70 bbl. The actual average ZAR/USD exchange rate for the same period was R13.79/USD, 24% weaker than the budget estimate of R11.13/USD. The economic indicators alone had a total negative impact of R584 million on the revenue for the financial year.
Optimising the trading business
Feedstock for the GTL Refinery was sourced by PetroSA at R714 million less than budget as a result of lower premiums and falling oil prices. Sourcing directly from equity owners is a key contributor to driving feedstock costs down.
Security of supply
Considering South Africa is a net importer of finished product, PetroSA plays an important role in securing a sustainable supply for the country’s needs by purchasing finished product to supplement the local production.
Imports accounted for approximately 53% of PetroSA’s total volumes traded for the year ending March 2015, with the balance of 47% being produced from the GTL Refinery, as shown in the Figure 7. The volumes were mainly sold to the oil industry and commercial business customers.
Petrochemicals
Lower oil prices also impacted on the sales of petrochemicals (distillates and alcohols), which were 27% below budget. Gas throughput was lower and general activity within the drilling sector decreased. The financial year concluded with the decision to withdraw alcohols from the Far East, Middle East and European markets in order to sustain the Refinery operations. Despite the lower volumes, PetroSA achieved higher than budgeted distillate margins, largely attributable to savings in distribution costs and our strategy to focus on applications commanding higher premiums.
Supply and distribution
As in 2014/2015, supply and distribution optimisation was a key focus area in 2015/2016, with PetroSA rationalising its various business stream supply chains. By reducing storage costs, higher product margins were achieved. Both the Bloemfontein and Tzaneen depots performed well, largely due to an increase in product sales through both depots. Tzaneen saw an increase in both petrol and diesel sales to the oil industry, and this contributed favourably to improved financial performance at the depot.
Following the introduction of 50 ppm and ULP95, the Bloemfontein depot now offers a full basket of products to both commercial business and oil industry customers. Existing customers have welcomed the increased offering and sales increased; boosted further
by unplanned supply outages at other refineries, as well as from the successful deal with a new customer to trade through the Bloemfontein depot from the second quarter of 2015/2016.
Diesel sales to Eskom’s Open Cycle Gas Turbine (OCGT) plants were better than planned, although the second half of the year saw lower demand due to the stable running of the other plants. Speciality sales were under pressure due to the GTL’s feedstock constraints, resulting in a Force Majeure for LPG being declared towards the end of the financial year.
Upstream growth
PetroSA’s growth ambition is to operate as a fully integrated business across all sectors of the value chain by 2017. In fulfilling this ambition, PetroSA’s growth strategy is to build the Company into a significant player and leader in the South African petroleum industry, thereby contributing to the security of the country’s energy supply. Our growth strategy takes place across the three main elements of the value chain: upstream, comprising our West Coast and South Coast South Africa Assets, midstream, comprising our Asset Development Programme, and downstream, which entails entering the market as a supplier and distributor of petroleum products.
100
Budget Q1 Budget Q2 Budget Q3 Budget Q4 Budget FY 2016
Actual FY 2016
Actual Q1 Actual Q2 Actual Q3 Actual Q4
90
80
70
60
50
40
30
20
10
0
Manufactured productPurchased product
FIGURE 7 Ratio of manufactured vs purchased product
50%
50%
41%
59%
51%
49%
47%
53%
51%
49%
48%
52%
51%
49%
61%
39%
51%
49%
47%
53%

Midstream
Liquefied natural gas Aligned to the National Development Plan and the DoE’s Integrated Resource Plan, PetroSA in collaboration with CEF and other SOCs is developing an integrated project to construct LNG receiving infrastructure, import LNG and deliver gas to supply the power and industrial markets.
In the previous financial year PetroSA completed a pre-feasibility study for an onshore LNG terminal based in Saldanha Bay. In the past year extensive engage-ments have been held with critical Stakeholders with the objective of achieving alignment on Government’s LNG to Power programme. In July 2016, PetroSA as part of the CEF Group of Companies responded to the DoE’s Request for Information on this programme, providing critical input to the DoE on the commercial structuring of the programme.
One of the main features of CEF’s approach is to unbundle the develop-ment and operations of the LNG and natural gas infrastructure from the procurement and sale of LNG/natural gas and to allocate the role of a gas aggregator to an agent of the state.
Technology development
Continuous evolution of GTL technologyPetroSA’s interest in and participation in GTL.F1 continues to remain core to PetroSA’s growth strategy despite the negative influence introduced by low international oil prices. GTL.F1’s Low-Temperature Fischer Tropsch
REVIEW OF THE 2015/2016 FINANCIAL YEAR
BUSINESS SUSTAINABILITY/CONTINUED
GTL.F1’s Low-Temperature Fischer Tropsch Technology has been engineered into a fully integrated GTL complex design for economic evaluation by clients with access to commercial and strategic gas supplies.
Technology has been engineered into a fully integrated GTL complex design for economic evaluation by clients with access to commercial and strategic gas supplies. Low oil prices are however dampening interest in new projects which has reduced the studies undertaken for new clients during the past year. The GTL.F1 technology offering remains proprietary, and as only a few companies worldwide have in-depth knowledge of the process, PetroSA has a unique advantage when strategic National Oil Company interests need to be fulfilled.
Our skills base continues to expand as PetroSA maintains its support to various development studies to commercialise this unique technology. PetroSA, together with its GTL industrial partner Air-Liquide, maintained its specialised research and development programme to support commercialisation of the technology.
COD developmentThe PetroSA Synthetic Fuels Innovation Centre, located at the University of the Western Cape, continues to receive support from PetroSA both in direct involvement as well as funding. The program aims to unlock new growth opportunities for PetroSA through fundamental understanding of the proprietary COD Technology. The Centre continues to file new patent applications associated with the modified zeolite catalyst. The Centre is also proudly fulfilling its role in post graduate studies in the scientific field of synthetic fuels, most notably achieving its first PhD graduate from the Centre.
68 | PetroSA Integrated Annual Report 2016

PetroSA Integrated Annual Report 2016 | 69
Upstream
PetroSA is currently in the process of looking for partners with the financial capacity and technical competence to jointly execute the committed work programmes in order to accelerate its activities whilst also reducing technical and financial risk on the West Coast blocks as well as Block 9.
South Coast Assets
Block 9&11aThe Block 9&11a lead and prospect portfolio has been screened and ranked in order of lowest risk and highest geological chance of success. Currently, technical work is being conducted to evaluate and mature these opportunities through PetroSA’s internal technical Quality Assurance Review process. The ultimate objective is to mature the identified leads into drillable prospects, whilst also gaining insight into the remaining potential present within Block 9&11a.
West Coast Assets
Block 1Block 1 is situated off the west coast of South Africa, north of the Ibhubesi gas field (Block 2A) and the A-J1 oil discovery (Block 2B), and south of the Kudu gas field in Namibia. PetroSA holds 40% equity and Cairn India (the Operator) the remaining 60% equity. Gas has been discovered in the block (A-F1 well), promising similar prospects to the Kudu gas field in the north and Ibhubesi in the south.
During the first Exploration Right renewal phase, a 1 900 km2 3D seismic survey and 2 000 line kilometres of 2D seismic infill was acquired and processed. A deep-water oil prospect portfolio has been generated and matured with a number of possible exploration well locations currently being evaluated.
Block 2C
Anadarko (65% and block Operator) and PetroSA (35% equity) jointly applied for a new Exploration Right over Block 2C in 2012. The Exploration Right was awarded by the Petroleum Agency of South Africa in January 2016. The plays of interest are deep-water, structurally trapped oil, similar to what has been identified in the deep water portion of Block 1. The work commitment for the Exploration Right is to acquire a 3D seismic survey in order to determine the best location for an exploration well.
Block 3A/4APetroSA (block Operator) and Sasol Petroleum International (SPI) both hold 50% equity in Block 3A/4A. On 29 May 2014, upon culmination of the one-year Technical Co-operation
STRATEGIC
FOCUS AREA 2 / Growth
FIGURE 8 South and West Coast South Africa Assets
Permit, PetroSA and SPI applied for an Exploration Right. The Exploration Right was awarded to the Joint Venture in August 2015.
Two proven plays have been identified near the block, namely the Albian fluvial gas play and the syn-rift graben oil play. Discoveries in these two plays are less than a 100 km north of the block; however it is uncertain to what extent these plays extend into Block 3A/4A, due to the poor quality legacy 2D seismic data currently available.
Technical work done during the Technical Co-operation Permit highlighted the requirement for modern data to better image the syn-rift graben play. In addressing this, the work programme proposed
Block 1
Block 2CBlock 3A/4A
Block 5/6
Block 9 South
Block 11A
MosselBay
Block 9 North
Production Rights
Block 2A
350 km
N
E-CB
E-BK

70 | PetroSA Integrated Annual Report 2016
REVIEW OF THE 2015/2016 FINANCIAL YEAR
GROWTH/CONTINUED
for the first exploration phase will include the initial acquisition of an Airborne Gravity and Magnetic survey, results of which will inform how to optimally design the modern 2D seismic survey acquisition planned for the block.
Block 5/6 Anadarko operates Block 5/6 with 80% equity and PetroSA holds the remaining 20% equity. The Joint Venture finished the first three-year Exploration right period in August 2015. Subsequently, the first Exploration Right renewal period was applied for and was awaiting regulatory approval and award at the time of this report. The large acreage covering an area just shy of 93 000 km2 makes the Block 5/6 Joint Venture the largest acreage holders on the West Africa margin.
Over and above the minimum commitment for the acquisition
of 6 000 line km of 2D seismic data, the JV reprocessed legacy 2D seismic data, acquired high resolution bathymetry and executed a number of geological and geophysical studies during the initial Exploration Right period. The work programme for the first Exploration Right renewal period includes specialised geophysical processing on the existing 2D seismic survey, as well as geochemical seabed sampling.
Block 2APetroSA holds 24% equity in the Block 2A Production Right, which is operated by Sunbird Energy who hold the remaining 76% equity. The Production Right is currently suspended until a gas market for the discovered resources can be secured. Once an interim sales agreement is negotiated, the Joint Venture will enter into a nine-month, front-end engineering and design study in order to make a final investment decision
on the development of the Ibhubesi Gas Field.
Negotiations are ongoing between the Joint Venture and Eskom to supply gas through a 400km offshore pipeline to their Ankerlig power station in Atlantis, 60 km north of Cape Town.
Midstream
Project Mthombo
PetroSA had developed Project Mthombo to the feasibility gate in 2012. The National Development Plan has raised the issue of additional refining capacity as a critical national strategic imperative and set a target of 2017 to determine if additional capacity is required. PetroSA continues to support the Department of Energy to develop this critical project to ensure that it remains ready to contribute to the process defined in the NDP.

PetroSA Integrated Annual Report 2016 | 71
PetroSA recognises that sustainability issues are shaping the global business world and acknowledges that its own sustainbility depends on its com-mitment and ability to safeguard the health and safety of its employees, reduce its environmental impacts and continually improve the quality of its business operations.
Sadly, in September 2015, the Company experienced a fatal accident at its GTL Refinery when an employee, (Mr Mzukisi Welcome Vanqa), fell down a caged fixed ladder and sustained fatal injuries. This accident, is a sobering reality as PetroSA reflects on the past financial year.
Excellent SHEQ performance is not something which just happens; it requires consistent attention from all employees. The performance during the year under review is perhaps indicative of the challenges facing the organisation and a call to renew our commitment to the aims of our HSE and Quality policies.
Group Health, Safety and Environmental Management System (Group HSE-MS)
PetroSA has implemented a Health, Safety and Environmental Management System (HSE-MS) as a framework for managing the HSE risks of the business. This integrated HSE-MS conforms to the requirements of internationally recognised standards and sets the expectations for conducting the business in a consistent and responsible manner. As part of the implementation of the Group Health Safety Environmental Management System PetroSA restructured the SHEQ scorecard to encompass the concept of dual assurance that key risk control systems are operating as intended. Both leading and lagging indicators are set in a structured and systematic way for each critical risk
control identified in the PetroSA HSE Risk Management process.
PetroSA’s performance during 2015/2016 demonstrated that the Company needs to focus on the leading indicators which are the key actions or activities essential to deliver the desired HSE outcome.
Incident management
Incident management is a cornerstone of continual improvement. The investiga-tion of incidents is an opportunity to learn and to apply these lessons in the prevention of future incidents. PetroSA utilises the SAP EHS module for this purpose and the organisation has grown in confidence in the use of this tool.
Health and safety performance
Following the public enquiry into the fatal accident, PetroSA was issued with a Section 54(1) instruction in terms of the Mine Health and Safety Act to implement fall arrestors on all fixed ladders. The instruction was implemented within the specified time period to the satisfaction of the Principal Inspector. This has constituted a major change to working norms at PetroSA’s facilities.
PetroSA recorded a Disabling Injury Frequency Rate (DIFR) of 0.42 against the target of <0.4. Of particular concern, was the number of disabling injuries not associated with task execution which is generally indicative of a low level of risk awareness.PetroSA maintains a system of medical surveillance that is proportionate to the health risk profile of the organisation. This medical surveillance programme is key to assessing the effectiveness of the occupational health risk controls that are in place for employees. Approximately 85,2% of Staff completed the necessary medical surveillance examination during the
year under review, against a target of 80–85%.
Environmental performance
The main corporate indicator for environmental performance is the number of environmental incidents, defined as any event that has a localised effect that causes environmental damage beyond any fence boundary, or that results from a substantiated community complaint, or that constitutes the exceeding of permit conditions or non-compliance with the relevant regulation. This broad definition encompasses a wide-range of environmental concerns, which the Company believes are PetroSA’s key environmental risks.
There were seven environmental incidents in the 2015/2016 financial year, which is in line with the performance of the previous year but below the target of 0–6 incidents.
The Auditor-General undertakes an annual environmental audit at PetroSA. The audit is focused on environmental legal compliance, specifically in relation to potential liabilities. There were no repeat findings recorded and progress has been made in the implementation of recommendations. There is progress in the long-term remediation at the Voorbaai tank farm and progress will continue to be monitored by PetroSA on a quarterly basis.
Quality performance
PetroSA maintains a Quality Management System that conforms to the internationally recognised ISO 9001: 2008 Standard to ensure the continued delivery of good quality products and services, as well as the continual improvement of internal processes to meet and exceed customer expectations.
PetroSA retained its certification to the ISO 9001: 2008 code and Mark-scheme requirements in a clear demonstration of the Company’s ability to provide products and services that enhance customer satisfaction and meet statutory and regulatory requirements.
The Company is committed to retaining its certification and has a transition plan in place to manage the migration of the Quality Management System to the requirements of ISO 9001: 2015.
STRATEGIC
FOCUS AREA 3 / SHEQ

72 | PetroSA Integrated Annual Report 2016
REVIEW OF THE 2015/2016 FINANCIAL YEAR
STRATEGIC
FOCUS AREA 4 / Transforming Company, sector and society
Introduction
PetroSA is committed to the country’s socio-economic transformation. The Company understands that given its pivotal role in the South African oil and gas sector, it has a responsibility towards transforming not only its own operations, but the wider oil and gas sector, as well as the communities with which it engages and on whom it impacts.
Transforming the Company
The 2014/2015 B-BBEE Verification Audit was the last opportunity for PetroSA to be measured under the old B-BBEE Codes of Good Practice where the seven score card elements were still applicable including: Management Control, Employment Equity, Skills Development, Enterprise Development, Preferential Procurement and Socio-Economic Development. This report presents the results and a brief analysis of the B-BBEE verification audit conducted.
The 2014/2015 B-BBEE Verification Audit indicated that PetroSA has yet again performed well in complying with the B-BBEE Codes of Good practice by maintaining its B-BBEE level 2 Contributor Status and achieving an impressive total score of 91.24; thus maintaining its Level 2 B-BBEE Contributor Status. The score achieved is slightly higher than the 90.66 achieved in 2014/2015 and much better that the 80.90 achieved in 2013/2014. The improvement in the score is indeed commendable. Table 12 reflects the scores achieved in each scorecard element.
Driving the Transformation Mandate in the oil and gas industry Table 12 shows a summary of the current B-BBEE status at PetroSA. Although PetroSA’s B-BBEE status remained the same as in the last verification period, there has been a slight improvement in the Employment Equity and Preferential Procurement elements, with Preferential Procurement attaining the full points. A slight decrease on the Skills Development elements was experienced. This is largely attributed to the current cost contain-ment measures that were introduced during this verification period.
The Employment Equity score is attributed to the current organisational changes, with people resigning from the organisation. At the same time, the preferential procurement scores have been boosted by the latest ESD initiatives and close collaboration between the two departments. By maintaining the same score, PetroSA continues to maintain its “Super Contributor to B-BBEE’’ status (Level one to level three contributor to B-BBEE).
In comparison with other State Owned Entities, this year PetroSA is again at the forefront, despite challenges that include cost-cutting measures that impact directly on some of the scorecard elements. PetroSA continues to be in the lead with an overall score of 91.24%, followed by Transnet with a score of 90.29%, Denel with 86.07%, Telkom with 79.72%, and Eskom with 72.44%.
Being state-owned and controlled, PetroSA is fully compliant with the elements of ownership and management control. This report therefore focuses on elements it can influence:
• Employment equity • Skills development• Enterprise and supplier
development• Socio-economic development
(also referred to as Corporate Social Investment (CSI))
Employment equity
Employment Equity (Table 13) is a critical area of focus for PetroSA and the Company is firmly committed to transformation and to develop an organisational culture that values and promotes diversity and equal

PetroSA Integrated Annual Report 2016 | 73
TABLE 12 PetroSA B-BBEE scorecard elements scores achieved
B-BBEE ElementsCurrent
results 2016Previousresults Target Status Remarks
Equity ownership N/A N/A N/A N/A N/A
Management control 16 16 15 Consistency in the recruitment and retaining Black people at senior managerial levels.
Employment equity 8.84 8.41 15 Recruitment of Black women and people living with disabilities is still a challenge.
Skills development 16.40 16.73 20 BillionPlus meant a reduction in non-core training.
Preferential procurement 20.00 19.51 20 Consistency in the procurement from B-BBEE compliant suppliers
Enterprise development 15.00 15.00 15 Enterprise and Supplier Development programmes are being implemented. B-BBEE Awareness is being spread internally and externally.
Socio-Economic Development (CSI)
15.00 15.00 15 Consistent implementation of our Corporate Social Investment programmes.
Contribution level 2 2 Consistent achievement as a Superior Contributor to B-BBEE.
Source: PetroSA B-BBEE Department, March 2016 Achieved Pending Not achieved
TABLE 13 PetroSA’s Employment Equity Status as at 31 March 2016
“TASK” job
grade Occupational level
Male FemaleForeign
nationals
TotalA C I W A C I W M F
Permanent 334 289 22 203 205 110 10 63 3 2 1 241
23–26 Top management 0
19–22 Senior management 7 3 8 1 1 20
14–18 Professionally qualified and experienced specialists and mid-management
104 48 9 62 60 21 3 17 3 327
09–13 Skilled technical and academically qualified workers, junior management, supervisors, foremen and superintendents
170 194 10 125 98 69 5 44 1 716
04–08 Semi-skilled and discretionary decision-making
53 47 8 46 20 1 2 1 178
01–03 Unskilled and defined decision-making
Fixed term 72 48 21 15 8 6 7 177
23–26 Top management 0
19–22 Senior management 1 1 2
14–18 Professionally qualified and experienced specialists and mid-management
4 1 5 1 1 1 7 20
09–13 Skilled technical and academically qualified workers, junior management, supervisors, foremen and superintendents
1 10 12 2 2 27
01–03 Unskilled and defined decision-making 11 4 1 3 1 1 21
TOTAL PERMANENT AND FIXED TERM 406 337 22 224 220 118 10 69 10 2 1 418
The table shows the workforce profile breakdown of employees by gender, nationality and race (and include people living with disabilities)

74 | PetroSA Integrated Annual Report 2016
for example: Disability Open Days, Heritage Day and Woman’s Day. The Company continually pioneers initiatives, creating a platform for our transformation agenda for “people living with disabilities” within the oil and gas sector.
In as far as the publishing of Employment Equity targets and the achievement of Employment Equity stretch targets is concerned, the Company succeeded in establishing a diversified workforce representative of the national Economic Active Population (EAP), and made progress towards aligning the skills development plan to meet employment equity objectives and implementing relevant affirmative action measures.
Though there has been limited opportunities to appoint new Staff due to a moratorium on external recruitment, all internal Staff movements during
opportunity. PetroSA has a long-term Employment Equity strategy with short- and medium-term objectives.Rooted in the PetroSA values which serve as a compass to guide the behaviour of all PetroSA employees, Employment Equity is a strategic driver that contributes towards transforming the Company, sector and society. To achieve this goal, the Employment Equity Forum implemented a change in its structure to facilitate achieving this objective, namely a vibrant Employment Equity Forum, Skills Development Committee and Women’s Council. The advancement of women and people living with disabilities is a strategic goal with targets embedded in the corporate Scorecards. This has led to a systematic increase in the appointment and promotion of women and people living with disabilities.
Diversity interventions are regularly celebrated on a continuous basis,
the year were in line with achieving the desired national economic active population demographic (Table 14).
PetroSA excels in the Department of Labour inaugural Employment Equity Awards (EEA)
The Commission for Employment Equity (CEE) hosted its first Employment Equity Awards in accordance with section 30(2) of the Employment Equity Act (EEA). The awards took place on 15 October 2015 at the Gallagher Convention Centre in Midrand. The awards sought to recognise the achievements of employers in furthering the purpose of the Act and identifying those that excel in capturing the true spirit of transformation.
The Awards System required participating employers to successfully pass two hurdles before being
REVIEW OF THE 2015/2016 FINANCIAL YEAR
TRANSFORMING COMPANY, SECTOR AND SOCIETY/CONTINUED
TABLE 14 PetroSA’s workforce comparison: National and regional economic active population as at 31 March 2016
African Coloured Indian WhiteForeign
nationals TOTAL
PetroSA workforce (No) 626 455 32 293 12 1 418
PetroSA workforce (%) 44.1% 32.1% 2.3% 20.7% 0.8% 100%
National economic active population 77.4% 10.0% 2.7% 9.9% 100%
Regional economic active population 36.3% 48.2% 0.7% 14.8% 100%
PetroSA females (No) 419 220 118 10 69 2
PetroSA females (%) 29.5% 15.5% 8.3% 0.7% 4.9% 0.5%
National EAP (females) 45.2% 35.3% 4.6% 1.0% 4.3%
Regional EAP (females) 45.8% 16.2% 22.5% 0.3% 6.7%
PetroSA people living with disabilities (No)
31
PetroSA people living with disabilities (%)
2.2%
SOE Target (people living with disabilities)
2.0%
Source: CEE annual report 2015–2016

PetroSA Integrated Annual Report 2016 | 75
PetroSA – Sharing success stories: Disability employment summit and celebrating women
The Western Cape Department of Economic Development and Tourism (DEDAT) and the Western Cape
considered as excellent achievers. Participating employers were required to first pass the basic compliance, regarded as minimum compliance, before passing the second hurdle of progressive compliance, which demonstrates some progress in furthering the aims of the EEA. To be considered for excellent achievement, employers were required to show consistent progress in furthering the true spirit of the Act to advance the cause of designated groups. Leadership commitment was key in this regard, in order to properly support consistent results to sustain the efforts of the organisation.
Of the 131 employers who entered for the awards, only 15 employers were subjected to site visits and 11 companies were chosen as finalists.
The special award recognising innovation and special projects for improving gender equality in the workplace (supported by numerical performance) was awarded to PetroSA in the Public Sector category. The excellence awards recognising overall achievement in implementing employment equity in the workplace were awarded to SABC and PetroSA (runner up).
Establishing a female pipeline for science and technology
PetroSA’s female talent pipeline for science, technology, engineering and mathematics (STEM) career streams, achieved notable progress this year, with fifteen (15) TechnoGirls graduating from the programme and nine TechnoGirls continuing with further studies at tertiary institutions. The TechnoGirls programme is a Government initiative aimed at encouraging female learners to pursue careers in the STEM fields.
Table 15 illustrates their studying streams.
Twelve (12) new TechnoGirls who joined the programme in 2014 completed a CHIETA training programme in Mossel Bay. They were exposed to all the disciplines of engineering and spent time with their mentors at the Mossel Bay GTL plant. These girls come from historically disadvantaged schools and are following the STEM (science, technology, and engineering and mathematics) career streams. See Table 16.
Network on Disability hosted the 2nd Annual Disability Employment Summit in 2015 at the Cape Town International Convention Centre (CTICC). The theme this year was ‘Disability Employment 20 years later’, reflecting on what has been achieved since the introduction of democracy and what barriers still exist. PetroSA was invited to share its case study, exploring what is working for the Company and what the main challenges were in the employment of people with disabilities.
PetroSA celebrated Woman’s Day on 28 August and the theme of the day was building women entrepreneurship. PetroSA collaborated with ABSA bank and the Industrial Development Corporation (IDC) and interactive sessions were held between PetroSA women and the speakers.
Skills development
During the period under review PetroSA’s training budget was mainly allocated to statutory training and training geared towards improving business performance. This explains the R4 million decrease in training and
TABLE 16 2014 TechnoGirls who have completed a CHIETA training programme
No. Name Status
1. Khati Mamelo Active
2. Lelethu Beko Active
3. Xola Maci Active
4. Athini Ngwanya Active
5. Asanda Qata Active
6. Siyazi Buhle Active
7. Liko Qokela Active
8. Zahraa Samodien Active
9. Skye Adams Active
10. Yusrah Adams Active
11. Romencia Korkee Active
12. Kaylin Kammies Active
TABLE 15 PetroSA’s female talent pipeline for STEM career streams
Names Course Tertiary institution
Siphokazi Dayimane Chemistry UCT
Rasheeka Damon Analytical Chemistry CPUT
Nodi Masayidi Chemical Engineering CPUT
Luyanda Nonjiwu Chemical Engineering CPUT
Ilse Du Plessis Chemical Engineering UCT
Mieshka Majiet Chemical Engineering Stellenbosch University
Keshrie Reddy Chemical Engineering CPUT
Busisiwe Mange BSc in Computer Science UWC
FIGURE 9 PetroSA’s training and development costs for 2015/2016
12
10
8
6
4
2
0
R/M
illio
ns
R1 218 091.03 R2 614 696.25 R– R– R11 192 589.46 R1 550 673.51 R2 775 786.80TOTAL
Study assistance
Bursary Scholarships Secondments Skills development
Travel/ accommodation
Training cost/course

76 | PetroSA Integrated Annual Report 2016
Initially it offered four artisan training programmes. Currently it offers training in seven trades, including: rigging, welding, boiler making, fitting, electrical and instrumentation. All available trades, received full accreditation by the Chemical Industries Education & Training Authority (CHIETA).
The COE’s vision is to be a leading provider of top quality artisans for the petrochemical industry and industry at large. Through this, PetroSA is continually contributing to close the skills shortage gap in the industry and the country as a whole.
development costs compared to the 2014/2015 financial year.
PetroSA Bursary programmeThe intake for PetroSA’s bursary programme consists mainly of HDI students studying towards qualifica-tions in Engineering, Geosciences, Accounting and Economics. The number of bursary students decreased over the year from 31 in April 2015 to 17 in March 2016. All 14 bursars that graduated were released from their contractual obligation.
Graduate in Training (GIT) programmeFollowing the completion of studies, bursary recipients are appointed on two-year fixed-term contracts within PetroSA. At the beginning of 2015/2016 there were 46 GiT’s in PetroSA’s various business units; however by the end of March 2016 only 16 GiT’s were still in the programme.
Skills development grants received from CHIETA for 2015/2016To date PetroSA has received a total of R13 million from CHIETA for its Skills Development programmes. See Figure 10.
The Chemical Industries Education & Training Authority (CHIETA) fundingFigure 11 shows the amounts of discretionary and mandatory grants that were received from CHIETA. These funds are used for various skills development programmes.
Centre of Excellence (COE)
The Centre of Excellence (COE) makes a significant contribution towards addressing the challenges of skills and youth development. PetroSA’s COE, established in 2003 as an artisan provider, has grown remarkably over the past 13 years.
A full Learnership (NQF 2 to 4) stretches over a period of three years and a full Apprenticeship (Phases 1 to 4) over four years. Both include theoretical and practical training. Although PetroSA is the main sponsor, funding is also received from the CHIETA in the form of grants. As at 31 March 2016 there were 218 learners registered at the COE. See Table 16.
Enterprise and Supplier Development (ESD)
The ESD program is an integral part of PetroSA’s business and continues
REVIEW OF THE 2015/2016 FINANCIAL YEAR
TRANSFORMING COMPANY, SECTOR AND SOCIETY/CONTINUED
FIGURE 10 Skills and Youth Development, March 2016
FIGURE 11 Grants received 2015–2016
Apprenticeship Learnership Graduate-in-training
In-service Bursars Techno-girls
100
80
60
40
20
0
93%
47%
16% 5% 17% 12%
Q1 Q2 Q3 Q4
Mandatory R– R1 061 059.14 R385 540.08 R711 284.49
Discretionary R3 562 359.00 R3 595 582.00 R2 947 330.74 R1 424 907.48
5 000 000
4 000 000
3 000 000
2 000 000
1 000 000
0
Ran
d

PetroSA Integrated Annual Report 2016 | 77
to make a meaningful contribution towards building the capacity of PetroSA suppliers and transformation of the Oil and Gas Industry sector. Business development support provided to companies does make a difference in helping to grow and sustain their businesses. In 2015/2016, 13 black owned beneficiaries situated in various provinces including the Western Cape, Eastern Cape, KwaZulu-Natal and Gauteng were supported. Through business mentorship, they receive development support. This varies from marketing, financial management and financial accounting; market access and compliance amongst others and financial support in a form of small grants and loans ranging from R50 000 to R500 000 for purchasing assets such as equipment and technology to advance their businesses.
2015/2016 ESD incubation extensionAn assessment was conducted in November 2015 on the 13 ESD beneficiaries. The results indicated that more work still needs to be done as part of providing business development to the companies. Most, (80%), of the companies needed to receive additional assistance mainly due to the nature of their businesses which is more technical (in the space of engineering and fuel), while others needed to be assisted in putting appropriate financial systems in place and appropriate training. This led to the PetroSA Procurement Committee (PC) approving that the ESD Programme to be rolled over to 2016/2017. It is on this basis that all companies that were part of the 2015 programme will still be beneficiaries for 2016. See Table 17.
Tunnel DawnAs part of promoting local participation through CSI Infrastructure Projects, this 100% Black-owned entity from KwaNonqaba community was awarded a contract to build a sport facility at Imekhaya Primary School in Mossel Bay. Apart from being provided with an ESD loan of R500 000, the Company was also supported in other areas of their business. This included, amongst others, helping them to renew their COIDA certificate; perform an analysis on their project cash flow.
ESD and job creationThe information set out in Table 18 reflects the overall number of job opportunities created by PetroSA as
TABLE 17 ESD 2015/2016 beneficiaries
No. Name Services
1 Uhambo Procurement and Distribution
Safety products and gear, protective clothing and gear
2 Ngaphaya Y2K10 Trading Suppliers of tools and industrial equipment
3 Qualcon Civils Civils construction and maintenance services
4 MDC Arendse Building, civils roads construction and petrochemical plants
5 Eve Travel Travel agency
6 Mazikhule Projects Gardening and Landscaping services
7 Coalition Cabling and Electrical ICT infrastructure, electrical contracting and maintenance
8 Valsar Petroleum Petrochemical wholesaler
9 Kayla Africa Suppliers and Distributors
Supply of chemicals, equipment, consumables safety, hardware
10 Anax Energy Petroleum and oil products
11 Metatrade Import and Export Pipes, pipe fittings, tuning, flanges and industrial valves
12 Massive Quantum Supply chemical raw materials, mechanical and engineering products
13 Sibanye Office Solutions Office consumables and equipment and furniture
TABLE 16 Learners and Apprentices as at 31 March 2016
African Coloured Indian White
Trade M F M F M F M F
Boilermakers 0 0 0 0 0 0 0 0
Electrical 4 2 3 3 0 0 2 0
Fitting 17 9 10 6 1 0 7 0
Rigging 10 7 6 2 0 0 3 0
Turners 2 1 2 1 0 0 2 0
Welders 8 6 10 1 0 0 1 0
Instrumentation 3 3 3 1 0 0 2 0
TOTAL 44 28 34 14 1 0 17 0

78 | PetroSA Integrated Annual Report 2016
REVIEW OF THE 2015/2016 FINANCIAL YEAR
TRANSFORMING COMPANY, SECTOR AND SOCIETY/CONTINUED
Case Study 1 / MDC constructionPetroSA supplier specialising in construction. A technical skills audit was conducted on MDC, following reviews which highlighted concerns regarding the adequacy of their on-site construction supervision skills. The objective of the audit was to assess the competence and identify technical skills gaps in their management capacity, including supervisors. The key findings were that there is good construction experience within MDC supervisory middle management personnel. Also, there has been improvement with regards to invoicing since the interventions were implemented.
Case Study 2 / Qualcon CivilsPetroSA supplier specialising in gardening services and construction has received accredited training covering site management, productivity management, and supervision during this period. The training is aimed at equipping the employees with management skills and supervision of technical work.
Case Study 3 / Eve TravelA 100% Black Women Owned specialist in travel-related services to both corporate and leisure clients. Prior to the ESD interventions, Eve Travel struggled with new business acquisition. The customer-targeting intervention including the introduction of a new interactive website allowed the business to increase the number of corporate clients on their books whilst developing alterative revenue streams through the leisure market. The current ISO 9001:2008 system is being upgraded to comply with ISO 9001:2015 standards.
Enterprise and Supplier Development (ESD) 2015 case study feedback

PetroSA Integrated Annual Report 2016 | 79
PetroSA and ABSAThe PetroSA BEE department in collaboration with Absa enterprise development hosted a one-day seminar with special focus on Finance and Project management for SMMEs in both Cape Town and Mossel Bay. ESD Boot Camps As part of diversifying the ESD program, the concept of hosting an ESD Beneficiaries Boot Camp was introduced. This is intended to provide participants with an interactive learning platform to engage, connect, share, learn and network with their counter-parts, users and mentors. The method also helped in fast tracking the learning process. Two boot camps were organised.
The first boot camp was organised in January 2016 themed ‘Understanding and Engaging with Public Sector’. Topics covered included Introduction and Tender Terminology; The Public Sector System in South Africa; Marketing Opportunities; Golden Rules for Tendering; Know Your Business, and Know Your Market. Organised in February 2016, the second boot camp was themed “Sales and Understanding the corporate supply chain”. Topics covered included how to decide on which customers to focus on; importance of customer targeting and Understanding the Corporate Supply Chain amongst others. Positive feedback was received from participants. This type of intervention will dominate the ESD program for 2017, including training.
part of awarding contracts and ESD support as at 30 September 2015.Other enterprise development initiatives
Enterprise Development ExpoPetroSA continues to participate in the annual Enterprise Development Expo hosted by Smart Procurement in collaboration with ABSA, held from 7 to 8 September 2015 at Gallagher Estate, Johannesburg. Most State Owned Entities do participate and showcase the Black-owned suppliers who are being supported by them as part of their own ESD programme. In this quarter, 10 SMMEs, mainly from Johannesburg and Cape Town, involved in various sectors including Fuel, Engineering and Chemicals (amongst others), were supported to participate in this exhibition. PetroSA covered their exhibition costs whilst participants catered for their own travel and accommodation expenses. The event offers opportunities for SMME’s to meet buyers from a wide range of corporate clients and also to network and learn from their peers.
Women in construction Phase two of the ESD women in construction skills upgrade programme focussed on equipping 10 women entities with financial management skills. Training conducted included the installation and monitoring of a Management Information System (MIS). With this tool in place, suppliers should now be able to handle a broader and more complex range of financial functions, improving their business process efficiencies and accuracy of the data. The next phase will introduce a hands-on approach for women to gaining practical experience from big companies. The ultimate objective is to place women in companies that are already implementing big scale projects and for them to gain exposure and experience that they can later use in their own companies. The full rollout will be in 2017.
ESD Supplier Day: PetroSA hosted an SMME workshop at its premises at both the Parow offices and the GTL Refinery. The objectives of the workshop were to appraise PetroSA’s suppliers on the new requirements of the revised B-BBEE codes, share information on PetroSA ESD initiatives, the procurement offerings and available financial services offered by the Small Enterprise Finance Agency (SEFA).
SMME Market SurveyAn SMME market survey was conducted, focusing on operational entities in the Eden District. The surveys will assist in growing the PetroSA SMME database from the Eden District and assess their level of business competency.
Financial implications
The financial expenditure related to Enterprise and Supplier Development for the 2015/2016 is R9 970 471.
Operation Phakisa Oil and Gas work-stream (C1) PetroSA, through its B-BBEE Department, continues to participate and contribute through the Department of Trade and Industry and Department of Mineral Resources, together with the members of Offshore Petroleum Association of South Africa (OPASA), working under the Operation Phakisa Projects. This falls under the “local content” workstream. The work is intended to develop a strategy that will ensure that black and women-owned local enterprises benefit from the Operation Phakisa initiative. The focus has mainly been around the Offshore Oil and Gas Exploration working group. So far the work output of this group as part of developing the local content roadmap has involved the following three key activities:
• Conduct financial analysis (baseline) of South African offshore oil and gas (O&G) sector procurement. The working group conducted a study
TABLE 18 Number of job opportunities created by PetroSA as part of awarding contracts and ESD support as at 30 September 2015
Company nameService offering (as per scope of work)
Contract duration
Permanent job created
Temp job created (current)
Tunnel Dawn cc Construction of sport facility at Imekhaya Primary School KwaNonqaba in Mossel Bay
6 Months 7 3
MDC Arendse Construction cc
Civil maintenance at the GTL Refinery in Mossel Bay
3 years 57 11
Qualcon Civils Garden maintenance and weed control services at GTL Refinery in Mossel Bay
3 years 40 5
Mazikhule Projects
Garden maintenance and weed control services at PetroSA Parow offices in Cape Town
3 years 11 0
TOTAL 115 19

80 | PetroSA Integrated Annual Report 2016
REVIEW OF THE 2015/2016 FINANCIAL YEAR
TRANSFORMING COMPANY, SECTOR AND SOCIETY/CONTINUED
on product and service categories were sourced from various companies with previous experience on offshore exploration and production projects. PetroSA and OPASA played an important role in coordination and obtaining inputs from its members. This work is being finalised with 80% of it having been completed.
• Set targets for minimum local production and supply in proportion to total domestic upstream O&G value chain spend.
• Establish national enterprise and supplier development and training programme for upstream O&G: supplier database is being developed, building on work already started by SAOGA and to be followed with matching of product and services and last phase verifying supplier capabilities. The work is ongoing.
Preferential procurement
Discretionary procurement:Payments to suppliers of goods and services Expenditure on preferential procurement for the 2015/2016 financial year is listed in Table 19.
The results captured in Table 19 indicate that PetroSA continues to perform well in the area of preferential procurement, with more B-BBEE compliant entities benefiting from tenders allocated. PetroSA has met its B-BBEE procurement spend in the period under review. At the same time, more could be done, but due to challenges being experienced – linked to cost optimisation efforts embarked upon.
Corporate Social Investment (CSI)
PetroSA, subscribes to the principle of good corporate citizenship through its CSI programme, which is aimed at fundamentally improving the lives of historically disadvantaged South Africans.
Since inception, PetroSA has contributed approximately R410 million
towards initiatives aimed at improving the lives of South Africans. These initiatives are spread over four key focus areas; i.e. community develop-ment, education, environmental and sustainable development, and health.
During the 2015/2016 financial year, the Company committed a budget of R60 million towards the execution of such projects.
TABLE 19 Expenditure on preferential procurement for the 2015/2016 financial year
Period Target
Total procurement
spendDiscretionary procurement
BEE procurement
spend
Discretionary procurement
(%)
YTD Actual
56–65% R16 billion R5.33 billion R4.51 billion 84.71%
TABLE 20 The CSI projects for 2015/2016
Project name Current budget
Construction of IeC at Qamata, Eastern Cape R14 500 000
Construction of Asla Park Clinic, Western Cape R14 000 000
Extension of D’Almeida Clinic, Western Cape R3 900 000
Extension of Alma Clinic, Western Cape R3 000 000
New Ablution Facilities and Sports Infrastructure at three schools, Western Cape
R2 353 397
Provision of computer laboratory at Siyazingisa School Project, Western Cape
R1 000 000
Construction of classrooms at Humansdorp School, Eastern Cape
R1 600 000
Construction of classrooms at Maselani Primary, Eastern Cape
R4 000 000
Construction of Greatbak Youth Development Centre, Western Cape
R6 500 000
Upgrading of 22 early childhood education Centres, Western Cape
R1 500 000
Totals R52 353 397

PetroSA Integrated Annual Report 2016 | 81
Education
In the year under review R10.4 million was allocated to this focus area. PetroSA acknowledges the challenges that are facing education in disadvantaged areas in South Africa. Funding from PetroSA ensured that new ablution facilities and sports infrastructure was constructed at three schools located in the Southern Cape. Classrooms were also constructed at two Eastern Cape schools. PetroSA also ensured that it funded the upgrading of 22 early childhood education centres.
Health
In the 2015/2016 financial year PetroSA budgeted R20.9 million for the health focus area.
CASE STUDY
Construction of Asla Park clinic and renovation of Alma and D’Almeida Clinics
During this reporting year, PetroSA has started construction of Asla Park clinic, a R14 million state of the art clinic at KwaNonqaba township, Mossel Bay. The estimated time of completion is November 2016. The clinic will boast children, women, maternal and curative health services. It will ensure the treatment of acute illnesses such as TB, chronic disease management, assessments for disability, occupational and physiotherapy. PetroSA is also renovating other two clinics in the Mossel Bay area, i.e. Alma and D’Almeida.
Community development
PetroSA has budgeted R21 million for this focus area.
CASE STUDY
Youth Café, Great Brak River
PetroSA has committed to fund the construction of a Youth Development Centre costing R6.5 million in Mossel Bay.The choice of a Youth Café is informed by an extensive needs assessments exercise that was undertaken of various Stake-holders, including the Mossel Bay municipality, Government authorities and communities. It is envisaged that the Café will provide the youth of the area with development skills.
The construction of the Youth Café commenced in May 2016, and it is expected to be completed in November 2016.
CASE STUDY
Qamata Integrated Energy Centre
PetroSA has committed to fund the construction of the Qamata IeC to the value of R14.5 million. An IeC. is a one-stop energy center owned and operated by a community through a community appointed Cooperative. it provides energy solutions to
communities, access to affordable safe and sustainable energy services, information and awareness on how to handle and utilise energy sources, such as paraffin and LPG.
As construction is underway, approximately 15 temporary jobs have been created. After completion in December 2016, an initial number of 14 permanent jobs (IeC. Manager, 4 cashiers, petrol attendants and cleaners), will be created. Other supplementary projects include a car wash and computer laboratory.

82 | PetroSA Integrated Annual Report 2016
INSPIRING CHANGE. CREATING POSSIBILITIES.

PetroSA Integrated Annual Report 2016 | 83
FINANCIAL PERFORMANCE
The Petroleum Oil and Gas Corporation of South Africa SOC Ltd

84 | PetroSA Integrated Annual Report 2016
FINANCIAL PERFORMANCE
General Information
The Petroleum Oil and Gas Corporation of South Africa SOC LtdConsolidated and Separate Financial Statements for the year ended 31 March 2016
Country of incorporation and domicile South Africa
Nature of business and principal activities Exploration for and production of oil and gas, refining operations, converting gas and gas condensate to liquid fuels and petrochemicals and the marketing thereof.
Directors Mr BW Ngubane Mr W Steenkamp Mr O Tobias Ms J Ntwane Mr S Mthethwa Mr MW Mkhize Dr BDC Makhubela Mr MF Baleni Mr TB Hlongwa Mr TI Rakgoale
Registered office 151 Frans Conradie Drive Parow 7500
Postal address Private Bag X5 Parow 7499
Holding company CEF SOC Limited incorporated in South Africa
Auditors Auditor-General of South Africa Registered Auditors Secretary Ms X Mpongoshe
Company registration number 1970/008130/07
Level of assurance These consolidated and separate financial statements have been audited in compliance with the applicable requirements of the Companies Act, 71 of 2008.
These financial statements were internally prepared and supervised by: Mr JP Rhode CA(SA) (Group Financial Manager) and Mr WZ Fanadzo (FCMA) (Acting Group Chief Financial Officer). Published 29 July 2016.

PetroSA Integrated Annual Report 2016 | 85
Index
The reports and statements set out below comprise the consolidated and separate financial statements presented to the shareholder:
Page
Directors’ responsibilities and approval 86
Performance against objectives 87–94
Directors’ Report 95–99
Report of the Board Audit Committee 100–101
Statement of the Company Secretary 102
Statements of financial position 103
Statements of profit or loss and other comprehensive income 104
Statements of Changes in Equity 105
Statements of Cash Flows 106
Accounting policies 107–122
Notes to the consolidated and separate financial statements 123–160
The following supplementary information does not form part of the consolidated and separate financial statements and is unaudited:
Fields in production and under development 161
Definition of financial terms 162–170

86 | PetroSA Integrated Annual Report 2016
FINANCIAL PERFORMANCE
Audited Annual Financial Statementsfor the year ended 31 March 2016
Directors’ responsibilities and approval
The directors are required to maintain adequate accounting records and are responsible for the content and integrity of the consolidated and separate financial statements and related financial information included in this report. It is their responsibility to ensure that the consolidated and separate financial statements fairly present the state of affairs of the group as at the end of the financial year and the results of its operations and cash flows for the period then ended, in conformity with International Financial Reporting Standards. The external auditors are engaged to express an independent opinion on the consolidated and separate financial statements.
The consolidated and separate financial statements are prepared in accordance with International Financial Reporting Standards and are based upon appropriate accounting policies consistently applied and supported by reasonable and prudent judgements and estimates.
The directors acknowledge that they are ultimately responsible for the system of internal financial control established by the group and place considerable importance on maintaining a strong control environment. To enable the directors to meet these responsibilities, the board of directors sets standards for internal control aimed at reducing the risk of error or loss in a cost effective manner. The standards include the proper delegation of responsibilities within a clearly defined framework, effective accounting procedures and adequate segregation of duties to ensure an acceptable level of risk. These controls are monitored throughout the group and all employees are required to maintain the highest ethical standards in ensuring the group’s business is conducted in a manner that in all reasonable circumstances is above reproach. The focus of risk management in the group is on identifying, assessing, managing and monitoring all known forms of risk across the group. While operating risk cannot be fully eliminated, the group endeavours to minimise it by ensuring that appropriate infrastructure, controls, systems and ethical behaviour are applied and managed within predetermined procedures and constraints.
The directors are of the opinion, based on the information and explanations given by management, that the system of internal control provides reasonable assurance that the financial records may be relied on for the preparation of the consolidated and separate financial statements. However, any system of internal financial control can provide only reasonable, and not absolute, assurance against material misstatement or loss.
The directors have reviewed the group’s cash flow forecast for the year to 31 March 2017 and, in light of this review and the current financial position, they are satisfied that the group has or has access to adequate resources to continue in operational existence for the foreseeable future. Nothing significant has come to the attention of the directors to indicate that any material breakdown has occurred in the functioning of these controls, procedures and systems during the year under review.
In the opinion of the directors, based on the information available to date, the annual financial statements fairly present the financial position of PetroSA and the group at 31 March 2016 and the results of its operations and cash flow information for the year then ended.
The external auditors are responsible for independently auditing and reporting on the group’s consolidated and separate financial statements in terms of the Companies Act 71 of 2008. The consolidated and separate financial statements have been examined by the group’s external auditors and their report is presented on pages X to X.
The consolidated and separate financial statements set out on pages XX to XX, which have been prepared on the going concern basis, were approved by the board of directors on 29 July 2016 and were signed on its behalf by:
___________________________ ___________________________ Director Director
Johannesburg 29 July 2016

PetroSA Integrated Annual Report 2016 | 87
Performance against objectives
A summary of The Petroleum Oil And Gas Corporation of South Africa SOC Ltd company business performance against objectives is contained in the table below:
Objective Key performance indicator Target ActualPerformance results
1
TR
AN
SFO
RM
AT
ION
To meet transformational initiatives
1.1 To implement new organisational plan/structure
31 March 2016 Implementation of the new organisational structure was deferred in order to take into consideration outputs from Project Apollo.
Not achived
1.2 Identify and implement policies that support cost optimisation and transformation
31 March 2016 25% of policies implemented Not achieved
1.3 To ensure a 60% preferential procurement target
56%–65% 84.7% Achieved
1.4 To implement enterprise supplier development plan
2% of net profit after tax
–2.1% Not achieved
2
FIN
AN
CE
To optimise profitability through revenue enhancement and/or cost reduction
2.1 To develop capital allocation model
Model developed by 30 June 2015
Capital allocation model developed by 29 June 2015
Achieved
2.2 To optimise cashflow returns Sabor –15bps to Sabor +15bps
Sabor + 50bps Achieved
2.3 To manage revenues and optimise costs in line with the BillionPlus target of R1 billion in savings
Maintain R1 billion in savings
17.3% savings Achieved
3 S
TAK
EH
OLD
ER
S To obtain the appropriate stakeholder support
3.1 To develop and implement stakeholder strategy with regard to state participation, Project Irene, Project Mthombo, LNG
70%–80% Stakeholder strategy was developed and approved by the Board. In terms of implementation less than 60% was achieved.
Not achieved
4
INT
ER
NA
L B
US
INE
SS
P
RO
CE
SS
ES
4.1 SHEQ
4.1.1 LTIFR =/<0.4 0.425 Not achieved
4.1.2 Environmental incidents 6 7 Not achieved
4.1.3 Occupational hygiene survey
80%–85% medical surveillance and documented health risk assessments
85% medical surveillance and documented Health Risk Assessments.
Achieved

88 | PetroSA Integrated Annual Report 2016
FINANCIAL PERFORMANCE
Audited Annual Financial Statementsfor the year ended 31 March 2016
Performance against objectives (continued)
Objective Key performance indicator Target ActualPerformance results
4.1 SHEQ
4
INT
ER
NA
L B
US
INE
SS
PR
OC
ES
SE
S
4.1.4 Quality Retain certification +90% of internal quality audits completed
Retained certification; 54.9% of audits completed against plan.
Not achieved
4.1.5 Process safety 80%–84% performance on dashboard
67.5% Not achieved
4.1.6 Risk Index rating of 3 Divisional Risk Profile updated on CURA, signed off by the Vice President and presented to the Executive Management Insurance Committee as being accurate and complete. Five key divisional controls identified and 90% tested for effectiveness and reported to EMAC.
Achieved
4.2 Sustainability
4.2.1 Total indigenous GTL refinery production and F-O
6.799 MMbbls 5.068 MMbbls Not achieved
4.2.2 Execute the LNG project – commence pre-FEED (Saldanha)
Appoint the pre-FEED Contractor, and commence with pre-FEED studies by end of Q2 and finalise the pre-FEED study by end Q4
Pre-FEED contractor was not appointed and the pre-FEED studies were not initiated.
Not achieved
4.2.3 To develop approved options for the Mossel Bay refinery
Initiate the next project phase for the selected option by March 2016
Liquid Fuel Project has been put on hold pending the outcome of the sustainability programme development.
Not achieved
4.2.4 Ikhwezi development executed on schedule according to approved development plan
3 wells producing gas to the refinery by 30 June 2015 not exceeding budget of US$1344 million
2 wells are producing gas to the refinery and not exceeding budget of US$ 1 344 million.
Not achieved
4.2.5 To develop gas to power options
Submit business case for gas to power project by 31 March 2016
Business case for gas to power project was not submitted by 31 March 2016.
Not achieved

PetroSA Integrated Annual Report 2016 | 89
Objective Key performance indicator Target ActualPerformance results
4
INT
ER
NA
L B
US
INE
SS
PR
OC
ES
SE
S
4.3 Growth initiatives
4.3.1 To enter the downstream market
4.3.1.1 To review and update the downstream entry strategy
Review and update the downstream strategy and seek Board approval in line with PetroSA’s corporate strategy by March 2016
Board approval for the updated strategy was obtained on 18 Feb 2016 with the recommendation that the project team proceed with the submission of an Expression of Interest in respect of the target bid process.
Achieved
4.3.1.2 To ensure a net margin for downstream business
3% 4.03% Achieved
4.3.1.3 To commercialise the logistics base
Logistics business model approved by 31 December 2015
Logistics business model was not approved by 31 December 2015.
Not achieved
4.3.2 To grow the upstream resource base, reserves and production for long- term profitability
4.3.2.1 Board resolution on Upstream partnership strategies
31 March 2016 Board approval for both West and South Coast farm-out/partnership strategies is in place. Data rooms were held and completed by 31 March 2016.
Achieved
4.3.2.2 State allocation to PetroSA
Develop a business case and engage with 50% of the Stakeholders as per the Stakeholder Engagement Plan by 31 March 2016
Business case was not developed but not submitted to EXCO. Draft stakeholder engagement plan was developed and engaged with some stakeholders. DOE support not obtained yet.
Achieved
4.3.2.3 FEED initiated for next Feedstock development project – EBK
FEED 100% complete by 31 March 2016
Feasibility study for EBK was completed by 31 March 2016.
Not achieved

90 | PetroSA Integrated Annual Report 2016
FINANCIAL PERFORMANCE
Audited Annual Financial Statementsfor the year ended 31 March 2016
1. Transformation
1.1 Implement a new organisational plan/structureThe target is to ensure that the newly created or approved positions at the Executive (EXCO) and Management (i.e. Levels 3 & 4) levels are filled by March 2016.
Actual: The implementation of the new organisational structure was deferred in order to take into consideration outputs from Project Apollo initiated by CEF.
1.2 Identify and implement policies that support cost optimisation and transformation The purpose is to ensure that 70% of the Identified Policies are implemented by 31 March 2016.
Actual: 25% of the policies that support cost optimisation and transformation were implemented.
1.3 Ensure a 60% preferential procurement targetIn terms of the BBBEE codes of good practice, certain expenditure may be excluded from total procurement. The target is 60% of generic spent (local and foreign).
Actual: The preferential procurement spend for the period under review was 84.7% versus a target of 60%.
1.4 Implement enterprise supplier development planContribute towards the growth and sustainability of local enterprises and suppliers (current and potential suppliers and customers) through support development initiatives. The target was 2% of net profit after tax (NPAT) spent towards supplier development.
Actual: –2.1% of NPAT was achieved against a target of 2% of NPAT. Enterprise Supplier Development spend for the period under review was R9.3 million.
2. Finance
Optimise profitability through revenue enhancement and/or cost reduction
2.1 Develop capital allocation modelThe target is to develop a capital allocation model by the 30 June 2015. The model will prioritise projects that will be pursued by PetroSA based on current strategy and cash constraints.
Actual: The capital allocation model was developed by 29 June 2015.
2.2 Optimise cashflow returnsThe target is to achieve South African Benchmark Overnight Rate (Sabor) –15bps to Sabor +15bps.
Actual: Achieved Sabor + 50 bps.
2.3 Manage revenues and optimise costs in line with the BillionPlus target of R1 billion in savingsThis measure encourages cost savings – a target of R1 billion based on BillionPlus ideas in IL3 and above at December 2014 which have been included in the budget.
Actual: A cost saving of 17.3% was achieved in the period under review.
Performance against objectives (continued)
PetroSA Integrated Annual Report 2016 | 91
3. Managing stakeholders
Obtain the appropriate stakeholder support
3.1 Develop and implement stakeholder strategyContribute towards ensuring stakeholder support for key projects in line with the approved company strategy. The 2015/2016 financial year will focus on state participation, survival and sustainability elements of the strategy.
Actual: The stakeholder strategy was developed and approved by the Board in May 2015. In terms of implementation, less than 60% of stakeholder engagement was achieved.
4. Internal business processes
4.1 SHEQIt must be noted that a single fatality had occurred at the refinery in September 2015, hence the default rating for SHEQR is 1.
4.1.1 The Lost Time Injury Frequency Rate (LTIFR)This refers to the safety performance of the company. The Lost Time Injury Frequency Rate is calculated on the basis of a rolling 12-month formula as follows:
DIFR = NUMBER OF LOST TIME INJURIES X 200 000 (HOURS) NO. OF HOURS WORKED (DURING PERIOD UNDER REVIEW)
A lost time injury is defined as a work-related injury including occupational illness arising out and in course of duty giving rise to any related temporary or permanent disablement or death as determined by a medical practitioner.
Actual: For the period under review, there were thirteen (13) lost time incidents (LTIs) across the organisation. The LTIFR for the period under review was 0.425 against the targeted LTIFR of <0.4.
4.1.2 Environmental incidentsThis refers to the environmental performance of the company. In the corporate scorecard, an environmental incident is an event which has a localised effect, environmental damage beyond the fence boundary; substantiated community complaint; permit exceedance or non-compliance.
In the absence of any organisation we know of in our industry that has defined an environmental incident same way as us, we have had to do the benchmarking internally by way of identifying historical incidents that PetroSA has had that fit the revised definition of an environmental incident.
Actual: There were seven (7) environmental incidents reported during the period under review.
4.1.3 Occupational hygiene surveyIn terms of the South African health and safety legislation PetroSA must conduct occupational hygiene surveys to determine the health hazards employees might be or are exposed to and put in place an annual medical surveillance programme. A medical or occupational health surveillance programme will be used as a measure for determining interventions/improvements in employee health. This KPI seeks to measure the percentage of employees who have undergone medical surveillance against the year-plan.
Actual: 1 855 medicals were conducted versus a target of 2 178. This translates to 85% completion for the period under review.

92 | PetroSA Integrated Annual Report 2016
FINANCIAL PERFORMANCE
Audited Annual Financial Statementsfor the year ended 31 March 2016
4.1.4 QualityPetroSA’s Quality Management System is currently certified under ISO9001:2008. The target is to retain ISO 9001 certification and complete 90% of internal quality audits against plan.
Actual: The organisation retained its ISO certification + 45 audits were completed against 82 plan which translates to 54.9%.
4.1.5 Process safetyThis refers to Process Safety Management (PSM) performance as expressed in the PSM Dashboard. There are 41 KPIs in the Dashboard with targets covering the 13 PSM Elements.
Actual: The dashboard score achieved on process safety management was 67.5%.
4.1.6 RiskThe target is to ensure that the divisional risk profiles (DRP) are updated on CURA, signed off by the respective Vice President and presented to the Executuve Management Assurance Committee (EMAC) as being accurate and complete together with 5 key divisional controls identified and 80% tested for effectiveness and reported to EMAC.
The DRP was updated on CURA, signed off by the respective Vice President and presented to EMAC as being accurate and complete. Five key divisional controls were identified and 90% tested for effectiveness and reported to EMAC.
4.2 Sustainability
4.2.1 Total indigenous GTL refinery production and F-OTotal indigenous GTL refinery production + F-O (6.799 Mbbls), this exclude indigenous import feedstock and blendstock.
Actual: Total indigenous production for the period under review was 5.068 MMbbls versus a target of 6.799 MMbbls.
4.2.2 Execute the LNG project – commence pre-FEED (Saldanha)The liquified natural gas (LNG) project supports the development of 2400 MW of Gas-to-Power generation capacity by 2020. A feasibility study, recommending a land-based terminal in the Port of Saldanha, was completed in the 2014/2015 financial year.
The target for Q2 was to appoint the pre-FEED contractor and commence with pre-FEED studies. The pre-FEED will take 18 months. The target for Q4 was to finalise the pre-FEED study, (scheduled to be concluded by end of Q2 2016/2017 financial year).
Actual: Approval to commence FEED was not obtained and therefore the pre-FEED study was not initiated.
4.2.3 Develop approved options for the Mossel Bay refineryPetroSA is considering different options to secure the short to medium term operation of the Mossel Bay site for the period 2018–2021. The target is to initiate the next project phase for the selected option by 31 March 2016.
Actual: The liquid fuels project has been put on hold pending the outcome of sustainability programme development.
4.2.4 Ikhwezi development executed on schedule according to approved development planThe target is to ensure that three (3) wells are producing gas to the refinery by 30 June 2015 and not exceeding the budget of US$1 344 million.
Actual: Two wells produced gas to the refinery by 31 July 2015 instead of the targeted 3 wells and the budget of US$ 1 344 million was not exceeded. Project close-out activities are continuing.
Performance against objectives (continued)

PetroSA Integrated Annual Report 2016 | 93
4.2.5 Develop gas to power optionsThe objective of this project is to improve feedstock supply reliability and to reduce the cost of feedstock to the Gourikwa power plant. In addition, it provides PetroSA with a second revenue source which can operate beyond the gas feedstock cut-off point for the GTL refinery. The target is to submit a business case for the gas to power project by 31 March 2016.
Actual: The business case for the gas to power project was not submitted by 31 March 2016. No allocation of gas was provided to the gas to power project due to the prioritization of the gas supply for the sustainability of the refinery. The project is in the process of being closed out.
4.3 Growth initiatives
4.3.1 Downstream market entry
4.3.1.1 Review and update the downstream entry strategyThe target is to review and update the downstream strategy and seek board approval in line with PetroSA’s corporate strategy.
Actual: The downstream strategy was reviewed, updated and submitted to the Board. Board approval was obtained on the 18 February 2016 with the recommendation that the project team proceed with the submission of an Expression of Interest in respect of the target bid process.
4.3.1.2 Ensure a net margin for downstream businessThe target is to ensure a Net Margin Target equivalent to a 3% margin but excludes margin from manufactured product. Initiatives for margin improvement are captured through the Billion Plus Project.
Actual: A 4.03% net margin was achieved for the period under review.
4.3.1.3 Commercialise the logistics basePetroSA will consider the expansion of its logistics base for both Upstream and Downstream to provide additional services to PetroSA and other companies. This initiative forms part of PetroSA’s growth strategy and further seeks to support the South African government’s Operation Phakisa. The target is to have an approved business model for the logistics base by 31 December 2015.
Actual: The logistics business model was not approved by 31 December 2015.
4.3.2 Grow production and reserve base for long term profitability
4.3.2.1 Board resolution on Upstream partnership strategiesActual: In December 2015, the Board approved the West and South Coast farm-out/partnership strategies. Data rooms were held and completed by 31 March 2016.
4.3.2.2 State allocation to PetroSAActual: Business case was developed but not submitted to EXCO.Draft stakeholder engagement plan was also developed and engaged with some stakeholders. DOE support not obtained yet.
4.3.2.3 FEED initiated for next Feedstock development ProjectActual: The feasibility study for EBK was completed at end March 2016. The plan is to commence approval process to enter FEED in May 2016.

94 | PetroSA Integrated Annual Report 2016
FINANCIAL PERFORMANCE
Audited Annual Financial Statementsfor the year ended 31 March 2016
Directors’ Report
1. Directors
The directors present their report that forms part of the annual financial statements for the group for the year ended 31 March 2016.
The directors of the company from the approval of the previous report to the date of this report are as follows:
Name Appointed Resigned/Term expired
Mr BW Ngubane Non-executive (Interim Chairperson)
Ms NN Nokwe Executive – Group CEO 01 November 2015
Mr S Mokoena Non-executive 31 December 2015
Mr D Hlatshwayo Non-executive 19 June 2015
Ms GN Jiyane Non-executive 27 July 2015
Mr W Steenkamp Non-executive
Mr O Tobias Non-executive
Ms J Ntwane Non-executive
Mr S Mthethwa Non-executive (acting Group CEO)
Mr MW Mkhize Non-executive 01 July 2016
Dr BDC Makhubela Non-executive 14 September 2015
Mr MF Baleni Non-executive 14 September 2015
Mr TB Hlongwa Non-executive 14 September 2015
Mr TI Rakgoale Non-executive 15 January 2016
Ms L Bakoro Executive – Group CFO 30 November 2015

PetroSA Integrated Annual Report 2016 | 95
Attendance at meetings Board Board AuditHuman Capital
Strategy & Growth
Risk & Compliance
Social & Ethics Ad hoc^ Ad hoc^^
Mr BW Ngubane1 19/22 7/7 N/A 1/1 2/2 N/A N/A N/A
Ms NN Nokwe N/A N/A N/A N/A N/A N/A N/A N/A
Mr S Mokoena 20/22 7/8 N/A 5/6 1/1 N/A 9/9 3/3
Mr D Hlatshwayo 4/4 N/A N/A N/A 1/1 1/1 N/A N/A
Ms GN Jiyane 10/10 N/A N/A 2/2 1/1 N/A 1/1* N/A
Mr W Steenkamp2 20/22 7/8 7/7 N/A N/A 1/1 6/9 N/A
Mr O Tobias3 16/22 N/A 5/7 5/6 3/4 N/A 1/1* N/A
Ms J Ntwane4 21/22 N/A 7/7 N/A N/A 4/4 6/9 N/A
Mr S Mthethwa 17/22 N/A N/A 5/6 N/A N/A 9/9 N/A
Mr MW Mkhize 19/22 N/A 2/7 2/6 N/A 3/4 N/A 2/3
Dr BCE Makhubela 7/10 N/A N/A N/A 2/2 2/2 N/A 3/3
Mr MF Baleni 9/10 N/A 3/3 N/A N/A 2/2 N/A 3/3
Mr TB Hlongwa5 5/10 2/2 N/A N/A 1/2 N/A N/A N/A
Mr TI Rakgoale 1/1 1/1 N/A N/A N/A N/A N/A N/A
Ms L Bakoro 9/9 1/1* N/A 1/1* 1/1 N/A 1/1* N/A
Ms MM Modipa** 12/12 3/3* 7/7* 5/5* 3/3* 4/4* 2/2 N/A
Mr WZ Fanadzo*** 11/11 2/2* N/A 5/5* 3/3* 2/3* 1/1 N/A
NA = Not applicable* = Invitee** = Acting Group CEO (resigned 30 June 2016)*** = Acting Group CFO
1 = Chairperson of Board Committee2 = Chairperson of Human Capital Committee3 = Chairperson of Strategy & Growth Committee4 = Chairperson of Social & Ethics Committee5 = Chairperson of Board Audit Committee^ = Board Adhoc committee for company turnaround^^ = Board Adhoc committee for SNG implementation

96 | PetroSA Integrated Annual Report 2016
FINANCIAL PERFORMANCE
Audited Annual Financial Statementsfor the year ended 31 March 2016
Directors’ Report (continued)
2. Secretary
Ms X Mpongoshe is the secretary of the company. Her business and postal addresses are as follows:
Business address 151 Frans Conradie Drive Parow 7500
Postal address Private Bag X5 Parow 7449
3. Nature of business
ActivitiesThe main areas of activity within the group during the year are as follows:
• To focus on projects aimed at sustaining the GTL refinery through the securing of long-term feedstock and cash-flow maximisation;
• To ensure security of supply, growth of the group and increase its share of the local market;• To deliver sustainable development of the economy and communities through the targeting of skills development,
the implementation of Enterprise and Supplier Development programmes and the investment in social upliftment programmes of targeted groups through Corporate Social Investment programmes; and
• To ensure adherence to world class environmental, safety, health and quality standards.
ObjectivesThe key elements/objectives of PetroSA’s core business strategy are as follows:
• Ensure security of supply of liquid fuels for the country;• Be a competitive, commercially viable company on a sustained basis along the value chain for the petroleum, oil,
gas and petrochemical sectors;• To achieve transformation on a continuous basis through the implementation of Employment Equity and Broad
Based Black Economic Empowerment policies;• Operate PetroSA in line with best international practices with regard to safety, product quality, and protection of
the environment and health of the people employed by the company; and• Actively contribute to macro-economic objectives related to the fuel price to the end user, security of supply and
reduction of exposure to foreign exchange requirements.
4. Holding company
The company’s holding company is CEF SOC Limited incorporated in South Africa and the ultimate shareholder is the South African Government. All shares held by the Government in CEF are not transferable in terms of the Central Energy Fund Act (Act No. 37 of 1977).
5. Annual general meeting
The annual general meeting will be held in terms of section 61 of the Companies Act 71 of 2008.
6. Subsidiaries and associates
The PetroSA group structure has remained relatively stable and is mostly driven by the company’s pursuit of exploration and production opportunities in Africa and elsewhere in line with the company’s objectives. The companies within the group are subsidiaries whose existence is driven by business needs.

PetroSA Integrated Annual Report 2016 | 97
6. Subsidiaries and associates (continued)
PetroSA Equatorial Guinea holds a 75% participating interest in Block Q in Equatorial Guinea. The remaining 25% of the participating interest is held by GEPetrol, the Equatorial Guinea’s National Oil Company. The expiry date for the licence has been extended to December 2014. On 20 May 2015, the PetroSA Equatorial Guinea Board resolved to terminate all activities and close the branch in Equatorial Guinea. The closure is underway.
7. Group financial results and operating activities
The group experienced a challenging financial year, with production volumes as well as sales volumes not living up to the expectations of the corporate plan and the price of crude falling by 44% year-on-year.
The group achieved an operating profit before impairment of property, plant and equipment (onshore and offshore production assets) of R0.3 billion (2015: R0.1 billion). A net loss of R0.5 billion (2015: R14.6 billion loss) was recorded for the year.
Revenue decreased by 13% from R18 billion to R15.7 billion. The negative revenue variance is attributable to the lower Brent crude price. The fall in the Brent crude oil affected the group negatively across all operational units, necessitating the total impairment of the Oribi/Oryx crude oil production division. The impairment was largely due to an increase in the rand value of the dollar-based cost of provision for abandonment, emanating from the weakness of the rand against the dollar (28% weaker).
Cost of sales amounted to R14.2billion, R2.8 billion less than the prior year. This was due to lower feedstock cost at the GTL plant, lower than expected semi-fixed costs and distribution costs which are in line with lower sales volumes. Lower cost of sales in PetroSA Ghana has also contributed to this reduction. Other operating expenses were lower at R1.6 billion as a result of the lower impairment charge of R0.3 billion compared to R14.4 billion in the prior year.
Continued cost-containment efforts remain a key focus area across the organisation. This is all amidst a major crash in crude oil prices resulting in a very unstable business environment. On the GTL front, the pessimistic prediction of reduced Project Ikhwezi gas remains a major concern insofar as it impacts planned production and liquidity management.
8. Authorised and issued share capital
Details of the share capital of the company are set out in note 12 to the consolidated and separate financial statements.
9. Subsequent events
On 29 February 2016, PetroSA Ghana Limited drew down US$10 million from its Reserve Based Lending Facility. A second draw down of US$ 15 million was made on 29 April 2016. The available facility amount/borrowing base is redetermined six monthly at the end of June and December and is a function of the present value of future cash flows generated by producing/developing assets. The available facility amount is most sensitive to economic assumptions such as the Brent crude oil price and changes to independently audited oil reserves. No short term portion could be determined at year end hence no disclosure has been made in the financial statements.
The agreement for a loan facility of US$ 60 million was signed between PetroSA Ghana Limited and PetroSA on 20 June 2016. An amount of US$ 17.7 million has been drawn down to date.
The directors are not aware of any matters or circumstances arising since the end of the financial year, not otherwise dealt with in the financial statements which significantly affect the financial position of the group or the result of the operations.

98 | PetroSA Integrated Annual Report 2016
FINANCIAL PERFORMANCE
Audited Annual Financial Statementsfor the year ended 31 March 2016
10. Dividends
No dividends were declared to the shareholder during the year.
11. Materiality and significant framework
A materiality and significant framework has been developed for reporting losses through criminal conduct and irregular, fruitless and wasteful expenditure, as well as for significant transactions envisaged per section 54(2) of the PFMA that require ministerial approval. The framework was finalised after consultation with the external auditors and has been formally approved by the Board.
During the year, SARS conducted an integrated VAT audit and raised an assessment of R0.4 million. The penalties were waived but not the interest.
PetroSA was also charged interest of R0.087 million on the late payment of an invoice.
12. Going concern
The directors believe that the group and company will continue as a going concern in the year ahead. Despite of the diminished reserves outlook as reported in these financial statements, the company does not intend to liquidate or cease trading. There are long term sustainability plans under development for the GTL plant and related offshore assets. The purchased product trading and PetroSA Ghana activities are unaffected and continue to expand.
13. Funding of abandonment/rehabilitation provision
At year-end the company had an obligation to rehabilitate and abandon its offshore and onshore facilities valued at R10.7 billion, which is currently not fully funded. Given that PetroSA has set aside R1.9 billion there is an identified projected shortfall of approximately R8.8 billion in PetroSA’s closure financial provision. As per the approved corporate plan the gap would be funded over time in line with the expected maturity of the liability. However, in terms of the financial provision regulations which were promulgated under the National Environmental Management Act 107 of 1998, PetroSA is required to review, assess and adjust its financial provision within the next 12 months from year-end. PetroSA will accordingly need to update the financial provisioning and associated plans for PetroSA in accordance with these regulations during the course of 2016, whereafter such funds will need to be immediately available. Such an update will require the review, assessment and adjustment of an annual rehabilitation plan, final rehabilitation, decommissioning and mine closure plan and an environmental risk assessment report. Therefore, there are current challenges with funding the current shortfall (approximated at R8.8 billion at year-end) from equity due to PetroSA’s weakened financial position which has emanated from depleting feedstock, the limited success of Project Ikhwezi and the significant decline in crude oil prices. It is likely that the R10.7 billion will increase as the scope of what is required has now been expanded to include reporting with regard to (i) on-going concurrent environmental remediation (ii) closure and decommissioning and (iii) post closure liability for unforeseen or unknown liability that may arise in the future. PetroSA has appointed technical advisors, Reverse Engineering Services Limited to undertake the review and assessment of the abandonment liability in order to enable PetroSA to adjust its financial provision.
PetroSA has up until February 2017 to undertake a more adequate assessment of the quantum and plug the current and ‘future’ deficit using acceptable financing vehicles, including making the necessary arrangements in accordance with NEMA and the Financial Provision Regulations. PetroSA and the Board of Directors are working with all the key stakeholders to ensure compliance with the requirements of the financial provision regulations come February 2017. To this extent the holding company (CEF) has committed to assist PetroSA, through various support and oversight mechanisms, to close the funding gap. In addition, PetroSA is working closely with the regulator (the Petroleum Agency of South Africa) to ensure that PetroSA discharges its responsibilities as required under the NEMA financial provision regulations. Other key stakeholders involved include the Departments of Energy, National Treasury, Mineral Resources and Environmental Affairs.
Directors’ Report (continued)

PetroSA Integrated Annual Report 2016 | 99
14. Appointment of the auditors
PetroSA being a state owned company must have its financial statements audited by the Auditor-General of South Africa (AG) in terms of the Constitution of the Republic of South Africa and the Public Audit Act of 2004, and that the AG must be re-appointed each year at the AGM of the company as required by the Companies Act 71 of 2008.
_________________________ _________________________ Director Director
Johannesburg 29 July 2016

100 | PetroSA Integrated Annual Report 2016
FINANCIAL PERFORMANCE
Audited Annual Financial Statementsfor the year ended 31 March 2016
Report of the Board Audit Committee
The Board Audit Committee has formal terms of reference that are reviewed and approved by the board on an annual basis. The Committee has discharged its responsibilities in compliance with its terms of reference and as required by the Companies Act 71 of 2008.
1. Responsibilities
The Committee consists of three independent non-executive directors, elected by the shareholder at each annual general meeting (AGM). The Board appointed the Chairman of the Committee, an independent non-executive director. The Group Chief Executive Officer, Group Chief Financial Officer, Chief Audit Executive, Chief Risk and Compliance Officer and External Auditors are permanent invitees to the committee meetings. Four meetings were held during the year; directors’ attendances at these meetings are set out on page XX of the annual financial statements. Two directors were appointed to the Committee during the latter half of the year under review. Their appointments will be ratified by the shareholder at the next AGM. The performance of the newly formed Committee was not assessed for the year under review.
The Committee performed the following duties during the year in accordance with section S94(7) of the Companies Act 71 of 2008:
• concurred the quantum of fees to be paid to the auditors and the auditor’s terms of engagement;• determined the nature and extent of any non-audited services;• prepared a report, to be included in the annual financial statements for the financial year;• made submissions to the board on matters concerning the company’s accounting policies, financial control,
records and reporting; and• performed other oversight functions determined by the board.
The Committee is responsible for overseeing the external audit process and confirms that the external auditors are independent of the company and conducted its audit without influence from the company. The Committee and the chairman meet with the external auditors independently of management.
The Committee is responsible for overseeing the Internal Audit function, preserving its independence and ensuring that it has the necessary resources and authority to enable it to fulfil its duties. The Chief Audit Executive reports functionally to the Committee and has met with the committee independently of management. The Committee annually reviews and approves the internal audit coverage plan and reviews the performance of the internal audit function on a quarterly basis.
The Committee has reviewed the expertise, competence and experience of the Finance function. Based on the self- assessment performed, the Committee is satisfied that the Group Chief Financial Officer and the finance management team have the appropriate expertise and experience.
Combined Assurance has not been successfully implemented during the year; the Committee will focus its attention on enhancing an effective combined assurance approach in the year ahead.
The Committee has reviewed the written assessment performed by Internal Audit on the design, implementation and effectiveness of internal financial controls and risk management of the company.

PetroSA Integrated Annual Report 2016 | 101
Internal Audit were unable to express an opinion on the adequacy and effectiveness of the internal financial controls and the associated governance and risk management processes for the financial year ended 31 March 2016 because:
• Management did not provide a formal list of key financial controls for testing that are relevant to the business and financial information presented in the annual financial statements;
• Management did not implement an appropriately resourced key financial controls process that allows for the performance of self-assessments, central co-ordination of evidence of tests performed, monitoring, reporting, escalation and timely resolution of control failures; and
• There is no evidence that key financial controls were tested by management for the period ending March 2016.
Based on the results of the review and after considering the results of external audit, internal financial controls were assessed as …
Enterprise risk management is assessed as requiring Material Opportunities for Improvement due to the business (1st line of defense) having failed to fully implement, embrace and embed the risk management process.
The Committee reviewed the assessment of the going concern premise of the group and concurs that the group will be a going concern for the foreseeable future.
Having reviewed and evaluated the Annual Financial Statements of the group for the year ended 31 March 2016, the members of the Board Audit Committee are satisfied that the financial statements fairly present the state of affairs of the company, its business, financial results, performance against predetermined objectives and its financial position at the end of the financial year and conclude that they comply, in all material respects, with the requirements of the Companies Act 71 of 2008 and the Public Finance Management Act.
2. Legal and regulatory compliance
The Board Audit Committee recommended the adoption of the Annual Financial Statements and the Annual Report by the board of directors at their meeting on XXX
_________________________________ T Hlongwa
Chairperson 29 July 2016

102 | PetroSA Integrated Annual Report 2016
FINANCIAL PERFORMANCE
Audited Annual Financial Statementsfor the year ended 31 March 2016
Statement of the Company Secretary
In my capacity as company secretary, I hereby certify, in terms of section 88(2)(e) of the Companies Act of 2008, that the company has lodged with the Commissioner all such returns and notices as are required of a company in terms of the Companies Act, and that all such returns are, to the best of my knowledge, true, correct and up to date.
_________________________________ Ms X Mpongoshe
29 July 2016

PetroSA Integrated Annual Report 2016 | 103
Statements of financial position
GROUP COMPANY
Note(s)2016R’000
2015R’000
2016R’000
2015R’000
Assets
Non-current Assets
Property, plant and equipment 2 8 808 154 7 620 145 2 185 491 3 413 198
Intangible assets 3 1 775 111 1 654 727 1 314 299 1 228 715
Investments in subsidiaries 4 – – 3 520 347 3 214 194
Joint arrangements 5 – – 29 625 29 625
Other financial assets 7 1 990 969 391 747 1 846 798 306 922
Amounts held by holding company 8 489 021 489 021 489 021 489 021
13 063 255 10 155 640 9 385 581 8 681 675
Current Assets
Inventories 9 1 981 547 2 203 655 1 946 359 2 180 978
Trade and other receivables 10 2 185 767 3 122 408 2 140 523 3 044 267
Cash and cash equivalents 11 3 689 584 4 349 053 3 493 303 3 759 866
7 856 898 9 675 116 7 580 185 8 985 111
Total Assets 20 920 153 19 830 756 16 965 766 17 666 786
Equity and Liabilities
Equity
Share capital 12 2 755 936 2 755 936 2 755 936 2 755 936
Foreign currency translation reserve 835 580 381 822 (293) (435)
Retained income 544 686 999 208 747 422 1 506 763
4 136 202 4 136 966 3 503 065 4 262 264
Liabilities
Non-current Liabilities
Other financial liabilities 13 1 201 244 865 496 – –
Deferred tax 14 1 337 529 953 137 – –
Provisions 15 11 134 886 9 673 784 10 784 375 9 383 113
13 673 659 11 492 417 10 784 375 9 383 113
Current Liabilities
Current tax payable 4 300 4 349 – –
Trade and other payables 16 2 612 731 3 862 165 2 185 065 3 686 550
Provisions 15 76 059 48 098 76 059 48 098
Bank overdraft 11 417 202 286 761 417 202 286 761
3 110 292 4 201 373 2 678 326 4 021 409
Total Liabilities 16 783 951 15 693 790 13 462 701 13 404 522
Total Equity and Liabilities 20 920 153 19 830 756 16 965 766 17 666 786

104 | PetroSA Integrated Annual Report 2016
FINANCIAL PERFORMANCE
Audited Annual Financial Statementsfor the year ended 31 March 2016
Statements of profit or loss and other comprehensive income
GROUP COMPANY
Note(s)2016R’000
2015R’000
2016R’000
2015R’000
Revenue 17 15 733 652 18 048 631 15 063 072 17 212 076
Cost of sales (14 191 754) (17 005 355) (13 645 341) (16 260 698)
Gross profit 1 541 898 1 043 276 1 417 731 951 378
Other income 99 892 93 906 101 410 94 114
Operating expenses (1 608 066) (15 688 578) (2 042 497) (13 850 840)
Operating profit/(loss) 18 33 724 (14 551 396) (523 356) (12 805 348)
Investment revenue 19 326 813 408 925 265 424 688 509
Finance costs 20 (511 952) (1 305 744) (496 000) (1 297 546)
Loss before taxation (151 415) (15 448 215) (753 932) (13 414 385)
Taxation 21 (297 698) 874 432 – –
Loss for the year (449 113) (14 573 783) (753 932) (13 414 385)
Other comprehensive income:
Items that will not be reclassified to profit or loss:Remeasurements on net defined benefit liability/asset (5 409) (924) (5 409) (924)
Items that may be reclassified to profit or loss:Exchange differences on translating foreign operations 453 758 239 275 142 (370)
Other comprehensive income (loss) for the year net of taxation 448 349 238 351 (5 267) (1 294)
Total comprehensive loss for the year (764) (14 335 432) (759 199) (13 415 679)

PetroSA Integrated Annual Report 2016 | 105
Statements of changes in equity
Share capital
Share premium
Total share capital
Foreign currency
translation reserve
Retained income
Total equity
R’000 R’000 R’000 R’000 R’000 R’000
GROUP
Balance at 01 April 2014 2 2 755 934 2 755 936 142 547 15 573 915 18 472 398
Changes in equity
Loss for the year – – – – (14 573 783) (14 573 783)
Other comprehensive income – – – 239 275 (924) 238 351
Balance at 01 April 2015 2 2 755 934 2 755 936 381 822 999 208 4 136 966
Changes in equity
Loss for the year – – – – (449 113) (449 113)
Other comprehensive income/(loss) – – – 453 758 (5 409) 448 349
Balance at 31 March 2016 2 2 755 934 2 755 936 835 580 544 686 4 136 202
Note(s) 12 12 12
COMPANY
Balance at 01 April 2014 2 2 755 934 2 755 936 (65) 14 922 072 17 677 943
Changes in equity
Loss for the year – – – – (13 414 385) (13 414 385)
Other comprehensive income – – – (370) (924) (1 294)
Balance at 01 April 2015 2 2 755 934 2 755 936 (435) 1 506 763 4 262 264
Changes in equity
Loss for the year – – – – (753 932) (753 932)
Other comprehensive loss – – – 142 (5 409) (5 267)
Balance at 31 March 2016 2 2 755 934 2 755 936 (293) 747 422 3 503 065
Note(s) 12 12 12

106 | PetroSA Integrated Annual Report 2016
FINANCIAL PERFORMANCE
Audited Annual Financial Statementsfor the year ended 31 March 2016
Statements of Cash Flows
GROUP COMPANY
Note(s)2016R’000
2015R’000
2016R’000
2015R’000
Cash flows from operating activities
Cash generated by operations 22 2 092 461 3 470 966 1 418 719 2 746 419
Interest income 326 813 408 925 265 424 624 074
Dividends received – – – 64 435
Finance costs (3 030) (15 349) (3 030) (15 116)
Tax refunded 23 86 645 35 594 – –
Net cash from operating activities 2 502 889 3 900 136 1 681 113 3 419 812
Cash flows from investing activities
Purchase of property, plant and equipment 2 (2 070 302) (5 782 255) (461 990) (4 964 464)
Sale of property, plant and equipment 2 34 769 19 249 34 769 19 248
Purchase of intangible assets 3 (53 798) (120 114) (42 316) (105 449)
Sale of intangible assets 3 186 (108) – –
Movement of other financial assets (1 599 222) 1 660 416 (1 542 843) 2 230 191
Net cash from investing activities (3 688 367) (4 222 812) (2 012 380) (2 820 474)
Cash flows from financing activities
Movement of other financial liabilities 335 748 (725 554) – (1 591 050)
Net cash from financing activities 335 748 (725 554) – (1 591 050)
Cash and cash equivalents movement for the year (849 730) (1 048 230) (331 267) (991 712)
Cash and cash equivalents at the beginning of the year 4 062 292 5 101 575 3 473 105 4 522 962
Effect of exchange rate movement on cash balances 59 820 8 947 (65 737) (58 145)
Cash and cash equivalents at end of the year 11 3 272 382 4 062 292 3 076 101 3 473 105
PetroSA Integrated Annual Report 2016 | 107
Accounting Policies
1. Presentation of annual financial statements
The following are the principal accounting policies used by the group which are, in all material respects, consistent with those applied in the previous year, except as otherwise indicated.
1.1 Basis of preparationThe consolidated and separate financial statements are prepared under the historical cost basis, except where otherwise specified. The consolidated and separate annual financial statements are prepared in accordance with IFRS and the Companies Act of 2008.
These consolidated and separate financial statements are presented in South African Rands. Rounding is to the nearest Rand in thousands. The consolidated and separate financial statements are prepared on the going concern basis.
Assets and liabilities or income and expenditure will not be offset, unless it is required or permitted by a standard.
1.2 Basis of consolidationThe consolidated and separate financial statements incorporate the consolidated and separate financial statements of the group and enterprises controlled by the group at 31 March each year.
Control is achieved where the entity:• has power over the investee;• is exposed, or has rights, to variable returns from its involvement in the investee; and• has the ability to use its power to affect its returns.
The group re-assesses whether or not it controls an investee if facts and circumstances indicate that there are changes to one or more of the three elements of control.
Consolidation of a subsidiary begins when the group obtains control over the subsidiary and ceases when the group loses control. Assets, liabilities, income and expenses of subsidiaries acquired or disposed of during the year are included in the consolidated financial statements from the date the group gains control until the date it ceases to control the subsidiary.
Where necessary, adjustments are made to the consolidated and separate financial statements of subsidiaries to bring the accounting policies used in line with the group accounting policies.
All significant inter-entity transactions, unrealised profit and losses and balances between group enterprises are eliminated on consolidation.
The most recent audited consolidated and separate financial statements of associates, joint ventures and subsidiaries are used where available, which are all within three months of the year-end of the group. Adjustments are made to the financial results for material transactions and events in the intervening period.
Consolidated financial statementsBusiness combinationsBusiness combinations are accounted for using the acquisition method. The cost of the business combination is measured as the aggregate of the fair values (at the date of acquisition) of assets given, liabilities incurred or assumed and equity instruments issued by the group in exchange for control of the acquiree. Acquisition related costs are expensed as incurred. The acquiree’s identifiable assets, liabilities and contingent liabilities that meet the conditions for recognition under IFRS 3: Business Combinations are recognised at their fair values at the acquisition date.

108 | PetroSA Integrated Annual Report 2016
FINANCIAL PERFORMANCE
Audited Annual Financial Statementsfor the year ended 31 March 2016
Accounting Policies (continued)
Business combinations (continued)The consideration transferred includes the fair value of any asset or liability resulting from a contingent consideration arrangement. Any contingent consideration to be transferred by the acquirer is recognised at fair value at the acquisition date. Subsequent changes to the fair value of the contingent consideration that is deemed to be an asset or liability is recognised in profit or loss or as a change to other comprehensive income. Contingent consideration that is classified as equity is not re-measured, and its subsequent settlement is accounted for within equity.
Goodwill is calculated as the excess of the sum of a) fair value of consideration transferred, b) the recognised amount of any non-controlling interest in the acquiree and c) acquisition-date fair value of any existing equity interests in the acquiree over the acquisition-date fair values of net identifiable assets. If, after reassessment, the group’s interest in the net fair value of the acquiree’s identifiable assets, liabilities and contingent liabilities exceeds the cost of the business combination, the excess is recognised immediately in profit or loss. After initial recognition, goodwill is measured at cost less any accumulated impairment losses.
The group treats transactions with non-controlling interests as transactions with equity owners of the group. For purchases from non-controlling interests, the difference between any consideration paid and the relevant share acquired of the carrying value of net assets of the subsidiary is recorded in equity. Gains or losses on disposals to non-controlling interests are also recorded in equity.
When the group ceases to have control, any retained interest in the entity is remeasured to its fair value, with the change in carrying amount recognised in profit or loss. The fair value is the initial carrying amount for the purposes of subsequently accounting for the retained interest as a joint arrangement or financial asset. In addition, any amounts previously recognised in other comprehensive income in respect of that entity are accounted for as if the group had directly disposed of the related assets or liabilities. This may mean that amounts previously recognised in other comprehensive income are reclassified to profit or loss.
Joint arrangementsJoint venturesThe results and assets and liabilities of joint ventures are incorporated in the financial statements by using the equity method of accounting. The aggregate of the group’s share of profit or loss of a joint venture is shown on the face of the statement of profit or loss outside operating profit and represents profit or loss after tax and non-controlling interests in the subsidiaries of the joint venture.
Under the equity method, investments in joint ventures are carried in the consolidated Statement of Financial Position at cost as adjusted for post-acquisition changes in the group’s share of the net assets of the joint ventures, less any impairment in the value of individual investments. Losses of a joint venture in excess of the group’s interest in that joint ventures (which includes any long-term interests that, in substance, form part of the group’s net investment in joint ventures) are recognised only to the extent that the group has incurred legal or constructive obligations or made payments on behalf of the entity.
After application of the equity method, the group determines whether it is necessary to recognise an impairment loss on its investment in its joint venture. At each reporting date, the group determines whether there is objective evidence that the investment in the joint venture is impaired. If there is such evidence, the group calculates the amount of impairment as the difference between the recoverable amount of the joint venture and its carrying value, and then recognises the loss as ‘share of profit of a joint venture’ in the statement of profit or loss.
If the ownership interest is reduced but significant influence is retained, only a proportionate share of the amounts previously recognised in other comprehensive income are reclassified to profit or loss where appropriate.
Upon loss of joint control over the joint venture, the group measures and recognises any retained investment at its fair value. Any difference between the carrying amount of the joint venture upon loss of joint control and the fair value of the retained investment and proceeds from disposal is recognised in profit or loss.

PetroSA Integrated Annual Report 2016 | 109
Joint operationsWhen the group undertakes its activities under a joint operation, the group as joint operator recognises in relation to its interest in the joint operation its assets, including its share of any assets held jointly; its liabilities, including its share of any liabilities incurred jointly; its revenue from the sale of its share of the output of the joint operation; its share of the revenue from the sale of the output by the joint operation; and its expenses, including its share of any expenses incurred jointly.
The group accounts for assets, liabilities, revenues and expenses relating to its interest in joint operations in accordance with applicable IFRS’.
1.3 Translation of foreign currencies
TransactionsForeign currency transactions are recognised, initially in Rand by applying the foreign currency amount to the exchange rate between the Rand and the foreign currency at the date of the transaction, and is restated at each reporting date by using the ruling exchange rate at that date.
Statement of financial positionAt each reporting date:
• foreign currency monetary items are measured using the closing rate;• non-monetary items, which are carried in terms of historical cost denominated in a foreign currency, are reported
using the exchange rate at the date of the transaction; and• non-monetary items which are carried at fair value denominated in a foreign currency are reported using the
exchange rates that existed when the values were determined.
Exchange differencesExchange differences arising on the settlement of monetary items or on reporting a company’s monetary items at rates different from those at which they were initially recorded during the period, or reported in previous consolidated and separate financial statements, are recognised as income or expenses in the period in which they arise.
Exchange differences that relate to borrowing and cash and cash equivalents are presented in the statement of profit or loss finance costs and investment income.
Foreign entitiesIn translating the financial statements of a foreign entity for incorporation in the group financial statements, the following is applied:
(a) The assets and liabilities, both monetary and non-monetary, of the foreign entity are translated at the closing exchange rate at the financial year end date.
(b) Income and expense items of the foreign entity are translated at the weighted average rates of exchange for the year.(c) All resulting exchange differences are taken directly to the foreign currency translation reserve which is classified
as a non-distributable reserve. On disposal the related amount in this reserve will be recognised in profit or loss.
1.4 Comparative figuresComparative figures are restated in the event of a change in accounting policy or prior period error.
1.5 Property, plant and equipmentProperty, plant and equipment represent tangible items that are held for use in the production or supply of goods or services, for rental to others, or for administrative purposes and are expected to be used during more than one period.
110 | PetroSA Integrated Annual Report 2016
FINANCIAL PERFORMANCE
Audited Annual Financial Statementsfor the year ended 31 March 2016
Carrying amountsAll property, plant and equipment are stated at cost less accumulated depreciation and accumulated impairment losses.
CostCost includes all costs directly attributable to bringing the assets to the working condition for their intended use. Improvements are capitalised. Maintenance, repairs and renewals which neither materially add to the value of assets nor appreciably prolong their useful lives are charged against income.
Expenditure on major maintenance refits, inspections or repairs comprises the cost of replacement assets or parts of assets, inspection costs and overhaul costs. Where an asset, or part of an asset that was separately depreciated and is now written off is replaced and it is probable that future economic benefits associated with the item will flow to the group, the expenditure is capitalised. Where part of the asset replaced was not separately considered as a component and therefore not depreciated separately, the replacement value is used to estimate the carrying amount of the replaced asset(s) and is immediately written off. Inspection costs associated with major maintenance programmes are capitalised and amortised over the period to the next inspection. All other day-to-day repairs and maintenance costs are expensed as incurred.
DerecognitionThe carrying amount of an item of property, plant and equipment is derecognised on disposal or when no future economic benefits are expected from its use.
Gains or losses on disposal of property, plant and equipment are determined by reference to their carrying amount. The gain or losses arising from derecognition of an item of property, plant and equipment is included in operating profit or loss.
DepreciationDepreciation is charged so as to write off the depreciable amount of the assets, other than land, over their estimated useful lives to estimated residual values, using the straight line method or other acceptable method to write off the cost of each asset that reflects the pattern in which the asset’s future economic benefits are expected to be consumed by the entity.
Where significant parts of an item have different useful lives to the item itself, these parts are depreciated over their estimated useful lives.
The following methods and rates are used during the year to depreciate property, plant and equipment to estimated residual values:
Item Average useful life Land Not depreciated Buildings 40 yearsFurniture, fittings and communication equipment 3–15 years Motor vehicles 10–12 years Computer equipment 3–5 years Shutdown costs 3–5 years Restoration costs Units of production
Improvements to leased premises are written off over the period of the lease.
The methods of depreciation, useful lives and residual values are reviewed annually.
Accounting Policies (continued)

PetroSA Integrated Annual Report 2016 | 111
Production assets (oil and gas fields)Oil and gas production assets are the aggregated exploration and evaluation tangible assets, and development expenditure associated with the production of proved reserves.
Subsequent expenditure which enhances or extends the performance of oil and gas production assets beyond their original specifications is recognised as capital expenditure and added to the original cost of the asset.
Production assets are depreciated over their expected useful lives. This applies from the date production commences, on a unit of production basis, which is the ratio of oil and gas production in the period to the estimated quantities of proved and probable reserves at the end of the period plus the production in the period, on a field-by- field basis. Costs used in the unit of production calculation comprise the net book value of capitalised costs plus the estimated future field development costs required to recover the commercial reserves remaining. Unit of production rates are based on the proved and probable developed reserves, which are oil, gas and other mineral reserves estimated to be recoverable from existing facilities using current operating methods. Changes in the estimates of commercial reserves or future field development costs are dealt with prospectively.
Where there has been a change in economic conditions that indicates a possible impairment in a discovery field, the recoverability of the net book value relating to that field is assessed by comparison with the estimated discounted future cash flows based on management’s expectations of future oil and gas prices and future costs. Where there is evidence of economic interdependency between fields, such as common infrastructure, the fields are grouped as a single cash generating unit for impairment purposes.
Any impairment identified is charged to profit or loss. Where conditions giving rise to impairment subsequently reverse, the effect of the impairment charge is also reversed as a credit to profit or loss, net of any depreciation that would have been charged since the impairment.
Restoration costsCost of property, plant and equipment also includes the estimated costs of dismantling and removing the assets and site rehabilitation costs.
Estimated decommissioning and restoration costs are based on current requirements, technology and price levels. Provision is made for all net estimated abandonment costs as soon as an obligation to rehabilitate the area exists, based on the present value of the future estimated costs. These costs are deferred and are depreciated over the useful life of the assets to which they relate using the unit of production method based on the same reserve quantities as are used for the calculation of depletion of oil and gas production assets.
The amount recognised is the estimated cost of restoration, discounted to its net present value, and is reassessed each year in accordance with local conditions and requirements. Changes in the estimated timing of decommissioning or decommissioning cost estimates are dealt with prospectively by recording an adjustment to the provision, and a corresponding adjustment to property, plant and equipment. The unwinding of the discount on the restoration provision is included as a finance cost.
1.6 Exploration, evaluation and development of oil and gas wellsThe “successful efforts” method is used to account for natural oil and gas exploration, evaluation and development activities.
Under the successful efforts method, only those costs that lead directly to the discovery, acquisition, or development of specific discrete mineral reserves are capitalised and become part of the capitalised costs of the cost centre. Costs that are known to fail to meet this criterion (at the time of incurrence) are generally charged to the statement of profit or loss as an expense in the period they are incurred.

112 | PetroSA Integrated Annual Report 2016
FINANCIAL PERFORMANCE
Audited Annual Financial Statementsfor the year ended 31 March 2016
Pre-licensing costsThese are costs incurred prior to the acquisition of a legal right to explore for oil and gas. They may include speculative seismic data and subsequent geological and geophysical analysis of this data, but may not be exclusive to such costs. These costs are expensed in the year they are incurred.
Exploration and evaluation costsAll costs relating to the acquisition of licences, exploration and evaluation of a well, field or exploration area are initially capitalised. Directly attributable administration costs and interest payable are capitalised insofar as they relate to specific development activities.
These costs are not depreciated but written off as exploration costs in profit or loss unless commercial reserves have been established or the determination process has not been completed and there are no indications of impairment.
Assets pending determinationExploratory wells that discover potentially commercial reserves are capitalised pending a decision to further develop or a firm plan to develop has been approved. These are continuously assessed for impairment. If no such plan or development exists or information is obtained that raises doubt about the economic or operating viability then an impairment is recognised. If a plan or intention to further develop these wells or fields exists, the costs are transferred to development costs.
Commercial reservesCommercial reserves are proven and probable oil and gas reserves, which are defined as the estimated quantities of crude oil, natural gas and natural gas liquids which geological, geophysical and engineering data demonstrate with a specified degree of certainty to be recoverable in future years from known reservoirs and which are considered commercially producible. There should be a 50 per cent statistical probability that the actual quantity of recoverable reserves will be more than the amount estimated as proven and probable reserves and a 50 per cent statistical probability that it will be less.
Development costsCosts of development wells, platforms, well equipment and attendant production facilities are capitalised. The cost of production facilities capitalised includes finance costs incurred until the production facility is completed and ready for the start of the production phase. All development wells are not depreciated until production starts and then they are depreciated on the unit of production method calculated using the estimated proved and probable reserves.
Dry wellsGeological and geophysical costs, as well as all other costs relating to dry exploratory wells costs are recognised in profit or loss in the year they are incurred.
1.7 Intangible assetsAn intangible asset is an identifiable non-monetary asset without physical substance.
Intangible assets are initially recognised at cost less accumulated amortisation and accumulated impairment, if acquired separately or internally generated or at fair value if acquired as part of a business combination. If assessed as having a finite useful life, it is amortised over its useful life using a straight line basis and tested for impairment if there is an indication that it may be impaired.
Research costs are recognised in profit or loss when incurred.
Development costs are capitalised only if they result in an asset that can be identified, it is probable that the asset will generate future economic benefits and the development cost can be reliably measured. Otherwise it is recognised in profit or loss.
Accounting Policies (continued)

PetroSA Integrated Annual Report 2016 | 113
Purchased software and the direct costs associated with the customisation and installation thereof are capitalised. The following rates are used during the year to amortise intangible assets to estimated residual values:
Item Useful lifePatents Validity period of the patentSoftware 3 –5 years
1.8 Impairment of financial assets
Non-derivative financial assetsA financial asset is assessed at each reporting date to determine whether there is objective evidence that it is impaired. A financial asset is impaired if there is objective evidence of impairment as a result of one or more events that occurred after the initial recognition of the asset, and that loss event(s) had an impact on the estimated future cash flows of that asset that can be estimated reliably.
Objective evidence that financial assets are impaired includes default or delinquency by a debtor, restructuring of an amount due to the group on terms that the group would not consider otherwise, indications that a debtor or issuer will enter bankruptcy, adverse changes in the payment status of borrowers or issuers, economic conditions that correlate with defaults or the disappearance of an active market for a security. Significant financial difficulties of the debtor, probability that the debtor will enter bankruptcy or financial reorganisation, and default or delinquency in payments (more than 30 days overdue) are considered indicators that the trade receivable is impaired.
Financial assets measured at amortised costThe group considers evidence of impairment for financial assets measured at amortised cost (loans and receivables) at both a specific asset and collective level. All individually significant assets are assessed for specific impairment. Those found not to be specifically impaired are then collectively assessed for any impairment that has been incurred but not yet identified. Assets that are not individually significant are collectively assessed for impairment by grouping together assets with similar risk characteristics.
In assessing collective impairment, the group uses historical trends of the probability of default, the timing of recoveries and the amount of loss incurred, adjusted for management’s judgement as to whether current economic and credit conditions are such that the actual losses are likely to be greater or lesser than suggested by historical trends.
An impairment loss in respect of a financial asset measured at amortised cost is calculated as the difference between its carrying amount and the present value of the estimated future cash flows discounted at the asset’s original effective interest rate. Losses are recognised in profit or loss and reflected in an allowance account against loans and receivables or held to maturity investment securities. Interest on the impaired asset continues to be recognised.
When an event occurring after the impairment was recognised causes the amount of impairment loss to decrease, the decrease in impairment loss is reversed through profit or loss.
1.9 Impairment of non–financial assetsAt each reporting date, the group reviews the carrying amounts of its tangible and intangible assets to determine whether there is any indication that those assets may be impaired. If such indication exists, the recoverable amount of the asset is estimated in order to determine the extent of the impairment loss (if any). Where it is not possible to estimate the recoverable amount for an individual asset, the recoverable amount is determined for the cash generating unit to which the asset belongs. Value in use is estimated taking into account future cash flows, forecast market conditions and the expected lives of the assets discounted by the pre-tax weighted average cost of capital.

114 | PetroSA Integrated Annual Report 2016
FINANCIAL PERFORMANCE
Audited Annual Financial Statementsfor the year ended 31 March 2016
1.9 Impairment of non–financial assets (continued)If the recoverable amount of an asset (or cash generating unit) is estimated to be less than its carrying amount, its carrying amount is reduced to the higher of its recoverable amount and zero. Impairment losses are recognised in profit or loss. Subsequent to the recognition of the impairment loss, the depreciation or amortisation charge for the asset is adjusted to allocate its remaining carrying value, less any residual value, over its remaining useful life.
If an impairment loss is subsequently reversed, the carrying amount of the asset (or cash generating unit) is increased to the revised estimate of its recoverable amount but limited to the carrying amount that would have been determined had an impairment loss not been recognised in prior years. A reversal of an impairment loss is recognised in profit or loss.
1.10 LeasesRentals payable under operating leases are recognised in profit or loss on a straight line basis over the term of the relevant lease where significant or another basis if more representative of the time pattern of the user’s benefit.
When an operating lease is terminated before the lease period has expired, any payment required to be made to the lessor by way of penalty is recognised as an expense in the period in which termination takes place.
Contingent rentals are recognised in profit or loss as they accrue.
1.11 Inventories
Trading inventoryFinished and intermediate inventory is measured at the lower of cost and net realisable value according to the standard costing method. Cost includes production expenditure, depreciation and a proportion of triennial turnaround expenses and replacement of catalysts, as well as transport and handling costs. Provision is made for obsolete, slow moving and defective inventories.
Spares, catalysts and chemicalsThese inventories are measured at the lower of cost on a weighted average cost basis and net realisable value less appropriate provision for obsolescence in arriving at the net realisable value. Any inventories which meet the definition of property, plant and equipment are reclassified accordingly.
1.12 Financial instruments
RecognitionFinancial assets and financial liabilities are recognised on the group and company’s Statement of Financial Position when the group and company becomes a party to the contractual provisions of the instrument.
Financial instruments recognised on the Statement of Financial Position include cash and cash equivalents, trade and other receivables, foreign exchange contracts, trade and other payables and borrowings.
MeasurementFinancial assets and liabilities are initially measured at fair value. Transaction costs that are directly attributable to the acquisition or issue of financial assets and financial liabilities (other than financial assets and financial liabilities at fair value through profit or loss) are added to or deducted from the fair value of the financial assets and financial liabilities, as appropriate, on initial recognition. Transaction costs that are directly attributable to the acquisition or issue of financial assets and financial liabilities at fair value through profit or loss are immediately recognized in profit or loss.
Purchases or sales of financial assets that require delivery of assets within a time frame established by regulation or convention in the market place (regular way trades) are recognised on the trade date, i.e., the date that the group commits to purchase or sell the asset.
Accounting Policies (continued)

PetroSA Integrated Annual Report 2016 | 115
Subsequent measurementFor purposes of subsequent measurement financial assets are classified in four categories: Financial assets at fair value through profit or loss; loans and receivables; held-to-maturity investments and available for sale financial assets. The classification depends on the purpose for which the financial assets were acquired. Management determines the classification of its financial assets at initial recognition.
Financial assetsThe group financial assets have been classified as follows:
a) Financial assets at fair value through profit or lossFinancial assets at fair value through profit or loss are financial assets held for trading. A financial asset is classified in this category if acquired principally for the purpose of selling in the short term. Derivatives are also categorised as held for trading unless they are designated as hedges. Assets in this category are classified as current assets if expected to be settled within 12 months, otherwise they are classified as non-current. Financial assets at fair value through profit or loss are carried in the statement of financial position at fair value with net changes in fair value presented in operating costs in the statement of profit or loss. The group’s forward exchange contracts are classified as at fair value through profit or loss.
b) Loans and receivablesLoans and receivables are non-derivative financial assets with fixed or determinable payments that are not quoted in an active market. The effective interest method is a method of calculating the amortised cost of a financial asset or liability and of allocating interest over the relevant period. Amortised cost is calculated by taking into account any discount or premium on acquisition and fees or costs that are an integral part of the effective interest method. Loans and receivables are included in current assets, except for maturities greater than 12 months after the end of the reporting period. These are classified as non-current assets. This category applies to loans (note 7), trade and other receivables (note 10) and cash and cash equivalents (note 11).
The group does not have any financial assets classified as held to maturity and available for sale.
Cash and cash equivalentsCash and cash equivalents comprise cash at bank and on hand and instruments which are readily convertible to known amounts of cash and are subject to an insignificant risk of change in value. Cash and cash equivalents are stated at amortised cost which is deemed to be the fair value.
Financial liabilitiesFinancial liabilities are subsequently measured at fair value through profit or loss if held for trading. This category also includes derivative financial instruments entered into by the group.
Trade and other payablesTrade and other payables are initially measured at fair value and subsequently measured at amortised cost.
BorrowingsAfter initial recognition, interest-bearing loans and borrowings are subsequently measured at amortised cost using the effective interest rate (EIR) method. Gains and losses are recognised in profit or loss when the liabilities are derecognised as well as through the effective interest rate amortisation process.
Amortised cost is calculated by taking into account any discount or premium on acquisition and fees or costs that are an integral part of the effective interest rate. The effective interest rate amortisation is included as finance costs in the statement of profit or loss.
This category generally applies to interest-bearing loans and borrowings. For more information refer to note 13.

116 | PetroSA Integrated Annual Report 2016
FINANCIAL PERFORMANCE
Audited Annual Financial Statementsfor the year ended 31 March 2016
DerecognitionA financial asset (or, where applicable, a part of a financial asset or part of a group of similar financial assets) is primarily derecognised (i.e., removed from the group’s consolidated statement of financial position) when:
• the rights to receive cash flows from the asset have expired or• the group has transferred its rights to receive cash flows from the asset or• the group has assumed an obligation to pay the received cash flows in full without material delay to a third party
under a ‘pass-through’ arrangement; and either (a) the group has transferred substantially all the risks and rewards of the asset, or (b) the group has neither transferred nor retained substantially all the risks and rewards of the asset, but has transferred control of the asset.
When the group has transferred its rights to receive cash flows from an asset, it evaluates if and to what extent it has retained the risks and rewards of ownership. When it has neither transferred nor retained substantially all of the risks and rewards of the asset, nor transferred control of the asset, the group continues to recognise the transferred asset to the extent of the group’s continuing involvement. In that case, the group also recognises an associated liability.
The transferred asset and the associated liability are measured on a basis that reflects the rights and obligations that the group has retained.
Continuing involvement that takes the form of a guarantee over the transferred asset is measured at the lower of the original carrying amount of the asset and the maximum amount of consideration that the group could be required to repay.
A financial liability is derecognised when the obligation under the liability is discharged or cancelled or expires. When an existing financial liability is replaced by another from the same lender on substantially different terms, or the terms of an existing liability are substantially modified, such an exchange or modification is treated as the derecognition of the original liability and the recognition of a new liability. The difference in the respective carrying amounts is recognised in the statement of profit or loss.
Fair value considerationsFor financial reporting purposes, fair value measurements are categorised into level 1, 2 or 3 based on the degree to which the inputs to the fair value measurements are observable and the significance of the inputs to their fair value measurement in its entirety, are described as follows:
a) Level 1 inputs are quoted prices (unadjusted) in active markets for identical assets or liabilities that the group can access at measurement date;
b) Level 2 inputs are inputs, other than quoted prices included in Level 1, that are observable for the asset or liability, either directly or indirectly; and
c) Level 3 inputs are unobservable for the asset or liability.
Fair value is the price that would be received to sell an asset or paid to transfer a liability in an orderly transaction between market participants at the measurement date, regardless of whether that price is directly observable or estimated using another valuation technique. In estimating the fair value of an asset or a liability, the Group takes into account the characteristics of the asset or liability if market participants would take those characteristics into account when pricing the asset or liability at the measurement date. The group uses valuation techniques that are appropriate in the circumstances and for which sufficient data are available to measure fair value, maximising the use of relevant observable inputs and minimising the use of unobservable inputs.
The fair values at which financial instruments are carried at the reporting date have been determined using available market prices. Where market prices are not available, fair values have been calculated by discounting expected future cash flows at prevailing interest rates. The carrying amounts of financial assets and financial liabilities with a maturity of less than one year are assumed to approximate their fair values due to the short term trading cycle of these items.
Accounting Policies (continued)

PetroSA Integrated Annual Report 2016 | 117
OffsettingFinancial assets and financial liabilities are offset and the net amount is reported in the consolidated statement of financial position if there is a currently enforceable legal right to offset the recognised amounts and there is an intention to settle on a net basis, to realise the assets and settle the liabilities simultaneously. The legally enforceable right must not be contingent on future events and must be enforceable in the normal course of business and in the event of default, insolvency or bankruptcy of the company or the counterparty.
1.13 Post-employment benefit costs
Defined contribution costsThe group operates a defined contribution plan, the assets of which are held in a separate trustee administered fund. The plan is funded by payments from the group, and takes into account the recommendations of independent qualified actuaries.
Contributions to a defined contribution plan in respect of service in a particular period are recognised as an expense in that period.
Defined benefit costsPost employment health care benefits are provided to certain retirees. The entitlement to post retirement health care benefits is based on the eligible employees remaining in service up to retirement age. These benefits are funded. The cost of providing benefits under a defined benefit plan is determined using a projected unit credit valuation method. The liability recognized in the statement of financial position is the present value of the defined benefit obligation at the end of the reporting period less the fair value of plan assets.
Remeasurements, comprising of actuarial gains and losses, the effect of the asset ceiling, excluding amounts included in net interest on the net defined benefit liability and the return on plan assets (excluding amounts included in net interest on the net defined benefit liability), are recognised immediately in the statement of financial position with a corresponding debit or credit to retained earnings through OCI in the period in which they occur. Remeasurements are not reclassified to profit or loss in subsequent periods.
Past service costs are recognised in profit or loss on the earlier of the date of the plan amendment or curtailment and the date that the group recognises related restructuring costs
Net interest is calculated by applying the discount rate to the net defined benefit liability or asset. The group recognises the following changes in the net defined benefit obligation in the statement of profit or loss:
• Service costs comprising current service costs, past-service costs, gains or losses on curtailments and non- routine settlements
• Net interest expense or income
1.14 ProvisionsProvisions represent liabilities of uncertain timing or amount.
Provisions are recognised when a present legal or constructive obligation exists, as a result of past events, for which it is probable that an outflow of economic benefits will be required to settle the obligation, and a reliable estimate can be made for the amount of the obligation.
Provisions are measured at the expenditure required to settle the present obligation. Where the effect of discounting is material, provisions are measured at their present value using a pre-tax discount rate that reflects the current market assessment of the time value of money and the risks for which future cash flow estimates have not been adjusted. The increase in the provision due to passage of time is recognised as an interest expense.

118 | PetroSA Integrated Annual Report 2016
FINANCIAL PERFORMANCE
Audited Annual Financial Statementsfor the year ended 31 March 2016
1.14 Provisions (continued)Provision for the cost of environmental and other remedial work such as reclamation costs, close down and restoration costs is made when such expenditure is probable and the cost can be estimated with a reasonable range of possible outcomes.
1.15 Share capital and equityOrdinary shares are classified as equity. An equity instrument is any contract that evidences a residual interest in the assets of an entity after deducting all its liabilities.
1.16 Revenue recognitionRevenue is measured at the fair value of the consideration received or receivable, and represents the amount receivable for goods supplied, net of discounts, returns and VAT. Revenue from the sale of oil and petroleum products is recognised when the significant risks and rewards of ownership have been transferred, which is considered to occur when title passes to the customer. This generally occurs when the product is physically transferred into a vessel, pipe or other delivery mechanism.
1.17 Cost of salesWhen inventories are sold, the carrying amount is recognised as part of cost of sales. Any write-down of inventories to net realisable value and all losses of inventories or reversals of previous write-downs or losses are recognised in cost of sales in the period the write-down, loss or reversal occurs.
1.18 Income from investmentsInterest income is accrued on a time basis by reference to the principal outstanding and at the effective interest rate applicable, which is the rate that exactly discounts estimated future cash receipts through the expected life to the net carrying amount on initial recognition.
Dividend income from investments is recognised when the shareholder’s right to receive payment has been established.
1.19 Taxation
Current tax assets and liabilitiesThe tax expense for the period comprises current and deferred tax.
Tax is recognised in the statement of profit or loss, except to the extent that it relates to items recognized in other comprehensive income or directly in equity. In this case, the tax is also recognized in other comprehensive income or directly in equity, respectively. The charge for current tax is based on the results for the year as adjusted for income that is exempt and expenses that are not deductible using tax rates that have been enacted or substantively enacted by the reporting date.
Deferred tax is provided using the liability method on temporary differences between the tax bases of assets and liabilities and their carrying amounts for financial reporting purposes at the reporting date at the tax rates that have been enacted or substantively enacted by the reporting date.
The measurement of deferred tax liabilities and assets reflects the tax consequences that would follow from the manner in which the group expects to recover or settle the carrying amount of its assets and liabilities.
Deferred tax assetsA deferred tax asset is only recognised to the extent that it is probable that taxable profits will be available against which deductible temporary differences can be utilised, unless specifically exempt. It is measured at the tax rates that have been enacted or substantively enacted by the reporting date.
Accounting Policies (continued)

PetroSA Integrated Annual Report 2016 | 119
Deferred tax liabilityDeferred tax liabilities are recognised for all taxable temporary differences, except:
• When the deferred tax liability arises from the initial recognition of goodwill or an asset or liability in a transaction that is not a business combination and, at the time of the transaction, affects neither the accounting profit nor taxable profit or loss.
• In respect of taxable temporary differences associated with investments in subsidiaries, associates and interests in joint ventures, when the timing of the reversal of the temporary differences can be controlled and it is probable that the temporary differences will not reverse in the foreseeable future.
1.20 Borrowing and finance costsBorrowing costs directly attributable to the acquisition, construction or production of qualifying assets are added to the cost of those assets, until the assets are substantially ready for their intended use or sale. Qualifying assets are assets that necessarily take a substantial period to get ready for their intended use or sale. Investment income earned on the temporary investment of specific borrowings pending their expenditure on qualifying assets is deducted from the cost of those assets.
Other borrowing costs are recognised as an expense in the period in which they are incurred.
1.21 Government grantsGovernment grants are recognised where there is reasonable assurance that the grant will be received and all attached conditions will be complied with. When the grant relates to an expense item, it is recognised as income on a systematic basis over the periods that the related costs, for which it is intended to compensate, are expensed.
1.22 Subsequent eventsRecognised amounts in the consolidated and separate financial statements are adjusted to reflect events arising after the reporting date that provide evidence of conditions that existed at the reporting date. Events after the reporting date that are indicative of conditions that arose after the reporting date are dealt with by way of a note.
1.23 Irregular and fruitless and wasteful expenditureIrregular expenditure means expenditure incurred in contravention of, or not in accordance with, a requirement of any applicable legislation, including the PFMA.
Fruitless and wasteful expenditure means expenditure that was made in vain and would have been avoided had reasonable care been exercised.
When determining whether expenditure shall be classified as fruitless and wasteful or irregular the following will be considered:
• Could reasonable steps have been taken to avoid the expenditure?• Were there policies and/or procedures governing the incurred expenditure?• Is it material? (for disclosure purposes)
All irregular and fruitless and wasteful expenditure is charged against profit or loss in the period in which it is incurred and disclosed as a note to the consolidated and separate financial statements of the company and group.

120 | PetroSA Integrated Annual Report 2016
FINANCIAL PERFORMANCE
Audited Annual Financial Statementsfor the year ended 31 March 2016
1.24 Adoption of International Financial Reporting Standards
The following standards and amendments to existing standards have been published and are not yet effective and the group has not adopted them early.
1. IFRS 9, ‘Financial instruments’, issued in July 2014 (effective 1 January 2018). IFRS 9 addresses the classification, measurement and derecognition of financial assets and financial liabilities and introduces new rules for hedge accounting. Another revised version of IFRS 9 was issued in July 2014 mainly to include a) impairment requirements for financial assets and b) limited amendments to the classification and measurement requirements by introducing a ‘fair value through other comprehensive income’ (FVTOCI) measurement category for certain simple debt instruments. These latest amendments now complete the new financial instruments standard.
Following the changes approved by the IASB in July 2014, the group no longer expects any impact from the new classification, measurement and derecognition rules on the group’s financial assets and financial liabilities. The group has yet to undertake a detailed assessment of the new requirements affecting the accounting for financial liabilities that are designated at fair value through profit or loss. The new impairment model is an expected credit loss (ECL) model which may result in the earlier recognition of credit losses.
2. IFRS 15, ‘Revenue from Contracts with Customer’, (effective 1 January 2018). The IASB has issued a new standard for the recognition of revenue. This will replace IAS 18 which covers contracts for goods and services and IAS 11 which covers construction contracts. The core principle of IFRS 15 is that an entity should recognise revenue to depict the transfer of promised goods or services to customers in an amount that reflects the consideration to which the entity expects to be entitled in exchange for those goods or services. As the new standard is based on the principle that revenue is recognised when control of a good or service transfers to a customer – the notion of control replaces the existing notion of risks and rewards. The standard permits a modified retrospective approach for the adoption. Under this approach entities will recognise transitional adjustments in retained earnings on the date of initial application (eg 1 January 2017), ie without restating the comparative period. They will only need to apply the new rules to contracts that are not completed as of the date of initial application.
At this stage, the group is not able to estimate the impact of the new rules on the group’s financial statements. The group will make more detailed assessments of the impact over the next twelve months.
3. IFRS 16, ‘Leases’, (effective 1 January 2019). The new standard introduces a single lessee accounting model and requires a lessee to recognise assets and liabilities for all leases with a term of more than 12 months, unless the underlying asset is of low value. A lessee is required to recognise a right-of-use asset representing its right to use the underlying leased asset and a lease liability representing its obligation to make lease payments. A lessee measures right-of-use assets similarly to other non-financial assets and lease liabilities similarly to other financial liabilities. IFRS 16 also contains expanded disclosure requirements for lessees.
4. IAS 1, ‘Presentation of financial statements – Disclosure Initiative’, (effective 1 January 2016). The amendments to IAS 1 give some guidance on how to apply the concept of materiality in practice. The amendments to IAS 1 are effective for annual periods beginning on or after 1 January 2016. The directors of the group do not anticipate that the application of these amendments to IAS 1 will have a material impact on the Group’s consolidated financial statements.
There are no other standards that are not yet effective and that would be expected to have a material impact on the entity in the current or future reporting periods and on foreseeable future transactions.
Accounting Policies (continued)

PetroSA Integrated Annual Report 2016 | 121
1.25 Key assumptions made by management in applying accounting policies
Critical accounting estimates and judgementsIn preparing the consolidated and separate financial statements in terms of IFRS, the group’s management is required to make certain estimates and assumptions that may materially affect reported amounts of assets and liabilities at the date of the consolidated and separate financial statements and the reported amounts of revenues and expenses during the reported period and the related disclosures. As these estimates and assumptions concern future events, due to the inherent uncertainty involved in this process, the actual results often vary from the estimates. These estimates and judgements are based on historical experience, current and expected future economic conditions and other factors, including expectations of the future events that are believed to be reasonable under the circumstances.
Environmental and decommissioning provisionProvision is made for environmental and decommissioning costs where either a legal or constructive obligation is recognised as a result of past events. Estimates are made in determining the present obligation of environmental and decommissioning provisions, which include the actual estimate, the discount rate used and the expected date of closure of mining activities in determining the present value of environmental and decommissioning provisions. Estimates are based upon costs that are regularly reviewed, by internal and external experts, and adjusted as appropriate for new circumstances.
Other provisionsFor other provisions, estimates are made of legal or constructive obligations resulting in the raising of provisions, and the expected date of probable outflow of economic benefits to assess whether the provision should be discounted.
Recoverability of assetsThe group assesses its cash generating units (CGUs) at each reporting period to determine whether any indication of impairment exists. Impairment tests are performed when there is an indication of impairment of assets or a reversal of previous impairments of assets. Where an indicator of impairment exists, a formal estimate of the recoverable amount is made, which is considered to be the higher of the fair value less costs of disposal (FVLCD) and value in use (VIU). Management therefore has implemented certain impairment indicators and these include movements in exchange rates, commodity prices and the economic environment its businesses operate in. Estimates are made in determining the recoverable amount of assets which include the estimation of cash flows and discount rates used. In estimating the cash flows, management base cash flow projections on reasonable and supportable assumptions that represent managements’ best estimate of the range of economic conditions that will exist over the remaining useful life of the assets, based on publicly available information. The discount rates used are pre-tax rates that reflect the current market assessment of the time value of money and the risks specific to the assets for which the future cash flow estimates have not been adjusted. These estimates and assumptions are subject to risk and uncertainty. Therefore, there is a possibility that changes in circumstances will impact these projections, which may impact the recoverable amount of CGUs.
Impairments and impairment reversalsImpairment tests are performed when there is an indication of impairment of assets or a reversal of previous impairments of assets. Management therefore has implemented certain impairment indicators and these include movements in exchange rates, commodity prices and the economic environment its businesses operate in. Estimates are made in determining the recoverable amount of assets which include the estimation of cash flows and discount rates used. In estimating the cash flows, management base cash flow projections on reasonable and supportable assumptions that represent managements’ best estimate of the range of economic conditions that will exist over the remaining useful life of the assets, based on publicly available information. The discount rates used are post-tax rates that reflect the current market assessment of the time value of money and the risks specific to the assets for which the future cash flow estimates have not been adjusted.
Contingent liabilitiesManagement considers the existence of possible obligations which may arise from legal action as well as the possible non-compliance of the requirements of completion guarantees and other guarantees provided. The estimation of the amount disclosed is based on the expected possible outflow of economic benefits should there be a present obligation.

122 | PetroSA Integrated Annual Report 2016
FINANCIAL PERFORMANCE
Audited Annual Financial Statementsfor the year ended 31 March 2016
Hydrocarbon reserve and resource estimatesHydrocarbon reserves are estimates of the amount of hydrocarbons that can be economically and legally extracted from the group’s oil properties. The group estimates its commercial reserves and resources based on information compiled by appropriately qualified persons relating to the geological and technical data on the size, depth, shape and grade of the hydrocarbon body and suitable production techniques and recovery rates. Commercial reserves are determined using estimates of oil and gas in place, recovery factors and future commodity prices.
Future development costs are estimated using assumptions as to the number of wells required to produce the commercial reserves, the cost of such wells and associated production facilities, and other capital costs.The carrying amount of oil development and production assets at 31 March 2015 is shown in Note 3.
As the economic assumptions used may change and as additional geological information is obtained during the operation of a field, estimates of recoverable reserves may change. Such changes may impact the group’s reported financial position and results which include:
1) The carrying value of exploration and evaluation assets and production assets may be affected due to changes in estimated future cash flows.
2) Depreciation and amortisation charges in the statement of profit or loss may change where such charges are determined using the Units of Production method.
3) Provisions for decommissioning may change, where changes to the reserve estimates affect expectations about when such activities will occur and the associated cost of these activities.
4) The recognition and carrying value of deferred tax assets may change due to changes in the judgements regarding the existence of such assets and in estimates of the likely recovery of such assets.
Evaluation of the useful life of assetsOn an annual basis, management evaluates the useful life of all assets. In carrying out this exercise, experience of asset’s historical performance and the medium-term business plan are taken into consideration.
Carrying value of intangible exploration and evaluation assetsThe amount of intangible exploration and evaluation assets represent active exploration assets. These amounts will be written off to the statement of profit or loss and comprehensive income as exploration costs unless commercial reserves are established or the determination process is not completed and there are no indicators of impairment.
The key areas in which management have applied judgement are as follows: group’s intention to proceed with a future work programme for a prospect or license; the likelihood of licence renewal or extension; and the success of a well result or geological or geophysical survey.
Units of production (UOP) depreciation of oil and gas assetsOil and gas properties are depreciated using the UOP method. The actual production for the period is divided by the total proved developed and undeveloped hydrocarbon reserves. This results in a depreciation/amortisation charge (UOP rate) proportional to the depletion of the anticipated remaining production from the field.
The life of each item, which is assessed at least annually, has regard to both its physical life limitations and present assessments of economically recoverable reserves of the field at which the asset is located. These calculations require the use of estimates and assumptions, including the amount of recoverable reserves and estimates of future capital expenditure. The calculation of the UOP rate of depreciation/amortisation will be impacted to the extent that actual production in the future is different from current forecast production based on total proved reserves whereas the life of each item and the total recoverable reserves is impacted by future capital expenditure (because the future estimated capex does not affect the UOP rate directly; it only affects the life and value of the assets to be depreciated).
Accounting Policies (continued)

PetroSA Integrated Annual Report 2016 | 123
Notes to the Consolidated and Separate Financial Statements
2. Property, plant and equipment
2016R’000
2015R’000
GROUP Cost
Accumulateddepreciation
andimpairment
Carrying value Cost
Accumulateddepreciation
andimpairment
Carrying value
Land 43 587 – 43 587 45 135 – 45 135
Buildings 223 992 (39 111) 184 881 211 897 (38 677) 173 220
Production assets 37 377 825 (29 760 880) 7 616 945 37 883 592 (31 641 866) 6 241 726
Furniture, fittings and office equipment 647 189 (562 697) 84 492 653 059 (546 489) 106 570
Motor vehicles 83 612 (42 706) 40 906 73 459 (42 256) 31 203
Restoration costs 3 664 739 (3 152 979) 511 760 2 810 009 (2 460 577) 349 432
Shutdown costs capitalised 637 846 (619 931) 17 915 637 837 (586 091) 51 746
Assets under development 340 994 (33 326) 307 668 3 312 398 (2 691 285) 621 113
Total 43 019 784 (34 211 630) 8 808 154 45 627 386 (38 007 241) 7 620 145
2016R’000
2015R’000
COMPANY Cost
Accumulateddepreciation
andimpairment
Carrying value Cost
Accumulateddepreciation
andimpairment
Carrying value
Land 43 587 – 43 587 45 135 – 45 135
Buildings 223 992 (39 111) 184 881 211 897 (38 677) 173 220
Production assets 29 584 072 (28 399 822) 1 184 250 29 511 834 (27 331 211) 2 180 623
Furniture, fittings & office equipment 647 032 (562 549) 84 483 652 937 (546 382) 106 555
Motor vehicles 83 612 (42 706) 40 906 73 459 (42 256) 31 203
Restoration costs 3 400 750 (3 078 949) 321 801 2 615 464 (2 411 861) 203 603
Shutdown costs capitalised 637 846 (619 931) 17 915 637 837 (586 091) 51 746
Assets under development 340 994 (33 326) 307 668 3 312 398 (2 691 285) 621 113
Total 34 961 885 (32 776 394) 2 185 491 37 060 961 (33 647 763) 3 413 198

124 | PetroSA Integrated Annual Report 2016
FINANCIAL PERFORMANCE
Audited Annual Financial Statementsfor the year ended 31 March 2016
Notes to the Consolidated and Separate Financial Statements (continued)
2. Property, plant and equipment (continued)
Reconciliation of property, plant and equipment – Group 2016
OpeningBalance
R’000Additions
R’000 Disposals
R’000
Transfer/Reclassifi-
cationR’000
Foreignexchange
movementsR’000
Change inestimate
R’000Depreciation
R’000
Impairmentloss
R’000
Closingbalance
R’000
Land 45 135 – (1 548) – – – – – 43 587
Buildings 173 220 – – 11 661 – – – – 184 881
Production assets 6 241 726 1 692 403 (32 194) 401 570 529 626 – (1 662 342) 446 156 7 616 945
Furniture, fittings and office equipment 106 570 12 846 (282) – 3 – (27 645) (7 000) 84 492
Motor vehicles 31 203 14 416 – – – – (4 713) – 40 906
Restoration costs 349 432 168 603 – – 30 349 748 286 (126 342) (658 568) 511 760
Shutdown costs capitalised 51 746 9 – – – – (32 676) (1 164) 17 915
Assets under development 621 113 182 025 (745) (461 399) – – – (33 326) 307 668
7 620 145 2 070 302 (34 769) (48 168) 559 978 748 286 (1 853 718) (253 902) 8 808 154
Reconciliation of property, plant and equipment – Group 2015
OpeningBalance
R’000Additions
R’000 Disposals
R’000
Transfer/Reclassifi-
cationR’000
Foreignexchange
movementsR’000
Change inestimate
R’000Depreciation
R’000
Impairmentloss
R’000
Closingbalance
R’000
Land 45 135 – – – – – – – 45 135
Buildings 173 429 – (209) – – – – – 173 220
Production assets 8 930 958 773 672 (18 442) 8 577 001 249 164 – (1 847 642) (10 422 985) 6 241 726
Furniture, fittings and office equipment 103 803 21 403 (905) 45 172 (2) – 44 891 (107 792) 106 570
Motor vehicles 11 776 20 262 (499) – – – (336) – 31 203
Restoration costs 1 337 220 44 633 – – 14 140 317 337 (341 028) (1 022 870) 349 432
Shutdown costs capitalised 416 498 1 909 – – – – (161 854) (204 807) 51 746
Assets under development 6 997 929 4 920 376 – (8 605 907) – – – (2 691 285) 621 113
18 016 748 5 782 255 (20 055) 16 266 263 302 317 337 (2 305 969) (14 449 739) 7 620 145

PetroSA Integrated Annual Report 2016 | 125
2. Property, plant and equipment (continued)
Reconciliation of property, plant and equipment – Company 2016
Opening balance
R’000Additions
R’000Disposals
R’000
Transfers/Reclassifi-
cationR’000
Change inestimate
R’000Depreciation
R’000
Impairment loss
R’000
Closingbalance
R’000
Land 45 135 – (1 548) – – – – 43 587
Buildings 173 220 – – 11 661 – – – 184 881
Production assets 2 180 623 252 694 (32 194) 394 945 – (1 300 518) (311 300) 1 184 250
Furniture, fittings and office equipment 106 555 12 846 (282) – – (27 636) (7 000) 84 483
Motor vehicles 31 203 14 416 – – – (4 713) – 40 906
Restoration costs 203 603 – – – 888 492 (111 726) (658 568) 321 801
Shutdown costs capitalised 51 746 9 – – – (32 676) (1 164) 17 915
Assets under development 621 113 182 025 (745) (461 399) – – (33 326) 307 668
3 413 198 461 990 (34 769) (54 793) 888 492 (1 477 269) (1 011 358) 2 185 491
Reconciliation of property, plant and equipment – Company 2015
Opening balance
R’000Additions
R’000Disposals
R’000
Transfers/Reclassifi-
cationR’000
Change inestimate
R’000Depreciation
R’000
Impairment loss
R’000
Closingbalance
R’000
Land 45 135 – – – – – – 45 135
Buildings 173 429 – (209) – – – – 173 220
Production assets 2 589 460 514 (18 442) 8 560 735 – (1 235 884) (7 715 760) 2 180 623
Furniture, fittings and office equipment 103 403 21 403 (584) 45 172 – 44 953 (107 792) 106 555
Motor vehicles 11 218 20 262 (13) – – (264) – 31 203
Restoration costs 1 236 931 – – – 319 651 (330 109) (1 022 870) 203 603
Shutdown costs capitalised 416 498 1 909 – – – (161 854) (204 807) 51 746
Assets under development 6 997 929 4 920 376 – (8 605 907) – – (2 691 285) 621 113
11 574 003 4 964 464 (19 248) – 319 651 (1 683 158) (11 742 514) 3 413 198

126 | PetroSA Integrated Annual Report 2016
FINANCIAL PERFORMANCE
Audited Annual Financial Statementsfor the year ended 31 March 2016
2. Property, plant and equipment (continued)
Restoration expenditure relates to the abandonment provision (note 15) and is amortised on a units of production basis. The units of production method is also used in calculating depreciation on producing assets. Due to the nature of the business, the gas and oil reserves at the end of each financial year differ from the previous year. This necessitates a change in the estimated remaining useful lives of these assets at the end of each financial year. The effect on the current year is a increase of R8.2 million in profit. Due to the number of variables involved in the depreciation calculation it is not practicable to estimate the effect in future years.
The PetroSA group impairment charge of R0.3 billion comprises of an impairment of R1.5 billion which was offset by an impairment reversal of R1.2 billion.
Impairment – GTL Refinery in South AfricaOil and gas reserves are used in assessing oil and gas producing properties for impairment. A significant reduction in the oil and gas price and a downgrade of proved and probable reserves triggered an impairment review. When such indicators are identified, management must exercise further judgement in making an estimate of the recoverable amount (value in use) of the asset against which to compare the carrying value. The outcome of the review necessitated an impairment of R1 billion (2015: R11.7 billion) based on a recoverable amount of R1.8 billion (2015: R3.2 billion). This was determined by comparing the CGU’s carrying value at year-end against the expected present value of the free cash flows (net present value) from this CGU, based on a fixed life of field approved by the Board of Directors. These cash flows are management’s best estimate taking into account past experience and future economic assumptions, such as forward curves for crude oil, product prices and exchange rates and discounted using the WACC of 14% (2015: 14%). The impairment loss was recorded as part of operating expenses. (under review)
A sensitivity analysis indicates that a R1 weakening of the Rand against the US Dollar will result in a increase in the impairment charge of R182 million (2015: R467 million) and a $1 increase in the Brent crude oil price will decrease the impairment charge by R87 million (2015:R107 million).
Impairment – West Cape Three Points and Deepwater Tano blocks in GhanaIn light of the current commodity prices, the West Cape Three Points block and Deepwater Tano block held by PetroSA Ghana Limited were assessed for impairment. The impairment charge of R0.5 billion for the West Cape Three block (2015: R2.7 billion for both blocks) was based on a recoverable amount of R0.9 billion (2015: R3.7 billion for both block). An impairment reversal on the Deepwater Tano block of R1.2 billion resulted in a net impairment reversal of R0.7 billion. A sensitivity analysis indicates that a $1 increase in the Brent crude oil price will decrease the impairment charge by RXXX (2015: R85 million). (under review)
Macroeconomic assumptionsThe macroeconomic assumptions used in the net present value computation include Brent crude oil prices at US$46.56 (2018: US$64, 2019: $70, 2020: $75), a Rand/US Dollar exchange rate of R14.79 (2018: R13.70, 2019: R13.49, 2020: R13.62), Rand-based WACC of 14% (2015: 14%) and USDollar-based WACC of 11% (2015: 11%). PetroSA will continue to review the recoverable amounts of the CGUs in the event of future changes in reserves and relevant macroeconomic indicators.
Notes to the Consolidated and Separate Financial Statements (continued)

PetroSA Integrated Annual Report 2016 | 127
3. Intangible assets
2016 2015
GROUP CostAccumulatedamortisation Carrying value Cost
Accumulated amortisation Carrying value
Patents 6 934 (2 475) 4 459 6 934 (2 197) 4 737
Exploration and evaluation assets 1 744 318 – 1 744 318 1 610 370 – 1 610 370
Software 48 899 (40 105) 8 794 48 847 (28 858) 19 989
Restoration costs 17 540 – 17 540 19 631 – 19 631
Total 1 817 691 (42 580) 1 775 111 1 685 782 (31 055) 1 654 727
2016 2015
COMPANY CostAccumulatedamortisation Carrying value Cost
Accumulatedamortisation Carrying value
Patents 6 934 (2 475) 4 459 6 934 (2 197) 4 737
Exploration and evaluation assets 1 301 046 – 1 301 046 1 203 989 – 1 203 989
Software 48 899 (40 105) 8 794 48 847 (28 858) 19 989
Total 1 356 879 (42 580) 1 314 299 1 259 770 (31 055) 1 228 715

128 | PetroSA Integrated Annual Report 2016
FINANCIAL PERFORMANCE
Audited Annual Financial Statementsfor the year ended 31 March 2016
3. Intangible assets (continued)
Reconciliation of intangible assets – Group 2016
Opening Balance
R’000Additions
R’000Disposals
R’000Transfers
R’000
Foreign exchange
movementsR’000
Change in estimate
R’000Amortisation
R’000Total
R’000
Patents 4 737 – – – – – (278) 4 459
Exploration and evaluation assets 1 610 370 53 697 (2 781) 48 168 34 864 – – 1 744 318
Software 19 989 52 – – – – (11 247) 8 794
Restoration costs 19 631 49 – – 4 142 (6 282) – 17 540
1 654 727 53 798 (2 781) 48 168 39 006 (6 282) (11 525) 1 775 111
Reconciliation of intangible assets – Group 2015
OpeningBalance
R’000Additions
R’000 Disposals
R’000
Written backR’000
TransfersR’000
Foreign exchange
movementsR’000
Change in estimate
R’000Amortisation
R’000Total
R’000
Patents 5 014 – – – – – – (277) 4 737
Exploration and evaluation assets 1 495 342 109 956 (231) (136) (16 266) 21 705 – – 1 610 370
Software 20 052 10 118 – – – – – (10 181) 19 989
Restoration costs 20 651 40 – – – 3 120 (4 180) – 19 631
1 541 059 120 114 (231) (136) (16 266) 24 825 (4 180) (10 458) 1 654 727
Reconciliation of intangible assets – Company 2016
OpeningBalance
R’000Additions
R’000Transfers
R’000Amortisation
R’000Total
R’000
Patents 4 737 – – (278) 4 459
Exploration and evaluation assets 1 203 989 42 264 54 793 – 1 301 046
Software 19 989 52 – (11 247) 8 794
1 228 715 42 316 54 793 (11 525) 1 314 299
Reconciliation of intangible assets – Company 2015
OpeningBalance
R’000Additions
R’000Amortisation
R’000Total
R’000
Patents 5 014 – (277) 4 737
Exploration and evaluation assets 1 108 658 95 331 – 1 203 989
Software 20 052 10 118 (10 181) 19 989
1 133 724 105 449 (10 458) 1 228 715
Notes to the Consolidated and Separate Financial Statements (continued)

PetroSA Integrated Annual Report 2016 | 129
4. Investments in subsidiaries
GROUP COMPANY
2016R’000
2015R’000
2016R’000
2015R’000
The carrying amounts of subsidiaries are shown net of impairment losses.
PetroSA Synfuel International SOC Ltd (100%) Shares:Balance at the end of the year – – 501 501
Provision for impairment – – (501) (501)
Balance at the end of the year – – – –
PetroSA Sudan SOC Ltd (100%) Loans:Balance at the end of the year – – (0.12) (0.12)
Shares:Balance at the end of the year – – 0.12 0.12
Loans – – (0.12) (0.12)
Shares – – 0.12 0.12
Carrying amount of investment – – – –
Petroleum Oil & Gas Corporation of South Africa(Namibia) SOC Ltd (100%) Loans:Balance at the end of the year – – (0.12) (0.12)
Shares:Balance at the end of the year – – 0.12 0.12
Loans – – (0.12) (0.12)
Shares – – 0.12 0.12
Carrying amount of investment – – – –
PetroSA Egypt SOC Ltd (100%) Loans:Balance at the end of the year – – (0.10) (0.10)
Shares:Balance at the end of the year – – 0.10 0.10
Loans – – (0.10) (0.10)
Shares – – 0.10 0.10
Carrying amount of investment – – – –
PetroSA Europe BV (100%) Shares:Balance at the end of the year – – 166 166
Share premium:Balance at the end of the year – – 2 965 2 965
Shares – – 166 166
Share premium – – 2 965 2 965
Carrying amount of investment – – 3 131 3 131
PetroSA Brass SOC Ltd (100%) Loans:Balance at the end of the year – – (0.06) (0.06)
SharesBalance at the end of the year – – 0.06 0.06
Loans – – (0.06) (0.06)

130 | PetroSA Integrated Annual Report 2016
FINANCIAL PERFORMANCE
Audited Annual Financial Statementsfor the year ended 31 March 2016
GROUP COMPANY
2016R’000
2015R’000
2016R’000
2015R’000
Shares – – 0.06 0.06
Carrying amount of investment – – – –
PetroSA Gryphon Marin Permit SOC Ltd (100%) Loans:Balance at the end of the year – – (0.06) (0.06)
Shares:Balance at the end of the year – – 0.06 0.06
Loans – – (0.06) (0.06)
Shares – – 0.06 0.06
Carrying amount of investment – – – –
PetroSA Iris SOC Ltd (100%) Loans:Balance at the end of the year – – (0.06) (0.06)
Shares:Balance at the end of the year – – 0.06 0.06
Loans – – (0.06) (0.06)
Shares – – 0.06 0.06
Carrying amount of investment – – – –
PetroSA Themis SOC Ltd (100%) Loans:Balance at the end of the year – – (0.12) (0.12)
Shares:Balance at the end of the year – – 0.12 0.12
Loans – – (0.12) (0.12)
Shares – – 0.12 0.12
Carrying amount of investment – – – –
PetroSA Equatorial Guinea SOC Ltd (100%) Loans:Balance at the end of the year – – (0.06) (0.06)
Shares:Balance at the end of the year – – 0.06 0.06
Loans – – (0.06) (0.06)
Shares – – 0.06 0.06
Carrying amount of investment – –
PetroSA Ghana Ltd (100%)
Shares: Balance at the end of the year – – 3 880 651 3 880 651
Provision for impairment – – (363 435) (669 588)
Balance at the end of the year – – 3 517 216 3 211 063
Carrying amount of investment – – 3 517 216 3 211 063
The recoverable amount of R3.52 billion for the PetroSA Ghana Limited cash-generating unit was calculated on a fair value less cost to sell basis and takes into consideration a WACC of 11% (2015: 10%) and an inflation rate of 2.21% (2015: 2.21%).
PetroSA has provided its shares in PetroSA Ghana Limited as security to the lenders for the Reserve Based Lending facility. Refer to note 16.
4. Investments in subsidiaries (continued)
Notes to the Consolidated and Separate Financial Statements (continued)

PetroSA Integrated Annual Report 2016 | 131
GROUP COMPANY
2016R’000
2015R’000
2016R’000
2015R’000
Total
Loans – – (1) (1)
Shares – – 3 517 884 3 211 731
Share premium – – 2 965 2 965
Provision for impairment – – (501) (501)
Carrying amount of investments – – 3 520 347 3 214 194
5. Joint arrangements
The following table lists all of the joint ventures in the group:
Group
Name of company Held by % ownership interest % ownership interest Carrying amount Carrying amount
2016 2015 2016 2015
GTL.F1 AG PetroSA 50.00% 50.00% – –
Company
Name of company Held by % ownership interest % ownership interest Carrying amount Carrying amount
2016 2015 2016 2015
GTL.F1 AG PetroSA 50.00% 50.00% 29 625 29 625
GTL.F1 AG is the process licensor of the Low Temperature Fischer Tropsch (LTFT) technology and its principal place of business is in Germany.
Summarised Statement of Profit or Loss and other Comprehensive Income GTL.F1 AG
2016R’000
2015R’000
Revenue 20 568 20 610
Depreciation and amortisation (12 763) (10 805)
Interest income – 9
Other income and expenses (54 694) (68 773)
Interest expense (3 960) (3 557)
Loss before tax (50 849) (62 516)
Taxation (8 882) 621
Loss from continuing operations (59 731) (61 895)
Total comprehensive loss (59 731) (61 895)
4. Investments in subsidiaries (continued)

132 | PetroSA Integrated Annual Report 2016
FINANCIAL PERFORMANCE
Audited Annual Financial Statementsfor the year ended 31 March 2016
Summarised Statements of Financial Position GTL.F1 AG
2016R’000
2015R’000
Assets
Non current assets 147 347 131 501
CurrentCash and cash equivalents 23 754 71 950
Other current assets 73 9 409
Total current assets 23 827 81 359
LiabilitiesNon current financial liabilities 445 181 363 231
Total non current liabilities 445 181 363 231
CurrentOther current liabilities 12 192 29 945
Total current liabilities 12 192 29 945
Total net liabilities (286 199) (180 316)
Reporting periodThe reporting date of the joint venture is not the same as that of the group. GTL.F1 AG’s year end is 31 December 2015.
Unrecognised lossesThe group has discontinued recognising its share of the losses of GTL.F1 AG, as the investment at a group level is held at R nil and the group has no obligation for any losses of the joint venture. The total unrecognised losses for the current period amount to R29.9 million (2015: R30.8 million). The accumulated unrecognised losses to date amount to R124.8 million (2015: R94.9 million).
6. Interests in unconsolidated structured entities
PetroSA Development TrustThe PetroSA Development Trust was established to facilitate the development and transformation of the lives of people from historically disadvantaged and impoverished communities and the enhancement of the education and literacy levels in these communities, in particular those within which PetroSA operates such as the Mossel Bay region and other deserving communities.
Gannet TrustThe Gannet Trust group of companies was created to underwrite insurance risks for PetroSA and other companies with similar risk profiles. Gannet Trust enables PetroSA to access the re-insurance markets that would not otherwise be available to it. Gannet Trust is also available to accept risks that are either uninsured, uninsurable or that bridge the gap between the underwriter imposed risk retentions and PetroSA’s preferred risk retentions.
5. Joint arrangements (continued)
Notes to the Consolidated and Separate Financial Statements (continued)

PetroSA Integrated Annual Report 2016 | 133
7. Other financial assets
GROUP COMPANY
2016R’000
2015R’000
2016R’000
2015R’000
Loan to PetroSA Rehabilitation The loan to PetroSA Rehabilitation is PetroSA contribution towards the funding of its abandonment provision as details below. – – 1 435 239 –
Restricted cash PetroSA utilises PetroSA Rehabilitation NPC (Non-Profit company) as a funding vehicle to ring-fence funds for PetroSA’s abandonment/environmental liability. Funds are invested in fixed term deposits with various counterparties and earn a weighted interest rate of 7.7% per annum. 98% of the investments mature on 27 September 2016 and will be reinvested at this point. These funds are not available for the general purposes of the group. The amount disclosed in 2015 was reclassified from cash and cash equivalents to other financial assets. 1 452 765 32 495 – –
1 452 765 32 495 1 435 239 –
Loans and receivables
Ghana National Petroleum Corporation (GNPC) The loan in respect of TEN Development capital expenditure bears interest at LIBOR plus a margin percentage of 1.5% per annum and the loan in respect of the TEN Development gas export pipeline expenditure bears interest at 15% per annum. The loan will be repaid with 40% of GNPC’s receivables per each lifting of TEN production until the liability is fully discharged. TEN production is scheduled to commence in August 2016.GTL.F1 AGThe subordinated loan accrues interest at EURIBOR +0.75%. This loan is repayable by 31 December 2016. Should settlement not be possible at this date, a new installment plan may be agreed on the same day. LurgiThe amount owing by Lurgi is in respect of a purchase of a 12.5% share in the GTL.F1 AG Joint Venture. The loan accrues interest at EURIBOR + 0.75%. The loan is repayable based on dividends receivable by Lurgi from the GTL.F1 AG technology company.
126 645 52 330 – –
213 159 153 190 213 159 153 190
198 400 153 732 198 400 153 732
Subtotal 538 204 359 252 411 559 306 922
538 204 359 252 411 559 306 922
Non-current assets 1 990 969 391 747 1 846 798 306 922
Total other financial assets 1 990 969 391 747 1 846 798 306 922
At 31 March 2016, PetroSA waived its claim of R2.9 million (2015: R2 billion) against PetroSA Equatorial Guinea and the loan was written off.

134 | PetroSA Integrated Annual Report 2016
FINANCIAL PERFORMANCE
Audited Annual Financial Statementsfor the year ended 31 March 2016
8. Amounts held by holding company
This deposit is held by CEF SOC Ltd as security for guarantees issued by itself to third parties on behalf of PetroSA. These funds are not available for the general purposes of the group.
GROUP COMPANY
2016R’000
2015R’000
2016R’000
2015R’000
CEF SOC Ltd 489 021 489 021 489 021 489 021
9. Inventories
GROUP COMPANY
2016R’000
2015R’000
2016R’000
2015R’000
The amounts attributable to the different categories are as follows:Petroleum fuels 1 652 055 1 895 820 1 652 055 1 895 820
Crude oil 43 185 31 199 7 997 8 522
Consumable stores, spares and catalysts 286 307 276 636 286 307 276 636
1 981 547 2 203 655 1 946 359 2 180 978
10. Trade and other receivables
GROUP COMPANY
2016R’000
2015R’000
2016R’000
2015R’000
Trade receivables 1 351 735 2 189 916 1 310 846 2 129 973
Prepayments 310 818 342 592 310 231 341 801
Deposits 269 421 – –
VAT 96 629 329 742 84 938 325 855
Underlift 2 941 17 697 – –
Statutory receivables 283 063 160 010 283 061 159 950
Provision for doubtful debts (28 963) (28 875) (28 963) (28 875)
Sundry receivables 169 275 110 905 180 410 115 563
Fair value of trade and other receivables 2 185 767 3 122 408 2 140 523 3 044 267
Notes to the Consolidated and Separate Financial Statements (continued)

PetroSA Integrated Annual Report 2016 | 135
Trade receivables past due but not impaired
Trade receivables which are less than 3 months past due are not considered to be impaired. At 31 March 2016, R0 million (2015: R39.7 million) were past due but not impaired. The ageing of amounts past due but not impaired is as follows:
1 month past due – 390 – 390
2 months past due – 110 – 110
3 months past due – 10 503 – 10 503
GROUP COMPANY
2016R’000
2015R’000
2016R’000
2015R’000
Reconciliation of provision for impairment of trade receivablesOpening balance 28 875 31 976 28 875 31 976
Impairment losses recognised on receivables 185 – 185 –
Written offAmounts recovered during the year
(97)–
–(3 101)
(97)–
–(3 101)
28 963 28 875 28 963 28 875
The provision for doubtful debts consists of a number of customer account balances. The balance of R28.9 million (2015: R28.9 million) is aged at over 120 days.
11. Cash and cash equivalents
Cash and cash equivalents consist of cash on hand and balances with banks and investments in money market instruments. Cash and cash equivalents included in the statement of financial position comprise the following:
GROUP COMPANY
2016R’000
2015R’000
2016R’000
2015R’000
Short-term investments in money market and cash on handBank balances
3 449 815239 769
3 741 684607 369
3 449 85043 453
3 741 11918 747
Bank overdraft (417 202) (286 761) (417 202) (286 761)
3 272 382 4 062 292 3 076 101 3 473 105
Current assets 3 689 584 4 349 053 3 493 303 3 759 866
Current liabilities (417 202) (286 761) (417 202) (286 761)
3 272 382 4 062 292 3 076 101 3 473 105
A term deposit of R40.8 million (2015: R32.5 million) held in the company PetroSA Rehabilitation (NPC) was reallocated from cash and cash equivalents to other financial assets as restricted cash, to better reflect the underlying substance of the funds.
At year-end, the group held R2 597.2 million with banks which had a credit rating of Aa1.za, R396.4 million with banks which had a credit rating of A1 and R278.8 million with banks which had a credit rating of A2.

136 | PetroSA Integrated Annual Report 2016
FINANCIAL PERFORMANCE
Audited Annual Financial Statementsfor the year ended 31 March 2016
12. Share capital authorised
GROUP COMPANY
2016R’000
2015R’000
2016R’000
2015R’000
5000 Ordinary par value shares of R1 each 5 5 5 5
Issued1,914 Ordinary par value shares of R1 each 2 2 2 2
Share premium 2 755 934 2 755 934 2 755 934 2 755 934
2 755 936 2 755 936 2 755 936 2 755 936
13. Other financial liabilities
GROUP COMPANY
2016R’000
2015R’000
2016R’000
2015R’000
Reserve Based Lending FacilityThe loan accrues interest at LIBOR plus a margin percentage, varying between 3.25% and 4.50% over the period of the loan. The loan is due to mature in February 2022. All interest payable accrues from day to day at the relevant rate of interest, is calculated on the basis of the actual number of days elapsed and a 360 day year.
1 256 750
(55 506)
918 362
(52 866)
–
–
–
–
Transaction costs incurredThese costs were incurred as a result of theReserve Based Lending Facility mentioned above
1 201 244 865 496 – –
The facility is a revolving credit facility secured against the producing asset of PetroSA Ghana. The security package comprises a share pledge and subordination of future loans to PetroSA Ghana. Additional security includes an offshore debenture comprising security over contemplated hedging agreement, intercompany loans granted by PetroSA Ghana to its subsidiaries and certain project accounts into which transaction funds are deposited. The available facility amount/borrowing base is redetermined six monthly at the end of June and December and is a function of the present value of future cash flows generated by an producing/developing assets. The available facility amount most sensitive to economic assumptions such as the Brent crude oil price and changes to independently audited oil reserves. The loan covenants applicable are the field life cover ratio of 1.5 and a loan life cover ratio of 1.3.
14. Deferred tax
GROUP COMPANY
2016R’000
2015R’000
2016R’000
2015R’000
Deferred tax asset and liability
Property plant and equipment (1 712 247) (1 129 877) – –
Tax losses available for set off against future taxable incomeProvisions
324 66450 054
146 23830 502
––
––
(1 337 529) (953 137) – –
Notes to the Consolidated and Separate Financial Statements (continued)

PetroSA Integrated Annual Report 2016 | 137
14. Deferred tax (continued)
The deferred tax assets and the deferred tax liability relate to income tax in the same jurisdiction, and the law allows net settlement. Therefore, they have been offset in the statement of financial position as follows:
GROUP COMPANY
2016R’000
2015R’000
2016R’000
2015R’000
Deferred tax liability (1 712 247) (1 129 877) – –
Deferred tax asset 374 718 176 740 – –
Total net deferred tax liability (1 337 529) (953 137) – –
Reconciliation of deferred tax liability
At beginning of the year (953 137) (1 791 557) – –
(Reversing)/originating temporary difference on assetsIncrease (decrease) in tax losses available for
(632 567)197 978
727 981(23 709)
––
––
Set off against future taxable incomeReversing temporary difference on fair value adjustment 50 197 134 148 – –
Balance at end of year (1 337 529) (953 137) – –
Recognition of deferred tax asset – CompanyPetroSA is an oil and gas company as defined in the Tenth Schedule to the Income Tax Act. As an oil and gas company, PetroSA qualifies for additional tax deductions in respect of its capital expenditure on exploration and production activities. This assessed loss position is directly attributable to PetroSA’s oil and gas activities.
PetroSA continued with its development programme of the F-O field, known as project Ikhwezi. Project Ikhwezi will contribute toward further increasing PetroSA’s assessed loss position. As it is unlikely that the assessed loss will be utilised in the foreseeable future, no deferred tax asset has been recognised. The current tax value of the unrecognised estimated tax loss/assessed loss is R5.2 billion (2015: R5.4 billion). The unused estimated/assessed tax loss at year-end is R18.6 billion (2015: R19.1 billion).
15. Provisions
GROUP 2016Opening balance Additions
Utilised during the year
Interest expense
Change in estimate Total
Abandonment/Environmental 9 621 589 168 652 20 625 485 246 775 242 11 071 354
Post-retirement medical aid benefits 52 195 2 413 (2 112) 3 523 7 513 63 532
Rehabilitation 13 374 – (937) – – 12 437
Social investment 34 153 – (9 947) – – 24 206
Restructuring – 21 656 – – – 21 656
Retention bonus 571 17 719 – – (530) 17 760
9 721 882 210 440 7 629 488 769 782 225 11 210 945

138 | PetroSA Integrated Annual Report 2016
FINANCIAL PERFORMANCE
Audited Annual Financial Statementsfor the year ended 31 March 2016
15. Provisions (continued)
GROUP 2015Opening balance Additions
Utilised during the year
Interest expense
Change in estimate Total
Post-retirement medical aid benefits 45 991 10 524 (1 593) (2 727) – 52 195
Rehabilitation 13 837 – (463) – – 13 374
Social investment 36 863 – (2 710) – – 34 153
Bonus 166 112 – (159 972) – (5 569) 571
8 342 006 84 575 (164 738) 1 152 452 307 587 9 721 882
Reconciliation of provisions
COMAPNY 2016Opening balance Additions
Utilised during the year
Interest expense
Change in estimate Total
Abandonment / Environmental 9 330 918 – – 468 195 921 730 10 720 843
Post-retirement medical aid benefits 52 195 2 413 (2 112) 3 523 7 513 63 532
Rehabilitation 13 374 – (937) – – 12 437
Social investment 34 153 – (9 947) – – 24 206
Restructuring – 21 656 – – – 21 656
Retention bonus 571 17 719 – – (530) 17 760
9 431 211 41 788 (12 996) 471 718 928 713 10 860 434
COMPANY 2015Opening balance Additions
Utilised during the year
Interest expense
Change in estimate Total
Abandonment / Environmental 7 864 962 – – 1 146 306 319 650 9 330 918
Post-retirement medical aid benefits 45 991 10 524 (1 593) (2 727) – 52 195
Rehabilitation 13 837 – (463) – – 13 374
Social investment 36 863 – (2 710) – – 34 153
Bonus 165 601 – (159 461) – (5 569) 571
8 127 254 10 524 (164 227) 1 143 579 314 081 9 431 211
GROUP COMPANY
2016R’000
2015R’000
2016R’000
2015R’000
Non-current liabilities 11 134 886 9 673 784 10 784 375 9 383 113
Current liabilities 76 059 48 098 76 059 48 098
11 210 945 9 721 882 10 860 434 9 431 211
Post-retirement medical aid benefitsPetroSA contributes to a medical aid scheme for retired and medically unfit employees. Refer to note 26 for more information.
Notes to the consolidated and separate Financial Statements (continued)

PetroSA Integrated Annual Report 2016 | 139
15. Provisions (continued)
RehabilitationThis amount is for the rehabilitation of the land at the Voorbaai terminal.
Social investmentThis provision is for commitments to community investment projects as a pre-condition for the issuing of exploration licences.
Retention bonusThe provision is for retention bonuses for PetroSA employees who qualify in terms of their employment contracts.
Abandonment/EnvironmentalThe abandonment provision represents the present value of abandonment costs relating to oil and gas interests, the majority of which are expected to be incurred up to 2023. Assumptions, based on the current economic environment, have been made which management believes are a reasonable basis upon which to estimate the future liability. These estimates are reviewed regularly to take into account any material changes to the assumptions. However, actual abandonment costs will ultimately depend upon future market prices for the necessary abandonment works required which will reflect market conditions at the relevant time. Furthermore, the timing of abandonment is likely to depend on when the fields cease to produce at economically viable rates. This in turn will depend upon future oil and gas prices, which are inherently uncertain.
Major assumptions included in the calculation of provisions is that the South African inflation decreased from 6.9% to 5.4% and US inflation of 2.2%. A sensitivity analysis indicates that a R1 weakening of the Rand against the US Dollar translates into R493 million increase in the provision and a US$1 decrease in the Brent crude oil price translates into a decrease in the provision by R19 million. (figures/sensitivities to be updated)
The total cost of future restoration is estimated at R11 071 million. This cost includes the net expenditure to abandon and to rehabilitate both the onshore and offshore facilities as well as other related closure costs. The costs are expected to be incurred as follows:
Financial year R’million – 6 years and beyond 11 071
PetroSA has commissioned an external expert to assess the quantum and scope of the group abandonment provision. This assessment occurs every 5 years. The current year assessment includes additional research into the requirements to fully close or decommission redundant exploration wells. For these wells, no reliable estimate of the cost can be made at present. Therefore no amounts have been provided for these items.
The group has set aside funds towards the cost of abandonment/environmental rehabilitation. These funds are not available for the general purposes of the group. The funds are comprised of the following investments:
Rand millions 2016 2015
Portion of cash deposit with CEF SOC Ltd (Holding company) (refer to note 8) 477 477
Cash in escrow account (refer to note 7) 1 453 31
Financial guarantee (refer to note 27) 180 180
2 110 688

140 | PetroSA Integrated Annual Report 2016
FINANCIAL PERFORMANCE
Audited Annual Financial Statementsfor the year ended 31 March 2016
16. Trade and other payables
GROUP COMPANY
2016R’000
2015R’000
2016R’000
2015R’000
Trade payables 1 070 854 1 714 277 1 069 349 1 721 409
Statutory payables 554 871 761 025 554 871 761 025
Accrued leave pay 50 262 82 492 49 910 82 017
Accrued expenses 920 215 1 297 011 494 406 1 114 739
Deposits received 23 23 23 23
Other payables 16 506 7 337 16 506 7 337
2 612 731 3 862 165 2 185 065 3 686 550
17. Revenue
Gross revenue represents the invoiced value of crude oil, fuel sales and other goods and services supplied, excluding value added tax.
GROUP COMPANY
2016R’000
2015R’000
2016R’000
2015R’000
Major classes of revenue comprise:Fuel production sales 15 063 072 17 212 076 15 063 072 17 212 076
Crude oil sales 670 580 836 555 – –
15 733 652 18 048 631 15 063 072 17 212 076
Notes to the consolidated and separate Financial Statements (continued)

PetroSA Integrated Annual Report 2016 | 141
18. Operating profit/(loss)
GROUP COMPANY
2016R’000
2015R’000
2016R’000
2015R’000
Operating profit for the year is stated after accounting for the following:
Income from administration and management activitiesAdministration and management fees 8 475 9 629 10 005 11 639
Operating lease chargesPremisesContractual amounts 7 486 6 388 6 657 4 666
Loss on sale of property, plant and equipment – 806 – –
Loss on sale of intangible assets 2 595 339 – –
Bad debts recovered – (3 101) – (3 101)
Stock provision 1 706 (12 010) 1 706 (18 161)
(Profit)/loss on foreign exchange (34 571) 327 (34 559) 327
Impairment of trade receivables 185 – 185 –
Impairment of property, plant and equipment 1 525 663 14 449 739 1 011 358 11 742 514
Reversal of impairment on property, plant and equipmentImpairment of investment subsidiaries
(1 271 761)–
––
––
–669 588
Reversal of impairment on investment subsidiaries – – (306 153) –
Impairment/write-off of loans to group companies – – 2 967 225 137
Amortisation of intangible assets 11 525 10 458 11 525 10 458
Depreciation of property, plant and equipment 1 853 718 2 305 969 1 477 269 1 683 158
Research and development 20 892 25 376 20 892 25 376
Exploration and evaluation costs 117 821 72 138 117 821 72 138
Salaries and wages 1 119 901 1 003 286 1 115 193 995 594
Pension and medical costs 186 682 186 137 186 682 186 137
19. Investment income
GROUP COMPANY
2016R’000
2015R’000
2016R’000
2015R’000
Dividend revenueSubsidiaries – Foreign – – – 64 435
Interest incomeShort-term investments in money market 326 813 408 925 265 424 624 074
326 813 408 925 265 424 688 509

142 | PetroSA Integrated Annual Report 2016
FINANCIAL PERFORMANCE
Audited Annual Financial Statementsfor the year ended 31 March 2016
20. Finance costs
GROUP COMPANY
2016R’000
2015R’000
2016R’000
2015R’000
Non-current borrowingsDiscounting of other receivables
–24 775
12 631–
–24 775
12 543–
Bank 3 030 2 573 3 030 2 573
Current borrowings – 145 – –
Interest on abandonment provision 484 147 1 154 270 468 195 1 146 305
Foreign exchange difference on revaluation of foreign loans – 136 125 – 136 125
511 952 1 305 744 496 000 1 297 546
Borrowing costs capitalised 50 107 9 772 – –
Capitalisation rate used to determine the amount of borrowing costs eligible for capitalisation 3.09% 0.82% – –
21. Taxation
GROUP COMPANY
2016R’000
2015R’000
2016R’000
2015R’000
Major components of the tax expense (income)
CurrentForeign income tax or withholding tax – current period 4 200 8 830 – –
DeferredOriginating and reversing temporary differences 431 070 (938 184) – –
Benefit of unrecognised tax loss (137 572) 54 922 – –
293 498 (883 262) – –
297 698 (874 432) – –
Reconciliation of the tax expense
Reconciliation between applicable tax rate and average effective tax rate
Applicable tax rate 28.00% 28.00% 28.00% 28.00%
Non-deductible expenses (14.44)% (0.23)% (3.90)% (0.28)%
Unrecognised deferred tax asset (173.08)% (34.58)% (24.10)% (27.72)%
Effect of different tax rates operating in differentjurisdictions 26.08 % 1.15 % – % – %
(133.44)% (5.66)% – % – %
Notes to the consolidated and separate Financial Statements (continued)
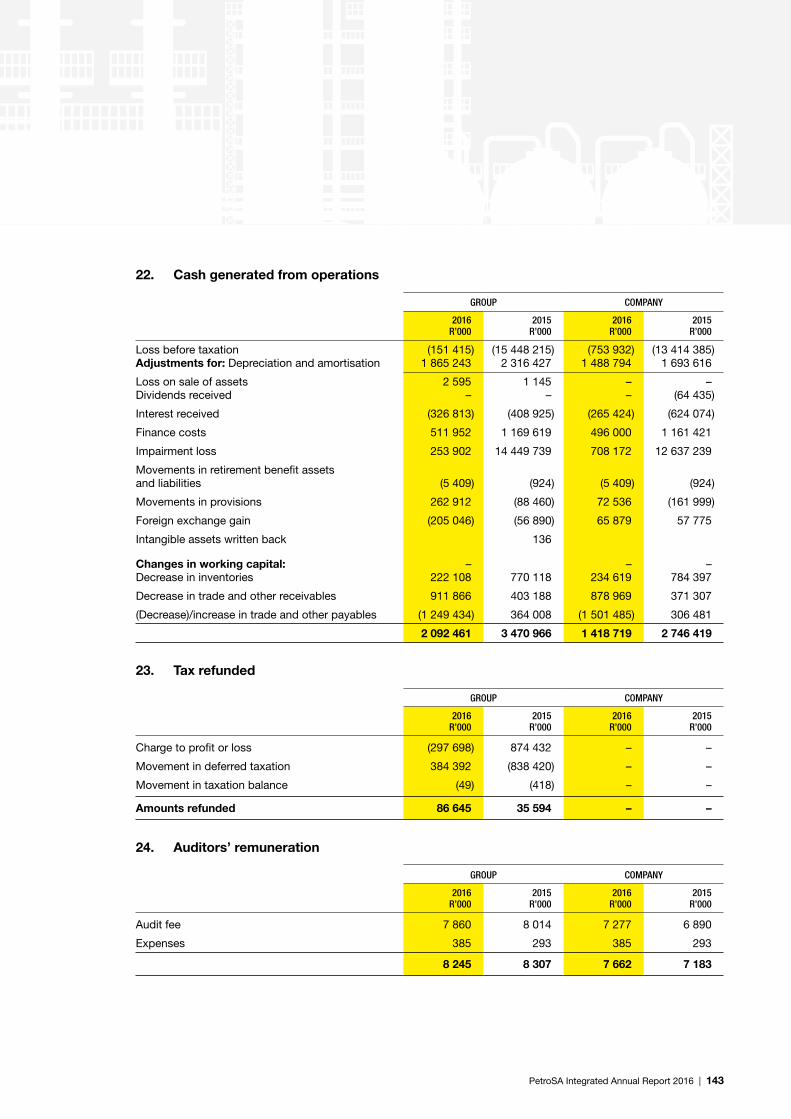
PetroSA Integrated Annual Report 2016 | 143
22. Cash generated from operations
GROUP COMPANY
2016R’000
2015R’000
2016R’000
2015R’000
Loss before taxation Adjustments for: Depreciation and amortisation
(151 415)1 865 243
(15 448 215)2 316 427
(753 932)1 488 794
(13 414 385)1 693 616
Loss on sale of assetsDividends received
2 595–
1 145–
––
–(64 435)
Interest received (326 813) (408 925) (265 424) (624 074)
Finance costs 511 952 1 169 619 496 000 1 161 421
Impairment loss 253 902 14 449 739 708 172 12 637 239
Movements in retirement benefit assets and liabilities (5 409) (924) (5 409) (924)
Movements in provisions 262 912 (88 460) 72 536 (161 999)
Foreign exchange gain (205 046) (56 890) 65 879 57 775
Intangible assets written back 136
Changes in working capital:Decrease in inventories
–222 108 770 118
–234 619
–784 397
Decrease in trade and other receivables 911 866 403 188 878 969 371 307
(Decrease)/increase in trade and other payables (1 249 434) 364 008 (1 501 485) 306 481
2 092 461 3 470 966 1 418 719 2 746 419
23. Tax refunded
GROUP COMPANY
2016R’000
2015R’000
2016R’000
2015R’000
Charge to profit or loss (297 698) 874 432 – –
Movement in deferred taxation 384 392 (838 420) – –
Movement in taxation balance (49) (418) – –
Amounts refunded 86 645 35 594 – –
24. Auditors’ remuneration
GROUP COMPANY
2016R’000
2015R’000
2016R’000
2015R’000
Audit fee 7 860 8 014 7 277 6 890
Expenses 385 293 385 293
8 245 8 307 7 662 7 183

144 | PetroSA Integrated Annual Report 2016
FINANCIAL PERFORMANCE
Audited Annual Financial Statementsfor the year ended 31 March 2016
25. Government grants
PetroSA receives a government grant for training on projects. In terms of the signed agreement, PetroSA will receive a refund based on the cost incurred in order to provide specialised training on the project.
GROUP COMPANY
2016R’000
2015R’000
2016R’000
2015R’000
Grants received 12 333 2 073 12 333 2 073
26. Employee benefits
It is the policy of the group to provide retirement benefits for all its eligible permanent employees. All eligible permanent employees are members of the PetroSA Retirement Fund, a defined contribution fund, subject to the Pension Funds Act, 1956.
Pensions and Retirement Funds Defined contribution pension plan PetroSA Retirement FundThe company operates a defined contribution retirement plan, administered by Momentum, for the benefit of employees. All employees who commenced employment after 1 April 1996 qualify for membership of this fund. The amount recognised as an expense during the year under review was R114.9 million (2015: R122.2 million) for the retirement fund.
Medical benefitsPost-employment medical benefitsThe group has provided for an amount of R160.8 million of which R97.3 million was funded (2015: R155.6 million of which R103.4 million was funded). This is the funding of post-retirement medical scheme costs for all employees and pensioners. The commitment is actuarially valued annually, with the most recent valuation performed as at 31 March 2016.
The post-employment medical arrangement provides health benefits to retired employees and certain dependants. The benefit was applicable and on offer only to employees in the service of PetroSA before 1 May 2012.
During the 2013 financial year, PetroSA funded a portion of the post-retirement medical liability through the purchase of a company-funded annuity policy. As this annuity policy is CPI linked, the company is exposed to revaluation risks if medical inflation is higher than the CPI increases granted. The current value of the annuity policy is R97.3 million.
The net defined benefit obligation in respect of promised post-retirement medical scheme costs as at 31 March 2016 is R63.5 million (2015: R52.2 million). The obligation is partially funded and was valued using the “projected unit credit method”. A discount rate of 9.8% (2015: 8.5%) and a health care cost inflation of 8.25% (2015: 6.75%) were assumed. Mortality assumptions were in line with standard table SA56/62 ultimate (pre-retirement) and PA(90) rated down by two years (post-retirement).
A sensitivity analysis was performed on key assumptions. A 1% or 1 year-downward rating change in assumptions will increase or decrease the net obligation as follows:
Discount rate – R20.3 million and R16.4 million respectively (2015: R20.7 million and R16.9 million respectively) Mortality rate – R5 million and R4.7 million respectively (2015: R4.6 million and R4.5 million respectively).
Health care cost inflation: R19.9 million and R16.4 million respectively (2015: R20.3 million and R16.9 million respectively).
Notes to the Consolidated And Separate Financial Statements (continued)

PetroSA Integrated Annual Report 2016 | 145
26. Employee benefits (continued)
A 1% or 1 year-downward rating change in assumptions will increase or decrease combined interest and service cost as follows:
Discount rate – R18 million and R16.9 million respectively (2015: R15.7 million and R14.8 million respectively) Mortality rate – R18 million and R16.9 million respectively (2015: R15.7 million and R14.8 million respectively) Health care cost inflation – R19.7 million and R15.4 million respectively (2015: R17.4 million and R13.5 million respectively)
Post-employment medical defined benefit
GROUP COMPANY
2016R’000
2015R’000
2016R’000
2015R’000
Present value of funded obligations 160 811 155 650 160 811 155 650
Fair value of plan assets (97 285) (103 456) (97 285) (103 456)
Liability in the statement of financial position 63 526 52 194 63 526 52 194
The movement in the defined benefit obligation was as follows:
Defined benefit obligation at beginning of year 155 650 147 861 155 650 147 861
Current service cost 2 408 3 349 2 408 3 349
Interest cost 12 840 12 927 12 840 12 927
Benefit payments (9 192) (8 449) (9 192) (8 449)
Actuarial (gain)/loss (895) (38) (895) (38)
Defined benefit obligation at end of year 160 811 155 650 160 811 155 650
The movement in plan assets was as follows:
Market value of assets at beginning of year 103 456 101 869 103 456 101 869
Return on plan assets 9 317 9 883 9 317 9 883
Actuarial loss (8 408) (1 321) (8 408) (1 321)
Benefit payments (7 080) (6 975) (7 080) (6 975)
Market value of assets at end of year 97 285 103 456 97 285 103 456
Assumptions used:
Discount rate 9.75 % 8.50 % 9.75 % 8.50 %
Health care cost inflationMortality rate
8.25 %PA(90)–2
6.75 %PA(90)–2
8.25 %PA(90)–2
6.75 %PA(90)–2
The plan asset is unquoted. It is a policy of insurance. Therefore the split of the underlying investments is not readily available, and is most likely to be predominantly invested in CPI-linked bonds.
Defined benefit pension planThe company operated a defined benefit pension plan, the Mossgas Pension Fund, for the benefit of employees. The plan was governed by the Pension Funds Act, 1956 (Act no. 24 of 1956). The assets of the plan were administered by trustees in a fund independent of the company.
The fund was closed to new entrants during 1996. With effect from 1 October 2007 all in-service members were transferred out of the fund to the PetroSA Retirement Fund, and future accrual of benefits under the Pension Fund

146 | PetroSA Integrated Annual Report 2016
FINANCIAL PERFORMANCE
Audited Annual Financial Statementsfor the year ended 31 March 2016
ceased. Application was made to the Registrar to transfer the accrued benefits of in-service members to the PetroSA Retirement Fund, and to transfer the pensioner liabilities to individual annuity policies with Old Mutual. The Registrar’s approval was granted and all liabilities have been fully transferred.
The trustees have appointed a liquidator, the Registrar approved of this appointment and the fund was placed into liquidation in October 2010. Approval for the liquidation of the Mossgas Pension Fund was granted by the Registrar of Pension Funds on 25 September 2014 and amounts due were paid to the beneficiaries. The fund was liquidated in the current year.
27. Contingencies
GROUP COMPANY
2016R’000
2015R’000
2016R’000
2015R’000
Guarantees1. The group has issued guarantees for the rehabilitation of land
disturbed by mining on the Sable field. 180 000 180 000 180 000 180 000
2. The group has issued a manufacture and excisable bond in favour of the South African Revenue Service. 5 000 5 000 5 000 5 000
3. The group has issued an evergreen VAT guarantee in favour of the Dutch VAT Authorities (€0.5 million) 8 392 6 546 8 392 6 546
4. The group has issued a guarantee in lieu of a lease in the Netherlands (Eur0.016 million) 268 209 268 209
193 660 191 755 193 660 191 755
ClaimsPetroSA is considering settling a claim made by a former employee – 4 000 – 4 000
PetroSA is considering settling claims made in terms of contracts 13 798 81 834 13 798 81 834
13 798 85 834 13 798 85 834
Mbizana Integrated Energy CentrePetroSA may be liable for any soil contamination resulting from the dispensing of fuel at the Mbizana Integrated Energy Centre. The estimated financial impact is R1 million.
RestructuringPetroSA had notified employees in terms of section 189 of the Labour Relations Act 66 of 1995 of possible headcount reduction based on operational requirements, on 24 February 2015. It is not possible, at this time, to measure reliably the mandatory obligations arising from this notice, nor is it practicable to estimate their magnitude or possible timing of payment. In terms of the voluntary severange packages, R21.7 million was provided for at year- end.
PetroSA Ghana Ltd Corporate TaxOn 14 September 2012 PetroSA Ghana’s place of effective management changed to South Africa and the company became a tax resident in South Africa. The South African Income Tax legislation does not expressly deal with the tax treatment of the opening balances of capital expenditure on property, plant and equipment (and intangible assets) prior to commencing to be tax resident. Clarity in this regard is being sought from the South African Revenue Service and National Treasury. Furthermore, the deductibility, for South African income tax purposes, of fees paid to a previous lender is unclear. In the event that no deduction is allowed in respect of capital expenditure prior to 14 September 2012, nor for fees paid to a previous lender, the aggregate estimated normal tax liability for the 2012 to 2014 years would be in the region of R325 million (USD22 million).
Notes to the Consolidated And Separate Financial Statements (continued)

PetroSA Integrated Annual Report 2016 | 147
28. Commitments
GROUP COMPANY
2016R’000
2015R’000
2016R’000
2015R’000
Authorised capital expenditure
Approved by the directors
Contracted for 862 614 1 504 410 – 247 850
Not contracted for – 1 347 137 – 1 347 137
862 614 2 851 547 – 1 594 987
Operating lease commitments
PetroSA
– within one year 867 1 663 867 1 663
– in second to fifth year inclusive – 867 – 867
867 2 530 867 2 530
Office space is leased at 1 Protea Place in Sandton, Johannesburg, effective from 1 October 2011. The lease payment is fixed at R102 420 per month with a 9% escalation per annum. The lease period is five years and ends on 30 September 2016.
PetroSA – George airport space– within one year 654 600 654 600
– in second to fifth year inclusive 341 996 341 996
995 1 596 995 1 596
Office space is leased at the general aviation area of the George Airport effective from 1 October 2012. The lease payment is fixed at R40 291 per month with a 9% escalation per annum. The lease period is five years and ends on 30 September 2017.
PetroSA – Mozambican office space
– within one year – 25 – 25
PetroSA leases furnished office space in Mozambique at a monthly rental fee of 48,000Mtn. The lease term is for one year starting on 1 July 2012 and has been extended annually. The lease agreement was terminated on 30 April 2015.
PetroSA – TNPA
– within one year 4 420 4 055 4 420 4 055
– in second to fifth year inclusive 22 035 20 215 22 035 20 215
– later than five years 6 801 13 041 6 801 13 041
33 256 37 311 33 256 37 311
PetroSA leases premises and other properties from Transnet National Ports Authority at a monthly fee of R260 964 escalating at 9%. The lease term of 10 years commenced on 1 April 2012.
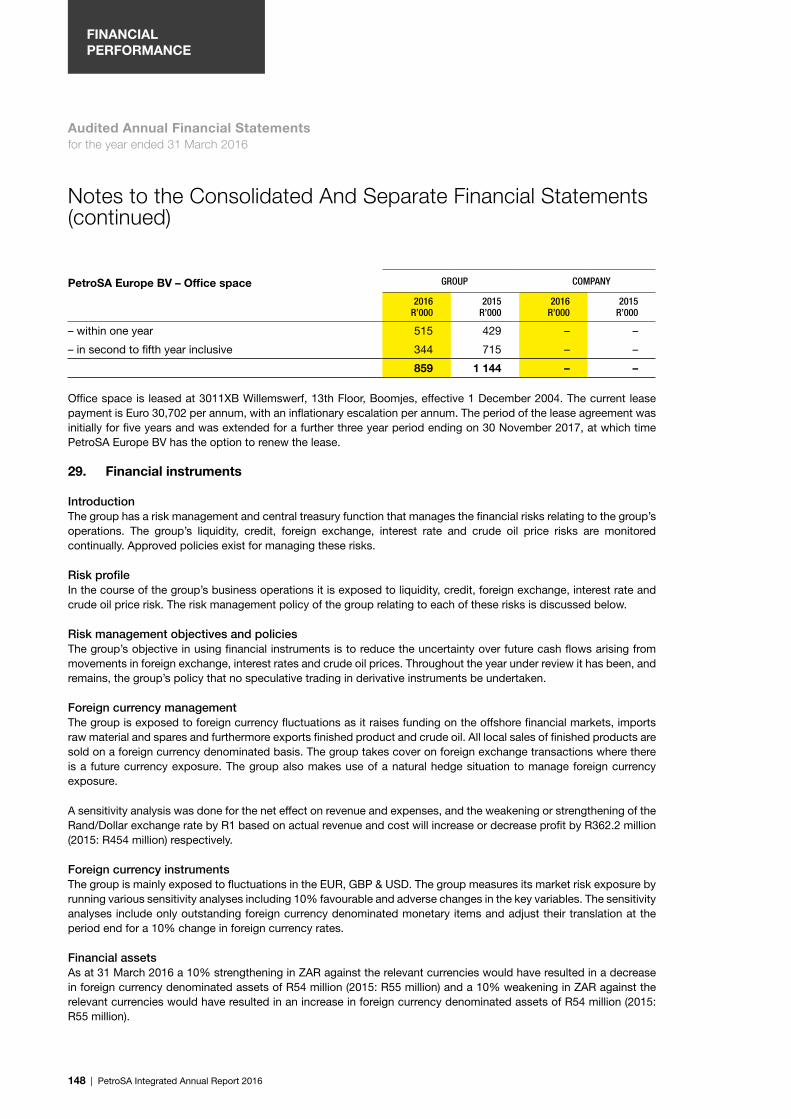
148 | PetroSA Integrated Annual Report 2016
FINANCIAL PERFORMANCE
Audited Annual Financial Statementsfor the year ended 31 March 2016
PetroSA Europe BV – Office space GROUP COMPANY
2016R’000
2015R’000
2016R’000
2015R’000
– within one year 515 429 – –
– in second to fifth year inclusive 344 715 – –
859 1 144 – –
Office space is leased at 3011XB Willemswerf, 13th Floor, Boomjes, effective 1 December 2004. The current lease payment is Euro 30,702 per annum, with an inflationary escalation per annum. The period of the lease agreement was initially for five years and was extended for a further three year period ending on 30 November 2017, at which time PetroSA Europe BV has the option to renew the lease.
29. Financial instruments
IntroductionThe group has a risk management and central treasury function that manages the financial risks relating to the group’s operations. The group’s liquidity, credit, foreign exchange, interest rate and crude oil price risks are monitored continually. Approved policies exist for managing these risks.
Risk profileIn the course of the group’s business operations it is exposed to liquidity, credit, foreign exchange, interest rate and crude oil price risk. The risk management policy of the group relating to each of these risks is discussed below.
Risk management objectives and policiesThe group’s objective in using financial instruments is to reduce the uncertainty over future cash flows arising from movements in foreign exchange, interest rates and crude oil prices. Throughout the year under review it has been, and remains, the group’s policy that no speculative trading in derivative instruments be undertaken.
Foreign currency managementThe group is exposed to foreign currency fluctuations as it raises funding on the offshore financial markets, imports raw material and spares and furthermore exports finished product and crude oil. All local sales of finished products are sold on a foreign currency denominated basis. The group takes cover on foreign exchange transactions where there is a future currency exposure. The group also makes use of a natural hedge situation to manage foreign currency exposure.
A sensitivity analysis was done for the net effect on revenue and expenses, and the weakening or strengthening of the Rand/Dollar exchange rate by R1 based on actual revenue and cost will increase or decrease profit by R362.2 million (2015: R454 million) respectively.
Foreign currency instrumentsThe group is mainly exposed to fluctuations in the EUR, GBP & USD. The group measures its market risk exposure by running various sensitivity analyses including 10% favourable and adverse changes in the key variables. The sensitivity analyses include only outstanding foreign currency denominated monetary items and adjust their translation at the period end for a 10% change in foreign currency rates.
Financial assetsAs at 31 March 2016 a 10% strengthening in ZAR against the relevant currencies would have resulted in a decrease in foreign currency denominated assets of R54 million (2015: R55 million) and a 10% weakening in ZAR against the relevant currencies would have resulted in an increase in foreign currency denominated assets of R54 million (2015: R55 million).
Notes to the Consolidated And Separate Financial Statements (continued)

PetroSA Integrated Annual Report 2016 | 149
Financial liabilitiesAs at 31 March 2016 a 10% strengthening in ZAR against the relevant currencies would have resulted in a decrease in foreign currency denominated liabilities of R67.6 million (2015: R133 million) and a 10% weakening in ZAR against the US Dollar would have resulted in an increase in foreign currency denominated liabilities of R67.6 million (2015: R133 million).
Currency riskThe Company has entered into certain forward exchange contracts which do not relate to specific items appearing on the Statement of Financial Position but which were entered into to cover foreign commitments not yet due and proceeds not yet received. The contracts will be utilised for purposes of trade.
Exchange rates used for conversion of foreign currency items were:
Closing rate 2016 2015
USD 14.7853 12.2093
Euro 16.7842 13.0932
GBPAverage:USD
21.2686
13.7835
18.0245
11.0602
Euro 15.2119 13.9828
GBP 20.7225 18.8107
Forward foreign exchange contracts2016Total foreign currencyLiabilitiesUSD 16 691 061
Average forward exchange rate14.8
Maturity dateLess than 3 months
2015Total foreign currencyLiabilitiesUSD 104 390 069
Average forward exchange rate
12.2753
Maturity date
Less than 3 months
GBP 315 242 18.0485 Less than 3 months
GBP 52 540 18.4643Longer than 3 months but
less than 6 months
As at 31 March 2016, a 10% relative change in the USD to the ZAR would have impacted profit or loss for the year by R24.7 million (2015: R128.1 million).
Fair value Estimated fair value (loss)/gain
R’000 2016 2015 2016 2015
Forward exchange contracts – assets – – – –
Forward exchange contracts – liabilities (16 691) (1 287 989) (10 788) 72 260
(16 691) (1 287 989) (10 788) 72 260
These amounts are included in other receivables and payables.

150 | PetroSA Integrated Annual Report 2016
FINANCIAL PERFORMANCE
Audited Annual Financial Statementsfor the year ended 31 March 2016
29. Financial instruments (continued)
Credit riskFinancial assets, which potentially subject the group to concentrations of credit risk, pertain principally to trade receivables and investments in the South African money market. Trade receivables of R1.4 billion (2015: R2.2 billion) are presented net of the allowance for doubtful debts.
The exposure to credit risk with respect to trade receivables is not concentrated due to a large customer base.
The group manages counter-party exposures arising from money market and derivative financial instruments by only dealing with well-established financial institutions of a high credit rating. Losses are not expected as a result of non- performance by these counter parties.
Credit limits with financial institutions are revised and approved by the Board annually.
Maturity profileThe maturity profiles of financial assets and liabilities at the reporting date are as follows:
GROUP at 31 March 2016
Assets Less than 1 yearBetween
1 and 5 years Over 5 yearsNon-interest
bearing Total
Cash 3 689 584 – – – 3 689 584
Other financial assets 1 452 765 339 804 198 400 – 1 990 969
Trade and other receivables 1 803 134 – – – 1 803 134
Amounts held by holding company – 489 021 – – 489 021
Total financial assets 6 945 483 828 825 198 400 – 7 972 708
LiabilitiesTrade and other payables 2 047 075 – – – 2 047 075
Other financial liabilities 1 201 244 – – – 1 201 244
Forward exchange contracts 10 788 – – – 10 788
Bank overdrafts 417 202 – – – 417 202
Total financial liabilities 3 676 309 – – – 3 676 309
At 31 March 2015 Less than 1 yearBetween
1 and 5 years Over 5 yearsNon-interest
bearing Total
AssetsCash 4 349 053 – – 4 349 053
Other financial assets 32 495 205 520 153 732 – 391 747
Trade and other receivables 2 542 699 – – – 2 542 699
Forward exchange contracts 72 260 – – – 72 260
Amounts held by holding company – 489 021 – – 489 021
Total financial assets 6 996 507 694 541 153 732 – 7 844 780
Trade and other payables 3 100 790 – – – 3 100 790
Other financial liabilities 865 496 – – – 865 496
Bank overdrafts 286 761 – – – 286 761
Total financial liabilities 4 253 047 – – – 4 253 047
Notes to the Consolidated And Separate Financial Statements (continued)

PetroSA Integrated Annual Report 2016 | 151
29. Financial instruments (continued)
COMPANY at 31 March 2016
AssetsLess than
1 yearBetween
1 and 5 years Over 5 yearsNon-interest
bearing Total
Cash 3 493 303 – – – 3 493 303
Other financial assets 1 435 239 213 159 198 400 – 1 846 798
Trade and other receivables 1 772 524 – – – 1 772 524
Amounts held by holding company – 489 021 – – 489 021
Total financial assets 6 701 066 702 180 198 400 – 7 601 646
LiabilitiesTrade and other payables 1 619 408 – – – 1 619 408
Forward exchange contracts 10 788 – – – 10 788
Bank overdrafts 417 202 – – – 417 202
Total financial liabilities 2 047 398 – – – 2 047 398
At 31 March 2015
AssetsLess than
1 yearBetween
1 and 5 years Over 5 yearsNon-interest
bearing Total
Cash 3 759 866 – – – 3 759 866
Other financial assets – 153 190 153 732 – 306 922
Trade and other receivables 2 486 202 – – – 2 486 202
Forward exchange contracts 72 260 – – – 72 260
Amounts held by holding company – 489 021 – – 489 021
Total financial assets 6 318 328 642 211 153 732 – 7 114 271
LiabilitiesTrade and other payables 2 925 525 – – – 2 925 525
Bank overdrafts 286 761 – – – 286 761
Total financial liabilities 3 212 286 – – – 3 212 286
Liquidity riskThe group manages liquidity risk by monitoring forecast cash flows and ensuring that adequate cash resources are available to meet cash commitments.
Price riskExternal sales and purchases are subject to price and basis risks associated with volume and timing differences.
A sensitivity analysis was performed for revenue and every $1 increase or decrease in the Brent crude oil price will increase or decrease profit by R109.7 million (2015: R60.2 million) respectively, based on the 2015/16 financial results.

152 | PetroSA Integrated Annual Report 2016
FINANCIAL PERFORMANCE
Audited Annual Financial Statementsfor the year ended 31 March 2016
29. Financial instruments (continued)
Interest rate risk
Exposure to interest rate risk on liabilities and investments is monitored on a proactive basis. The financing of the group is structured on a combination of floating and fixed interest rates.
The following table sets out the carrying amount, by maturity, of the group’s financial instruments that are exposed to interest rate risk and the effective interest rates applicable:
At 31 March 2016
Floating RateCash and cash equivalents (7.51%) 3 493 303 – – 3 493 303
Cash on deposit (7.33%) – 489 021 – 489 021
Bank overdraft (4.74%) (417 202) – – (417 202)
Lurgi (0.51%) – – 198 400 198 400
GTL.F1 (0.81%) – 213 159 – 213 159
At 31 March 2015
Fixed RateLess than 1 year
Between 1 and 5 years Over 5 years Total
Cash and cash equivalents (6.25%) 2 402 069 – – 2 402 069
Cash on deposit (5.98%) – 489 021 – 489 021
Floating RateCash and cash equivalents (5.87%) 1 357 797 – – 1 357 797
Bank overdraft (3.58%) (286 761) – – (286 761)
Lurgi (0.77%) – – 153 732 153 732
GTL.F1 (1.07%) – 153 190 – 153 190
Interest rate InstrumentsAs at 31 March 2016, a 10% relative change in the:
• ZAR interest rate would have impacted profit or loss for the year by R26.7 million (2015: R25.9 million)• EURIBOR interest rate would have impacted profit or loss for the year by R0.3 million (2015: R0.3 million)• USDLIBOR interest rate would have impacted profit or loss for the year by R0.6 million (2015: R0 million)
Market riskThe group’s activities expose it primarily to the financial risks of changes in commodity prices and foreign currency exchange rates. Refer to note 31 for foreign currency risk management and price risk management.
Notes to the Consolidated And Separate Financial Statements (continued)

PetroSA Integrated Annual Report 2016 | 153
30. Fair value information
GROUP COMPANY
2016R’000
2015R’000
2016R’000
2015R ‘R’000
Fair value hierarchy
The table below analyses assets and liabilities carried at fair value.
Levels of fair value measurements
Level 2
Financial assets and liabilities at fair value through profit or lossForeign exchange contracts – asset – 72 260 – 72 260
Foreign exchange contracts – liability (10 788) – (10 788) –
Total (10 788) 72 260 (10 788) 72 260
PetroSA enters into derivative financial instruments with various counterparties, principally financial institutions with investment grade credit ratings. Foreign exchange forward contracts are valued using valuation techniques, which employ the use of market observable inputs. The most frequently applied valuation technique uses a forward pricing model. The model incorporates various inputs including the credit quality of counterparties, foreign exchange spot and forward rates, yield curves and currency basis spreads between the respective currencies.
No changes have been made to the valuation technique. The carrying value of loans approximates their fair value.
31. Financial assets by category
The accounting policies for financial instruments have been applied to the line items below:
GROUP 2016Loans and
receivables Total
Other financial assets 538 204 538 204
Amounts held by holding company 489 021 489 021
Trade and other receivables 1 803 134 1 803 134
Cash and cash equivalents 3 689 584 3 689 584
Restricted cash 1 452 765 1 452 765
7 972 708 7 972 708
GROUP 2015Loans and
receivables Total
Other financial assets 359 252 359 252
Amounts held by holding company 489 021 489 021
Trade and other receivables 2 542 699 2 542 699
Forward exchange contracts 72 260 72 260
Cash and cash equivalents 4 349 053 4 349 053
7 812 285 7 812 285

154 | PetroSA Integrated Annual Report 2016
FINANCIAL PERFORMANCE
Audited Annual Financial Statementsfor the year ended 31 March 2016
31. Financial assets by category (continued)
COMPANY 2016 Loans and receivables Total
Other financial assets 411 559 411 559
Amounts held by holding company 489 021 489 021
Trade and other receivables 1 772 524 1 772 524
Cash and cash equivalents 3 493 303 3 493 303
Loan to subsidiary 1 435 239 1 435 239
7 601 646 7 601 646
COMPANY 2015 Loans and receivables Total
Other financial assets 306 922 306 922
Amounts held by holding company 489 021 489 021
Trade and other receivables 2 486 202 2 486 202
Forward exchange contracts 72 260 72 260
Cash and cash equivalents 3 759 866 3 759 866
7 114 271 7 114 271
32. Financial liabilities by category
The accounting policies for financial instruments have been applied to the line items below:
GROUP 2016Financial liabilitiesat amortised cost
Fair value throughprofit or loss – designated Total
Other financial liabilities 1 201 244 – 1 201 244
Trade and other payables 2 047 075 – 2 047 075
Forward exchange contracts – 10 788 10 788
Bank overdraft 417 202 – 417 202
3 665 521 10 788 3 676 309
GROUP 2015Financial liabilities at
amortised cost Total
Other financial liabilities 865 496 865 496
Trade and other payables 3 100 790 3 100 790
Bank overdraft 286 761 286 761
4 253 047 4 253 047
Notes to the Consolidated And Separate Financial Statements (continued)

PetroSA Integrated Annual Report 2016 | 155
COMPANY 2016Financial liabilitiesat amortised cost
Fair value throughprofit or loss –
designated Total
Trade and other payables 1 619 408 – 1 619 408
Forward exchange contracts – 10 788 10 788
Bank overdraft 417 202 – 417 202
2 036 610 10 788 2 047 398
COMPANY 2015Financial liabilities at amortised cost Total
Trade and other payables 2 925 525 2 925 525
Bank overdraft 286 761 286 761
3 212 286 3 212 286
33. Directors’ emoluments
Year ended 31 March 2016
ExecutiveDirectors Salary/ Fee
Bonuses and performance
paymentsPension
contributionsOther
contributionsActing
allowance Leave paySpecialpayout Total
NN Nokwe 2 631 – 324 82 – 165 2 346 5 548
LE Bakoro 1 942 875 322 85 – 241 3 545 7 010
Total 4 573 875 646 167 – 406 5 891 12 558
Non-executive Directors Salary/ Fee
Bonuses andpayments Pension
Expenses performance
Other contributions
Compensationfor loss of office Other Total
BW Ngubane 1 047 – – – 240 – – 1 287
S Mokoena 1 136 – – – 96 – – 1 232
S Hlatshwayo 215 – – – 6 – – 221
GN Jiyane 710 – – – 50 – – 760
W Steenkamp 1 068 – – – 247 – – 1 315
O Tobias 861 – – – 246 – –
J Ntwane 1 043 – – – 261 – – 1 304
S Mthethwa – – – – 27 – – 27
MW Mkhize – – – – 39 – – 39
BDC Makhubela 283 – – – 45 – – 328
MF Baleni 372 – – – 49 – – 421
TB Hlongwa 232 – – – 41 – – 273
TI Rakgoale 65 – – – 2 – – 67
Total 7 032 – – – 1 349 – – 8 381

156 | PetroSA Integrated Annual Report 2016
FINANCIAL PERFORMANCE
Audited Annual Financial Statementsfor the year ended 31 March 2016
33. Directors’ emoluments (continued)
ExecutiveManagement Salary/Fee
Bonuses and performance
paymentsPension
contributionsOther
contributionsActing
allowance Leave pay Other Total
JEP Falbe (1) 1 017 – – 46 – – – 1 063
B Zwane (2) 1 360 – 246 181 354 – – 2 141
P Luthuli (1) 413 – 50 28 – 136 – 627
M Modipa 2 091 – 242 146 292 – 25 2 796
K Zono (2) 1 683 – 263 149 196 – – 2 291
A Dippenaar (2) 1 773 – 262 162 291 247 – 2 735
W Fanadzo (2) 922 – 158 59 161 – – 1 300
O Mohapanele (2) 751 – 156 96 163 – – 1 166
N Ramchander 1 005 – 119 82 191 – – 1 397
T Manne (2) 1 073 – 153 59 204 – – 1 489
Total 12 088 – 1 649 1 008 1 852 383 25 17 005
1 – Resigned 2 – Acting Vice Presidents appointed during the year
Year ended 31 March 2015
Executive Directors Salary/Fee
Bonuses andperformanc payments
Pension contributions
Other contributions Expenses
Acting allowance Other Total
NN Nokwe 3 694 – 424 151 – – – 4 269
LE Bakoro 2 780 – 464 114 – – – 3 358
Total 6 474 – 888 265 – – – 7 627
Non-executiveDirectors Salary/Fee
Bonuses and performance
paymentsPension
contributionsOther
contributions Expenses
Compensationfor loss of
office Other Total
S Mncwango – – – – 51 – – 51
ACG Molusi 376 – – – 5 – – 381
FE Letlape 529 – – – 64 – – 593
MM Zwane 467 – – – 20 – – 487
V Sibiya – – – – 37 – – 37
GC Smith 272 – – – 37 – – 309
B Madumise 710 – – – 58 – – 768
S Mokoena 825 – – – 93 – – 918
S Hlatshwayo 679 – – – 66 – – 745
GN Jiyane 287 – – – 28 – – 315
BW Ngubane 186 – – – 21 – – 207
W Steenkamp 229 – – – 72 – – 301
O Tobias 159 – – – 9 – – 168
Notes to the Consolidated And Separate Financial Statements (continued)

PetroSA Integrated Annual Report 2016 | 157
Non-executiveDirectors Salary/Fee
Bonuses and performance
paymentsPension
contributionsOther
contributions Expenses
Compensationfor loss of
office Other Total
J Ntwane 200 – – – 45 – – 245
S Mthethwa – – – – 5 – – 5
MW Mkhize – – – – 6 – – 6
Total 4 919 – – – 617 – – 5 536
ExecutiveManagement Salary/Fee
Bonuses andperformance
paymentsPension
contributionsOther
contributionsActing
allowance
Longservice/
Relocation allowance
Expatriateallowance Total
JEP Falbe 2 827 – 138 161 – – 1 359 4 485
D Arendse (1) – 439 – – – – – 439
T Kgogo (2) 391 – 26 18 – 90 – 525
B Zwane (3) 1 226 299 228 202 354 – – 2 309
G Griessel (2) 553 (921) 78 24 – – – (266)
X Hewu (3) 716 – 80 14 62 – – 872
P Luthuli 1 558 – 181 160 – – – 1 899
M Modipa 1 167 – 117 70 – – – 1 354
K Zono (3) 1 269 68 152 115 128 – – 1 732
A Dippenaar (3) 1 691 414 250 149 166 – – 2 670
Total 11 398 299 1 250 913 710 90 1 359 16 019
1 – Contract expired2 – Resigned3 – Acting Vice Presidents appointed during the year
34. Related parties
GROUP COMPANY
2016R’000
2015R’000
2016R’000
2015R’000
Related party transactions
CEF SOC LtdCash on call 489 021 489 021 489 021 489 021
Accrued interest 3 001 2 485 3 001 2 485
Services received 38 100 38 100
Interest received 31 761 28 699 31 761 28 699
Recoveries 95 771 95 771
Trade receivables – 101 – 101
Trade payable 106 148 106 148
PASAServices received 5 20 5 20
Royalties paid 5 3 5 3
Trade payable – 15 – 15

158 | PetroSA Integrated Annual Report 2016
FINANCIAL PERFORMANCE
Audited Annual Financial Statementsfor the year ended 31 March 2016
GROUP COMPANY
2016R’000
2015R’000
2016R’000
2015R’000
SFFTrade payable 22 – 22 –
Training – 124 – 124
Recoveries – 854 – 854
SubsidiariesLoan forgiveness – – 2 964 2 021 054
Loans owing – – 1 1
Management fee – – 4 180 5 821
Recoveries – – 6 859 7 069
Interest received – – – 218 132
Commission paid – – 29 605 31 859
Dividends – – – 64 435
Trade receivable – – 2 043 6 266
Trade payable – – 566 7 020
The above transactions were carried out on commercial terms and conditions. All outstanding balances are payable in cash.
35. Public finance management act
GROUP COMPANY
2016R’000
2015R’000
2016R’000
2015R’000
Fruitless and wasteful expenditureItems individually < R50 000 11 55 11 55
Penalties and interest paid to Tax AuthoritiesNon-performance penaltiesInterest on late payment of invoicesMisplaced/stolen items
402–
87–
–1 302
–110
402–
87–
–1 302
–110
Contract cancellation fee – 135 – 135
Overpayment of retrenchment package – 291 – –
500 1 893 500 1 602
Refer to the Directors’ Report, note 11 for further details. The appropriate corrective and/or disciplinary actions have been taken (where necessary).
SARS conducted an integrated VAT audit. The penalties were waived but not the interest. An assessment of R0.4 million was raised.
PetroSA was charged interest of R0.087 million on the late payment of an invoice.
34. Related parties (continued)
Notes to the consolidated and separate Financial Statements (continued)

PetroSA Integrated Annual Report 2016 | 159
35. Public finance management act (continued)
GROUP COMPANY
2016R’000
2015R’000
2016R’000
2015R’000
Fruitless and wasteful expenditure movementIncurred during the year 500 1 893 500 1 602
Recognised as expense during the year (500) (1 893) (500) (1 602)
Closing balance – – – –
Irregular transactionsContravention of company policy 511 16 937 511 16 937
Contravention of company policy
Training, together with travel and accommodation costs, were incurred outside of the company policy. An investigation was initiated to identify and prevent further irregular expenditure incurred in contravention of company policy.
GROUP COMPANY
2016R’000
2015R’000
2016R’000
2015R’000
Irregular expenditure movement
Opening balance 2 453 701 2 453 690 2 453 701 2 453 690
Incurred during the year 511 16 937 511 16 937
Condoned during the year – (16 926) – (16 926)
Closing balance 2 454 212 2 453 701 2 454 212 2 453 701
36. Subsequent events
On 29 February 2016, PetroSA Ghana Limited drew down $10 million from its Reserve Based Lending Facility. A second draw down of $15 million was made on 29 April 2016. The available facility amount/borrowing base is redetermined six monthly at the end of June and December and is a function of the present value of future cash flows generated by producing/developing assets. The available facility amount is most sensitive to economic assumptions such as the Brent crude oil price and changes to independently audited oil reserves. No short term portion could be determined at year end hence no disclosure has been made in the financial statements.
The agreement for a loan facility of $60 million was signed between PetroSA Ghana Limited and PetroSA on 20 June 2016. An amount of $17.7 million has been drawn down to date.
The directors are not aware of any matters or circumstances arising since the end of the financial year, not otherwise dealt with in the financial statements which significantly affect the financial position of the group or the result of the operations.

160 | PetroSA Integrated Annual Report 2016
FINANCIAL PERFORMANCE
Audited Annual Financial Statementsfor the year ended 31 March 2016
37. Interest in joint operating agreements
The group’s proportionate share in the assets and liabilities of unincorporated joint ventures, which are included in the financial statements are as follows:
2016 Percentage Holding/Tracts
24%Block 2A
35%Block 2C
50%Block3A/4A
20%Block 5/6/7
40%Block 1
Partners:Sunbird 76%
Anadarko 65%
Sasol 50%
Anadarko 80%
Cairn 60%
Nature of project Exploration Exploration Exploration Exploration Exploration
2015 Percentage Holding/Tracts
24%Block 2A
35%Block 2C
50%Block3A/4A
20%Block 5/6/7
40%Block 1
Partners:Sunbird 76%
Anadarko 65%
Sasol 50%
Anadarko 80%
Cairn 60%
Nature of project Exploration Exploration Exploration Exploration Exploration
Notes to the consolidated and separate Financial Statements (continued)

PetroSA Integrated Annual Report 2016 | 161
Fields in production and under development
1. Movement in net remaining proved and probable reserves
Crude oil/ Condensate MMbbl
2016Gas Bscf
2016
Crude oil/ Condensate MMbbl
2015Gas Bscf
2015
At beginning of year 18.10 97.60 26.40 392.30
Revisions of previous estimates (0.06) 23.00 (4.95) (256.10)
Production (1.67) (44.80) (1.90) (38.60)
Additions 1.12 – (1.45) –
At end of year 17.49 75.80 18.10 97.60
2. Proved and probable reserves by type of field
Fields in production 9.09 69.30 8.90 56.85
Fields under development 8.40 6.50 9.20 40.75
17.49 75.80 18.10 97.60
3. Reserves by category
Proved 0.90 38.40 11.20 39.60
Proved and probable 17.49 75.80 18.10 97.60
Total proved and probable reserves at end of year 17.49 75.80 18.10 97.60
OilFields in production and under development comprise the Jubilee (2.73%), Oribi (100%) and Oryx (100%) oil fields.
GasFields in production and under development comprise the F-A and F-A Satellite, E-M and E-M Satellite and FO gas fields respectively.
Fields under appraisal comprise discoveries. The reserves shown are either all oil or all gas, excluding gas liquids. Oil includes condensate and LPG.
Reserves and production are shown on a working interest basis (100%). Reserves were generated using a reservoir simulator that incorporated PetroSA’s production philosophy. Oil and gas reserves cannot be measured exactly since the estimation of reserves involves subjective judgement and arbitrary determinations and therefore all estimations are subject to revision. The gas and oil reserves reflected above have been determined by independent reservoir engineers.
Revisions of previous estimates (2015)The decrease in gas reserves can be ascribed to the following events:
• The shift in the end of plateau date from 2021 to 2019, resulted in a decrease in the reserves from FA and FA Satellites, EM and EM Satellites and SCG field as the tail gas from these fields can no longer be unlocked.
• The negative impact of the shift in the F-O field first gas date and decrease in recoverable volumes from the field. This is due to the drilling campaign being reduced from a 5-well campaign to a 3-well campaign as well as lower than expected production volumes.

162 | PetroSA Integrated Annual Report 2016
FINANCIAL PERFORMANCE
Audited Annual Financial Statementsfor the year ended 31 March 2016
Definition of financial terms
Revisions of previous estimates (2015) (continued)Below is a list of definitions of financial terms used in the annual report of PetroSA SOC Limited and the group:
Accounting policiesThe specific principles, bases, conventions, rules and practices applied in preparing and presenting annual financial statements.
Accrual accountingThe effects of transactions and other events are recognised when they occur rather than when the cash is received.
AcquireeThe business or businesses that the acquirer obtains control of in a business combination.
AcquirerThe entity that obtains control of the acquiree.
Acquisition dateThis is the date on which the acquirer obtains control of the acquiree.
Active marketA market in which transactions for the asset or liability take place with sufficient frequency and volume to provide pricing information on an ongoing basis.
Actuarial gains and lossesThe changes in the present value of the defined benefit obligation resulting from experience adjustments (the effects of differences between the previous actuarial assumptions and what have actually occurred) as well as the effects of changes in actuarial assumptions.
Amortisation (depreciation)The systematic allocation of the depreciable amount of an asset over its useful life.
Amortised costThe amount at which a financial asset or financial liability is measured at initial recognition, minus principal repayments, plus or minus the cumulative amortisation using the effective interest method of any difference between that initial amount and the maturity amount, and minus any reduction for impairment or uncollectability.
AssetA resource controlled by the entity as a result of a past event from which future economic benefits are expected to flow.
Assets under constructionA non-current asset which includes expenditure capitalised for work in progress in respect of activities to develop, expand or enhance items of property, plant and equipment, intangible assets and exploration assets.
Borrowing costsInterest and other costs incurred in connection with the borrowing of funds.
BusinessAn integrated set of activities and assets that is capable of being conducted and managed for the purpose of providing a return in the form of dividends, lower costs or other economic benefits directly to investors or other owners, members or participants.

PetroSA Integrated Annual Report 2016 | 163
Business combinationA transaction or other event in which an acquirer obtains control of one or more businesses.
Carrying amountThe amount at which an asset is recognised after deducting any accumulated depreciation or amortisation and accumulated impairment losses.
Cash and cash equivalentsCash comprises cash on hand and demand deposits. Cash equivalents are short-term, highly liquid investments that are readily convertible to known amounts of cash and that are subject to an insignificant risk of changes in value.
Cash-generating unitThe smallest identifiable group of assets that generates cash inflows that are largely independent of the cash inflows from other assets or groups of assets.
Change in accounting estimateAn adjustment to the carrying amount of an asset, liability or the amount of the periodic consumption of an asset that results from new information or new developments. Changes in accounting estimates are not corrections of errors.
Consolidated annual financial statementsThe annual financial statements of a group presented as those of a single economic entity.
Constructive obligationAn obligation that derives from an entity’s actions where:
(a) by an established pattern of past practice, published policies or a sufficiently specific current statement, the entity has indicated to other parties that it will accept certain responsibilities; and
(b) as a result, the entity has created a valid expectation on the part of those other parties that it will discharge those responsibilities.
Contingent assetA possible asset that arises from past events and whose existence will be confirmed only by the occurrence or non- occurrence of one or more uncertain future events not wholly within the control of the entity.
Contingent liabilityA possible obligation that arises from past events and whose existence will be confirmed only by the occurrence or non- occurrence of one or more uncertain future events not wholly within the control of the entity, or a present obligation that arises from past events but is not recognised because it is not probable that an outflow of resources embodying economic benefits will be required to settle the obligation, or the amount of the obligation cannot be measured with sufficient reliability.
ControlAn investor controls an investee when the investor is exposed, or has rights, to variable returns from its involvement with the investee and has the ability to affect those returns through its power over the investee.
Corporate assetsAssets other than goodwill that contribute to the future cash flows of both the cash generating unit under review and other cash generating units.
Costs to sellThe incremental costs directly attributable to the disposal of an asset (or disposal group), excluding finance costs and income tax expense.

164 | PetroSA Integrated Annual Report 2016
FINANCIAL PERFORMANCE
Audited Annual Financial Statementsfor the year ended 31 March 2016
Credit riskThe risk that one party to a financial instrument will cause a financial loss for the other party by failing to discharge an obligation.
Currency riskThe risk that the fair value or future cash flows of a financial instrument will fluctuate because of changes in foreign exchange rates.
Date of transactionThe date on which the transaction first qualifies for recognition in accordance with International Financial Reporting Standards.
Deferred tax assetsThe amounts of income taxes recoverable in future periods in respect of deductible temporary differences, the carry forward of unused tax losses and the carry forward of unused tax credits.
Deferred tax liabilitiesThe amounts of income taxes payable in future periods in respect of taxable temporary differences.
Depreciation (or amortisation)The systematic allocation of the depreciable amount of an asset over its useful life. The depreciable amount of an asset is the cost of an asset, or other amount substituted for cost, less its residual value.
DerecognitionThe removal of a previously recognised asset or liability from the statement of financial position.
DerivativeA financial instrument whose value changes in response to an underlying item, requires no initial or little net investment in relation to other types of contracts that would be expected to have a similar response to changes in market factors and is settled at a future date.
DevelopmentThe application of research findings or other knowledge to a plan or design for the production of new or substantially improved materials, devices, products, processes, systems or services before starting commercial production or use.
Effective interest methodA method of calculating the amortised cost of a financial asset or a financial liability (or group of financial assets or financial liabilities) and of allocating the interest income or interest expense over the relevant period.
Effective interest rateThe rate that exactly discounts estimated future cash payments or receipts through the expected life of the financial instrument or, when appropriate, a shorter period to the net carrying amount of the financial asset or financial liability.
Employee benefitsAll forms of consideration (excluding share options granted to employees) given in exchange for services rendered by employees or for the termination of employment.
Equity instrumentA contract or certificate that evidences a residual interest in the total assets after deducting the total liabilities.
Definition of financial terms (continued)

PetroSA Integrated Annual Report 2016 | 165
Equity methodA method in which the investment is initially recognised at cost and adjusted thereafter for the post-acquisition change in the share of net assets of the investee. Profit or loss includes the investor’s share of the profit or loss of the investee.
Events after the reporting period (Subsequent events)Those events, favourable and unfavourable, that occur between the end of the reporting period and the date when the financial statements are authorised for issue. Two types of events can be identified:
(a) those that provide evidence of conditions that existed at the end of the reporting period (adjusting events after the reporting period); and
(b) those that are indicative of conditions that arose after the reporting period (non-adjusting events after the reporting period).
Exchange differenceThe difference resulting from translating a given number of units of one currency into another currency at different exchange rates.
ExpensesThe decreases in economic benefits in the form of outflows or depletions of assets or incurrences of liabilities that result in decreases in equity, other than those relating to distributions to equity participants.
Fair valueThe amount for which an asset could be exchanged, a liability settled, or an equity instrument granted could be exchanged, between knowledgeable, willing parties in an arm’s length transaction.
Financial asset Any asset that is: (a) cash;(b) an equity instrument of another entity;(c) a contractual right (i) to receive cash or another financial asset from another entity; or (ii) to exchange financial
assets or financial liabilities with another entity under conditions that are potentially favourable to the entity; or(d) a contract that will or may be settled in the entity’s own equity instruments and is (i) a non-derivative for which the
entity is or may be obliged to receive a variable number of the entity’s own equity instruments; or (ii) a derivative that will or may be settled other than by the exchange of a fixed amount of cash or another financial asset for a fixed number of the entity’s own equity instruments. For this purpose the entity’s own equity instruments do not include puttable financial instruments classified as equity instruments in accordance with paragraphs 16A and 16B of IAS 32, instruments that impose on the entity an obligation to deliver to another party a pro rata share of the net assets of the entity only on liquidation and are classified as equity instruments in accordance with paragraphs 16C and 16D of IAS 32, or instruments that are contracts for the future receipt or delivery of the entity’s own equity instruments.
Financial asset or liability at fair value through profit or lossA financial asset or financial liability that is classified as held for trading or is designated as such on initial recognition other than investments in equity instruments that do not have a quoted market price in an active market and whose fair value cannot be reliably measured.
Financial instrumentA contract that gives rise to a financial asset of one entity and a financial liability or equity instrument of another entity.

166 | PetroSA Integrated Annual Report 2016
FINANCIAL PERFORMANCE
Audited Annual Financial Statementsfor the year ended 31 March 2016
Financial liabilityAny liability that is:
a) a contractual obligation (i) to deliver cash or another financial asset to another entity or (ii) to exchange financial assets or financial liabilities with another entity under conditions that are potentially unfavourable to the entity; or
(b) a contract that will or may be settled in the entity’s own equity instruments and is (i) a non-derivative for which the entity is or may be obliged to deliver a variable number of the entity’s own equity instruments; or (ii) a derivative that will or may be settled other than by the exchange of a fixed amount of cash or another financial asset for a fixed number of the entity’s own equity instruments. For this purpose, rights, options or warrants to acquire a fixed number of the entity’s own equity instruments for a fixed amount of any currency are equity instruments if the entity offers the rights, options or warrants pro rata to all of its existing owners of the same class of its own non-derivative equity instruments. Also, for these purposes the entity’s own equity instruments do not include puttable financial instruments that are classified as equity instruments in accordance with paragraphs 16A and 16B of IAS 32, instruments that impose on the entity an obligation to deliver to another party a pro rata share of the net assets of the entity only on liquidation and are classified as equity instruments in accordance with paragraphs 16C and 16D of IAS 32, or instruments that are contracts for the future receipt or delivery of the entity’s own equity instruments.
Financial riskThe risk of a possible future change in one or more of a specified interest rate, financial instrument price, commodity price, foreign exchange rate, index of prices or rates, credit rating or credit index or other variable, provided in the case of a non- financial variable that the variable is not specific to a party to the contract.
Foreign operationAn entity that is a subsidiary, joint arrangement or branch of the reporting entity, the activities of which are based or conducted in a country or currency other than those of the reporting entity.
Functional currencyThe currency of the primary economic environment in which the group operates.
Going concern basisThe assumption that the entity will continue in operation for the foreseeable future. The financial statements are prepared on a going concern basis unless management either intends to liquidate the entity or to cease trading, or has no realistic alternative but to do so.
Highest and best useThe use of a non-financial asset by market participants that would maximise the value of the asset or the group of assets and liabilities (eg a business) within which the asset would be used.
Held-to-maturity investmentA non-derivative financial asset with fixed or determinable payments and fixed maturity where there is a positive intention and ability to hold it to maturity.
ImmaterialIf individually or collectively it would not influence the economic decisions of the primary users of the annual financial statements.
Impairment lossThe amount by which the carrying amount of an asset or a cash-generating unit exceeds its recoverable amount.
ImpracticableApplying a requirement is impracticable when the entity cannot apply it after making every reasonable effort to do so.
Definition of financial terms (continued)

PetroSA Integrated Annual Report 2016 | 167
IncomeIncrease in economic benefits in the form of inflows or enhancements of assets or decreases in liabilities that result in increases in equity, other than those relating to contributions from equity participants.
Interest in other entityFor the purpose of IFRS 12, an interest in another entity refers to contractual and non-contractual involvement that exposes an entity to variability of returns from the performance of the other entity. An interest in another entity can be evidenced by, but is not limited to, the holding of equity or debt instruments as well as other forms of involvement such as the provision of funding, liquidity support, credit enhancement and guarantees.
Interest rate riskThe risk that the fair value or future cash flows of a financial instrument will fluctuate because of changes in market interest rates.
Joint arrangementAn arrangement of which two or more parties have joint control, which is the contractually agreed sharing of control of an arrangement, which exists only when decisions about the relevant activities require the unanimous consent of the parties sharing control.
Joint operationA joint arrangement whereby the parties that have joint control of the arrangement have rights to the assets, and obligations for the liabilities, relating to the arrangement.
Joint ventureA joint arrangement whereby the parties that have joint control of the arrangement have rights to the net assets of the arrangement.
Key management personnelThose persons having authority and responsibility for planning, directing and controlling the activities of the entity. ie. the members of the Board of Directors of PetroSA and within the individual companies, the Board of Directors and Executive Management committees.
LeaseAn agreement whereby the lessor conveys to the lessee in return for a payment or series of payments the right to use an asset for an agreed period of time.
Legal obligationAn obligation that derives from a contract, legislation or other operation of law.
LiabilityA present obligation of the entity arising from a past event, the settlement of which is expected to result in an outflow from the entity of resources embodying economic benefits.
Loans and receivablesNon-derivative financial assets with fixed or determinable payments that are not quoted in an active market.
Market riskThe risk that the fair value or future cash flows of a financial instrument will fluctuate because of changes in market prices. Market risk comprises three types of risk: currency risk, interest rate risk and other price risk.

168 | PetroSA Integrated Annual Report 2016
FINANCIAL PERFORMANCE
Audited Annual Financial Statementsfor the year ended 31 March 2016
MaterialOmissions or misstatements of items are material if they could, individually or collectively, influence the economic decisions that users make on the basis of the financial statements. Materiality depends on the size and nature of the omission or misstatement judged in the surrounding circumstances.
Minimum lease paymentsPayments over the lease term that the lessee is or can be required to make, excluding contingent rent, costs for services and taxes to be paid by and reimbursed to the lessor including in the case of a lessee, any amounts guaranteed by the lessee or by a party related to the lessee or in the case of a lessor, any residual value guaranteed to the lessor by the lessee, a party related to the lessee or a third party unrelated to the lessor that is financially capable of discharging the obligations under the guarantee.
Net assetsNet operating assets plus cash and cash equivalents.
Net realisable valueThe estimated selling price in the ordinary course of business less the estimated costs of completion and the estimated costs necessary to make the sale.Net realisable value refers to the net amount that an entity expects to realise from the sale of inventory in the ordinary course of business. Fair value reflects the amount for which the same inventory could be exchanged between knowledgeable and willing buyers and sellers in the marketplace. The former is an entity specific value; the latter is not. Net realisable value for inventories may not equal fair value less costs to sell.
Operating leaseA lease where the lessor retains substantially all the risks and rewards incidental to ownership of an asset.
Other comprehensive incomeComprises items of income and expense (including reclassification adjustments) that are not recognized in profit or loss and includes the effect of translation of foreign operations, cash flow hedges, available-for-sale financial assets and changes in revaluation reserves.
Owner-occupied propertyProperty held by the owner or by the lessee under a finance lease for use in the production or supply of goods or services or for administrative purposes.
Past service costThe change in the present value of the defined benefit obligation for employee service in prior periods resulting from a plan amendment (introduction or withdrawal of, or changes to, a defined benefit plan) or a curtailment (a significant reduction by the entity in the number of employees covered by the plan).
Post-employment benefitsEmployee benefits (other than termination benefits) that are payable after the completion of employment.
Post-employment benefit plansFormal or informal arrangements under which an entity provides post-employment benefits to employees. Defined contribution benefit plans are where there are no legal or constructive obligations to pay further contributions if the fund does not hold sufficient assets to pay all employee benefits relating to employee service in the current and prior periods. Defined benefit plans are post-employment benefit plans other than defined contribution plans.
Presentation currencyThe currency in which the annual financial statements are presented.
Definition of financial terms (continued)

PetroSA Integrated Annual Report 2016 | 169
Prior period errorAn omission from or misstatement in the annual financial statements for one or more prior periods arising from a failure to use, or misuse of, reliable information that was available when annual financial statements for those periods were authorised for issue and could reasonably be expected to have been obtained and taken into account in the preparation of those annual financial statements.
Prospective applicationApplying a new accounting policy to transactions, other events and conditions occurring after the date the policy changed or recognising the effect of the change in an accounting estimate in the current and future periods.
Proved reserves• quantities of petroleum anticipated to be commercially recoverable from known accumulations from a given date
forward under the following conditions: Discovered, recoverable, commercial and remaining.• Means the amount of petroleum which geophysical, geological and engineering data indicate to be commercially
recoverable to a high degree of certainty. For the purposes of this definition, there is a 90% chance that the actual quantity will be more than the amount estimated as proved and a 10% chance that it will be less.
Proved and probable reserves• Proved and probable reserves are quantities of petroleum anticipated to be commercially recoverable from known
accumulations from a given date forward under the following conditions: Discovered, recoverable, commercial and remaining.
• Means proved reserves plus the amount of petroleum which geophysical, geological and engineering data indicate to be commercially recoverable but with a greater element of risk than in the case of proved. For the purposes of this definition, there is a 50% chance that the actual quantity will be more than the amount estimated as proved and probable and a 50% chance that it will be less.
Recoverable amountThe amount that reflects the greater of the fair value less costs to sell and the value in use that can be attributed to an asset or cash generating unit as a result of its ongoing use by the entity. In determining the value in use, expected future cash flows to be derived from the asset or cash generating unit are discounted to their present values using an appropriate discount rate.
Related partyA person or entity that is related to the entity that is preparing its financial statements.
a) A person or a close member of that person’s family is related to a reporting entity if that person:• has control or joint control over the reporting entity;• has significant influence over the reporting entity; or• is a member of the key management personnel of the reporting entity or of a parent of the reporting entity.
b) An entity is related to a reporting entity if any of the following conditions applies:• The entity and the reporting entity are members of the same group.• One entity is an associate or joint venture of the other entity (or an associate or joint venture of a member of a
group of which the other entity is a member).• Both entities are joint ventures of the same third party.• One entity is a joint venture of a third entity and the other entity is an associate of the third entity.• The entity is a post-employment benefit plan for the benefit of employees of either the reporting entity or an
entity related to the reporting entity. If the reporting entity is itself such a plan, the sponsoring employers are also related to the reporting entity.
• The entity is controlled or jointly controlled by a person identified in (a).• A person identified in (a) has significant influence over the entity or is a member of the key management
personnel of the entity (or of a parent of the entity).• The entity, or any member of a group of which it is a part, provides key management personnel services to the
reporting entity or to the parent of the reporting entity.

170 | PetroSA Integrated Annual Report 2016
FINANCIAL PERFORMANCE
Audited Annual Financial Statementsfor the year ended 31 March 2016
ResearchThe original and planned investigation undertaken with the prospect of gaining new scientific or technical knowledge and understanding.
Reserves under appraisalComprise quantities of petroleum, which are considered, on the basis of information currently available and current economic forecasts, to be commercially recoverable by present producing methods from fields that have been discovered but which require further appraisal prior to commerciality being established.
Residual valueThe estimated amount which an entity would currently obtain from disposal of the asset, after deducting the estimated costs of disposal, if the asset were already of the age and in the condition expected at the end of its useful life.
RestructuringA programme that is planned and controlled by management, and materially changes either the scope of a business undertaken by an entity or the manner in which that business is conducted.
Retrospective applicationApplying a new accounting policy to transactions, other events and conditions as if that policy had always been applied.
Retrospective restatementCorrecting the recognition, measurement and disclosure of amounts as if a prior period error had never occurred.
Tax baseThe tax base of an asset is the amount that is deductible for tax purposes if the economic benefits from the asset are taxable or is the carrying amount of the asset if the economic benefits are not taxable. The tax base of a liability is the carrying amount of the liability less the amount deductible in respect of that liability in future periods. The tax base of revenue received in advance is the carrying amount less any amount of the revenue that will not be taxed in future periods.
Temporary differencesThe differences between the carrying amount of an asset or liability and its tax base.
Transaction costsIncremental costs that are directly attributable to the acquisition, issue or disposal of a financial asset or financial liability, i.e. those that would not have been incurred if the entity had not acquired, issued or disposed of the financial instrument.
Useful lifeThe period over which an asset is expected to be available for use or the number of production or similar units expected to be obtained from the asset.
Value in useThe present value of estimated future cash flows expected to arise from the continuing use of an asset and from its disposal at the end of its useful life.
Definition of financial terms (continued)