2016 annual report • jonesville, virginia · 2016 annual report • jonesville, virginia. robert...
TRANSCRIPT

POWELL VALLEy BAnkShArES, Inc. And SuBSIdIArIES
2016 Annual Report • Jonesville, Virginia

Robert EstesBrowning Wynn, IILeton L. Harding, Jr.
George F. CridlinLloyd C. Martin, Jr.Roy E. Woodward, Jr.F. Winston Witt
DIRECTORS
Mission Statement The bank’s major business objective is to continue growing as a community based company through internal growth while providing superior service to our customer base, professional opportunities for it’s employees and maximizing long term shareholder value.
48 1Powell Valley National Bank • 2016 Annual Report Powell Valley National Bank • 2016 Annual Report
ADVISORY BOARD
Roger AudiaBruce Robinette
OFFICERS
George F. Cridlin ....................................................................................................................................................ChairmanLloyd C. Martin, Jr ...................................................................................................President & Secretary of CorporationLeton Harding ................................................................................................................. Executive Vice President & CEOLarry K. Presley ..................................................................................... Executive Vice President & Loan Administrator Robert Horton ................................................................... Senior Vice President / Compliance Officer & Training Officer Charles L. Allen .................................................. Senior Vice President/ Manager - Pennington Office & CRA Officer Gary Richardson ...................................................................... Senior Vice President & Manager - Big Stone Gap OfficeCarol W. Hayes ...................................................................................... Senior Vice President & Manager - Wise OfficeLee Houston ................................................................................... Senior Vice President and Commercial Loan OfficerBrowning Wynn, II .............................................................................................................................Senior Vice PresidentChris Suggs ........................................................................................................................................Vice President & CFOSusan Barber .......................................................................................................... Vice President & Director of PersonnelDouglas McDonald ...........................................................................................Vice President & Manager - Duffield OfficeMike Sprinkle .................................................................................................................Vice President - Loan DepartmentJeff Woodard .................................................................................. Vice President-Security Officer & Privacy Manager Cory Dotson ............................................................................................................Vice President - Business DevelopmentMary Beth Baker .................................................................................... Vice President & Retail Lending AdministratorPaula Lawson ..................................................................................................................................................Vice PresidentLori Hilton ..................................................................................................................................................................AuditorKaren Wright .............................................................................................................................................................AuditorRoss Hawkins ...................................................................................................... Vice President - Collections DepartmentJason Laster ...................................................................................................................................Assistant Vice PresidentLinda Thomas ...............................................................................................................................Assistant Vice PresidentCliff Ely .......................................................................................................................................... Assistant Vice PresidentDeborah Bonham ..........................................................................................................................Assistant Vice President Marsha Nickodam ..........................................................................................................................Assistant Vice President Buford Ervin ..........................................................................................................................Business Development OfficerAmy Mellinger ................................................................................................................................... Retail Banking OfficerTiffany Collier ................................................................................................................................... Retail Banking Officer
Allen Poole .......................................................................... Investment Executive for Powell Valley Investment Services
STAFFJonesville
Tami BurganBetty Jo CarterAngela CombsAlysha ElkinsMargaret Elkins
Mary Ann FannonSharon HarberAmanda HuffHoward JonesTammy Large
Autumn LogsdonKalli MarcumRachel MarshallSarah MooreJudy Mullins
Julia NapierSandra Newman Debra QuallsNorma RobbinsCrissie Robinson
Pennington GapLisa Bailey Buffy BurganLisa Christie Sharon GarrettNorma GraceAshley HammondsTeresa KellyBrittney Nelson
WiseNancy CantrellCassie DotsonAngie FarmerHaley FieldsMelody LovellPat RayLauren Turner
Big Stone GapBarbara BowmanJanis CollinsGina CothronJessica DanielsSue HuffCandice LaneMary Oakes
DuffieldKathy ArwoodVickie BishopCourtney LawsonKellie PageCindy Tipton
KingsportMargaret Hensley

2 47Powell Valley National Bank • 2016 Annual Report Powell Valley National Bank • 2016 Annual Report
George CridlinChairman of the Board
Lloyd C. Martin, Jr.President and Secretary
of Corporation
Leton HardingExecutive Vice
President and CEO
Board of Directors - from left to right: George Cridlin, Browning Wynn, Lloyd C. Martin, Jr., Winston Witt, Eddie Woodward and Robert Estes. Not pictured is Leton Harding.
In celebration of the National Parks 100th Anniversary, the U.S. Mint released a special coin honoring the Cumberland Gap National Historic Park. Pennington Gap employees joined in on the festivities with their annual Customer Appreciation Day and supported 100 years of the National Parks by dressing up from the early 1900s time period.
Cumberland Gap National Park Board Member and Photographer Harold Jerrell spent the day in our Pennington Gap and Jonesville offices. Pictured above are Leton Harding, Harold Jerrell, and Charlie Allen.

Powell Valley National Bank • 2016 Annual Report Powell Valley National Bank • 2016 Annual Report46 3
To Our Shareholders,The year 2016 will likely go down as one of the greatest transition years in our Bank’s 129-year history. I will expand upon that a little later in this letter to you.
We ended 2016 with earnings of $2.91 million, up from earnings of $2.71 million in 2015. As you will read in the following pages, net loans grew almost $8 million dollars to $164.7 million, up from $156.8 million. This trend continues our positive loan growth over the past five (5) years in a very competitive market. I attribute this success to a can-do attitude that starts at the top with our Board, Loan Committee, Loan Officers and Loan Staff proactively finding ways to make loans while protecting the Bank with strong credit underwriting.
Our investment portfolio, and related assets, played a significant role in the positive earnings growth for the year. Larry Presley, EVP of our Bank and our Asset Liability Committee (ALCO), spend countless hours discussing and implementing long term strategies that benefit the company and enable us to be productive in the type of economy cycle we have experienced since 2008.
This year we made the hardware and software transition to the Fiserv Data Center in Norcross, GA. I cannot stress the work and commitment that our staff put in to this conversion and the extra work we undertook evaluating and updating data systems during this move. We are now, in my opinion, in the best operational position possible with the reliability of a data center and the subsequent freeing of our Operations staff to focus on the needs of our customers.
We added MobiMoney in 2016. This service allows our customers to control their own debit cards. Among the capabilities of this software is allowing the customer to decide where the card can be used, turn their card off or on and the extra benefit of allowing customers to see their balances, receive alerts and transfer funds. Just like houses have multiple doors to get in and out, we now provide our customers multiple ways to keep up with their accounts including the following: Online and Mobile Banking, Event Alerts, and now MobiMoney. I can honestly say that your Company can compete with any financial entity when it comes to 21st Century Banking.
Your Board made a decision last year to expand our market footprint. We have hired Sam Neese, former CEO of Highlands Union Bank in Abingdon, Virginia to open a loan production office with the intent of opening a full-service location in Abingdon as soon as possible. Retaining a person of Sam’s experience, market background, and philosophical approach to community banking sends a strong message to the region and other bankers that your company is a great place to work, and have a successful career and future. Joining Sam in Abingdon will be Matthew Eades, Vice President and Business Development Officer, Jim Swartz, Vice President and Loan Review Officer, and Dawn Yarber, Loan Administration.
During the year we had one (1) very valuable and respected employee retire, Peggy Wilder, who dedicated over 37 years of service to your bank in the Jonesville office.
Your Bank hired several new employees during the year. In Wise, we welcomed Haley Fields and Lauren Turner, Tellers, and Tiffany Collier, Director of Training. In Jonesville, we hired Kalli Marcum, Part-Time Teller, and Gina Cothron was hired as Teller in the Big Stone Gap Office. Buford Ervin joined us as part-time Business Development Officer in the Duffield Office and we welcomed Karen Wright, Auditor, to the Bank.
As we enter 2017, there appears to be light at the end of the economy tunnel we have been stuck in since 2008. Interest rates are moving in the direction of historic norms. Serious discussions are occurring about regulatory relief. There are also prospects for tax reform.
Santa made an early stop in Jonesville for Customer Appreciation Day. Leton and his grandson, Jeremiah, take a few minutes to visit with Santa.
Julia Napier’s daughter Eva wasn’t so sure about Santa. Eva enjoys Santa’s visit to the Jonesville office from a distance.

4 45Powell Valley National Bank • 2016 Annual Report Powell Valley National Bank • 2016 Annual Report
We are hopeful that these trends will continue; however, as a Company that has survived 31 recessions and a great depression in our 129 years of service, we will hold on to our Appalachian roots of prudence, self-reliance and commitment to our community and neighbors. This is our tradition and our future!
George F. Cridlin,Chairman of the Board
Lloyd C. Martin, Jr.President and Secretary of Corporation
Leton HardingExecutive Vice President and CEO
Amy Mellinger, Larry Presley, Lori Hilton, Leton Harding, and Karen Cridlin enjoying our annual meeting.
We had a great time welcoming the incoming freshmen of the LMU Vet School during our August picnic. Pictured above are Lee Houston, Browning Wynn, George Cridlin, and Cory Dotson.

Powell Valley National Bank • 2016 Annual Report Powell Valley National Bank • 2016 Annual Report44 5
ToTal DeposiTs - Millions of Dollars230225220215210205200195190185
207 202.1 221.3 222.5 225.6
2012 2013 2014 2015 2016
FINANCIAL HIGHLIGHTSFIVE YEAR SUMMARY
(In Thousands of Dollars)
2016 2015 2014 2013 2012
Net Earnings After Taxes 2,916 2,711 3,128 2,414 2,256
Total Deposits 225,612 222,479 221,311 202,132 206,975
Loans, Net 164,687 156,888 147,942 144,280 132,024
Securities, including assets 63,171 68,599 70,374 62,427 57,100
Held in trading accounts And other investmentsTotal Assets* 273,884 269,970 267,923 245,844 250,891
Capital 45,675 45,028 43,886 40,280 40,210
ToTal asseTs - Millions of Dollars275270265260255250245240235230225220
2012 2013 2014 2015 20162007 2008 2009 2010 2011
270.0267.9245.8250.9240.7235.0240.0225.2229.3 273.9
Jonesville employees Jeff Woodard, Alysha Elkins, Sandy Newman, Susan Barber, and Sarah Moore pose for a quick picture after loading up the truck during our annual Bank Clean-Up Day.
Our Big Stone Gap office employees participated in the Union High School “pink out” game and showed their support for breast cancer and the Union Bears.

6 43Powell Valley National Bank • 2016 Annual Report Powell Valley National Bank • 2016 Annual Report
Supporting Our Bank Family and Local CommunitiesA Tradition Since 1888
ToTal loans - Millions of Dollars1701601501401301201101009080
132.0 144.3 147.9156.9 164.7
2012 2013 2014 2015 2016
CapiTal - Millions of Dollars5045403530252010
50
40.2 40.3 43.9 45.0 45.7
2012 2013 2014 2015 2016
neT inCoMe - THousanDs of Dollars
3,5003,0002,5002,0001,5001,000
5000
2,256
2012 2013 2014 2015 2016
2,414 3,128 2,711 2,916
Every fall our offices show their school spirit for our local high school teams by setting up tailgates on Friday night under the lights. Doug McDonald and Vickie Bishop show their support for the Rye Cove High School Eagles.
Buford Ervin and Veteran Kenny Fannon pose for a picture during our Veteran’s Day celebration at our Duffield Office.
Chairman George Cridlin and Board Member Eddie Woodward preparing for the annual meeting.
Shareholder and retiree, Barlow Newman, enjoying the refreshments and fellowship during our annual meeting.

42 7Powell Valley National Bank • 2016 Annual Report Powell Valley National Bank • 2016 Annual Report
INDEPENDENT AUDITOR’S REPORT
To the Stockholders and Board of DirectorsPowell Valley Bankshares, Inc. and SubsidiariesJonesville, Virginia
We have audited the accompanying consolidated financial statements of Powell Valley Bankshares, Inc. and Subsidiaries, which comprise the consolidated statements of condition as of December 31, 2016 and 2015, and the related consolidated statements of income, comprehensive income, changes in stockholders’ equity, and cash flows for the years then ended, and the related notes to the consolidated financial statements.
Management’s Responsibility for the Financial Statements
Management is responsible for the preparation and fair presentation of these consolidated financial statements in accordance with accounting principles generally accepted in the United States of America; this includes the design, implementation, and maintenance of internal control relevant to the preparation and fair presentation of consolidated financial statements that are free from material misstatement, whether due to fraud or error.
Auditor’s Responsibility
Our responsibility is to express an opinion on these consolidated financial statements based on our audits. We conducted our audits in accordance with auditing standards generally accepted in the United States of America. Those standards require that we plan and perform the audit to obtain reasonable assurance about whether the consolidated financial statements are free of material misstatement.
An audit involves performing procedures to obtain audit evidence about the amounts and disclosures in the consolidated financial statements. The procedures selected depend on the auditor’s judgment, including the assessment of the risks of material misstatement of the consolidated financial statements, whether due to fraud or error. In making those risk assessments, the auditor considers internal control relevant to the entity’s preparation and fair presentation of the consolidated financial statements in order to design audit procedures that are appropriate in the circumstances, but not for the purpose of expressing an opinion on the effectiveness of the entity’s internal control. Accordingly, we express no such opinion. An audit also includes evaluating the appropriateness of accounting policies used and the reasonableness of significant accounting estimates made by management, as well as evaluating the overall presentation of the consolidated financial statements.
We believe that the audit evidence we have obtained is sufficient and appropriate to provide a basis for our audit opinion. Opinion
In our opinion, the consolidated financial statements referred to above present fairly, in all material respects, the financial position of Powell Valley Bankshares, Inc. and Subsidiaries as of December 31, 2016 and 2015, and the results of their operations and their cash flows for the years then ended in accordance with accounting principles generally accepted in the United States of America.
Kingsport, TennesseeFebruary 27, 2017 Certified Public Accountants
PVNB FINANCIAL PERFORMANCE RECOGNIZED
In 2016 Powell Valley National Bank (PVNB) was recognized by two nationally renowned risk management organizations for its outstanding financial performance. Seifried & Brew LLC (S&B), a community bank risk management firm named PVNB as a S&B 5 Gold Bar Institution. This designation is earned by banks which rank in the top 15th Percentile of Community Bank Performance thru out the United States. To gain entry into this distinguished ranking, the Bank demonstrated exemplary performance of balancing risk and reward based on the Bank’s S&B Total Risk/Return Composite Ranking. This is no small feat considering that the Bank not only survived the Financial Crisis but actually thrived. This supports Seifried & Brew’s belief that conservative, traditional community banking is the strength of our financial system.
Bauer Financial, Inc. (Bauer) has recognized Powell Valley National Bank as a 5-Star Rated Institution. Bauer has been reporting on the financial condition of the banking industry since 1983. Bauer collects and analyzes financial reports filed by all banks to their federal regulators. The data is then subjected to a comprehensive analysis. A star-rating is assigned upon completion, with five stars (PVNB’s ranking) being the highest possible rating for bank performance.
across

CONSOLIDATED STATEMENTS OF CONDITIONDecember 31, 2016 and 2015
ASSETS 2016 2015
Cash and cash equivalents $ 25,951,390 $ 25,248,290
Interest bearing time deposits in banks 4,310,000 3,815,000
Investment securities:
Available for sale 62,557,137 67,986,812
Investments, at cost 613,972 611,872
Loans, net 164,687,221 156,888,461
Foreclosed assets 300,880 335,160
Premises and equipment, net 5,713,928 5,859,135
Accrued interest receivable 925,448 874,165
Accrued income tax receivable 184,189 76,722
Deferred income tax benefit 1,710,866 1,349,448
Goodwill 865,410 865,410
Bank owned life insurance 4,344,382 4,228,741
Other assets 1,719,639 1,831,043
Total Assests $273,884,471 $269,970,259
LIABILITIES AND STOCKHODERS’ EQUITY l
LIABILITIES 2016 2015
Deposits:
Noninterest bearing demand $ 77,112,807 $ 68,944,851
Interest bearing demand 26,912,846 23,848,173
Savings 50,517,277 52,800,933
Time deposits 71,069,521 76,884,947
Total Deposits 225,612,451 222,478,904
Accrued interest and other liabilities 2,597,127 2,462,874
Total Liablities 228,209,578 224,941,778
8 41Powell Valley National Bank • 2016 Annual Report Powell Valley National Bank • 2016 Annual Report
Note 15. TRAnSACTIOnS WITH RELATED PARTIES(COnTInUED)
Directors and officers of the Bank and their affiliates were customers of the Bank in the ordinary course of business. The following table presents the activity of such loans for the years ended December 31:
Loan transactions with directors and officers were made on substantially the same terms as those prevailing at the time made for comparable loans to other persons and did not involve more than normal risk of collectability or present other unfavorable features.
The amount of deposits belonging to executive officers and directors of the Bank or indirectly by corporations, partnerships, or joint ventures in which these individuals have an interest were approximately $9,313,487 as of December 31, 2016.
The Bank purchases insurance coverage from an insurance company that is majority-owned by a member of the Board of Directors. Competitive bids were obtained but none were found to be more favorable than the current policies obtained. During the years ended December 31, 2016 and December 31, 2015, the Bank paid the insurance agency $49,776 and $47,886, respectively, for insurance coverage. A portion of the amount paid in 2016 and 2015 included payments for renewals for policies with three-year terms.
2016 2015Balance, January 1 $ 1,288,466 $ 1,091,102
Borrowings 75,000 500,092Repayments 392,525 302,728
Balance, December 31 $ 970,941 $ 1,288,466
40 9Powell Valley National Bank • 2016 Annual Report Powell Valley National Bank • 2016 Annual Report
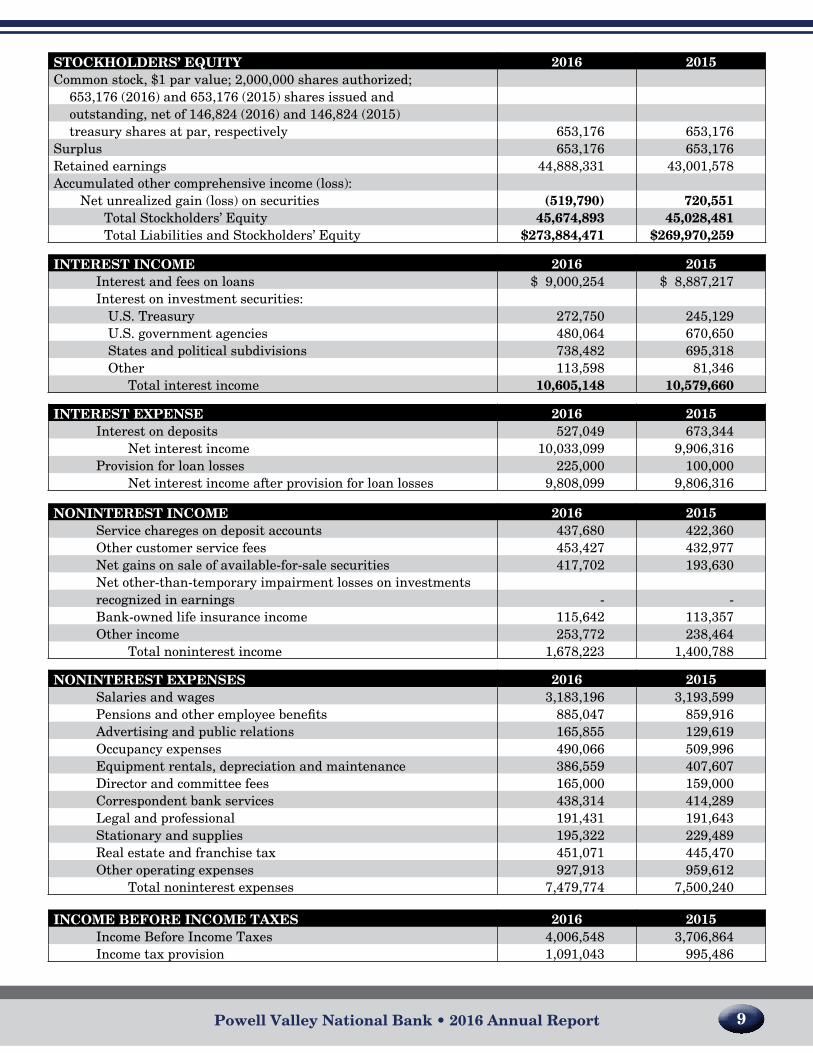
STOCKHOLDERS’ EQUITY 2016 2015Common stock, $1 par value; 2,000,000 shares authorized;
653,176 (2016) and 653,176 (2015) shares issued andoutstanding, net of 146,824 (2016) and 146,824 (2015)treasury shares at par, respectively 653,176 653,176
Surplus 653,176 653,176Retained earnings 44,888,331 43,001,578Accumulated other comprehensive income (loss):
net unrealized gain (loss) on securities (519,790) 720,551Total Stockholders’ Equity 45,674,893 45,028,481Total Liabilities and Stockholders’ Equity $273,884,471 $269,970,259
InTEREST InCOME 2016 2015Interest and fees on loans $ 9,000,254 $ 8,887,217Interest on investment securities:
U.S. Treasury 272,750 245,129U.S. government agencies 480,064 670,650States and political subdivisions 738,482 695,318Other 113,598 81,346
Total interest income 10,605,148 10,579,660
InTEREST ExpEnSE 2016 2015Interest on deposits 527,049 673,344
Net interest income 10,033,099 9,906,316Provision for loan losses 225,000 100,000
Net interest income after provision for loan losses 9,808,099 9,806,316
nOnInTEREST InCOME 2016 2015Service chareges on deposit accounts 437,680 422,360Other customer service fees 453,427 432,977Net gains on sale of available-for-sale securities 417,702 193,630Net other-than-temporary impairment losses on investmentsrecognized in earnings - -Bank-owned life insurance income 115,642 113,357Other income 253,772 238,464
Total noninterest income 1,678,223 1,400,788
nOnInTEREST ExpEnSES 2016 2015Salaries and wages 3,183,196 3,193,599Pensions and other employee benefits 885,047 859,916Advertising and public relations 165,855 129,619Occupancy expenses 490,066 509,996Equipment rentals, depreciation and maintenance 386,559 407,607Director and committee fees 165,000 159,000Correspondent bank services 438,314 414,289Legal and professional 191,431 191,643Stationary and supplies 195,322 229,489Real estate and franchise tax 451,071 445,470Other operating expenses 927,913 959,612
Total noninterest expenses 7,479,774 7,500,240
INCOME BEFORE INCOME TAxES 2016 2015Income Before Income Taxes 4,006,548 3,706,864Income tax provision 1,091,043 995,486
Note 14. FAIR VALUE DISCLOSURES (COnTInUED)
Impaired loans:
The Company does not record loans at fair value on a recurring basis. However, from time to time, a loan is considered impaired and an allowance for loan losses is established. Loans for which it is probable that payment of interest and principal will not be made in accordance with the contractual terms of the loan agreement are considered impaired. Once a loan is identified as individually impaired, its fair value is estimated using several methods including collateral value, observable market value, and discounted cash flows.
As of December 31, 2016, substantially all of the total impaired loans were evaluated (or impaired loans were primarily evaluated) based on the fair value of collateral. Impaired loans where an allowance is established based on the fair value of collateral require classification in the fair value hierarchy. When the fair value of the collateral is based on the observable market price or a current appraised value, the Company records the impaired loan as nonrecurring Level 2. When an appraised value is not available or management determines the fair value of the collateral is further impaired below the appraised value and there is no observable market price, the Bank records the impaired loan as nonrecurring Level 3.
Other assets:
Included in other assets are certain assets carried at fair value, including foreclosed properties. The carrying amount of foreclosed properties is based on information obtained from an independent appraiser with further adjustment based on management evaluation of estimated selling cost and other factors. The Bank reflects these assets within Level 3 of the hierarchy.
Deposit liabilities:
The fair values disclosed for demand deposits (e.g., interest and non-interest checking, passbook savings, and certain types of money market accounts) are, by definition, equal to the amount payable on demand at the reporting date (i.e., their carrying amounts). The carrying amounts of variable-rate, fixed-term money market accounts approximate their fair values at the reporting date. Fair values for fixed-rate certificates of deposit are estimated using a discounted cash flow calculation that applies interest rates currently being offered on certificates to a schedule of aggregated expected monthly maturities on time deposits.
Short-term borrowings:
The carrying amounts of federal funds purchased, borrowings under repurchase agreements, and other short-term borrowings maturing within ninety days approximate their fair values. Fair values of other short-term borrowings with fixed rates are estimated using discounted cash flow analyses based on the Bank’s current incremental borrowing rates for similar types of borrowing arrangements.
Accrued interest:
The carrying amounts of accrued interest approximate fair value.
Note 15. TRANSACTIONS WITH RELATED PARTIES
The Bank has had, and may be expected to have in the future, banking transactions in the ordinary course of business with directors, executive officers, their immediate families and affiliated companies in which they are principal stockholders (commonly referred to as related parties), all of which have been, in the opinion of management, on the same terms, including interest rates and collateral, as those prevailing at the time for comparable transactions with others.

10 39Powell Valley National Bank • 2016 Annual Report Powell Valley National Bank • 2016 Annual Report
nET InCOME 2016 2015Net Income $ 2,915,505 $ 2,711,368
EARNINGS PER COMMON SHARENet income per common share $ 4.46 $ 4.13
nET InCOME $ 2,915,505 $2,711,368
OTHER COMPREHENSIVE INCOME (LOSS), BEFORE TAx:Unrealized holding gains (losses) arising during the year for securities available-for-sale
(1,461,602) 27,157
Less: Reclassification adjustment for gains included in net gains on sale of securities in net income
(417,702) (193,630)
OTHER COMPREHENSIVE INCOME (LOSS), BEFORE TAx (1,879,304) (166,473)
INCOME TAx BENEFIT (ExPENSE) RELATED TO ITEMSOF OTHER COMpREHEnSIVE InCOME 638,963 56,601
OTHER COMPREHENSIVE INCOME (LOSS), NET OF TAx (1,240,431) (109,872)
COMpREHEnSIVE InCOME $ 1,675,164 $ 2,601,496
Note 14. FAIR VALUE DISCLOSURES (COnTInUED
The estimated fair values of the Company’s financial instruments as of December 31 are as follows:
The following methods and assumptions were used by the Company in estimating fair value disclosures for financial instruments, along with a description of the valuation methodologies used for those instruments measured at fair value.
Cash and cash equivalents:
The carrying amounts of cash and cash equivalents approximate fair value.
Interest-bearing time deposits in banks:
Interest-bearing time deposits in banks have a maturity of one year or less and are carried at cost.
Securities:
The Bank obtains fair value measurement from an independent pricing service. Where quoted prices are available in an active market, securities are classified within Level 1 of the valuation hierarchy. Level 1 Securities include highly liquid government securities and certain other products. If quoted market prices are not available, then fair value is estimated by using quoted prices of securities with similar characteristics; quoted prices in markets that are not active; or, other inputs that are observable or can be corroborated by observable market data for substantially the full term of the assets or liabilities, the securities are included in Level 2 of the valuation hierarchy. The Bank’s securities generally fall within the Level 2 category. In certain cases where there is limited activity or less transparency around inputs to the valuation, securities are classified within Level 3 of the valuation hierarchy.
It is not practical to estimate the fair value of the Federal Home Loan Bank (FHLB) and Federal Reserve Bank (FRB), as the Bank is required to hold these investments and the only market for these investments is the issuer. These investments are reported in the consolidated financial statements at their carrying value.
2016 2015
Carrying Amount
Fair Value
Carrying Amount
Fair Value
Financial Assets:
Cash and cash equivalents $ 25,951,390 $ 25,951,390 $ 25,248,290 $ 25,248,290
Interest bearing time deposits in banks 4,310,000 4,310,000 3,815,000 3,815,000
Investments, at cost 613,972 613,972 611,872 611,872
Securities available for sale 62,557,137 62,557,137 67,986,812 67,986,812
Loans 164,687,221 167,077,605 156,888,461 157,669,087
Accrued interest receivable 925,448 925,448 874,165 874,165
Financial liabilities
Deposits 225,612,451 226,126,367 222,478,904 223,426,080
Accrued interest payable 36,232 36,232 38,222 38,222

38 11Powell Valley National Bank • 2016 Annual Report Powell Valley National Bank • 2016 Annual Report
CO
NS
OL
IDA
TE
D S
TA
TE
ME
NT
S O
F C
HA
NG
ES
IN S
TO
CK
HO
LD
ER
S’ E
QU
ITY
Yea
rs En
ded
Decem
ber 31, 2016 a
nd
2015
Co
mm
on
Sto
ckS
urp
lus
Reta
ined
E
arn
ing
s
Accu
mu
lated
Oth
erC
om
preh
ensiv
e In
com
e (Lo
ss)T
ota
l
Balan
ce, Decem
ber 31, 2014$
661,135
$
661,135$
41,733,231
$
830,423$
43,885,924
Net in
come
--
2,711,368-
2,711,368
Oth
er compreh
ensive in
come, n
et of tax-
--
(109,872)(109,872)
Pu
rchase of 7,959 T
reasury sh
ares of Pow
ell Valley
Ban
kshares, In
c.(7,959)
(7,959)(509,148)
-(525,066)
Cash
dividends declared ($1.25 per com
mon
share)
--
(933,873)-
(933,873)
Balan
ce, Decem
ber 31, 2015653,176
653,17643,001,578
720,55145,028,481
Net in
come
--
2,915,505-
2,915,505
Oth
er compreh
ensive in
come, n
et of tax-
--
(1,240,341)(1,240,341)
Cash
dividends declared ($1.43 per com
mon
share)
--
(1,028,752)-
(1,028,752)
Ba
lan
ce, Decem
ber 31, 2016
$
653,176$ 653,176
$
44,888,331$
(519,790)
$
45,674,893
Fair Value Measurement atReporting Date Using
December 31,2015 Fair Value
Prices in Active
Markets for Identical Assets
(Level 1)
Significant Other
ObservableInputs
(Level 2)
SignificantOther
UnobservableInputs
(Level 3)Available-for-sale securities:
U.S. Government agenciesand corporations $ 11,798,715 $ - $ 11,798,715 $ -State and Political Subdivisions 35,579,514 452,877 35,126,637 -Mortgage-backed securitites 16,104,768 - 16,104,768 -Miscellaneous 4,188,231 - 4,188,231 -
Total debt securities 67,671,228 452,877 67,218,351 -
Equity securities 315,584 - 315,584 -
Total securities available-for-sale $ 67,986,812 452,877 $ 67,533,935 $ -
Note 14. FAIR VALUE DISCLOSURES (COnTInUED)
Assets and liabilities measured at fair value on a nonrecurring basis as of December 31 are as follows:
Fair Value
Prices inActive
Marrkets for Identical Assets
(Level 1)
SignificantOther
ObservableInputs
(Level 2)
SignificantOther
UnobservableInputs
(Level 3)December 31, 2016
Impaired loans $ 5,206,886 $ - $ 5,206,886 $ -Foreclosed real estate 300,380 - - 300,380
Total assets at fair value $ 5,507,266 $ - $ 5,206,886 $ 300,380
December 31, 2015Impaird loans $ 5,775,367 $ - $ 577,537 $ -Foreclosed real estate 335,160 - - 335,160
Total assets at fair value $ 6,110,527 $ - $ 577,537 $ 335,160
12 37Powell Valley National Bank • 2016 Annual Report Powell Valley National Bank • 2016 Annual Report
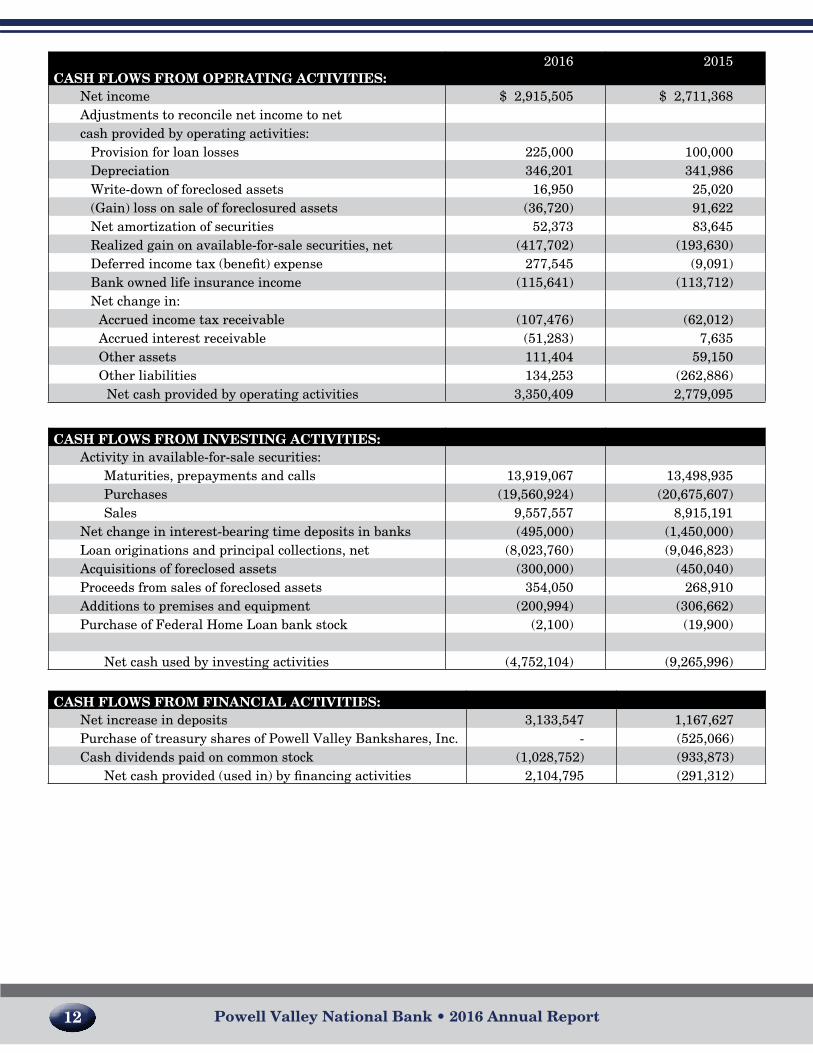
CASH FLOWS FROM OPERATING ACTIVITIES:2016 2015
Net income $ 2,915,505 $ 2,711,368Adjustments to reconcile net income to netcash provided by operating activities:
Provision for loan losses 225,000 100,000Depreciation 346,201 341,986Write-down of foreclosed assets 16,950 25,020(Gain) loss on sale of foreclosured assets (36,720) 91,622Net amortization of securities 52,373 83,645Realized gain on available-for-sale securities, net (417,702) (193,630)Deferred income tax (benefit) expense 277,545 (9,091)Bank owned life insurance income (115,641) (113,712)Net change in:
Accrued income tax receivable (107,476) (62,012)Accrued interest receivable (51,283) 7,635Other assets 111,404 59,150Other liabilities 134,253 (262,886)
Net cash provided by operating activities 3,350,409 2,779,095
CASH FLOWS FROM INVESTING ACTIVITIES:Activity in available-for-sale securities:
Maturities, prepayments and calls 13,919,067 13,498,935Purchases (19,560,924) (20,675,607)Sales 9,557,557 8,915,191
Net change in interest-bearing time deposits in banks (495,000) (1,450,000)Loan originations and principal collections, net (8,023,760) (9,046,823)Acquisitions of foreclosed assets (300,000) (450,040)Proceeds from sales of foreclosed assets 354,050 268,910Additions to premises and equipment (200,994) (306,662)Purchase of Federal Home Loan bank stock (2,100) (19,900)
Net cash used by investing activities (4,752,104) (9,265,996)
CASH FLOWS FROM FINANCIAL ACTIVITIES:Net increase in deposits 3,133,547 1,167,627Purchase of treasury shares of Powell Valley Bankshares, Inc. - (525,066)Cash dividends paid on common stock (1,028,752) (933,873)
net cash provided (used in) by financing activities 2,104,795 (291,312)
Note 14. FAIR VALUE DISCLOSURES (COnTInUED)
In accordance with this guidance, the Company groups its financial assets and financial liabilities generally measured at fair value in three levels, based on the markets in which the assets and liabilities are traded and the reliability of the assumptions used to determine fair value.
• Level 1 – Valuation is based on quoted prices in active markets for identical assets or liabilities that the Company has the ability to access at the measurement date. Level 1 assets and liabilities generally include debt and equity securities that are traded in an active exchange market. Valuations are obtained from readily available pricing sources for market transactions involving identical assets or liabilities.
• Level 2 – Valuation is based on inputs other than quoted prices included within Level 1 that are observable for the asset or liability, either directly or indirectly. The valuation may be based on quoted prices for similar assets or liabilities; quoted prices in markets that are not active; or other inputs that are observable or can be corroborated by observable market data for substantially the full term of the asset or liability.
• Level 3 – Valuation is based on unobservable inputs that are supported by little or no market activity and that are significant to the fair value of the assets or liabilities. Level 3 assets and liabilities include financial instruments whose value is determined using pricing models, discounted cash flow methodologies, or similar techniques, as well as instruments for which determination of fair value requires significant management judgment or estimation.
Assets and liabilities measured at fair value on a recurring basis as of December 31 are as follows:
Fair Value Measurement atReporting Date Using
December 31,2016 Fair Value
Prices in Active
Markets for Identical Assets
(Level 1)
Significant Other
ObservableInputs
(Level 2)
SignificantOther
UnobservableInputs
(Level 3)Available-for-sale securities:
U.S. Government agenciesand corporations $ 5,190,115 $ - $ 5,190,115 $ -State and Political Subdivisions 40,912,993 - 40,912,993 -Mortgage-backed securitites 12,186,313 - 12,186,313 -Miscellaneous 3,817,788 - 3,817,788 -
Total debt securities 62,107,209 - 62,107,209 -
Equity securities 449,928 - 449,928 -
Total securities available-for-sale $ 62,557,137 - $ 62,557,137 $ -

36 13Powell Valley National Bank • 2016 Annual Report Powell Valley National Bank • 2016 Annual Report
2016 2015Net change in cash and cash equivalents $ 703,100 $ (6,788,213)
Cash and cash equivalents at beginning of year 25,248,290 32,026,503
Cash and cash equivalents at end of year $ 25,951,390 $ 25,248,290
SUPPLEMENTAL DISCLOSURES OF CASH FLOW INFORMATIONCash payments for:
Interest paid on deposits and borrowed funds $ 574,039 $ 678,046
Income taxes paid $ 1,220,000 $ 1,170,000
SUPPLEMENTAL SCHEDULE OF NONCASH INVESTING ACTIVITIES:Total increase in unrealized gain (loss)on securities available for sale - $ (166,473)
obligations as for on-balance-sheet instruments. A summary of the Bank’s commitments as of December 31 is as follows:
2016 2015
Commitments to extend credit $ 13,829,940 $ 14,558,696Standby letters of credit 1,290,700 777,950
$ 15,120,640 $ 15,336,646
Commitments to extend credit are agreements to lend to a customer as long as there is no violation of any condition established in the contract. Since many of the commitments are expected to expire without being drawn upon, the total commitment amounts do not necessarily represent future cash requirements. The Bank evaluates each customer’s credit worthiness on a case-by-case basis. The amount of collateral obtained, if deemed necessary by the Bank upon extension of credit, is based on management’s credit evaluation of the party. Collateral held varies, but may include accounts receivable, crops, livestock, inventory, property and equipment, residential real estate and income-producing commercial properties.
Standby letters of credit are conditional commitments issued by the Bank to guarantee the performance of a customer to a third party. Those guarantees are primarily issued to support public and private borrowing arrangements. The credit risk involved in issuing letters of credit is essentially the same as that involved in extending loan facilities to customers. Collateral held varies as specified above and is required in instances which the Bank deems necessary.
Significant concentrations of credit risk:
All of the Bank’s loans, commitments to extend credit, and standby letters of credit have been granted to customers in the Bank’s market area. The distribution of commitments to extend credit approximates the distribution of loans outstanding. Standby letters of credit were granted primarily to commercial borrowers.
The Bank as a matter of policy does not routinely extend credit to any single borrower or group of related borrowers in excess of $3,000,000. Any extension of credit in excess of $3,000,000 up to the legal lending limit of the Bank must be expressly approved by the Board of Directors. The legal lending limit as of December 31, 2016 is approximately $7 million. Although the Bank has a diversified loan portfolio, loans are concentrated mainly in the Lee, Scott, and Wise County region with a concentration in residential and nonresidential rental properties and the heavy construction and mining industries.
Legal contingencies:
The Company from time to time is party to various legal actions normally associated with its bank subsidiary. In the opinion of management and counsel, liabilities, if any, arising from such proceedings presently pending would not have a material adverse effect on the consolidated financial positions or results of operations of the Company.
Note 14. FAIR VALUE DISCLOSURES
Determination of fair value:
The Company uses fair value measurements to record fair value adjustments to certain assets and liabilities and to determine fair value disclosures. In accordance with the Fair Value Measurements and Disclosures topic of FASB ASC 820, the fair value of a financial instrument is the price that would be received to sell an asset or paid to transfer a liability in an orderly transaction between market participants at the measurement date. Fair value is best determined based upon quoted market prices. However, in many instances, there are no quoted market prices for the Company’s various financial instruments. In cases where quoted market prices are not available, fair values are based on estimates using present value techniques or other valuation models or processes that use primarily market-based or independently-sourced market data, including interest rate yield curves, option volatilities and third party information.
14 35Powell Valley National Bank • 2016 Annual Report Powell Valley National Bank • 2016 Annual Report
Note 1. SUMMARY OF SIGNIFICANT ACCOUNTING POLICIES
The accounting and reporting policies of Powell Valley Bankshares, Inc. and Subsidiaries (collectively, the “Company”) conform with accounting principles generally accepted in the United States of America and accepted accounting and reporting practices within the banking industry. The significant accounting policies
are summarized as follows:
Subsequent events:
The Company has evaluated the accompanying consolidated financial statements for subsequent events and transactions through February 27, 2017, the date these financial statements were available for issue.
Principles of consolidation:
The consolidated statements include the accounts of the Powell Valley Bankshares, its wholly-owned subsidiary, Powell Valley national Bank (Bank), and Powell Valley Service Corporation, a wholly owned subsidiary of Powell Valley national Bank. All significant intercompany balances and transactions have been eliminated in consolidation.
Nature of operations:
The Company is a bank-holding company which owns all of the outstanding common stock of Powell Valley national Bank. The Bank provides a variety of financial services throughout locations within its primary lending areas of the City of Norton, and Lee, Scott, and Wise counties in Virginia. The Bank also has a loan production office in Kingsport, Tennessee. The Bank’s primary deposit products are demand deposits, savings accounts, and certificates of deposit. Its primary lending products are real estate loans, consumer loans, and commercial loans. The Bank offers investment services to its customers through an investment service agreement with a third party provider.
Use of estimates:
The preparation of consolidated financial statements in conformity with accounting principles generally accepted in the United States requires management to make estimates and assumptions that affect the reported amounts of assets and liabilities and disclosure of contingent assets and liabilities at the date of the
financial statements and the reported amounts of revenues and expenses during the reporting period. Actual results could differ from those estimates.
Material estimates that are particularly susceptible to significant change relate to the determination of the allowance for losses on loans, the valuation of foreclosed real estate, the valuation of deferred tax assets, other-than-temporary impairments of securities, and the fair value of financial instruments. In connection with the determination of the estimated losses on loans and valuation of foreclosed real estate, management
obtains independent appraisals for significant collateral and properties. Although the Bank has a diversified loan portfolio, a substantial portion of its debtors’ ability to honor their contracts is dependent upon the local
economic condition of the primary lending area, particularly in the real estate sector and coal-dependent areas. Accordingly, the ultimate collectability of a substantial portion of the Bank’s loan portfolio and the recovery of a substantial portion of the carrying amount of foreclosed real estate are susceptible to changes in local market conditions.
Management uses available information to recognize losses on loans and foreclosed real estate. However,
further reductions in the carrying amounts of loans and foreclosed assets may be necessary based on changes in local economic conditions. In addition, regulatory agencies, as an integral part of their examination process, periodically review the estimated losses on loans and foreclosed real estate. Such agencies may require the Bank to recognize additional losses based on their judgments about information available to them at the time of their examination. Because of these factors, it is reasonably possible that the estimated losses on loans and foreclosed real estate may change materially in the near term. However, the amount of the change that is reasonably possible cannot be estimated.
Note 11. RESTRICTION ON DIVIDENDS
The payment of dividends by the Company depends to a great extent on the ability of the Bank to pay dividends to the Holding Company. The Bank, as a Virginia banking corporation, may pay dividends only out of its retained earnings. The payment of dividends by any bank is dependent upon its earnings and financial condition and subject to the statutory power of certain federal and state regulatory agencies to act to prevent what they deem unsafe or unsound banking practices. Moreover, the Federal Reserve Board, the Comptroller of the Currency and the FDIC have issued policy statements which provide that bank holding companies and insured depository institutions generally should only pay dividends out of current operating earnings. The approval of the regulatory agency is required if the dividends declared in any year exceed net income for that year combined with the retained net income of the two preceding years. The payment of dividends by the Bank may also be affected or limited by other factors, such as the requirement to maintain adequate capital above regulatory guidelines. During 2016, the Bank paid $1,328.752 in dividends to the Company. The regulatory dividend limit from the Bank to the Company for 2016 was $6,227,615. As of December 31, 2016, the amount of retained earnings at the Bank that were available for future dividends to the Company without prior regulatory approval equaled $4,898,863.
note 12. Employee Benefit Plans
401(k) and profit share plan:
The Bank has a 401(k) Plan (“Plan”) to provide retirement benefits for its employees. Employees may make elective contributions to the Plan, limited to a maximum annual amount as set by the Internal Revenue Service. The Bank matches employee contributions dollar for dollar up to a maximum of 2.5% per year per person plus a discretionary profit share contribution as determined by the board of directors. In 2016, the Bank elected to contribute an additional 2.5% of each employee’s gross pay into the plan for eligible employees. For the years ended December 31, 2016 and 2015, expense attributable to the Plan amounted to $148,823 and $148,855, respectively.
Nonqualified deferred compensation plan:
The Board of Directors adopted a nonqualified deferred compensation plan (“Plan”) for the Board as of August 18, 2000. The Plan is administered by the VBA Benefits Corporation. Under the Plan, an irrevocable Trust was established for the benefit of the plan participants. Each participant may make annual elective contributions to the Plan.
Supplementary executive retirement plan:
The Bank adopted a non-qualified long-term incentive plan for some executive officers of the Bank. The funds necessary to guarantee these payments are being provided for by the purchase of life insurance policies on the life of each officer. The Bank is the owner and beneficiary of each life insurance policy. During the year ended December 31, 2016 and 2015, $30,275 and $35,073 was charged to expense under these plans, respectively.
Note 13. COMMITMENTS AND CONTINGENCIES
Financial instrument with off-balance-sheet risk:
The Bank is party to financial instruments with off-balance-sheet risk in the normal course of business to meet the financing needs of its customers. These financial instruments include commitments to extend credit and standby letters of credit. These instruments involve, to varying degrees, elements of credit risk in excess of the amount recognized in the balance sheets.
The Bank’s exposure to credit loss in the event of nonperformance by the other party to the financial instrument for commitments to extend credit and standby letters of credit is represented by the contractual amount of those instruments. The Bank uses the same credit policies in making commitments and conditional

34 15Powell Valley National Bank • 2016 Annual Report Powell Valley National Bank • 2016 Annual Report
Note 1. SUMMARY OF SIGnIFICAnT ACCOUnTInG POLICIES (COnTInUED)
Cash and cash equivalents:
For purposes of the consolidated statements of cash flows, cash and cash equivalents include cash and balances due from banks, interest-bearing deposits in other banks, and federal funds sold, all of which mature within ninety days. Accounts in financial institutions are insured by the Federal Deposit Insurance Corporation (FDIC) up to $250,000. At times, cash balances may exceed these limits; however, the Company does not believe it is subject to any significant credit risk as a result of these deposits. Excess cash reserves are held at the Federal Reserve Bank of Richmond.
Investment securities:
The Bank’s investments in securities are classified and accounted for as follows:
Held-to-maturity: Government and government agency bonds, notes, and certificates which the Bank has the positive intent and ability to hold to maturity are reported at cost, adjusted for amortization of premiums
and accretion of discounts which are recognized in interest income using the interest method over the period to maturity. The Bank had no held-to-maturity securities at December 31, 2016 or 2015.
Available-for-sale: Government and government agency bonds, notes, and certificates are classified available-for-sale when the Bank anticipates that the securities could be sold in response to rate changes, prepayment risk, liquidity, availability of and the yield on alternative investments and other market and economic factors. Securities available-for-sale are carried at fair value with unrealized gains and losses reported in other comprehensive income. Realized gains (losses) on securities available-for-sale are included in non-interest income and reported as a reclassification adjustment, net of tax, in other comprehensive income. Gains and losses on sales of securities are determined on the specific-identification method.
Declines in the fair value of individual held-to-maturity and available-for-sale securities below their cost that are other-than-temporary result in write-downs of the individual securities to their fair value. The related write-downs are included in earnings as realized losses. In estimating other-than-temporary impairment losses, management considers (1) the length of time and the extent to which the fair value has been less than cost, (2) the financial condition and near-term prospects of the issuer, and (3) the intent and ability of the Bank to retain its investment in the issuer for a period of time sufficient to allow for any anticipated recovery in fair value.
Loans:
The Bank grants mortgage, commercial, and consumer loans to customers. A substantial portion of the loan portfolio is represented by mortgage loans throughout southwestern Virginia and upper northeast Tennessee. The ability of the Bank’s debtors to honor their contracts is dependent upon the real estate and general economic conditions in this area.
Loans that management has the intent and ability to hold for the foreseeable future or until maturity or pay-off generally are reported at their outstanding unpaid principal balances adjusted for charge-offs, the allowance for loan losses, and any unearned discounts. Interest income is accrued on the unpaid principal balance. Unearned discounts on installment loans are recognized as income over the term of the loans using a method that approximates the interest method. The Bank does not defer loan fees and related loan origination costs. Based on management’s assessments, the difference between deferral and immediate recognition of such fees and related costs is not material.
The accrual of interest on mortgage and commercial loans is discontinued at the time the loan is 90 days past due unless the credit is well-secured and in process of collection. Personal loans are typically charged off no later than 120 days past due. Past due status is based on contractual terms of the loan. In all cases, loans are placed on non-accrual or charged-off at an earlier date if collection of principal or interest is considered doubtful.
Note 10. MInIMUM REGULATORY CAPITAL REqUIREMEnTS (COnTInUED)
The prompt corrective action standards also changed effective January 1, 2015. Under the new standards, in order to be considered well capitalized, the Bank must have a CET1 ratio of 6.5% (new), a Tier 1 ratio of 8.0% (increased from 6.0%), a total risk-based capital ratio of 10.0% (unchanged), and a leverage ratio of 5.0% (unchanged). The Company and the Bank meet all requirements, including the full capital conservation buffer.
The Company’s and the Bank’s actual capital amounts and ratios as of December 31, 2016 and 2015 are as follows (in thousands):
ActualFor Capital
Adequacy Purposes
To Be Well Capitalized Under Prompt Corrective Action Provisions
December 31, 2016: Amount Ratio Amount Ratio Amount RatioTotal Capital to Risk
Weighted Assets $ 47,053 26.86% $ 14,013 8.00% $ 17,517 10.00%Consolidated $ 47,613 27.18% $ 14,013 8.00% N/A
Tier I Capital to RiskWeighted Assets $ 44,770 25.56% $ 10,510 6.00% $ 14,013 8.00%Consolidated $ 45,330 25.88% $ 10,510 6.00% N/A
Tier I Leverage to Average Assets $ 44,770 16.76% $ 10,687 4.00% $ 13,359 5.00%Consolidated $ 45,330 16.94% $ 10,703 4.00% N/A
Common Equity Tier I to Risk Weighted Assets $ 44,770 25.56% $ 7,882 4.50% $ 11,386 6.50%Consolidated $ 45,330 25.88% $ 7,882 4.50% N/A
December 31, 2015Total Capital to Risk
Weighted Assets $ 45,530 24.55% $ 14,839 8.00% $ 18,549 10.00%Consolidated $ 45,796 24.69% $ 14,839 8.00% N/A
Tier I Capital to RiskWeighted Assets $ 43,177 23.28% $ 11,130 6.00% $ 14,839 8.00%Consolidated $ 43,443 23.42% $ 11,130 6.00% N/A
Tier I Leverage to AverageAssets $ 43,177 16.11% $ 10,720 4.00% $ 13,400 5.00%Consolidated $ 43,443 16.19% $ 10,732 4.00% N/A
Common Equity Tier 1 toRisk Weighted Assets $ 43,177 23.28% $ 8,347 4.50% $ 12,057 6.50%Consolidated $ 43,443 23.42% $ 8,347 4.50% N/A

16 33Powell Valley National Bank • 2016 Annual Report Powell Valley National Bank • 2016 Annual Report
Note 1. SUMMARY OF SIGnIFICAnT ACCOUnTInG POLICIES (COnTInUED)
Loans: (Continued)
All interest accrued but not collected for loans that are placed on nonaccrual or charged off is reversed against interest income. The interest on these loans is accounted for on the cash-basis or cost-recovery method, until qualifying for return to accrual. Loans are returned to accrual status when all principal and interest amounts contractually due are brought current and future payments are reasonably assured.
Allowance for loan losses:
The allowance for loan losses represents the amount of earnings that have been set aside (reserved) to cover losses from loans. Loan losses are charged against the allowance when management believes the uncollectability of a loan balance is confirmed. Subsequent recoveries, if any, are credited to the allowance.
The allowance for loan losses is evaluated on a regular basis by management and is based upon management’s periodic review of the collectability of the loans in light of historical experience, the nature and volume of the loan portfolio, adverse situations that may affect the borrower’s ability to repay, estimated value of any underlying collateral and prevailing economic conditions. This evaluation is inherently subjective as it requires estimates that are susceptible to significant revision as more information becomes available.
The allowance consists of specific, general, and unallocated components. The specific component relates to
loans that are classified as doubtful, substandard, or special mention. For such loans that are also considered impaired, an allowance is established when the discounted cash flows (or collateral value or observable market price) of the impaired loan is lower than the carrying value of that loan. The general component covers non-classified loans and is based on historical loss experience adjusted for qualitative factors. An unallocated component is maintained to cover uncertainties that could affect management’s estimate of probable losses. The unallocated component of the allowance reflects the margin of imprecision inherent in the underlying assumptions used in the methodologies for estimating specific and general losses in the portfolio.
A loan is considered impaired when, based on current information and events, it is probable that the Bank will be unable to collect the scheduled payments of principal or interest when due according to the contractual terms of the loan agreement. Factors considered by management in determining impairment include payment status, collateral value, and the probability of collecting scheduled principal and interest payments when due. Loans that experience insignificant payment delays and payment shortfalls generally are not considered impaired. Management determines the significance of payment delays and payment shortfalls on a case-by-case basis, taking into consideration all of the circumstances surrounding the loan and the borrower, including the length of the delay, the reasons for the delay, the borrower’s prior payment record, and the amount of the shortfall in relation to the principal and interest owed. Impairment is measured on a loan-by-loan basis for commercial and construction loans by either the present value of expected future cash flows discounted at the loan’s effective interest rate, the loan’s obtainable market price, or the fair value of the collateral if the loan is collateral dependent.
Large groups of smaller balance homogeneous loans are collectively evaluated for impairment. Accordingly, the Bank does not separately identify individual consumer and residential loans for impairment disclosures, unless such loans are the subject of a restructuring agreement.
Off-balance sheet credit related financial instruments:
In the ordinary course of business, the Bank has entered into commitments to extend credit, including commitments under commercial letters of credit and standby letters of credit. Such financial instruments are recorded when they are funded.
Note 10. MINIMUM REGULATORY CAPITAL REQUIREMENTS
The Company (on a consolidated basis) and the Bank are subject to various regulatory capital requirements administered by the federal banking agencies. Failure to meet minimum capital requirements can initiate certain mandatory and possibly additional discretionary actions by regulators that, if undertaken, could have a direct material effect on the Company and the consolidated financial statements. Under the regulatory capital adequacy guidelines and the regulatory framework for prompt corrective action, the Company and the Bank must meet specific capital guidelines involving quantitative measures of their assets, liabilities, and certain off-balance sheet items as calculated under regulatory accounting practices. The Company’s and the Bank’s capital amounts and classification under the prompt corrective action guidelines are also subject to qualitative judgments by the regulators about components, risk weightings, and other factors.
Effective January 1, 2015 (with some changes transitioned into full effectiveness over two to four years), the Company and Bank became subject to new capital requirements with the implementation of Basel III. These new requirements create a new required ratio for common equity Tier 1 (“CET1”) capital, increase the Tier 1 capital ratio, change the risk weight of certain assets for purposes of the risk-based capital ratios, create an additional capital conservation buffer over the required capital ratios and change what qualifies as capital for purposes of meeting these various capital requirements. Beginning in 2016, failure to maintain the required capital conservation buffer will limit the ability of the Company and the Bank to pay dividends, repurchase shares, or pay discretionary bonuses.
Under the new capital regulations, the minimum capital ratios are: (1) CET1 capital ratio of 4.5% of risk-weighted assets (new); (2) a Tier 1 capital ratio of 6.0% of risk-weighted assets (increased from 4.0%); (3) a total capital ratio of 8.0% of risk-weighted assets (unchanged); and (4) a leverage ratio of 4.0% (unchanged). CET1 generally consist of common stock and retained earnings, subject to applicable regulatory adjustments and deductions.
There are a number of changes in what constitutes regulatory capital, some of which are subject to transition periods. These changes include the phasing-out of certain instruments as qualifying capital. The Company and the Bank do not use any of these instruments. Under the new requirements for total capital, Tier 2 capital is no longer limited to the amount of Tier 1 capital included in total capital. Mortgage servicing rights, certain deferred tax assets, and investments in unconsolidated subsidiaries over designated percentages of CET1 will be deducted from capital. The Company and the Bank has elected to permanently opt-out of the inclusion of accumulated other comprehensive income in the capital calculations, as permitted by the regulations. This opt-out will reduce the impact of market volatility on regulatory capital levels.
The new requirements also include changes in the risk-weights of assets to better reflect credit risk and other risk exposures. These include a 150% risk weight (increased from 100%) for certain high volatility commercial real estate acquisitions, development and construction loans and for non-residential mortgage loans that are 90 days past due or otherwise in non-accrual status; a 20% (increased from 0%) credit conversion factor for the unused portion of a commitment with an original maturity of one year or less that is not unconditionally cancellable; a 250% risk weight (increased from 100%) for mortgage servicing and deferred tax assets that are not deducted from capital; and increased risk weights (0% to 600%) for equity exposures.
In addition to the minimum CET1, Tier 1 and total capital ratios, the Company and Bank will have to
maintain a capital conservation buffer consisting of CET1 capital greater than 2.5% of risk weighted assets above the required minimum levels in order to avoid limitations on paying dividends, engaging in share purchases, and paying discretionary bonuses based on percentages of eligible retained income that could be utilized for such actions. This new capital conservation buffer requirement will be phased in beginning January 2016 at 0.625% of risk-weighted assets and increasing each year until fully implemented in January 2019.
32 17Powell Valley National Bank • 2016 Annual Report Powell Valley National Bank • 2016 Annual Report
Note 1. SUMMARY OF SIGnIFICAnT ACCOUnTInG POLICIES (COnTInUED)
Premises and equipment:
Land is carried at cost. Premises and equipment are carried at cost less accumulated depreciation. Depreciation is computed principally on the methods used for Federal income tax reporting purposes. Maintenance and repairs are expensed as incurred while major additions and improvements are capitalized. Gains and losses on dispositions are included in current operations.
Premises and equipment are depreciated over the following lives:
Buildings and improvements 5-40 years Furniture, equipment, and software 3-10 years
Bank owned life insurance:
The Bank purchased single premium life insurance on certain employees of the Bank. Appreciation in value of the insurance policies is classified in non-interest income.
Foreclosed assets:
Foreclosed assets consist of other real estate owned (OREO). OREO represents real estate properties acquired through or in lieu of loan foreclosure. OREO is held for sale and is initially recorded at the fair value less estimated selling cost at the date of foreclosure. Any write-down based on the asset’s fair value at the time of transfer to OREO is charged to the allowance for loan losses. Property is evaluated regularly to ensure the recorded amount is supported by its current fair value, with charges to operations, if necessary, to reduce the carrying value of a property to the lower of its cost or fair value less cost to sell. Costs of significant property improvements are capitalized; whereas, costs relating to holding property are expensed. Foreclosed assets are held by the Bank and by Powell Valley Service Corporation, the Bank’s wholly owned subsidiary.
Intangible assets: The Bank evaluates goodwill for impairment in accordance with ASC Topic 350, Intangibles – Goodwill
and Other Intangibles. Under the provisions of ASC 350, goodwill is evaluated for impairment through the assessment of certain qualitative factors to determine whether it is more likely than not that the carrying amount exceeds its fair market value. Based on the qualitative assessment, no impairment loss was deemed necessary at December 31, 2016 and 2015.
Advertising:
The Bank’s policy is to expense advertising costs as the costs are incurred.
Income taxes:
Income taxes are provided for the tax effects of the transactions reported in the financial statements and consist of taxes currently due plus deferred taxes.
Note 9. InCOME TAxES (COnTInUED)
The net deferred tax asset includes the following components:
2016 2015
Deferred tax assets:
Allowance for loan loss $ 798,147 $ 321,647
Deferred compensation 520,855 530,333
Interest on non-accruals 114,771 100,482
Impaired assets - investments 415,379 792,883
Deferred self-employment retirement plan 10,294 11,925
Unrealized loss on securities available for sale 273,604 -
Total deferred assets 2,133,050 2,157,270
Deferred tax liablilities:
Accretion - investment securities 10,453 12,847
Amortization - intangibles 294,240 294,240
Depreciation 117,491 132,745
Unrealized gain on securities available for sale - 402,949
Total deferred liabilities 422,184 842,781
Net deferred tax assets $ 1,710,866 $ 1,314,489
At December 31, the Bank did not have a valuation allowance. Realization of deferred tax benefits is dependent upon sufficient future taxable income during the period that deductible temporary differences and carryforwards are expected to be available to reduce taxable income.
Powell Valley National Bank is exempt from state income taxes in Virginia as are all other banks in the State. Instead, banks are assessed a franchise tax based on an adjusted capital calculation. The Bank franchise tax expense was approximately $381,000 for both 2016 and 2015. The Bank includes such accrued payable in other liabilities and the expense is included in other operating expenses.

18 31Powell Valley National Bank • 2016 Annual Report Powell Valley National Bank • 2016 Annual Report
Note 1. SUMMARY OF SIGnIFICAnT ACCOUnTInG POLICIES (COnTInUED)
Income taxes: (Continued)
Current income tax reflects taxes to be paid or refunded for the current period by applying the provisions of the enacted tax law to taxable income or loss. Deferred taxes relate primarily to differences between the basis of the allowance for loan losses, available-for-sale securities, accumulated depreciation, and accrued employee benefits. The deferred tax assets and liabilities represent the future tax return consequences of those differences, which will either be taxable or deductible when the assets and liabilities are settled. Deferred tax assets and liabilities are reflected at income tax rates applicable to the period in which the deferred tax assets or liabilities are expected to be realized or settled. As changes in tax laws or rates are enacted, deferred tax assets and liabilities are adjusted through the provision for income taxes.
The Bank recognizes deferred tax assets if it is more likely than not, based on the technical merits, that the tax position will be realized or sustained upon examination. The Bank follows the statutory requirements for its income tax accounting and generally avoids risks associated with potentially problematic tax positions that may be challenged upon examination.
The Bank’s policy is to recognize interest and penalties on income taxes in other noninterest expenses. The Bank remains subject to examination for income tax returns for the years 2013 through 2016.
Compensated absences:
Compensated absences for sick day and personal time have not been accrued since they cannot be reasonably estimated. The Bank’s policy is to recognize these costs when actually paid.
Comprehensive income (loss):
Comprehensive income (loss) consists of the total of all components of comprehensive income (loss) including net income (loss). Other comprehensive income (loss) refers to revenues, expenses, gains, and losses under U.S. generally accepted accounting principles that are included in comprehensive income (loss) but excluded from net income (loss). Currently, the Bank’s other comprehensive income (loss) consists of unrealized gains and losses on securities available for sale, net of deferred tax expense (benefit).
Earnings per common share:
Earnings per common share amounts are computed by dividing net income by the weighted average number of common shares outstanding during each year.
Reclassifications:
Certain prior year amounts have been reclassified to conform with present year presentations.
Recent accounting pronouncements:
In May 2014, the FASB issued ASU no. 2014-09, Revenue from Contracts with Customers (Topic 606). ASU 2014-09 is a comprehensive new revenue recognition model that requires a company to recognize revenue to depict the transfer of goods or services to a customer at an amount that reflects the consideration it expects to receive in exchange for those goods or services. ASU 2014-09 also requires additional disclosure about the nature, amount, timing, and uncertainty of revenue and cash flows arising from customer contracts, including significant judgments and changes in judgments and assets recognized from costs incurred to obtain or fulfill a contract. ASU 2014-09 was effective for annual reporting periods beginning after December 15, 2017. ASU No. 2015-14 issued in August 2015 deferred the effective date of this Update to annual reporting periods beginning after December 15, 2018. Earlier application is permitted only as of annual reporting periods beginning after December 15, 2016, including interim reporting periods within that reporting period. The adoption of this ASU is not expected to have a material effect on the Company’s current financial position or results of operations; however, it may impact the reporting of future financial statement disclosures.
Note 7. FEDERAL HOME LOAN BANK ADVANCES
Pursuant to collateral agreements with the Federal Home Loan Bank (FHLB), advances are collateralized by the Bank’s stock in the FHLB and a blanket pledge of qualifying first mortgage loans. The lendable collateral value of the loans as of December 31, 2016 and 2015 was $32,781,956 and $30,135,264, respectively.
Note 8. DEPOSITS
The aggregate amount of time deposits in denominations of $250,000 or more as of December 31, 2016 and 2015 was $17,292,785 and $15,527,808, respectively.
At December 31, 2016, the scheduled maturities of time deposits are as follows:
2017 $ 44,784,9672018 13,583,7342019 5,100,3712020 689,6002021 6,807,393
Thereafter 103,456
$ 71,069,521
Note 9. INCOME TAxES
The Company files a consolidated federal income tax return with its subsidiaries. The consolidated provision for income taxes for 2016 and 2015 consists of the following:
2016 2015
Current tax expense $ 813,498 $ 1,004,587Deferred tax expense (benefit) 277,545 (9,091)
Total income tax expense $ 1,091,043 $ 995,496
2016 2015
Amount % Amount %Expected tax provision at a 34% rate $ 1,362,226 34.0% $ 1,260,334 34.0%
Tax effect of:Tax exempt income (356,272) (10.2%) (377,321) 10.2%Other items, net 85,089 3.4% 112,483 3.3%
Income taxes $ 1,091,043 27.2% $ 995,496 21.7%
The provision for federal income taxes differs from that computed by applying federal statutory rates to income (loss) before federal income tax expense, as indicated in the following analysis:

30 19Powell Valley National Bank • 2016 Annual Report Powell Valley National Bank • 2016 Annual Report
Note 1. SUMMARY OF SIGnIFICAnT ACCOUnTInG POLICIES (COnTInUED)
Recent accounting pronouncements: (Continued)
In January 2016, ASU no. 2016-01 Financial Instruments – Overall (Subtopic 825-10) was issued by the FASB. The amendments address certain aspects of recognition, measurement, presentation, and disclosure of financial instruments. The amendments will be effective for fiscal years beginning after December 15, 2018. The Company is currently evaluating the impact of these amendments on its financial statements.
In June 2016, ASU no. 2016-13 Financial Instruments – Credit Losses (Topic 326) was issued by the FASB. The ASU is intended to improve financial reporting by requiring timelier recording of credit losses on loans and other financial instruments held by financial institutions and other organizations. The ASU is effective for the Company in fiscal years beginning after December 15, 2020. Early application will be permitted for all organizations for fiscal years, and interim periods within those fiscal years, beginning after December 15, 2018. The Company is currently evaluating the effect that implementation of the new standard will have on its financial position, results of operations, and cash flows.
Other accounting standards have been issued by the FASB that are not currently applicable to the Company or are not expected to have a material impact on its financial statements.
Note 2. RESTRICTIONS ON CASH AND DUE FROM BANKS AND INTEREST-BEARING DEPOSITS
Under agreements with correspondent banks, the Bank maintains deposit balances with the correspondents to cover various bank processing charges. In addition, the Bank is required to maintain average reserve balances on hand or with the Federal Reserve Bank based on customer deposit balances. As of December 31, 2016 and 2015, these reserve balances amounted to $2,102,000 and $2,102,000, respectively.
Note 3. INVESTMENT SECURITIES
The amortized cost and approximate fair value of securities, with gross unrealized gains and losses, follows:
2016 AmortizedCost
Gross Unrealized
Gains
GrossUnrealized
Losses Fair ValueAvailable-for-Sale Securities:
U.S. government agenciesand corporations $ 5,358,323 $ 7,277 $ (175,485) $ 5,190,115State and political subdivisions 41,402,141 488,094 (977,242) 40,912,993Mortgage-backed securities 12,427,498 21,396 (262,581) 12,186,313Miscellaneous 3,806,535 120,488 (109,235) 3,817,788
Total debt securities 62,994,497 637,255 (1,524,163) 62,107,209Equity Securities 350,200 223,957 (124,229) 449,928Total investment securities $ 63,344,697 $ 861,212 $ (1,648,772) $ 62,557,137
Note 4. LOAnS (COnTInUED)
Residential real estate properties for which the foreclosure process had begun but had yet to be completed as of December 31, 2016:
Residential real estate in foreclosure process at year end $ 106,223
Number of properties 4
Capital Leases Operating Leases
2017 $ 13,762 $ 5,3362018 - 5,3362019 - 5,3362020 - 4,002
$ 13,762 $ 20,010
Amount representing interest $ (1,016)
Present value of net minimum lease payments, reported in other liabilities $ 12,746
2016 2015
Land $ 1,282,781 $ 1,282,781Bank building and improvements 6,803,633 6,708,591Furniture and equipment 2,827,151 2,740,539Automobile 194,735 175,395
11,108,300 10,907,306Less accumulated depreciation (5,394,372) (5,048,171)
$ 5,713,928 $ 5,859,135
Note 5. PREMISES AND EQUIPMENT
The major classes of premises and equipment and the total accumulated depreciation are as follows:
Depreciation and amortization expense of premises and equipment for 2016 and 2015 was $346,201 and
$341,986, respectively.
Note 6. LEASE COMMITMENTS The Company leases various types of office equipment and other facilities generally over periods ranging
up to five years. Certain leases provide renewal or purchase options, and accordingly, the capital lease is recorded in the Company’s fixed assets and other liabilities. The net book value of equipment subject to capital leases at December 31, 2016 was approximately $6,000.
Minimum future lease payments as of December 31, 2016, are as follows:
Lease expense under operating leases totaled approximately $9,045 in 2016 and $9,628 in 2015.

20 29Powell Valley National Bank • 2016 Annual Report Powell Valley National Bank • 2016 Annual Report
The amortized cost and approximate fair value of debt securities as of December 31, 2016, by contractual
maturity are shown below. Maturities may differ from contractual maturities in mortgaged-backed securities because the mortgages underlying the securities may be called or re-paid without any penalties. Therefore, these securities are not included in the maturity categories in the following summary.
2015 AmortizedCost
Gross Unrealized
Gains
GrossUnrealized
Losses Fair ValueAvailable-for-Sale Securities:
U.S. government agenciesand corporations $ 11,902,996 $ 26,076 $ (130,357) $ 11,798,715State and political subdivisions 34,635,728 980,694 (36,908) 35,579,514Mortgage-backed securities 16,168,580 119,507 (183,319) 16,104,768Miscellaneous 3,837,564 460,246 (109,579) 4,188,231
Total debt securities 66,544,868 1,586,523 (460,163) 67,671,228Equity Securities 350,200 95,184 (129,800) 315,584Total investment securities $ 66,895,068 $ 1,681,707 $ (589,963) $ 67,986,812
Debt SecuritiesAvailable-for-sale
AmortizedCost
Fair Value
Available-for-sale securities:Due in one year or less $ 7,164,121 $ 7,119,934Due after one year through five years 24,483,024 24,684,252Due after five years through ten years 14,370,587 13,952,112Due after ten years $ 4,549,267 $ 4,170,306
50,566,999 49,926,604
Mortgage-backed securities 12,427,498 12,180,605Total $ 62,994,497 $ 62,107,209
Management determines whether it intends to sell or if it is more likely than not that it will be required to sell impaired securities. This determination considers current and forecasted liquidity requirements, regulatory and capital requirements, and securities portfolio management. For all impaired securities for which there was no intent or expected requirement to sell, the evaluation considers all available evidence to assess whether it is likely the amortized cost value will be recovered. The Bank conducts a regular assessment of its debt securities with unrealized losses to determine whether securities have other-than-temporary impairment (OTTI) considering, among other factors, the nature of the securities, credit rating or financial condition of the issuer, the extent and duration of the unrealized loss, expected cash flows of underlying collateral, market conditions and whether the Bank intends to sell or more likely than not the Bank will be required to sell the debt securities.
Note 4. LOAnS (COnTInUED)
Troubled debt restructuring:
A modification of a loan constitutes a troubled debt restructuring (“TDR”) when a borrower is experiencing financial difficulty and the modification constitutes a concession. By granting the concession, the Bank expects to increase the probability of collection by more than would be expected by not granting the concession. The Bank’s determination of whether a modification is a TDR considers the facts and circumstances surrounding each respective modification.
The following presents information related to loans modified as a TDR during the year ended December 31, 2016.
2016 2015Performing $ 13,421,857 $ 12,886,150Non-performing 164,801 177,773
Total $ 13,586,658 $ 13,063,923
Number of Loans
Pre-Modification Outstanding
Recorded Investment
Post-Modification Outstanding
Recorded Investment
Residential 1-4 Family 2 $ 262,633 $ 261,463Commercial Real Estate 1 - -
3 $ 262,633 $ 261,463
The loan modifications completed in 2016 were related to a single borrower to provide a lower interest rate and extend the maturity date for each loan with no forgiveness of debt.
There were no loans modified in a TDR from January 1, 2016 through December 31, 2016 that subsequently defaulted (60 days or more past due following modification) during the twelve months ended December 31, 2016.
There were no loans modified as a troubled debt restructuring during the year ended December 31, 2015.
Foreclosed properties as of December 31, 2016 included residential real estate properties of:
Residential real estate included in foreclosed property $ 300,380
Number of properties 5
Note 3. InVESTMEnT SECURITIES (COnTInUED)

28 21Powell Valley National Bank • 2016 Annual Report Powell Valley National Bank • 2016 Annual Report
Note 3. InVESTMEnT SECURITIES (COnTInUED)
Information pertaining to securities with gross unrealized losses as of December 31, 2016 and 2015, aggregated by investment category and length of time that individual securities have been in a continuous loss position is shown in the table below.
2016Less Than 12 Months 12 Months or Greater Total
Fair ValueGross
Unrealized Losses
Fair ValueGross
Unrealized Losses
Fair ValueGross
Unrealized Losses
Available-for-sale securities:Debt securities
U.S. Government agencies and corporations $ 5,156,128 $ (175,485) $ - $ - $ 5,156,128 $ (175,485)State and political subdivisions 22,349,207 (977,242) - - 22,349,207 (977,242)Mortgage-backed securities
7,448,564 (173,993) 2,141,238 (88,588) 9,589,802 (262,581)
Miscellaneous 1,937,375 (78,000) 719,665 (30,335) 2,657,040 (109,235)Total debt securities 36,891,274 (1,405,620) 2,860,903 (118,923) 39,752,177 (1,524,543)
Equity Securities - - 225,771 (124,229) 225,771 (124,229)Total equity securities - - 225,771 (124,229) 225,771 (124,229)
Total $ 36,891,274 $ (1,405,620) $ 3,806,674 $ (243,152) $ 39,977,948 $ (1,648,772)
Note 4. LOAnS (COnTInUED) Generally, the accrual of income is discontinued when the full collection of principal or interest is in doubt or
when the payment of principal or interest has become contractually 90 days past due unless the obligation is both well secured and in the process of collection.
Credit quality indicators:
The Bank utilizes six classifications: pass, special mention, watch, substandard, doubtful, and loss. “Pass assets” have at least a reasonable credit risk. “Special mention assets” have weaknesses and warrant management’s close attention. “Watch assets” have emerging problems and are showing early signs of weaknesses. “Substandard assets” have unsatisfactory characteristics that cause a more than acceptable level and risk and have one or more well-defined weaknesses that could jeopardize the repayment of the debt. “Doubtful assets” contain weaknesses that collection or liquidation in full is questionable. Doubtful loans are normally placed on the non-accrual list, regardless of past due status. “Loss assets” are considered uncollectible and of such little value that their continuance as an active bank asset is not warranted.
The following tables outline the amount of residential, commercial real estate, and commercial loans
categorized into each risk rating class as of December 31, 2016 and December 31, 2015:
Consumer loans are not graded using the aforementioned system. The Bank uses the classifications of
“performing” and “nonperforming” for consumer loans. “Performing loans” are current to 89 days past due. “Nonperforming” loans are 90 or more days past due. The following tables summarize the Bank’s consumer loans based on performance as of December 31:
December 31, 2016Residential 1-4
FamilyCommercial Real Estate Commercial Total
Pass $ 55,969,049 $ 72,935,215 $ 17,733,882 $ 146,638,146Special Mention - 739,100 881,185 1,620,285Watch 155,189 755,599 78,112 988,900Substandard 2,295,821 1,054,572 1,466,924 4,817,317Doubtful - - - -Loss - - - -
Total $ 58,420,059 $ 75,484,486 $ 20,160,103 $ 154,064,648
December 31, 2015Residential 1-4
FamilyCommercial Real Estate Commercial Total
Pass $ 58,577,940 $ 67,820,276 $ 12,644,945 $ 139,043,161Special Mention - 1,783,319 76,516 1,859,835Watch 129,672 831,179 5,811 966,662Substandard 2,019,819 1,278,052 1,600,437 4,898,308Doubtful - - - -Loss - - - -
Total $ 60,727,431 $ 71,712,826 $ 14,327,709 $ 146,767,966

22 27Powell Valley National Bank • 2016 Annual Report Powell Valley National Bank • 2016 Annual Report
Note 3. InVESTMEnT SECURITIES (COnTInUED)
2015
Less Than 12 Months 12 Months or Greater Total
Fair ValueGross
Unrealized Losses
Fair ValueGross
Unrealized Losses
Fair ValueGross
Unrealized Losses
Available-for-sale securities:
Debt securities
U.S. Government agencies and corporations $ 2,958,671 $ (28,184) $ 5,591,885 $ (102,173) $ 8,550,556 $ (130,357)State and political subdivisions 3,760,334 (25,442) 909,685 (11,466) 4,670,019 (36,908)Mortgage-backed securities
4,377,213 (37,876) 4,122,914 (145,443) 8,500,127 (183,319)
Miscellaneous 1,491,070 (18,770) 1,037,433 (90,809) 2,528,503 (109,579)Total debt securities 12,587,288 (110,272) 11,661,917 (349,891) 24,249,205 (460,163)
Equity Securities:Other - - 220,200 (129,800) 220,200 (129,800)Total equity securities - - 220,200 (129,800) 220,200 (129,800)
Total $ 12,587,288 $ (110,272) $ 11,882,117 $ (479,691) $ 24,469,405 $ (589,963)
The Bank had 38 and 71 securities at December 31, 2016 and 2015, which were in a loss position. The Bank did not recognize any other-than-temporary impairments in 2016 or 2015; substantially all of the Bank’s unrealized losses related to interest rate movements rather than changes in credit ratings.
During 2016, sales and redemptions of securities available for sale resulted in gross realized gains of $494,838 and gross realized losses of $77,137, with a net realized gain of $417,702. During 2015, sales and redemptions of securities available for sale resulted in gross realized gains of $199,031 and gross realized losses of $5,401, with a net realized gain of $193,630.
Investment securities with a carrying amount of $46,828,177 and $36,029,501 as of December 31, 2016 and 2015, respectively, were pledged as collateral on public deposits and for other purposes as required or permitted by law.
Investments, at cost:
The Bank is required to hold a minimum number of shares of stock in the Federal Home Loan Bank (FHLB) and the Federal Reserve Bank (FRB). These are considered restricted investments and are carried at cost on the balance sheet. Additional restricted investments the Bank is required to maintain and also carried at cost include Virginia Bankers Insurance Center, LLC and Virginia Title Corporation stock. The carrying amount of the restricted investments, at cost, are as follows:
Note 4. LOAnS (COnTInUED)
Past due loans:
The following tables present an aged analysis of past due loans and loans on nonaccrual status by loan type as of December 31, 2016 and December 31, 2015:
December 31, 2016
Residential 1-4 Family
Commercial Real Estate Commercial Consumer Total
Current $ 55,246,854 $ 73,068,744 $ 19,961,123 $ 13,015,182 $ 161,291,903
30-59 Days past due 1,372,472 724,959 147,321 319,307 2,564,059
60-89 Days past due 932,551 1,318,444 17,780 87,368 2,356,143
90+ Days past due 868,182 372,339 33,879 164,801 1,439,201
Total past due $ 3,173,205 $ 2,415,742 $ 198,980 $ 571,476 $ 6,359,403
Total loans receivable $ 58,420,059 $ 75,484,486 $ 20,160,103 $ 13,586,658 $ 167,651,306
Nonaccrual loans $ 1,495,426 $ 462,865 $ - $ 206,077 $ 2,164,068
Recorded investment >90 days and still accruing $ - $ - $ - $ - $ -
December 31, 2015
Residential 1-4 Family
Commercial Real Estate Commercial Consumer Total
Current $ 57,256,728 $ 69,734,102 $ 14,215,950 $ 12,420,471 $ 153,627,251
30-59 Days past due 1,914,687 1,143,112 32,255 423,985 3,514,039
60-89 Days past due 719,973 604,756 79,504 41,694 1,445,927
90+ Days past due 836,043 230,856 - 177,773 1,244,672
Total past due $ 3,470,703 $ 1,978,724 $ 111,759 $ 643,452 $ 6,204,638
Total loans receivable $ 60,727,431 $ 71,712,826 $ 14,327,709 $ 13,063,923 $ 159,831,889
Nonaccrual loans $ 1,070,527 $ 1,104,488 $ - $ 180,468 $ 2,355,483
Recorded investment >90 days and still accruing $ - $ - $ - $ - $ -

26 23Powell Valley National Bank • 2016 Annual Report Powell Valley National Bank • 2016 Annual Report
Note 3. InVESTMEnT SECURITIES (COnTInUED)
Note 4. LOANS
The Bank’s loans consist of the following:
December 31 2016 2015
Federal Home Loan Bank $243,100 $241,100 Federal Reserve Bank 48,000 48,000 Virginia Bankers Insurance Center, LLC 223,922 223,922 Virginia Title Corporation 98,950 98,950 $613,972 $611,872
December 31 2016 2015 Real estate loans: Residential 1-4 family $ 58,420,059 $ 60,727,431 Commercial 75,484,486 71,712,826 Total real estate loans 133,904,545 132,440,257 Commercial loans 20,160,103 14,327,709 Consumer loans, including overdrafts 13,586,658 13,063,923 Total loans 167,651,306 159,831,889
Less: Unearned discount - - Allowance for loan losses 2,964,085 2,943,428 Loans, net $164,687,221 $156,888,461
The Bank’s consumer loans include $61,108 and $20,619 in overdrafts as of December 31, 2016 and 2015, respectively.
Impaired loans:
Loan impairment and any valuation allowances are determined under the provisions established by Accounting Standards Codification Topic 310, Receivables. Impaired loans without a valuation allowance represent loans for which management believes that the discounted cash flows, collateral value, or observable market price of the impaired loan is higher than the carrying value of the loan.
The following table presents impaired loans individually evaluated by class of loans.
December 31, 2015
Residential1-4 Family
CommercialReal Estate Commercial Consumer Unallocated Total
Allowance for loan losses
Beginning balance at January 1, 2015 $ 211,648 $ 437,111 $ 5,207 $ - $ 2,257,250 $ 2,911,216
Charge-offs (40,828) (62,393) (75,729) (61,660) - (240,610)
Recoveries 2,743 134,928 15,462 19,689 - 172,882
Provision 1,046,437 149,354 406,060 313,971 (1,815,822) 100,000
Ending balance at December 31, 2015 $ 1,220,000 $ 659,000 $ 351,000 $ 272,000 $ 441,428) $ 2,943,428
Portion of ending balance
Individually evaluated for impairment $ 60,000 $ - $ - $ - $ - $ 60,000
Collectively evaluatedfor impairment 1,160,000 659,000 351,000 272,000 441,428 2,883,428
Total ALLL evaluated for impairment $ 1,220,000 $ 659,000 $ 351,000 $ 272,000 $ 441,428 $ 2,943,428
Loans Receivable
Ending balance atDecember 31, 2015 $ 60,727,431 $ 71,712,826 $ 14,327,709 $ 13,063,923 N/A $ 159,831,889
Portion of ending balance
Individually evaluated for impairment $ 1,200,409 $ 2,958,975 $ 1,595,527 $ 20,456 N/A $ 5,775,367
Collectively evaluated for impairment 59,527,022 68,753,851 12,732,182 13,043,467 N/A 154,056,522
Total loans evaluated for impairments $ 60,727,431 $ 71,712,826 $ 14,327,709 $ 13,063,923 N/A $ 159,831,889
Note 4. LOAnS (COnTInUED)

24 25Powell Valley National Bank • 2016 Annual Report Powell Valley National Bank • 2016 Annual Report
Note 4. LOAnS (COnTInUED)
Impaired loans: (Continued)
December 31, 2016
RecordedInvestment
UpaidPrincipalBalance
SpecificAllowance
AverageRecorded
Investment
InterestRecorded
RecognizedWith no related allowance recorded:
Residential 1-4 family $ 945,055 $ 945,055 $ - $ 951,354 $ 42,725Commercial real estate 2,735,519 3,037,284 - 3,142,015 128,752Commercial 1,365,283 1,365,283 - 1,480,405 80,653Consumer 18,803 18,804 - 19,630 1,933
With an allowance recorded:Residential 1-4 family 142,226 142,226 60,000 143,316 8,883Commercial real estate - - - - -Commercial - - - - -Consumer - - - - -
Total:Residential 1-4 family 1,087,281 1,087,281 60,000 1,094,670 51,608Commercial real estate 2,735,519 3,037,284 - 3,142,015 128,752Commercial 1,365,283 1,365,283 - 1,480,405 80,653Consumer 18,803 18,804 - 19,630 1,933
Total impaired loans,individually evaluated $ 5,206,886 $ 5,508,652 $ 60,000 $ 5,736,720 $ 262,946
December 31, 2015
RecordedInvestment
UpaidPrincipalBalance
SpecificAllowance
AverageRecorded
Investment
InterestRecorded
RecognizedWith no related allowance recorded:
Residential 1-4 family $ 1,056,031 $ 1,056,031 $ - $ 1,064,999 $ 67,226Commercial real estate 2,958,975 3,260,740 - 3,418,933 194,348Commercial 1,595,527 1,595,527 - 1,602,377 91,986Consumer 20,456 20,456 - 20,521 1,933
With an allowance recorded:Residential 1-4 family 144,378 144,378 60,000 145,522 9,590Commercial real estate - - - - -Commercial - - - - -Consumer - - - - -
Total:Residential 1-4 family 1,200,409 1,200,409 60,000 1,210,521 76,816Commercial real estate 2,958,975 3,260,740 - 3,418,933 194,348Commercial 1,595,527 1,595,527 - 1,602,377 91,986Consumer 20,456 20,456 - 20,521 1,933
Total impaired loans,individually evaluated $ 5,775,367 $ 6,077,132 $ 60,000 $ 6,252,352 $ 365,083
Note 4. LOAnS (COnTInUED)
Allowance for loan loss:
The following table outlines the changes in the allowance for loan losses by collateral type and purpose, the allowances for loans individually and collectively evaluated for impairment, and the amount of loans individually and collectively evaluated for impairment as of December 31, 2016 and December 31, 2015:
December 31, 2016
Residential1-4 Family
CommercialReal Estate Commercial Consumer Unallocated Total
Allowance for loan losses
Beginning balance at January 1, 2016 $ 1,220,000 $ 659,000 $ 351,000 $ 272,000 $ 441,428 $ 2,943,428
Charge-offs (58,368) (72,783) (4,498) (141,369) - (277,018)
Recoveries 42,917 12,731 1,914 15,113 - 72,675
Provision 1,095,000 633,000 188,000 211,000 (1,902,000) 225,000
Ending balance at December 31,2016 $ 2,299,549 $ 1,231,948 $ 536,416 $ 356,744 $ (1,460,572) $ 2,964,085
Portion of ending balance
Individually evaluated for impairment $ 60,000 $ - $ - $ - $ - $ 60,000
Collectively evaluatedfor impairment 2,239,549 1,231,948 536,416 356,744 (1,460,572) 2,904,085
Total ALLL evaluated for impairment $ 2,299,549 $ 1,231,948 $ 536,416 $ 356,744 $ (1,460,572) $ 2,964,085
Loans Receivable
Ending balance atDecember 31, 2016 $ 58,420,059 $ 75,484,486 $ 20,160,103 $ 13,586,658 N/A $ 167,651,306
Portion of ending balance
Individually evaluated for impairment $ 1,087,281 $ 2,735,519 $ 1,365,283 $ 18,803 N/A $ 5,206,886
Collectively evaluated for impairment 57,332,778 72,748,967 18,794,820 13,567,855 N/A 162,444,420
Total loans evaluated for impairments $ 58,420,059 $ 75,484,486 $ 20,160,103 $ 13,586,658 N/A $ 167,651,306
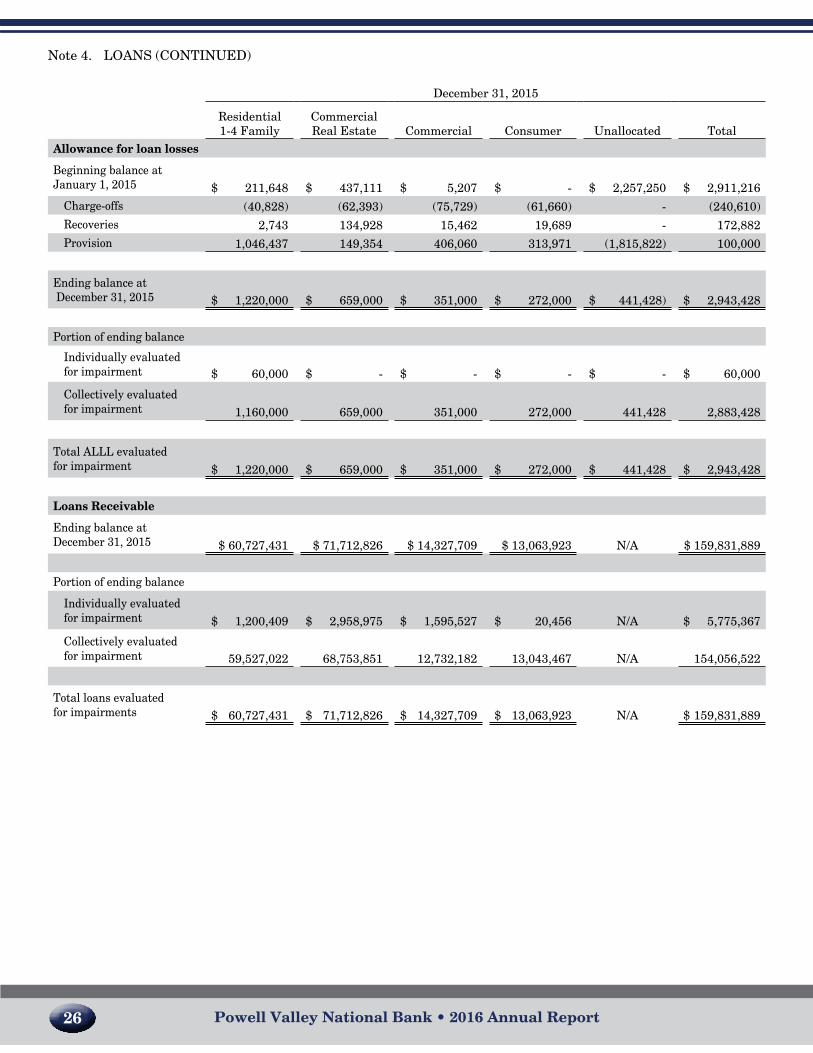
26 23Powell Valley National Bank • 2016 Annual Report Powell Valley National Bank • 2016 Annual Report
Note 3. InVESTMEnT SECURITIES (COnTInUED)
Note 4. LOANS
The Bank’s loans consist of the following:
December 31 2016 2015
Federal Home Loan Bank $243,100 $241,100 Federal Reserve Bank 48,000 48,000 Virginia Bankers Insurance Center, LLC 223,922 223,922 Virginia Title Corporation 98,950 98,950 $613,972 $611,872
December 31 2016 2015 Real estate loans: Residential 1-4 family $ 58,420,059 $ 60,727,431 Commercial 75,484,486 71,712,826 Total real estate loans 133,904,545 132,440,257 Commercial loans 20,160,103 14,327,709 Consumer loans, including overdrafts 13,586,658 13,063,923 Total loans 167,651,306 159,831,889
Less: Unearned discount - - Allowance for loan losses 2,964,085 2,943,428 Loans, net $164,687,221 $156,888,461
The Bank’s consumer loans include $61,108 and $20,619 in overdrafts as of December 31, 2016 and 2015, respectively.
Impaired loans:
Loan impairment and any valuation allowances are determined under the provisions established by Accounting Standards Codification Topic 310, Receivables. Impaired loans without a valuation allowance represent loans for which management believes that the discounted cash flows, collateral value, or observable market price of the impaired loan is higher than the carrying value of the loan.
The following table presents impaired loans individually evaluated by class of loans.
December 31, 2015
Residential1-4 Family
CommercialReal Estate Commercial Consumer Unallocated Total
Allowance for loan losses
Beginning balance at January 1, 2015 $ 211,648 $ 437,111 $ 5,207 $ - $ 2,257,250 $ 2,911,216
Charge-offs (40,828) (62,393) (75,729) (61,660) - (240,610)
Recoveries 2,743 134,928 15,462 19,689 - 172,882
Provision 1,046,437 149,354 406,060 313,971 (1,815,822) 100,000
Ending balance at December 31, 2015 $ 1,220,000 $ 659,000 $ 351,000 $ 272,000 $ 441,428) $ 2,943,428
Portion of ending balance
Individually evaluated for impairment $ 60,000 $ - $ - $ - $ - $ 60,000
Collectively evaluatedfor impairment 1,160,000 659,000 351,000 272,000 441,428 2,883,428
Total ALLL evaluated for impairment $ 1,220,000 $ 659,000 $ 351,000 $ 272,000 $ 441,428 $ 2,943,428
Loans Receivable
Ending balance atDecember 31, 2015 $ 60,727,431 $ 71,712,826 $ 14,327,709 $ 13,063,923 N/A $ 159,831,889
Portion of ending balance
Individually evaluated for impairment $ 1,200,409 $ 2,958,975 $ 1,595,527 $ 20,456 N/A $ 5,775,367
Collectively evaluated for impairment 59,527,022 68,753,851 12,732,182 13,043,467 N/A 154,056,522
Total loans evaluated for impairments $ 60,727,431 $ 71,712,826 $ 14,327,709 $ 13,063,923 N/A $ 159,831,889
Note 4. LOAnS (COnTInUED)
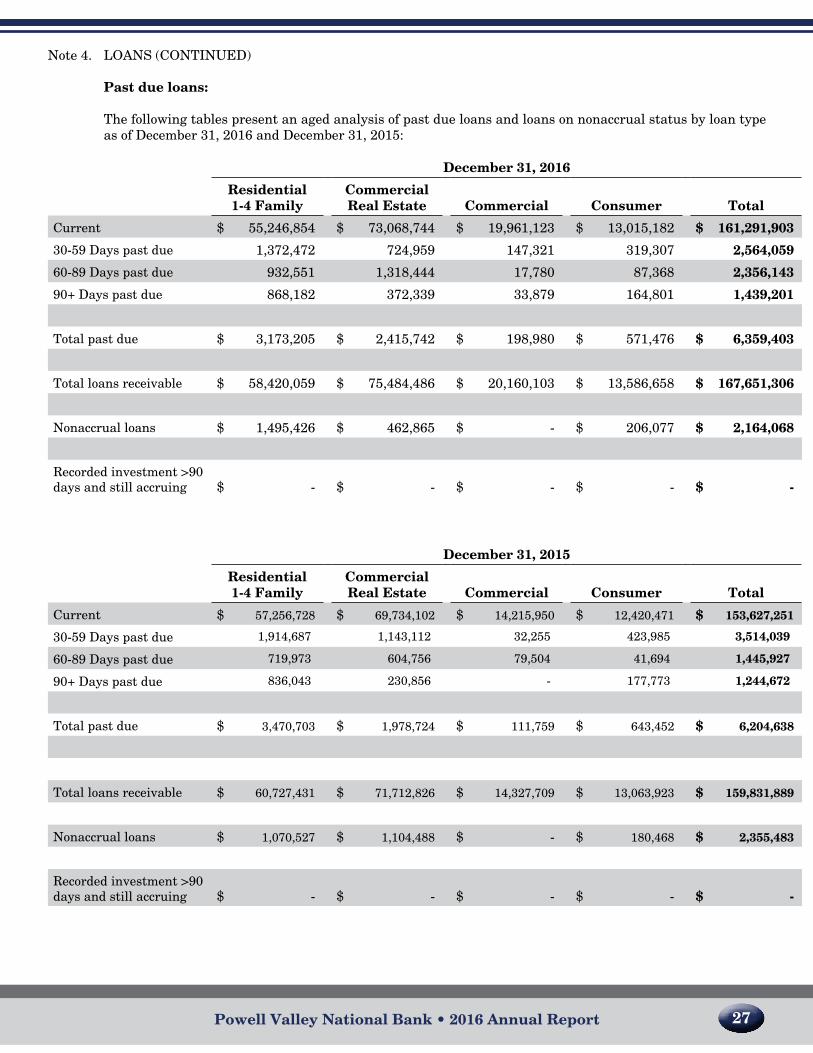
22 27Powell Valley National Bank • 2016 Annual Report Powell Valley National Bank • 2016 Annual Report
Note 3. InVESTMEnT SECURITIES (COnTInUED)
2015
Less Than 12 Months 12 Months or Greater Total
Fair ValueGross
Unrealized Losses
Fair ValueGross
Unrealized Losses
Fair ValueGross
Unrealized Losses
Available-for-sale securities:
Debt securities
U.S. Government agencies and corporations $ 2,958,671 $ (28,184) $ 5,591,885 $ (102,173) $ 8,550,556 $ (130,357)State and political subdivisions 3,760,334 (25,442) 909,685 (11,466) 4,670,019 (36,908)Mortgage-backed securities
4,377,213 (37,876) 4,122,914 (145,443) 8,500,127 (183,319)
Miscellaneous 1,491,070 (18,770) 1,037,433 (90,809) 2,528,503 (109,579)Total debt securities 12,587,288 (110,272) 11,661,917 (349,891) 24,249,205 (460,163)
Equity Securities:Other - - 220,200 (129,800) 220,200 (129,800)Total equity securities - - 220,200 (129,800) 220,200 (129,800)
Total $ 12,587,288 $ (110,272) $ 11,882,117 $ (479,691) $ 24,469,405 $ (589,963)
The Bank had 38 and 71 securities at December 31, 2016 and 2015, which were in a loss position. The Bank did not recognize any other-than-temporary impairments in 2016 or 2015; substantially all of the Bank’s unrealized losses related to interest rate movements rather than changes in credit ratings.
During 2016, sales and redemptions of securities available for sale resulted in gross realized gains of $494,838 and gross realized losses of $77,137, with a net realized gain of $417,702. During 2015, sales and redemptions of securities available for sale resulted in gross realized gains of $199,031 and gross realized losses of $5,401, with a net realized gain of $193,630.
Investment securities with a carrying amount of $46,828,177 and $36,029,501 as of December 31, 2016 and 2015, respectively, were pledged as collateral on public deposits and for other purposes as required or permitted by law.
Investments, at cost:
The Bank is required to hold a minimum number of shares of stock in the Federal Home Loan Bank (FHLB) and the Federal Reserve Bank (FRB). These are considered restricted investments and are carried at cost on the balance sheet. Additional restricted investments the Bank is required to maintain and also carried at cost include Virginia Bankers Insurance Center, LLC and Virginia Title Corporation stock. The carrying amount of the restricted investments, at cost, are as follows:
Note 4. LOAnS (COnTInUED)
Past due loans:
The following tables present an aged analysis of past due loans and loans on nonaccrual status by loan type as of December 31, 2016 and December 31, 2015:
December 31, 2016
Residential 1-4 Family
Commercial Real Estate Commercial Consumer Total
Current $ 55,246,854 $ 73,068,744 $ 19,961,123 $ 13,015,182 $ 161,291,903
30-59 Days past due 1,372,472 724,959 147,321 319,307 2,564,059
60-89 Days past due 932,551 1,318,444 17,780 87,368 2,356,143
90+ Days past due 868,182 372,339 33,879 164,801 1,439,201
Total past due $ 3,173,205 $ 2,415,742 $ 198,980 $ 571,476 $ 6,359,403
Total loans receivable $ 58,420,059 $ 75,484,486 $ 20,160,103 $ 13,586,658 $ 167,651,306
Nonaccrual loans $ 1,495,426 $ 462,865 $ - $ 206,077 $ 2,164,068
Recorded investment >90 days and still accruing $ - $ - $ - $ - $ -
December 31, 2015
Residential 1-4 Family
Commercial Real Estate Commercial Consumer Total
Current $ 57,256,728 $ 69,734,102 $ 14,215,950 $ 12,420,471 $ 153,627,251
30-59 Days past due 1,914,687 1,143,112 32,255 423,985 3,514,039
60-89 Days past due 719,973 604,756 79,504 41,694 1,445,927
90+ Days past due 836,043 230,856 - 177,773 1,244,672
Total past due $ 3,470,703 $ 1,978,724 $ 111,759 $ 643,452 $ 6,204,638
Total loans receivable $ 60,727,431 $ 71,712,826 $ 14,327,709 $ 13,063,923 $ 159,831,889
Nonaccrual loans $ 1,070,527 $ 1,104,488 $ - $ 180,468 $ 2,355,483
Recorded investment >90 days and still accruing $ - $ - $ - $ - $ -
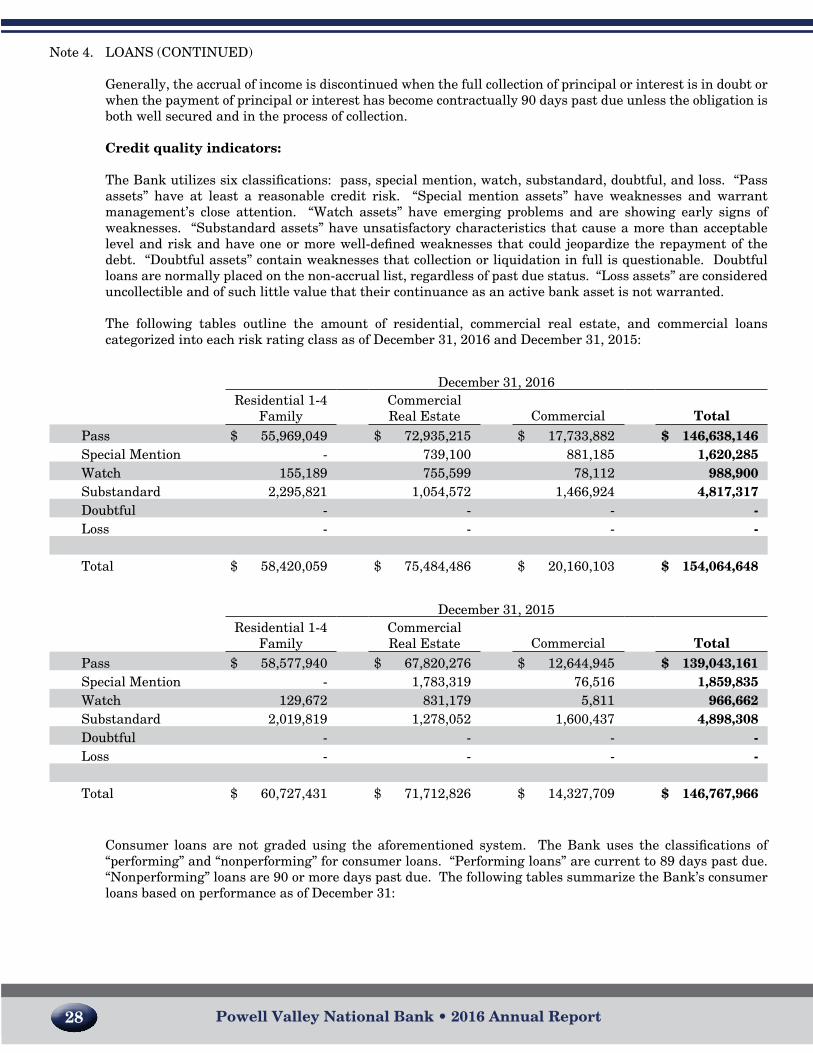
28 21Powell Valley National Bank • 2016 Annual Report Powell Valley National Bank • 2016 Annual Report
Note 3. InVESTMEnT SECURITIES (COnTInUED)
Information pertaining to securities with gross unrealized losses as of December 31, 2016 and 2015, aggregated by investment category and length of time that individual securities have been in a continuous loss position is shown in the table below.
2016Less Than 12 Months 12 Months or Greater Total
Fair ValueGross
Unrealized Losses
Fair ValueGross
Unrealized Losses
Fair ValueGross
Unrealized Losses
Available-for-sale securities:Debt securities
U.S. Government agencies and corporations $ 5,156,128 $ (175,485) $ - $ - $ 5,156,128 $ (175,485)State and political subdivisions 22,349,207 (977,242) - - 22,349,207 (977,242)Mortgage-backed securities
7,448,564 (173,993) 2,141,238 (88,588) 9,589,802 (262,581)
Miscellaneous 1,937,375 (78,000) 719,665 (30,335) 2,657,040 (109,235)Total debt securities 36,891,274 (1,405,620) 2,860,903 (118,923) 39,752,177 (1,524,543)
Equity Securities - - 225,771 (124,229) 225,771 (124,229)Total equity securities - - 225,771 (124,229) 225,771 (124,229)
Total $ 36,891,274 $ (1,405,620) $ 3,806,674 $ (243,152) $ 39,977,948 $ (1,648,772)
Note 4. LOAnS (COnTInUED) Generally, the accrual of income is discontinued when the full collection of principal or interest is in doubt or
when the payment of principal or interest has become contractually 90 days past due unless the obligation is both well secured and in the process of collection.
Credit quality indicators:
The Bank utilizes six classifications: pass, special mention, watch, substandard, doubtful, and loss. “Pass assets” have at least a reasonable credit risk. “Special mention assets” have weaknesses and warrant management’s close attention. “Watch assets” have emerging problems and are showing early signs of weaknesses. “Substandard assets” have unsatisfactory characteristics that cause a more than acceptable level and risk and have one or more well-defined weaknesses that could jeopardize the repayment of the debt. “Doubtful assets” contain weaknesses that collection or liquidation in full is questionable. Doubtful loans are normally placed on the non-accrual list, regardless of past due status. “Loss assets” are considered uncollectible and of such little value that their continuance as an active bank asset is not warranted.
The following tables outline the amount of residential, commercial real estate, and commercial loans
categorized into each risk rating class as of December 31, 2016 and December 31, 2015:
Consumer loans are not graded using the aforementioned system. The Bank uses the classifications of
“performing” and “nonperforming” for consumer loans. “Performing loans” are current to 89 days past due. “Nonperforming” loans are 90 or more days past due. The following tables summarize the Bank’s consumer loans based on performance as of December 31:
December 31, 2016Residential 1-4
FamilyCommercial Real Estate Commercial Total
Pass $ 55,969,049 $ 72,935,215 $ 17,733,882 $ 146,638,146Special Mention - 739,100 881,185 1,620,285Watch 155,189 755,599 78,112 988,900Substandard 2,295,821 1,054,572 1,466,924 4,817,317Doubtful - - - -Loss - - - -
Total $ 58,420,059 $ 75,484,486 $ 20,160,103 $ 154,064,648
December 31, 2015Residential 1-4
FamilyCommercial Real Estate Commercial Total
Pass $ 58,577,940 $ 67,820,276 $ 12,644,945 $ 139,043,161Special Mention - 1,783,319 76,516 1,859,835Watch 129,672 831,179 5,811 966,662Substandard 2,019,819 1,278,052 1,600,437 4,898,308Doubtful - - - -Loss - - - -
Total $ 60,727,431 $ 71,712,826 $ 14,327,709 $ 146,767,966

20 29Powell Valley National Bank • 2016 Annual Report Powell Valley National Bank • 2016 Annual Report
The amortized cost and approximate fair value of debt securities as of December 31, 2016, by contractual
maturity are shown below. Maturities may differ from contractual maturities in mortgaged-backed securities because the mortgages underlying the securities may be called or re-paid without any penalties. Therefore, these securities are not included in the maturity categories in the following summary.
2015 AmortizedCost
Gross Unrealized
Gains
GrossUnrealized
Losses Fair ValueAvailable-for-Sale Securities:
U.S. government agenciesand corporations $ 11,902,996 $ 26,076 $ (130,357) $ 11,798,715State and political subdivisions 34,635,728 980,694 (36,908) 35,579,514Mortgage-backed securities 16,168,580 119,507 (183,319) 16,104,768Miscellaneous 3,837,564 460,246 (109,579) 4,188,231
Total debt securities 66,544,868 1,586,523 (460,163) 67,671,228Equity Securities 350,200 95,184 (129,800) 315,584Total investment securities $ 66,895,068 $ 1,681,707 $ (589,963) $ 67,986,812
Debt SecuritiesAvailable-for-sale
AmortizedCost
Fair Value
Available-for-sale securities:Due in one year or less $ 7,164,121 $ 7,119,934Due after one year through five years 24,483,024 24,684,252Due after five years through ten years 14,370,587 13,952,112Due after ten years $ 4,549,267 $ 4,170,306
50,566,999 49,926,604
Mortgage-backed securities 12,427,498 12,180,605Total $ 62,994,497 $ 62,107,209
Management determines whether it intends to sell or if it is more likely than not that it will be required to sell impaired securities. This determination considers current and forecasted liquidity requirements, regulatory and capital requirements, and securities portfolio management. For all impaired securities for which there was no intent or expected requirement to sell, the evaluation considers all available evidence to assess whether it is likely the amortized cost value will be recovered. The Bank conducts a regular assessment of its debt securities with unrealized losses to determine whether securities have other-than-temporary impairment (OTTI) considering, among other factors, the nature of the securities, credit rating or financial condition of the issuer, the extent and duration of the unrealized loss, expected cash flows of underlying collateral, market conditions and whether the Bank intends to sell or more likely than not the Bank will be required to sell the debt securities.
Note 4. LOAnS (COnTInUED)
Troubled debt restructuring:
A modification of a loan constitutes a troubled debt restructuring (“TDR”) when a borrower is experiencing financial difficulty and the modification constitutes a concession. By granting the concession, the Bank expects to increase the probability of collection by more than would be expected by not granting the concession. The Bank’s determination of whether a modification is a TDR considers the facts and circumstances surrounding each respective modification.
The following presents information related to loans modified as a TDR during the year ended December 31, 2016.
2016 2015Performing $ 13,421,857 $ 12,886,150Non-performing 164,801 177,773
Total $ 13,586,658 $ 13,063,923
Number of Loans
Pre-Modification Outstanding
Recorded Investment
Post-Modification Outstanding
Recorded Investment
Residential 1-4 Family 2 $ 262,633 $ 261,463Commercial Real Estate 1 - -
3 $ 262,633 $ 261,463
The loan modifications completed in 2016 were related to a single borrower to provide a lower interest rate and extend the maturity date for each loan with no forgiveness of debt.
There were no loans modified in a TDR from January 1, 2016 through December 31, 2016 that subsequently defaulted (60 days or more past due following modification) during the twelve months ended December 31, 2016.
There were no loans modified as a troubled debt restructuring during the year ended December 31, 2015.
Foreclosed properties as of December 31, 2016 included residential real estate properties of:
Residential real estate included in foreclosed property $ 300,380
Number of properties 5
Note 3. InVESTMEnT SECURITIES (COnTInUED)

30 19Powell Valley National Bank • 2016 Annual Report Powell Valley National Bank • 2016 Annual Report
Note 1. SUMMARY OF SIGnIFICAnT ACCOUnTInG POLICIES (COnTInUED)
Recent accounting pronouncements: (Continued)
In January 2016, ASU no. 2016-01 Financial Instruments – Overall (Subtopic 825-10) was issued by the FASB. The amendments address certain aspects of recognition, measurement, presentation, and disclosure of financial instruments. The amendments will be effective for fiscal years beginning after December 15, 2018. The Company is currently evaluating the impact of these amendments on its financial statements.
In June 2016, ASU no. 2016-13 Financial Instruments – Credit Losses (Topic 326) was issued by the FASB. The ASU is intended to improve financial reporting by requiring timelier recording of credit losses on loans and other financial instruments held by financial institutions and other organizations. The ASU is effective for the Company in fiscal years beginning after December 15, 2020. Early application will be permitted for all organizations for fiscal years, and interim periods within those fiscal years, beginning after December 15, 2018. The Company is currently evaluating the effect that implementation of the new standard will have on its financial position, results of operations, and cash flows.
Other accounting standards have been issued by the FASB that are not currently applicable to the Company or are not expected to have a material impact on its financial statements.
Note 2. RESTRICTIONS ON CASH AND DUE FROM BANKS AND INTEREST-BEARING DEPOSITS
Under agreements with correspondent banks, the Bank maintains deposit balances with the correspondents to cover various bank processing charges. In addition, the Bank is required to maintain average reserve balances on hand or with the Federal Reserve Bank based on customer deposit balances. As of December 31, 2016 and 2015, these reserve balances amounted to $2,102,000 and $2,102,000, respectively.
Note 3. INVESTMENT SECURITIES
The amortized cost and approximate fair value of securities, with gross unrealized gains and losses, follows:
2016 AmortizedCost
Gross Unrealized
Gains
GrossUnrealized
Losses Fair ValueAvailable-for-Sale Securities:
U.S. government agenciesand corporations $ 5,358,323 $ 7,277 $ (175,485) $ 5,190,115State and political subdivisions 41,402,141 488,094 (977,242) 40,912,993Mortgage-backed securities 12,427,498 21,396 (262,581) 12,186,313Miscellaneous 3,806,535 120,488 (109,235) 3,817,788
Total debt securities 62,994,497 637,255 (1,524,163) 62,107,209Equity Securities 350,200 223,957 (124,229) 449,928Total investment securities $ 63,344,697 $ 861,212 $ (1,648,772) $ 62,557,137
Note 4. LOAnS (COnTInUED)
Residential real estate properties for which the foreclosure process had begun but had yet to be completed as of December 31, 2016:
Residential real estate in foreclosure process at year end $ 106,223
Number of properties 4
Capital Leases Operating Leases
2017 $ 13,762 $ 5,3362018 - 5,3362019 - 5,3362020 - 4,002
$ 13,762 $ 20,010
Amount representing interest $ (1,016)
Present value of net minimum lease payments, reported in other liabilities $ 12,746
2016 2015
Land $ 1,282,781 $ 1,282,781Bank building and improvements 6,803,633 6,708,591Furniture and equipment 2,827,151 2,740,539Automobile 194,735 175,395
11,108,300 10,907,306Less accumulated depreciation (5,394,372) (5,048,171)
$ 5,713,928 $ 5,859,135
Note 5. PREMISES AND EQUIPMENT
The major classes of premises and equipment and the total accumulated depreciation are as follows:
Depreciation and amortization expense of premises and equipment for 2016 and 2015 was $346,201 and
$341,986, respectively.
Note 6. LEASE COMMITMENTS The Company leases various types of office equipment and other facilities generally over periods ranging
up to five years. Certain leases provide renewal or purchase options, and accordingly, the capital lease is recorded in the Company’s fixed assets and other liabilities. The net book value of equipment subject to capital leases at December 31, 2016 was approximately $6,000.
Minimum future lease payments as of December 31, 2016, are as follows:
Lease expense under operating leases totaled approximately $9,045 in 2016 and $9,628 in 2015.

18 31Powell Valley National Bank • 2016 Annual Report Powell Valley National Bank • 2016 Annual Report
Note 1. SUMMARY OF SIGnIFICAnT ACCOUnTInG POLICIES (COnTInUED)
Income taxes: (Continued)
Current income tax reflects taxes to be paid or refunded for the current period by applying the provisions of the enacted tax law to taxable income or loss. Deferred taxes relate primarily to differences between the basis of the allowance for loan losses, available-for-sale securities, accumulated depreciation, and accrued employee benefits. The deferred tax assets and liabilities represent the future tax return consequences of those differences, which will either be taxable or deductible when the assets and liabilities are settled. Deferred tax assets and liabilities are reflected at income tax rates applicable to the period in which the deferred tax assets or liabilities are expected to be realized or settled. As changes in tax laws or rates are enacted, deferred tax assets and liabilities are adjusted through the provision for income taxes.
The Bank recognizes deferred tax assets if it is more likely than not, based on the technical merits, that the tax position will be realized or sustained upon examination. The Bank follows the statutory requirements for its income tax accounting and generally avoids risks associated with potentially problematic tax positions that may be challenged upon examination.
The Bank’s policy is to recognize interest and penalties on income taxes in other noninterest expenses. The Bank remains subject to examination for income tax returns for the years 2013 through 2016.
Compensated absences:
Compensated absences for sick day and personal time have not been accrued since they cannot be reasonably estimated. The Bank’s policy is to recognize these costs when actually paid.
Comprehensive income (loss):
Comprehensive income (loss) consists of the total of all components of comprehensive income (loss) including net income (loss). Other comprehensive income (loss) refers to revenues, expenses, gains, and losses under U.S. generally accepted accounting principles that are included in comprehensive income (loss) but excluded from net income (loss). Currently, the Bank’s other comprehensive income (loss) consists of unrealized gains and losses on securities available for sale, net of deferred tax expense (benefit).
Earnings per common share:
Earnings per common share amounts are computed by dividing net income by the weighted average number of common shares outstanding during each year.
Reclassifications:
Certain prior year amounts have been reclassified to conform with present year presentations.
Recent accounting pronouncements:
In May 2014, the FASB issued ASU no. 2014-09, Revenue from Contracts with Customers (Topic 606). ASU 2014-09 is a comprehensive new revenue recognition model that requires a company to recognize revenue to depict the transfer of goods or services to a customer at an amount that reflects the consideration it expects to receive in exchange for those goods or services. ASU 2014-09 also requires additional disclosure about the nature, amount, timing, and uncertainty of revenue and cash flows arising from customer contracts, including significant judgments and changes in judgments and assets recognized from costs incurred to obtain or fulfill a contract. ASU 2014-09 was effective for annual reporting periods beginning after December 15, 2017. ASU No. 2015-14 issued in August 2015 deferred the effective date of this Update to annual reporting periods beginning after December 15, 2018. Earlier application is permitted only as of annual reporting periods beginning after December 15, 2016, including interim reporting periods within that reporting period. The adoption of this ASU is not expected to have a material effect on the Company’s current financial position or results of operations; however, it may impact the reporting of future financial statement disclosures.
Note 7. FEDERAL HOME LOAN BANK ADVANCES
Pursuant to collateral agreements with the Federal Home Loan Bank (FHLB), advances are collateralized by the Bank’s stock in the FHLB and a blanket pledge of qualifying first mortgage loans. The lendable collateral value of the loans as of December 31, 2016 and 2015 was $32,781,956 and $30,135,264, respectively.
Note 8. DEPOSITS
The aggregate amount of time deposits in denominations of $250,000 or more as of December 31, 2016 and 2015 was $17,292,785 and $15,527,808, respectively.
At December 31, 2016, the scheduled maturities of time deposits are as follows:
2017 $ 44,784,9672018 13,583,7342019 5,100,3712020 689,6002021 6,807,393
Thereafter 103,456
$ 71,069,521
Note 9. INCOME TAxES
The Company files a consolidated federal income tax return with its subsidiaries. The consolidated provision for income taxes for 2016 and 2015 consists of the following:
2016 2015
Current tax expense $ 813,498 $ 1,004,587Deferred tax expense (benefit) 277,545 (9,091)
Total income tax expense $ 1,091,043 $ 995,496
2016 2015
Amount % Amount %Expected tax provision at a 34% rate $ 1,362,226 34.0% $ 1,260,334 34.0%
Tax effect of:Tax exempt income (356,272) (10.2%) (377,321) 10.2%Other items, net 85,089 3.4% 112,483 3.3%
Income taxes $ 1,091,043 27.2% $ 995,496 21.7%
The provision for federal income taxes differs from that computed by applying federal statutory rates to income (loss) before federal income tax expense, as indicated in the following analysis:
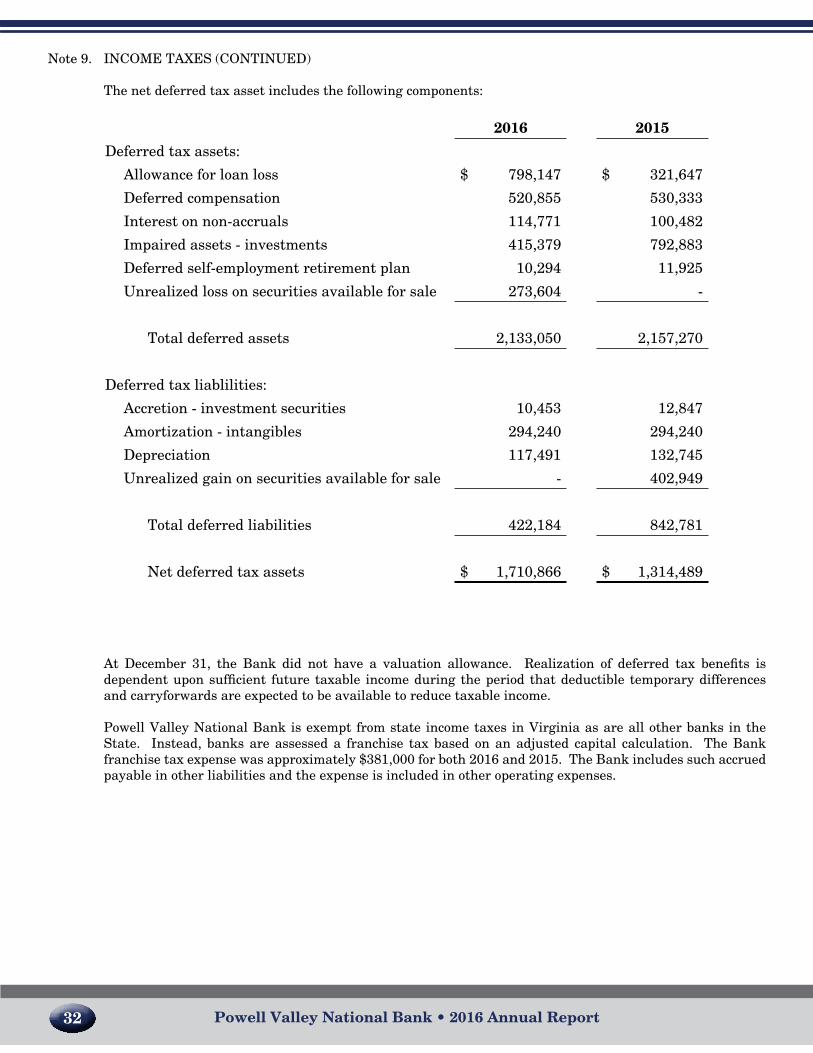
32 17Powell Valley National Bank • 2016 Annual Report Powell Valley National Bank • 2016 Annual Report
Note 1. SUMMARY OF SIGnIFICAnT ACCOUnTInG POLICIES (COnTInUED)
Premises and equipment:
Land is carried at cost. Premises and equipment are carried at cost less accumulated depreciation. Depreciation is computed principally on the methods used for Federal income tax reporting purposes. Maintenance and repairs are expensed as incurred while major additions and improvements are capitalized. Gains and losses on dispositions are included in current operations.
Premises and equipment are depreciated over the following lives:
Buildings and improvements 5-40 years Furniture, equipment, and software 3-10 years
Bank owned life insurance:
The Bank purchased single premium life insurance on certain employees of the Bank. Appreciation in value of the insurance policies is classified in non-interest income.
Foreclosed assets:
Foreclosed assets consist of other real estate owned (OREO). OREO represents real estate properties acquired through or in lieu of loan foreclosure. OREO is held for sale and is initially recorded at the fair value less estimated selling cost at the date of foreclosure. Any write-down based on the asset’s fair value at the time of transfer to OREO is charged to the allowance for loan losses. Property is evaluated regularly to ensure the recorded amount is supported by its current fair value, with charges to operations, if necessary, to reduce the carrying value of a property to the lower of its cost or fair value less cost to sell. Costs of significant property improvements are capitalized; whereas, costs relating to holding property are expensed. Foreclosed assets are held by the Bank and by Powell Valley Service Corporation, the Bank’s wholly owned subsidiary.
Intangible assets: The Bank evaluates goodwill for impairment in accordance with ASC Topic 350, Intangibles – Goodwill
and Other Intangibles. Under the provisions of ASC 350, goodwill is evaluated for impairment through the assessment of certain qualitative factors to determine whether it is more likely than not that the carrying amount exceeds its fair market value. Based on the qualitative assessment, no impairment loss was deemed necessary at December 31, 2016 and 2015.
Advertising:
The Bank’s policy is to expense advertising costs as the costs are incurred.
Income taxes:
Income taxes are provided for the tax effects of the transactions reported in the financial statements and consist of taxes currently due plus deferred taxes.
Note 9. InCOME TAxES (COnTInUED)
The net deferred tax asset includes the following components:
2016 2015
Deferred tax assets:
Allowance for loan loss $ 798,147 $ 321,647
Deferred compensation 520,855 530,333
Interest on non-accruals 114,771 100,482
Impaired assets - investments 415,379 792,883
Deferred self-employment retirement plan 10,294 11,925
Unrealized loss on securities available for sale 273,604 -
Total deferred assets 2,133,050 2,157,270
Deferred tax liablilities:
Accretion - investment securities 10,453 12,847
Amortization - intangibles 294,240 294,240
Depreciation 117,491 132,745
Unrealized gain on securities available for sale - 402,949
Total deferred liabilities 422,184 842,781
Net deferred tax assets $ 1,710,866 $ 1,314,489
At December 31, the Bank did not have a valuation allowance. Realization of deferred tax benefits is dependent upon sufficient future taxable income during the period that deductible temporary differences and carryforwards are expected to be available to reduce taxable income.
Powell Valley National Bank is exempt from state income taxes in Virginia as are all other banks in the State. Instead, banks are assessed a franchise tax based on an adjusted capital calculation. The Bank franchise tax expense was approximately $381,000 for both 2016 and 2015. The Bank includes such accrued payable in other liabilities and the expense is included in other operating expenses.

16 33Powell Valley National Bank • 2016 Annual Report Powell Valley National Bank • 2016 Annual Report
Note 1. SUMMARY OF SIGnIFICAnT ACCOUnTInG POLICIES (COnTInUED)
Loans: (Continued)
All interest accrued but not collected for loans that are placed on nonaccrual or charged off is reversed against interest income. The interest on these loans is accounted for on the cash-basis or cost-recovery method, until qualifying for return to accrual. Loans are returned to accrual status when all principal and interest amounts contractually due are brought current and future payments are reasonably assured.
Allowance for loan losses:
The allowance for loan losses represents the amount of earnings that have been set aside (reserved) to cover losses from loans. Loan losses are charged against the allowance when management believes the uncollectability of a loan balance is confirmed. Subsequent recoveries, if any, are credited to the allowance.
The allowance for loan losses is evaluated on a regular basis by management and is based upon management’s periodic review of the collectability of the loans in light of historical experience, the nature and volume of the loan portfolio, adverse situations that may affect the borrower’s ability to repay, estimated value of any underlying collateral and prevailing economic conditions. This evaluation is inherently subjective as it requires estimates that are susceptible to significant revision as more information becomes available.
The allowance consists of specific, general, and unallocated components. The specific component relates to
loans that are classified as doubtful, substandard, or special mention. For such loans that are also considered impaired, an allowance is established when the discounted cash flows (or collateral value or observable market price) of the impaired loan is lower than the carrying value of that loan. The general component covers non-classified loans and is based on historical loss experience adjusted for qualitative factors. An unallocated component is maintained to cover uncertainties that could affect management’s estimate of probable losses. The unallocated component of the allowance reflects the margin of imprecision inherent in the underlying assumptions used in the methodologies for estimating specific and general losses in the portfolio.
A loan is considered impaired when, based on current information and events, it is probable that the Bank will be unable to collect the scheduled payments of principal or interest when due according to the contractual terms of the loan agreement. Factors considered by management in determining impairment include payment status, collateral value, and the probability of collecting scheduled principal and interest payments when due. Loans that experience insignificant payment delays and payment shortfalls generally are not considered impaired. Management determines the significance of payment delays and payment shortfalls on a case-by-case basis, taking into consideration all of the circumstances surrounding the loan and the borrower, including the length of the delay, the reasons for the delay, the borrower’s prior payment record, and the amount of the shortfall in relation to the principal and interest owed. Impairment is measured on a loan-by-loan basis for commercial and construction loans by either the present value of expected future cash flows discounted at the loan’s effective interest rate, the loan’s obtainable market price, or the fair value of the collateral if the loan is collateral dependent.
Large groups of smaller balance homogeneous loans are collectively evaluated for impairment. Accordingly, the Bank does not separately identify individual consumer and residential loans for impairment disclosures, unless such loans are the subject of a restructuring agreement.
Off-balance sheet credit related financial instruments:
In the ordinary course of business, the Bank has entered into commitments to extend credit, including commitments under commercial letters of credit and standby letters of credit. Such financial instruments are recorded when they are funded.
Note 10. MINIMUM REGULATORY CAPITAL REQUIREMENTS
The Company (on a consolidated basis) and the Bank are subject to various regulatory capital requirements administered by the federal banking agencies. Failure to meet minimum capital requirements can initiate certain mandatory and possibly additional discretionary actions by regulators that, if undertaken, could have a direct material effect on the Company and the consolidated financial statements. Under the regulatory capital adequacy guidelines and the regulatory framework for prompt corrective action, the Company and the Bank must meet specific capital guidelines involving quantitative measures of their assets, liabilities, and certain off-balance sheet items as calculated under regulatory accounting practices. The Company’s and the Bank’s capital amounts and classification under the prompt corrective action guidelines are also subject to qualitative judgments by the regulators about components, risk weightings, and other factors.
Effective January 1, 2015 (with some changes transitioned into full effectiveness over two to four years), the Company and Bank became subject to new capital requirements with the implementation of Basel III. These new requirements create a new required ratio for common equity Tier 1 (“CET1”) capital, increase the Tier 1 capital ratio, change the risk weight of certain assets for purposes of the risk-based capital ratios, create an additional capital conservation buffer over the required capital ratios and change what qualifies as capital for purposes of meeting these various capital requirements. Beginning in 2016, failure to maintain the required capital conservation buffer will limit the ability of the Company and the Bank to pay dividends, repurchase shares, or pay discretionary bonuses.
Under the new capital regulations, the minimum capital ratios are: (1) CET1 capital ratio of 4.5% of risk-weighted assets (new); (2) a Tier 1 capital ratio of 6.0% of risk-weighted assets (increased from 4.0%); (3) a total capital ratio of 8.0% of risk-weighted assets (unchanged); and (4) a leverage ratio of 4.0% (unchanged). CET1 generally consist of common stock and retained earnings, subject to applicable regulatory adjustments and deductions.
There are a number of changes in what constitutes regulatory capital, some of which are subject to transition periods. These changes include the phasing-out of certain instruments as qualifying capital. The Company and the Bank do not use any of these instruments. Under the new requirements for total capital, Tier 2 capital is no longer limited to the amount of Tier 1 capital included in total capital. Mortgage servicing rights, certain deferred tax assets, and investments in unconsolidated subsidiaries over designated percentages of CET1 will be deducted from capital. The Company and the Bank has elected to permanently opt-out of the inclusion of accumulated other comprehensive income in the capital calculations, as permitted by the regulations. This opt-out will reduce the impact of market volatility on regulatory capital levels.
The new requirements also include changes in the risk-weights of assets to better reflect credit risk and other risk exposures. These include a 150% risk weight (increased from 100%) for certain high volatility commercial real estate acquisitions, development and construction loans and for non-residential mortgage loans that are 90 days past due or otherwise in non-accrual status; a 20% (increased from 0%) credit conversion factor for the unused portion of a commitment with an original maturity of one year or less that is not unconditionally cancellable; a 250% risk weight (increased from 100%) for mortgage servicing and deferred tax assets that are not deducted from capital; and increased risk weights (0% to 600%) for equity exposures.
In addition to the minimum CET1, Tier 1 and total capital ratios, the Company and Bank will have to
maintain a capital conservation buffer consisting of CET1 capital greater than 2.5% of risk weighted assets above the required minimum levels in order to avoid limitations on paying dividends, engaging in share purchases, and paying discretionary bonuses based on percentages of eligible retained income that could be utilized for such actions. This new capital conservation buffer requirement will be phased in beginning January 2016 at 0.625% of risk-weighted assets and increasing each year until fully implemented in January 2019.

34 15Powell Valley National Bank • 2016 Annual Report Powell Valley National Bank • 2016 Annual Report
Note 1. SUMMARY OF SIGnIFICAnT ACCOUnTInG POLICIES (COnTInUED)
Cash and cash equivalents:
For purposes of the consolidated statements of cash flows, cash and cash equivalents include cash and balances due from banks, interest-bearing deposits in other banks, and federal funds sold, all of which mature within ninety days. Accounts in financial institutions are insured by the Federal Deposit Insurance Corporation (FDIC) up to $250,000. At times, cash balances may exceed these limits; however, the Company does not believe it is subject to any significant credit risk as a result of these deposits. Excess cash reserves are held at the Federal Reserve Bank of Richmond.
Investment securities:
The Bank’s investments in securities are classified and accounted for as follows:
Held-to-maturity: Government and government agency bonds, notes, and certificates which the Bank has the positive intent and ability to hold to maturity are reported at cost, adjusted for amortization of premiums
and accretion of discounts which are recognized in interest income using the interest method over the period to maturity. The Bank had no held-to-maturity securities at December 31, 2016 or 2015.
Available-for-sale: Government and government agency bonds, notes, and certificates are classified available-for-sale when the Bank anticipates that the securities could be sold in response to rate changes, prepayment risk, liquidity, availability of and the yield on alternative investments and other market and economic factors. Securities available-for-sale are carried at fair value with unrealized gains and losses reported in other comprehensive income. Realized gains (losses) on securities available-for-sale are included in non-interest income and reported as a reclassification adjustment, net of tax, in other comprehensive income. Gains and losses on sales of securities are determined on the specific-identification method.
Declines in the fair value of individual held-to-maturity and available-for-sale securities below their cost that are other-than-temporary result in write-downs of the individual securities to their fair value. The related write-downs are included in earnings as realized losses. In estimating other-than-temporary impairment losses, management considers (1) the length of time and the extent to which the fair value has been less than cost, (2) the financial condition and near-term prospects of the issuer, and (3) the intent and ability of the Bank to retain its investment in the issuer for a period of time sufficient to allow for any anticipated recovery in fair value.
Loans:
The Bank grants mortgage, commercial, and consumer loans to customers. A substantial portion of the loan portfolio is represented by mortgage loans throughout southwestern Virginia and upper northeast Tennessee. The ability of the Bank’s debtors to honor their contracts is dependent upon the real estate and general economic conditions in this area.
Loans that management has the intent and ability to hold for the foreseeable future or until maturity or pay-off generally are reported at their outstanding unpaid principal balances adjusted for charge-offs, the allowance for loan losses, and any unearned discounts. Interest income is accrued on the unpaid principal balance. Unearned discounts on installment loans are recognized as income over the term of the loans using a method that approximates the interest method. The Bank does not defer loan fees and related loan origination costs. Based on management’s assessments, the difference between deferral and immediate recognition of such fees and related costs is not material.
The accrual of interest on mortgage and commercial loans is discontinued at the time the loan is 90 days past due unless the credit is well-secured and in process of collection. Personal loans are typically charged off no later than 120 days past due. Past due status is based on contractual terms of the loan. In all cases, loans are placed on non-accrual or charged-off at an earlier date if collection of principal or interest is considered doubtful.
Note 10. MInIMUM REGULATORY CAPITAL REqUIREMEnTS (COnTInUED)
The prompt corrective action standards also changed effective January 1, 2015. Under the new standards, in order to be considered well capitalized, the Bank must have a CET1 ratio of 6.5% (new), a Tier 1 ratio of 8.0% (increased from 6.0%), a total risk-based capital ratio of 10.0% (unchanged), and a leverage ratio of 5.0% (unchanged). The Company and the Bank meet all requirements, including the full capital conservation buffer.
The Company’s and the Bank’s actual capital amounts and ratios as of December 31, 2016 and 2015 are as follows (in thousands):
ActualFor Capital
Adequacy Purposes
To Be Well Capitalized Under Prompt Corrective Action Provisions
December 31, 2016: Amount Ratio Amount Ratio Amount RatioTotal Capital to Risk
Weighted Assets $ 47,053 26.86% $ 14,013 8.00% $ 17,517 10.00%Consolidated $ 47,613 27.18% $ 14,013 8.00% N/A
Tier I Capital to RiskWeighted Assets $ 44,770 25.56% $ 10,510 6.00% $ 14,013 8.00%Consolidated $ 45,330 25.88% $ 10,510 6.00% N/A
Tier I Leverage to Average Assets $ 44,770 16.76% $ 10,687 4.00% $ 13,359 5.00%Consolidated $ 45,330 16.94% $ 10,703 4.00% N/A
Common Equity Tier I to Risk Weighted Assets $ 44,770 25.56% $ 7,882 4.50% $ 11,386 6.50%Consolidated $ 45,330 25.88% $ 7,882 4.50% N/A
December 31, 2015Total Capital to Risk
Weighted Assets $ 45,530 24.55% $ 14,839 8.00% $ 18,549 10.00%Consolidated $ 45,796 24.69% $ 14,839 8.00% N/A
Tier I Capital to RiskWeighted Assets $ 43,177 23.28% $ 11,130 6.00% $ 14,839 8.00%Consolidated $ 43,443 23.42% $ 11,130 6.00% N/A
Tier I Leverage to AverageAssets $ 43,177 16.11% $ 10,720 4.00% $ 13,400 5.00%Consolidated $ 43,443 16.19% $ 10,732 4.00% N/A
Common Equity Tier 1 toRisk Weighted Assets $ 43,177 23.28% $ 8,347 4.50% $ 12,057 6.50%Consolidated $ 43,443 23.42% $ 8,347 4.50% N/A

14 35Powell Valley National Bank • 2016 Annual Report Powell Valley National Bank • 2016 Annual Report
Note 1. SUMMARY OF SIGNIFICANT ACCOUNTING POLICIES
The accounting and reporting policies of Powell Valley Bankshares, Inc. and Subsidiaries (collectively, the “Company”) conform with accounting principles generally accepted in the United States of America and accepted accounting and reporting practices within the banking industry. The significant accounting policies
are summarized as follows:
Subsequent events:
The Company has evaluated the accompanying consolidated financial statements for subsequent events and transactions through February 27, 2017, the date these financial statements were available for issue.
Principles of consolidation:
The consolidated statements include the accounts of the Powell Valley Bankshares, its wholly-owned subsidiary, Powell Valley national Bank (Bank), and Powell Valley Service Corporation, a wholly owned subsidiary of Powell Valley national Bank. All significant intercompany balances and transactions have been eliminated in consolidation.
Nature of operations:
The Company is a bank-holding company which owns all of the outstanding common stock of Powell Valley national Bank. The Bank provides a variety of financial services throughout locations within its primary lending areas of the City of Norton, and Lee, Scott, and Wise counties in Virginia. The Bank also has a loan production office in Kingsport, Tennessee. The Bank’s primary deposit products are demand deposits, savings accounts, and certificates of deposit. Its primary lending products are real estate loans, consumer loans, and commercial loans. The Bank offers investment services to its customers through an investment service agreement with a third party provider.
Use of estimates:
The preparation of consolidated financial statements in conformity with accounting principles generally accepted in the United States requires management to make estimates and assumptions that affect the reported amounts of assets and liabilities and disclosure of contingent assets and liabilities at the date of the
financial statements and the reported amounts of revenues and expenses during the reporting period. Actual results could differ from those estimates.
Material estimates that are particularly susceptible to significant change relate to the determination of the allowance for losses on loans, the valuation of foreclosed real estate, the valuation of deferred tax assets, other-than-temporary impairments of securities, and the fair value of financial instruments. In connection with the determination of the estimated losses on loans and valuation of foreclosed real estate, management
obtains independent appraisals for significant collateral and properties. Although the Bank has a diversified loan portfolio, a substantial portion of its debtors’ ability to honor their contracts is dependent upon the local
economic condition of the primary lending area, particularly in the real estate sector and coal-dependent areas. Accordingly, the ultimate collectability of a substantial portion of the Bank’s loan portfolio and the recovery of a substantial portion of the carrying amount of foreclosed real estate are susceptible to changes in local market conditions.
Management uses available information to recognize losses on loans and foreclosed real estate. However,
further reductions in the carrying amounts of loans and foreclosed assets may be necessary based on changes in local economic conditions. In addition, regulatory agencies, as an integral part of their examination process, periodically review the estimated losses on loans and foreclosed real estate. Such agencies may require the Bank to recognize additional losses based on their judgments about information available to them at the time of their examination. Because of these factors, it is reasonably possible that the estimated losses on loans and foreclosed real estate may change materially in the near term. However, the amount of the change that is reasonably possible cannot be estimated.
Note 11. RESTRICTION ON DIVIDENDS
The payment of dividends by the Company depends to a great extent on the ability of the Bank to pay dividends to the Holding Company. The Bank, as a Virginia banking corporation, may pay dividends only out of its retained earnings. The payment of dividends by any bank is dependent upon its earnings and financial condition and subject to the statutory power of certain federal and state regulatory agencies to act to prevent what they deem unsafe or unsound banking practices. Moreover, the Federal Reserve Board, the Comptroller of the Currency and the FDIC have issued policy statements which provide that bank holding companies and insured depository institutions generally should only pay dividends out of current operating earnings. The approval of the regulatory agency is required if the dividends declared in any year exceed net income for that year combined with the retained net income of the two preceding years. The payment of dividends by the Bank may also be affected or limited by other factors, such as the requirement to maintain adequate capital above regulatory guidelines. During 2016, the Bank paid $1,328.752 in dividends to the Company. The regulatory dividend limit from the Bank to the Company for 2016 was $6,227,615. As of December 31, 2016, the amount of retained earnings at the Bank that were available for future dividends to the Company without prior regulatory approval equaled $4,898,863.
note 12. Employee Benefit Plans
401(k) and profit share plan:
The Bank has a 401(k) Plan (“Plan”) to provide retirement benefits for its employees. Employees may make elective contributions to the Plan, limited to a maximum annual amount as set by the Internal Revenue Service. The Bank matches employee contributions dollar for dollar up to a maximum of 2.5% per year per person plus a discretionary profit share contribution as determined by the board of directors. In 2016, the Bank elected to contribute an additional 2.5% of each employee’s gross pay into the plan for eligible employees. For the years ended December 31, 2016 and 2015, expense attributable to the Plan amounted to $148,823 and $148,855, respectively.
Nonqualified deferred compensation plan:
The Board of Directors adopted a nonqualified deferred compensation plan (“Plan”) for the Board as of August 18, 2000. The Plan is administered by the VBA Benefits Corporation. Under the Plan, an irrevocable Trust was established for the benefit of the plan participants. Each participant may make annual elective contributions to the Plan.
Supplementary executive retirement plan:
The Bank adopted a non-qualified long-term incentive plan for some executive officers of the Bank. The funds necessary to guarantee these payments are being provided for by the purchase of life insurance policies on the life of each officer. The Bank is the owner and beneficiary of each life insurance policy. During the year ended December 31, 2016 and 2015, $30,275 and $35,073 was charged to expense under these plans, respectively.
Note 13. COMMITMENTS AND CONTINGENCIES
Financial instrument with off-balance-sheet risk:
The Bank is party to financial instruments with off-balance-sheet risk in the normal course of business to meet the financing needs of its customers. These financial instruments include commitments to extend credit and standby letters of credit. These instruments involve, to varying degrees, elements of credit risk in excess of the amount recognized in the balance sheets.
The Bank’s exposure to credit loss in the event of nonperformance by the other party to the financial instrument for commitments to extend credit and standby letters of credit is represented by the contractual amount of those instruments. The Bank uses the same credit policies in making commitments and conditional

36 13Powell Valley National Bank • 2016 Annual Report Powell Valley National Bank • 2016 Annual Report
2016 2015Net change in cash and cash equivalents $ 703,100 $ (6,788,213)
Cash and cash equivalents at beginning of year 25,248,290 32,026,503
Cash and cash equivalents at end of year $ 25,951,390 $ 25,248,290
SUPPLEMENTAL DISCLOSURES OF CASH FLOW INFORMATIONCash payments for:
Interest paid on deposits and borrowed funds $ 574,039 $ 678,046
Income taxes paid $ 1,220,000 $ 1,170,000
SUPPLEMENTAL SCHEDULE OF NONCASH INVESTING ACTIVITIES:Total increase in unrealized gain (loss)on securities available for sale - $ (166,473)
obligations as for on-balance-sheet instruments. A summary of the Bank’s commitments as of December 31 is as follows:
2016 2015
Commitments to extend credit $ 13,829,940 $ 14,558,696Standby letters of credit 1,290,700 777,950
$ 15,120,640 $ 15,336,646
Commitments to extend credit are agreements to lend to a customer as long as there is no violation of any condition established in the contract. Since many of the commitments are expected to expire without being drawn upon, the total commitment amounts do not necessarily represent future cash requirements. The Bank evaluates each customer’s credit worthiness on a case-by-case basis. The amount of collateral obtained, if deemed necessary by the Bank upon extension of credit, is based on management’s credit evaluation of the party. Collateral held varies, but may include accounts receivable, crops, livestock, inventory, property and equipment, residential real estate and income-producing commercial properties.
Standby letters of credit are conditional commitments issued by the Bank to guarantee the performance of a customer to a third party. Those guarantees are primarily issued to support public and private borrowing arrangements. The credit risk involved in issuing letters of credit is essentially the same as that involved in extending loan facilities to customers. Collateral held varies as specified above and is required in instances which the Bank deems necessary.
Significant concentrations of credit risk:
All of the Bank’s loans, commitments to extend credit, and standby letters of credit have been granted to customers in the Bank’s market area. The distribution of commitments to extend credit approximates the distribution of loans outstanding. Standby letters of credit were granted primarily to commercial borrowers.
The Bank as a matter of policy does not routinely extend credit to any single borrower or group of related borrowers in excess of $3,000,000. Any extension of credit in excess of $3,000,000 up to the legal lending limit of the Bank must be expressly approved by the Board of Directors. The legal lending limit as of December 31, 2016 is approximately $7 million. Although the Bank has a diversified loan portfolio, loans are concentrated mainly in the Lee, Scott, and Wise County region with a concentration in residential and nonresidential rental properties and the heavy construction and mining industries.
Legal contingencies:
The Company from time to time is party to various legal actions normally associated with its bank subsidiary. In the opinion of management and counsel, liabilities, if any, arising from such proceedings presently pending would not have a material adverse effect on the consolidated financial positions or results of operations of the Company.
Note 14. FAIR VALUE DISCLOSURES
Determination of fair value:
The Company uses fair value measurements to record fair value adjustments to certain assets and liabilities and to determine fair value disclosures. In accordance with the Fair Value Measurements and Disclosures topic of FASB ASC 820, the fair value of a financial instrument is the price that would be received to sell an asset or paid to transfer a liability in an orderly transaction between market participants at the measurement date. Fair value is best determined based upon quoted market prices. However, in many instances, there are no quoted market prices for the Company’s various financial instruments. In cases where quoted market prices are not available, fair values are based on estimates using present value techniques or other valuation models or processes that use primarily market-based or independently-sourced market data, including interest rate yield curves, option volatilities and third party information.

12 37Powell Valley National Bank • 2016 Annual Report Powell Valley National Bank • 2016 Annual Report
CASH FLOWS FROM OPERATING ACTIVITIES:2016 2015
Net income $ 2,915,505 $ 2,711,368Adjustments to reconcile net income to netcash provided by operating activities:
Provision for loan losses 225,000 100,000Depreciation 346,201 341,986Write-down of foreclosed assets 16,950 25,020(Gain) loss on sale of foreclosured assets (36,720) 91,622Net amortization of securities 52,373 83,645Realized gain on available-for-sale securities, net (417,702) (193,630)Deferred income tax (benefit) expense 277,545 (9,091)Bank owned life insurance income (115,641) (113,712)Net change in:
Accrued income tax receivable (107,476) (62,012)Accrued interest receivable (51,283) 7,635Other assets 111,404 59,150Other liabilities 134,253 (262,886)
Net cash provided by operating activities 3,350,409 2,779,095
CASH FLOWS FROM INVESTING ACTIVITIES:Activity in available-for-sale securities:
Maturities, prepayments and calls 13,919,067 13,498,935Purchases (19,560,924) (20,675,607)Sales 9,557,557 8,915,191
Net change in interest-bearing time deposits in banks (495,000) (1,450,000)Loan originations and principal collections, net (8,023,760) (9,046,823)Acquisitions of foreclosed assets (300,000) (450,040)Proceeds from sales of foreclosed assets 354,050 268,910Additions to premises and equipment (200,994) (306,662)Purchase of Federal Home Loan bank stock (2,100) (19,900)
Net cash used by investing activities (4,752,104) (9,265,996)
CASH FLOWS FROM FINANCIAL ACTIVITIES:Net increase in deposits 3,133,547 1,167,627Purchase of treasury shares of Powell Valley Bankshares, Inc. - (525,066)Cash dividends paid on common stock (1,028,752) (933,873)
net cash provided (used in) by financing activities 2,104,795 (291,312)
Note 14. FAIR VALUE DISCLOSURES (COnTInUED)
In accordance with this guidance, the Company groups its financial assets and financial liabilities generally measured at fair value in three levels, based on the markets in which the assets and liabilities are traded and the reliability of the assumptions used to determine fair value.
• Level 1 – Valuation is based on quoted prices in active markets for identical assets or liabilities that the Company has the ability to access at the measurement date. Level 1 assets and liabilities generally include debt and equity securities that are traded in an active exchange market. Valuations are obtained from readily available pricing sources for market transactions involving identical assets or liabilities.
• Level 2 – Valuation is based on inputs other than quoted prices included within Level 1 that are observable for the asset or liability, either directly or indirectly. The valuation may be based on quoted prices for similar assets or liabilities; quoted prices in markets that are not active; or other inputs that are observable or can be corroborated by observable market data for substantially the full term of the asset or liability.
• Level 3 – Valuation is based on unobservable inputs that are supported by little or no market activity and that are significant to the fair value of the assets or liabilities. Level 3 assets and liabilities include financial instruments whose value is determined using pricing models, discounted cash flow methodologies, or similar techniques, as well as instruments for which determination of fair value requires significant management judgment or estimation.
Assets and liabilities measured at fair value on a recurring basis as of December 31 are as follows:
Fair Value Measurement atReporting Date Using
December 31,2016 Fair Value
Prices in Active
Markets for Identical Assets
(Level 1)
Significant Other
ObservableInputs
(Level 2)
SignificantOther
UnobservableInputs
(Level 3)Available-for-sale securities:
U.S. Government agenciesand corporations $ 5,190,115 $ - $ 5,190,115 $ -State and Political Subdivisions 40,912,993 - 40,912,993 -Mortgage-backed securitites 12,186,313 - 12,186,313 -Miscellaneous 3,817,788 - 3,817,788 -
Total debt securities 62,107,209 - 62,107,209 -
Equity securities 449,928 - 449,928 -
Total securities available-for-sale $ 62,557,137 - $ 62,557,137 $ -
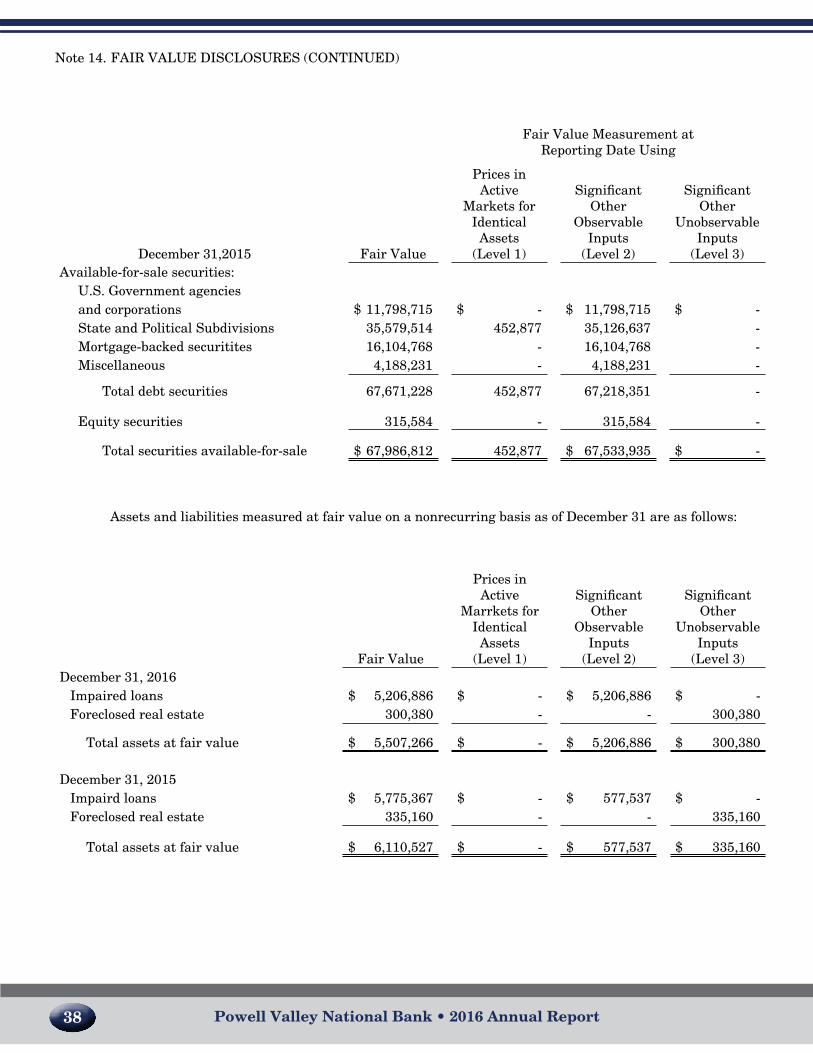
38 11Powell Valley National Bank • 2016 Annual Report Powell Valley National Bank • 2016 Annual Report
CO
NS
OL
IDA
TE
D S
TA
TE
ME
NT
S O
F C
HA
NG
ES
IN S
TO
CK
HO
LD
ER
S’ E
QU
ITY
Yea
rs En
ded
Decem
ber 31, 2016 a
nd
2015
Co
mm
on
Sto
ckS
urp
lus
Reta
ined
E
arn
ing
s
Accu
mu
lated
Oth
erC
om
preh
ensiv
e In
com
e (Lo
ss)T
ota
l
Balan
ce, Decem
ber 31, 2014$
661,135
$
661,135$
41,733,231
$
830,423$
43,885,924
Net in
come
--
2,711,368-
2,711,368
Oth
er compreh
ensive in
come, n
et of tax-
--
(109,872)(109,872)
Pu
rchase of 7,959 T
reasury sh
ares of Pow
ell Valley
Ban
kshares, In
c.(7,959)
(7,959)(509,148)
-(525,066)
Cash
dividends declared ($1.25 per com
mon
share)
--
(933,873)-
(933,873)
Balan
ce, Decem
ber 31, 2015653,176
653,17643,001,578
720,55145,028,481
Net in
come
--
2,915,505-
2,915,505
Oth
er compreh
ensive in
come, n
et of tax-
--
(1,240,341)(1,240,341)
Cash
dividends declared ($1.43 per com
mon
share)
--
(1,028,752)-
(1,028,752)
Ba
lan
ce, Decem
ber 31, 2016
$
653,176$ 653,176
$
44,888,331$
(519,790)
$
45,674,893
Fair Value Measurement atReporting Date Using
December 31,2015 Fair Value
Prices in Active
Markets for Identical Assets
(Level 1)
Significant Other
ObservableInputs
(Level 2)
SignificantOther
UnobservableInputs
(Level 3)Available-for-sale securities:
U.S. Government agenciesand corporations $ 11,798,715 $ - $ 11,798,715 $ -State and Political Subdivisions 35,579,514 452,877 35,126,637 -Mortgage-backed securitites 16,104,768 - 16,104,768 -Miscellaneous 4,188,231 - 4,188,231 -
Total debt securities 67,671,228 452,877 67,218,351 -
Equity securities 315,584 - 315,584 -
Total securities available-for-sale $ 67,986,812 452,877 $ 67,533,935 $ -
Note 14. FAIR VALUE DISCLOSURES (COnTInUED)
Assets and liabilities measured at fair value on a nonrecurring basis as of December 31 are as follows:
Fair Value
Prices inActive
Marrkets for Identical Assets
(Level 1)
SignificantOther
ObservableInputs
(Level 2)
SignificantOther
UnobservableInputs
(Level 3)December 31, 2016
Impaired loans $ 5,206,886 $ - $ 5,206,886 $ -Foreclosed real estate 300,380 - - 300,380
Total assets at fair value $ 5,507,266 $ - $ 5,206,886 $ 300,380
December 31, 2015Impaird loans $ 5,775,367 $ - $ 577,537 $ -Foreclosed real estate 335,160 - - 335,160
Total assets at fair value $ 6,110,527 $ - $ 577,537 $ 335,160
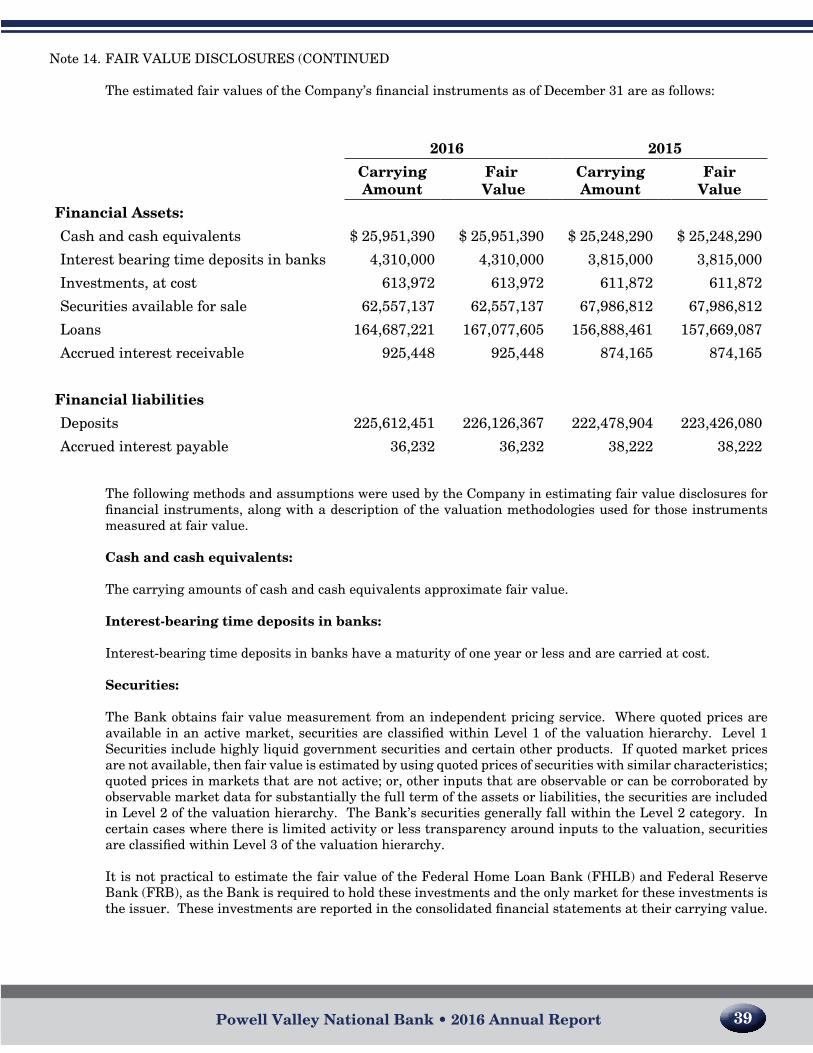
10 39Powell Valley National Bank • 2016 Annual Report Powell Valley National Bank • 2016 Annual Report
nET InCOME 2016 2015Net Income $ 2,915,505 $ 2,711,368
EARNINGS PER COMMON SHARENet income per common share $ 4.46 $ 4.13
nET InCOME $ 2,915,505 $2,711,368
OTHER COMPREHENSIVE INCOME (LOSS), BEFORE TAx:Unrealized holding gains (losses) arising during the year for securities available-for-sale
(1,461,602) 27,157
Less: Reclassification adjustment for gains included in net gains on sale of securities in net income
(417,702) (193,630)
OTHER COMPREHENSIVE INCOME (LOSS), BEFORE TAx (1,879,304) (166,473)
INCOME TAx BENEFIT (ExPENSE) RELATED TO ITEMSOF OTHER COMpREHEnSIVE InCOME 638,963 56,601
OTHER COMPREHENSIVE INCOME (LOSS), NET OF TAx (1,240,431) (109,872)
COMpREHEnSIVE InCOME $ 1,675,164 $ 2,601,496
Note 14. FAIR VALUE DISCLOSURES (COnTInUED
The estimated fair values of the Company’s financial instruments as of December 31 are as follows:
The following methods and assumptions were used by the Company in estimating fair value disclosures for financial instruments, along with a description of the valuation methodologies used for those instruments measured at fair value.
Cash and cash equivalents:
The carrying amounts of cash and cash equivalents approximate fair value.
Interest-bearing time deposits in banks:
Interest-bearing time deposits in banks have a maturity of one year or less and are carried at cost.
Securities:
The Bank obtains fair value measurement from an independent pricing service. Where quoted prices are available in an active market, securities are classified within Level 1 of the valuation hierarchy. Level 1 Securities include highly liquid government securities and certain other products. If quoted market prices are not available, then fair value is estimated by using quoted prices of securities with similar characteristics; quoted prices in markets that are not active; or, other inputs that are observable or can be corroborated by observable market data for substantially the full term of the assets or liabilities, the securities are included in Level 2 of the valuation hierarchy. The Bank’s securities generally fall within the Level 2 category. In certain cases where there is limited activity or less transparency around inputs to the valuation, securities are classified within Level 3 of the valuation hierarchy.
It is not practical to estimate the fair value of the Federal Home Loan Bank (FHLB) and Federal Reserve Bank (FRB), as the Bank is required to hold these investments and the only market for these investments is the issuer. These investments are reported in the consolidated financial statements at their carrying value.
2016 2015
Carrying Amount
Fair Value
Carrying Amount
Fair Value
Financial Assets:
Cash and cash equivalents $ 25,951,390 $ 25,951,390 $ 25,248,290 $ 25,248,290
Interest bearing time deposits in banks 4,310,000 4,310,000 3,815,000 3,815,000
Investments, at cost 613,972 613,972 611,872 611,872
Securities available for sale 62,557,137 62,557,137 67,986,812 67,986,812
Loans 164,687,221 167,077,605 156,888,461 157,669,087
Accrued interest receivable 925,448 925,448 874,165 874,165
Financial liabilities
Deposits 225,612,451 226,126,367 222,478,904 223,426,080
Accrued interest payable 36,232 36,232 38,222 38,222

40 9Powell Valley National Bank • 2016 Annual Report Powell Valley National Bank • 2016 Annual Report
STOCKHOLDERS’ EQUITY 2016 2015Common stock, $1 par value; 2,000,000 shares authorized;
653,176 (2016) and 653,176 (2015) shares issued andoutstanding, net of 146,824 (2016) and 146,824 (2015)treasury shares at par, respectively 653,176 653,176
Surplus 653,176 653,176Retained earnings 44,888,331 43,001,578Accumulated other comprehensive income (loss):
net unrealized gain (loss) on securities (519,790) 720,551Total Stockholders’ Equity 45,674,893 45,028,481Total Liabilities and Stockholders’ Equity $273,884,471 $269,970,259
InTEREST InCOME 2016 2015Interest and fees on loans $ 9,000,254 $ 8,887,217Interest on investment securities:
U.S. Treasury 272,750 245,129U.S. government agencies 480,064 670,650States and political subdivisions 738,482 695,318Other 113,598 81,346
Total interest income 10,605,148 10,579,660
InTEREST ExpEnSE 2016 2015Interest on deposits 527,049 673,344
Net interest income 10,033,099 9,906,316Provision for loan losses 225,000 100,000
Net interest income after provision for loan losses 9,808,099 9,806,316
nOnInTEREST InCOME 2016 2015Service chareges on deposit accounts 437,680 422,360Other customer service fees 453,427 432,977Net gains on sale of available-for-sale securities 417,702 193,630Net other-than-temporary impairment losses on investmentsrecognized in earnings - -Bank-owned life insurance income 115,642 113,357Other income 253,772 238,464
Total noninterest income 1,678,223 1,400,788
nOnInTEREST ExpEnSES 2016 2015Salaries and wages 3,183,196 3,193,599Pensions and other employee benefits 885,047 859,916Advertising and public relations 165,855 129,619Occupancy expenses 490,066 509,996Equipment rentals, depreciation and maintenance 386,559 407,607Director and committee fees 165,000 159,000Correspondent bank services 438,314 414,289Legal and professional 191,431 191,643Stationary and supplies 195,322 229,489Real estate and franchise tax 451,071 445,470Other operating expenses 927,913 959,612
Total noninterest expenses 7,479,774 7,500,240
INCOME BEFORE INCOME TAxES 2016 2015Income Before Income Taxes 4,006,548 3,706,864Income tax provision 1,091,043 995,486
Note 14. FAIR VALUE DISCLOSURES (COnTInUED)
Impaired loans:
The Company does not record loans at fair value on a recurring basis. However, from time to time, a loan is considered impaired and an allowance for loan losses is established. Loans for which it is probable that payment of interest and principal will not be made in accordance with the contractual terms of the loan agreement are considered impaired. Once a loan is identified as individually impaired, its fair value is estimated using several methods including collateral value, observable market value, and discounted cash flows.
As of December 31, 2016, substantially all of the total impaired loans were evaluated (or impaired loans were primarily evaluated) based on the fair value of collateral. Impaired loans where an allowance is established based on the fair value of collateral require classification in the fair value hierarchy. When the fair value of the collateral is based on the observable market price or a current appraised value, the Company records the impaired loan as nonrecurring Level 2. When an appraised value is not available or management determines the fair value of the collateral is further impaired below the appraised value and there is no observable market price, the Bank records the impaired loan as nonrecurring Level 3.
Other assets:
Included in other assets are certain assets carried at fair value, including foreclosed properties. The carrying amount of foreclosed properties is based on information obtained from an independent appraiser with further adjustment based on management evaluation of estimated selling cost and other factors. The Bank reflects these assets within Level 3 of the hierarchy.
Deposit liabilities:
The fair values disclosed for demand deposits (e.g., interest and non-interest checking, passbook savings, and certain types of money market accounts) are, by definition, equal to the amount payable on demand at the reporting date (i.e., their carrying amounts). The carrying amounts of variable-rate, fixed-term money market accounts approximate their fair values at the reporting date. Fair values for fixed-rate certificates of deposit are estimated using a discounted cash flow calculation that applies interest rates currently being offered on certificates to a schedule of aggregated expected monthly maturities on time deposits.
Short-term borrowings:
The carrying amounts of federal funds purchased, borrowings under repurchase agreements, and other short-term borrowings maturing within ninety days approximate their fair values. Fair values of other short-term borrowings with fixed rates are estimated using discounted cash flow analyses based on the Bank’s current incremental borrowing rates for similar types of borrowing arrangements.
Accrued interest:
The carrying amounts of accrued interest approximate fair value.
Note 15. TRANSACTIONS WITH RELATED PARTIES
The Bank has had, and may be expected to have in the future, banking transactions in the ordinary course of business with directors, executive officers, their immediate families and affiliated companies in which they are principal stockholders (commonly referred to as related parties), all of which have been, in the opinion of management, on the same terms, including interest rates and collateral, as those prevailing at the time for comparable transactions with others.
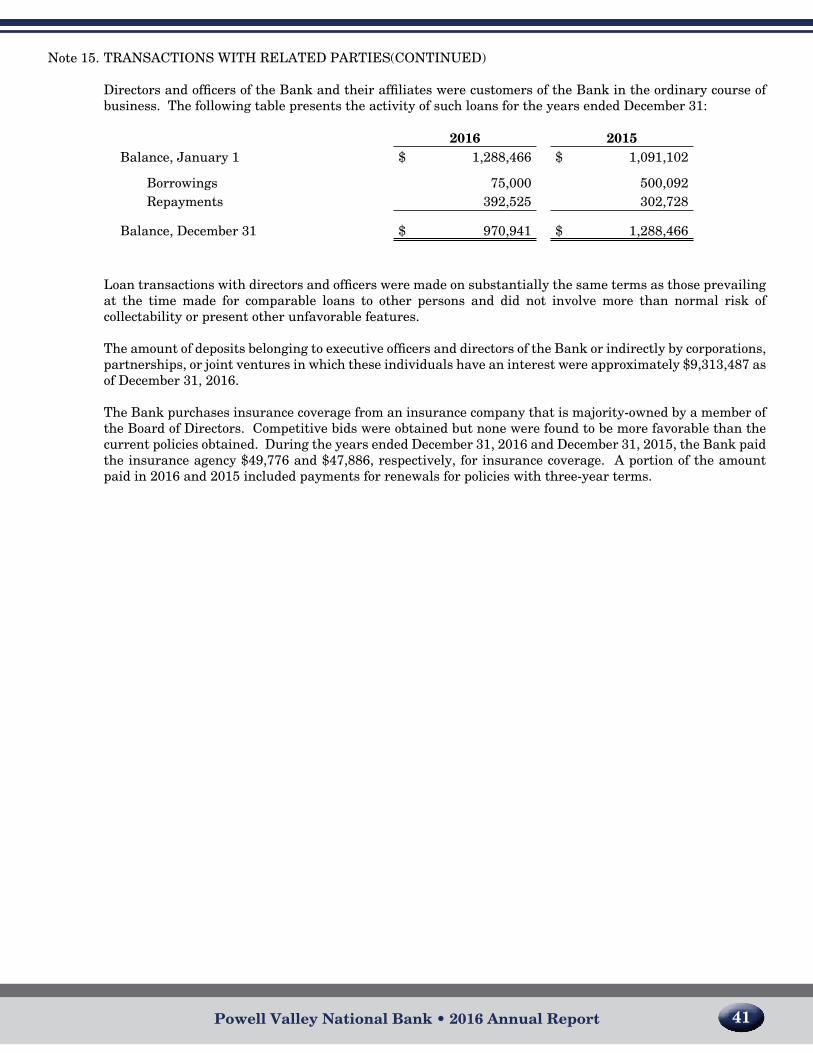
CONSOLIDATED STATEMENTS OF CONDITIONDecember 31, 2016 and 2015
ASSETS 2016 2015
Cash and cash equivalents $ 25,951,390 $ 25,248,290
Interest bearing time deposits in banks 4,310,000 3,815,000
Investment securities:
Available for sale 62,557,137 67,986,812
Investments, at cost 613,972 611,872
Loans, net 164,687,221 156,888,461
Foreclosed assets 300,880 335,160
Premises and equipment, net 5,713,928 5,859,135
Accrued interest receivable 925,448 874,165
Accrued income tax receivable 184,189 76,722
Deferred income tax benefit 1,710,866 1,349,448
Goodwill 865,410 865,410
Bank owned life insurance 4,344,382 4,228,741
Other assets 1,719,639 1,831,043
Total Assests $273,884,471 $269,970,259
LIABILITIES AND STOCKHODERS’ EQUITY l
LIABILITIES 2016 2015
Deposits:
Noninterest bearing demand $ 77,112,807 $ 68,944,851
Interest bearing demand 26,912,846 23,848,173
Savings 50,517,277 52,800,933
Time deposits 71,069,521 76,884,947
Total Deposits 225,612,451 222,478,904
Accrued interest and other liabilities 2,597,127 2,462,874
Total Liablities 228,209,578 224,941,778
8 41Powell Valley National Bank • 2016 Annual Report Powell Valley National Bank • 2016 Annual Report
Note 15. TRAnSACTIOnS WITH RELATED PARTIES(COnTInUED)
Directors and officers of the Bank and their affiliates were customers of the Bank in the ordinary course of business. The following table presents the activity of such loans for the years ended December 31:
Loan transactions with directors and officers were made on substantially the same terms as those prevailing at the time made for comparable loans to other persons and did not involve more than normal risk of collectability or present other unfavorable features.
The amount of deposits belonging to executive officers and directors of the Bank or indirectly by corporations, partnerships, or joint ventures in which these individuals have an interest were approximately $9,313,487 as of December 31, 2016.
The Bank purchases insurance coverage from an insurance company that is majority-owned by a member of the Board of Directors. Competitive bids were obtained but none were found to be more favorable than the current policies obtained. During the years ended December 31, 2016 and December 31, 2015, the Bank paid the insurance agency $49,776 and $47,886, respectively, for insurance coverage. A portion of the amount paid in 2016 and 2015 included payments for renewals for policies with three-year terms.
2016 2015Balance, January 1 $ 1,288,466 $ 1,091,102
Borrowings 75,000 500,092Repayments 392,525 302,728
Balance, December 31 $ 970,941 $ 1,288,466

42 7Powell Valley National Bank • 2016 Annual Report Powell Valley National Bank • 2016 Annual Report
INDEPENDENT AUDITOR’S REPORT
To the Stockholders and Board of DirectorsPowell Valley Bankshares, Inc. and SubsidiariesJonesville, Virginia
We have audited the accompanying consolidated financial statements of Powell Valley Bankshares, Inc. and Subsidiaries, which comprise the consolidated statements of condition as of December 31, 2016 and 2015, and the related consolidated statements of income, comprehensive income, changes in stockholders’ equity, and cash flows for the years then ended, and the related notes to the consolidated financial statements.
Management’s Responsibility for the Financial Statements
Management is responsible for the preparation and fair presentation of these consolidated financial statements in accordance with accounting principles generally accepted in the United States of America; this includes the design, implementation, and maintenance of internal control relevant to the preparation and fair presentation of consolidated financial statements that are free from material misstatement, whether due to fraud or error.
Auditor’s Responsibility
Our responsibility is to express an opinion on these consolidated financial statements based on our audits. We conducted our audits in accordance with auditing standards generally accepted in the United States of America. Those standards require that we plan and perform the audit to obtain reasonable assurance about whether the consolidated financial statements are free of material misstatement.
An audit involves performing procedures to obtain audit evidence about the amounts and disclosures in the consolidated financial statements. The procedures selected depend on the auditor’s judgment, including the assessment of the risks of material misstatement of the consolidated financial statements, whether due to fraud or error. In making those risk assessments, the auditor considers internal control relevant to the entity’s preparation and fair presentation of the consolidated financial statements in order to design audit procedures that are appropriate in the circumstances, but not for the purpose of expressing an opinion on the effectiveness of the entity’s internal control. Accordingly, we express no such opinion. An audit also includes evaluating the appropriateness of accounting policies used and the reasonableness of significant accounting estimates made by management, as well as evaluating the overall presentation of the consolidated financial statements.
We believe that the audit evidence we have obtained is sufficient and appropriate to provide a basis for our audit opinion. Opinion
In our opinion, the consolidated financial statements referred to above present fairly, in all material respects, the financial position of Powell Valley Bankshares, Inc. and Subsidiaries as of December 31, 2016 and 2015, and the results of their operations and their cash flows for the years then ended in accordance with accounting principles generally accepted in the United States of America.
Kingsport, TennesseeFebruary 27, 2017 Certified Public Accountants
PVNB FINANCIAL PERFORMANCE RECOGNIZED
In 2016 Powell Valley National Bank (PVNB) was recognized by two nationally renowned risk management organizations for its outstanding financial performance. Seifried & Brew LLC (S&B), a community bank risk management firm named PVNB as a S&B 5 Gold Bar Institution. This designation is earned by banks which rank in the top 15th Percentile of Community Bank Performance thru out the United States. To gain entry into this distinguished ranking, the Bank demonstrated exemplary performance of balancing risk and reward based on the Bank’s S&B Total Risk/Return Composite Ranking. This is no small feat considering that the Bank not only survived the Financial Crisis but actually thrived. This supports Seifried & Brew’s belief that conservative, traditional community banking is the strength of our financial system.
Bauer Financial, Inc. (Bauer) has recognized Powell Valley National Bank as a 5-Star Rated Institution. Bauer has been reporting on the financial condition of the banking industry since 1983. Bauer collects and analyzes financial reports filed by all banks to their federal regulators. The data is then subjected to a comprehensive analysis. A star-rating is assigned upon completion, with five stars (PVNB’s ranking) being the highest possible rating for bank performance.
across

6 43Powell Valley National Bank • 2016 Annual Report Powell Valley National Bank • 2016 Annual Report
Supporting Our Bank Family and Local CommunitiesA Tradition Since 1888
ToTal loans - Millions of Dollars170160150140130120110100
9080
132.0 144.3 147.9156.9 164.7
2012 2013 2014 2015 2016
CapiTal - Millions of Dollars5045403530252010
50
40.2 40.3 43.9 45.0 45.7
2012 2013 2014 2015 2016
neT inCoMe - THousanDs of Dollars
3,5003,0002,5002,0001,5001,000
5000
2,256
2012 2013 2014 2015 2016
2,414 3,128 2,711 2,916
Every fall our offices show their school spirit for our local high school teams by setting up tailgates on Friday night under the lights. Doug McDonald and Vickie Bishop show their support for the Rye Cove High School Eagles.
Buford Ervin and Veteran Kenny Fannon pose for a picture during our Veteran’s Day celebration at our Duffield Office.
Chairman George Cridlin and Board Member Eddie Woodward preparing for the annual meeting.
Shareholder and retiree, Barlow Newman, enjoying the refreshments and fellowship during our annual meeting.

Powell Valley National Bank • 2016 Annual Report Powell Valley National Bank • 2016 Annual Report44 5
ToTal DeposiTs - Millions of Dollars230225220215210205200195190185
207 202.1 221.3 222.5 225.6
2012 2013 2014 2015 2016
FINANCIAL HIGHLIGHTSFIVE YEAR SUMMARY
(In Thousands of Dollars)
2016 2015 2014 2013 2012
Net Earnings After Taxes 2,916 2,711 3,128 2,414 2,256
Total Deposits 225,612 222,479 221,311 202,132 206,975
Loans, Net 164,687 156,888 147,942 144,280 132,024
Securities, including assets 63,171 68,599 70,374 62,427 57,100
Held in trading accounts And other investmentsTotal Assets* 273,884 269,970 267,923 245,844 250,891
Capital 45,675 45,028 43,886 40,280 40,210
ToTal asseTs - Millions of Dollars275270265260255250245240235230225220
2012 2013 2014 2015 20162007 2008 2009 2010 2011
270.0267.9245.8250.9240.7235.0240.0225.2229.3 273.9
Jonesville employees Jeff Woodard, Alysha Elkins, Sandy Newman, Susan Barber, and Sarah Moore pose for a quick picture after loading up the truck during our annual Bank Clean-Up Day.
Our Big Stone Gap office employees participated in the Union High School “pink out” game and showed their support for breast cancer and the Union Bears.

4 45Powell Valley National Bank • 2016 Annual Report Powell Valley National Bank • 2016 Annual Report
We are hopeful that these trends will continue; however, as a Company that has survived 31 recessions and a great depression in our 129 years of service, we will hold on to our Appalachian roots of prudence, self-reliance and commitment to our community and neighbors. This is our tradition and our future!
George F. Cridlin,Chairman of the Board
Lloyd C. Martin, Jr.President and Secretary of Corporation
Leton HardingExecutive Vice President and CEO
Amy Mellinger, Larry Presley, Lori Hilton, Leton Harding, and Karen Cridlin enjoying our annual meeting.
We had a great time welcoming the incoming freshmen of the LMU Vet School during our August picnic. Pictured above are Lee Houston, Browning Wynn, George Cridlin, and Cory Dotson.

Powell Valley National Bank • 2016 Annual Report Powell Valley National Bank • 2016 Annual Report46 3
To Our Shareholders,The year 2016 will likely go down as one of the greatest transition years in our Bank’s 129-year history. I will expand upon that a little later in this letter to you.
We ended 2016 with earnings of $2.91 million, up from earnings of $2.71 million in 2015. As you will read in the following pages, net loans grew almost $8 million dollars to $164.7 million, up from $156.8 million. This trend continues our positive loan growth over the past five (5) years in a very competitive market. I attribute this success to a can-do attitude that starts at the top with our Board, Loan Committee, Loan Officers and Loan Staff proactively finding ways to make loans while protecting the Bank with strong credit underwriting.
Our investment portfolio, and related assets, played a significant role in the positive earnings growth for the year. Larry Presley, EVP of our Bank and our Asset Liability Committee (ALCO), spend countless hours discussing and implementing long term strategies that benefit the company and enable us to be productive in the type of economy cycle we have experienced since 2008.
This year we made the hardware and software transition to the Fiserv Data Center in Norcross, GA. I cannot stress the work and commitment that our staff put in to this conversion and the extra work we undertook evaluating and updating data systems during this move. We are now, in my opinion, in the best operational position possible with the reliability of a data center and the subsequent freeing of our Operations staff to focus on the needs of our customers.
We added MobiMoney in 2016. This service allows our customers to control their own debit cards. Among the capabilities of this software is allowing the customer to decide where the card can be used, turn their card off or on and the extra benefit of allowing customers to see their balances, receive alerts and transfer funds. Just like houses have multiple doors to get in and out, we now provide our customers multiple ways to keep up with their accounts including the following: Online and Mobile Banking, Event Alerts, and now MobiMoney. I can honestly say that your Company can compete with any financial entity when it comes to 21st Century Banking.
Your Board made a decision last year to expand our market footprint. We have hired Sam Neese, former CEO of Highlands Union Bank in Abingdon, Virginia to open a loan production office with the intent of opening a full-service location in Abingdon as soon as possible. Retaining a person of Sam’s experience, market background, and philosophical approach to community banking sends a strong message to the region and other bankers that your company is a great place to work, and have a successful career and future. Joining Sam in Abingdon will be Matthew Eades, Vice President and Business Development Officer, Jim Swartz, Vice President and Loan Review Officer, and Dawn Yarber, Loan Administration.
During the year we had one (1) very valuable and respected employee retire, Peggy Wilder, who dedicated over 37 years of service to your bank in the Jonesville office.
Your Bank hired several new employees during the year. In Wise, we welcomed Haley Fields and Lauren Turner, Tellers, and Tiffany Collier, Director of Training. In Jonesville, we hired Kalli Marcum, Part-Time Teller, and Gina Cothron was hired as Teller in the Big Stone Gap Office. Buford Ervin joined us as part-time Business Development Officer in the Duffield Office and we welcomed Karen Wright, Auditor, to the Bank.
As we enter 2017, there appears to be light at the end of the economy tunnel we have been stuck in since 2008. Interest rates are moving in the direction of historic norms. Serious discussions are occurring about regulatory relief. There are also prospects for tax reform.
Santa made an early stop in Jonesville for Customer Appreciation Day. Leton and his grandson, Jeremiah, take a few minutes to visit with Santa.
Julia Napier’s daughter Eva wasn’t so sure about Santa. Eva enjoys Santa’s visit to the Jonesville office from a distance.

2 47Powell Valley National Bank • 2016 Annual Report Powell Valley National Bank • 2016 Annual Report
George CridlinChairman of the Board
Lloyd C. Martin, Jr.President and Secretary
of Corporation
Leton HardingExecutive Vice
President and CEO
Board of Directors - from left to right: George Cridlin, Browning Wynn, Lloyd C. Martin, Jr., Winston Witt, Eddie Woodward and Robert Estes. Not pictured is Leton Harding.
In celebration of the National Parks 100th Anniversary, the U.S. Mint released a special coin honoring the Cumberland Gap National Historic Park. Pennington Gap employees joined in on the festivities with their annual Customer Appreciation Day and supported 100 years of the National Parks by dressing up from the early 1900s time period.
Cumberland Gap National Park Board Member and Photographer Harold Jerrell spent the day in our Pennington Gap and Jonesville offices. Pictured above are Leton Harding, Harold Jerrell, and Charlie Allen.

Robert EstesBrowning Wynn, IILeton L. Harding, Jr.
George F. CridlinLloyd C. Martin, Jr.Roy E. Woodward, Jr.F. Winston Witt
DIRECTORS
Mission Statement The bank’s major business objective is to continue growing as a community based company through internal growth while providing superior service to our customer base, professional opportunities for it’s employees and maximizing long term shareholder value.
48 1Powell Valley National Bank • 2016 Annual Report Powell Valley National Bank • 2016 Annual Report
ADVISORY BOARD
Roger AudiaBruce Robinette
OFFICERS
George F. Cridlin ....................................................................................................................................................ChairmanLloyd C. Martin, Jr ...................................................................................................President & Secretary of CorporationLeton Harding ................................................................................................................. Executive Vice President & CEOLarry K. Presley ..................................................................................... Executive Vice President & Loan Administrator Robert Horton ................................................................... Senior Vice President / Compliance Officer & Training Officer Charles L. Allen .................................................. Senior Vice President/ Manager - Pennington Office & CRA Officer Gary Richardson ...................................................................... Senior Vice President & Manager - Big Stone Gap OfficeCarol W. Hayes ...................................................................................... Senior Vice President & Manager - Wise OfficeLee Houston ................................................................................... Senior Vice President and Commercial Loan OfficerBrowning Wynn, II .............................................................................................................................Senior Vice PresidentChris Suggs ........................................................................................................................................Vice President & CFOSusan Barber .......................................................................................................... Vice President & Director of PersonnelDouglas McDonald ...........................................................................................Vice President & Manager - Duffield OfficeMike Sprinkle .................................................................................................................Vice President - Loan DepartmentJeff Woodard .................................................................................. Vice President-Security Officer & Privacy Manager Cory Dotson ............................................................................................................Vice President - Business DevelopmentMary Beth Baker .................................................................................... Vice President & Retail Lending AdministratorPaula Lawson ..................................................................................................................................................Vice PresidentLori Hilton ..................................................................................................................................................................AuditorKaren Wright .............................................................................................................................................................AuditorRoss Hawkins ...................................................................................................... Vice President - Collections DepartmentJason Laster ...................................................................................................................................Assistant Vice PresidentLinda Thomas ...............................................................................................................................Assistant Vice PresidentCliff Ely .......................................................................................................................................... Assistant Vice PresidentDeborah Bonham ..........................................................................................................................Assistant Vice President Marsha Nickodam ..........................................................................................................................Assistant Vice President Buford Ervin ..........................................................................................................................Business Development OfficerAmy Mellinger ................................................................................................................................... Retail Banking OfficerTiffany Collier ................................................................................................................................... Retail Banking Officer
Allen Poole .......................................................................... Investment Executive for Powell Valley Investment Services
STAFFJonesville
Tami BurganBetty Jo CarterAngela CombsAlysha ElkinsMargaret Elkins
Mary Ann FannonSharon HarberAmanda HuffHoward JonesTammy Large
Autumn LogsdonKalli MarcumRachel MarshallSarah MooreJudy Mullins
Julia NapierSandra Newman Debra QuallsNorma RobbinsCrissie Robinson
Pennington GapLisa Bailey Buffy BurganLisa Christie Sharon GarrettNorma GraceAshley HammondsTeresa KellyBrittney Nelson
WiseNancy CantrellCassie DotsonAngie FarmerHaley FieldsMelody LovellPat RayLauren Turner
Big Stone GapBarbara BowmanJanis CollinsGina CothronJessica DanielsSue HuffCandice LaneMary Oakes
DuffieldKathy ArwoodVickie BishopCourtney LawsonKellie PageCindy Tipton
KingsportMargaret Hensley

POWELL VALLEy NAtiONAL BANk
powellvalleybank.com