2016-06-21 philippines in the electronics & electrical
TRANSCRIPT

The PhiliPPines i n t h e e l e c t r o n i c s &
e l e c t r i c a l g l o b a l V a l U e c h a i n
M a y 2 0 1 6

The Philippines in the Electronics & Electrical Global Value Chain
This research was prepared by the Duke University Center on Globalization, Governance and Competitiveness (Duke CGGC) on behalf of the USAID/Philippines, through the Science, Technology, Research and Innovation for Development (STRIDE) Program. This study is part of the Philippines Department of Trade and Industry (DTI) Board of Investment (BOI) Roadmap Initiative for the revitalization of the manufacturing industry in the Philippines. The report is based on both primary and secondary information sources. In addition to interviews with firms operating in the sector and supporting institutions, the report draws on secondary research and information sources. The project report is available at www.cggc.duke.edu. Acknowledgements Duke CGGC would like to thank all of the interviewees, who gave generously of their time and expertise, as well as Richard Umali of USAID Advancing Philippine Competitiveness (COMPETE) project for his extensive support and feedback on earlier drafts. The Duke University Center on Globalization, Governance & Competitiveness undertakes client-sponsored research that addresses economic and social development issues for governments, foundations and international organizations. We do this principally by utilizing the global value chain (GVC) framework, created by Founding Director Gary Gereffi, and supplemented by other analytical tools. As a university-based research center, we address clients’ real world questions with transparency and rigor. www.cggc.duke.edu Center on Globalization, Governance & Competitiveness, Duke University © May 2016

The Philippines in the Electronics & Electrical Global Value Chain FINAL DRAFT FOR REVIEW
May 2016
Prepared by Stacey Frederick and Gary Gereffi Center on Globalization, Governance & Competitiveness, Duke University Prepared for
USAID/Philippines
This study is made possible by the generous support of the American people through the United States Agency for International Development (USAID). The contents are the responsibility of Duke University Center on Globalization, Governance and Competitiveness and do not necessarily reflect the views of USAID or the United States Government.

The Philippines in the Electronics & Electrical Global Value Chain
ii
Table of Contents
Executive Summary ........................................................................................................................................... v 1. Introduction ................................................................................................................................................ 9 2. The Electronics and Electrical Equipment Global Value Chain ..................................................... 10
2.1. Mapping the Electronics and Electrical Equipment Global Value Chain ............................. 11 2.2. Global Trade in the Electronics and Electrical GVC .............................................................. 20 2.3. Lead Firms and Governance Structure of the E&E Equipment GVC ................................. 23 2.4. Standards and Institutions ............................................................................................................. 29 2.5. Human Capital and Workforce Development ........................................................................ 32 2.6. Upgrading Trajectories in the Electronics & Electrical Equipment GVC ........................... 34
3. Lessons from Other Countries ............................................................................................................ 37 3.1. Malaysia ............................................................................................................................................. 38 3.2. Vietnam ............................................................................................................................................. 41
4. The Philippines and the Electronics & Electrical Equipment Global Value Chain ..................... 42 4.1. The Development of the E&E Industry in the Philippines ..................................................... 43 4.2. Philippine Current Participation in the Electronics & Electrical Global Value Chain ..... 44 4.3. Human Capital ................................................................................................................................. 53 4.4. Evidence of Industry Upgrading ................................................................................................... 54 4.5. Analysis of Current Situation in the Philippines ...................................................................... 57 4.6. Opportunities for Upgrading ....................................................................................................... 59
5. References ................................................................................................................................................. 65 6. Appendix ................................................................................................................................................... 69 Tables Table E-1. Potential Upgrading Trajectories for the Philippines .......................................................... viii Table 1. End Market Segments, Values, RSP, EMS/ODM, and Exports, 2014 .................................. 16 Table 2. World E&E Exports by Value Chain Stage and Category, 2007-2014 ............................... 21 Table 3. Top 10 World Exporters of E&E Final Products/Subassemblies in 2014 .......................... 22 Table 4. Top 10 World E&E Component Exporters in 2014 .............................................................. 22 Table 5. Lead Firms and Tier 1 Suppliers Revenue by Market, 2014 ................................................. 24 Table 6. Top 15 Electronics Contract Manufacturers (EMS & ODM), 2014 ................................... 26 Table 7. Functional Categories of Electronics Companies with Country Examples ...................... 27 Table 8. Top 10 Semiconductor Firms by Revenue, 2010 & 2014 ..................................................... 28 Table 9. Global Electrical Equipment Companies, by Sector, by Revenue, 2014 ............................ 29 Table 10. Important Standards in the Electronics and Electrical GVC .............................................. 31 Table 11. Employee Profile for the Electronics and Electrical Value Chain ...................................... 33 Table 12. Types of Upgrading in the Electronics Value Chain ............................................................. 37 Table 13. Comparison of E&E Industry in ASEAN countries .............................................................. 37 Table 14. Structure of Malaysia's E&E Industry ....................................................................................... 38 Table 15. Evolution of Electronic & Electrical Firms in the Philippines ............................................. 44 Table 16. Major E&E Companies in the Philippines, by Sectors .......................................................... 46 Table 17. Philippines Electronic Component Exports by Subsector, 2007-2014 ............................ 49 Table 18. Philippines Top Export Destinations, Select Products, 2007-2014 .................................. 50 Table 19. PEZA Investments by Electronics & Electrical Firms, 1978-2015 (Sept) ......................... 55

The Philippines in the Electronics & Electrical Global Value Chain
iii
Table 20. The Philippines in the E&E GVC SWOT Analysis ................................................................ 57 Table 21. The Automotive E&E Cluster ................................................................................................... 62 Table A-1. Electronic Product Categories Definitions and Export Statistics, 2014 ........................ 69 Table A-2. Electrical Equipment Industry Definition, Market/Export Statistics, 2014 .................... 70 Table A-3. Electrical Final Products & Parts, Definition, Export Statistics, 2014 ............................ 71 Table A-4. Lead Firms and Tier 1 Suppliers Revenue by Market, 2014 ............................................ 72 Table A-5. World Passive Component Firms, Market Shares, 2008 .................................................. 74 Table A-6. Key Indicators of the E&E Industry in the Philippines ....................................................... 75 Figures Figure E-1. The Philippines in the Electronics & Electrical Global Value Chain ................................. vi Figure 1. Electronics and Electrical Global Value Chain ........................................................................ 11 Figure 2. Philippine Participation in the E&E Global Value Chain ....................................................... 45 Figure 3. Philippine E&E Exports, by Industry & Stage, 2007-2014 ..................................................... 48 Boxes Box 1. Building an Automotive E&E Cluster in the Philippines ........................................................... 62

The Philippines in the Electronics & Electrical Global Value Chain
iv
Acronyms
3C Computers, Communications and Consumer Electronics A&T Assembly & Testing B2B Business to Business CHED Commission on Higher Education, Philippines COGS Cost of Goods Sold E&E Electronics & Electrical EDA Electronic Design Automation EMS Electronic Manufacturing Services EU European Union FTA Free Trade Agreement GVC Global Value Chain HDD Hard Disk Drives HS Harmonized System IPD Integrated Passive Devices IT Information Technology IoT Internet of Things MNC Multinational Corporation NPD New Product Development ODM Original Design Manufacturer OEM Original Equipment Manufacturer PCB Printed Circuit Board PEZA Philippine Economic Zones Authority PLC Programmable Logic Control R&D Research and Development SEIPI Semiconductors and Electronics Industries in the Philippines, Inc. SMT Surface Mount Technique STEM Science, Technology, Engineering and Mathematics T&D Transmission & Distribution THT Through-Hole US United States
The Philippines in the Electronics & Electrical Global Value Chain
v
Executive Summary This report uses the Duke CGGC global value chain (GVC) framework to examine the role of the Philippines in the global electronics & electrical (E&E) industry and identify opportunities to upgrade. Electronics and electrical equipment have played an important role in the Philippine economy since the 1970s and form the foundation of the country’s export basket today. In 2014, these sectors accounted for 47% of total exports from the Philippines at US$28.8 billion, of which 41% was from electronics, and 6% from electrical products. From a global perspective, while the Philippines is not the leading exporter in any particular product category, it is known for its significant number of semiconductor assembly and test (A&T) facilities. The global economic crisis (2008-09), combined with the exit of Intel (2009), had a significant negative impact on electronics exports and, although steadily increasing, they have not yet rebounded to pre-crisis levels. Nonetheless, investment in the E&E industries has picked up since 2010; in the past five years, there have been 110 new investments in these sectors. Another positive sign is the low exit rate; with the exception of Intel, companies that have invested in the Philippines have stayed, with several operations dating back to the late 1970s and 1980s. These firms have not only stayed, but have continued to grow and expand in the country due to the quality of the workforce and satisfaction with the Philippine Economic Zone Authority (PEZA) environment. The growth of the industry has significantly benefited from foreign investment and close ties with Japanese firms. Global Electronics & Electrical Global Value Chain The electronics and electrical industry encompasses a broad range of component, intermediate, and final products that feed into a number of different end markets. World exports in 2014 were US$2.9 trillion of which electronic components were US$616 billion, electrical equipment was US$508 billion, final electronic products and specific parts was US$1.4 trillion, and final consumer appliances, equipment and specific parts was US$342 billion. • The number of products with electronic content is rapidly increasing due to
lower manufacturing costs and consumer demand for connectivity and data access and storage across all walks of life. This trend has gone hand in hand with the proliferation of handheld electronic devices (i.e., mobile phones, tablets, etc.) and the ability to store massive amounts of data ‘in the cloud’ (large data centers) rather than locally on the device. Electronic content is found in traditional products (computers, televisions, phones), which still make up the largest share of demand; however, fast growing markets include automobiles, industrial equipment, and medical devices.
• On the supply side, China/Hong Kong is the dominant exporter in all segments
of the chain. In 2014, China and Hong Kong accounted for 39% of overall E&E exports; up from 28% in 2007. Demand for final E&E products is also increasingly from Asia (particularly China), which is causing a slow shift towards more regional rather than global manufacturing networks.
• Three key sets of players exist in the value chain: lead firms, contract
manufacturers/Tier 1 suppliers, and component semiconductor suppliers. Lead firms are responsible for the marketing, branding, and final product research, design and product development. These firms work closely with key semiconductor firms in technical

The Philippines in the Electronics & Electrical Global Value Chain
vi
product development. Lead firms and semiconductor companies have headquarters in the main consuming markets (US, Europe, Japan), with an increasing number from emerging Asian countries, particularly South Korea, Singapore, Taiwan, and China. Lead firms often outsource production to contract manufacturers (referred to as electronic manufacturing service (EMS) providers), or in the case of non-electronic end markets (i.e. automotive, aerospace, medical devices), the lead firms work with Tier 1 supplier that are responsible for coordinating production of electronic subassemblies. Tier 1 suppliers either manufacture in-house or work with EMS providers.
Philippines in the Electronics & Electrical Global Value Chain In 2014, the Philippines exported US$29 billion in E&E related products; of this total, 87% was electronic and 13% was electrical. Electronic and electrical equipment have played an important role in the Philippine economy since the 1970s and continue to form the foundation of the country’s exports today. In 2014, these sectors accounted for 47% of total exports from the Philippines. The export-oriented industry is an important source of employment and is characterized by large, labor-intensive operations. The 258 E&E firms operating out of the Philippines employ some 344,450 workers. These firms also tend to be branch plants of foreign MNCs, and E&E accounts for the majority of all FDI in the country. While the sector is strong locally, globally the Philippines is still a relatively small contributor to the industry, accounting for just 1% of global E&E exports in 2014. The Philippines participates primarily in the component stage of the value chain; it accounts for over two-thirds of exports and firms. Within electronic components, integrated circuits, particularly A&T activities for analog semiconductors, is the main area.
Figure E-1. The Philippines in the Electronics & Electrical Global Value Chain
Source: Authors. Note: Values are 2014 exports (US$, billions). The number of firms and shading is based on firms with exports >$1 million in segment in 2014. Omitted or white boxes are segments in which data is not available.

The Philippines in the Electronics & Electrical Global Value Chain
vii
Philippines Advantages for Upgrading
• The Workforce, particularly at the operator level; specific strengths include English language skills, supply (availability, stability), cost, loyalty (low turnover rates), and the overall quality of workers (flexible, trainable).
• The Philippine Export Zone Authority (PEZA) is considered a key advantage to E&E companies. Beyond incentives, the responsiveness and stability of the organization are why firms have stayed and expanded their operations in the Philippines. The overall cost of manufacturing (attributable to the workforce and PEZA) is also seen as a strength.
• Footprint in Integrated Circuits and Automotive E&E products: Accounting for 2.8% of world IC exports, the Philippines has been among the top 10 exporters for at least the last decade. Several of the largest IC global companies have locations in the Philippines including Texas Instruments, STMicroelectronics, NXP, ON Semiconductor, Analog Devices and Maxim among others. Within ICs, the Philippines is particularly dominant in analog A&T activities. In the automotive industry, two-thirds of exports are in E&E components and the Philippines is among the top five exporters of wire harnesses globally. Collectively, E&E and auto exports accounted for 53% of the country’s exports in 2014.
Philippines Challenges for Upgrading
• Stagnant export growth: The Philippines had a negative export CAGR since 2007 (-2%) compared to a positive world rate (4%), although exports have increased since the economic crisis and the exit of Intel. This is compounded by the fact that the export profile of the country has remained largely the same (IC A&T activities and storage devices) with little change in product mix.
• Loss of engineering talent to other countries and minimal functional
upgrading: top engineering talent has had a tendency to leave for better opportunities in other countries, which poses a challenge to moving into higher value activities in the chain across segments. In order to engage in more functional upgrading (which has been minimal), the Philippines will need to address the issue of losing skilled workers to other countries. There is a relatively limited supply of industry-specific technicians that would be needed to move into new product areas, end markets, or more skill-intensive functions.
• Competition from other ASEAN countries with similar backgrounds and
aspirations. These countries are also trying to entice foreign investors to set up operations in their countries, so it is important for the Philippines to be aware of their strategies. Focusing on industries and firms that fill gaps across multiple industries and establishing a niche will help the country stand out compared to competitors.

The Philippines in the Electronics & Electrical Global Value Chain
viii
Given the current dynamics of the E&E industry both globally and in the Philippines, five areas have been identified as targets for upgrading, with three of these having a strong tie to the automotive industry. Table E-1. Potential Upgrading Trajectories for the Philippines
Time Frame Potential Upgrading Trajectory Key Benefits Philippines Challenges
Short to Medium Term
Product upgrading in storage devices
• Remain relevant & competitive as industry innovates
• Skilled employment and enhancement of knowledge capabilities
• Industry dominated by MNCs with production strategy developed in HQs outside Philippines
Medium to Long Term
Entry into electrical equipment: networking & infrastructure improvements & industrial end market
• Leverage domestic & regional demand to drive economies of scale
• Improve telecom & energy grid infrastructure
• Employment generation
• Limited presence in the electrical business • Competition from ASEAN countries with larger domestic markets
Short to Medium Term
Strengthen and expand automotive E&E (EMS, batteries, motors, etc.)
• Continue to build automotive E&E cluster; niche area within ASEAN
• Employment • Higher value; lower volume products
leverage competitive advantages • Move beyond competitive semiconductor
A&T • Future opportunities in aerospace and
shipbuilding
• Competition from other ASEAN countries
• Experience focused only on one area – wire harnesses; limited experience in other areas (e.g. batteries, motors)
• Limited global awareness
Short to Medium Term
Backward linkages in common electro-mechanical products (e.g. passive components, circuit boards, electrical equipment)
• Close supply chain gaps • Add value to copper raw materials • Increase domestic component of exports,
capture more value by expanding participation along chain and increase employment
• Help grow EMS/Tier 1 segment in the country
• Local firms lack capital, scale and expertise to provide products & services for MNCs
• Information asymmetries regarding capabilities impede linkage formation
• Slowdown in copper refining locally (only for copper wires).
Long Term
Functional upgrading in analog and power ICs for automotive applications
• Skilled employment • Minimal involvement in non-manufacturing segments of the chain
Source: Duke CGGC.

The Philippines in the Electronics & Electrical Global Value Chain
9
1. Introduction Electronics and electrical equipment have played an important role in the Philippine economy since the 1970s and form the foundation of the country’s export basket today. In 2014, these sectors accounted for 47% of total exports from the Philippines at US$28.8 billion, of which 41% was from electronics and 5.4% from electrical equipment, and 0.6% from consumer appliances and electrical industrial equipment.1 From a global perspective, while the Philippines is not the leading exporter in any particular product category, it is known for its significant number of semiconductor assembly and test (A&T) facilities. The global economic crisis (2008-09), combined with the exit of Intel (2009), had a significant negative impact on electronics exports and, although steadily increasing, they have not yet rebounded to pre-crisis levels. Nonetheless, investment in the electronics and electrical industries has picked up since 2010; in the past five years, there have been 110 new investments in these sectors. Another positive sign is the low exit rate; with the exception of Intel, companies that have invested in the Philippines have stayed, with several operations dating back to the late 1970s and 1980s. These firms have not only stayed, but have continued to grow and expand in the country due to the quality of the workforce and satisfaction with the Philippine Economic Zone Authority (PEZA) environment. The growth of the industry has significantly benefited from foreign investment and close ties with Japanese firms. Moving forward, there are several opportunities for the Philippines to grow its participation in the electronics and electrical equipment value chain. Within the subassembly and final product stages, the Philippines is primarily engaged in storage devices and office-type equipment. Recently, exports of industrial equipment have also increased, which is among the fast growing export categories globally. The country has also started shifting exports towards China/Hong Kong, the largest electronics exporter and the fastest growing consumer market, which is a positive sign for the country. Perhaps the most promising are opportunities in automotive electronics and electrical components and subassemblies; demand for motor vehicles as well as electronic content are rapidly growing in Asia and globally, and the Philippines already has a considerable footprint in this area. This report uses the global value chain (GVC) framework to analyze the Philippine current position and potential for upgrading in the electronics and electrical equipment GVC. GVC analysis examines the full range of activities that firms and workers around the world perform to bring a product from conception through production and end use. As part of this analysis, multiple factors are considered; trade patterns, end markets, product characteristics, technology-intensity, labor, standards, and regulations, among others. This information is analyzed from a global perspective and from the viewpoint of the Philippines in order to provide a holistic picture of the situation when identifying trajectories for entry, growth, and upgrading along that chain. In particular, the report exams opportunities where the Philippines can attract subassembly/final product manufacturers, such as electronic manufacturing service (EMS) providers. 1 References to trade data are based on UN Comtrade and refer to 2014 unless otherwise stated. These categories cover the majority of HS chapter 84 and 85. Approximately US$1.2 billion in exports (2014) from the Philippines from HS chapter 84 is not included.

The Philippines in the Electronics & Electrical Global Value Chain
10
This report is structured as follows: First, it analyzes the global industry, including an extended discussion on the key segments of the chain, the countries that participate in each, and how key stakeholders in the chain interact. It then offers case studies to illustrate the opportunities and challenges faced by developing countries in similar positions in the global value chain. This is followed by an assessment of the industry in the Philippines before it concludes by offering possible upgrading strategies to boost the sector in the global market. 2. The Electronics and Electrical Equipment Global Value Chain The electronics and electrical (E&E) industry encompasses a broad range of component, intermediate, and final products that feed into a number of different end markets. World exports in 2014 of electronic components were US$616 billion, electrical equipment was US$508 billion, final electronic products and specific subassemblies was US$1.4 trillion, and final consumer appliances, equipment and specific subassemblies was US$342 billion (Table 2). The electronics segment in particular is characterized by rapid technological change, large investments in research and development (R&D), and demanding quality standards. Many key manufacturing and business processes have been formalized, codified, standardized, and computerized including product design (e.g., computer aided design), production planning, inventory and logistics control (e.g., enterprise resource planning), as well as various aspects of production (e.g., circuit board assembly, test and inspection, and materials handling). This combination of standardization and automation has created a recipe for ‘value chain modularity’ in which multiple firms participate in the chain, assembly operations can easily be separated from technology development, and basic, high-volume components can be substituted with relative ease. This substitutability narrows profit margins in the manufacturing segments, and has led to a high degree of offshoring and outsourcing throughout the value chain as firms seek to lower costs. Lead firms today now focus on their core competencies, which also happen to be the most profitable segments of the chain (e.g., product development, consumer research, branding and marketing), and rely on contract manufacturers, component producers, and service providers to do the rest. These suppliers have flexibility to locate where total costs are lowest; at the subassembly and final product stages, these costs can either be driven by capital intensity for highly automated operations, or labor-intensity in lower volume operations. At the same time, the relative level of standardization has enabled electronics to be embedded in a wide range of final products – from cars and consumer appliances to medical devices, aircraft and industrial equipment, offering diverse opportunities for customized components that have the same fundamental architecture. This, coupled with the ability and desire for convenience and connectivity, a trend commonly referred to as the “Internet of Things” (IoT), is causing simple electrical products to increasingly become ‘smart devices’. E&E products are now pervasive in all walks of life, thus creating continuous opportunities for new and existing E&E companies along the value chain. The following sections present the global value chain, discuss the global geographic distribution of demand and supply, examine the key actors in the chain and how the chain is impacted by

The Philippines in the Electronics & Electrical Global Value Chain
11
public and private institutions, provide an overview of the human capital requirements for the various activities in the chain, and identify typical upgrading trajectories. Analyzing the global dynamics of this industry provides important insight for developing an upgrading strategy for future growth in the Philippines.
2.1. Mapping the Electronics and Electrical Equipment Global Value Chain The E&E GVC comprises intermediate products or electronic and electrical components, subassemblies used in other markets, and final products. Electronics are generally perceived as being able to store and/or process information while electrical components are responsible for generating, distributing, and/or storing electricity. All of the final products can be considered “electrical” in that they require an electrical power source to operate, however, only products that have semiconductors are considered electronics. There is an opportunity for nearly all electrical products to perform electronic functions, however the adoption rate has been faster in some markets than others. Figure 1 presents a comprehensive map of the E&E value chain. The full range of Harmonized System (HS) codes used to define the industry in this report is available in the Appendix; this definition builds on the definition provided in Frederick and Gereffi (2013). The following provides a description of the five main segments and activities undertaken by firms in the industry from conception to consumption, both tangible and intangible. Figure 1. Electronics and Electrical Global Value Chain
Source: Authors.
Electrical!
R&D and Design!
Electronic!
Integrated!Circuits!
Plastic &!Glass!
Silicon!
Passive IC!Components!
Active !Discrete!
Packaging!
Final Products/!Market Segments!
Metal!
Medical!
Automotive!
Aerospace & !Defense !
Industrial !Equipment!
Consumer!Electronics!
Communications!& Networking!
Computers/!Storage/Office!
Bare Circuit!Boards!
Wires & !Cables!
Switchgear!
Motors &!Batteries!
Assembled!PCBs!
Product-!Specific Parts!
IC!Design!
Circuitry!Design!
Software!Integration!
New Product!Development!
Components! Subassemblies!
Switchgear/!Panel Boards!
Chemicals!
Consumer: !Retailers!
Industrial:!Firms!
Public-Use:!Institutions!
Distribution/!Sales Channels!Inputs!
Transformers! Electric Utilities/!Infrastructure!
Semiconductor!Wafers!
Consumer!Appliances!

The Philippines in the Electronics & Electrical Global Value Chain
12
The GVC is composed of raw materials and inputs, electronic and electrical components, subassemblies, final product assembly for a variety of end market segments, and the ultimate buyers of final products. The value chain also includes several activities that add value to final products outside of the manufacturing process related to research, product and process development, design, marketing and after-sales services. Given the breadth of products covered in this report, there is a wide range of value-adding activities, however, the main activities that cut across several sectors include: new product development, circuitry and semiconductor design, software integration, and overall product architecture development. These activities are among the most profitable in the chain and are predominately controlled by lead firms or leading component suppliers. These are the last activities to be performed in offshore locations or outsourced to other facilities, but this is starting to occur in some regions within countries with large agglomerations of manufacturing facilities. The inputs and raw materials needed to make electronic components varies by the component. The materials used in semiconductor fabrication include silicon and silicon chips (for wafers), plastic (to form the layers of circuit boards), ceramics, various metals (mainly aluminum and copper, but also gold and silver), and doped chemicals and other materials. Elements boron, gallium, phosphorus, and arsenic are used in silicon chips to turn a silicon crystal from a good insulator into a viable conductor, or anything in between (IBISWorld, 2012b). Key inputs to other electronic and electrical components include various quantities of metals such as aluminum, copper, gold, and silver. The next stage in the value chain is components. Electronic components are electronic elements with two or more connecting leads or metallic pads intended to be connected together, usually by soldering to a printed circuit board, to create an electronic circuit (IBISWorld, 2015d). They can be categorized as passive or active, where active components amplify voltage and control the flow of electric current in a circuit. Semiconductors and passives are usually configured together in an electronic subsystem (the most common type being a printed circuit board assembly) for incorporation into a complete electronic subsystem (Freedonia, 2012).
• Passive electronic components: store, filter, or regulate electric current flow, but they cannot amplify or independently control it (IBISWorld, 2015d). Examples of passive electronic IC components include capacitors, resistors, and varistors.
• Semiconductors (active) o Wafers/dice: The key component in active elements is the semiconductor
substrate/wafer/die. These are produced in foundries or fabs and is considered the front end of semiconductor manufacturing. The terms “die/dice”, “chip”, “integrated circuit”, and “semiconductor” are often used interchangeably although each has a different definition and refers to a different stage in processing. The capital investment required to set-up a state-of-the-art (300mm wafer) semiconductor manufacturing facility is significant; about US$5-6.8 billion in the US and about US$1 billion less in a non-US location (IBISWorld, 2015d).
o Discretes: contain only one device per chip and are designed to perform a single electrical function. These nonintegrated devices can be used individually (for simple electrical switching and processing applications) or as parts of larger

The Philippines in the Electronics & Electrical Global Value Chain
13
circuit designs (Zino, 2015). Active discretes include transistors and diodes; individual passive components may also be referred to as discretes.
o Integrated circuits (ICs):2 are electronic circuits in which many active and/or passive components are fabricated and connected on a continuous semiconducting substrate (Zino, 2015). The main types of ICs include microprocessors, memory, and logic chips. Assembly, Packaging and Testing (A&T) (back-end) are the main processing steps.
• Printed circuits or printed circuit boards (PCBs): consist of patterns of circuitry etched from copper laminated together using intense heat and pressure under vacuum. Manufacturers in this segment print, perforate, plate, screen, etch or photoprint interconnecting pathways for electric current on laminates. The final product at this stage is a “bare” printed circuit board without mounted electronic components. Although they vary in complexity, PCBs are used in virtually all electronic equipment from consumer products to high-end commercial equipment. Printed circuit boards used in consumer electronics typically have lower layer counts and lower performance materials and require less manufacturing capability. High-end commercial equipment manufacturers require more complex multi-layer PCBs, often constructed with advanced materials. Manufacturing PCBs for high-end products requires more investment in advanced production facilities and process technology as well as engineering and manufacturing expertise (IBISWorld, 2012). Prior to creating the circuit board, PCB artwork must be created which is the schematic that shows how the circuits are connected. This was originally a labor-intensive process, but now computers and programmable manufacturing equipment can be used. Electronic design automation (EDA) software is used to develop, verify, simulate, and transfer circuit designs to manufacturing equipment of ICs and PCBs (IBISWorld, 2015a).
• Printed circuit (board) assemblies (PCA or PCBA) are PCBs with the electronic components attached. The two primary techniques for circuit board assembly are surface mount (SMT) and through-hole (THT). Surface mount is the more advanced technique in which components are placed on pads and soldered to the surface of the PCB. In THT, component leads are inserted in holes in the board to keep them in place. THT boards can be assembled by hand while most SMT is done with robotic machinery.
Electronic subassemblies vary by final product, however circuit boards are found in the majority of electronic products. A circuit board is put into a plastic or metal enclosure (also called casing or housing) to form a subassembly. Manufacturers at this stage may be responsible for creating the PCBA and/or putting it in its casing; the manufacturer may take on the responsibility of sourcing raw materials or perform the operations on a contract or consignment basis for another firm. The electro-mechanical assembly process involves enclosure fabrication, installation of subassemblies and components, and installation and routing of cables. A common term used by industry to refer to this stage is “box-build” or systems integration, which means assembly work other than just PCBA.3 The final assembled product is then a “product-specific” part, indicating it is ready to go into a definable final product.
2 The world export value is larger than the market value for ICs because wafers cannot be separated from ICs in the trade data, so wafers and ICs post A&T activities are both included in export data. 3 https://www.ventureoutsource.com/contract-manufacturing/information-center/terms-and-definitions

The Philippines in the Electronics & Electrical Global Value Chain
14
Electrical equipment components and subassemblies generate (motors/generators), transmit and distribute (switchgear, transformers, wires/cables), or store (batteries) electric power. They are used as part of electrical subassemblies such as electrical panels, switchgear equipment, and power transmission devices (see Table A-2. Electrical Equipment Industry Definition, Market/Export Statistics, 2014). The term electrical equipment typically encompasses all of these products except wire/cable, and some small switchgear components. 4
• Transmission and distribution (T&D): o Transformers: regulate flow; power, distribution, and specialty types; this
category also includes uninterruptable power supply (UPS) devices. o Switchgear include devices for switching, protecting, or making connections to,
or in, electrical circuits and the base materials they are mounted on to create subassemblies. The component products in this category are primarily parts of subassemblies for power transmission equipment and telecommunications (for products such as routers, bridges, and gateways), and to a lesser extent residential and commercial wiring systems. Products include base panels, switches, connectors, plugs, sockets, junction boxes, relays, and fuses. A “back panel” to interconnect electronic switch modules in a telecommunications central office is an example of a subassembly in this category. A small portion of these products are also used on circuit board (connectors, fuses, switches, etc.) and as part of larger electronic or electro-mechanical systems (power supplies, actuators, wiring harnesses, sensors, etc.).
o Wire and cables include insulated nonferrous wire and cable and fiber optic cable used for power transmission and communication (Oston, 2015).
• Other components: electro-magnets, carbon electrodes, and insulators. Insulators are devices intended for electrical insulation and mechanical fixing of equipment or conductors subject to electric potential differences (IEC, 2012).
• Motors, generators and batteries are electrical subassemblies responsible for generating and storing electricity. Electric motors and generators perform different functions—generators convert mechanical energy into electricity, while motors convert electrical energy into mechanical power—however, they share many of the same suppliers, production steps, firms, and competitive landscape (Lowe, Golini, et al., 2010).
The distribution and sales methods for electronics components vary by the stage in the value chain and the relative value of the part. Passive electronic component manufacturers (other than semiconductors) sell over half of their products via distributors (Ulama, 2015). Semiconductor and PCB companies are more likely to sell their products directly to electronic product manufacturers (IBISWorld, 2012). How finished ICs are sold to downstream manufacturers depends on a combination of product type and scale. Customized products are sold directly to specific buyers whereas standard products go through distributors; large buyers receive direct shipments whereas smaller buyers source from distributors. Regardless of how the product is sold, the components may be shipped from the A&T facility to the main 4 Based on the following industry definition for electrical equipment: firms in this industry primarily manufacture: power, distribution and specialty transformers; electric motors, generators and motor-generator sets; switchgear and switchboard apparatus; relays; and industrial controls (Hurley, 2015).

The Philippines in the Electronics & Electrical Global Value Chain
15
distribution center of the semiconductor, distributor, or Tier 1/EMS company in the region (in Asia, these are primarily in Singapore, Taiwan, and Hong Kong), even if the purchasing firm is physically in the same country as the A&T facility. Final Products: Final products are destined to a growing range of end markets, from computers and consumer electronics – including mobile phones and TVs, to automotive, medical, industrial and aerospace & defense (A&D). Continuous growth and spread into new industries make it difficult to classify all the final products and end markets encompassed by the industry. In this report, seven principal end market segments are analyzed (Table 1). For the first three market segments (computers, consumer electronics, and communications and networking, the “3Cs”) final products are often referred to as “electronics or ICT” and the entire output of these industries is included in our analysis. In medical and industrial equipment, a share of the products in these markets use E&E components, but the overall market contains several products that do not require electricity to operate and these products are not included in this report. For automotive and A&D, E&E content accounts for a significant share of the cost of goods sold, but the final product (e.g., car, airplanes) requires intricate knowledge of how multiple E&E and non-E&E subassemblies work together. In the 3Cs, the lead firms are E&E specialists with technical expertise in the industry. For the other markets, the lead firm relies on a group of specialized suppliers (often referred to as Tier 1 suppliers in the industry) to develop expertise and establish the supply chains for their subassembly, therefore adding another layer of coordination into the chain. For example, a car has a motor and a battery as well as a system of safety electronic sensors, however these are parts of different subassemblies and therefore the development of each would be coordinated by a different group of firms. Computers and consumer electronics are by far the largest categories as these are both high volume, primarily consumer markets. However, there are significant growth opportunities for E&E components and parts in the other markets as electronic content (or the electronics cost of goods sold (ECOGS)) increases. These markets differ from the 3Cs because the overall size of the market is smaller and production volumes are lower (high mix, low volume). These markets provide opportunities for smaller, flexible, and more customized components. On the electrical side, consumer appliances and electrical industrial equipment are also included. Electronic components are increasingly being added to these final products as well, but at present, estimates for the ECOGS were not available. Across all segments, several factors are important to foreign investors or buyers when looking for new manufacturing locations. These include low labor costs, scalability, a supporting business and regulatory environment (including incentives), ethical working conditions, and proximity to market (Wood & Tetlow, 2013). These factors are more important for traditional, high volume, lower value markets (mobile phones, computers, and consumer electronics).

The Philippines in the Electronics & Electrical Global Value Chain
16
Table 1. End Market Segments, Values, RSP, EMS/ODM, and Exports, 2014
End Market Final Products Market Values (US$, Billions) Total, RSP EMS/ODM Exports
(2014)
Computers (2014, 2011)
Personal Computers (PCs): Desktop, Laptop, Notebook, Netbook, Tablets, (US$139); Peripherals/Hardware: keyboard, mouse, portable storage (memory cards/sticks), hard disk drives (HDD) & external storage (US$80); Office equipment (printer, fax, copier, scanner)(US$99); Commercial: servers, enterprise computing systems
$318- $479 $86 $526
Consumer Electronics (2014, 2011)
Mobile phones (US$320), routers, TVs, cameras, video players, audio equipment, wearable electronics, and video game hardware
$563 $60
$721* Communications & Networking (2014, 2011)5
Public telecommunications, private communications networks, Internet, mobile phone infrastructure $119 $55
Automotive (2014) Car audio and video (US$64); Vehicle control (braking, acceleration, traction, suspension, parking assist) (~US$100)
$164 $23 --
Medical (2008, 2012) Consumer medical, diagnostics and testing equipment, imaging, telemedicine, meters and monitoring, implants, fitness
$118 $16 $52
Industrial (2012) Process control, test & measurement, ‘other’ industrial, and clean energy; covers electronic content of goods (COGS)
$95 $22 $141*
Aerospace & Defense (2014)
Ground combat systems, aircraft, sea-based systems, satellites, eavesdropping and surveillance, missile guidance & intercept
$116 $17 --
EMS/ODM Share ~35% -- -- Total Above (2014; 2011/12) $1,574 $278 $1,439 NVR Estimates (2014) $1,300 $460 --
Sources: Consumer Electronics: Euromonitor (2014); EMS/ODM estimated from MarketLine (2012); Computers: US$318 MarketLine (2011, 2015a, 2015b) and US$479 IBISWorld (2015b)(excludes other computer peripheral manufacturing); EMS/ODM: MarketLine (2012); Communications & Networking: Total (sum of 2014 revenues of lead firms); EMS/ODM: MarketLine (2012); Automotive: IBISWorld (2015c) and Reghu (2015); Medical: Total Frost & Sullivan (2009a); EMS: Frost & Sullivan (2013); Industrial: NVR (2012); EMS/ODM: NVR (2015); Aerospace & Defense: Total (sum of 2014 revenues of lead firms); EMS: Ravikrishan (2014). Exports: see tables below in geographic supply section; exports higher than market value because it also includes subassembly trade; (*): industrial and consumer include some products likely considered automotive and A&D in market values. While there are numerous studies on the traditional electronics end markets, fewer studies have examined the potential for expansion in the other end markets. This subsection highlights opportunities for E&E and EMS suppliers in the automotive, industrial, medical devices and aerospace & defense sectors. Computers, office equipment, storage, and servers This end market is comprised of consumer products as well as enterprise or commercial products purchased by businesses. Consumer products include personal computers (i.e., 5 Exports are likely contained within communication equipment under consumer electronics and electrical T&D. Sales are primarily for public-use infrastructure (utilities/construction), so different from other markets.

The Philippines in the Electronics & Electrical Global Value Chain
17
laptops, desktops); this volume segment experienced tremendous growth in the last decade, but has stagnated due to the growth of smaller, more handheld electronics with similar capabilities such as smartphones. This segment is dominated by the top five contract manufacturers who have the global scale to produce for this high volume market. This segment also includes printers, scanners, copiers, fax machines (and combinations thereof), as well as parts of computer systems sold individually (keyboard, display, mice, etc.). Products in the enterprise segment include computer systems, servers and storage devices6; this is a smaller, but growing market due to companies and individuals saving more data and the trend towards ‘cloud computing’ rather than saving all data locally. The lead firms in this segment differ from those in the personal computer segment and align more with the communication and networking end market. Automotive and other transportation markets Electronic and electrical systems account for a significant share of vehicle costs, up to 30-40% (GTAI, 2014; Reghu, 2015).7 In 2014, global revenue for automotive E&E systems was US$164 billion, of which 14% is attributed to EMS providers. The brain of the electronic system in a car is considered to be the electronic control unit (ECU) (Reghu, 2015). Automotive electronics can be broken into the following categories:8
1. Powertrain/engine/chassis: engine control units, vehicle stability control systems, adaptive cruise control units.
a. Diverse electric motors, electrical (turbo-) charging, new ignitors and advanced sensors, automated manual transmission, e-braking/e-steering/e-suspension, electronic stability control, and start-stop system.
2. Safety and warning systems: airbag igniters, tire pressure monitor systems a. Rear cameras, lane departure warning, adaptive cruise control, blind spot
detection, map-supported adaptive front lighting, tire pressure monitoring system, curve warning, speed alert, collision warning, and usage data transmission.
3. Entertainment/navigation (infotainment/in-car entertainment/telematics) a. Fixed and portable navigation devices, multimedia features, Bluetooth, eCall,
voice-based, haptic and human machine interface systems and touch, real-time traffic, parking assistant, social media, and Wi-Fi/Smartphone interface.
b. Comfort and convenience: adaptive front lighting, steering wheel buttons, central/heads-up displays, voice control systems, Xenon headlights, LED/ambient lighting touch screens, remote control, and well-being assistant.
4. Wire and cable harnesses (electrical): these direct the flow of current and electronic signals throughout the vehicle.9
Automotive manufacturers (lead firms) work with global Tier 1 suppliers specialized in automotive systems and subsystems (e.g., Denso, Delphi, Bosch), which may include circuit
6 Storage devices are components of personal computers and industrial computers as well as standalone products. 7 GTAI: 30%; Reghu: 30-40% 8 Products listed in bullet points from (GTAI, 2014). 9 See companion report “The Philippines in the Automotive GVC” for further details.

The Philippines in the Electronics & Electrical Global Value Chain
18
boards. If an EMS provider is involved, they typically just assemble the circuit board for a particular module such as an engine control. Further upstream, semiconductors are a key component of automotive electronics. Semiconductors in the automotive industry (global revenue of US$22 billion in 2014) include: (1) ASIC/ASSP/FPGA or analog-based ICs (2) microcontrollers, (3) discrete power semiconductors (particularly important in hybrid/EV), (4) sensors/MEMS, and (5) optoelectronics (Frost & Sullivan, 2011; Hammerschmidt, 2014; Parker & Thomas, 2013). The semiconductor (which is only a portion of overall E&E content) content of hybrid electric vehicles is higher than the average vehicle; the average automobile has US$350 worth of semiconductor content, whereas hybrid e-vehicles contain approximately US$600. This largely stems from semiconductors used in the drivetrain to power circuits such as those that route power from batteries to the motor (Parker & Thomas, 2013). Drivers: Opportunities for electronics stem from many factors including general trends such as the substituting electronic components for mechanical devices and rising automobile sales in emerging countries (e.g., Brazil, India, and China) as well as increases in demand for in-car entertainment systems and safety features such as anti-lock braking system (ABS), stricter fuel economy and emissions standards, and the growth of hybrid electric and battery electric vehicles (Frost & Sullivan, 2011). While electronic-related features in earlier years was associated with luxury class vehicles, many are now considered standard, and are all installed in vehicles of all categories. Criteria: Global footprint, manufacturing capability, adherence to quality requirements, and track record. Regarding quality, automotive manufacturers expect less than 1% defect manufacturing rates and 100% just in time delivery of products. Electronics suppliers are also expected to showcase continuous improvement in all business areas (Reghu, 2015). Industrial The industrial market is the most diverse and consists of multiple subcategories including process control equipment, test & measurement (T&M), and ‘other’ industrial equipment. These are important segments because they are at the intersection of electronics and electrical equipment. Many firms that have divisions in industrial electronics are also engaged in electrical equipment. In 2012, the cost of electronics in the cost of goods sold (COGS) in industrial assembly products was US$95 billion, with EMS accounting for approximately 23% of the market in terms of revenue at US$22 billion. Of the categories listed, T&M has the highest value of EMS (US$7.5 billion) and is also the most electronic-intensive category, followed by the “other” category (US$7 billion). In each of these, approximately 30% of revenue is via EMS. In the T&M segment, the lead firm is responsible for the final integration or ‘box’ assembly of the industrial product while the EMS subcontractor manufactures the complex PCBs that account for the highest proportion of semiconductor electronics assembly. In certain cases, such as with small handheld test equipment, the EMS provider will assemble and ship the entire product (PCB and box assembly).

The Philippines in the Electronics & Electrical Global Value Chain
19
The process control segment is comprised of 13 product segments: automation/programmable logic control (PLC), construction/agricultural/mining, electric motors, electrical distribution/smart grid, elevator systems, environmental management, fluid control/hydraulics, marine/waste water, oil/gas, power supplies, robotics, smart meters, and UPS/batteries. The cost of electronics in this segment was US$33.6 billion in 2012 of which 17% is carried out by EMS providers. The electronics content of process control equipment varies considerably by individual product, with automation/PLC (embedded in nearly aspect of this market) and smart meters having the highest concentration. The majority of subcontracting involves PCBs, and in some cases, the final integration or ‘box’ assembly of the industrial product (NVR, 2012). The “other” category includes applications that do not fit neatly into a clear sector, such as ATM/gaming equipment, HVAC, laundry/home appliances, lighting/LEDs, security/safety products, tools, and material handling/specialty equipment/other industrial hardware. Many of the sectors are quite large, such as the LED lighting systems sector, while others are composed of multiple companies and derivative products, such as HVAC and home appliances, which nevertheless constitute significant markets, albeit minor ones for electronics assembly overall (that is, the electronic content is less than 10% of the overall COGS). Aerospace & Defense (A&D) Like the automotive sector, E&E systems are key subassemblies in the aerospace sector;10 an A380, for example, contains some 500km of wire cables. The past decade has seen a significant increase in outsourcing in the industry. Today, the EMS market for A&D has close to 400 participants worldwide and is becoming increasingly competitive as more EMS providers are drawn in because of the high margins. The EMS sector is fragmented as the top three firms only control a quarter of the market. Market revenue for the A&D EMS market was US$16.6 billion in 2014. This market is considered a growth opportunity with a projected CAGR of 8.7% (2014-2019) (Ravikrishan, 2014). Drivers: the expanded use of electronics on new aircraft and adding new electronic technologies to existing aircraft both present opportunities in this market. From the passenger entertainment perspective, the trend towards adding Wi-Fi connectivity, and in-seat entertainment systems and charging capabilities on commercial aircraft are opportunities. From an operational standpoint, drivers include (1) a shift from hydraulic to optical and electronic control systems and (2) growth of integrated, and more standardized avionics systems, which presents opportunities in communication, navigation, and surveillance systems. MRO, or aftermarket services are also a growing area for EMS providers, particularly in the Asia Pacific region. Given the growth in air travel, many EMS providers are shifting their focus to establish service centers in these countries. Singapore, Malaysia, China, and to a lesser extent India have been early hubs for aftermarket services. Some firms, however, have withdrawn from the Chinese market because of counterfeit electronic components, which is contributing to growth opportunities for other Asia Pacific countries. Criteria: High levels of quality, efficiency, and credibility are critical factors in this market. Similar to the automotive and medical industry, acquiring certifications is necessary (e.g., AS9100). EMS
10 See companion report “The Philippines in the Aerospace GVC”.

The Philippines in the Electronics & Electrical Global Value Chain
20
providers also need to be positioned to establish a long-term relationship due to the long lead time for products to reach the market (i.e. 3-8 years). A responsive and flexible manufacturing model is also needed to produce for this low-volume, high-mix market. Given the commonalities, transitioning from the medical or automotive industries to A&D will be comparatively easier than shifting from a focus on consumer electronics. Similarly, entering the A&D market may be difficult for new EMS providers without a prior reputation. Medical The medical device sector continues to expand its use of E&E systems (Bamber & Gereffi, 2013; Frederick & Gereffi, 2013). Electrical medical products such as defibrillators, dialysis instruments, dental drills, and laser-based instruments require electrical power systems to function and maintain consistent operations, while medical electronics include both large medical imaging equipment (e.g. X-ray machines, MRI, and ultrasound machines) as well as smaller equipment that can be used in a healthcare facility or in the home (e.g. monitoring systems for blood pressure, activity level, or heart rate). In 2008, the electronics medical device market was US$118 billion (Frost & Sullivan, 2009a). In 2012, the EMS medical market generated US$16.4 billion in revenue (Frost & Sullivan, 2013); the majority (88%) of which is derived from manufacturing. Lead firms are hesitant to outsource other services such as design, engineering, testing, and direct-order fulfillment due to regulatory compliance and the critical aspects of the product, and many device producers continue to manufacture in-house. As such, functional upgrading opportunities will likely be limited for the foreseeable future. Drivers: An aging global population with means to pay and advances in science and technology continue to push the boundaries of how devices can improve the quality of life for millions of people around the world. Developed country markets are mature, with low but steady growth rates, while developing countries represent an important new growth opportunity as the result of increasing expenditure on healthcare in emerging economies and double-digit growth rates that are expected to continue as overall income levels rise (Araujo et al., 2011). Criteria: Aspiring EMS providers need to be able to bear the significant cost associated with becoming regulatory compliant, have access to people with prior experience and expertise in this market, and the ability to have a long-term view because product life cycles are longer than other electronic products (Frost & Sullivan, 2013). Participating in the medical industry requires significant investment because of audits, the certification process, the low- to medium-volume manufacturing environment, and the need for quality systems and sterilization. Lead firms/Tier 1 suppliers are seeking EMS partners with proven capabilities.
2.2. Global Trade in the Electronics and Electrical GVC This section introduces the main countries participating (exporting and importing) in the different segments of the GVC, including key end markets. Global trade in both demand and supply has begun to shift away from developed markets and towards Asia. While the shift of production towards the region has been steady as a result of lower costs and access to raw materials, more recently the continued growth of the Asian consumer market, increased connectivity and internet access, and environmental regulations oriented toward energy efficiency have made the region an important geographic end market.

The Philippines in the Electronics & Electrical Global Value Chain
21
Global supply is represented by the countries that export E&E components and those that assemble and export final products that incorporate these parts and product-specific subassemblies. Table 2Error! Reference source not found. lists world exports by value chain stage and the following final product/subassembly categories identifiable using trade statistics: computers/storage devices/office equipment, consumer electronics (including phones and cameras), industrial electronic equipment, medical electronics and consumer appliances. Exports of final electronic products and specific parts were US$1.4 trillion while electrical were $342 billion for a combined total of US$1.8 trillion in 2014. Consumer electronics continues to drive trade in the sector, accounting for US$721 billion, however computers are a relatively close second, followed by consumer appliances (Table 2). Table 2. World E&E Exports by Value Chain Stage and Category, 2007-2014
Stage/Sector/Category Value (US$, Billions) World Market Share (%) CAGR (%)
2007 2010 2012 2014 2007 2010 2012 2014 2007-14 E&E Total 2,253 2,447 2,729 2,905 4% Electronics Total 1,642 1,776 1,943 2,055 73% 73% 71% 71% 3% Electronic Components 465 541 558 616 21% 22% 20% 21% 4% Final Electronic Products/Specific Parts 1,177 1,236 1,385 1,439 52% 50% 51% 50% 3% Electrical Total 611 671 786 850 27% 27% 29% 29% 5% Electrical Equipment 366 411 477 508 16% 17% 17% 17% 5% Final Electrical Products/Specific Parts 245 260 309 342 11% 11% 11% 12% 5% VC Stage Totals E&E Components 831 952 1,035 1,124 37% 39% 38% 39% 4% E&E Final/Subassemblies 1,422 1,496 1,694 1,781 63% 61% 62% 61% 3% Final Products and Parts Categories Share of Final Stage (%)
Consumer (incl. Communication) 580 616 674 721 41% 41% 40% 40% 3% Computers/Storage Devices/Office 451 459 525 526 32% 31% 31% 30% 2%
Consumer Appliances 180 188 224 256 13% 13% 13% 14% 5% Industrial Equipment 105 113 135 141 7% 8% 8% 8% 4%
Medical 42 47 52 52 3% 3% 3% 3% 3%
Source: UNComtrade (2015a); Consumer electronics’ largest segment is ‘communications’ which include mobile phones and cameras. This is not the same as the communications/networking end market. China/Hong Kong has maintained its lead in the final assembly/subassemblies stage of the GVC over the past decade, representing 44% of exports in 2014 (Table 3). Export growth has also been strong for Mexico and Thailand, but other top exporters have remained steady (US, Germany, South Korea, and Singapore) or notably declined (Japan and Malaysia). Unpacking the trade of subassemblies from final product exports provides a more nuanced analysis of participation in the GVC, but requires analysis of trade data at a more granular level that is typically not available for all countries. A simple way to get a proxy for this is to examine the top importers of electronic components (this assumes components are mostly imported rather than produced domestically). The top 10 importers of electronic components were the same in 2005 and 2014 and the top exporters of final products/subassemblies and importers of electronic components are also the same. The similarity in these two groups indicates that

The Philippines in the Electronics & Electrical Global Value Chain
22
subassembly of product-specific parts and final product production are primarily carried out in the same set of countries, however there could be variation in the roles of individual countries.
Table 3. Top 10 World Exporters of E&E Final Products/Subassemblies in 2014
Exporter Value (US$, Billions) World Market Share (%) CAGR (%) 2007 2010 2012 2014 2007 2010 2012 2014 2007-14
World 1,422 1,496 1,694 1,781 3% China/Hong Kong 452 558 701 777 32% 37% 41% 44% 8% USA 128 130 149 153 9% 9% 9% 9% 3% Germany 104 88 98 101 7% 6% 6% 6% 0% Mexico 58 72 77 82 4% 5% 5% 5% 5% Rep. of Korea 68 65 64 75 5% 4% 4% 4% 1% Netherlands 67 62 64 69 5% 4% 4% 4% 0% Japan 69 58 59 48 5% 4% 3% 3% -5% Singapore 38 43 45 42 3% 3% 3% 2% 1% Thailand 30 35 40 39 2% 2% 2% 2% 4% Malaysia 46 42 37 35 3% 3% 2% 2% -4% Top 10 (in 2014) 1,061 1,154 1,334 1,421 75% 77% 79% 80% 4% Philippines 13 7 9 9 1% 0% 1% 1% -4% Vietnam 2 4 21 1 0% 0% 1% 0% -10%
Source: UNComtrade (2015a); top exporters based on export value. Total exports of E&E components were US$616 billion in 2014 (Table 4). The top exporters are China/Hong Kong, Singapore, USA, Germany, and Japan; among the top 10 exporters, China/Hong Kong and South Korea had the highest growth rates since 2007. Exports of the top 10 represented 79% of total exports in 2014. Electrical equipment exports are more from the EU-15 (France, Italy, and the UK), whereas electronics are from Asia (Singapore, Malaysia, Philippines, Thailand). The top importers of electrical equipment are the US, China/Hong Kong, Germany and Mexico. Demand grew at a CAGR of 5% between 2007 and 2014.
Table 4. Top 10 World E&E Component Exporters in 2014
Exporter Value (US$, Billions) World Market Share (%) CAGR (%) 2007 2010 2012 2014 2007 2010 2012 2014 2007-14
World 831 952 1,035 1,124 4% China/Hong Kong 172 245 296 350 21% 26% 29% 31% 11% Singapore 83 98 95 103 10% 10% 9% 9% 3% USA 88 88 89 94 11% 9% 9% 8% 1% Germany 73 79 82 88 9% 8% 8% 8% 3% Japan 80 88 85 71 10% 9% 8% 6% -2% Rep. of Korea 43 58 67 78 5% 6% 6% 7% 9% Malaysia 35 38 42 48 4% 4% 4% 4% 5% France 27 27 27 27 3% 3% 3% 2% 0% Mexico 18 17 21 24 2% 2% 2% 2% 5% Top 10 (in 2014) 618 738 803 883 74% 78% 78% 79% Philippines 20 12 16 19 2% 1% 2% 2% 0%
Source: UNComtrade (2015a)does not include exports of HS854430

The Philippines in the Electronics & Electrical Global Value Chain
23
Global demand is represented by the top importers of final products and subassemblies. The main consumers are the EU-15, US, China/Hong Kong, and Japan, These were also the top importers in 2007; the majority of recent import growth is driven by China/Hong Kong. Drivers of final product demand stem from growth of the Asian consumer market, environmental (energy) regulations, and increased Internet access and connectivity.
2.3. Lead Firms and Governance Structure of the E&E Equipment GVC The E&E industry is comprised of three main groups of actors: lead firms; Tier 1 suppliers and contract manufacturers (EMS/ODM); and component suppliers. Many other entities play important roles in the broader industry, including software developers, production equipment manufacturers, distributors, and producers of more generic components and subsystems, but understanding how these three firm-level actors interact provides the most important insight into economic development opportunities. The share of the total value captured by the most powerful firms in GVCs, lead firms and component suppliers with strong “platform leadership”, can be extremely high (Sturgeon & Kawakami, 2010). These actors control product and technology development that are crucial for competing in the final product market; the introduction of new applications and better engineered components drives growth in the E&E chain. Lead firms concentrate their activities in the highest value stages of the chain for final products; these activities include marketing, branding, research, design, and new product development (NPD). The table below lists the main global lead firms and Tier 1 suppliers in each end market segment (Table 5).11 Some lead firms still assemble products in-house in their owned and operated facilities, but outsourcing final product and subassembly activities to contract manufacturers has been a strong trend over the past three decades (Sturgeon & Kawakami, 2011). This enables them to focus on the highest ‘intangible’ value-adding activities listed above without having to also focus on achieving production efficiencies. Production and logistics activities require a different set of skills and tasks than inventing and marketing final goods, so dividing the chain in this way enables the different actors to each develop a more specialized set of core competencies. Furthermore, this enables manufacturers to sell to multiple customers which permits them to achieve a higher capital utilization rate.
11 The term “Tier 1” is used in end markets in which the final product is not typically considered an “electronic.” For example, in the automotive industry, lead firms are motor vehicle manufacturers (e.g., Ford, Mazda, or Toyota), however the primary electronic suppliers (such as those listed in the table) are considered Tier 1. In most cases the Tier 1 engages in manufacturing, but it is also possible for the Tier 1 to outsource to an EMS contract manufacturer. This is an important distinction because the distance between the contract manufacturer and the lead firm is further removed in these end markets.

The Philippines in the Electronics & Electrical Global Value Chain
24
Table 5. Lead Firms and Tier 1 Suppliers Revenue by Market, 2014
Market Firms
Firm Market-Specific Revenue
(US$, Billion)
Computers, Office Equipment & Storage
Apple, Dell, HP, Lenovo, ASUSTeK, Acer, Canon*, Ricoh*, Xerox, Epson*, Brother*, Western Digital*, Seagate, Toshiba*, EMC, Fujitsu*, Hitachi, IBM, NetApp
$487
Consumer Electronics Samsung*, Sony, Sharp, LG, Panasonic Mobile: Apple, Samsung, LG, Huawei, Xiaomi, Lenovo, ZTE
$399
Communication & Networking Cisco, Huawei, Ericsson, Alcatel-Lucent, Nokia, ZTE, NEC $119
Automotive Bosch, Continental AG*, Panasonic*, Denso, Aisin Seiki Co., Valeo SA, Delphi, Omron, Autoliv $109
Medical Medtronic, GE Healthcare, Siemens, Philips Healthcare, Toshiba, Hitachi, Omron $74
Industrial Siemens, ABB, UTC, Philips, Emerson, Hitachi, Schneider Electric, Mitsubishi Electric, Rockwell, Omron, Dover
$108
Aerospace & Defense GE, Lockheed Martin, Northrop Grumman, United Technologies, Finmeccanica, L-3, General Dynamics, Boeing, BAE Systems $116
Source: see Table A-4. Lead Firms and Tier 1 Suppliers Revenue by Market, 2014 for details on market segments of lead firms/Tier 1 suppliers.
The outsourcing of manufacturing functions and services by lead firms gave rise to the emergence of large supplier firms of varying degrees of sophistication and business models. Production services in the electronics industry include activities such as component purchasing, circuit board assembly, final product assembly, and testing. In the industry, this is referred to as electronics manufacturing services (EMS). In addition to manufacturing, some contract manufacturers also provide design services; contractors that provide manufacturing plus product design services are known collectively as original design manufacturers (ODM). A few of the largest cater to large volumes for the computer, communication, and consumer electronics. Others, particularly those beyond the top 15, are specialists in medical or automotive or niche markets. Some specialize in products with short life-cycles; others in products with longer life-cycles. A few also do design work (and thus resemble original design manufacturers)(van Liemt, 2016). Contract manufacturers establish their own global production networks to produce products and/or provide design services on behalf of lead firms for a specified period of time.12 The popularity of contract manufacturing in the electronics industry is enabled by value chain modularity, which enables a clear technical division of labor between design and manufacturing at multiple points in the value chain, most notably between the design and assembly of final products and the design and fabrication of integrated circuits (Sturgeon & Kawakami, 2011).
12 Most large ODM contract manufacturers are based in Taiwan where they host their design functions, while their manufacturing operations are concentrated in mainland China.

The Philippines in the Electronics & Electrical Global Value Chain
25
EMS firms have become significant players in the industry as standardized operations allowed them to serve multiple customers, achieve high capital utilization rates and leverage economies of scale. While some lead firms still carry out assembly activities, contract manufacturers make up a larger share in more mature markets (consumer electronics, computers, and communications) and an increasing share in others. Estimates for the size of the contract manufacturing industry in 2014 range from US$406 to US$490 billion (Buetow, 2015; IDC, 2015; NVR, 2015). The majority of the EMS business is at the circuit board assembly level, and manufacturing process technology at this level is fairly generic. For this reason, EMS providers can serve lead firms in a variety of end market sectors, which provides a large pool of potential customers. However, this limits the market power of EMS providers because their services are highly substitutable. On the other hand, design expertise is more sector-specific, which limits the potential for end market upgrading. Table 6 lists the top global EMS and ODM providers in 2014 based on industry revenue. The contract manufacturing sector is concentrated with the top company, Foxconn, accounting for approximately 30% of industry revenue in 2014 and the top 10 accounting for approximately 65% (Buetow, 2015). Contract manufacturers are responsible for some input sourcing, but this is largely only in lower value components. Contract manufacturers purchase the bulk of the world’s electronic components on behalf of their global buyers. Purchase contracts for the more expensive components such as microprocessors and other key integrated circuits are negotiated directly by the lead firms and the semiconductor companies (this is discussed further below). The global prices for the other generic electronic and electrical components are typically low and are often purchased through global distributors. Three of the main electronic component distributors include DigiKey, Arrow, and Avent. As a result, despite the significant volume of components purchased by contract manufacturers, their buyer power is low because it is ultimately lead firms that negotiate prices and coordinate development with key platform leaders (Sturgeon & Kawakami, 2011). Profitability thus is an ongoing challenge. Compared to Tier 1’s approximate profit margins of 10-30% (dependent on size of the customer), EMS providers profit margins typically range between 2 and 10% (Rammohan, 2011).

The Philippines in the Electronics & Electrical Global Value Chain
26
Table 6. Top 15 Electronics Contract Manufacturers (EMS & ODM), 2014
Rank Contract Manufacturers
Global HQ
Main Service
Year Est.
Revenue (US, B)
Emp. (‘000) Markets Manufacturing Locations
1 Foxconn/Hon Hai Taiwan EMS 1974 $135 1,061 3C China, Mexico, Brazil, USA, Czech Rep., Hungary, Slovakia, Turkey, Malaysia
2 Pegatron Taiwan ODM 2007 $33 7 3C China, Mexico, Taiwan, Czech Rep.
3 Quanta Computer Taiwan ODM 1988 $29 105 Computer China, USA, Germany
4 Compal Electronics Taiwan ODM 1987 $27 70 3C,
Auto China, Vietnam, Taiwan, Brazil, Poland
5 Flextronics+ Singapore EMS 1969 $27 150 All China, Malaysia, Mexico, Brazil, Hungary, Israel, Poland, Romania, Ukraine, India
6 Wistron Taiwan ODM 2001 $19 70 3C China, Mexico, Taiwan, Czech Rep., Malaysia
7 Jabil Circuit USA; FL EMS 1966 $17 142 All China, Malaysia, Singapore, Vietnam, India, USA, Mexico, Brazil, Hungary, Ireland, Poland, Ukraine
8 Inventec Taiwan ODM 1975 $14 -- 3C China, UK, Taiwan, Czech Rep., USA, Mexico
9 TPV Technology Taiwan; Hong Kong EMS 1998 $12 32 Computer
Consumer China, Mexico, Poland, Russia, Brazil, Argentina
10 Celestica Canada EMS 1997 $6 27 All China, Malaysia, Thailand, Singapore, Laos, Canada, USA, Mexico, Ireland, Spain, Romania
11 Cal-Comp Electronics* Thailand EMS 1989 $5 247 Computer
Telecom China, Thailand, Philippines
12 Sanmina-SCI USA; CA EMS 1980 $5 43 All China, Singapore, Malaysia, Israel, Finland, USA, Mexico, Hungary
13 Universal Scientific Industrial (USI)
Taiwan EMS 2003 $4 -- China, Taiwan, Mexico
14 Benchmark Electronics USA; TX EMS 1979 $3 10
Industrial Telecom
ComputerMedical
USA, Thailand, Mexico, Malaysia, China, Singapore, Netherlands, Romania, Brazil
15 BYD Electronic Hong Kong EMS 2002 $3 60 Consumer (Mobile) China, Hungary
Total/Top 15 $490/69%
18 SIIX* Japan EMS 1992 $2 -- Philippines, China, Indonesia, Thailand, Hong Kong, Slovakia, Mexico, Japan
25 IMI* Philippines EMS 1980 $1 14 All Philippines, China, Bulgaria, Czech Rep., Singapore, USA, Mexico
Sources: Buetow (2015); company websites and MarketLine firm profiles. (*): firm has a manufacturing location in the Philippines; (+) non-manufacturing location in the Philippines. Additional maps and tables are provided here.

The Philippines in the Electronics & Electrical Global Value Chain
27
Countries positions in the industry can also be generalized by the characteristics of the majority of the firms that have operations in the country. They can also be viewed in tiers based on sales volume and market orientation. From a geographic market standpoint, manufacturers physically located in Mexico and Eastern Europe primarily supply the US and Western Europe/EU-15, whereas “global” providers are all Asian based, more specifically Southeast Asia. Table 7 gives an overview of the roles played by the main country participants in the E&E value chain. Table 7. Functional Categories of Electronics Companies with Country Examples
Functional Categories Capabilities/Tiers Country Examples End Markets
Component suppliers: Semiconductors/ICs
A&T Philippines, Malaysia, Thailand
Wafer fabrication; IC design and/or R&D
Singapore (entered 1970s), Hong Kong, China, South Korea, USA, Malaysia (some)
EMS/ Tier 1 MNC Branch Plants
Regional
For USA: Mexico For Western EU: Hungary, Poland, Czech Republic, Germany, Romania For China: China
All
Global: Tier 3
Laos & Myanmar (very recent) Vietnam (entered 2000s) Indonesia (entered 1990s) Philippines (entered 1970s)
-- Mobile, PCs Consumer, Industrial Storage/Office, Automotive
Global: Tier 2 Thailand (entered 1980s) Malaysia (entered 1970s)
Computers/Storage Computers, Consumer
Global: Tier 1 China
3C, All
ODM Design and NPD Computers Communications Consumer Electronics
Taiwan USA
Global Lead Firm (OBM)
Global brand owners; marketing, branding and manufacturing (for some)
EU-15, USA, Japan, South Korea
Automotive (Germany, Japan) Medical (UK) Industrial (EU, USA) A&D (USA) Communications (All) Consumer Electronics (Japan, South Korea, China) Computers/Office Equipment (USA, Taiwan/China, Japan)
Source: Authors; based on trade data, market reports, and global locations of top Tier 1/EMS/ODM companies. While electronics assembly operations have become the purview of low-cost contract manufacturers headquartered mostly in Asia, components supply is still controlled more so by developed country firms. The world's largest electronic component companies tend to be headquartered in the US, Japan, South Korea, Taiwan and countries in Western Europe with manufacturing facilities in low-cost countries (such as China). In some cases these facilities are owned by the parent company and sometimes they are set up as joint ventures. In addition to manufacturing in-house, many companies outsource some of their production (particularly assembly and test activities) to contract manufacturers also located in low-cost countries (called SATS). This is particularly characteristic in the semiconductor production segment.

The Philippines in the Electronics & Electrical Global Value Chain
28
Semiconductors, including discretes, integrated circuits, and optoelectronics, are among the most technologically advanced and expensive component products in electronic products. Given the technological importance and value of the semiconductors in the cost of electronics, semiconductor companies often deal directly with lead firms and work in conjunction with them on the R&D and new product develop of final products (and in some cases lead firms have IC and final product divisions). Top semiconductor companies are listed in Table 8. Table 8. Top 10 Semiconductor Firms by Revenue, 2010 & 2014
Firm Headquarters Revenue (US$, billions) 2010 2012 2013 2014
Intel USA 40.0 49.1 48.3 51.4 Samsung Electronics South Korea 28.1 32.3 34.4 37.8 TSMC Taiwan -- 17.0 19.9 25.0 Qualcomm USA (San Diego, CA) 7.2 13.2 17.2 19.3 Micron Technology (acquired Elpida in 2012) USA (Boise, ID) 8.9 7.9 14.4 16.7 Hynix Semiconductor South Korea 10.6 9.1 13.0 16.3 Texas Instruments* USA (Dallas, TX) 13.0 12.1 11.5 12.2 Toshiba Japan 13.1 11.2 12.0 11.0 Broadcom (acquired by Avago Technologies 2015/16) USA/Singapore -- 7.8 8.2 8.4 STMicroelectronics* Switzerland 10.3 8.4 8.0 7.4 Renesas Technology Japan 11.8 -- -- -- Elpida Memory Japan 6.9 -- -- -- Top 10 131.1 167.9 186.8 205.5
Sources: Zino (2011, 2015); Source’s sources: 2010: company reports; iSuppli; 2014: IC Insights. A (*) indicates the company has a facility in the Philippines. Additional maps and tables are provided here.
The electrical segment, which is a much smaller market than electronics components is dominated by a handful of global MNCs, including General Electric, Schneider Electric, ABB, Siemens, and Eaton (Table 9). Sales of electrical equipment are mostly business to business (B2B) as the primary end markets are include utility providers, construction/infrastructure builders, and large industrial manufacturers. The world market value of electrical components was US$281 billion (Table A-2). T&D component companies tend to also have divisions in passive electronic components or in industrial subassemblies/final products. The main buyers of electrical transmission and distribution equipment are utilities, large industrial power users, and construction (residential and commercial). Electric motors are purchased by the automotive industry, heating and cooling equipment companies, heavy machinery manufacturers, and a variety of other markets. Siemens, GE, ABB, and Emerson are also motor manufacturers.
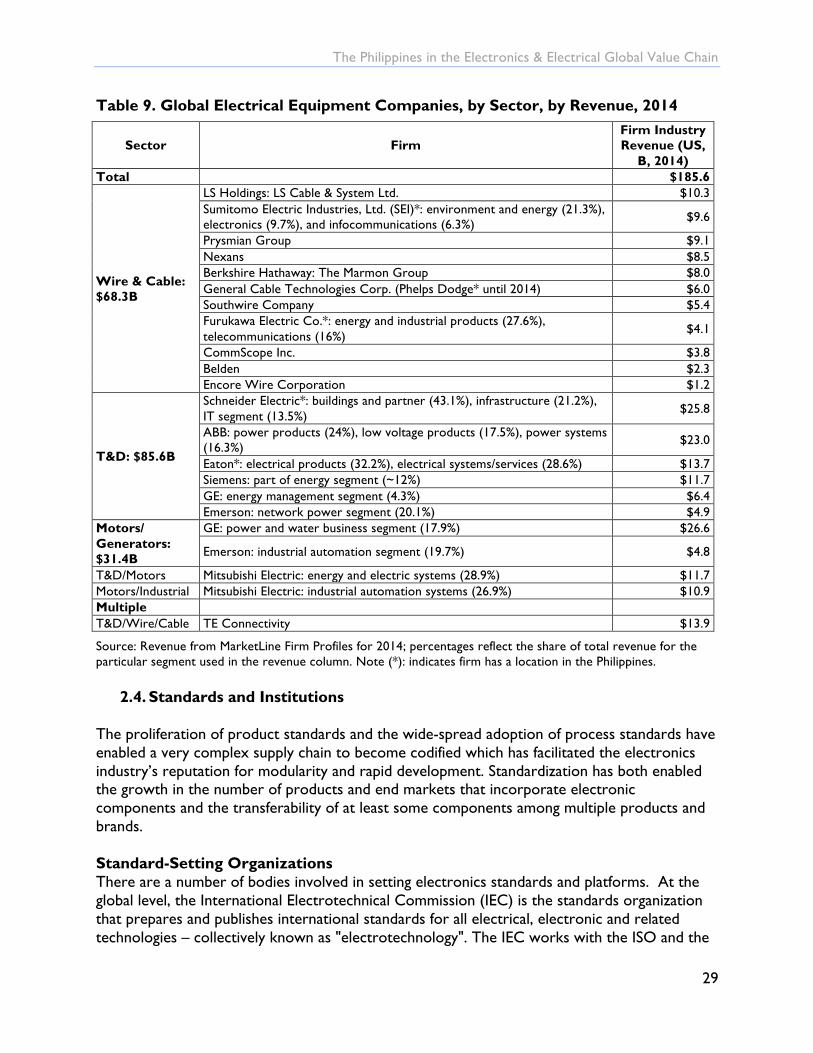
The Philippines in the Electronics & Electrical Global Value Chain
29
Table 9. Global Electrical Equipment Companies, by Sector, by Revenue, 2014
Sector Firm Firm Industry Revenue (US,
B, 2014) Total $185.6
Wire & Cable: $68.3B
LS Holdings: LS Cable & System Ltd. $10.3 Sumitomo Electric Industries, Ltd. (SEI)*: environment and energy (21.3%), electronics (9.7%), and infocommunications (6.3%) $9.6
Prysmian Group $9.1 Nexans $8.5 Berkshire Hathaway: The Marmon Group $8.0 General Cable Technologies Corp. (Phelps Dodge* until 2014) $6.0 Southwire Company $5.4 Furukawa Electric Co.*: energy and industrial products (27.6%), telecommunications (16%) $4.1
CommScope Inc. $3.8 Belden $2.3 Encore Wire Corporation $1.2
T&D: $85.6B
Schneider Electric*: buildings and partner (43.1%), infrastructure (21.2%), IT segment (13.5%) $25.8
ABB: power products (24%), low voltage products (17.5%), power systems (16.3%) $23.0
Eaton*: electrical products (32.2%), electrical systems/services (28.6%) $13.7 Siemens: part of energy segment (~12%) $11.7 GE: energy management segment (4.3%) $6.4 Emerson: network power segment (20.1%) $4.9
Motors/ Generators: $31.4B
GE: power and water business segment (17.9%) $26.6
Emerson: industrial automation segment (19.7%) $4.8
T&D/Motors Mitsubishi Electric: energy and electric systems (28.9%) $11.7 Motors/Industrial Mitsubishi Electric: industrial automation systems (26.9%) $10.9 Multiple T&D/Wire/Cable TE Connectivity $13.9
Source: Revenue from MarketLine Firm Profiles for 2014; percentages reflect the share of total revenue for the particular segment used in the revenue column. Note (*): indicates firm has a location in the Philippines.
2.4. Standards and Institutions The proliferation of product standards and the wide-spread adoption of process standards have enabled a very complex supply chain to become codified which has facilitated the electronics industry’s reputation for modularity and rapid development. Standardization has both enabled the growth in the number of products and end markets that incorporate electronic components and the transferability of at least some components among multiple products and brands. Standard-Setting Organizations There are a number of bodies involved in setting electronics standards and platforms. At the global level, the International Electrotechnical Commission (IEC) is the standards organization that prepares and publishes international standards for all electrical, electronic and related technologies – collectively known as "electrotechnology". The IEC works with the ISO and the

The Philippines in the Electronics & Electrical Global Value Chain
30
International Telecommunications Union (ITU), in some cases developing joint standards. The IEC is composed of one national committee per country. These members help develop the standards as well as conformity assessments. Process Standards Quality standards are very important in the electronics and electrical equipment industries and the ability to manufacture with low defect rates and quick turnaround times are necessities. Resultantly, maintaining certifications for international standards is of the utmost importance. Certification is important for firms throughout the supply chain from component suppliers to final product manufacturers. The ISO 9000 family of standards covers quality management systems and how products are produced rather than the product itself. These standards provide guidance and tools for firms who want to ensure that their products and services consistently meet customer requirements, and that quality is consistently improved. ISO standards are published by the International Organization for Standardization (ISO) and are available through national standard bodies (in the Philippines, this group is the Bureau of Product Standards within the Department of Trade and Industry). Companies are certified through accredited certification organizations (e.g., SGS Philippines) and must renew the certification at regular intervals, typically every three years. ISO 9001 was first released in 1987, and has been through four versions with 2008 being the most recent. All requirements are generic and intended to apply to all organizations, regardless of size, industry, or products provided. Most E&E companies obtain an ISO 9001 certification. Several industries have more specific quality management standards that expand on ISO 9001 to cater to their market’s needs, many of which are applicable to electronic and electrical product manufacturers. Lead firms often require suppliers to be certified, and firms wishing to sell into multiple end markets must obtain certifications for each industry. In some cases, these certification requirements can be a constraint or even a barrier to entry for new firms, SMEs, or those in developing countries due to the costs required to meet the qualifications of the standard and to become and maintain certification. Given the critical nature of products for the automotive, A&D, and medical markets, quality requirements are more stringent than those for consumer electronics. Tier 1 and EMS providers are required to get industry-specific certifications and ensure the latest version is implemented. Beyond quality management, there are several other ISO standards that pertain to maintaining operational or environmental efficiencies. The most common is the ISO 14000 family of standards which focuses on environmental management and helps companies minimize their environmental impact. For capital-intensive manufacturing, ISO 50001 is important to ensure energy efficiency. Table 10 provides a list of the main standards and certifications relevant for the electronics and electrical industries.

The Philippines in the Electronics & Electrical Global Value Chain
31
Table 10. Important Standards in the Electronics and Electrical GVC
Standard Description Certification/
Audit Frequency
End Markets
Quality Management ISO 9001 Industry neutral standard Valid: 3 years All
ISO/TS 16949: 2009
Combines ISO 9001 with automotive-specific (including motorcycles) requirements agreed upon by the major automotive manufacturers. EMS providers are required to be certified.
Valid: 3 years Audits: annual
Automotive
ISO 13485 Specific to the medical device industry; unlike the automotive standard, is not an addendum to ISO 9001.
Medical
ISO/IEC 17025: 2005 Certification would signal functional upgrading to service activities.
Testing and Calibration Laboratories
AS 9000 Specific for the aerospace industry and developed by major manufacturers. Aerospace
TL 9000
Specific to the telecommunications industry; developed by the telecom industry group QuEST Forum. It also includes standardized product measurements for benchmarking.
Telecommunications
Federal Aviation Association (FAA) Certification Requirement in MRO Aerospace: MRO
Certifications are often country-specific Military Business Operations/Environment
ISO 50001:2011 Improvement of energy performance, including energy efficiency, energy use and consumption.
Valid: 3 years All (Energy Management)
ISO 14000 Valid: 3 years Audits: annual
All (Environmental Management)
RoHS Impacts sales to the EU market All WEEE Impacts sales to the EU market All
Sources: Aerospace: Ravikrishan (2014); Automotive: Reghu (2015) Product and Environmental Standards There are numerous product standards for the E&E industry, most of which can be found on the IEC’s database of standards. Adoption of IEC standards is voluntary, although they are often referenced in national laws or regulations around the world. There are also environmental standards and waste regulations for electronics and electrical products in many countries, particularly in the EU market. Since late 2006, products sold in the EU must comply with the Restriction of Hazardous Substances (RoHS) Directive 2002/95/EC (and now also RoHS Directive 2011/65/EU (RoHS2), effective January 2013) which restricts the use of six heavy metals (lead, mercury, cadmium, hexavalent chromium, and other flame retardant materials) found in electrical and electronic products. The EU also promotes collection and recycling of electronic equipment under the Waste from Electrical and Electronic Equipment (WEEE) Directive 2002/96/EC. All applicable products in the EU market must pass

The Philippines in the Electronics & Electrical Global Value Chain
32
WEEE compliance and carry the "Wheelie Bin" sticker. WEEE encourages manufacturers to design electronic products with end of life recycling and recovery in mind. RoHS assists in this process by requiring the use of safer materials via restricting the amount of hazardous chemicals (European Commisson, 2015). Tariffs and Trade Agreements Import tariffs for electronics and electrical products tend to be low due to the WTO Information Technology Agreement (ITA). The ITA was reached through a “Ministerial Declaration on Trade in Information Technology Products”, at the first WTO Ministerial Conference, held in Singapore in December 1996. The original ITA had 29 participants, however the number has grown to 81, representing about 97% of world trade in IT products. The ITA requires each participant to eliminate and bind customs duties at zero for all products specified. During 2015, the ITA was expanded to cover an additional 201 products. At the time of writing, 54 members have agreed to the expansion, covering 90% of world trade in IT products. Participants must develop a schedule to eliminate tariffs on the majority of the new products over the course of three years (2016-2018) (WTO, 2016a).13 Another objective of the ITA is to eliminate non-tariff barriers (NTBs) in IT trade (WTO, 2016b). As such, free trade agreements (FTAs) are not widely used by firms in the electric machinery industry in Asia compared to other manufacturing industries. According to JETRO’s last survey of Japanese-affiliated firms in Asia, the proportion of firms utilizing FTAs in electrical machinery was one of the lowest at 33.5% (97 of 290 companies).14 Motor vehicles was the second highest after textiles at 59.5% (JETRO, 2014).
2.5. Human Capital and Workforce Development The majority of workers in E&E manufacturing establishments are production workers including operators and technicians. Workers at these levels typically have at least primary education as well as secondary education and some additional technical/vocational school at the technician level. Non-production workers include research scientists, product developers, process developers, managers, supervisors, and other administrative staff. These employees typically have a four-year university degree in engineering or a business administration field. Firms employ a range of engineers that focus on various aspects of process and product development, including process and systems engineers, component and machine design, field applications, and quality control.15 The highest level workers are scientists who engage in research related to theory and conceptually development new ideas for technologies that will enable new processes and products. Scientists typically have a Doctor of Philosophy (PhD) in basic sciences, engineering, or a degree that combines aspects of the two. After an idea is generated, product developers
13 Participants: https://www.wto.org/english/tratop_e/inftec_e/itscheds_e.htm (includes all top importers and exporters except Mexico). 14 Only firms engaged in export/import were included. 15 This section draws on fieldwork conducted on the E&E industry as part of this project, and two previous studies (Frederick & Gereffi, 2013; Metha & Frederick, 2015)

The Philippines in the Electronics & Electrical Global Value Chain
33
with a strong background in engineering principles work to create a new or improved product or prototype. Product developers have a Master of Science (M.S.) degree in an engineering-related field, or a Bachelor of Science (B.S.) combined with many years of experience in the field. Process developers look at the results of current operations and experiments to determine how production can be modified to improve productivity and reduce cost. These activities are more repetitive and less innovative than product development, and positions are typically held by someone with a B.S. in engineering. Related to process development, mechanical engineers are also involved in areas related to manufacturing equipment. Industrial engineers are often involved in activities related to inventory and supply chain management. Employees with a background in business are engaged in scheduling, procurement, marketing, and other administrative roles. Table 11 provides the typical workforce profile of an electronics or electrical manufacturing firm. The most common engineering degrees vary by company, but popular fields include electrical or electronic, mechanical, and industrial. Increasingly firms are looking for employees that have cross-disciplinary skills across two or more fields within engineering (e.g., electromechanical, industrial design) or more often in engineering and business. These positions are particularly important in areas where employees need to be able to communicate the benefits of their technology in a way that someone outside of the engineering field can understand such as customers, investors, and government officials. Similarly, employees with these qualifications are also well-suited for management positions or to start their own companies. Technology management degree programs are gaining in popularity where coursework is divided between business classes and a specific scientific or industrial area. A different workforce profile is required for firms to move beyond manufacturing into sourcing, distribution, and sales. Employees include production-level workers in distribution centers, receiving, and shipping, and university-level employees in fields related to business management to work in procurement, supply chain management, and sourcing. To move into technical research, design, and product development, advanced science, engineering, and analytical skills are needed; for marketing, branding, and retail, workers need soft skills related to communication and business development. Growing and advancing to higher value-added activities in E&E requires a large supply of workers with sufficient technical skills to cover the full range of key supply chain functions.
Table 11. Employee Profile for the Electronics and Electrical Value Chain Position Share Education Job Characteristics
Operators 30% Mostly primary education Production line workers; majority of training is on the job
Technicians 50% Secondary education, technical high school, vocational training
Some specific technical or industry-specific skills required
Engineers 14% Tertiary; university degree in engineering
Process engineering; systems optimization, quality control
Administrative 6% Tertiary; university degree in business Sales, finance, customer service, supervisors, management
Source: Frederick and Gereffi (2013); based on field research in Costa Rica and secondary information.

The Philippines in the Electronics & Electrical Global Value Chain
34
Given the capital-intensive nature of this industry, labor/wages account for a relatively small share of industry costs. The average estimate for labor costs is 12%, with material costs making up the bulk of expenses at an average of 65% (IBISWorld, 2015b, 2015c, 2015d; JETRO, 2014). Labor costs have fallen as a percentage of revenue since 2010 due to the standardization of components, improved supply chain management, increased use of automation, and the transfer of production from high-wage to low-wage countries.
2.6. Upgrading Trajectories in the Electronics & Electrical Equipment GVC Upgrading is broadly defined as moving to higher-value activities in GVCs to increase the benefits (e.g. security, profits, skill, technology or knowledge transfer) from participating in global production. Upgrading can take place in many forms; firms can make better products, make them more efficiently, take on more manufacturing stages, move into more skill-intensive activities, or change who products are made for. Countries often initially compete by performing labor-intensive work at low costs, however rising labor costs will eventually cause much of this low-value work to shift to a cheaper location, and the economy will need to transition to higher-value activities to differentiate itself and continue growth. The following presents each type of upgrading in the E&E industry.
1. Pure Process Upgrading Machinery: Given the rapid development of new products and process technologies, investment in new machinery and equipment is essential to remaining competitive. Indicators of process upgrading include purchases of new capital equipment and software. This is especially true for companies in the semiconductor and integrated circuit segments of the chain. Manufacturing Capabilities: Each stage of the value chain includes a series of manufacturing-related activities a firm engages in to produce the product. For example, steps required to make electrical components may include molding, stamping, finishing, and assembly. These activities can be performed in-house, or by subcontractors that perform a portion of the activities on behalf of another firm. The firms carrying out these operations can be foreign-owned firms that establish an operation in a host country, or domestic firms can emerge to provide these services. For multinational electronics companies (characteristic of many of those in Philippines) that have branch plants in several countries, a sign of process upgrading is increasing number of activities in manufacturing process performed in the same facility. For example, in Costa Rica, several firms have slowly moved operations that were performed at other global locations owned by the parent company to their manufacturing facilities in Costa Rica. To a lesser extent, subcontractors (both foreign and locally-owned) have emerged that are capable of performing these additional tasks (Frederick & Gereffi, 2013). Within the EMS segment, firms often start in PCB assembly (or in some cases IC A&T activities) and move into “box build” which also includes putting the assembled PCB into a housing/enclosure to create a finished subassembly. This requires adding capabilities to produce plastic/metal inputs or having access and financial capabilities to purchase them.

The Philippines in the Electronics & Electrical Global Value Chain
35
2. Product & Process Upgrading
Production Model: One example is shifting to products that require a ‘‘high mix, low volume’’ production model, which refers to manufacturing several products in low and medium quantities rather than mass producing one type. Reduced economies of scale are generally compensated by higher margins (i.e., they make fewer units overall, but the price per unit is higher). Firms operating under this model manufacture several types of E&E goods and components for multiple clients or end markets. Firms using this strategy focus on product variety, which often requires more interaction with clients and their other suppliers to address specific needs. Given the increased number of interactions with clients, the management aspects of the business, such as marketing, program, and materials management, become more important. This can provide an avenue for firms to gain valuable production and business development skills if customer relationships are maintained at the plant level rather than a head office in another country. Under this model, the HR and training aspects can also be more complex as line workers often need to be adept at multiple skills and able to engage in job rotation. Firms must also have the ability to modify their product lines and layout regularly. In Guadalajara, Mexico, existing firms took the following steps to shift to this business model. First, new systems were developed to configure and customize products for small orders. This required an increase in the number of engineers employed at the companies. Second, inflexible tooling dedicated to a single product was replaced with “soft tooling.” This led to less automation and greater labor intensity and worker skills, especially in final assembly. Lastly, due to the increased diversity and complexity of products, new systems were needed to maintain product quality (Sturgeon & Kawakami, 2010).
3. End Market Upgrading Geographic: Regional supplier countries have existed for decades for the US and EU markets due to FTAs, the desire to protect upstream industries, cultural similarities, and the drive to reduce lead times. Given the growth in final product demand in Asia, particularly from China, interest in establishing regional value chain networks for the Asian consumer market is increasing. Identifying and targeting FDI that focuses on selling to the Asian market or cultivating the development of domestic firms to sell into the Asian market are two possibilities to increase sales via end market upgrading. Industry: As an increasing number of products incorporate electronic components, new market segments (e.g., medical, aerospace, defense) are continually emerging that require lower volume, more specialized goods and components that might offer large profit margins. In this type of upgrading, firms still carry out the same type of activities in the value chain, but sell them to new customers that incorporate the product into different final products. Competition is less intense in these markets as many of the lead firms still produce their goods in-house and do not have long standing relationships with contract manufacturers as is the case in consumer electronics and computers. However, some of these products have strict, industry-specific standards, so entrance into these end markets will require firms to meet and maintain certifications for each end market they sell to. Companies that want to add electronic functionality to traditionally non-electronic products, are less likely to possess the technical or

The Philippines in the Electronics & Electrical Global Value Chain
36
design expertise needed to integrate electronic components, therefore providing new opportunities for contract manufacturers to provide domain expertise related to manufacturing.
4. Functional Upgrading Moving into Higher Value Functions: Functional upgrading is the movement into new value-adding activities in the chain, and typically represents a shift from production-related activities to ‘intangible activities’ such as distribution, sourcing, design, product development, R&D, marketing and sales. It can be viewed from the perspective of performing these functions on behalf of the entire value chain and thus represents the stages to becoming a lead firm, or it can represent increasing the range of value-adding activities performed by a single firm in one stage of the value chain or within a country. The first shift is typically when a firm moves from assembling imported inputs (e.g. basic contract manufacturer), to taking on the responsibility of sourcing the components and distributing products to the next stage in the supply chain rather than shipping products back to the parent company. Beyond manufacturing and logistics activities, the next steps entail engaging in product and process design and engineering (upgrading to become an ODM firm), and finally working on research and new product development, marketing and sales (i.e. joining the ranks of lead firms).16 Functional upgrading requires acquiring new technology and knowledge-intensive capabilities and thus represents a more sustainable competitive edge than advantages related to low labor costs, geographical proximity, or favorable trade agreements. Moving into these more intangible activities is a big step however, and many firms will never make this shift due to differences in the required workforce skills or limitations due to MNC production network configurations. The shift from manufacturing to ODM has largely been limited to the computer (particularly the personal computer segment), and to a less extent the other “3C” end markets. For example, it is estimated that 90% of notebook computers are produced under the ODM model (Pawlicki, 2016). Entry-level/low-cost products are perceived by lead firms as an area in which product design can be outsourced in addition to manufacturing. This allows lead firms to focus leading edge products with higher profit margins and technological leadership opportunities.
Developing Backward Linkages: This includes deepening value chain participation by adding capabilities in a previous stage of the value chain. For example, industry-specific backward linkages in the electronics components industry include developing capabilities in the provision of direct raw material inputs (e.g., metals, chemicals, plastic) or outputs. This upgrading trajectory allows countries to add value to a particular primary sector and increase employment gains by operating in two consecutive stages of the value chain. In the electronics sector, follow sourcing has become a key way of driving backward linkages. In order to maintain the quick supply chain cycles for electronic products, final product manufacturers benefit from
16 The introduction of ODM firms in the PC sector is a noticeable examples of functional upgrading. Contract manufacturers have moved from merely assembling final products on behalf of lead firms, to distributing the final products to the ultimate buyers, handling sourcing and financing of components, and in a few cases providing after sale services in the case of EMS providers to even providing design and new product development in the case of ODM firms in the PC market. Firms engaged in these activities have increasing levels of control over the entire value chain, but their power is still limited by lead firms who control the most valuable activities in the chain.

The Philippines in the Electronics & Electrical Global Value Chain
37
having local component suppliers. For example, when Foxconn set up a plant in San Jerónimo Mexico, it created a magnet for E&E component suppliers to set up in nearby areas (Robinson-Avila, 2011). Countries can also use this to increase integration of domestic firms into the GVC by linking them to large foreign firms. Table 12. Types of Upgrading in the Electronics Value Chain
Upgrading Type Description
Functional
Final product manufacturers acquire responsibility for more value-adding activities; a switch from manufacturer to service provider often occurs over time: Categories: Assembly!EMS!ODM!Lead Firm Activities: Assembly!Sourcing/Distribution!Development/Design!Marketing
Linkages (Manufacturing-Related)
Establish backward (or forward) manufacturing linkages within the supply chain; related to vertical integration: Inputs !Components! Subassemblies! Final Products
End Market
Market diversification: serving new buyers or markets often in emerging domestic or regional markets (new geographic destinations or distribution/market channels) Geographic: exporting only to the US and now to Mexico as well Market Sector: consumer electronics to medical
Product Shift to customized products, use of higher quality inputs, or other additions that increase the value of the product or otherwise provide a competitive edge
Process Reduce cost, increase productivity and improve flexibility by investing in new or better machinery or logistics technology. Specific steps within a stage (for example, components): Assembly!Metal Fabrication!Stamping!Finishing!Testing
Source: Frederick and Gereffi (2013) 3. Lessons from Other Countries In order to help define the potential upgrading strategies for the Philippines, the experiences of other developing countries is examined. Malaysia was chosen given its similar beginning in the E&E industry as the Philippines in timeframe (1970s), focus on A&T in the semiconductor segment, and dominance of FDI and exports in development. Malaysia has taken a different approach in the last decade by trying to establish backward linkages into wafer fabrication while also promoting functional upgrading into IC design. Whereas the country has made some progress in these areas, the amount invested by the country to purse these upgrades has been significant. Malaysia’s experience provides a valuable cautionary lesson on the difficulty into moving into these segments. Vietnam was chosen given the country’s rapid entry in the E&E industry – the country entered the industry in 2007, but exports have already surpassed those of the Philippines. Whereas the export profile of the Philippines is different from Vietnam, the country is still a competitive threat in recruiting future FDI due its similar advantages to the Philippines in terms of incentives and workforce (availability and cost) and the bonus of being geographically close and connected to China. Table 13. Comparison of E&E Industry in ASEAN countries Malaysia Vietnam Thailand Firms 1,695 (2009) 2,485 (2013) Employees 336,408 (2009) 284,508 (2013) 600,000 (2015) E&E Exports (Billions) US$83 (2014) $26 (2012) US$56 (2014) Promoting IC Fabs, R&D & Design, Solar Mobile HDD, RFID, Auto electronics
Sources: Malaysia MGCC (2012); Thailand Thailand BOI (2015); exports UNComtrade (2015a)

The Philippines in the Electronics & Electrical Global Value Chain
38
3.1. Malaysia
Malaysia’s E&E exports in 2014 were US$83 billion, accounting for 3% of world E&E (UNComtrade, 2015a) and 44% of Malaysia’s total manufactured exports (MATRADE, 2014). In the 1970s, which marked a policy shift to export-oriented industrialization in in the country, Malaysia launched its industry by attracting some of the major chip assembly firms including Intel, On Semiconductor, Infineon, STMicroelectronics, and Texas Instruments (Rasiah, 2015). Nearly 85% of the total realized investment in Malaysia’s E&E industry, estimated at US$49 billion in 2013, has come from foreign firms (Tong, 2014). While MNCs have dominated the industry, local companies participating in MNC supply chains have been developing competencies in research, design, and development. To promote functional upgrading, the Malaysian government has supported industry partnerships by providing grants, which have mainly focused on promoting university-industry linkages since 2012 (Dutta et al., 2015). Overall, the E&E industry in Malaysia is classified into four subcategories: consumer electronics, electronic components, industrial electronics, and electrical (Table 14). Although the structure of the industry has been dynamic over time, semiconductor assembly has been the main product category, accounting for 30-50% of the E&E industry’s output over 1990-2013 (Rasiah, 2015). The majority of activity in this category is in semiconductor A&T, however in the last decade, a few wafer fabrication and chip design firms have invested in the country.
Table 14. Structure of Malaysia's E&E Industry Industry Subcategory Example of Products (Export Share, 1996, 2006)
Electronics
Components Semiconductors, passive components, PCBs, metal stamped parts and precision plastics parts (54%, 38%)
Consumer Audio video products such as TV receivers, infotainment products, speakers, cameras and electronics games (25%, 10%)
Industrial Multimedia and information technology products such as computers and computer peripherals; telecommunications equipment; office equipment; and box built products for industrial applications (10%, 41%)
Electrical Electrical Distribution boards, control panels, switching apparatus, lightings, transformers, cables and wires, primary cells and batteries, solar cells and modules, air conditioners, household appliances (11%, 11%)
Sources: MIDA (2006, 2015) Moving forward, the country wants to deepen and strengthen within semiconductors (ICs, solar and light emitting diodes (LED) technologies) (MIDA, 2014). Within solar, Malaysia has attracted some photovoltaic manufacturing plants; these firms include AUO Crystal (wafers), AUO - Sunpower (cells), Hanwha Q-Cells Malaysia (cells), First Solar Malaysia (thin-film and solar modules), and Panasonic Energy Malaysia (MIDA, 2015). Development: Initiated to supply the domestic market with final consumer goods, Malaysia’s E&E industry grew rapidly in the 1970s when the country switched to export-oriented industrialization. During the 1970s and 1980s, the industry experienced two major development waves phases that mainly relied on labor-intensive assembly and processing operations (Rasiah,

The Philippines in the Electronics & Electrical Global Value Chain
39
2015). The E&E industry started in 1965 when Matsushita Electric established operations to assemble consumer electronic appliances (Rasiah et al., 2014). Rapid growth in production and exports began after the country received the first wave of FDI. Beginning in the 1970s, MNCs relocated low-wage assembly operations to Free Trade Zones (FTZs) and Licensed Manufacturing Warehouses (LMWs). Clarion and National Semiconductor were the pioneer firms; both built factories in Bayan Lepas, Penang in 1971 (Rasiah, 2015). By the mid-1970s, a number of MNCs including Intel, Advanced Micro Devices, Texas Instruments, Hitachi, Motorola, HP, and Siemens had relocated chip assembly operations in Malaysia (Rasiah, 2015). During this period, consumer electronics was the main output, followed by computer-related equipment. Building on a decade of production experience, Malaysia began receiving the second major wave of exported-oriented FDI from the relocation of low-wage E&E operations from the Asian economies, led by Japan, South Korea, Taiwan, Hong Kong in the 1980s (Rasiah, 2015). During the 1980s and 1990s, sourcing strategies of MNCs have strongly shaped development of the local E&E industry in Malaysia (Giroud, 2000). In a competitive market, MNC sourcing requirements in terms of high precision and quality control have built the capabilities of local contract suppliers. Besides the E&E industry participants, firms in the supporting industries also took advantage of the emerging local market driven by demand from the E&E industry. These firms specialized in auto-precision and precision engineering, plastic mold and parts fabrication, precision plastic molding products, plastic extrusion products, tooling, die making, and packaging (Giroud, 2000). MIDA (2006) summarized the local development impact of MNC sourcing strategies in four major areas: 1) provided a training ground for local engineers and an incubating platform for local startups supplying parts and components; 2) helped local firms to upgrade and own their brands of consumer E&E products; 3) created a sizeable local market for E&E components and supporting industries; and 4) fostered partnership opportunities with local firms and public research institutions through R&D collaboration. In the 1990s semiconductor firms began to introduce some early aspects of R&D, with a focus on modifications, and production and organizational restructuring (Rasiah, 2015). Since the 2000s, five wafer fabs have been set up in Malaysia (two discrete, one analog, and two small foundries). Software activities related to chip design, which can take place in isolation and geographically distant from wafer fabrication, have not emerged in Malaysia due to a limited supply of human capital, particularly information technology specialists Malaysia (Rasiah, 2015). During this period, foreign ownership has also continued to fall in the E&E industry with the emergence of more attractive manufacturing sites for labor-intensive operations in China and Vietnam. A combination of slow functional upgrading and the lack of human capital have been documented as the prime reasons for a contraction of output and exports in Malaysia’s E&E industry in the early 2000s (Mahadevan & Ibrahim, 2007; Rasiah, 2010). Local E&E firms in Malaysia have focused more on process innovation than functional upgrading and/or product innovation. Local contract suppliers were involved in improving process technology to fulfill the requirements of their MNC customers. The provision of grants to foreign firms starting in 2005 has helped stimulate some functional upgrading in to chip design and R&D support activities and backward linkages to wafer fabrication. These grants helped attract Intel (chip design); Infineon, Osram, ON

The Philippines in the Electronics & Electrical Global Value Chain
40
Semiconductor, and X-Fab (wafer fabrication); and Renesas, Motorola, Alterra, Advanced Micro Devices, and Fairchild (R&D support activities) (Rasiah et al., 2014). The number of semiconductor firms in chip design and wafer fabrication increased from zero in 1999 to 11 in 2014 (Rasiah, 2015). However, upgrading initiatives have remained confined to these firms with limited linkages to national R&D organizations and universities. Due to human capital constraints, no firms participate in R&D activities associated with miniaturization or enlargement of wafer diameter, which are the two key dimensions of frontier technology for semiconductor chips (Rasiah, 2015). Product and process upgrading have been more prevalent over the last decade as factories have moved from high-volume, low-mix to high-mix, low-volume operations to stay competitive. Policy: Government policy has played an important role in the development of Malaysia’s E&E industry, and over time, the scope of policy interventions has progressively expanded. From a liberal framework focused on business environment and investment promotion activities, the government has increasingly played a more direct role through provision of grants to entice partnerships in R&D, design, and wafer fabrication (Rasiah, 2015). During the 1970s to mid-1980s, the Malaysian government supported development of FTZs and LMWs which featured strong basic infrastructure and consistent promotion incentives, tax holidays, and investment tax credits for a period of five years, which were renewable for another five year term (Rasiah, 2015). In addition, the Malaysian government proactively approached potential investors among MNCs from the United States, Japan, and Europe to relocate in Malaysia. A major policy shift occurred in 1986 when the government introduced tax incentives for participation in training and R&D activities (Rasiah, 2015). Support for workforce developed was triggered by the second wave of FDI which resulted in the rising demand for statistical and cognitive skills. Companies faced wage spirals as they were fiercely competing for technicians and engineers. In response, the provincial government in Penang together with the industry stakeholders established the specialized workforce development centers, Penang Skill Development Centre (PSDC) in 1989, and Selangor Human Resource Development Centre (SHRDC) in 1992. These early efforts in Penang were followed by a more institutionalized framework at the national level to support training through the enactment of the Human Resource Development Act in 1992, which provided tax incentives to cover approved training expenses in the manufacturing sector. In addition, the government introduced matching grants in 1991 to support R&D activities in the E&E industry. However the matching grant program remained restricted to supporting local firms until 2005. These policies proved successful in creating employment opportunities, but they did not stimulate functional upgrading. To address collective action problems in stimulating R&D and upgrading, the Malaysian government launched intermediary institutions. As an agency of Ministry of Science, Technology and Innovation (MOSTI), the Malaysian Institute of Microelectronics Systems (MIMOS) was established in 1985, corporatized in 1990s and appointed as the Secretariat to the National Information Technology Council, chaired by the Prime Minister. Silterra, originally Wafer Technology Malaysia, was established within MIMOS in 1995 and later launched its operations at Kulim High Tech Park in 2000 (Rasiah, 2015). Although the creation of Silterra offered the opportunity to leapfrog the technological ladder into wafer fabrication, lack of industry leadership and human capital challenges denied

The Philippines in the Electronics & Electrical Global Value Chain
41
integration of more knowledge-intensive stages, such as chip design, and implant activities. MIMOS then extended the provision of matching grants to foreign firms in 2005 with the purpose of incentivizing investment in chip design and wafer fabrication (Rasiah, 2015). Established in 2012, the Collaborative Research in Engineering, Science & Technology (CREST) is a key matching grant program set up by government to stimulate public-private initiatives in the E&E industry (Dutta et al., 2015). CREST focuses on bringing together stakeholders from industry, academia, and government for collaborative R&D, talent development, and commercialization. It is the first research grant provider that targets only those R&D projects that drive university-industry linkages in Malaysia’s E&E industry. By providing R&D grants, CREST promotes and facilitates partnerships in market-driven research. Since 2012, CREST has approved 74 projects through matching grants. CREST aims to commercialize 61 intellectual properties by 2018, and produce 299 research publications, 89 Master’s, and 32 Doctoral degree graduates (Dutta et al., 2015).
3.2. Vietnam17 Vietnam is an important case study for the Philippines because they are a threat for the relocation of current FDI and future FDI, particularly in labor-intensive sectors. Furthermore, the government is offering attractive investment incentives (Intel received a four-year corporate tax holiday followed by nine years at only 50% of the standard corporate tax rate). The industry has primarily emerged since 2005, with the majority of growth in the last five years. Vietnam’s main advantages are low cost of labor, proximity to regional suppliers, and a relatively stable investment climate. The industry is dominated by branch plants of MNCs that primarily engage in manufacturing-related activities. Similar to most manufacturing-focused locations, soft skills are weak in Vietnam. Vietnam and the Philippines are different in that the industry in Vietnam is dominated by only a handful of firms. The main firms in Vietnam include Samsung (75,000 workers), Nokia/Microsoft (Microsoft acquired Nokia’s smartphone factory; 11,000 workers). In the EMS segment, Foxconn, Jabil, and Compal have manufacturing plants in the country, and in semiconductors, the main firm is Intel, which moved its A&T facility from the Philippines to Vietnam (operational in 2010). LG and Panasonic also have production facilities in northern parts of Vietnam for consumer appliances, but these products are heavy and difficult to transport, and thus are mainly for sale for the domestic market. In 2016, however, LG Display Group announced a second investment in Vietnam that will produce high-tech digital displays using LG’s organic LEDs (Nesbitt, 2016). The majority of exports are final products and specific parts (80%). Nearly all exports are in the communications end market, specifically mobile phones (~75%), followed by PCs and office equipment (printers). The country is not a significant exporter of components, but is an important exporter of wire harnesses with a similar export value to the Philippines.
17 This case study draws on information collected by Sturgeon & Zylberberg (2015) for a World Bank project on Vietnam’s Current and Future Role in the ICT GVC and trade data from UNComtrade (2015a).

The Philippines in the Electronics & Electrical Global Value Chain
42
Vietnam’s experiences with regard to backward linkages have been similar to the Philippines. Most inputs are imported; components purchased within Vietnam primarily come from foreign-owned firms while domestic firms only provided packaging. Samsung relies heavily on Korean suppliers that have followed the company to Vietnam to produce intermediate inputs for smartphones and tablets. Of the company’s 67 suppliers, only four are Vietnamese, all of which are in packaging. Intel has a similar situation with only 16 Vietnamese suppliers. Perhaps the most significant contributor to Vietnam’s growth in E&E exports is the country’s proximity and connection to China. As labor costs increase and buyers and manufacturers seek to diversity their supply base, Vietnam is a desirable option given its geographic physical proximity to China; a key supplier of E&E components as well as an important end market. Furthermore, upon implementation of the TPP, Vietnam will be required to adhere to structural adjustments, such as enhancing transportation, labor standards, and establishing a more competitive environment for state-owned businesses. Even though tariff benefits for the E&E value chain will likely be minimal given the already low levels on most E&E products, the economy-wide improvements the country will make in order to receive benefits in other industries will also benefit the E&E industry. Supporting Environment The Law on High Technologies was passed in 2008 with the aim of spurring development in high tech industries. These include new materials, ICT, biotechnology and automation. Companies that establish high-tech businesses are eligible for funding from a 1 trillion VND fund provided through the National Hi-Tech Development program. In return, companies must spend at least 1% of annual revenues on R&D activities in the country and at least 5% of the workforce conducting R&D projects must have at least a university degree. In order to qualify, 70% of a firm’s revenue must come from “high tech” products, which has been a limiting factor thus far as only 10 firms currently qualify. Similar to Malaysia, the Vietnamese government is also making a push to upgrade into semiconductor wafers and design. The Government plans to invest $300 million in a wafer fabrication facility. Perhaps more important than the wafer fab, in response to this, more than 15 institutions have begun to offer chip design courses that use global EDA software tools developed by global vendors such as Synopsys, Cadence, and Mentor Graphics. 4. The Philippines and the Electronics & Electrical Equipment Global Value Chain Electronic and electrical equipment have played an important role in the Philippine economy since the 1970s and continue to form the foundation of the country’s exports today. In 2014, these sectors accounted for 47% of total exports from the Philippines of which approximately 41% was from electronics and 6% from electrical. The export-oriented industry is an important source of employment and is characterized by large, labor-intensive operations. The 258 E&E firms operating out of the Philippines employ some 344,450 workers. These firms also tend to be branch plants of foreign MNCs, and E&E accounts for the majority of all FDI in the country.

The Philippines in the Electronics & Electrical Global Value Chain
43
While the sector is strong locally, globally the Philippines is still a relatively small contributor to the industry, accounting for just 1% of global E&E exports in 2014. The Philippines participates primarily in the component stage of the value chain; over two-thirds of exports and firms are in components. Within electronic components, integrated circuits, particularly assembly and testing (A&T) activities for analog semiconductors, is the main area. The Philippines is best known globally for its activities in this area, accounting for 2.8% of global IC exports in 2014. The largest final product category is storage devices and office equipment and in electrical equipment, transformers and switchgear are the main products. The Philippines is not a significant exporter of final electrical products such as consumer appliances, although there are a few firms producing for the domestic market. Despite an overall decline in export value since 2007 due to the drop in global demand during the global economic crisis which was then compounded by Intel leaving the country in 2009, growth in the last five years in exports and investment have been steady. Growth has also been driven from existing investments; compared to original investments, E&E firms account for a greater share of the expansions and new projects undertaken by firms in PEZA zones. The following sections examine how the industry has evolved, where in the value chain the country is currently positioned, and how it has upgraded over time. This leads to an analysis of these factors along with preliminary future directions for upgrading.
4.1. The Development of the E&E Industry in the Philippines
The E&E industry in the Philippines started with semiconductor assembly activities in the 1970s. In 1976, the industry employed around 5,000 people, but this quickly increased over the next decade reaching 47,000 by 1984. Since this early start, which really began with Intel’s investment in 1974, the sector has been driven primarily by foreign subsidiaries of semiconductor firms (Lohr, 1984). Early investments by multinational IC A&T sites were accompanied by contract A&T companies as well. This provided a pathway for some local firms to join the sector; by 1980 there were approximately 11 Philippine operations in the country (CS Monitor, 1980). In the 1990s and into the 2000s, these trends shifted and Japanese and to a lesser extent Korean investment began to dominate. Investments in other electronic components came later in the 1990s along with electrical equipment providers starting in the second half of the 1990s. Subassembly and final products companies have come in spurts –auto and storage companies came in the 1990s and office equipment companies recently emerged in the 2000s. EMS companies have come in two shifts; in the 1980s with a few new investments in the 2000s. In the past five years, the industry has continued to grow with 110 new investments between 2010 and 2015. Another positive sign is the low exit rate; with the exception of Intel, companies that have invested in the Philippines have stayed, with several operations dating back to the late 1970s and 1980s. Table 15 provides a snapshot of the evolution of the industry in the Philippines.

The Philippines in the Electronics & Electrical Global Value Chain
44
Table 15. Evolution of Electronic & Electrical Firms in the Philippines
Years Original PEZA
Investments
Share of All
Firms Origins Activities Electronic Electrical
1970-1974 -- -- Stanford Microsystems, Dynetics, Intel, PSI, Signetics (Philips, now NXP)
Panasonic Filipino USA IC A&T
1975-1979 -- --
Motorola (now ON Semiconductor), Texas Instruments, AMI, Fairchild, National Semiconductor, AMD, Amkor
Taiyo Yuden USA IC A&T
1980-1984 1 0% IMI, Analog Devices, Cirtek Electronics, Mitsumi, Fastech IC A&T
1985-1989 6 2% Ionics, ATEK, Tsukiden Sycwin IC SATS/EMS
1990-1994 21 6% Rohm, Fujitsu Ten, Tong Hsing, HGST, Glory
American Wire & Cable, Philflex
1995-1999 98 26% Toshiba, TDK, Nidec, Kyocera, Epson, Maxim
Schneider (American Power) Japan HDD
2000-2004 77 21% Sunpower, Cypress, PSi Korea Electronic 2005-2009 59 16% Cirtek, First Philec Filipino
2010-2015 110 30% Ricoh, Canon, Brother, Funai, Murata, Knowles, Microsemi
Eaton Japan, USA
Office equipment
Total 372
Source: PEZA (2015); Philippines Electronics Firms (2016); BOI (2015)
4.2. Philippine Current Participation in the Electronics & Electrical Global Value Chain
This section provides an overview of the Philippines current footprint in the GVC, describing the main firms by segment (origin, size, entry year, etc.), employment/workforce characteristics, export destinations, and backward linkages inputs (origin, cost). Firm Profile Estimates for the size of the E&E industry in the Philippines vary from 436 in 2010 (Philippines NSO, 2013), to 420 electronics firms in 2014 (DTI, SPIK, et al., 2014).18 Based on firm-level data from PEZA, there are 372 companies in four E&E categories19 (PEZA, 2015), however, it is unclear how many of these firms are operating at a significant level within the chain. Firm-level export data therefore provides the best estimate; according to this data, approximately 258 companies exported over US$1 million in 2014 in electronic and electrical-related product
18 Industrial statistics are for all establishments based on the following PSIC 2009 codes: electronic components: C26120; electronic final products: C26200, C26300, C26400, C26513, C2817; electrical equipment: C2710, C2720, C2732, C2733, C2790, C2811; electrical final products: C2740, C2750, C28193, C28264. 19 Categories: Radio, TV and Communication Equipment and Apparatus, Electrical Machinery and Apparatus, N.E.C. (101 of 107 original investments included), Office, Accounting and Computing Machinery, and Medical, Precision and Optical Instruments, Watches and Clocks (only 8 of 51 original investments are included).

The Philippines in the Electronics & Electrical Global Value Chain
45
categories (PSA, 2007-2014).20 By category, there are 20 electronic component companies that account for all exports, 10 electrical equipment, and 25 subassembly/final product exporters (20 electronic and 5 electrical). As such there are approximately 55 firms responsible for the majority of exports in E&E with little to no overlap between categories.
The majority of firms and exports are in electronic components (Figure 2), of which most firms are engaged in semiconductor A&T activities. In subassemblies and final products, the export value of final products is higher, but there are about half as many firms responsible for these exports as compared to subassemblies. There are also about 75 manufacturers of final electrical products in the Philippines, but these firms primarily produce for the domestic market (two-thirds of output in 2010) (Philippines NSO, 2013). The total value of final product exports for consumer appliances and industrial electrical equipment in 2014 was only US$0.4 billion, less than 1% of the Philippines total exports. Given that the Philippines is not already an exporter of final goods in these electrical segments and the strengths of the country are not particularly aligned with a high volume production model, the discussion of these categories is minimal. Figure 2. Philippine Participation in the E&E Global Value Chain
Source: Author; based on Figure 1; Note: Values are total 2014 exports in category (US$, billions). The number of firms and shading is based on firms with exports >$1 million in segment in 2014. Boxes that are omitted or white are segments in which data is not available.
20 This is likely a close estimate as SEIPI has 264 member companies and claims to have all exporters. The threshold of US$1 million in industry-specific exports is used across all reports to enable the analysis to focus on only those firms that are truly participating in the sector.

The Philippines in the Electronics & Electrical Global Value Chain
46
Electronics firms in the Philippines tend to be manufacturing branch plants of foreign MNCs. Firms in this industry are large compared to the manufacturing industry as a whole in the Philippines. Approximately 80% of firms in E&E have over 20 employees compared to 29% for manufacturing overall (Philippines NSO, 2013). Foreign ownership dominates in E&E firms compared to manufacturing as a whole (72% for electronics; 30% for electrical compared to 18% for manufacturing). This is more the case for electronics than electrical companies. Japanese investors account for the largest portion of sectoral FDI, accounting for 43% of all electronic firms, followed by Korean 10% (Philippines NSO, 2013). Geographically, firms are clustered in two main areas: Calabarzon (42%) and Metro Manila (48%), with a few in Cebu (7%) and Northern/Central Luzon (3%) (SEIPI, 2015b). It is also common for firms from the same country to cluster in the same industrial park. For example, Calambra and Carmelray II have more Korean investors; Laguna, First Philippine Industrial Park, and Mactan have mostly Japanese companies; and Cavite (the largest zone for electronics companies) has a mix of the two plus Filipino companies (PEZA, 2015). Table 16 lists some of the main companies in the Philippines by segment in the value chain, business model, and activities carried out in the country including end markets when available. Table 16. Major E&E Companies in the Philippines, by Sectors
VC Sector/ Market
Activities in Philippines
Business Model Major Players & Year Est. in the Philippines
E&
E C
ompo
nent
s
ICs Assembly & Test (A&T)
Foreign MNC
Texas Instruments-Analog: 1979 STMicroelectronics-Discrete/Logic: 2008 ON Semiconductor-Analog: 1978 (Sanyo/Motorola) Analog Devices-Analog (IC Design; Auto): 1982 Maxim-Analog (industrial): 1996 Fairchild-Discrete/Analog: ≤ 1980 Microsemi-Analog (Medical/Industrial): 2010 Cypress-Logic; 2001 NXP-Logic: 1981
Outsourced/ Contract
IMI: PSI Technologies*: 1974 Amkor: 1976 Fastech (discretes)*: 1980 ATEC*: 1987 Tong Hsing (discretes): 1994 Ibiden Philippines: 2000
Active Discrete
Photovoltaic cells Sunpower: 2003; First Philec (FPSC)*: 2007
Diodes Transistors
Foreign MNCs
Excelitas Technologies: 1996 Kyocera: 1996 (quartz crystals)
Rohm Electronics: 1990 Passives Capacitors, Resistors
Samsung: 1997; Murata: 2012 Bare CBs Daeduck-multiple markets: 1996; STI-aerospace: 2009
Electrical Equipment
Transformers Inductors
Taiyo Yuden: 1978 BAG Electronics: 1998 Schneider (American Power): 1996 Eaton: 2012
Wire & Cable-Automotive
Domestic (except Phelps)
Phelps Dodge (1955), American Wire & Cable (1990), Philflex (1992), Associated Wire Corp. of the Philippines, Sycwin (1986), Columbia Wire and Cable, London Industrial Products

The Philippines in the Electronics & Electrical Global Value Chain
47
VC Sector/ Market
Activities in Philippines
Business Model Major Players & Year Est. in the Philippines
Suba
ssem
blie
s/Fi
nal P
rodu
cts
Multiple End Markets
PCBs/ Box-build
EMS: Domestic
IMI*: 1980 Ionics*: 1985 Testech*: 2000 EMS-CAI*: 2004 EMS-Alliance Mansols (AMI)*: 2010
EMS: Foreign21
Mitsumi Philippines: 1980; Cebu Mitsumi: 1989 Tsukiden Electronics: 1988 Katolec: 1996 Test Solution Services: 1988 Cal-Comp-computers/telecom: 2012 SIIX-automotive: 2013
Storage / Office Parts
Spindle motors Magnetic head Printer parts
Foreign: Captive Suppliers
Nidec: 1996 TDK Philippines: 1997 Panasonic: 2000 Samsung Smart EMS: 2001
Storage Devices HDDs
Foreign MNCs: Lead Firms/ Tier 1
Western Digital/HGST (Hitachi): 1994 Toshiba: 1995
Office Equipment
Printers, Ink, Cash sorters
Glory: 1994 Epson: 1995 Lexmark: 1999; Funai Electric Cebu: 1999 Canon: 2012 Brother: 2012 3D Fab (3D printers): 2015
Consumer Cameras, DVD players
Ricoh: 2011 Funai Electric Philippines: 2013
Automotive Sensors Navigation
Fujitsu Ten: 1990 Continental Temic: 1997
Industrial/ Medical Sonion (transducers): 2011
Knowles: 2012
Sources: Author, based on data from DTI, SPIK, et al. (2014); PEZA (2015); Philippines Electronics Firms (2016). Note (*) indicates the firm is at least in part Filipino-owned. Product Profile In 2014, the Philippines exported US$29 billion in E&E related products; of this total, 87% was electronic and 13% was electrical; two-thirds were components with the remaining composed of final and product-specific parts (UNComtrade, 2015a). Since 2007, the export value of all categories has declined, with the exception of electrical equipment components (Figure 3Figure 3). The economic crisis impacted final product exports more so than the components stages of the chain. The predominant export sector is electronic components (56% of 2014 E&E exports) while final electrical products and parts makes up a trivial share at only 1%. The Philippines accounted for 1.2% of world electronic exports and 0.4% of world electrical exports in 2014.
21 Flextronics has a design/engineering location in Cebu (2007), but not manufacturing.

The Philippines in the Electronics & Electrical Global Value Chain
48
Figure 3. Philippine E&E Exports, by Industry & Stage, 2007-2014
Source: UNComtrade (2015a) Electronic The majority of electronic output by both component and final product/part companies is either directly or indirectly exported. Only 3% and 11% of output (based on values in 2010) was sold to the domestic market in the two stages respectively. This is low compared to the overall share of 56% to the domestic market for manufacturing as a whole. For electronic components, 92% is directly exported. For final products/parts, on the other hand, only 45% of output is directly exported; output is primarily sold to exporters (31%, i.e., indirect exports) or via interplant transfers (13%). As such, the electronics industry accounts for a significant share of the Philippines manufacturing output sold via indirect exports and interplant transports (54% and 41% respectively) (Philippines NSO, 2013). Within electronic components, electronic integrated circuits and microassemblies (“ICs”) is the most significant export, accounting for 75.5% of electronic components exports (Table 17). With an export value of US$12 billion, the Philippines was the 9th largest global exporter of ICs in 2014, accounting for 2.8% of world exports. The export value has however declined over the last seven years (2007-2014); the country had a negative CAGR (-3.7%) compared to a world growth rate of 3.9%. Exports primarily go to Hong Kong/China, Singapore, and Taiwan (~ 2/3 of exports). In Asia, the Philippines mainly competes with Malaysia in this segment, however, with Intel’s recent investment, Vietnam is now also a participant. Companies primarily engage in A&T activities for analog ICs (TI, Analog Devices, ON Semiconductor, Maxim, and Microsemi). There are no semiconductor fabs and there is minimal involvement in IC design. Exports are also fairly concentrated; the top two exporters accounted for 57% of exports within this code in 2014 (the top five 77% and the top 10 were 92%) (PSA, 2007-2014).

The Philippines in the Electronics & Electrical Global Value Chain
49
Table 17. Philippines Electronic Component Exports by Subsector, 2007-2014
Subsector Value (US$, Billions) Share of Exports (%) CAGR (%)
2007 2010 2012 2014 2007 2010 2012 2014 2007-14 Components Total 18.2 9.8 12.7 16.1 -1.7 Integrated Circuits (8542) 15.8 6.4 9.6 12.2 87.0 65.9 75.9 75.5 -3.7 Active Discrete (8540, 8541) 1.9 2.6 2.7 3.0 10.3 26.5 21.2 18.4 6.7 Passive (8532, 8533) 0.4 0.5 0.2 0.5 1.9 5.4 1.4 3.3 5.8 Printed Circuits (8534) 0.1 0.2 0.2 0.5 0.7 2.2 1.5 2.9 20.5
Source: UNComtrade (2015a) The next largest category, albeit much smaller, is of active discrete semiconductors. Exports totaled US$3 billion in 2014, and were composed of photovoltaic cells, transistors, and diodes. The sector is highly concentrated and dependent on the top four exporters which together accounted for 80% of exports in 2014. The final two segments of electronic components include passive components and printed circuits; collectively these were US$1 billion in exports. Passives are dominated by one firm (94% of exports in 2014), and the top six firms accounted for 84% of printed circuit exports. Within final products, computers/storage devices/office equipment is the largest category, accounting for 78% of electronic final product exports. The Philippines exported US$7 billion in 2014, and was the 13th largest exporter, accounting for 1.3% of world exports. Within this category, 69% is final products and 31% is parts. Exports primarily go to China/Hong Kong, the United States, Germany, and Japan (77% of exports). The Philippines is primarily engaged in the storage and office equipment/computer peripherals segments rather than computers. The majority of firms are from Japan with a few from South Korea. Exports of final products are concentrated in a few firms; the top exporter accounted for 45% of exports in 2014 and the top four were 82%. Exports are mainly in storage units (Toshiba, Samsung). The last new investment in the storage industry was in 2010; the growth of this industry occurred mainly between 1995 and 2002. Despite the lack of visible new investments, exports have increased by 80% between 2007 and 2014. Western Digital is also part of this supply chain, but is engaged in production farther upstream. After storage units, remaining exports are primarily printers (Epson, Canon, Funai Electric, and 3D Fab). Product-specific parts includes parts of storage devices and printer ink cartridges (Brother, Funai Cebu). The top five exporters accounted for 58% in 2014 (with no overlap in firms with final products). The Philippines has a critical mass of the global lead firms in the office equipment segment (Table A-4), including Epson, Canon, and Brother as well as Lexmark, who has an R&D facility in the country. Exports of consumer electronics and communication equipment were US$1 billion in 2014, and there are 41 firms with exports over US$1 million in this subsector. This segment is not particularly concentrated as the top three exporters only account for 44% of exports. Industrial equipment exports were US$800 million; the top three exporters account for 70% of exports. Exports are primarily (56%) in HS9032. Industrial equipment exports have experienced the most growth, although it still represented a small share of final electronic exports in 2014 (9%). This industry also overlaps with electrical T&D segments. Exports of medical electronics are the

The Philippines in the Electronics & Electrical Global Value Chain
50
lowest at only US$100M in 2014 with only seven firms exporting over US$1 million in 2014 (the top two exporters account for 83% of exports).
Table 18. Philippines Top Export Destinations, Select Products, 2007-2014
(A) Electronic Integrated Circuits and Microassemblies
Export Destination Value (US$, Billions) Partner’s Share of Exports (%) CAGR (%) 2007 2010 2012 2014 2007 2010 2012 2014 2007-14
World 15.8 6.4 9.6 12.2 -3.7 China/Hong Kong 5.1 1.5 2.9 3.5 32 23 30 29 -5.1 Singapore 1.8 0.8 2.5 2.6 11 13 26 21 5.3 Other Asia, nes 1.2 0.4 0.8 1.4 8 7 8 11 1.5 Germany 0.8 0.8 0.4 0.9 5 13 4 8 3.0 Top 5 (in 2014) 8.9 3.6 6.5 8.4 56 55 68 69 -0.8
Source: UNComtrade (2015a); Exports from the Philippines to Partners, based on HS02 code 8542.
(B) Computers/Storage Devices/Office Equipment and Parts
Export Destination Value (US$, Billions) Partner’s Share of Exports (%) CAGR (%)
2007 2010 2012 2014 2007 2010 2012 2014 2007-14 World 10.2 5.7 5.5 7.0 -5.2 China/Hong Kong 2.6 2.1 2.1 3.2 26 36 38 45 2.8 USA 2.8 1.5 0.8 1.0 27 26 15 14 -14.1 Germany 0.3 0.2 0.5 0.6 3 4 9 9 9.1 Japan 2.0 1.0 0.8 0.6 19 17 14 9 -15.5 Top 5 (in 2014) 7.7 4.8 4.1 5.4 76 83 75 76 -5.1
Source: UNComtrade (2015a); Exports from the Philippines to Partners, based on 4-digit HS02 codes: computers and storage devices (8471), computer/storage device/office equipment parts (8473), and office equipment (8472, 8470, 8469, 9009).
(C) Electrical Equipment
Export Destination Value (US$, Billions) Partner's Share of Exports (%) CAGR (%) 2007 2010 2012 2014 2007 2010 2012 2014 2007-14
World 1.6 2.0 3.6 3.4 11.7 USA 0.6 0.7 0.7 0.9 42 38 19 27 4.8 Japan 0.3 0.5 0.5 0.7 22 25 13 20 10.2 China/Hong Kong 0.1 0.2 0.7 0.6 5 9 18 17 32.5 Netherlands 0.2 0.2 0.3 0.3 15 11 9 8 2.4 Germany 0.0 0.0 0.3 0.2 2 2 7 5 30.7 Top 5 (in 2014) 1.3 1.7 2.1 2.4 84 83 59 72 9.3
Source: UNComtrade (2015a); does not include wire harnesses (HS854430) Electrical The electrical equipment industry in the Philippines is much smaller than the electronics industry. In 2010 there were approximately 123 establishment with 15,768 employees. Domestic ownership dominates in this segment (71% of establishments) and one-third have fewer than 20 employees. A larger share of output is sold to the domestic market or via interplant transfers (22% and 14%)(Philippines NSO, 2013).

The Philippines in the Electronics & Electrical Global Value Chain
51
In terms of overall production output, the largest segment is uninterruptible power supplies (UPS). After UPS, there is a significant degree of overlap with the automotive industry. The next largest segments are wires/cable, other electrical equipment, and batteries (these represented 33%, 15%, and 7% of 2010 output). Half of the output of wires/cable are for export, which are wire harnesses and covered in the automotive report. Within batteries, industrial statistics cannot be divided between storage batteries (which are covered in automotive) and primary batteries, however given that 85% of output is exported, it is likely these firms are in automotive batteries rather than other uses (Philippines NSO, 2013). The total value of electrical equipment exports from the Philippines was US$3.4 billion in 2014; this represents 5.4% of the Philippines total exports and 1% of world exports (Table A-2). The main two export destinations are the United States and Japan (collectively accounting for 47% of exports), with significant growth in exports to China/Hong Kong (see Table above). The top three exports are UPS, switchgear, and electro-magnets (within “other” category) representing 46%, 29%, and 14% (collectively accounting for 89%) of electrical equipment exports respectively. There are approximately 15 companies that account for the majority of these exports (PSA, 2007-2014). Transformers, including UPS (HS8504), had a total export value of US$1.6 billion in 2014; three firms accounted for 88% of exports (PSA, 2007-2014). The top two firms primarily export UPS and the third exports inductors. Industrial statistics from 2010 also indicate there were three firms, and UPS was the largest segment within electrical equipment accounting for 37% of production output (Philippines NSO, 2013). UPS firms import PCBs and ICs and active discrete electronic components. Switchgear had a total export value of US$1.0 billion in 2014. The top five firms in the main HS code (8536) accounted for 77% of exports in 2014. Exporters tend to export exclusively from this HS code, or from other electrical codes (such as wire/cable or other switchgear parts). Exporters tend to focus on one switchgear component (i.e., connectors, relays, fuses) rather than exporting a variety of products (PSA, 2007-2014). Exports are primarily for low voltage uses (≤ 1,000 volts). In 2010 there were nine firms that produced electrical components (switches, fuses, etc.) and half of the output of this industry is exported. There are 3-4 firms with foreign ownership (USA, Japan, Korea, and Taiwan), which are likely responsible for exports (Philippines NSO, 2013). There are also around 40 companies, primarily Filipino, engaged in producing transformers, switchgear and electricity distribution equipment for the domestic market. Exports of the entire “other” category were only US$500 million in 2014, primarily consisting of electro-magnets (HS8505). Two firms account for 99% of exports (PSA, 2007-2014). Exports of wire/cable are trivial. According to the copper roadmap, approximately 90-95% of the output of the wire industry is sold to the domestic market (only Phelps Dodge is known to export) (DTI, PASAR, et al., 2014).

The Philippines in the Electronics & Electrical Global Value Chain
52
Electrical final products and product-specific parts exports for consumer appliances and industrial electrical equipment in 2014 was only $0.4 billion, less than 1% of the Philippines total exports and 0.1% of world exports. Backward Linkages Raw materials and supplies account for 80% of electronics companies’ costs (Philippines NSO, 2013). The majority of inputs to production are imported. The highest share of inputs sourced from firms in the Philippines was 35%, however several firms stated they only source packaging materials within the Philippines. Inputs that are available locally include packaging materials and plastic/metal housing materials. All firms cited they import electronic components (ICs or wafers and passive components). China/Hong Kong was the most cited, followed by Japan and Singapore, and then Malaysia and Thailand. The US and EU were mentioned by a few for semiconductors. Despite the fact that most inputs are imported, this did not seem to be a significant problem for most of the firms interviewed. Although not explicitly stated, this is likely due to the fact that firms are in PEZA zones and can import inputs duty-free, and given that the majority of imports come from Asian countries, the increase in lead time is somewhat insignificant. Inputs that are purchased within the Philippines are primarily via follow sourcing, or suppliers that relocated to the Philippines when the Tier 1 firm set up operations. This is especially true for Japanese-owned firms. Japanese-affiliated companies in the Philippines have a tendency to source from Japan or from other Japanese-affiliated companies in the country across all industries. For manufacturing sectors, the Philippines had the highest procurement rate from Japan of all ASEAN countries at 44% in 2014 (JETRO, 2014). For Japanese-affiliated firms in Asian countries, sourcing from Japan or Japanese-affiliated companies in the host country is more common in E&E than other industries, with the primary reason being that clients ask them to source from Japan (JETRO, 2014). Imports of electronic components were US$11 billion in 2014; down from US$19 billion in 2007 (UNComtrade, 2015b). The top six countries have been the same throughout the time period (US, Germany, Taiwan, Singapore, Japan, and South Korea – this is logical given that these countries are the main global producers of semiconductor wafers). The decline in electronic component imports (-7.8% CAGR, 2007-14) versus the decline in exports should be viewed with caution because one of the largest IC companies (Intel) left the Philippines between 2007 and 2014, and their trade values were significant enough to skew these statistics. One report stated that in 2008, Intel’s exports from the Philippines totaled US$5 billion (approximately one-third of semiconductor exports).22 This also explains the significant drop in imports from the United States (from US$6 billion to US$2 billion between 2007 and 2014), as this is the location of Intel’s fabs. Furthermore, the type of semiconductors produced by Intel were different from the other IC companies in the country – Intel is primarily engaged in microcomponents and logic whereas the majority of other firms in the Philippines are in analog. Microcomponent wafers tend to be more expensive than analog.
22 http://www.gmanetwork.com/news/story/145644/money/companies/there-was-nothing-govt-could-do-to-prevent-intel-exit#sthash.rR9MnOe8.dpuf

The Philippines in the Electronics & Electrical Global Value Chain
53
The ability to establish domestic backward linkages for the IC industry will be limited because the primary inputs are wafers, which are produced in a limited number of fabs globally. Domestic purchases of electronic components is also limited by the global supply and distribution networks of large MNC electronic component suppliers. Even if a product is manufactured in the Philippines, it may still be exported and re-imported by the Tier1/EMS manufacturer because the company’s Asian distribution facility is in another country and the volume purchased is not significant enough to set up a direct sales agreement (see opening discussion on distribution and sales).
4.3. Human Capital In 2010, there were 183,035 employees in electronics manufacturing establishments and 23,840 for electrical for a combined total of 206,875 (Philippines NSO, 2013)(Table A-6). According to SEIPI, the electronics industry employed 344,450 workers in 2014 (SEIPI, 2015b). Electronics firms employ a large number of workers per establishment (769 employees per establishment) compared to electrical (120) and manufacturing establishments (60). The E&E industries account for just over one-fifth of all employees and production workers at manufacturing establishment in the Philippines and 32% of females employed by manufacturing establishments. Female workers make up a significantly larger share of the total workforce in E&E than for manufacturing as a whole (70% compared to 46%) (Philippines NSO, 2013). According to interviewees (2016), females are more prominent in assembly positions and males are more common in administration/management. For E&E, 77% of employees were production workers (Philippines NSO, 2013). Interviews revealed a similar share of the workforce engaged in production (70%). This is high and is a reflection of the labor-intensive assembly function being the main focus of the Philippines. In places where design and corporate support functions take place, a smaller share of workers tend to be in manufacturing. Engineers typically accounted for between 8-12% of the overall workforce; this number tends to be higher in IC firms than subassembly/final products. From an education perspective, the majority of workers come straight from high school (operator level) or from a four-year university (engineers and management). The role of technicians, or employees with two year vocational degrees appears to play a limited role for E&E firms in the Philippines, but this draws from a relatively small sample size. Most firms state they hire engineers from nearby universities with engineering programs such as Batangas State University. The average compensation per employee at electronics establishments is 17% higher than the average for manufacturing overall. This is entirely driven by electronic components where the average is 29% higher compared to final products in which average compensation is actually 3% lower (Philippines NSO, 2013). The workforce was the most cited advantage mentioned in firm interviews. At least one aspect of human capital was mentioned in all firm interviews including (in order of times mentioned)

The Philippines in the Electronics & Electrical Global Value Chain
54
English language skills, supply (availability, stability), cost, loyalty (low turnover rates), and the overall quality of workers (flexible, trainable). Turnover is not a problem at the operator level, although it does pose a threat at the engineering level. The only workforce-related issue cited concerns the ability to retain engineers with 3+ years of experience. Once engineers gain experience, they are inclined to go abroad for higher wages. The number of engineering and technology graduates has increased steadily over the last decade, with approximately 63,500 in 2013/14. Engineering only accounts for 11% of university degrees however, and the growth rate in this field is slightly below the rate of the total number of graduates. The CAGR for graduates between 2006/07 and 2013/14 for engineering was 3.5% compared to 3.9% for all disciplines (CHED, 2015). As of December 2010, there were 607 registered TVET programs related to the electronics industry. In 2010, 6,602 people were awarded a National Certificate in one of these programs and 9,350 Certificates of Competency were awarded. These programs are in three areas: Consumer Electronics Servicing, Instrumentation and Control Servicing, and Mechatronics Servicing with the majority of programs and graduates in consumer electronics. These programs focus on repair and servicing consumer products with a focus focused on industrial equipment installation, calibration and repair (TESDA, 2011). As such, there appears to be a lack of programs focused on developing technicians to develop skills in manufacturing E&E products and not just after sales service. This may explain why firms did not mention having many workers at the technician level or use TVET training programs. Based on data from 2014, the number of certifications (including national certifications and certificates of competency) issued in the electronics sector has doubled since 2010 (39,832 certifications in 2014), and the certification rate has also increased from 69% to at least 80%. SEIPI and TESDA also have a Teen for Work Scholarship (TWSP) training program. Companies hire high school graduates, train them for two weeks (one in the classroom and one on the manufacturing line), and then students are deployed to work. TESDA pays for the program with the minimum requirement that 80% of students are hired. Thus far placement has not been an issue, over 90% of participants have been placed and over 3,300 have gone through the program (SEIPI, 2015a). According to the (ACE International Consultants, 2014), the Philippine Institute of Integrated Circuits (PIIC) works with seven universities in the Philippines on two-week training courses, including “Analog training: Voltage reference”, “Digital training: Memory design”, “Digital training: Introduction to hardware description language (HDL)”, and “Digital training: Digital interfacing.” The stated objective of the program is to provide IC design capabilities to electronic component companies with the long term objective of creating global IP via IC SMEs. As of 2014, 250 students had gone through the programs.
4.4. Evidence of Industry Upgrading Upgrading in the Philippines has primarily stemmed from product and process upgrading. The Philippines has attracted a steady stream of foreign investors that have made a commitment to

The Philippines in the Electronics & Electrical Global Value Chain
55
manufacturing in the country evidenced by increasing the number of manufacturing processes and product lines produced in the country. These firms have also stimulated more FDI via follow sourcing, however there has been minimal spillover effects from FDI in terms of knowledge creation nor has it led to many new domestic firms. Functional upgrading into higher value activities has been limited. Process and product upgrading: Nearly all facilities are ISO certified, and the majority have certifications for specific end markets. SGS Philippines, Inc. is the local certification/auditing body in the Philippines. All companies were ISO 90001 and ISO 14001 certified, six had TS 16949, and two had ISO 13485. PEZA provides data on the total number of expansions and new projects that have been undertaken by firms located in export zones, which can serve as proxy variables for process and product upgrading.23 There have been 109 expansions in the E&E industry (process upgrading) and 642 new projects (product upgrading). E&E firms represent 12% of all original investments recorded, yet account for 21% of expansions and 37% of new projects. The number of new projects is particularly high in the radio, TV, and communication industry compared to the number of original investments. Table 19. PEZA Investments by Electronics & Electrical Firms, 1978-2015 (Sept)
PSIC Industry Original Expansion New Projects
Total 372 109 642 Radio, Television and Communication Equipment and Apparatus 240 82 471 Electrical Machinery and Apparatus, N.E.C. 101 22 74 Office, Accounting and Computing Machinery 23 4 72 Medical, Precision and Optical Instruments, Watches and Clocks 8 1 25 E&E Share of All PEZA Entries 12% 21% 37%
Source: PEZA (2015). Note: the table above only includes entries in the above categories (of which medical and electrical have been modified); if an electronics firm (based on original investment), had an expansion or new project in a non-electronic industry, it is not included above.
This emphasis on product upgrading was also confirmed by firm interviews, in which the majority stated plans to expand the product lines produced in the Philippines and increase sales. Branch plants of MNC operations expressed a strong desire to see their Philippines location become the best branch within their company. Even though managers at branch plants do not have direct control over the products and functions carried out at their location, they realize that their performance impacts the parent company’s decision-making process. This came out as the strongest motivating factor to improve, and as such, internal competition within MNCs (rather than competition among firms in the Philippines) is a primary driver of upgrading for firms in the Philippines.
23 In addition to the type of project (expansion or new project), the PEZA dataset lists the reasons for the activity. For expansions, most correspond to process upgrading (“increase in the production capacity of X”). For new projects, the majority of the stated reasons align with new product introductions.

The Philippines in the Electronics & Electrical Global Value Chain
56
Once a MNC has set up a location in the Philippines, PEZA incentives have been an important draw for these companies to add new product lines currently conducted at branch plants in other countries (or produce in the Philippines when new products are introduced) or expand production in the Philippines. Backward linkages: The majority of new backward linkages in the country have primarily come from follow sourcing rather than through the development of new domestic firms. This is a common practice by MNCs and leads to an increase in employment, as well as value-added in generated in the country. At the firm-level, this limits functional upgrading opportunities as the key non-manufacturing related activities are carried out at the companies’ headquarters rather than in the Philippines. However if a critical mass of companies in a particular product or market set up manufacturing activities in the Philippines, the likelihood of MNCs shifting some of the service-related activities (design, R&D, distribution, sales) increases. Based on the current situation, the computer/storage/office equipment market has the most leverage; particularly in the last decade with the growth of Japanese investors in office equipment and storage. The value of electronic components imports has decreased since 2007, however the value of electronic exports has also decreased. Furthermore, the trade code for the primary electronic input (8542) represents the main raw material input as well as the electronic component. As such, the ability to use trade data for electronic components is limited. End market upgrading: Based on interview data, there is some evidence of end market upgrading by subassembly firms in the country. EMS companies that originally sold to computer and consumer electronic markets are now shifting their focus to automotive, communications, industrial, and medical applications. Based on export data, the share in industrial equipment has increased as a share of all electronics exports. Supply chain upgrading: Domestic EMS companies started in contract IC packaging and assembly and have acquired or developed plastic housing/enclosure manufacturing facilities. Geographic export end market upgrading: the growth rate and share of final product/subassembly exports destined for China/Hong Kong is increasing. This is a positive sign for the country because China is the largest exporter and fastest growing end market for electronic products. Chain upgrading: the presence of the E&E industry in the Philippines has also facilitated growth in the country’s offshore services industry. Analog Devices, On Semiconductor, Maxim, Fairchild, Toshiba, Canon*, Lexmark, Ricoh, Murata, Tsukiden, Kyocera, and Schneider are all examples of E&E companies that established manufacturing operations in the Philippines and later set up a Business Process Outsourcing (BPO) operation in the Philippines. Functional upgrading: overall, firms have not moved into higher value functions in the chain (NPD, design, supplier selection, customer management, branding). Similar to backward linkages, functional upgrading is limited due to the fact that most firms are branch plants and the corporate strategy of the MNC is to carry out higher value activities at the companies’ headquarters or at designated R&D centers. Moving into higher value functions will also require a different set of skills with a greater supply of technical engineers and graduate level

The Philippines in the Electronics & Electrical Global Value Chain
57
researchers and designers. The supply of workers in these categories appears to be limited, and the Philippines is already facing challenges keeping engineers in the country.
4.5. Analysis of Current Situation in the Philippines This section provides an overview of the current situation for the electronics and electrical equipment value chain in the Philippines. Table 20. The Philippines in the E&E GVC SWOT Analysis Strengths Weaknesses
• Workforce; available, English-speaking, loyal • Efficient and competitive EPZ regime (PEZA) • Foreign investment and commitment by large
MNC firms (awareness) • Increasing exports in industrial equipment and to
the Asian market, particularly China • Electronics industry association (SEIPI) • Top IC exporter with several global MNCs
• Negative export CAGR since 2007 (-2%) compared to positive world rate (4%)
• Lack of organization/promotion for electrical • Availability of local suppliers • Infrastructure: ports, traffic, ICT, energy costs and
availability • Lack of EMS providers, particularly a Tier 1 • Minimal functional upgrading/technology transfer
Opportunities Threats
• Synergies with automotive and other transportation industries in the country
• Linking IC output with subassembly/final product demand
• China (as a market, for FDI, and China+1)
• Loss of engineering talent to other countries • Lack of domestically owned firms • Government incentives from competitor countries • Natural disasters • Export focus in “sunset” products with little
participation in new technologies (mobile, tablets)
Strengths The workforce, particularly at the operator level, is the primary strength for the Philippines. At least one aspect of human capital was mentioned in all firm interviews including English language skills, supply (availability, stability), cost, loyalty (low turnover rates), and the overall quality of workers (flexible, trainable). PEZA is seen by firms in the sector as a key advantage of the Philippines. Beyond incentives, the responsiveness and stability of the organization were mentioned as key reasons firms have stayed and chosen to expand operations in the Philippines. The overall cost of manufacturing (primarily attributable to the workforce and PEZA benefits) is also a primary strength of the Philippines. The primary industry organization for electronics in the Philippines is the Semiconductors and Electronics Industries in the Philippines (SEIPI). SEIPI was established in 1984 and has 264 members. According to the association, all of the large exporters are member companies. SEIPI is the largest and most organized industry association in the country, and has been successful at providing a collective voice on the electronic industry’s needs. It has also been able to solicit membership from all top exporters, which can be a challenge in industries comprised primarily of MNCs.

The Philippines in the Electronics & Electrical Global Value Chain
58
In 2014, the Philippines was the 9th largest exporter of integrated circuits, accounting for 2.8% of world exports and has been among the top 10 for at least the last decade. The Philippines presence in the this segment of the value chain started in the 1970s and several of the largest IC global companies have locations in the Philippines including Texas Instruments, STMicroelectronics, NXP, ON Semiconductor, Analog Devices and Maxim among others. Weaknesses A few firms mentioned power cost and availability as concerns. Electricity and water account for 2% of costs in the electronics industry (which is on par with global averages for this industry), however the electronics industry accounts for 18% of manufacturing costs in this category (Philippines NSO, 2013). Whereas it does not make up a significant share overall, the electronics industry is a significant consumer of electricity in the Philippines. This also appears to be more of a problem in certain provinces. There is not a formal association for electrical companies. This industry is also not being targeted for FDI or export promotion. Domestic supply of inputs for electronic and electrical subassemblies is fairly limited, and the majority of the supply available is from following sourcing from foreign investors. There are very few local companies in the sector and nearly all electronic component inputs are imported. However, given the concentration in the components segment, the potential for local linkages is limited from the onset. A few domestic EMS companies have emerged. Activities in the Philippines are mainly limited to those related to manufacturing, with limited upgrading into design, R&D, sourcing, or marketing/branding as independent firms. This is likely due to a number of factors, including low investment in R&D, relatively high turnover at the engineering level, limited local backward linkages (the majority of linkages established have been through foreign firms), and relatively small pool of engineering graduates compared to other disciplines. There has also been limited entrepreneurial activity by Filipino firms, with the exception of IMI, Ionics, and some additional A&T subcontractors. The Philippines has a strong entry-level manufacturing workforce, however there is a relatively limited supply of industry-specific technicians and engineers that would be needed to move into new product areas, end markets, or more skill-intensive functions. Whereas interviewees did not identify a weak linkage between industry and academia, this has been cited as a key issue in previous studies (DTI, SPIK, et al., 2014). Threats Whereas firms tend to stay in the Philippines, top engineering talent has had a tendency to leave for better opportunities in other countries, which poses a challenge to moving into higher value activities in the chain across segments. In order to engage in more functional upgrading, the Philippines will need to address the issue of losing good workers to other countries.24 The
24 The Philippines Overseas Employment Administration alone places approximately 7,300 engineers abroad (the equivalent of 15% of the graduating class of 2013) and 10,250 engineering technicians between 2008 and 2010 (TESDA, 2014).

The Philippines in the Electronics & Electrical Global Value Chain
59
lack of domestic firms is also a threat in this area. There has been a long history of foreign investment, but there have been comparatively few Filipino-owned firms. Other ASEAN countries have similar backgrounds and aspirations as the Philippines. These countries are also trying to entice foreign investors to set up operations in their countries, so it is important for the Philippines to be aware of their strategies. Focusing on industries and firms that fill gaps across multiple industries and establishing a niche will help the country stand out compared to competitors. Although unpreventable, the potential for natural disasters as an island nation is a threat for the Philippines. This was mentioned by a handful of firms and also cited as a challenge in other studies on the ASEAN countries (particularly also Japan and Thailand). There has been relatively minimal export diversification or movement into new products and technologies. The majority of exports are in computer-related office equipment and hard disk drives, which are considered “sunset products” with less room to grow (World Bank, 2015). The largest, fastest growing markets are in smartphones and tablets, for which the Philippines has little to no involvement. Vietnam’s impressive growth in exports has been driven by these products, however these are not necessarily aligned with the strengths of the Philippines due to their high volume nature of production. Not participating in these end markets will limit the Philippines ability to capture a sizeable share of the aggregate global market due to their size, but it does exclude the Philippines from growing exports in other more niche end markets. Opportunities For the last ten years, Japanese electronics manufacturers have primarily produced parts in Japan and in ASEAN economies, which are then sent to China for assembly, and from there the finished products are exported to the United States and other markets Recently, the rising cost of labor in China has caused some new assembly operations to locate in ASEAN economies (i.e., the “China+1” movement)(Wood & Tetlow, 2013). This is an opportunity for the Philippines as it seeks to expand capabilities in the EMS/Tier 1 segment of the value chain.
4.6. Opportunities for Upgrading
1. Product upgrading in storage devices Within the subassemblies/final product categories, the Philippines is almost entirely engaged in storage subassemblies. Opportunities in the storage industry will continue to expand as the ability to collect and save data (“big data”) continues. The technologies used to store data, however, are changing. For example, HDDs are being replaced with hybrid or solid state drives, and the need for nonvolatile memory in portable electronics is moving towards volatile memory to increase speed, and reduce weight. As such, the market/buyers for nonvolatile memory are increasingly industrial customers for use in data centers as part of the larger trend to save data ‘in the cloud’ rather than locally on a personal electronic device. Many of the same lead firms are still involved in mass production, but the Philippines will need to make sure that these MNCs continue to expand in the new areas in the Philippines.
The Philippines in the Electronics & Electrical Global Value Chain
60
2. Entry into electrical equipment and networking via infrastructure improvements
To overcome insufficiencies related to electricity and communications, the Philippines can use needed infrastructure development as a means to enter into T&D electrical equipment components manufacturing (switchgear and fiber optic cables) and telecommunications networking equipment (see the communication and networking firms listed in (Table A-4Error! Reference source not found.). In terms of both of these infrastructure areas, the Philippines is generally behind ASEAN countries. Only 37% of surveyed population in the Philippines were Internet users in 2014 and only 1.5 out of 100 had fixed broadband subscriptions. In 2012, only 70% of the population had access to electricity (below ASEAN average of 28.5%) (UNCTAD, 2015). Demand in the Philippines alone may not be sufficient to warrant an entire production facility, but infrastructure needs are prevalent across ASEAN and key providers will likely need to expand manufacturing capabilities closer to demand. Population growth could be used as an investment angle for E&E companies that wish to expand their market. For example, if a country lacks the T&D and ICT infrastructure needed to increase the number of people (and businesses) with access to electricity, Internet, and cell phone service, it is in the E&E companies’ interest to facilitate development. For example, some MNCs invest in infrastructure to support their core business; for instance, telecommunication service providers establish information and communication technology (ICT) infrastructure in order to achieve overall operation efficiency. Some upstream MNCs invest in downstream infrastructure to establish an integrated business. The industrial market is a key intersection of electrical equipment and electronics (e.g., smart meters, lighting controls, automotive electronics, etc.). Within the T&D segment, the growth in electrical equipment and industrial equipment exports is promising. The Philippines could build synergies around energy/process control areas (smart meters, lighting controls).
3. Strengthen and expand automotive E&E Given the importance of the automotive industry in the Philippines and the high share of E&E content in vehicles, the country should continue to build on existing resources and focus on new synergies among these industries. Even though there are not always direct supply chain linkages among existing firms, having a large concentration of firms in these industries leads to marketing benefits in terms of developing an image of the Philippines to the world as a destination for automotive and electronics. The Philippines can continue to build their presence in automotive electronics via each segment of the value chain: electronic components (semiconductors), EMS, and Tier 1 automotive electronics companies. This end market is strategic because the Philippines already has a strong presence in several segments (i.e., wire harnesses), consumption of motor vehicles is strongest in Asia, provides a potential entry path into other E&E component and subassemblies (i.e., batteries, motors, and EMS/Tier 1 manufacturing), and it presents opportunities to create more backward and forward linkages from raw materials (copper) to final products. The automotive

The Philippines in the Electronics & Electrical Global Value Chain
61
electronic cluster already has participants in each value chain stage, including Fujitsu Ten, Analog Devices, IMI, Ionics, SIIX, Continental, Yazaki and Sumitomo. Upgrading, particularly for the export market, should focus on physically small products that require labor, but also technical know-how. Products with these characteristics take advantage of the main strength of the Philippines (workforce), and reduce the need to use the ports. The Philippines’ strength in the automotive industry is in E&E components, with approximately two-thirds of exports in one of these categories. Exports currently include wire harnesses, ignition systems, radios, and batteries. In terms of global exports, E&E components comprise approximately one-fifth of auto-related component exports. One specific product that would expand the Philippines footprint in electrical equipment and automotive is in batteries. Lithium-ion batteries are a potential target for the Philippines given the country’s footprint in the automotive industry, and the significant presence of South Korean and Japanese firms in this market (top foreign E&E investors in the Philippines). Global lithium ion battery suppliers for e-Vehicles include LG Chem, SK Innovation, and Samsung SDI (South Korea), E-one Moli Energy (Taiwan), and from Japan, Toshiba, Panasonic Energy, Lithium Energy Japan (GS Yuasa/Mitsubishi JV), Automotive Energy Supply Corp, and Hitachi (GM supplier) . Battery production is currently limited in the Philippines; there is currently only one exporter of automotive batteries and perhaps one exporter of non-automotive batteries. However, one Taiwanese firm, Acbel Polytech Philippines, started a new project for A&T of lithium-ion battery packs in 2013 (PEZA, 2015). There are also two other foreign firms with plans to ramp up production in the Philippines (Talino EV and Pangea Motors). Batteries for e-vehicles are also listed in the 2014 IPP as priority area. Entry into the EMS segment should focus on operations that cater to end markets other than the 3Cs as these are mostly high volume products with a well-established manufacturing base. Given the Philippines existing footprint in automotive electronics, expanding in EMS in this area builds synergies to existing firms and is not as dominated by large MNCs and EMS providers. EMS providers offer advantages over captive operations (those owned by lead firms or Tier 1 suppliers) because they work for a diverse set of customers with requires firms to acquire additional competencies (materials management, design, frequent line changes), accelerates learning, and opens the possibility for local lead firms to have outsourcing manufacturing capabilities. Capitalizing on E&E components and subassemblies for the automotive market also opens opportunities to sell the same or similar products to other transportation end markets that also have a presence in the Philippines. Products such as wire harnesses, motors, ignitions, radios, etc. are in motor vehicles as well as airplanes, ships, trucks, etc. An in-depth analysis of the shipbuilding industry was beyond the scope of this report, however at 73%, exports of ships from the Philippines have highest CAGR of top export categories for 2007-2014 time period. Future research should investigate the overlaps in these value chains.

The Philippines in the Electronics & Electrical Global Value Chain
62
Box 1. Building an Automotive E&E Cluster in the Philippines From a holistic perspective, the Philippines has a large footprint in the automotive electronic & electrical (E&E) value chain. This begins with integrated circuit assembly & test (IC A&T) activities and extends through electrical components to EMS and Tier 1 parts/subassemblies. Coupled with several other trends, this provides opportunity for upgrading for the Philippines. These factors include the following: • The majority of automotive exports from the Philippines are in E&E components (two-
thirds in 2014) and the Philippines is among the top five exporters of wire harnesses globally. Similarly, E&E exports account for 47% of the Philippines exports and automotive accounts for 6%; so combined these make up 53% of the country’s exports. The Philippines is also the 9th largest IC exporter.
• Semiconductors used in automotive electronics (analog and discrete power) are the main types produced in the Philippines.
• ICs for the automotive market are predicted to have the highest growth rate of all end markets between 2013 and 2018 at 10.8%.
• China has the largest growing market for automobiles, and the production of cars is increasingly occurring via regional production networks.
• Analog circuit designers/engineers are in shorter supply than digital globally (the skill set is different for analog than digital); however it may take a decade of practical experience beyond graduate education to fully develop an analog engineer’s skills.
• Within automotive, e-vehicles have a higher electronic content than internal combustion vehicles (at the semiconductor level, US$600 instead of US$350 per vehicle). This is largely driven by the need for more power semiconductors (a Philippine strength).
• Motors for e-vehicles use copper wire; a raw material produced in the Philippines (opportunity for backward linkages).
• Electronic components and parts for the automotive industry offer chain upgrading opportunities to other end markets being pursued by the Philippines (aerospace and shipbuilding), creating the potential for a larger ‘electronic transportation’ cluster.
Table 21. The Automotive E&E Cluster
Segment Market Value
(US$, B) Segment
Philippines Global
Manufacturing Design/ R&D Manufacturing
Electrical
$32 Wire Harnesses Yazaki, Sumitomo, Furukawa, Lear
Sumitomo, Furukawa
Denso, Leoni, Delphi, Fujikura
Lithium Ion Batteries for EVs
Talino EV, Pangea Motors, Acbel Polytech Philippines
LG Chem, SK Innovation, E-one Moli Energy, Toshiba, Xalt, Samsung SDI, Panasonic Energy
Electronic Types of semiconductors: Discrete power, analog, microcontrollers, Sensors Three areas: Powertrain/chassis, infotainment, safety
$22 Semiconductors
Analog Devices, NXP, STM, TI, On Semi, Maxim, Fairchild, Micosemi
Infineon, Renesas, Agilent, Xilinx, Freescale, Siemens, Toshiba, Bosch, Rohm
$23 EMS IMI, Ionics, SIIX Flextronics, F. Tech R&D
Jabil, Flextronics, Compal, Sanmina-SCI
$164 Tier 1 Fujitsu Ten, Continental Temic Denso Bosch, Denso, Aisin,
Valeo, Delphi, Panasonic

The Philippines in the Electronics & Electrical Global Value Chain
63
4. Backward linkages in common electro-mechanical products
Several segments of the E&E value chain are present in the Philippines, but given the inherent information gaps that come with FDI, export-oriented development, awareness of these resources may be limited. There is potential to fill this gap, but information and scale barriers will be high. Increasing awareness of domestic capabilities would benefit the E&E industry as well as the automotive and aerospace industries as the general machine shop type activities needed for non-E&E subassemblies are similar. GVC-led development (export-oriented, foreign investment) often leads to disjointed industry clusters because facilities only do part of the process and are primarily linked to activities outside of the country. This can lead to information silos within a country. This is in contrast to organic industrial districts that, at least initially, have all vertical functions in the local area. Whereas having all steps in the value chain in one place does not take advantage of global competitive dynamics (i.e., wage arbitrage, skill-, or market-seeking investments), there is an opportunity for local economic developers to identify the key missing pieces in the local environment, and seek to fill them, and to foster vertical and horizontal linkages. Even better is when activities are identified that can benefit multiple industries or end markets. The Philippines current initiative for the CARS program involves collecting lists from auto companies of key inputs and suppliers. In order to maximize benefits, a similar exercise should be performed for the Tier 1/EMS and aerospace industries to see where synergies and overlaps exist. Once these gaps are identified, developing programs to help domestic firms fill these positions will provide more opportunities for the Philippines to build more sustainable, and engage in higher value, more knowledge-intensive activities. These firms can leverage local and global resources to invent now products for local, regional, and even global markets. Passive electronic components, circuit boards and electrical equipment components are categories that could be targeted for foreign investment. Circuit boards are an example of a backward linkage that would benefit EMS/Tier 1 firms in the country. Approximately 70% of imports of wire harness exporters are electrical equipment components (see automotive report). It should be noted that these are not high-value or high-margin segments of the chain and thus not “upgrading” opportunities per se, but they are missing pieces of the supply chain in terms of backward linkages and would provide employment opportunities for production workers, and could also help enrich the “ecosystem” of E&E in the Philippines, which is a benefit for start-ups and other local firms in the sector. Within the electrical segment, there is a connection between wire/cable manufacturing and wire harnesses. As wire for automotive applications is getting finer with low voltage and the push for vehicle weight reduction, wire harnesses for automobiles are becoming more similar to wire used in other electronics. Companies that manufacture wire harnesses often have other divisions that make wire/cables for non-automotive end markets, so this could be an opportunity for expansions or new projects for these companies in the Philippines.

The Philippines in the Electronics & Electrical Global Value Chain
64
This is also an opportunity to create a larger end market for copper. Copper is a key input for both wire/cable and electric motors, which are both key inputs into the automotive and industrial end markets. The Philippines has a sizeable wire/cable industry, but it currently produces for the domestic market. There is not a motor industry in the country, but given the presence of the copper industry and the automotive electronics and assembly industry, expanding into motors is a likely continuation of this industry cluster. Copper, including copper magnet wire, is a crucial material in all motors, particularly for high-efficiency motors, which require on average 25% more copper (Lowe, Golini, et al., 2010). In the 2014 IPP, copper wire and wire rods are considered priority manufacturing sectors and are eligible for incentives as are motors for e-vehicles (under manufacturing, motor vehicles) (DTI, PASAR, et al., 2014; DTI-BOI, 2014).
5. Functional upgrading into analog and power ICs for automotive
If the Philippines pursues functional upgrading, design and later R&D into analog and discrete power circuits, with a particular focus on automotive applications is a niche area that draws on the strengths of the existing industry in the country.

The Philippines in the Electronics & Electrical Global Value Chain
65
5. References ACE International Consultants. (2014). IC Design Industry Roadmap. Makati City, Philippines, pp. 104. Araujo, Rodrigo , Richard Arons, Jerome Bucher, Ulrika Hagle, Ling Li, and Robert Ruh. (2011). Medical Device
Industry: The Changing Business and Talent Landscape. Los Angeles: Korn/Ferry International. http://www.kornferryinstitute.com/sites/all/files//documents/briefings-magazine-download/ Medical device industry- the changing business and talent landscape _0.pdf
Bamber, Penny and Gary Gereffi. (2013). Costa Rica in the Medical Devices Global Value Chain: Opportunities for Upgrading. Durham, N.C.: Center on Globalization, Governance and Competitiveness. Commissioned by the Costa Rican Ministry of Foreign Trade. http://www.cggc.duke.edu/pdfs/2013-08-20_Ch2_Medical_Devices.pdf.
BOI. (2015). List of BOI-Registered Projects, 1968-2015 October. Manila: Philippine Board of Investment (BOI). Buetow, Mike (2015). Circuits Assembly Top 50 EMS Companies. Retrieved January 3, 2016, from
http://circuitsassembly.com/ca/magazine/24900-ems-top-50-1505.html CHED. (2015). Table 4. Higher Education Graduates by Discipline Group and Academic Year from AY 2002-03 to
AY 2013-14. In P. C. o. H. E. (CHED) (Ed.). Manila, Philippines. CS Monitor (1980). Electronics hums with home-grown firms, US 'big boys'. Retrieved December 8, 2015, from
http://www.csmonitor.com/1980/0919/091978.html DTI, PASAR and BOI. (2014). Philippine Copper Industry Roadmap. Manila: Philippine Department of Trade and
Investment (DTI). pp. 63. DTI, SPIK and BOI. (2014). Philippine Chemicals Industry Roadmap. Maniila: Philippine Department of Trade and
Investment. October. DTI-BOI. (2014). 2014 Investment Priorities Plan (IPP). Manila, Philippines: Department of Trade and Industry,
Board of Investment (DTI-BOI). pp. 98. http://industry.gov.ph/investment-priorities-plan-ipp-2014-2016/.
Dutta, Soumitra, Bruno Lanvin and Sacha Wunsch-Vincent. (2015). The Global Innovation Index 2015: Effective Innovation Policies for Development.
Euromonitor. (2014). Consumer Electronics Statistics. Retrieved December 28, 2015, from Euromonitor Internationalfrom
European Commisson. (2015, 11/11/2015). Recast of the RoHS Directive. Retrieved March 20, 2016, from http://ec.europa.eu/environment/waste/rohs_eee/index_en.htm.
Frederick, Stacey and Gary Gereffi. (2013). Costa Rica in the Electronics Global Value Chain: Opportunities for Upgrading. Durham, NC: Center on Globalization, Governance & Competitiveness (CGGC). pp. 67. http://www.cggc.duke.edu/pdfs/2013-08-20_Ch3_Electronics.pdf.
Freedonia. (2012). Electronic Components: United States, pp. 24 pages. Frost & Sullivan. (2009a). Global EMS Provider Market for the Medical Device Industry. ---. (2009b). World Passive Components Market: Frost & Sullivan.
http://cds.frost.com.prox.lib.ncsu.edu/p/58859/ - !/nts/c?id=N4ED-01-00-00-00. ---. (2011). Global Market for Automotive Semiconductors, pp. 98. ---. (2013). Analysis of Global Electronics Manufacturing Services Market Opportunities in the Medical Industry:
Frost & Sullivan. May 9, 2013. http://cds.frost.com.prox.lib.ncsu.edu/p/58859/ - !/ppt/c?id=NBDE-01-00-00-00.
Giroud, Axèle. (2000). "Japanese transnational corporations' knowledge transfer to Southeast Asia: the case of the electrical and electronics sector in Malaysia." International Business Review, 9(5): 571-586.
GTAI. (2014). Industry Overview: the Automotive Electronics Industry in Germany. Berlin, Germany: Germany Trade & Invest (GTAI). pp. 16. http://www.gtai.de/GTAI/Content/EN/Invest/_SharedDocs/Downloads/GTAI/Industry-overviews/industry-overview-automotive-electronics-industry-en.pdf.
Hammerschmidt, Christoph (2014). Automotive Industry Drives Chip Demand. Retrieved May 13, 2016, from http://www.eetimes.com/document.asp?doc_id=1324718
Hurley, Madeline. (2015). Electrical Equipment Manufacturing in the US (33531): IBISWorld,. pp. 38. IBISWorld. (2012). Global Semiconductor & Electronic Parts: IBISWorld. pp. 50.

The Philippines in the Electronics & Electrical Global Value Chain
66
---. (2015a). Electronic Design Automation Software Developers in the US (OD4540): IBISWorld,. pp. 30. ---. (2015b). Global Computer Hardware Manufacturing: IBISWorld. ---. (2015c). Global Consumer Electronics Manufacturing: IBISWorld,. pp. 35. ---. (2015d). Global Semiconductor & Electronic Parts: IBISWorld. pp. 39. IDC. (2015). Worldwide Electronics Manufacturing Services Forecaster. Framingham, MA, USA: IDC. IEC. (2012). Electropedia. Retrieved October 6, 2012, from International Electrotechnical Commission (IEC)from
http://www.electropedia.org. JETRO. (2014). Survey of Japanese-Affiliated Firms in Asia and Oceania (FY2014 Survey). Tokyo: Japan External
Trade Organization (JETRO). pp. 71. https://www.jetro.go.jp/ext_images/en/reports/survey/pdf/2015_01_biz.pdf.
Lohr, Steve (1984). A Rare Success in Philippines. Retrieved December 8, 2015, from http://www.nytimes.com/1984/08/13/business/a-rare-success-in-philippines.html
Lowe, Marcy, Ruggero Golini and Gary Gereffi. (2010). U.S. Adoption of High-Efficiency Motors and Drives: Lessons Learned. Durham, NC: Duke University Center on Globalization, Governance & Competitiveness (CGGC). pp. 56.
Lowe, Marcy, Saori Tokuoka, Tali Trigg, and Gary Gereffi. (2010). Lithium-ion Batteries for Electric Vehicles: the U.S. Value Chain. Durham, NC: Duke University Center on Globalization, Governance & Competitiveness (CGGC). pp. 76. http://www.cggc.duke.edu/pdfs/Lowe_Lithium-Ion_Batteries_CGGC_10-05-10_revised.pdf.
Mahadevan, Renuka and Mansor Ibrahim. (2007). "Competitiveness and workforce status in the Malaysian micro-electronics sector." Economics, East Asian Development Network (EADN), Malaysia.
MarketLine. (2011). Global Office Electronics. ---. (2012). Global Electronic Manufacturing Services, pp. 35. ---. (2014a). Global Cables, pp. 34. ---. (2014b). Global Electrical Equipment. ---. (2015a). Global Computer Hardware. ---. (2015b). Global Tablet Sales. MATRADE (2014). Malaysia External Trade Statistics: Trade Performance 2014`. Retrieved February 2016, from
Malaysia External Trade Development Corporation Metha, Aashish and Stacey Frederick. (2015). Skill Requirements of the Technology Workforce in California.
Center for Nanotechnology in Society (CNS). MGCC. (2012). “Market Watch 2012” Electrical & Electronic Industry in Malaysia, pp. 15. MIDA. (2006). Performance of the Manufacturing and Services Sectors. Malaysian Industrial Development Autority ---. (2014). Making Our Mark: Malaysia Investment Performance Report 2014. Malaysia Investment Development
Authority. ---. (2015). Malaysia Investment Performance Report Malaysian Investment Development Autority Nesbitt, Aysha (2016). LG to Invest US $1.5 Billion in Vietnamese Electronics Production. Asia Briefing Ltd.
Retrieved May 12, 2016, from http://www.vietnam-briefing.com/news/lg-electronics-vietnam.html
NVR (2012). The Worldwide Industrial Electronics Assembly Markets Defined. New Venture Research (NVR), 5, from http://www.newventureresearch.com/wp-content/uploads/2014/07/The-Industrial-Products-Market-article.pdf
---. (2015). Worldwide Electronics Manufacturing Services (EMS) Market - 2015 Edition. Nevada City, CA, USA: New Venture Research (NVR). http://www.newventureresearch.com/wp-content/uploads/2015/05/ems2015bro-RS.pdf.
Oston, Max. (2015). Wire & Cable Manufacturing in the US (33592 ): IBISWorld,. pp. 44. Parker, Doug and Christopher Thomas. (2013). "Winning share in automotive semiconductors." McKinsey on
Semiconductors, Autumn: 34-41. Pawlicki, Peter. (2016). Re-focusing and re-shifting – the constant restructuring of global production networks in
the electronics industry. In J. Drahokoupil, R. Andrijasevic & D. Sacchetto (Eds.), Flexible workforces and low profit margins: electronics assembly between Europe and China (pp. 21-44). Brussels, Belgium: European Trade Union Institute (ETUI).

The Philippines in the Electronics & Electrical Global Value Chain
67
PEZA. (2015). Firm-Level PEZA Investment Data (through Sept. 30, 2015). Manila: Philippine Economic Zone Authority (PEZA).
Philippines Electronics Firms. (2016). Interviews with Electronics Firms in the Philippines. In D. CGGC (Ed.). Philippines NSO. (2013). 2010 Annual Survey of Philippine Business and Industry (ASPBI) - Manufacturing Sector:
Final Results, Volume III-A. In P. N. S. O. (NSO) (Ed.), Annual Survey of Philippine Business and Industry (ASPBI). Manila, Philippines.
PSA. (2007-2014). Firm-Level Trade Data. Manila: Philippines Statistics Authority (PSA). Rammohan, Lavanya. (2011). CEO 360 Degree on EMS and ODM Industry: Frost & Sullivan.
http://cds.frost.com.prox.lib.ncsu.edu/p/58859/ - !/nts/c?id=N9DC-01-00-00-00. Rasiah, Rajah. (2010). "Are electronics firms in Malaysia catching up in the technology ladder?". Journal of the Asia
Pacific Economy, 15(3): 301-319. ---. (2015). "The industrial policy experience of the electronics industry in Malaysia." Rasiah, Rajah, Yap Xiao-Shan and VGR Chandran Govindaraju. (2014). "Crisis effects on the electronics industry in
Southeast Asia." Journal of Contemporary Asia, 44(4): 645-663. Ravikrishan, Apoorva. (2014). Global EMS Providers Market in Aerospace and Defense: Frost & Sullivan.
http://cds.frost.com.prox.lib.ncsu.edu/p/58859/ - !/ppt/c?id=NE72-01-00-00-00. Reghu, Vivek (2015). Electronics Manufacturing Services for Automotive. Frost & Sullivan. Retrieved December 21,
2015, from http://cds.frost.com.prox.lib.ncsu.edu/p/58859/ - !/insight?id=293394581&hq=electronic%20manufacturing%20service
SEIPI. (2015a). Interview with SEIPI. In S. Frederick & P. Bamber (Eds.). Muntinlupa City, Philippines: Semiconductor and Electronics Industries in the Philippines, Inc. (SEIPI).
---. (2015b). Philippine Electronics Industry (PowerPoint Presentation). Alabang, Muntinlupa City, Metro Manila: Semiconductor and Electronics Industries in the Philippines, Inc. (SEIPI).
Sturgeon, Timothy and Momoko Kawakami. (2010). Global Value Chains in the Electronics Industry: Was the Crisis a Window of Opportunity for Developing Countries? Washington, DC: World Bank. pp. 53. http://elibrary.worldbank.org/doi/book/10.1596/1813-9450-5417.
---. (2011). "Global value chains in the electronics industry: characteristics, crisis, and upgrading opportunities for firms from developing countries." International Journal of Technological Learning, Innovation and Development, 4(1/2/3): 120–147.
TESDA. (2011). Labor Market Intelligence Report: Semiconductor and Electronics Industry. Manila, Philippines: Technical Education and Skills Development Authority (TESDA). pp. 15. http://www.tesda.gov.ph.
Thailand BOI. (2015). Thailand Electrical & Electronics Industry. Bangkok: Thailand Board of Investment (BOI). pp. 11. http://www.boi.go.th/upload/content/BOI-brochure 2015-E&E_67848.pdf.
Tong, Phang Ah (2014). Completing the E&E Chain in Malaysia. Retrieved February 2016, from Malaysia Investment Development Authority
Ulama, Darryle. (2015). Circuit Board & Electronic Component Manufacturing in the US (33441b): IBISWorld,. pp. 34.
UNComtrade. (2015a). World Chemical Imports by All Reporters and Partners, 2005-2014 (based on HS-2002), Retrieved October 31, 2015 from UNComtrade. New York: United Nations Statistics Division (UNSD).
---. (2015b). World Electronics Imports by All Reporters and Partners, 2005-2014 (based on HS-2002), Retrieved November 11-12, 2015 from UNComtrade. New York: United Nations Statistics Division (UNSD).
UNCTAD. (2015). ASEAN Investment Report 2015: Infrastructure Investment and Connectivity. Geneva, Switzerland: United Nations. pp. 250. http://unctad.org/en/PublicationsLibrary/unctad_asean_air2015d1.pdf.
van Liemt, Gijsbert. (2016). Hon Hai/Foxconn: which way forward? In J. Drahokoupil, R. Andrijasevic & D. Sacchetto (Eds.), Flexible workforces and low profit margins: electronics assembly between Europe and China (pp. 45-66). Brussels, Belgium: European Trade Union Institute (ETUI).
Wood, Christopher and James Tetlow. (2013). Global Supply Chain Operation in the APEC Region: Case Study of the Electrical and Electronics Industry: Prepared for the Asia-Pacific Economic Cooperation (APEC). pp. 98.
World Bank. (2015). Philippine Economic Update: Making Growth Work for the Poor. Philippines: The World Bank, Macroeconomics and Fiscal Management Global Practice. pp. 78. http://www-

The Philippines in the Electronics & Electrical Global Value Chain
68
wds.worldbank.org/external/default/WDSContentServer/WDSP/IB/2015/08/10/090224b082c25bc6/1_0/Rendered/PDF/Philippine0eco0th0work0for0the0poor.pdf.
WTO. (2016a). Information Technology Agreement. Retrieved March 19, 2016 from https://www.wto.org/english/tratop_e/inftec_e/inftec_e.htm.
---. (2016b). WTO ITA Workshop on Non-Tariff Barriers (NTBs) Affecting Trade in IT Products. Retrieved March 19, 2016 from https://www.wto.org/english/tratop_e/inftec_e/workshopmay15_e/workshopmay15_e.htm.
Zino, Angelo. (2011). Semiconductors: S&P Capital IQ. pp. 48. ---. (2015). Semiconductors & Semiconductor Equipment: S&P Capital IQ. pp. 85.

The Philippines in the Electronics & Electrical Global Value Chain
69
6. Appendix Table A-1. Electronic Product Categories Definitions and Export Statistics, 2014
Category Subsector & Product Examples HS Codes ISIC
Rev4
World Exports (US$, B)
Philippines Exports (US$, B)
Distinct Exporters
(2014)/Main Computers/ Storage/Office Equipment
Laptops, Desktops, Storage Devices, Monitors, Copiers, Printers, Scanners, Parts
8471, 8469, 8470, 8472, 9009, 8473 2620 $526 $7 55/
10
Consumer Electronics
TV/Projectors (Monitors, reception equipment) Sound/Video (Microphones, Headphones, Amplifiers, Answering Machines, DVD Players), Video Games, Radio/Alarm Clocks, Communication (Phones, Fax, Routers), Transmission/Cameras (TV & Digital), Parts25
8528, 8518, 8519, 8520, 8521, 8522, 950410, 8527, 9006, 8517, 8525 8529
2630 2640 2670
(part)
$721 $1 48/ 10
Medical Capital Equipment, Therapeutics (partial)
901811, 901812, 901813, 901814, 901819, 901820 9022, 902140, 902150
2660 $52 $0.1 7/ 2
Industrial Equipment
Microscopes, Navigation Instruments, Balances, Mechanical Testing, Calibration, Counters, Electricity Measuring Radar/Radio Navigation
9012, 9014, 9016, 9024, 9027, 9028, 9029, 9030, 9032 8526
2651 $141 $0.8 31/ 3
Final Product/Subassembly Total $1,439 $9.0 128/ 15 (76%)
Philippines’ World Share of Exports 0.6% Share of Philippines’ Total Exports 15%
Category Subsector & Product Examples HS Codes
World Market Value
(US$, B)
World Exports (US$, B)
Philippines Exports (US$, B)
Distinct Exporters
(2014)/Main
Electronic Components
Passive: Resistors, Capacitors 8532, 8533 $89 $38 $0.5 6/ 1
Printed Circuits: Circuit Boards 8534 $67 $42 $0.5 21/ 6
Active: Tubes/valves; Discrete/Semiconductors 8540, 8541 $26 $104 $3 38/
4 Integrated Circuits: Semiconductor Media, Electronic ICs, Microassemblies, Parts
8542 $331 $433 $12 51/ 10
Electronic Component Total $513 $616 $16 89/ 15 (89%)
Philippines’ World Share of Exports 2.6% Share of Philippines’ Total Exports 26%
Source: Classifications developed by Author; see Mapping the Electronics and Electrical Equipment Global Value Chain for context. Electronic components are contained with ISIC Rev4 2610. NOTE: HS901420 also included in aerospace and 852710 and 852729 in automotive. Market Values: IBISWorld (2015d); Exports: UNComtrade (2015a). Distinct exporters (2014)/main based on PSA firm-level data and represents establishments with exports >$1 million in category.
25 Includes parts for industrial equipment as well because it covers parts for HS codes 8525-8528.

The Philippines in the Electronics & Electrical Global Value Chain
70
Table A-2. Electrical Equipment Industry Definition, Market/Export Statistics, 2014
Sector/Products HS Code
HS02 Codes and Descriptions End Markets
World Market Value
(US$, B, 2013/15)
World Export Value
& Sector Share (US$,
B, 2014)
Philippines Export Value & Sector Share
(US$, B, 2014)
Distinct Exporters
(2014)/ Main
Motors/Generators Parts
8501 8502 8503
8501: Electric motors & generators (excl. generating sets) 8502: Electric generating sets and rotary converters 8503: Parts for use solely/principally with machines of heading 8501-02
Overlap with Electronic End Markets (Auto/Transportation, Industrial, Appliances): 75%
$35.8 (Generators)
$96.5 / 19%
$0.2 / 6%
8/ 2
Batteries Battery Waste
8506 8548
8506: Primary cells and batteries 8548: Waste and scrap of primary cells & batteries; electrical parts not incl. elsewhere in Chapter
Overlap with Electronic End Markets (Standalone, Auto, Mobile, Medical): 100%
$14.4 / 3%
$0.01 / < 1%
Transmission & Distribution (T&D) $291.3/ 57%
Transformers 8504
8504: Electrical transformers, static converters (e.g., rectifiers), inductors
Industrial/Construction: 95% $95.1/
19% $1.6 /
46% 19/
3
Switchgear Wiring Devices Switches Plugs Sockets Circuit Breakers Lightning arresters Voltage limiters Surge suppressors Junction Boxes Connectors Fuses Relays Boards & Panels Panel boards with components
8535 8536 8538 8537
8535: Electrical apparatus for switching or protecting electrical circuits, or for making connections, for voltage >1,000 8536: Electrical apparatus…, for voltage ≤ 1,000 8538: Parts used with apparatus of 8535-37 8537: Boards, panels, etc., with two or more apparatus of 8535 or 8536, for control or distribution of electricity
Overlap with Electronic End Markets (Industrial): 20% Industrial/Construction/ Utilities: 80%
$152.6 $196.2/ 39%
$1.0 / 29%
26/ 3
Wire & Cable Winding wire Co-axial cable Conductors
8544*
8544: Insulated (incl. enameled/ anodized) wire, cable and other
Overlap with Electronic End Markets: 40% Industrial/Construction: 60%
$93 $84.4/ 17%
$0.1 / 4%
13/ 4

The Philippines in the Electronics & Electrical Global Value Chain
71
Sector/Products HS Code
HS02 Codes and Descriptions End Markets
World Market Value
(US$, B, 2013/15)
World Export Value
& Sector Share (US$,
B, 2014)
Philippines Export Value & Sector Share
(US$, B, 2014)
Distinct Exporters
(2014)/ Main
electric conductors; optical fiber cables
Other Electro-magnets Carbon electrodes Insulators
8505 8545 8546 8547
8505: Electro-magnets; permanent magnets 8545: Carbon electrodes, brushes, lamp, battery, etc., electrical purposes 8546: Electrical insulators 8547: Insulating fittings for electrical machines
8505: Electro-magnets are an input for computers/storage (automatic data processing machines HS 8473/8471). 8547: Insulated fittings are primarily an input for wire harnesses in the Philippines; 8546 is a separate group of companies.
$21.5/ 4%
$0.5 / 14%
4/ 2
Totals $281.4 $508.1 $3.4 73/ 15 (83%)
Share of World Electrical Equipment Exports 1% Share of Philippines’ Total Exports 5.4%
Source: Author; Note (*): all codes except 854430 (Ignition and other wiring sets, used in vehicles, aircraft or ships), which is included in the auto industry definition. See section 2.1 for details. Market Values: MarketLine (2014b); MarketLine (2014a); IBISWorld (2015d)(for connectors, relays, circuit protection devices; 70% of switchgear value); Exports: UNComtrade (2015a). Table A-3. Electrical Final Products & Parts, Definition, Export Statistics, 2014
VC Sector Product Examples HS 2002
World Export Value &
Sector Share (US$B)
Philippines Export Value & Share (US$B)
Distinct Exporters
(2014)/ Main
Major Appliances $83/ 24%
$0.03/ 8%
Kitchen: Food Preservation, Cleaning, Cooking
Compressors, Refrigerators, Freezers, Dishwashers, Stoves, Ovens
841430, 8418, 842211, 732111, 732112, 732113
Laundry Dryers, Washing Machines
842112, 842191, 8450
Small Appliances $173/ 51%
$0.2/ 52%
Personal Care Shavers, Hair clippers 8510
Household Comfort Fans, Air Conditioners Lamps, Lamps/Lights
841451, 8415, 8513, 9405
Food Preparation Floor Clean-up Other
Grinders, Mixers, Extractors, Vacuums, Floor polishers, Waste disposers, Other, Parts
8509
Other Irons, Heating Resistors Hair Dryers, Coffee/tea 8516

The Philippines in the Electronics & Electrical Global Value Chain
72
VC Sector Product Examples HS 2002
World Export Value &
Sector Share (US$B)
Philippines Export Value & Share (US$B)
Distinct Exporters
(2014)/ Main
makers, Toasters Radiators, Heaters, Microwaves, Parts26
Consumer Appliances (Major & Small) $0.2/ 60%
28/ Top 5 (51%)
Industrial Equipment $86/ 25%
$0.2/ 40%
9/ Top 3 (87%)
Manufacturing Equipment
Industrial/lab furnaces and ovens; Machines for: brazing/soldering; resistance welding of metal; arc (incl. plasma) welding of metals; other
8514 8515
Signalling Equipment
Electrical signalling, safety or traffic control equipment, other than HS8608; Electric sound or visual signalling, other than HS8512 or 8530
8530 8531
Other
Particle accelerators Signal generators Machines for electroplating, electrolysis, electrophoresis Electric fence energisers Parts
8543
Total $342 $0.4
Source: Author; distinct exporters includes number of firms with exports >US$1 million in 2014.
Table A-4. Lead Firms and Tier 1 Suppliers Revenue by Market, 2014
Market Top Companies Segment Revenue (US$, B)
Employees
1
Computers
Apple (iPad and Mac revenue) 54.5 92,600 Dell (estimated) 40.1 90,000 Hewlett-Packard (HP) (personal systems) 34.3 50,000 Lenovo (PC division) 33.3 60,000 ASUSTeK Computer 15.8 6,264 Acer 10.8 7,161
Office Equipment
Canon* 35.4 191,889 Hewlett-Packard (HP) (printing segment) 23.0 50,000 Ricoh* 22.0 108,195 Xerox Corporation 19.5 47,500 Epson* 10.0 73,171 Brother Industries* 6.2 33,118
Servers & Data Storage
Western Digital* 15.1 84,072 Seagate (incl. Maxtor and LaCie) 13.7 52,100 Hewlett-Packard Enterprise (HPE) 55.1 252,000
26 Both 8516 include Household Comfort, Personal Care, Cooking Appliances, Food Preparation, and Other.

The Philippines in the Electronics & Electrical Global Value Chain
73
Market Top Companies Segment Revenue (US$, B)
Employees
Toshiba* (electronic devices & components segment) 16.1 200,000 EMC (information storage segment) 16.5 70,000 Fujitsu* (technology solutions segment) 32.1 162,393 Hitachi (information and telecommunication systems) 17.4 320,725 IBM (STG segment) 10.0 379,592 NetApp 6.3 12,490
2
Consumer Electronics
Samsung Electronics* (CE division) 40.8 286,000 Sony (mobile/communications; home entertainment/sound, game, and imaging products) 43.1 140,900
Sharp (all) 29.3 50,253 LG (home entertainment segment) 17.4 83,641 Panasonic (AVC networks segment) 15.3 271,789 Microsoft (D&C computer/gaming; phone hardware) 11.5 128,000
Mobile Phones
Apple (iPhone revenue) 102.0
Samsung Electronics (IM division, also includes PCs) 91.1 LG (mobile segment) 13.5 Huawei (consumer business segment) 12.2 Xiaomi 12.1 Lenovo (mobile sales) 6.2 ZTE (handset terminals) 3.8
3 Communication Networking
Cisco (all product-related categories) 36.2 74,042 Huawei (carrier; enterprise) 34.4 170,000 Ericsson (networks; modems) 17.2 118,055 Alcatel-Lucent (half of access; core networking; other) 8.8 52,673 Nokia (mobile broadband) 8.0 61,656 ZTE (networks) 7.6 75,609 NEC (telecom carrier business) 7.2 100,914
4 Automotive Electronics
Bosch (mobility solutions segment) 44.3 290,183 Continental AG* (chassis and safety, interior, powertrain) 27.8 189,168 Panasonic* (automotive segment) 13.8 271,789 Denso (information and safety systems; electronic systems) 10.1 139,842 Aisin Seiki Co. (Aisin AW group-car navigation) 5.1 89,531 Valeo SA (comfort and driving assistance systems) 3.0 78,500 Delphi Automotive (electronics & safety) 2.8 117,000 Omron (automotive electronic components) 1.3 36,842 Autoliv (active safety segment) 0.5 50,800
5 Medical Electronics
Medtronic 20.3 92,000 General Electric (GE) Healthcare 18.3 51,000 Siemens (healthcare segment) 17.0 343,000 Philips Healthcare 12.2 37,065 Toshiba* (healthcare systems and services) 4.1 200,000 Hitachi (electronic systems and equipment, Hitachi Healthcare) 1.3 320,725 Omron (healthcare) 0.9 36,842
6 Industrial Electronics
Siemens (industry segment) 21.1 343,000 ABB (discrete automation and motion; process automation) 16.8 140,400 United Technologies (UTC climate, controls & security) 16.6 211,000 Philips (lighting segment) 9.1 113,678 Emerson (process management segment) 8.9 115,100 Hitachi (electronic systems and equipment, except healthcare) 8.8 320,725 Schneider Electric* (industry segment) 7.4 167,124

The Philippines in the Electronics & Electrical Global Value Chain
74
Market Top Companies Segment Revenue (US$, B)
Employees
Mitsubishi Electric (information and communication systems; electronic devices)
6.9 124,305
Rockwell (all) 6.6 22,500 Omron (industrial automation; social systems solutions) 3.8 36,842 Dover (engineered systems) 2.4 27,000
7 Aerospace & Defense
General Electric (GE) (aviation segment) 23.3 305,000 Lockheed Martin (aeronautics; space systems) 23.0 112,000 Northrop Grumman (aerospace systems; electronic systems) 15.9 65,300 United Technologies (UTC aerospace systems) 14.0 211,000 Finmeccanica (defense and security electronics; aeronautics) 10.1 54,380 L-3 (electronic systems; aerospace systems) 8.9 45,000 General Dynamics (aerospace) 8.6 99,500 Boeing (network and space systems) 8.0 163,740 BAE Systems (electronic systems) 3.8 83,400
Source notes: revenue is segment-specific when noted in parenthesis; employment is not. manufacturing-related location in the Philippines.
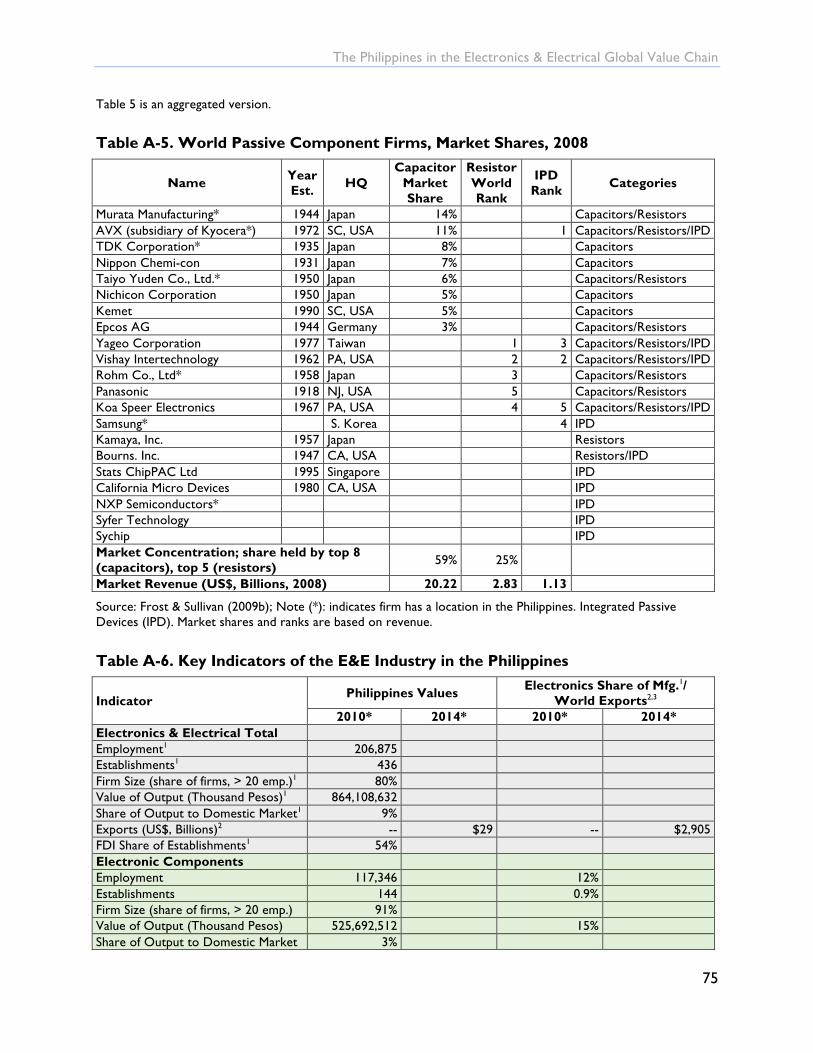
The Philippines in the Electronics & Electrical Global Value Chain
75
Table 5 is an aggregated version.
Table A-5. World Passive Component Firms, Market Shares, 2008
Name Year Est. HQ
Capacitor Market Share
Resistor World Rank
IPD Rank Categories
Murata Manufacturing* 1944 Japan 14% Capacitors/Resistors AVX (subsidiary of Kyocera*) 1972 SC, USA 11% 1 Capacitors/Resistors/IPD TDK Corporation* 1935 Japan 8% Capacitors Nippon Chemi-con 1931 Japan 7% Capacitors Taiyo Yuden Co., Ltd.* 1950 Japan 6% Capacitors/Resistors Nichicon Corporation 1950 Japan 5% Capacitors Kemet 1990 SC, USA 5% Capacitors Epcos AG 1944 Germany 3% Capacitors/Resistors Yageo Corporation 1977 Taiwan 1 3 Capacitors/Resistors/IPD Vishay Intertechnology 1962 PA, USA 2 2 Capacitors/Resistors/IPD Rohm Co., Ltd* 1958 Japan 3 Capacitors/Resistors Panasonic 1918 NJ, USA 5 Capacitors/Resistors Koa Speer Electronics 1967 PA, USA 4 5 Capacitors/Resistors/IPD Samsung* S. Korea 4 IPD Kamaya, Inc. 1957 Japan Resistors Bourns. Inc. 1947 CA, USA Resistors/IPD Stats ChipPAC Ltd 1995 Singapore IPD California Micro Devices 1980 CA, USA IPD NXP Semiconductors* IPD Syfer Technology IPD Sychip IPD Market Concentration; share held by top 8 (capacitors), top 5 (resistors) 59% 25%
Market Revenue (US$, Billions, 2008) 20.22 2.83 1.13
Source: Frost & Sullivan (2009b); Note (*): indicates firm has a location in the Philippines. Integrated Passive Devices (IPD). Market shares and ranks are based on revenue.
Table A-6. Key Indicators of the E&E Industry in the Philippines
Indicator Philippines Values Electronics Share of Mfg.1/ World Exports2,3
2010* 2014* 2010* 2014* Electronics & Electrical Total Employment1 206,875 Establishments1 436 Firm Size (share of firms, > 20 emp.)1 80% Value of Output (Thousand Pesos)1 864,108,632 Share of Output to Domestic Market1 9% Exports (US$, Billions)2 -- $29 -- $2,905 FDI Share of Establishments1 54% Electronic Components Employment 117,346 12% Establishments 144 0.9% Firm Size (share of firms, > 20 emp.) 91% Value of Output (Thousand Pesos) 525,692,512 15% Share of Output to Domestic Market 3%

The Philippines in the Electronics & Electrical Global Value Chain
76
Indicator Philippines Values Electronics Share of Mfg.1/ World Exports2,3
2010* 2014* 2010* 2014* Exports (US$, Billions) -- $16 $616 FDI Share of Establishments 72% Electronic Subassemblies/Final Employment 65,688 7% Establishments 94 0.5% Firm Size (share of firms, > 20 emp.) 90% Value of Output (Thousand Pesos) 219,356,689 6% Share of Output to Domestic Market 11% Exports (US$, Billions)2 -- $9 $1,439 FDI Share of Establishments 72% Top Export Category2 Computers/Storage Consumer/Communications Electrical Equipment Employment 15,768 Establishments 123 Firm Size (share of firms, > 20 emp.) 67% Value of Output (Thousand Pesos) 92,943,211 Share of Output to Domestic Market 22% Exports (US$, Billions) -- $3.4 $508 FDI Share of Establishments 32% Electrical Subassemblies/Final Employment 8,073 Establishments 75 Firm Size (share of firms, > 20 emp.) 68% Value of Output (Thousand Pesos) 26,116,220 Share of Output to Domestic Market 64% Exports (US$, Billions) -- $0.4 $342 FDI Share of Establishments 31%
Sources: (1) Philippines NSO (2013); ASPBI results for all establishments for 2010; (2) UNComtrade (2015a) for 2007 and 2010; Note (*): represent these years unless otherwise indicated in source notes.