2015/2016 corn harvest quality report
TRANSCRIPT
CORN HARVEST
QUALITY REPORT2015/20162015/2016
2015/2016 CORN HARVEST QUALITY REPORT i
ACKNOWLEDGEMENTS
Developing a report of this scope and breadth in a timely manner requires participation by a number of individuals and organizations. The U.S. Grains Council (Council) is grateful to Dr. Sharon Bard and Mr. Chris Schroeder of Centrec Consulting Group, LLC (Centrec) for their oversight and coordination in developing this report. They were supported by internal staff along with a team of experts that helped in data gathering, analysis, and report writing. External team members include Drs. Tom Whitaker, Lowell Hill, Marvin R. Paulsen, and Fred Below. In addition, the Council is indebted to the Illinois Crop Improvement Association’s Identity Preserved Grain Laboratory (IPG Lab) and Champaign-Danville Grain Inspection (CDGI) for providing the corn quality testing services.
Finally, this report would not be possible without the thoughtful and timely participation by local grain elevators across the United States. We are grateful for their time and effort in collecting and providing samples during their very busy harvest time.
2015/2016 CORN HARVEST QUALITY REPORTii
TABLE OF CONTENTS
GreetinGs from the CounCil ................................................................................................ 1
i. harvest Quality hiGhliGhts .......................................................................................... 2
ii. introduCtion ............................................................................................................... 3
iii. Quality test results ................................................................................................... 5
a. Grade faCtors ....................................................................................................... 5B. moisture ............................................................................................................. 13C. ChemiCal Composition ............................................................................................ 15d. physiCal faCtors .................................................................................................. 21e. myCotoxins .......................................................................................................... 31
iv. Crop and Weather Conditions .................................................................................... 36
a. plantinG and early GroWth Conditions–sprinG (marCh - may) .................................. 37B. pollination and Grain-fill Conditions–summer (June - auGust) ................................. 38C. harvest Conditions (septemBer - oCtoBer+) ............................................................ 39d. Comparison of the 2015 averaGe to the 2014, 2013 and 4ya ....................................... 40
v. u.s. Corn produCtion, usaGe and outlook .................................................................. 41
a. u.s. Corn produCtion ........................................................................................... 41B. u.s. Corn use and endinG stoCks .......................................................................... 43C. outlook .............................................................................................................. 44
vi. survey and statistiCal analysis methods ..................................................................... 46
a. overvieW ............................................................................................................. 46B. survey desiGn and samplinG .................................................................................. 46C. statistiCal analysis ............................................................................................... 48
vii. testinG analysis methods .......................................................................................... 49
a. Corn GradinG faCtors .......................................................................................... 49B. moisture ............................................................................................................. 50C. ChemiCal Composition ............................................................................................ 50d. physiCal faCtors .................................................................................................. 50e. myCotoxin testinG ................................................................................................. 52
viii. u.s. Corn Grades and Conversions ............................................................................ 53
usGC ContaCt information
2015/2016 CORN HARVEST QUALITY REPORT 1
GREETINGS FROM THE COUNCIL
The U.S. Grains Council (Council) is pleased to provide our customers and members with the organization’s 2015/2016 Corn Harvest Quality Report, the fifth in an annual series.
Accurate and timely information on crop quality helps buyers make better informed decisions, increases their confidence in the capacity and reliability of our market, and assists nations around the world in achieving food security through trade. It is our goal that this report on harvest quality offers a transparent view of the United States’ most recent corn crop as it comes out of the field.
Other than excessive rains in late May and June, the U.S. Corn Belt fortunately experienced near ideal growing and harvest conditions. As a result, we are anticipating an abundant crop for the second year in a row.
As in past editions, the 2015/2016 Harvest Report provides information about the quality of the current U.S. crop at harvest as it enters international merchandising channels, using consistent methodology to allow for comparison with past years’ quality.
Corn quality observed by buyers will be further affected by subsequent handling, blending and storage conditions. A second Council report, the 2015/2016 Corn Export Cargo Quality Report, will measure corn quality at export terminals at the point of loading for international shipment and should be available in early 2016.
The Council is committed to global food security and mutual economic benefit through trade. As a bridge between international corn buyers and the world’s largest and most sophisticated agricultural production and export system, the Council offers this report as a service to our partners around the world in support of our mission of developing markets, enabling trade and improving lives.
Sincerely,
Alan Tiemann U.S. Grains Council December 2015
2015/2016 CORN HARVEST QUALITY REPORT2
I . HARVEST QUALIT Y HIGHLIGHTSThe overall quality of the 2015 corn crop was better than the average of the previous four crop years (4YA1) on most attributes, with 94% of the samples that would grade U.S. No. 2 or better. In addition to desirable average levels of grade factors, the 2015 U.S. corn crop is entering the market channel with the following characteristics: average moisture content below 4YA, percent of stress cracks lower than 4YA, and starch and oil concentrations and whole kernels higher than 4YA.
The higher quality was largely the result of a favorable corn growing season with earlier than normal planting, a cool, wet summer, and a warm, dry fall. U.S. corn producers experienced record high yields in 2015, resulting in the third largest U.S. corn crop on record. Total U.S. corn production for 2015 is projected to be 346.8 million metric tons (13.65 million bushels), a 4% decrease in production over the 2014 corn crop. The United States is the top exporter of corn, with an estimated 38% of global corn exports during the 2015/2016 marketing year.
GRADE FACTORS AND MOISTURE • Test weight of 58.2 lb/bu (74.9 kg/hl), with 94.2%
above the limit for No. 1 grade corn, and 99.4% above the limit for No. 2. Higher than 2014 and 4YA, this test weight indicates good kernel filling and maturation.
• Low levels of broken corn and foreign material (BCFM) (0.8%), with 95.3% below the limit for No. 1 grade, indicating little cleaning will be required.
• Lower total damage (1.4%) than 2014, but higher than 4YA. However, 96.1% of the samples were below the limit for No. 2 corn, indicating that the corn should store well.
• Lower elevator moisture content (15.7%) than 2014 and 4YA. The distribution shows 40.7% of the samples were below 15% moisture, and only 19.1% of the samples were above 17% moisture. This distribution indicates fewer samples required drying than in 2014, which also decreases potential for stress cracking.
CHEMICAL COMPOSITION• Protein concentration (8.2% dry basis) lower
than 2014, 2013, and 4YA. The lower protein concentration is likely attributable to high yields and excellent growing and filling conditions in 2015 that produced high starch concentrations.
• High starch concentration (73.6% dry basis) above 2014, previous years and 4YA, indicating good growing conditions, excellent kernel filling and maturation, which will be beneficial for wet millers.
• Oil concentration of 3.8% (dry basis), same as 2014, but higher than 2013 and 4YA.
PHYSICAL FACTORS• Extremely low stress cracks (3%) and stress crack
index (6.6), below 2014, 2013, and 4YA, with 93% of samples having stress cracks less than 10%. The lower percentage of stress cracks is likely due to excellent field dry-down conditions at harvest with little artificial drying. Susceptibility to breakage should be very low compared to previous years.
• High kernel volumes (0.27 cm3), same as 2014, 2013, and 4YA.
• Higher 100-k weight (34.34 g) than 2014, 2013, and 4YA, signifying larger kernels than in previous years.
• Lower true density (1.254 g/cm3) and horneous endosperm (79%) than 2014 and 4YA, indicating softer kernels compared to 2014 and 4YA.
• Whole kernels (95%) higher than 2014, 2013, and 4YA. The high percentage of whole kernels indicates the corn should have fewer broken kernels and more resistance to molds than previous years.
MYCOTOXINS• Lower incidences of aflatoxins detected compared
to the 2014 and 2013 corn crop. 100% of the 2015 corn samples tested below the FDA action level of 20 ppb.
• 100% of the corn samples tested below the FDA advisory levels for DON (5 ppm for hogs and other animals and 10 ppm for chicken and cattle) (same as in 2014 and 2013). Lower incidences of DON (percent of samples testing positive for DON) were detected in the 2015 corn crop compared to the 2014 crop.
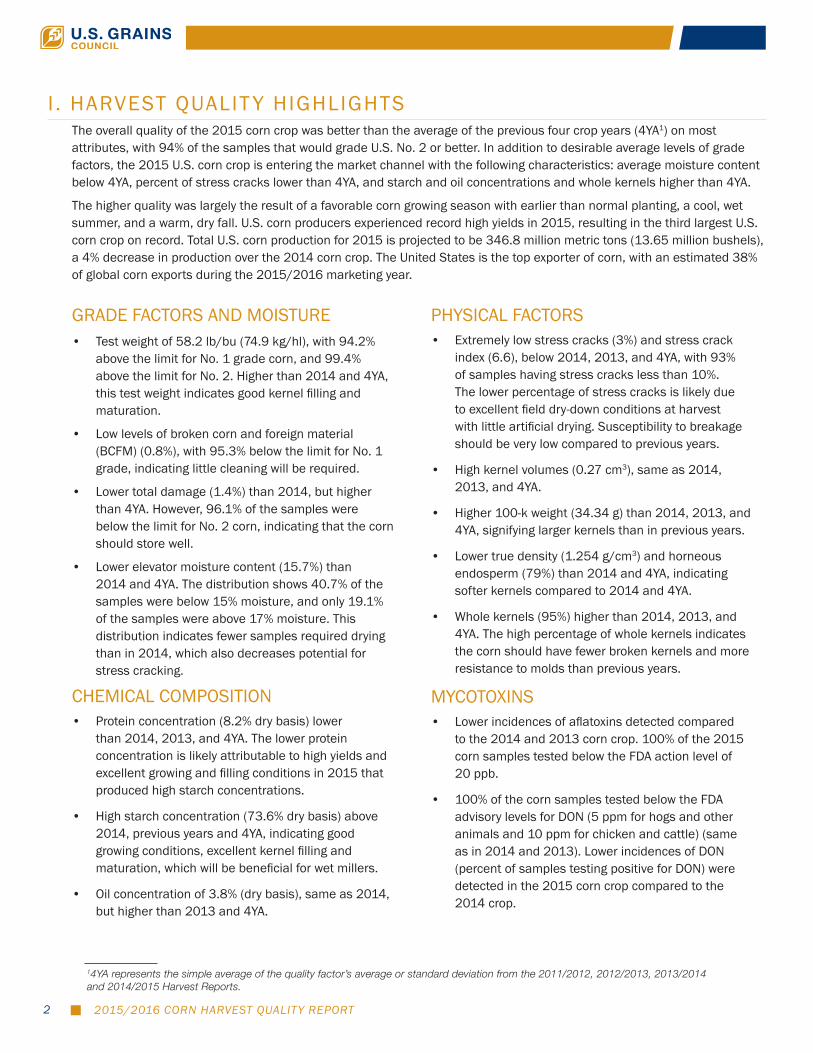
14YA represents the simple average of the quality factor’s average or standard deviation from the 2011/2012, 2012/2013, 2013/2014 and 2014/2015 Harvest Reports.
2015/2016 CORN HARVEST QUALITY REPORT 3
I I . INTRODUCTIONThe U.S. Grains Council 2015/2016 Corn Harvest Quality Report has been designed to help international buyers of U.S. corn understand the initial quality of U.S. yellow commodity corn as it enters the merchandising channel. This is the fifth annual measurement survey of the quality of the U.S. corn crop at harvest. With five years of results, patterns in the impact of weather and growing conditions on the quality of the U.S. corn as it comes out of the field are surfacing.
After a slow start, most of the corn was planted earlier than the 4-year average. The early start to the growing season was followed by heavy rainfall and cool temperatures in the late vegetative and pollination stages, leading to nitrogen fertilizer loss and limited nitrogen uptake. However, favorable weather during the grain filling period created good conditions for crop development, leading to much of the 2015 corn crop having a Good or Excellent crop condition rating. The growing weather set the stage for the second highest yields (just behind 2014), high starch and oil concentrations, and high 100-kernel weight and kernel volume, indicating large kernels. The conditions producing high yields and high starch also led to lower protein, lower true density, and softer endosperm corn in 2015 than in other years.
Warm temperatures and dry conditions hastened corn maturity and natural field drying. This pushed harvest ahead of the previous four years, resulting in little artificial drying and the lowest stress cracks over the past five years. Moistures were also low, and whole kernel percentages were higher than preceding years, which should lead to low breakage susceptibility in handling and good storability. Test weight was higher than the previous three years and 4YA, and BCFM and total damage were low, with averages well within the limits for U.S. No. 1 grade.
These observations show quality differences among the five years, but overall, the 2015/2016 Harvest Quality Report indicates above average quality corn entering the 2015/2016 market channel. 79% of the samples meet all requirements for No. 1 grade, and 94% meet No. 2 grade or better. Average moisture and total damage values show a crop that will store and handle well as it moves through the market channel to export.
Five years of data are laying the foundation for evaluating trends and the factors that impact corn quality. In addition, the cumulative Harvest Report measurement surveys are increasing in value by enabling export buyers to make year-to-year comparisons and assess patterns of corn quality based on crop growing conditions across the years.
This 2015/2016 Harvest Report is based on 620 yellow commodity corn samples taken from defined areas within 12 of the top corn-producing and exporting states. Inbound samples were collected from local grain elevators to observe quality at the point of origin and to provide representative information about the variability of the quality characteristics across the diverse geographic regions.
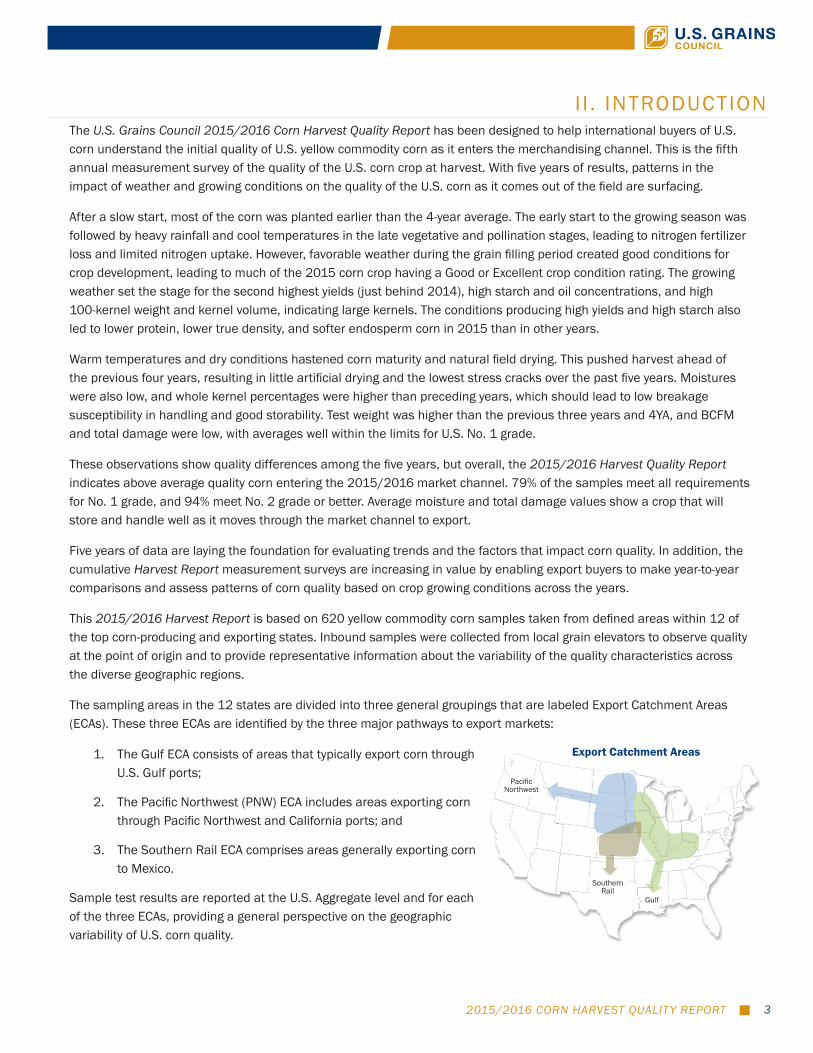
The sampling areas in the 12 states are divided into three general groupings that are labeled Export Catchment Areas (ECAs). These three ECAs are identified by the three major pathways to export markets:
1. The Gulf ECA consists of areas that typically export corn through U.S. Gulf ports;
2. The Pacific Northwest (PNW) ECA includes areas exporting corn through Pacific Northwest and California ports; and
3. The Southern Rail ECA comprises areas generally exporting corn to Mexico.
Sample test results are reported at the U.S. Aggregate level and for each of the three ECAs, providing a general perspective on the geographic variability of U.S. corn quality.
Pacific Northwest
Southern Rail
Gulf
Export Catchment Areas
2015/2016 CORN HARVEST QUALITY REPORT4
I I . INTRODUCTION (cont inued)
The quality characteristics of the corn identified at harvest establish the foundation for the quality of the grain ultimately arriving at the export customers’ doors. However, as corn passes through the U.S. marketing system, it is mingled with corn from other locations, aggregated into trucks, barges and rail cars, stored, and loaded and unloaded several times. Therefore, the quality and condition of the corn change between the initial market entry and the export elevator. For this reason, the 2015/2016 Harvest Report should be considered carefully in tandem with the U.S. Grains Council 2015/2016 Corn Export Cargo Quality Report that will follow early in 2016. As always, the quality of an export cargo of corn is established by the contract between buyer and seller, and buyers are free to negotiate any quality factor that is important to them.
This report provides detailed information on each of the quality factors tested, including averages and standard deviations for the aggregate of all samples, and for each of the three ECAs. The “Quality Test Results” section summarizes the following quality factors:
• Grade Factors: test weight, broken corn and foreign material (BCFM), total damage, and heat damage
• Moisture
• Chemical Composition: protein, starch, and oil
• Physical Factors: stress cracks/stress crack index, 100-kernel weight, kernel volume, kernel true density, whole kernels, and horneous (hard) endosperm
• Mycotoxins: aflatoxin and DON
In addition, this Harvest Report includes brief descriptions of the U.S. crop and weather conditions; U.S. corn production, usage and outlook; and detailed descriptions of survey and statistical analysis methods, and testing methods.
New to this 2015/2016 Harvest Report is a simple average of the quality factors’ averages and standard deviations of the previous four Harvest Reports (2011/2012, 2012/2013, 2013/2014 and 2014/2015). These simple averages are calculated for the U.S. Aggregate and each of the three ECAs, and are referred to as “4YA” in the report.

2015/2016 CORN HARVEST QUALITY REPORT 5
I I I . QUALIT Y TEST RESULTS A. Grade Factors
The U.S. Department of Agriculture’s Federal Grain Inspection Service (FGIS) has established numerical grades, definitions and standards for measurement of many quality attributes. The attributes which determine the numerical grades for corn are test weight, broken corn and foreign material (BCFM), total damage, and heat damage. The table for “U.S. Corn Grades and Grade Requirements” is provided on page 53 of this report.
SUMMARY: GRADE FACTORS AND MOISTURE• Average U.S. Aggregate test weight (58.2 lb/bu or
74.9 kg/hl) was higher than in 2014, and 4YA. It was well above the limit for U.S. No. 1 grade corn.
• As in previous years, the average U.S. Aggregate test weight was above the minimum for U.S. No. 1 grade in all ECAs.
• Average U.S. Aggregate broken corn and foreign material (BCFM) (0.8% consisting primarily of broken corn) was the same as in 2014, less than in 2013 and 4YA, and well below the maximum for U.S. No. 1 grade. Low BCFM indicates minimal cleaning required for corn delivered to first handler and should facilitate good aeration during storage.
• BCFM levels in almost all (98.0%) of the corn samples were at or below the maximum of 3% allowed for No. 2 grade.
• Average BCFM, broken corn, and foreign material differed little among the three ECAs.
• Average broken corn in the U.S. Aggregate samples (0.6%) was lower than 4YA.
• Average U.S. Aggregate foreign material (0.2%) was the same as in previous years and 4YA.
• Total damage in the U.S. Aggregate samples averaged 1.4% in 2015, lower than 2014, higher than 4YA, and still well below the limit for U.S. No. 1 grade (3%). Most of the samples (88.2%) contained 3% or less damaged kernels, indicating that the corn should have good quality and store well.
• The Pacific Northwest ECA had the lowest total damage in 2015, 2014, 2013 and 4YA when compared to the Gulf and Southern Rail ECAs. No heat damage was reported on any of the samples.
• Average U.S. Aggregate moisture content in 2015 (15.7%) was lower than 2014, 2013, and 4YA.
• The 2015 average moisture contents for all ECAs were similar – 15.6 to 15.7%.
• The moisture values were distributed with more of the samples containing 15% or less moisture and fewer samples above 17% moisture in 2015 compared to 2014. This moisture distribution indicates that the 2015 crop should require less artificial drying to reach safe storage levels than in 2014, and that the crop should store well.

2015/2016 CORN HARVEST QUALITY REPORT6
I I I . QUALIT Y TEST RESULTS (cont inued)
Test Weight (lb/bu) Test Weight (kg/hl)
BCFM (%)1 Moisture (%) Total Damage (%)
How to Read the Charts
57.9 57.6 58.2
62.9 62.5 61.5
50.9 51.9
53.4
2013 2014 2015
Test Weight (lbs/bu)
74.5 74.2 74.9
81.0 80.4 79.2
65.5 66.8
68.7
2013 2014 2015
Test Weight (kg/hl)
0.9 1.7 1.4
13.6
17.3
13.2
0.0 0.0 0.0 2013 2014 2015
Total Damage (%)
0.9 0.8 0.8
5.8 5.9
12.0
0.1 0.1 0.1 2013 2014 2015
BCFM (%)
17.3 16.6 15.7
28.2 29.9
23.5
10.9 10.9 11.0
2013 2014 2015
Moisture (%)
1One sample in 2015 contained a high level of broken corn (7.5%) and a high level of foreign material (4.5%), resulting in 12% BCFM. A high level of broken corn is evidence of spout-line segregation (separation of whole and broken kernels as they are discharged from a loading spout). The next highest level of BCFM in the 2015 survey was 6.7%. Based on the 2,970 samples tested over the five years of the Harvest Quality Report, the sample with 12% BCFM appears to be an outlier. However, to adhere to the Report’s policy of transparent methodology, the sample was retained in the results.
2015/2016 CORN HARVEST QUALITY REPORT 7
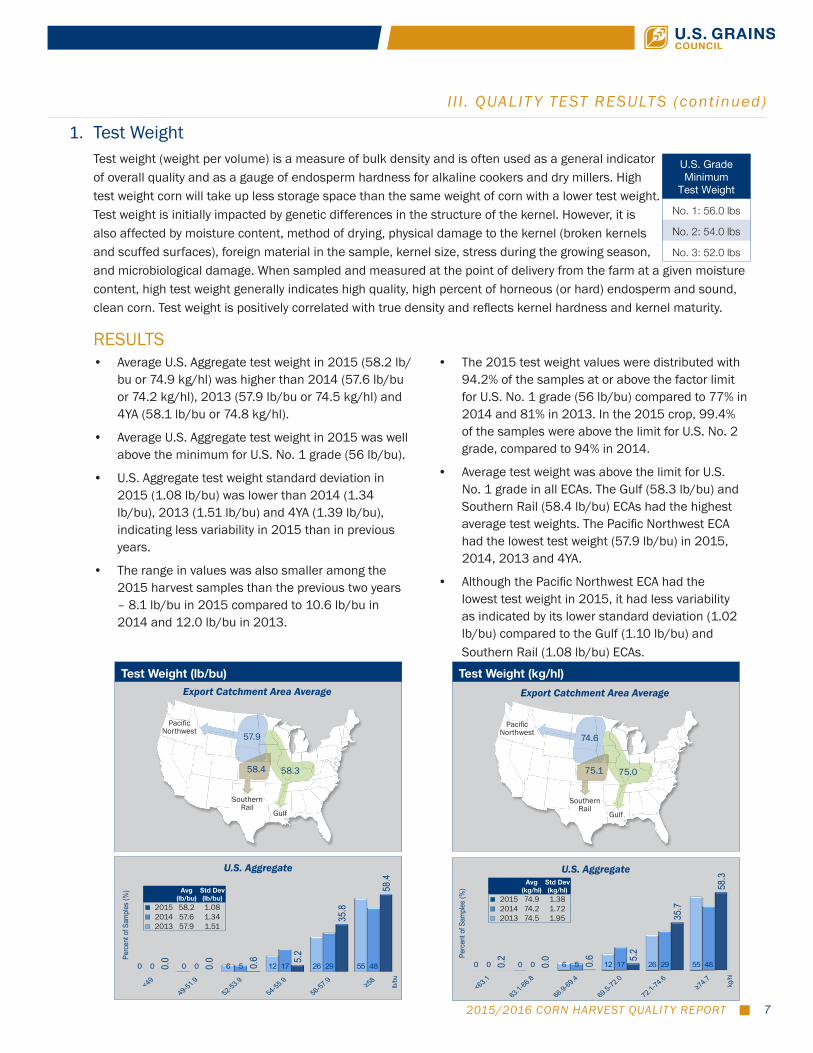
1. Test WeightTest weight (weight per volume) is a measure of bulk density and is often used as a general indicator of overall quality and as a gauge of endosperm hardness for alkaline cookers and dry millers. High test weight corn will take up less storage space than the same weight of corn with a lower test weight. Test weight is initially impacted by genetic differences in the structure of the kernel. However, it is also affected by moisture content, method of drying, physical damage to the kernel (broken kernels and scuffed surfaces), foreign material in the sample, kernel size, stress during the growing season, and microbiological damage. When sampled and measured at the point of delivery from the farm at a given moisture content, high test weight generally indicates high quality, high percent of horneous (or hard) endosperm and sound, clean corn. Test weight is positively correlated with true density and reflects kernel hardness and kernel maturity.
RESULTS
I I I . QUALIT Y TEST RESULTS (cont inued)
U.S. Grade Minimum
Test Weight
No. 1: 56.0 lbs
No. 2: 54.0 lbs
No. 3: 52.0 lbs
• Average U.S. Aggregate test weight in 2015 (58.2 lb/bu or 74.9 kg/hl) was higher than 2014 (57.6 lb/bu or 74.2 kg/hl), 2013 (57.9 lb/bu or 74.5 kg/hl) and 4YA (58.1 lb/bu or 74.8 kg/hl).
• Average U.S. Aggregate test weight in 2015 was well above the minimum for U.S. No. 1 grade (56 lb/bu).
• U.S. Aggregate test weight standard deviation in 2015 (1.08 lb/bu) was lower than 2014 (1.34 lb/bu), 2013 (1.51 lb/bu) and 4YA (1.39 lb/bu), indicating less variability in 2015 than in previous years.
• The range in values was also smaller among the 2015 harvest samples than the previous two years – 8.1 lb/bu in 2015 compared to 10.6 lb/bu in 2014 and 12.0 lb/bu in 2013.
• The 2015 test weight values were distributed with 94.2% of the samples at or above the factor limit for U.S. No. 1 grade (56 lb/bu) compared to 77% in 2014 and 81% in 2013. In the 2015 crop, 99.4% of the samples were above the limit for U.S. No. 2 grade, compared to 94% in 2014.
• Average test weight was above the limit for U.S. No. 1 grade in all ECAs. The Gulf (58.3 lb/bu) and Southern Rail (58.4 lb/bu) ECAs had the highest average test weights. The Pacific Northwest ECA had the lowest test weight (57.9 lb/bu) in 2015, 2014, 2013 and 4YA.
• Although the Pacific Northwest ECA had the lowest test weight in 2015, it had less variability as indicated by its lower standard deviation (1.02 lb/bu) compared to the Gulf (1.10 lb/bu) and Southern Rail (1.08 lb/bu) ECAs.
U.S. Aggregate
Test Weight (kg/hl)
Pacific Northwest
Gulf
Southern Rail
74.6
75.1 75.0
Export Catchment Area Average
0 0 6 12 26 550 0 5 17 29 480.2
0.0 0.6 5.
2
35.7
58.3
Perc
ent o
f Sam
ples
(%)
201320142015
kg/h
l
Test Weight CDGI kg
U.S. Aggregate
Test Weight (lb/bu)
Pacific Northwest
Gulf
Southern Rail
57.9
58.4 58.3
Export Catchment Area Average
0 0 6 12 26 550 0 5 17 29 480.0
0.0 0.6 5.
2
35.8
58.4
Perc
ent o
f Sam
ples
(%)
201320142015
lb/b
u
Test Weight CDGI
Avg (lb/bu)
Std Dev (lb/bu)
2015 58.2 1.082014 57.6 1.342013 57.9 1.51
Avg (kg/hl)
Std Dev (kg/hl)
2015 74.9 1.382014 74.2 1.722013 74.5 1.95
2015/2016 CORN HARVEST QUALITY REPORT8
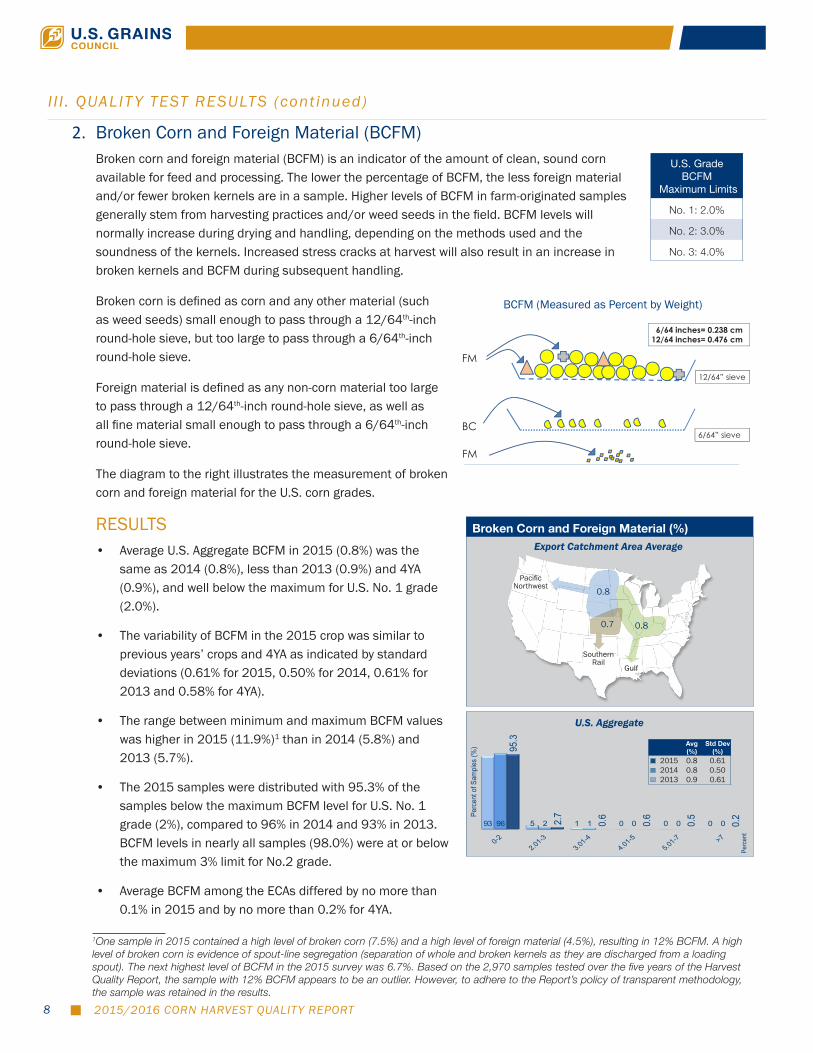
2. Broken Corn and Foreign Material (BCFM)Broken corn and foreign material (BCFM) is an indicator of the amount of clean, sound corn available for feed and processing. The lower the percentage of BCFM, the less foreign material and/or fewer broken kernels are in a sample. Higher levels of BCFM in farm-originated samples generally stem from harvesting practices and/or weed seeds in the field. BCFM levels will normally increase during drying and handling, depending on the methods used and the soundness of the kernels. Increased stress cracks at harvest will also result in an increase in broken kernels and BCFM during subsequent handling.
Broken corn is defined as corn and any other material (such as weed seeds) small enough to pass through a 12/64th-inch round-hole sieve, but too large to pass through a 6/64th-inch round-hole sieve.
Foreign material is defined as any non-corn material too large to pass through a 12/64th-inch round-hole sieve, as well as all fine material small enough to pass through a 6/64th-inch round-hole sieve.
The diagram to the right illustrates the measurement of broken corn and foreign material for the U.S. corn grades.
RESULTS• Average U.S. Aggregate BCFM in 2015 (0.8%) was the
same as 2014 (0.8%), less than 2013 (0.9%) and 4YA (0.9%), and well below the maximum for U.S. No. 1 grade (2.0%).
• The variability of BCFM in the 2015 crop was similar to previous years’ crops and 4YA as indicated by standard deviations (0.61% for 2015, 0.50% for 2014, 0.61% for 2013 and 0.58% for 4YA).
• The range between minimum and maximum BCFM values was higher in 2015 (11.9%)1 than in 2014 (5.8%) and 2013 (5.7%).
• The 2015 samples were distributed with 95.3% of the samples below the maximum BCFM level for U.S. No. 1 grade (2%), compared to 96% in 2014 and 93% in 2013. BCFM levels in nearly all samples (98.0%) were at or below the maximum 3% limit for No.2 grade.
• Average BCFM among the ECAs differed by no more than 0.1% in 2015 and by no more than 0.2% for 4YA.
I I I . QUALIT Y TEST RESULTS (cont inued)
BCFM (Measured as Percent by Weight)Corn Harvest Quality Report 2012/13
Broken Corn/Foreign MaterialMeasured as % by weight
FM
BC
FM12/64” sieve
6/64” sieve
6/64 inches= 0.238 cm12/64 inches= 0.476 cm
U.S. Grade BCFM
Maximum Limits
No. 1: 2.0%
No. 2: 3.0%
No. 3: 4.0%
Broken Corn and Foreign Material (%)
Pacific Northwest
Gulf
Southern Rail
0.8
0.7 0.8
Export Catchment Area Average
93 5 1 0 0 0 96 2 1 0 0 0
95.3
2.7
0.6
0.6
0.5
0.2Pe
rcen
t of S
ampl
es (%
)
201320142015
Perc
ent
BCFM
Avg (%)
Std Dev (%)
2015 0.8 0.612014 0.8 0.502013 0.9 0.61
U.S. Aggregate
1One sample in 2015 contained a high level of broken corn (7.5%) and a high level of foreign material (4.5%), resulting in 12% BCFM. A high level of broken corn is evidence of spout-line segregation (separation of whole and broken kernels as they are discharged from a loading spout). The next highest level of BCFM in the 2015 survey was 6.7%. Based on the 2,970 samples tested over the five years of the Harvest Quality Report, the sample with 12% BCFM appears to be an outlier. However, to adhere to the Report’s policy of transparent methodology, the sample was retained in the results.
2015/2016 CORN HARVEST QUALITY REPORT 9
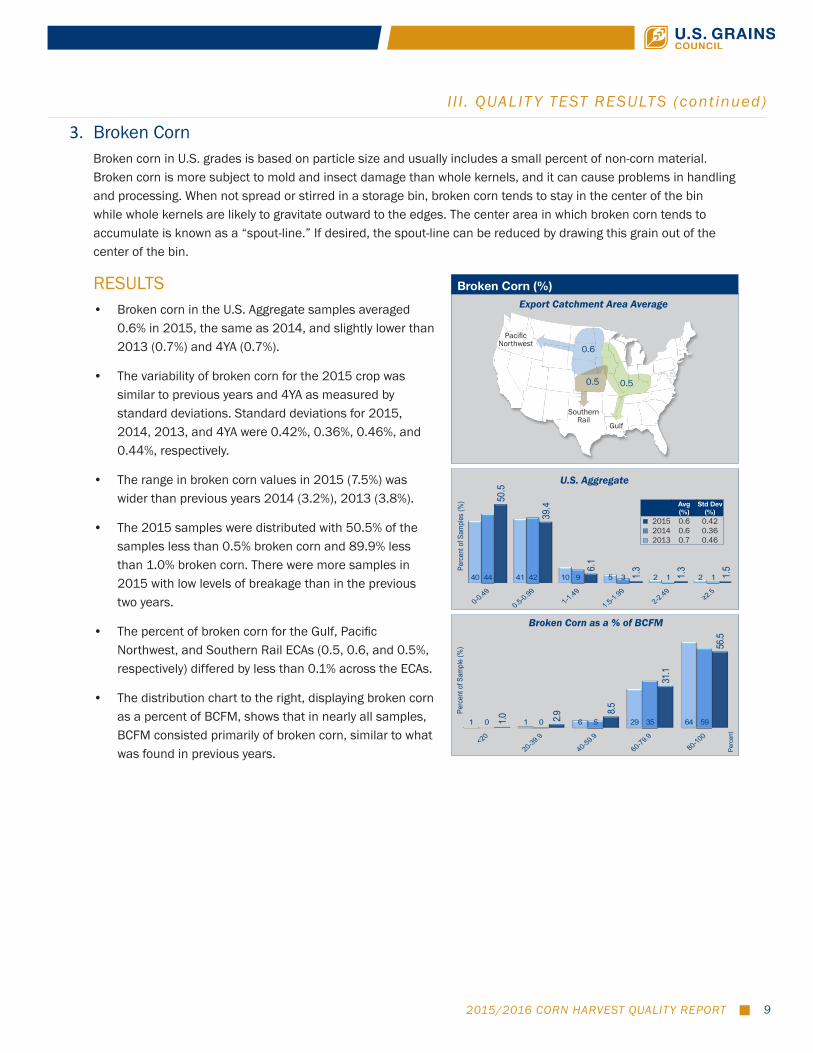
3. Broken CornBroken corn in U.S. grades is based on particle size and usually includes a small percent of non-corn material. Broken corn is more subject to mold and insect damage than whole kernels, and it can cause problems in handling and processing. When not spread or stirred in a storage bin, broken corn tends to stay in the center of the bin while whole kernels are likely to gravitate outward to the edges. The center area in which broken corn tends to accumulate is known as a “spout-line.” If desired, the spout-line can be reduced by drawing this grain out of the center of the bin.
RESULTS• Broken corn in the U.S. Aggregate samples averaged
0.6% in 2015, the same as 2014, and slightly lower than 2013 (0.7%) and 4YA (0.7%).
• The variability of broken corn for the 2015 crop was similar to previous years and 4YA as measured by standard deviations. Standard deviations for 2015, 2014, 2013, and 4YA were 0.42%, 0.36%, 0.46%, and 0.44%, respectively.
• The range in broken corn values in 2015 (7.5%) was wider than previous years 2014 (3.2%), 2013 (3.8%).
• The 2015 samples were distributed with 50.5% of the samples less than 0.5% broken corn and 89.9% less than 1.0% broken corn. There were more samples in 2015 with low levels of breakage than in the previous two years.
• The percent of broken corn for the Gulf, Pacific Northwest, and Southern Rail ECAs (0.5, 0.6, and 0.5%, respectively) differed by less than 0.1% across the ECAs.
• The distribution chart to the right, displaying broken corn as a percent of BCFM, shows that in nearly all samples, BCFM consisted primarily of broken corn, similar to what was found in previous years.
I I I . QUALIT Y TEST RESULTS (cont inued)
Broken Corn (%)
Pacific Northwest
Gulf
Southern Rail
0.6
0.5 0.5
Export Catchment Area Average
U.S. Aggregate
40 41 10 5 2 2 44 42 9 3 1 1
50.5
39.4
6.1
1.3
1.3
1.5Pe
rcen
t of S
ampl
es (%
)
201320142015
Perc
ent
BC
1 1 6 29 640 0 5 35 591.0 2.9
8.5
31.1
56.5
Perc
ent o
f Sam
ple
(%)
201320142015
BC%
Perc
ent
Broken Corn as a % of BCFM
Avg (%)
Std Dev (%)
2015 0.6 0.422014 0.6 0.362013 0.7 0.46

2015/2016 CORN HARVEST QUALITY REPORT10
4. Foreign MaterialForeign material is of importance because it has reduced feed or processing value. It is also generally higher in moisture content than the corn and therefore creates a potential for deterioration of corn quality during storage. Foreign material also contributes to the spout-line and has the possibility of creating more quality problems than broken corn because of the higher moisture level, as mentioned above.
RESULTS• Foreign material in the U.S. Aggregate samples averaged
0.2% in 2015, the same as 2014, 2013 and 4YA. Combines are designed to remove most fine material, and they appear to be functioning very well, given the consistently low level of foreign material found across the years.
• Variability, measured by standard deviation, among the U.S. Aggregate samples in 2015 (0.27%) was greater than 2014 (0.19%), 2013 (0.23%), and 4YA (0.20%).
• Foreign material in the 2015 samples ranged from 0.0 to 4.5%, compared to 2014 (0.0 to 5.5%) and 2013 (0.0 to 2.5%).
• In the 2015 crop, 90.8% of the samples contained less than 0.5% foreign material, fewer than in 2014 (94%) and 2013 (92%).
• All ECAs had average foreign material values equal to 0.2% in 2015, 2014, and 4YA.
U.S. Aggregate
Foreign Material (%)
Pacific Northwest
Gulf
Southern Rail
0.2
0.2 0.2
Export Catchment Area Average
92 5 2 0 0 0 94 4 1 0 0 0
90.8
6.3
1.1
0.8
0.2
0.8Pe
rcen
t of S
ampl
es (%
)
201320142015
Perc
ent
FM
Avg (%)
Std Dev (%)
2015 0.2 0.272014 0.2 0.192013 0.2 0.23
I I I . QUALIT Y TEST RESULTS (cont inued)
2015/2016 CORN HARVEST QUALITY REPORT 11
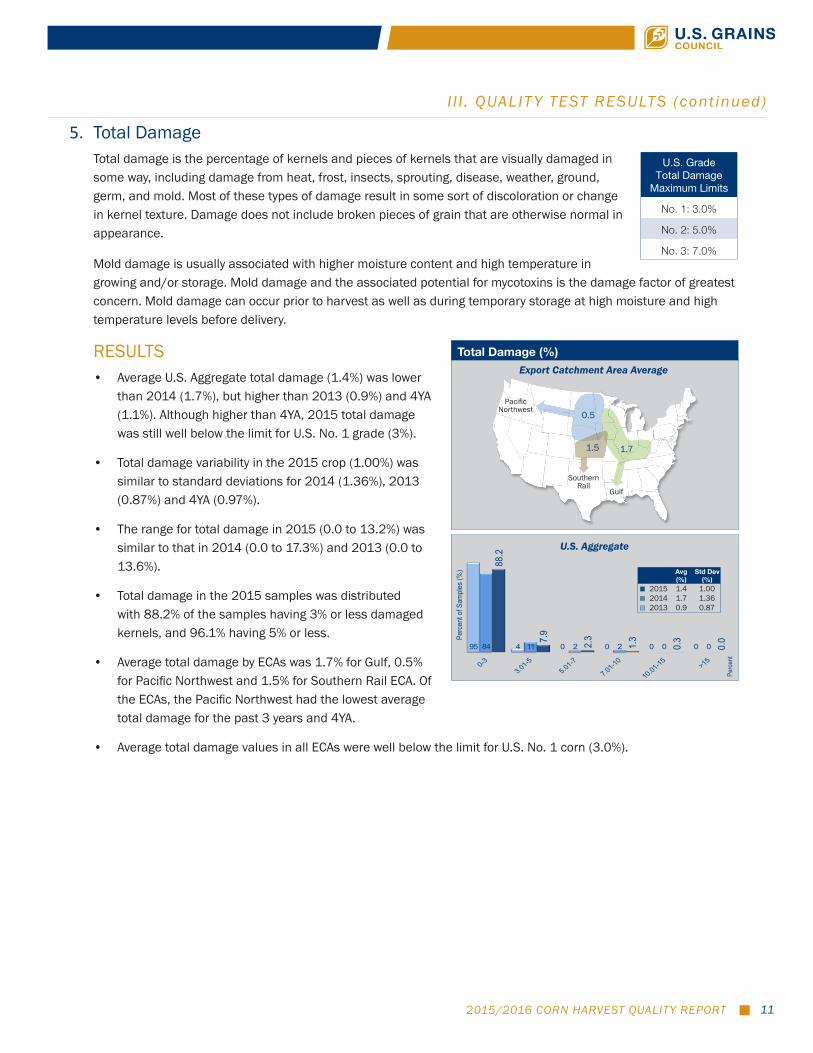
5. Total DamageTotal damage is the percentage of kernels and pieces of kernels that are visually damaged in some way, including damage from heat, frost, insects, sprouting, disease, weather, ground, germ, and mold. Most of these types of damage result in some sort of discoloration or change in kernel texture. Damage does not include broken pieces of grain that are otherwise normal in appearance.
Mold damage is usually associated with higher moisture content and high temperature in growing and/or storage. Mold damage and the associated potential for mycotoxins is the damage factor of greatest concern. Mold damage can occur prior to harvest as well as during temporary storage at high moisture and high temperature levels before delivery.
RESULTS• Average U.S. Aggregate total damage (1.4%) was lower
than 2014 (1.7%), but higher than 2013 (0.9%) and 4YA (1.1%). Although higher than 4YA, 2015 total damage was still well below the limit for U.S. No. 1 grade (3%).
• Total damage variability in the 2015 crop (1.00%) was similar to standard deviations for 2014 (1.36%), 2013 (0.87%) and 4YA (0.97%).
• The range for total damage in 2015 (0.0 to 13.2%) was similar to that in 2014 (0.0 to 17.3%) and 2013 (0.0 to 13.6%).
• Total damage in the 2015 samples was distributed with 88.2% of the samples having 3% or less damaged kernels, and 96.1% having 5% or less.
• Average total damage by ECAs was 1.7% for Gulf, 0.5% for Pacific Northwest and 1.5% for Southern Rail ECA. Of the ECAs, the Pacific Northwest had the lowest average total damage for the past 3 years and 4YA.
• Average total damage values in all ECAs were well below the limit for U.S. No. 1 corn (3.0%).
U.S. Grade Total Damage
Maximum Limits
No. 1: 3.0%
No. 2: 5.0%
No. 3: 7.0%
U.S. Aggregate
Total Damage (%)
Pacific Northwest
Gulf
Southern Rail
0.5
1.5 1.7
Export Catchment Area Average
95 4 0 0 0 0 84 11 2 2 0 0
88.2
7.9
2.3
1.3
0.3
0.0Pe
rcen
t of S
ampl
es (%
)
201320142015
Perc
ent
Total Damage
Avg (%)
Std Dev (%)
2015 1.4 1.002014 1.7 1.362013 0.9 0.87
I I I . QUALIT Y TEST RESULTS (cont inued)
2015/2016 CORN HARVEST QUALITY REPORT12
6. Heat DamageHeat damage is a subset of total damage and has separate allowances in the U.S. Grade standards. Heat damage can be caused by microbiological activity in warm, moist grain or by high heat applied during drying. Heat damage is seldom present in corn delivered at harvest directly from farms.
RESULTS• There was no heat damage reported in any of the 2015 samples, the same results as
2014, 2013 and 4YA.
• The absence of heat damage likely was due in part to fresh samples coming directly from farm to elevator with minimal prior drying.
U.S. Grade Heat Damage
Maximum Limits
No. 1: 0.1%
No. 2: 0.2%
No. 3: 0.5%
I I I . QUALIT Y TEST RESULTS (cont inued)
2015/2016 CORN HARVEST QUALITY REPORT 13
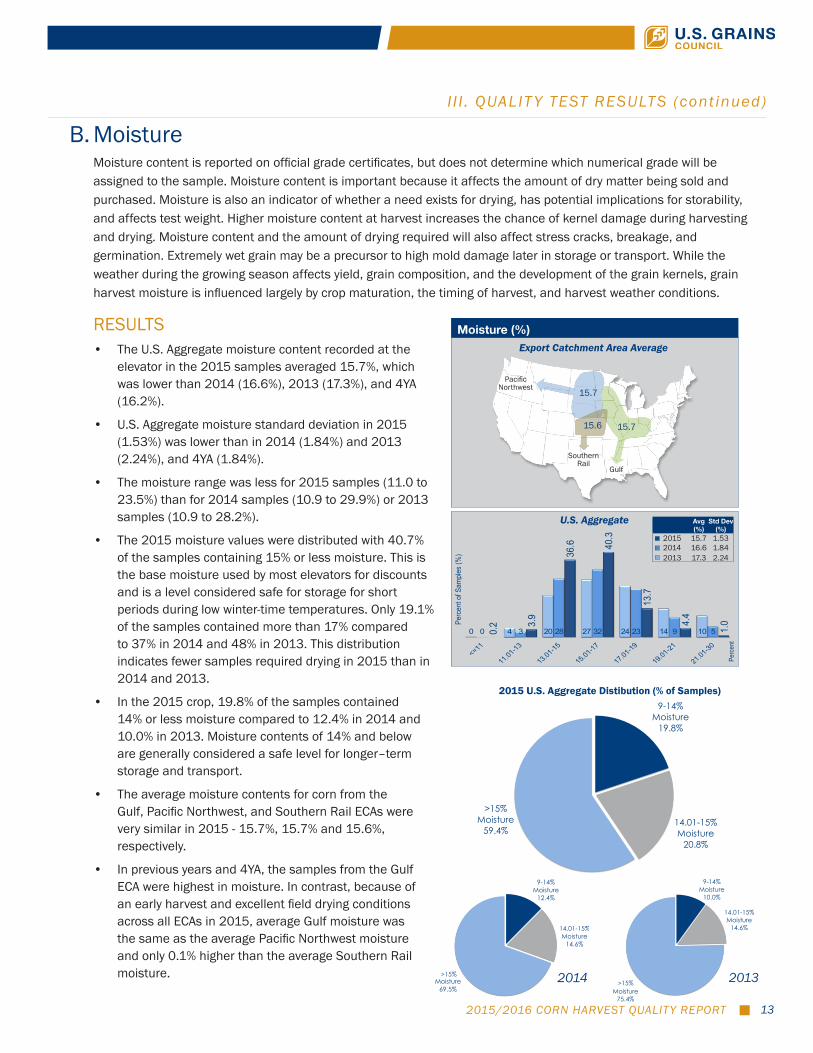
B. MoistureMoisture content is reported on official grade certificates, but does not determine which numerical grade will be assigned to the sample. Moisture content is important because it affects the amount of dry matter being sold and purchased. Moisture is also an indicator of whether a need exists for drying, has potential implications for storability, and affects test weight. Higher moisture content at harvest increases the chance of kernel damage during harvesting and drying. Moisture content and the amount of drying required will also affect stress cracks, breakage, and germination. Extremely wet grain may be a precursor to high mold damage later in storage or transport. While the weather during the growing season affects yield, grain composition, and the development of the grain kernels, grain harvest moisture is influenced largely by crop maturation, the timing of harvest, and harvest weather conditions.
RESULTS• The U.S. Aggregate moisture content recorded at the
elevator in the 2015 samples averaged 15.7%, which was lower than 2014 (16.6%), 2013 (17.3%), and 4YA (16.2%).
• U.S. Aggregate moisture standard deviation in 2015 (1.53%) was lower than in 2014 (1.84%) and 2013 (2.24%), and 4YA (1.84%).
• The moisture range was less for 2015 samples (11.0 to 23.5%) than for 2014 samples (10.9 to 29.9%) or 2013 samples (10.9 to 28.2%).
• The 2015 moisture values were distributed with 40.7% of the samples containing 15% or less moisture. This is the base moisture used by most elevators for discounts and is a level considered safe for storage for short periods during low winter-time temperatures. Only 19.1% of the samples contained more than 17% compared to 37% in 2014 and 48% in 2013. This distribution indicates fewer samples required drying in 2015 than in 2014 and 2013.
• In the 2015 crop, 19.8% of the samples contained 14% or less moisture compared to 12.4% in 2014 and 10.0% in 2013. Moisture contents of 14% and below are generally considered a safe level for longer–term storage and transport.
• The average moisture contents for corn from the Gulf, Pacific Northwest, and Southern Rail ECAs were very similar in 2015 - 15.7%, 15.7% and 15.6%, respectively.
• In previous years and 4YA, the samples from the Gulf ECA were highest in moisture. In contrast, because of an early harvest and excellent field drying conditions across all ECAs in 2015, average Gulf moisture was the same as the average Pacific Northwest moisture and only 0.1% higher than the average Southern Rail moisture.
U.S. Aggregate
Moisture (%)
Pacific Northwest
Gulf
Southern Rail
15.7
15.6 15.7
Export Catchment Area Average
0 4 20 27 24 14 100 3 28 32 23 9 5 0.2 3.
9
36.6 40
.3
13.7
4.4
1.0Pe
rcen
t of S
ampl
es (%
)
201320142015
Perc
ent
Moisture Elevator
Avg (%)
Std Dev (%)
2015 15.7 1.532014 16.6 1.842013 17.3 2.24
I I I . QUALIT Y TEST RESULTS (cont inued)
9-14%Moisture
12.4%
14.01-15%Moisture
14.6%
>15%Moisture
69.5%2014 2013
9-14%Moisture
10.0%
14.01-15%Moisture
14.6%
>15%Moisture
75.4%
9-14%Moisture
19.8%
14.01-15% Moisture
20.8%
>15%Moisture
59.4%
U.S. Aggregate Distribution (% of Samples)
2015 U.S. Aggregate Distibution (% of Samples)

2015/2016 CORN HARVEST QUALITY REPORT14
I I I . QUALIT Y TEST RESULTS (cont inued)
SUMMARY: GRADE FACTORS AND MOISTURE
2015 Harvest 2014 Harvest 2013 Harvest4 Year Avg.
(2011-2014)No. of
Samples1 Avg.Std. Dev. Min. Max.
No. of Samples1 Avg.
Std. Dev.
No. of Samples1 Avg.
Std. Dev. Avg.
Std. Dev.
U.S. Aggregate U.S. Aggregate U.S. Aggregate U.S. Aggregate
Test Weight (lb/bu) 620 58.2 1.08 53.4 61.5 629 57.6* 1.34 610 57.9* 1.51 58.1 1.39
Test Weight (kg/hl) 620 74.9 1.38 68.7 79.2 629 74.2* 1.72 610 74.5* 1.95 74.8 1.79
BCFM (%) 620 0.8 0.61 0.1 12.0 629 0.8 0.50 610 0.9* 0.61 0.9 0.58
Broken Corn (%) 620 0.6 0.42 0.0 7.5 629 0.6 0.36 610 0.7* 0.46 0.7 0.44
Foreign Material (%) 620 0.2 0.27 0.0 4.5 629 0.2* 0.19 610 0.2 0.23 0.2 0.20
Total Damage (%) 620 1.4 1.00 0.0 13.2 629 1.7* 1.36 609 0.9* 0.87 1.1 0.97
Heat Damage (%) 620 0.0 0.00 0.0 0.0 629 0.0 0.00 610 0.0 0.00 0.0 0.00
Moisture (%) 620 15.7 1.53 11.0 23.5 629 16.6* 1.84 610 17.3* 2.24 16.2 1.84 Gulf Gulf Gulf Gulf
Test Weight (lb/bu) 577 58.3 1.10 53.4 61.5 583 57.8* 1.34 557 58.1 1.49 58.3 1.39
Test Weight (kg/hl) 577 75.0 1.41 68.7 79.2 583 74.5* 1.73 557 74.8 1.91 75.0 1.78
BCFM (%) 577 0.8 0.63 0.1 12.0 583 0.8 0.48 557 0.8* 0.59 0.8 0.55
Broken Corn (%) 577 0.5 0.41 0.0 7.5 583 0.6* 0.37 557 0.7* 0.45 0.7 0.43
Foreign Material (%) 577 0.2 0.30 0.0 4.5 583 0.2* 0.15 557 0.2* 0.22 0.2 0.19
Total Damage (%) 577 1.7 1.17 0.0 13.2 583 2.2* 1.72 556 0.9* 0.95 1.3 1.15
Heat Damage (%) 577 0.0 0.00 0.0 0.0 583 0.0 0.00 557 0.0 0.00 0.0 0.00
Moisture (%) 577 15.7 1.51 11.0 23.3 583 16.9* 1.93 557 17.7* 2.38 16.6 1.95 Pacific Northwest Pacific Northwest Pacific Northwest Pacific Northwest
Test Weight (lb/bu) 329 57.9 1.02 53.4 61.2 262 56.6* 1.36 259 56.5* 1.60 57.3 1.42
Test Weight (kg/hl) 329 74.6 1.31 68.7 78.8 262 72.9* 1.75 259 72.8* 2.06 73.8 1.83
BCFM (%) 329 0.8 0.66 0.1 12.0 262 0.9 0.62 259 1.1* 0.70 1.0 0.66
Broken Corn (%) 329 0.6 0.48 0.0 7.5 262 0.6 0.38 259 0.8* 0.49 0.8 0.48
Foreign Material (%) 329 0.2 0.25 0.0 4.5 262 0.2 0.31 259 0.3* 0.28 0.2 0.25
Total Damage (%)2 329 0.5 0.53 0.0 4.9 262 0.4* 0.39 259 0.6 0.64 0.5 0.45
Heat Damage (%) 329 0.0 0.00 0.0 0.0 262 0.0 0.00 259 0.0 0.00 0.0 0.00
Moisture (%) 329 15.7 1.55 11.0 23.5 262 16.1* 1.75 259 16.4* 2.08 15.2 1.63 Southern Rail Southern Rail Southern Rail Southern Rail
Test Weight (lb/bu) 402 58.4 1.08 53.4 61.5 371 58.0* 1.30 313 58.3 1.56 58.4 1.36
Test Weight (kg/hl) 402 75.1 1.38 68.7 79.2 371 74.7* 1.67 313 75.1 2.00 75.1 1.75
BCFM (%) 402 0.7 0.46 0.1 12.0 371 0.7 0.45 313 0.9* 0.63 0.9 0.57
Broken Corn (%) 402 0.5 0.32 0.0 7.5 371 0.5 0.31 313 0.7* 0.46 0.7 0.43
Foreign Material (%) 402 0.2 0.20 0.0 4.5 371 0.2 0.20 313 0.2 0.25 0.2 0.20
Total Damage (%) 402 1.5 1.01 0.0 11.1 371 1.3* 1.00 313 1.0* 0.74 1.0 0.81
Heat Damage (%) 402 0.0 0.00 0.0 0.0 371 0.0 0.00 313 0.0 0.00 0.0 0.00
Moisture (%) 402 15.6 1.57 11.0 23.3 371 16.0* 1.54 313 16.6* 1.74 15.5 1.61
*Indicates averages in 2014 were significantly different from 2015, and 2013 averages were significantly different from 2015 based on a 2-tailed t-test at the 95% level of significance.1Due to the ECA results being composite statistics, the sum of the sample numbers from the three ECAs is greater than the U.S. Aggregate.2The Relative ME for predicting the 2015 harvest population average exceeded ±10%.
2015/2016 CORN HARVEST QUALITY REPORT 15
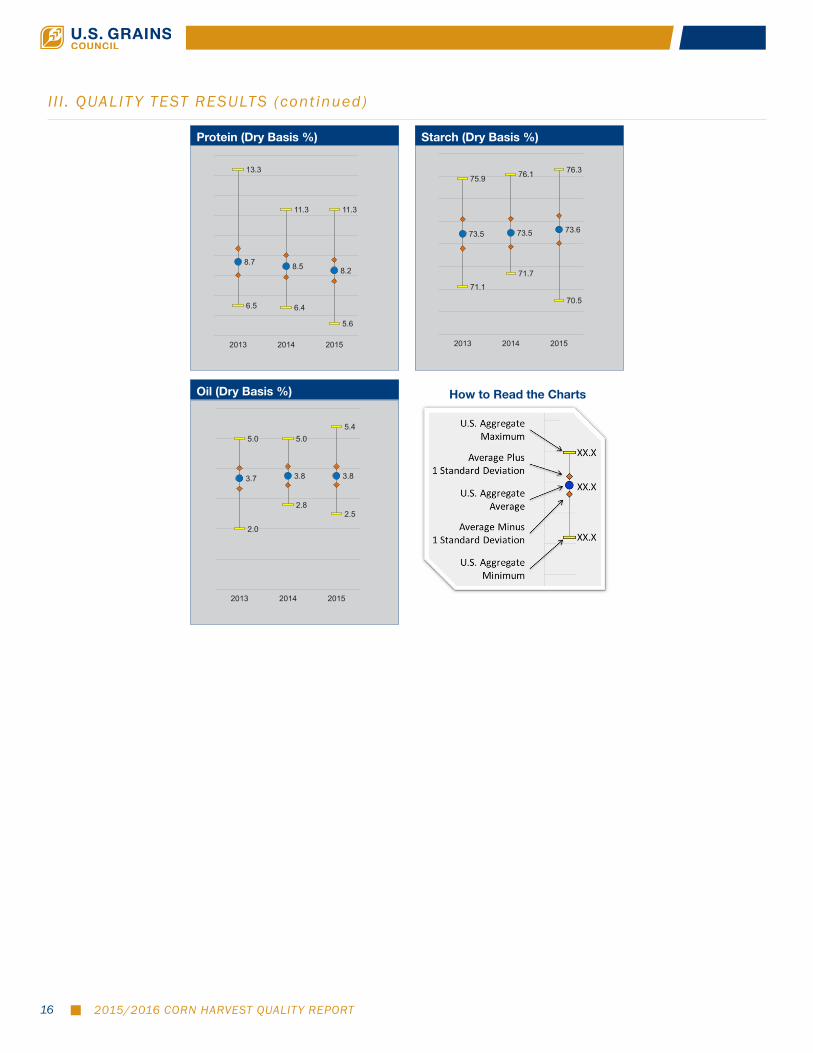
• The lower average U.S. Aggregate protein concentration in 2015 (8.2% dry basis) and 2014 compared to 4YA is likely attributable to higher yields in 2015 and 2014 than in the previous three years. During the 2015 and 2014 growing seasons, available nitrogen was distributed over more bushels per acre (or more metric tons per hectare) of corn, causing protein concentrations to be lower than in 2013.
• The Gulf ECA had lower protein concentrations than the other ECAs in 2015, 2014, 2013, and 4YA.
• Average U.S. Aggregate starch concentration in 2015 (73.6% dry basis) was higher than 2014, 2013, and 4YA. The higher starch in 2015, resulting in part from good growing and kernel filling conditions, should be desirable for corn wet milling.
• The Gulf ECA had higher starch concentrations than the other ECAs in 2015, 2014, 2013, and 4YA.
• Average U.S. Aggregate oil concentration (3.8% dry basis) was the same as 2014 but higher than 2013 and 4YA.
• Oil concentration averages were higher for the Gulf and Southern Rail ECAs than for the Pacific Northwest ECA in 2015, 2014, 2013, and 4YA.
• Chemical composition was less variable in 2015 than in the previous two years (based on lower standard deviations for protein, starch, and oil).
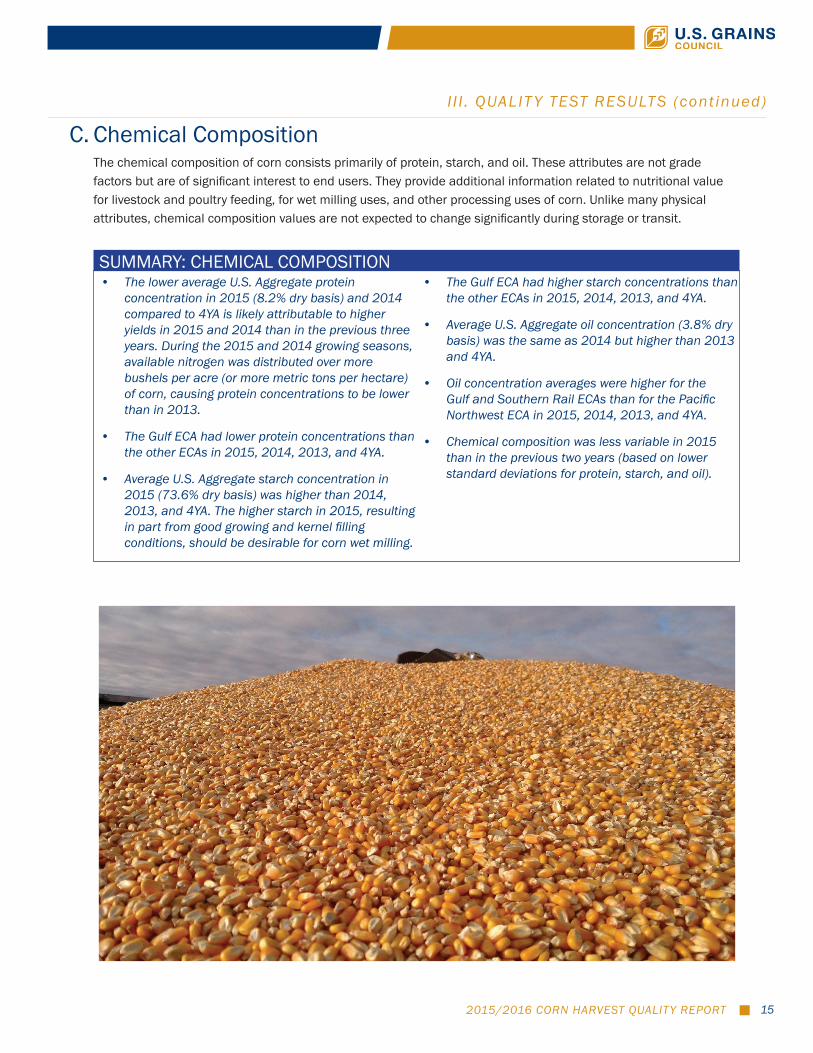
C. Chemical CompositionThe chemical composition of corn consists primarily of protein, starch, and oil. These attributes are not grade factors but are of significant interest to end users. They provide additional information related to nutritional value for livestock and poultry feeding, for wet milling uses, and other processing uses of corn. Unlike many physical attributes, chemical composition values are not expected to change significantly during storage or transit.
SUMMARY: CHEMICAL COMPOSITION
I I I . QUALIT Y TEST RESULTS (cont inued)
2015/2016 CORN HARVEST QUALITY REPORT16
I I I . QUALIT Y TEST RESULTS (cont inued)
Starch (Dry Basis %)Protein (Dry Basis %)
Oil (Dry Basis %) How to Read the Charts
73.5 73.5 73.6
75.9 76.1 76.3
71.1
71.7
70.5
2013 2014 2015
Starch (Dry Basis %)
3.7 3.8 3.8
5.0 5.0 5.4
2.0
2.8 2.5
2013 2014 2015
Oil (Dry Basis %)
8.7 8.5 8.2
13.3
11.3 11.3
6.5 6.4
5.6
2013 2014 2015
Protein (Dry Basis %)

2015/2016 CORN HARVEST QUALITY REPORT 17
1. ProteinProtein is very important for poultry and livestock feeding. It supplies essential sulfur-containing amino acids and helps to improve feed conversion efficiency. Protein tends to decrease with decreased available soil nitrogen and in years with high crop yields. Protein is usually inversely related to starch concentration. Results are reported on a dry basis.
RESULTS• In 2015, U.S. Aggregate protein concentration averaged
8.2%, lower than 2014 (8.5%), 2013 (8.7%), and 4YA (8.8%).
• U.S. Aggregate protein standard deviation in 2015 (0.53%) was lower than 2014 (0.55%), 2013 (0.66%), and 4YA (0.62%).
• Protein concentration range in 2015 (5.6 to 11.3%) was intermediate to the range in 2014 (6.4 to 11.3%) and 2013 (6.5 to 13.3%).
• Protein concentrations in 2015 were distributed with 33.4% below 8.0%, 52.1% between 8.0 and 8.99%, and 14.6% at or above 9.0%. The protein distribution in 2015 shows fewer samples with high levels of protein than in 2014 or 2013.
• Protein concentration averages for Gulf, Pacific Northwest, and Southern Rail ECAs were 8.1%, 8.7%, and 8.3%, respectively. The Gulf ECA had the lowest protein for 2015, 2014, 2013, and 4YA.
• Based on U.S. Aggregate averages over the past five years, protein concentration tends to increase as true density increases, as shown in the figure to the right (a correlation coefficient of 0.93). Protein concentration appears to be lower in years with lower true density (2015) and higher in years with higher true density (2012).
• Over the past five crop years, 11 of the 12 states surveyed have shown a negative relationship between average state corn yield and average state protein concentration. In general, when their average yield has increased, average protein concentration has decreased.
I I I . QUALIT Y TEST RESULTS (cont inued)
0 1 16 49 26 5 2 0 0 21 57 18 3 0 0.2 3.2
30.0
52.1
12.1
2.3
0.2Pe
rcen
t of S
ampl
es (%
)
201320142015
Perc
ent
(Dry
Basis
)
Protein
U.S. Aggregate
Protein (%)
Pacific Northwest
Gulf
Southern Rail
8.7
8.3 8.1
Export Catchment Area Average
Avg (%)
Std Dev (%)
2015 8.2 0.532014 8.5 0.552013 8.7 0.66
True Density vs Protein over 5 Years
y = 0.0185x + 1.1022R² = 0.87
1.250
1.255
1.260
1.265
1.270
1.275
1.280
8.0 8.2 8.4 8.6 8.8 9.0 9.2 9.4 9.6
True
Den
sity
(g/c
m3 )
Protein (Dry Basis %)
True Density vs. Protein over 5 Years
2015
2014 2013
2012
2011

2015/2016 CORN HARVEST QUALITY REPORT18
2. StarchStarch is an important factor for corn used by wet millers and dry-grind ethanol manufacturers. High starch concentration is often indicative of good kernel growing/filling conditions and reasonably moderate kernel densities. Starch is usually inversely related to protein concentration. Results are reported on a dry basis.
RESULTS• U.S. Aggregate starch concentration averaged 73.6% in
2015, higher than 73.5% in both 2014 and 2013, and 73.3% for 4YA.
• U.S. Aggregate starch standard deviation in 2015 (0.61%) was lower than 2014 (0.63%), 2013 (0.65%), and 4YA (0.64%).
• Starch concentration range in 2015 (70.5 to 76.3%) was similar to 2014 (71.7 to 76.1%) and 2013 (71.1 to 75.9%).
• Starch concentrations in 2015 were distributed with 15.7% of the samples at 72.99% or lower, 52.1% between 73.0 and 73.99%, and 31.8% at 74.0% and higher. The distribution shows more samples had higher levels of starch in 2015 than in 2014 and 2013. The higher concentrations of starch in 2015 were likely due in part to a high percentage of the crop having near 75% good-to-excellent crop growing conditions and low plant stress during the grain filling period.
• Starch concentration averages for the Gulf, Pacific Northwest, and Southern Rail ECAs were 73.7%, 73.5% and 73.5%, respectively. Starch concentration averages were highest in the Gulf ECA in 2015, 2014, 2013 and 4YA. Thus, the Gulf ECA had highest starch and lowest protein in each of the last three years and 4YA.
• Since starch and protein are the two largest components in corn, when the percentage of one goes up, the other usually goes down. This relationship is illustrated in the adjacent figure showing a weak but negative correlation (-0.62) between starch and protein.
I I I . QUALIT Y TEST RESULTS (cont inued)
0 4 22 50 23 2 0 1 20 52 25 2 0.3
0.6
14.8
52.1
28.7
3.1Pe
rcen
t of S
ampl
es (%
)
201320142015
Perc
ent
(Dry
Basis
)
Starch
U.S. Aggregate
Starch (%)
Pacific Northwest
Gulf
Southern Rail
73.5
73.5 73.7
Export Catchment Area Average
Avg (%)
Std Dev (%)
2015 73.6 0.612014 73.5 0.632013 73.5 0.65
Starch vs Protein
y = -0.6258x + 78.806
70
71
72
73
74
75
76
77
5 6 7 8 9 10 11 12
Star
ch (%
)
Protein (%)
2015/2016 CORN HARVEST QUALITY REPORT 19
I I I . QUALIT Y TEST RESULTS (cont inued)
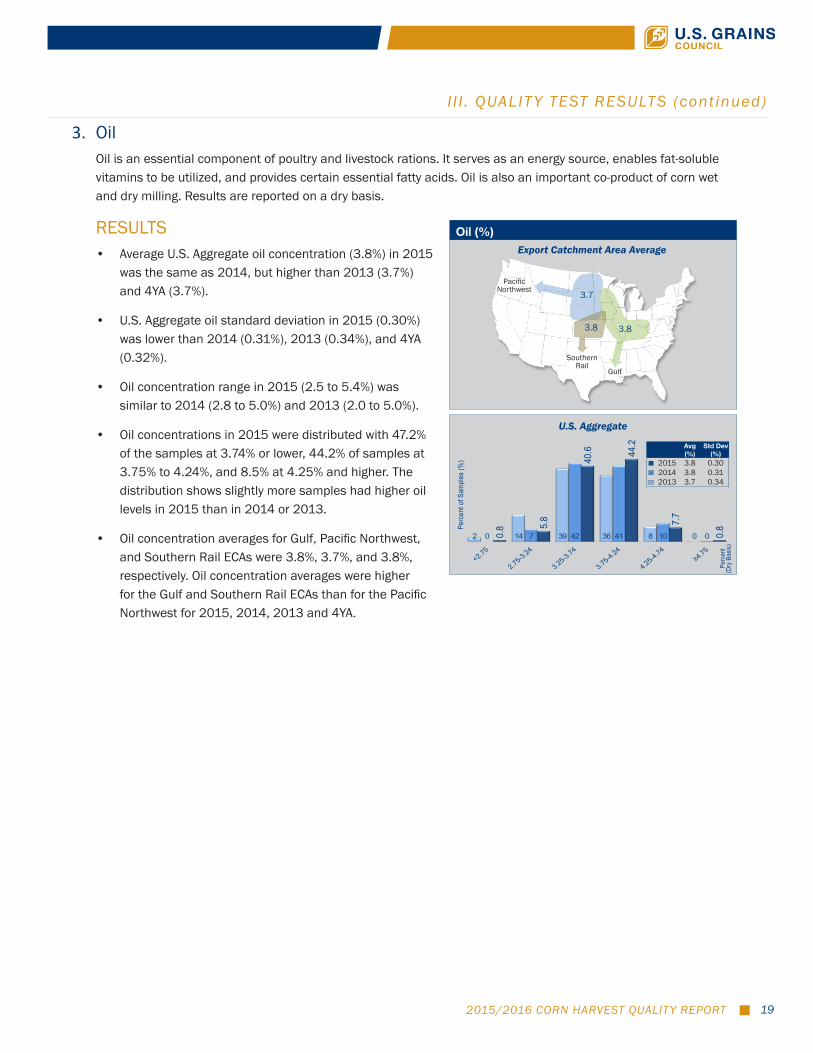
3. OilOil is an essential component of poultry and livestock rations. It serves as an energy source, enables fat-soluble vitamins to be utilized, and provides certain essential fatty acids. Oil is also an important co-product of corn wet and dry milling. Results are reported on a dry basis.
RESULTS• Average U.S. Aggregate oil concentration (3.8%) in 2015
was the same as 2014, but higher than 2013 (3.7%) and 4YA (3.7%).
• U.S. Aggregate oil standard deviation in 2015 (0.30%) was lower than 2014 (0.31%), 2013 (0.34%), and 4YA (0.32%).
• Oil concentration range in 2015 (2.5 to 5.4%) was similar to 2014 (2.8 to 5.0%) and 2013 (2.0 to 5.0%).
• Oil concentrations in 2015 were distributed with 47.2% of the samples at 3.74% or lower, 44.2% of samples at 3.75% to 4.24%, and 8.5% at 4.25% and higher. The distribution shows slightly more samples had higher oil levels in 2015 than in 2014 or 2013.
• Oil concentration averages for Gulf, Pacific Northwest, and Southern Rail ECAs were 3.8%, 3.7%, and 3.8%, respectively. Oil concentration averages were higher for the Gulf and Southern Rail ECAs than for the Pacific Northwest for 2015, 2014, 2013 and 4YA.
U.S. Aggregate
Oil (%)
Pacific Northwest
Gulf
Southern Rail
3.7
3.8 3.8
Export Catchment Area Average
2 14 39 36 8 0 0 7 42 41 10 0 0.8 5.
8
40.6 44
.2
7.7
0.8Pe
rcen
t of S
ampl
es (%
)
201320142015
Perc
ent
(Dry
Basis
)
Oil
Avg (%)
Std Dev (%)
2015 3.8 0.302014 3.8 0.312013 3.7 0.34
2015/2016 CORN HARVEST QUALITY REPORT20
I I I . QUALIT Y TEST RESULTS (cont inued)
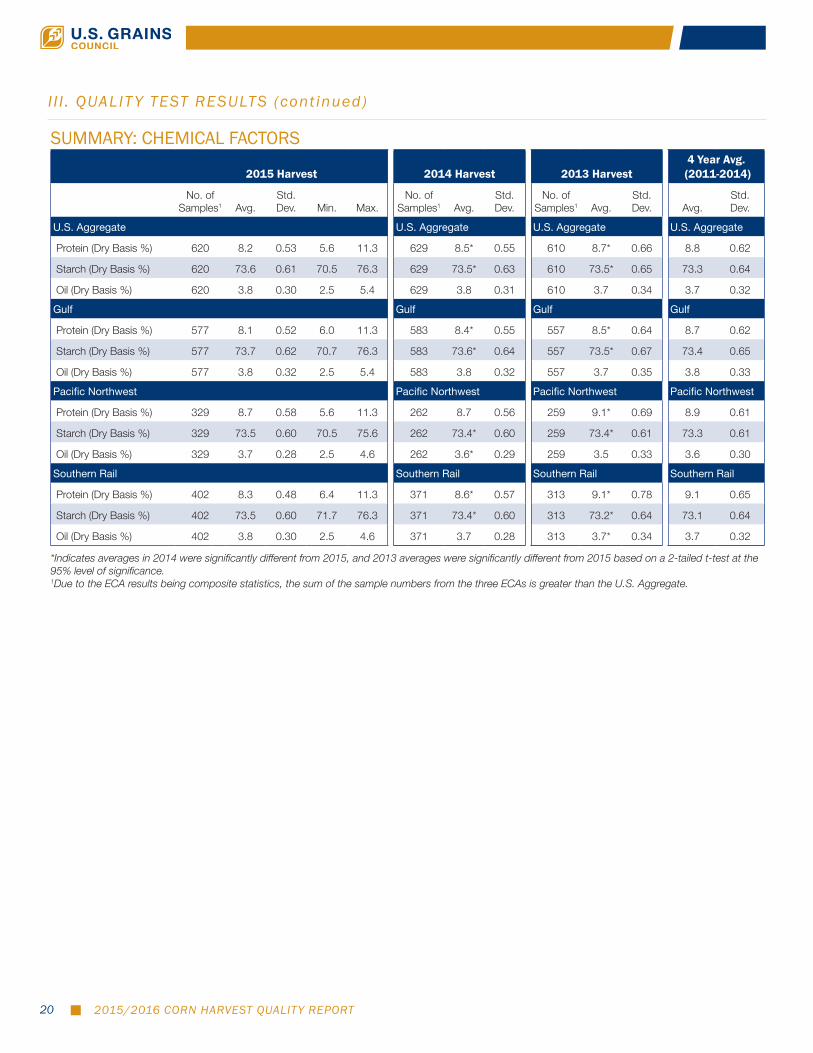
SUMMARY: CHEMICAL FACTORS
2015 Harvest 2014 Harvest 2013 Harvest4 Year Avg.
(2011-2014)
No. of Samples1 Avg.
Std. Dev. Min. Max.
No. of Samples1 Avg.
Std. Dev.
No. of Samples1 Avg.
Std. Dev. Avg.
Std. Dev.
U.S. Aggregate U.S. Aggregate U.S. Aggregate U.S. Aggregate
Protein (Dry Basis %) 620 8.2 0.53 5.6 11.3 629 8.5* 0.55 610 8.7* 0.66 8.8 0.62
Starch (Dry Basis %) 620 73.6 0.61 70.5 76.3 629 73.5* 0.63 610 73.5* 0.65 73.3 0.64
Oil (Dry Basis %) 620 3.8 0.30 2.5 5.4 629 3.8 0.31 610 3.7 0.34 3.7 0.32
Gulf Gulf Gulf Gulf
Protein (Dry Basis %) 577 8.1 0.52 6.0 11.3 583 8.4* 0.55 557 8.5* 0.64 8.7 0.62
Starch (Dry Basis %) 577 73.7 0.62 70.7 76.3 583 73.6* 0.64 557 73.5* 0.67 73.4 0.65
Oil (Dry Basis %) 577 3.8 0.32 2.5 5.4 583 3.8 0.32 557 3.7 0.35 3.8 0.33
Pacific Northwest Pacific Northwest Pacific Northwest Pacific Northwest
Protein (Dry Basis %) 329 8.7 0.58 5.6 11.3 262 8.7 0.56 259 9.1* 0.69 8.9 0.61
Starch (Dry Basis %) 329 73.5 0.60 70.5 75.6 262 73.4* 0.60 259 73.4* 0.61 73.3 0.61
Oil (Dry Basis %) 329 3.7 0.28 2.5 4.6 262 3.6* 0.29 259 3.5 0.33 3.6 0.30
Southern Rail Southern Rail Southern Rail Southern Rail
Protein (Dry Basis %) 402 8.3 0.48 6.4 11.3 371 8.6* 0.57 313 9.1* 0.78 9.1 0.65
Starch (Dry Basis %) 402 73.5 0.60 71.7 76.3 371 73.4* 0.60 313 73.2* 0.64 73.1 0.64
Oil (Dry Basis %) 402 3.8 0.30 2.5 4.6 371 3.7 0.28 313 3.7* 0.34 3.7 0.32
*Indicates averages in 2014 were significantly different from 2015, and 2013 averages were significantly different from 2015 based on a 2-tailed t-test at the 95% level of significance.1Due to the ECA results being composite statistics, the sum of the sample numbers from the three ECAs is greater than the U.S. Aggregate.
2015/2016 CORN HARVEST QUALITY REPORT 21
I I I . QUALIT Y TEST RESULTS (cont inued)
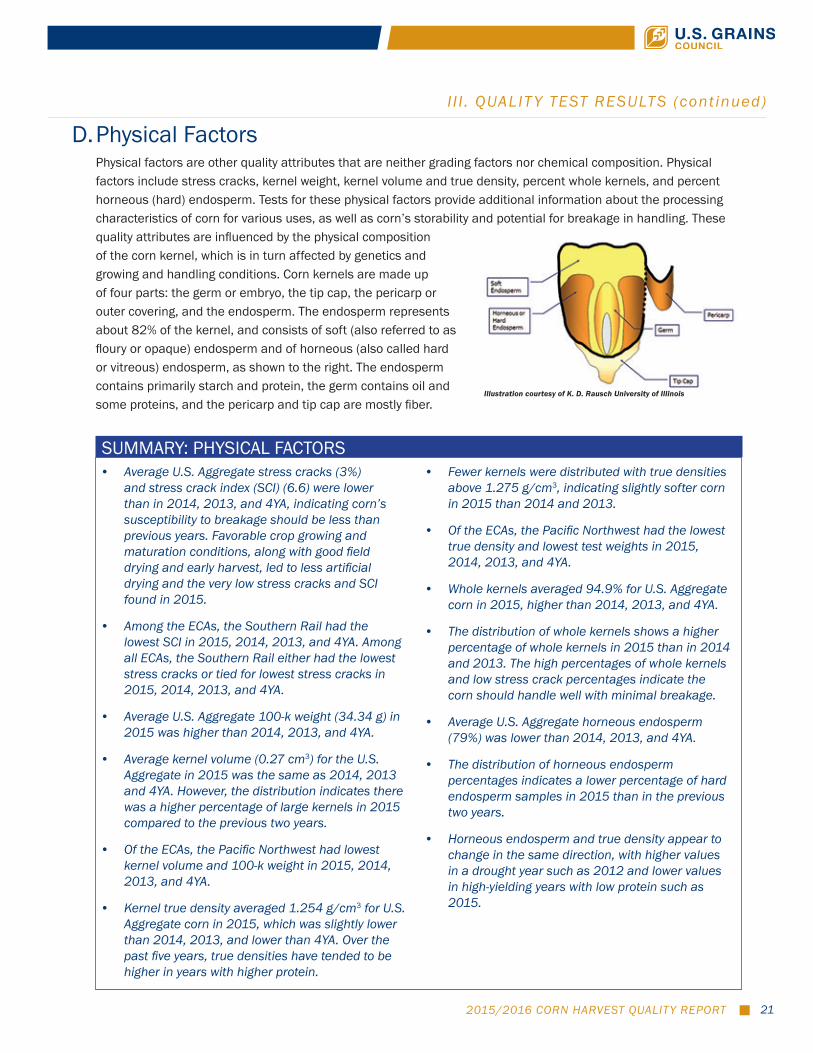
D. Physical FactorsPhysical factors are other quality attributes that are neither grading factors nor chemical composition. Physical factors include stress cracks, kernel weight, kernel volume and true density, percent whole kernels, and percent horneous (hard) endosperm. Tests for these physical factors provide additional information about the processing characteristics of corn for various uses, as well as corn’s storability and potential for breakage in handling. These quality attributes are influenced by the physical composition of the corn kernel, which is in turn affected by genetics and growing and handling conditions. Corn kernels are made up of four parts: the germ or embryo, the tip cap, the pericarp or outer covering, and the endosperm. The endosperm represents about 82% of the kernel, and consists of soft (also referred to as floury or opaque) endosperm and of horneous (also called hard or vitreous) endosperm, as shown to the right. The endosperm contains primarily starch and protein, the germ contains oil and some proteins, and the pericarp and tip cap are mostly fiber.
SUMMARY: PHYSICAL FACTORS• Average U.S. Aggregate stress cracks (3%)
and stress crack index (SCI) (6.6) were lower than in 2014, 2013, and 4YA, indicating corn’s susceptibility to breakage should be less than previous years. Favorable crop growing and maturation conditions, along with good field drying and early harvest, led to less artificial drying and the very low stress cracks and SCI found in 2015.
• Among the ECAs, the Southern Rail had the lowest SCI in 2015, 2014, 2013, and 4YA. Among all ECAs, the Southern Rail either had the lowest stress cracks or tied for lowest stress cracks in 2015, 2014, 2013, and 4YA.
• Average U.S. Aggregate 100-k weight (34.34 g) in 2015 was higher than 2014, 2013, and 4YA.
• Average kernel volume (0.27 cm3) for the U.S. Aggregate in 2015 was the same as 2014, 2013 and 4YA. However, the distribution indicates there was a higher percentage of large kernels in 2015 compared to the previous two years.
• Of the ECAs, the Pacific Northwest had lowest kernel volume and 100-k weight in 2015, 2014, 2013, and 4YA.
• Kernel true density averaged 1.254 g/cm3 for U.S. Aggregate corn in 2015, which was slightly lower than 2014, 2013, and lower than 4YA. Over the past five years, true densities have tended to be higher in years with higher protein.
• Fewer kernels were distributed with true densities above 1.275 g/cm3, indicating slightly softer corn in 2015 than 2014 and 2013.
• Of the ECAs, the Pacific Northwest had the lowest true density and lowest test weights in 2015, 2014, 2013, and 4YA.
• Whole kernels averaged 94.9% for U.S. Aggregate corn in 2015, higher than 2014, 2013, and 4YA.
• The distribution of whole kernels shows a higher percentage of whole kernels in 2015 than in 2014 and 2013. The high percentages of whole kernels and low stress crack percentages indicate the corn should handle well with minimal breakage.
• Average U.S. Aggregate horneous endosperm (79%) was lower than 2014, 2013, and 4YA.
• The distribution of horneous endosperm percentages indicates a lower percentage of hard endosperm samples in 2015 than in the previous two years.
• Horneous endosperm and true density appear to change in the same direction, with higher values in a drought year such as 2012 and lower values in high-yielding years with low protein such as 2015.
Illustration courtesy of K. D. Rausch University of Illinois

2015/2016 CORN HARVEST QUALITY REPORT22
I I I . QUALIT Y TEST RESULTS (cont inued)
Stress Cracks (%) Stress Crack Index
100-Kernel Weight (g) Kernel Volume (cm3) True Density (g/cm3)
Whole Kernel (%) Horneous Endosperm (%)
How to Read the Charts
9 83
86
100
75
0 0 02013 2014 2015
Stress Cracks (%)
22.8 20.2 6.6
324.0
410.0
180.0
0.0 0.0 0.0 2013 2014 2015
Stress Crack Index
33.41 34.03 34.34
45.09 46.30 45.64
18.07 19.70
24.90
2013 2014 2015
100-Kernel Weight (g)
1.258 1.259 1.254
1.326 1.340
1.327
1.157 1.160 1.166
2013 2014 2015
True Density (g/cm3)
0.27 0.27 0.27
0.36 0.36 0.36
0.15 0.16
0.21
2013 2014 2015
Kernel Volume (cm3)
92.4 93.6 94.9
99.6 99.8 99.8
73.6
63.6
78.4
2013 2014 2015
Whole Kernels (%)
82 82
79
96 9795
71 71 71
2013 2014 2015
Horneous Endosperm (%)

2015/2016 CORN HARVEST QUALITY REPORT 23
I I I . QUALIT Y TEST RESULTS (cont inued)
Stress cracks are internal fissures in the horneous (hard) endosperm of a corn kernel. The pericarps (or outer covering) of stress-cracked kernels are typically not damaged, so the kernel may appear unaffected at first glance, even if stress cracks are present.
The cause of stress cracks is pressure buildup due to moisture and temperature gradients within the kernel’s horneous endosperm. This can be likened to the internal cracks that appear when an ice cube is dropped into a lukewarm beverage. The internal stresses do not build up as much in the soft, floury endosperm as in the hard, horneous endosperm; therefore, corn with a higher percentage of horneous endosperm is more susceptible to stress cracking than softer grain. A kernel may have one, two, or multiple stress cracks. High-temperature drying causing rapid moisture removal is the most common cause of stress cracks. The impact of high levels of stress cracks on various uses includes:
• General: Increased susceptibility to breakage during handling, leading to increased broken corn which will likely need to be removed during cleaning operations for processors, and possible reduced grade/value.
• Wet Milling: Lower starch yields because the starch and protein become more difficult to separate. Stress cracks may also alter steeping requirements.
• Dry Milling: Lower yield of large flaking grits (the prime product of many dry milling operations).
• Alkaline Cooking: Non-uniform water absorption leading to overcooking or undercooking, which affects the process balance.
Growing conditions will affect crop maturity, timeliness of harvest, and the need for artificial drying, which will influence the degree of stress cracking found from region to region. For example, late maturity or late harvest caused by weather-related factors such as rain-delayed planting or cool temperatures may increase the need for artificial drying, thus potentially increasing the occurrence of stress cracks.
Stress crack measurements include “stress cracks” (the percent of kernels with at least one crack) and stress crack index (SCI), which is the weighted average of single, double, and multiple stress cracks. “Stress cracks” measures only the number of kernels with stress cracks, whereas SCI shows the severity of stress cracking. For example, if half the kernels have only single stress cracks, “stress cracks” is 50% and the SCI is 50 (50 X 1). However, if all the cracks are multiple stress cracks (more than 2 cracks), indicating a higher potential for handling breakage, “stress cracks” remains at 50% but the SCI becomes 250 (50 X 5). Lower values for “stress cracks” and the SCI are always more desirable. In years with high levels of stress cracks, the SCI provides valuable information because high SCI numbers (perhaps 300 to 500) indicate the sample had a very high percentage of multiple stress cracks. Multiple stress cracks are generally more detrimental to quality changes than single stress cracks.
1. Stress Cracks
2015/2016 CORN HARVEST QUALITY REPORT24
I I I . QUALIT Y TEST RESULTS (cont inued)
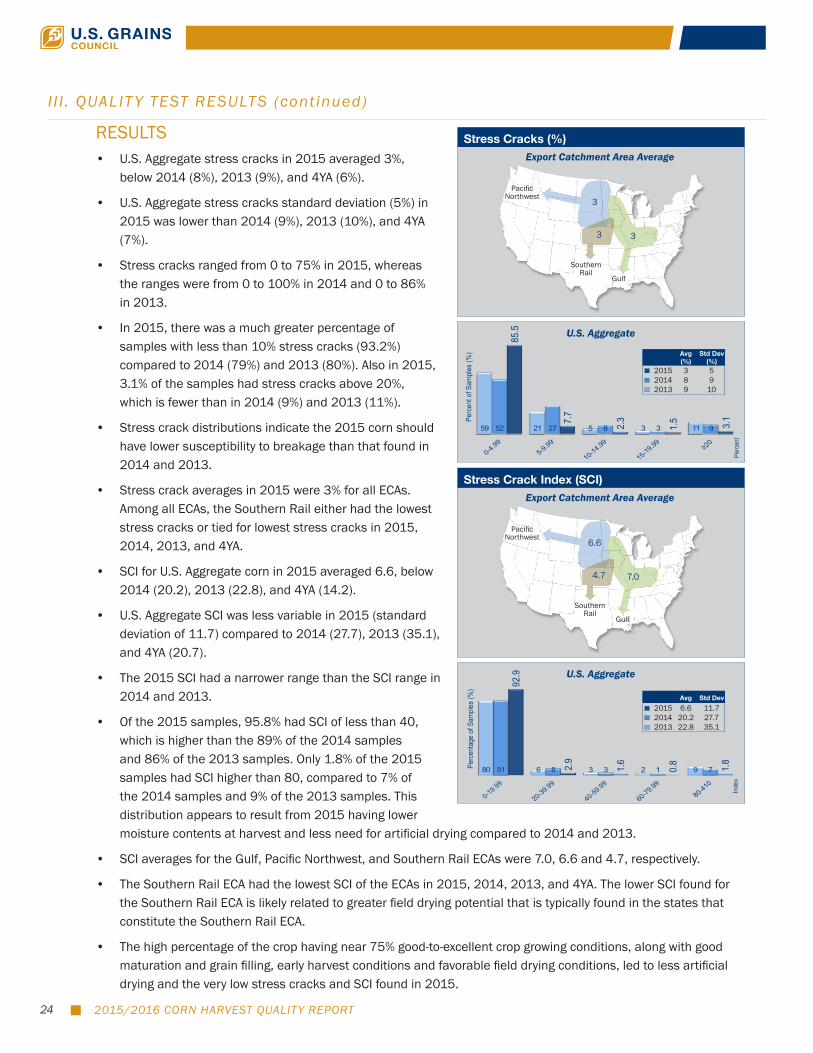
RESULTS• U.S. Aggregate stress cracks in 2015 averaged 3%,
below 2014 (8%), 2013 (9%), and 4YA (6%).
• U.S. Aggregate stress cracks standard deviation (5%) in 2015 was lower than 2014 (9%), 2013 (10%), and 4YA (7%).
• Stress cracks ranged from 0 to 75% in 2015, whereas the ranges were from 0 to 100% in 2014 and 0 to 86% in 2013.
• In 2015, there was a much greater percentage of samples with less than 10% stress cracks (93.2%) compared to 2014 (79%) and 2013 (80%). Also in 2015, 3.1% of the samples had stress cracks above 20%, which is fewer than in 2014 (9%) and 2013 (11%).
• Stress crack distributions indicate the 2015 corn should have lower susceptibility to breakage than that found in 2014 and 2013.
• Stress crack averages in 2015 were 3% for all ECAs. Among all ECAs, the Southern Rail either had the lowest stress cracks or tied for lowest stress cracks in 2015, 2014, 2013, and 4YA.
• SCI for U.S. Aggregate corn in 2015 averaged 6.6, below 2014 (20.2), 2013 (22.8), and 4YA (14.2).
• U.S. Aggregate SCI was less variable in 2015 (standard deviation of 11.7) compared to 2014 (27.7), 2013 (35.1), and 4YA (20.7).
• The 2015 SCI had a narrower range than the SCI range in 2014 and 2013.
• Of the 2015 samples, 95.8% had SCI of less than 40, which is higher than the 89% of the 2014 samples and 86% of the 2013 samples. Only 1.8% of the 2015 samples had SCI higher than 80, compared to 7% of the 2014 samples and 9% of the 2013 samples. This distribution appears to result from 2015 having lower moisture contents at harvest and less need for artificial drying compared to 2014 and 2013.
• SCI averages for the Gulf, Pacific Northwest, and Southern Rail ECAs were 7.0, 6.6 and 4.7, respectively.
• The Southern Rail ECA had the lowest SCI of the ECAs in 2015, 2014, 2013, and 4YA. The lower SCI found for the Southern Rail ECA is likely related to greater field drying potential that is typically found in the states that constitute the Southern Rail ECA.
• The high percentage of the crop having near 75% good-to-excellent crop growing conditions, along with good maturation and grain filling, early harvest conditions and favorable field drying conditions, led to less artificial drying and the very low stress cracks and SCI found in 2015.
U.S. Aggregate
Stress Crack Index (SCI)
Pacific Northwest
Gulf
Southern Rail
6.6
4.7 7.0
Export Catchment Area Average
80 6 3 2 9 81 8 3 1 7
92.9
2.9
1.6
0.8 1.8Perc
enta
ge o
f Sam
ples
(%)
201320142015
Inde
x
SCI
Avg Std Dev2015 6.6 11.72014 20.2 27.72013 22.8 35.1
59 21 5 3 1152 27 8 3 9
85.5
7.7
2.3
1.5 3.1Pe
rcen
t of S
ampl
es (%
)
201320142015
Perc
ent
SC %
U.S. Aggregate
Stress Cracks (%)
Pacific Northwest
Gulf
Southern Rail
3
3 3
Export Catchment Area Average
Avg (%)
Std Dev (%)
2015 3 52014 8 92013 9 10

2015/2016 CORN HARVEST QUALITY REPORT 25
2. 100-Kernel Weight100-kernel (100-k) weight (reported in grams) indicates larger kernel size as 100-k weight increases. Kernel size affects drying rates. As kernel size increases, the volume-to-surface-area-ratio becomes higher, and as the ratio gets higher, drying becomes slower. In addition, large uniform-sized kernels often enable higher flaking grit yields in dry milling. Kernel weights tend to be higher for specialty varieties of corn that have high amounts of horneous (hard) endosperm.
RESULTS• 100-k weight for U.S. Aggregate corn in 2015 averaged
34.34 g, higher than 2014 (34.03 g), 2013 (33.41 g), and 4YA (33.77 g).
• There was less variability in the 2015 U.S. Aggregate 100-k weights (standard deviation of 2.43 g) compared to 2014 (2.83 g), 2013 (2.88 g), and 4YA (2.78 g).
• 100-k weight range in 2015 was 24.90 to 45.64 g and was narrower than 2014 (19.70 to 46.30 g), 2013 (18.07 to 45.09 g), and 4YA (16.59 to 46.30 g).
• The 100-k weights in 2015 were distributed with 43.1% of the samples having 100-k weight of 35 g or greater, compared to 41% in 2014 and 39% in 2013. This distribution indicates a higher percentage of large kernels was found in 2015 than in the previous two years.
• Average 100-k weight was lowest for the Pacific Northwest ECA (33.08 g), compared to the Gulf (34.64 g) and Southern Rail (35.09 g) ECAs. The Pacific Northwest ECA also had the lowest 100-k weight in 2014, 2013, and 4YA.
I I I . QUALIT Y TEST RESULTS (cont inued)
U.S. Aggregate
100-k Weight (g)
Pacific Northwest
Gulf
Southern Rail
33.08
35.09 34.64
Export Catchment Area Average
0 2 24 35 33 6 0 0 0 14 44 34 7 0 0.0
0.2 6.
8
50.0
39.8
3.1
0.2Pe
rcen
t of S
ampl
es (%
)
201320142015
gram
s
100k
Avg (g)
Std Dev (g)
2015 34.34 2.432014 34.03 2.832015 33.41 2.88
2015/2016 CORN HARVEST QUALITY REPORT26
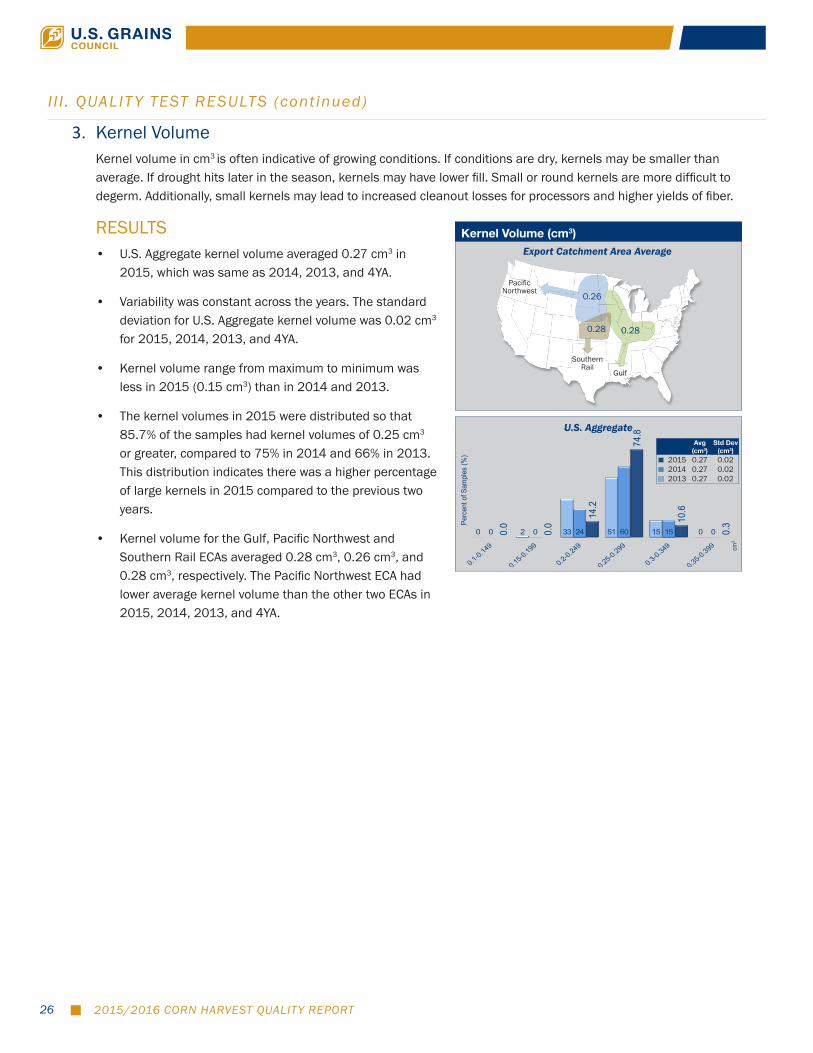
3. Kernel Volume Kernel volume in cm3 is often indicative of growing conditions. If conditions are dry, kernels may be smaller than average. If drought hits later in the season, kernels may have lower fill. Small or round kernels are more difficult to degerm. Additionally, small kernels may lead to increased cleanout losses for processors and higher yields of fiber.
RESULTS• U.S. Aggregate kernel volume averaged 0.27 cm3 in
2015, which was same as 2014, 2013, and 4YA.
• Variability was constant across the years. The standard deviation for U.S. Aggregate kernel volume was 0.02 cm3
for 2015, 2014, 2013, and 4YA.
• Kernel volume range from maximum to minimum was less in 2015 (0.15 cm3) than in 2014 and 2013.
• The kernel volumes in 2015 were distributed so that 85.7% of the samples had kernel volumes of 0.25 cm3 or greater, compared to 75% in 2014 and 66% in 2013. This distribution indicates there was a higher percentage of large kernels in 2015 compared to the previous two years.
• Kernel volume for the Gulf, Pacific Northwest and Southern Rail ECAs averaged 0.28 cm3, 0.26 cm3, and 0.28 cm3, respectively. The Pacific Northwest ECA had lower average kernel volume than the other two ECAs in 2015, 2014, 2013, and 4YA.
0 2 33 51 15 0 0 0 24 60 15 0 0.0
0.0
14.2
74.8
10.6
0.3Pe
rcen
t of S
ampl
es (%
)
201320142015
cm3
Kernel V
U.S. Aggregate
Kernel Volume (cm3)
Pacific Northwest
Gulf
Southern Rail
0.26
0.28 0.28
Export Catchment Area Average
Avg (cm3)
Std Dev (cm3)
2015 0.27 0.022014 0.27 0.022013 0.27 0.02
I I I . QUALIT Y TEST RESULTS (cont inued)
2015/2016 CORN HARVEST QUALITY REPORT 27
I I I . QUALIT Y TEST RESULTS (cont inued)
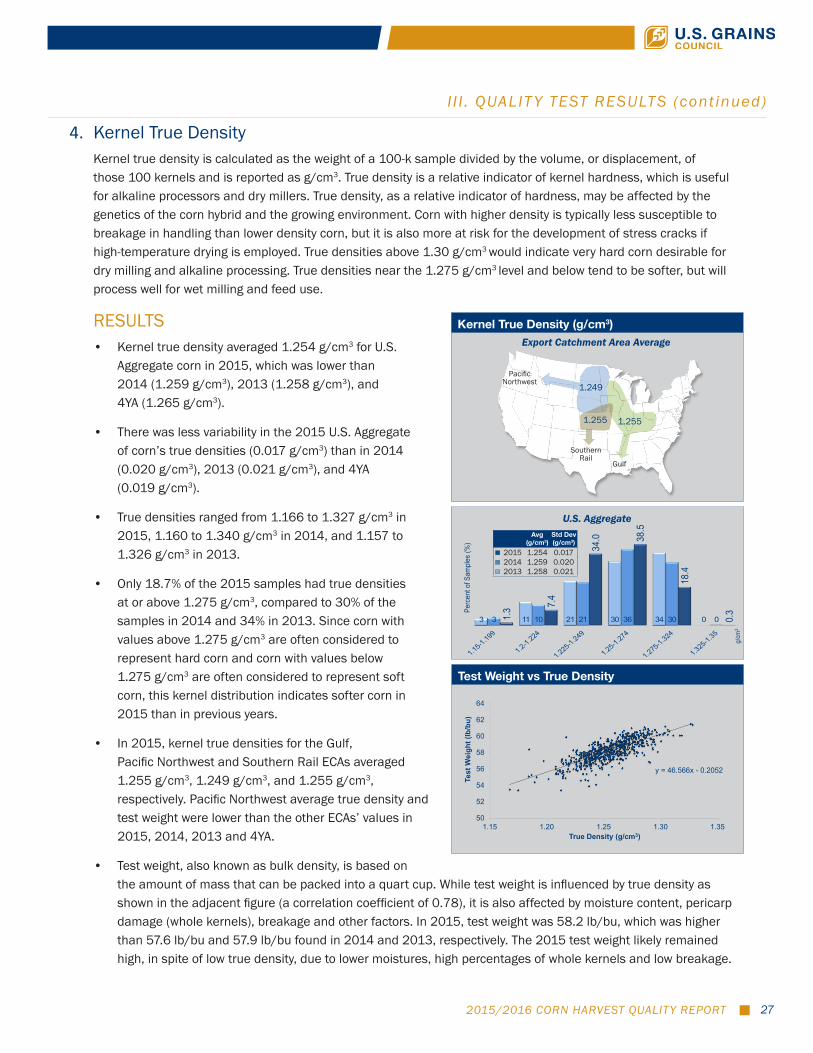
4. Kernel True DensityKernel true density is calculated as the weight of a 100-k sample divided by the volume, or displacement, of those 100 kernels and is reported as g/cm3. True density is a relative indicator of kernel hardness, which is useful for alkaline processors and dry millers. True density, as a relative indicator of hardness, may be affected by the genetics of the corn hybrid and the growing environment. Corn with higher density is typically less susceptible to breakage in handling than lower density corn, but it is also more at risk for the development of stress cracks if high-temperature drying is employed. True densities above 1.30 g/cm3 would indicate very hard corn desirable for dry milling and alkaline processing. True densities near the 1.275 g/cm3 level and below tend to be softer, but will process well for wet milling and feed use.
RESULTS• Kernel true density averaged 1.254 g/cm3 for U.S.
Aggregate corn in 2015, which was lower than 2014 (1.259 g/cm3), 2013 (1.258 g/cm3), and 4YA (1.265 g/cm3).
• There was less variability in the 2015 U.S. Aggregate of corn’s true densities (0.017 g/cm3) than in 2014 (0.020 g/cm3), 2013 (0.021 g/cm3), and 4YA (0.019 g/cm3).
• True densities ranged from 1.166 to 1.327 g/cm3 in 2015, 1.160 to 1.340 g/cm3 in 2014, and 1.157 to 1.326 g/cm3 in 2013.
• Only 18.7% of the 2015 samples had true densities at or above 1.275 g/cm3, compared to 30% of the samples in 2014 and 34% in 2013. Since corn with values above 1.275 g/cm3 are often considered to represent hard corn and corn with values below 1.275 g/cm3 are often considered to represent soft corn, this kernel distribution indicates softer corn in 2015 than in previous years.
• In 2015, kernel true densities for the Gulf, Pacific Northwest and Southern Rail ECAs averaged 1.255 g/cm3, 1.249 g/cm3, and 1.255 g/cm3, respectively. Pacific Northwest average true density and test weight were lower than the other ECAs’ values in 2015, 2014, 2013 and 4YA.
• Test weight, also known as bulk density, is based on the amount of mass that can be packed into a quart cup. While test weight is influenced by true density as shown in the adjacent figure (a correlation coefficient of 0.78), it is also affected by moisture content, pericarp damage (whole kernels), breakage and other factors. In 2015, test weight was 58.2 lb/bu, which was higher than 57.6 lb/bu and 57.9 lb/bu found in 2014 and 2013, respectively. The 2015 test weight likely remained high, in spite of low true density, due to lower moistures, high percentages of whole kernels and low breakage.
Test Weight vs True Density
y = 46.566x - 0.2052
50
52
54
56
58
60
62
64
1.15 1.20 1.25 1.30 1.35
Test
Wei
ght (
lb/b
u)
True Density (g/cm3)
U.S. Aggregate
Kernel True Density (g/cm3)
Pacific Northwest
Gulf
Southern Rail
1.249
1.255 1.255
Export Catchment Area Average
3 11 21 30 34 0 3 10 21 36 30 0 1.3 7.
4
34.0 38
.5
18.4
0.3Pe
rcen
t of S
ampl
es (%
)
201320142015
g/cm
3
Density
Avg (g/cm3)
Std Dev (g/cm3)
2015 1.254 0.0172014 1.259 0.0202013 1.258 0.021
2015/2016 CORN HARVEST QUALITY REPORT28
I I I . QUALIT Y TEST RESULTS (cont inued)
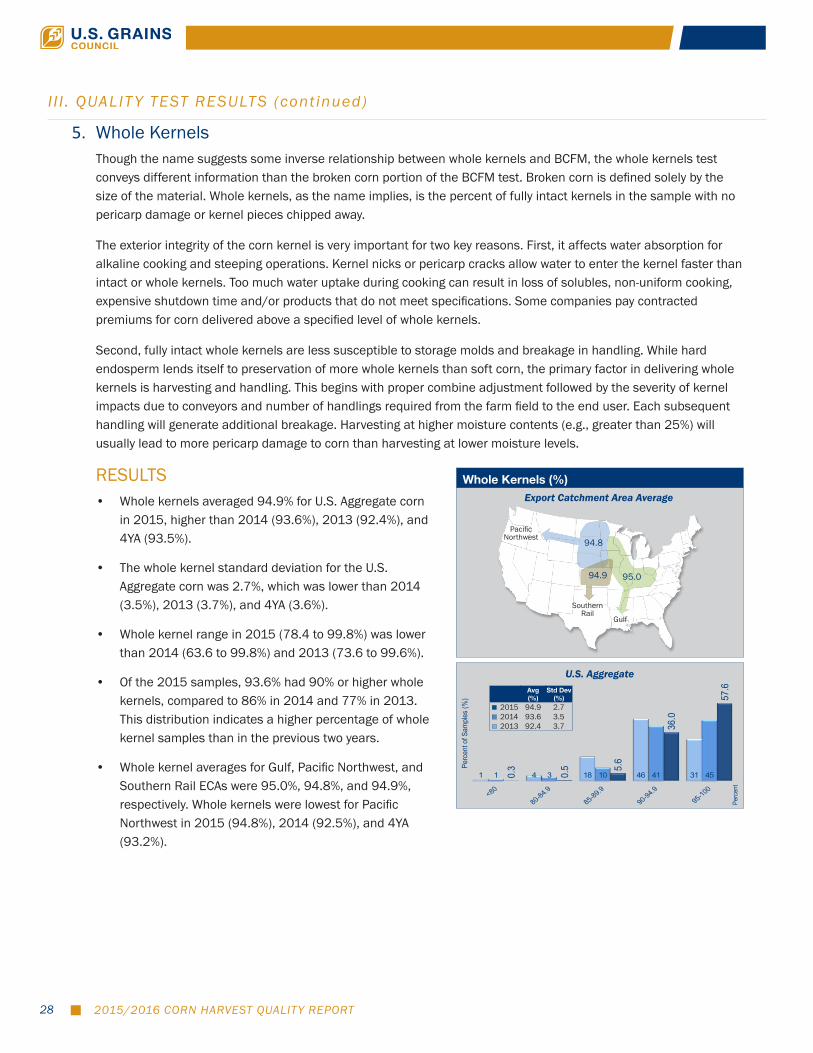
5. Whole KernelsThough the name suggests some inverse relationship between whole kernels and BCFM, the whole kernels test conveys different information than the broken corn portion of the BCFM test. Broken corn is defined solely by the size of the material. Whole kernels, as the name implies, is the percent of fully intact kernels in the sample with no pericarp damage or kernel pieces chipped away.
The exterior integrity of the corn kernel is very important for two key reasons. First, it affects water absorption for alkaline cooking and steeping operations. Kernel nicks or pericarp cracks allow water to enter the kernel faster than intact or whole kernels. Too much water uptake during cooking can result in loss of solubles, non-uniform cooking, expensive shutdown time and/or products that do not meet specifications. Some companies pay contracted premiums for corn delivered above a specified level of whole kernels.
Second, fully intact whole kernels are less susceptible to storage molds and breakage in handling. While hard endosperm lends itself to preservation of more whole kernels than soft corn, the primary factor in delivering whole kernels is harvesting and handling. This begins with proper combine adjustment followed by the severity of kernel impacts due to conveyors and number of handlings required from the farm field to the end user. Each subsequent handling will generate additional breakage. Harvesting at higher moisture contents (e.g., greater than 25%) will usually lead to more pericarp damage to corn than harvesting at lower moisture levels.
RESULTS• Whole kernels averaged 94.9% for U.S. Aggregate corn
in 2015, higher than 2014 (93.6%), 2013 (92.4%), and 4YA (93.5%).
• The whole kernel standard deviation for the U.S. Aggregate corn was 2.7%, which was lower than 2014 (3.5%), 2013 (3.7%), and 4YA (3.6%).
• Whole kernel range in 2015 (78.4 to 99.8%) was lower than 2014 (63.6 to 99.8%) and 2013 (73.6 to 99.6%).
• Of the 2015 samples, 93.6% had 90% or higher whole kernels, compared to 86% in 2014 and 77% in 2013. This distribution indicates a higher percentage of whole kernel samples than in the previous two years.
• Whole kernel averages for Gulf, Pacific Northwest, and Southern Rail ECAs were 95.0%, 94.8%, and 94.9%, respectively. Whole kernels were lowest for Pacific Northwest in 2015 (94.8%), 2014 (92.5%), and 4YA (93.2%).
U.S. Aggregate
Whole Kernels (%)
Pacific Northwest
Gulf
Southern Rail
94.8
94.9 95.0
Export Catchment Area Average
1 4 18 46 311 3 10 41 450.3
0.5 5.
6
36.0
57.6
Perc
ent o
f Sam
ples
(%)
201320142015
Perc
ent
Whole Kernels
Avg (%)
Std Dev (%)
2015 94.9 2.72014 93.6 3.52013 92.4 3.7
2015/2016 CORN HARVEST QUALITY REPORT 29
I I I . QUALIT Y TEST RESULTS (cont inued)
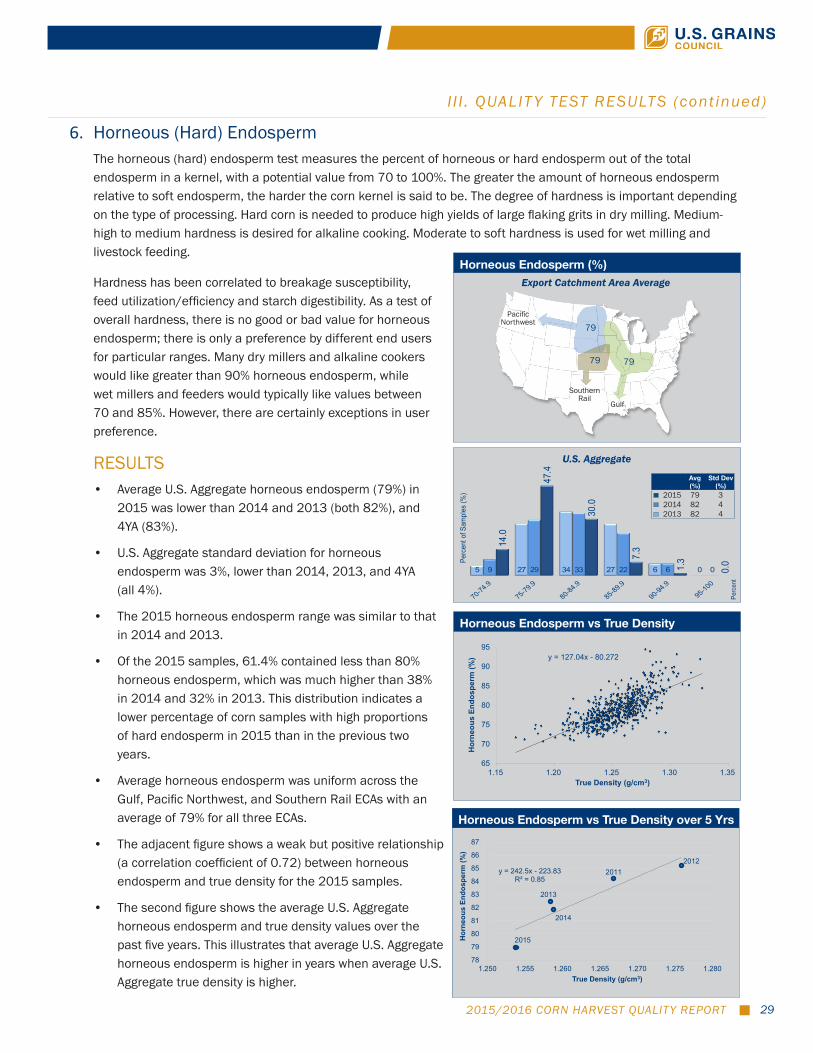
6. Horneous (Hard) EndospermThe horneous (hard) endosperm test measures the percent of horneous or hard endosperm out of the total endosperm in a kernel, with a potential value from 70 to 100%. The greater the amount of horneous endosperm relative to soft endosperm, the harder the corn kernel is said to be. The degree of hardness is important depending on the type of processing. Hard corn is needed to produce high yields of large flaking grits in dry milling. Medium-high to medium hardness is desired for alkaline cooking. Moderate to soft hardness is used for wet milling and livestock feeding.
Hardness has been correlated to breakage susceptibility, feed utilization/efficiency and starch digestibility. As a test of overall hardness, there is no good or bad value for horneous endosperm; there is only a preference by different end users for particular ranges. Many dry millers and alkaline cookers would like greater than 90% horneous endosperm, while wet millers and feeders would typically like values between 70 and 85%. However, there are certainly exceptions in user preference.
RESULTS• Average U.S. Aggregate horneous endosperm (79%) in
2015 was lower than 2014 and 2013 (both 82%), and 4YA (83%).
• U.S. Aggregate standard deviation for horneous endosperm was 3%, lower than 2014, 2013, and 4YA (all 4%).
• The 2015 horneous endosperm range was similar to that in 2014 and 2013.
• Of the 2015 samples, 61.4% contained less than 80% horneous endosperm, which was much higher than 38% in 2014 and 32% in 2013. This distribution indicates a lower percentage of corn samples with high proportions of hard endosperm in 2015 than in the previous two years.
• Average horneous endosperm was uniform across the Gulf, Pacific Northwest, and Southern Rail ECAs with an average of 79% for all three ECAs.
• The adjacent figure shows a weak but positive relationship (a correlation coefficient of 0.72) between horneous endosperm and true density for the 2015 samples.
• The second figure shows the average U.S. Aggregate horneous endosperm and true density values over the past five years. This illustrates that average U.S. Aggregate horneous endosperm is higher in years when average U.S. Aggregate true density is higher.
Horneous Endosperm vs True Density
y = 127.04x - 80.272
65
70
75
80
85
90
95
1.15 1.20 1.25 1.30 1.35
Hor
neou
s En
dosp
erm
(%)
True Density (g/cm3)
U.S. Aggregate
Horneous Endosperm (%)
Pacific Northwest
Gulf
Southern Rail
79
79 79
Export Catchment Area Average
5 27 34 27 6 0 9 29 33 22 6 0
14.0
47.4
30.0
7.3
1.3
0.0Pe
rcen
t of S
ampl
es (%
)
201320142015
Perc
ent
Horneous Endo
Avg (%)
Std Dev (%)
2015 79 32014 82 42013 82 4
Horneous Endosperm vs True Density over 5 Yrs
y = 242.5x - 223.83R² = 0.85
78
79
80
81
82
83
84
85
86
87
1.250 1.255 1.260 1.265 1.270 1.275 1.280
Hor
neou
s En
dosp
erm
(%)
True Density (g/cm3)
Horneous Endosperm vs. True Density over 5 Years
2015
2014
2013
20122011
2015/2016 CORN HARVEST QUALITY REPORT30
I I I . QUALIT Y TEST RESULTS (cont inued)
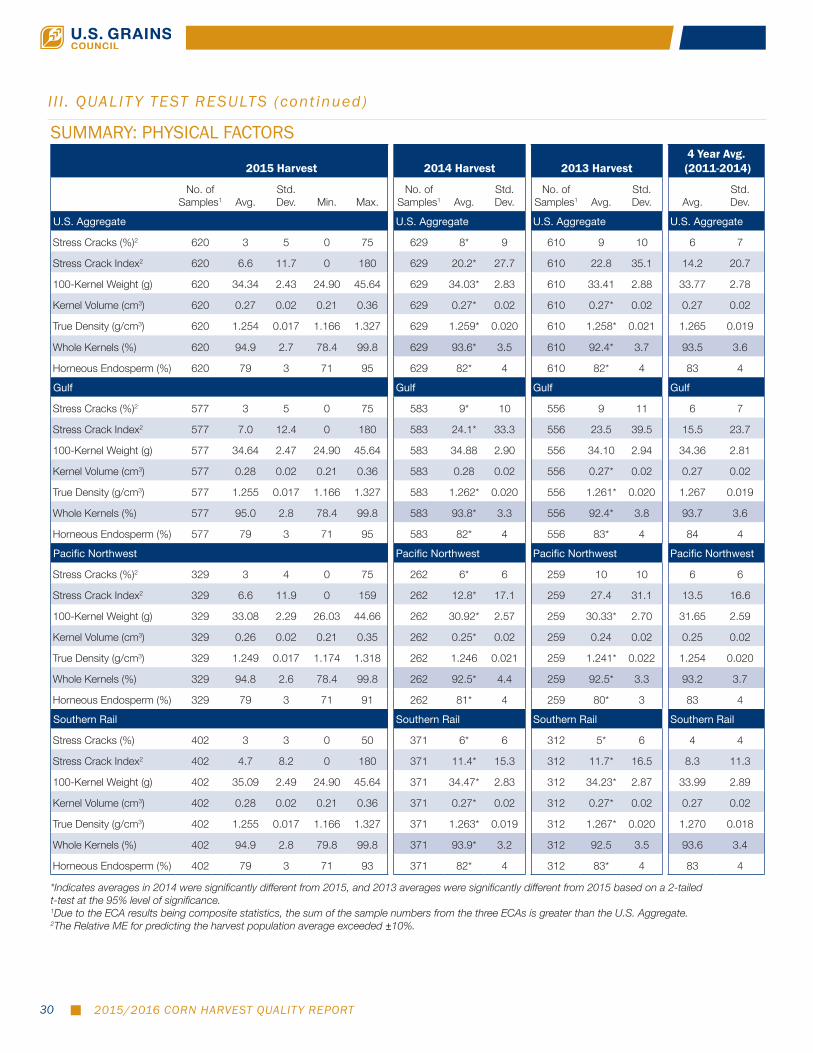
SUMMARY: PHYSICAL FACTORS
2015 Harvest 2014 Harvest 2013 Harvest4 Year Avg.
(2011-2014)
No. of Samples1 Avg.
Std. Dev. Min. Max.
No. of Samples1 Avg.
Std. Dev.
No. of Samples1 Avg.
Std. Dev. Avg.
Std. Dev.
U.S. Aggregate U.S. Aggregate U.S. Aggregate U.S. Aggregate
Stress Cracks (%)2 620 3 5 0 75 629 8* 9 610 9 10 6 7
Stress Crack Index2 620 6.6 11.7 0 180 629 20.2* 27.7 610 22.8 35.1 14.2 20.7
100-Kernel Weight (g) 620 34.34 2.43 24.90 45.64 629 34.03* 2.83 610 33.41 2.88 33.77 2.78
Kernel Volume (cm3) 620 0.27 0.02 0.21 0.36 629 0.27* 0.02 610 0.27* 0.02 0.27 0.02
True Density (g/cm3) 620 1.254 0.017 1.166 1.327 629 1.259* 0.020 610 1.258* 0.021 1.265 0.019
Whole Kernels (%) 620 94.9 2.7 78.4 99.8 629 93.6* 3.5 610 92.4* 3.7 93.5 3.6
Horneous Endosperm (%) 620 79 3 71 95 629 82* 4 610 82* 4 83 4
Gulf Gulf Gulf Gulf
Stress Cracks (%)2 577 3 5 0 75 583 9* 10 556 9 11 6 7
Stress Crack Index2 577 7.0 12.4 0 180 583 24.1* 33.3 556 23.5 39.5 15.5 23.7
100-Kernel Weight (g) 577 34.64 2.47 24.90 45.64 583 34.88 2.90 556 34.10 2.94 34.36 2.81
Kernel Volume (cm3) 577 0.28 0.02 0.21 0.36 583 0.28 0.02 556 0.27* 0.02 0.27 0.02
True Density (g/cm3) 577 1.255 0.017 1.166 1.327 583 1.262* 0.020 556 1.261* 0.020 1.267 0.019
Whole Kernels (%) 577 95.0 2.8 78.4 99.8 583 93.8* 3.3 556 92.4* 3.8 93.7 3.6
Horneous Endosperm (%) 577 79 3 71 95 583 82* 4 556 83* 4 84 4
Pacific Northwest Pacific Northwest Pacific Northwest Pacific Northwest
Stress Cracks (%)2 329 3 4 0 75 262 6* 6 259 10 10 6 6
Stress Crack Index2 329 6.6 11.9 0 159 262 12.8* 17.1 259 27.4 31.1 13.5 16.6
100-Kernel Weight (g) 329 33.08 2.29 26.03 44.66 262 30.92* 2.57 259 30.33* 2.70 31.65 2.59
Kernel Volume (cm3) 329 0.26 0.02 0.21 0.35 262 0.25* 0.02 259 0.24 0.02 0.25 0.02
True Density (g/cm3) 329 1.249 0.017 1.174 1.318 262 1.246 0.021 259 1.241* 0.022 1.254 0.020
Whole Kernels (%) 329 94.8 2.6 78.4 99.8 262 92.5* 4.4 259 92.5* 3.3 93.2 3.7
Horneous Endosperm (%) 329 79 3 71 91 262 81* 4 259 80* 3 83 4
Southern Rail Southern Rail Southern Rail Southern Rail
Stress Cracks (%) 402 3 3 0 50 371 6* 6 312 5* 6 4 4
Stress Crack Index2 402 4.7 8.2 0 180 371 11.4* 15.3 312 11.7* 16.5 8.3 11.3
100-Kernel Weight (g) 402 35.09 2.49 24.90 45.64 371 34.47* 2.83 312 34.23* 2.87 33.99 2.89
Kernel Volume (cm3) 402 0.28 0.02 0.21 0.36 371 0.27* 0.02 312 0.27* 0.02 0.27 0.02
True Density (g/cm3) 402 1.255 0.017 1.166 1.327 371 1.263* 0.019 312 1.267* 0.020 1.270 0.018
Whole Kernels (%) 402 94.9 2.8 79.8 99.8 371 93.9* 3.2 312 92.5 3.5 93.6 3.4
Horneous Endosperm (%) 402 79 3 71 93 371 82* 4 312 83* 4 83 4
*Indicates averages in 2014 were significantly different from 2015, and 2013 averages were significantly different from 2015 based on a 2-tailed t-test at the 95% level of significance.1Due to the ECA results being composite statistics, the sum of the sample numbers from the three ECAs is greater than the U.S. Aggregate.2The Relative ME for predicting the harvest population average exceeded ±10%.
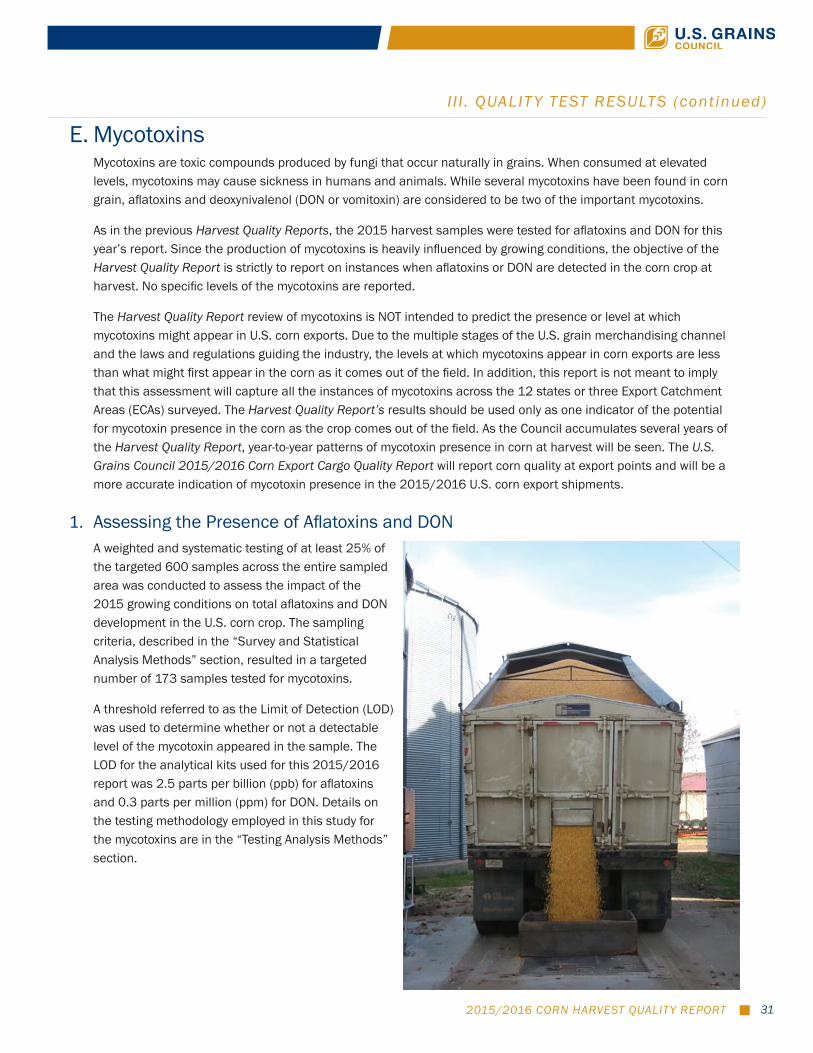
2015/2016 CORN HARVEST QUALITY REPORT 31
E. MycotoxinsMycotoxins are toxic compounds produced by fungi that occur naturally in grains. When consumed at elevated levels, mycotoxins may cause sickness in humans and animals. While several mycotoxins have been found in corn grain, aflatoxins and deoxynivalenol (DON or vomitoxin) are considered to be two of the important mycotoxins.
As in the previous Harvest Quality Reports, the 2015 harvest samples were tested for aflatoxins and DON for this year’s report. Since the production of mycotoxins is heavily influenced by growing conditions, the objective of the Harvest Quality Report is strictly to report on instances when aflatoxins or DON are detected in the corn crop at harvest. No specific levels of the mycotoxins are reported.
The Harvest Quality Report review of mycotoxins is NOT intended to predict the presence or level at which mycotoxins might appear in U.S. corn exports. Due to the multiple stages of the U.S. grain merchandising channel and the laws and regulations guiding the industry, the levels at which mycotoxins appear in corn exports are less than what might first appear in the corn as it comes out of the field. In addition, this report is not meant to imply that this assessment will capture all the instances of mycotoxins across the 12 states or three Export Catchment Areas (ECAs) surveyed. The Harvest Quality Report’s results should be used only as one indicator of the potential for mycotoxin presence in the corn as the crop comes out of the field. As the Council accumulates several years of the Harvest Quality Report, year-to-year patterns of mycotoxin presence in corn at harvest will be seen. The U.S. Grains Council 2015/2016 Corn Export Cargo Quality Report will report corn quality at export points and will be a more accurate indication of mycotoxin presence in the 2015/2016 U.S. corn export shipments.
1. Assessing the Presence of Aflatoxins and DONA weighted and systematic testing of at least 25% of the targeted 600 samples across the entire sampled area was conducted to assess the impact of the 2015 growing conditions on total aflatoxins and DON development in the U.S. corn crop. The sampling criteria, described in the “Survey and Statistical Analysis Methods” section, resulted in a targeted number of 173 samples tested for mycotoxins.
A threshold referred to as the Limit of Detection (LOD) was used to determine whether or not a detectable level of the mycotoxin appeared in the sample. The LOD for the analytical kits used for this 2015/2016 report was 2.5 parts per billion (ppb) for aflatoxins and 0.3 parts per million (ppm) for DON. Details on the testing methodology employed in this study for the mycotoxins are in the “Testing Analysis Methods” section.
I I I . QUALIT Y TEST RESULTS (cont inued)
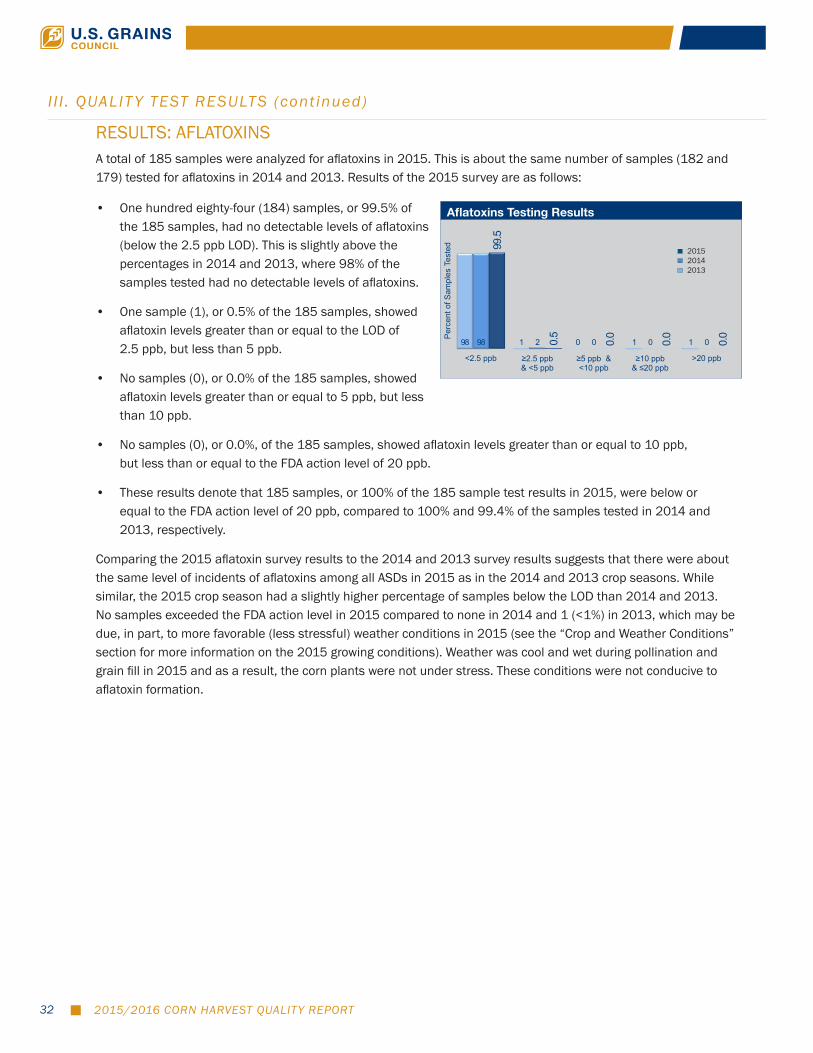
2015/2016 CORN HARVEST QUALITY REPORT32
RESULTS: AFLATOXINSA total of 185 samples were analyzed for aflatoxins in 2015. This is about the same number of samples (182 and 179) tested for aflatoxins in 2014 and 2013. Results of the 2015 survey are as follows:
• One hundred eighty-four (184) samples, or 99.5% of the 185 samples, had no detectable levels of aflatoxins (below the 2.5 ppb LOD). This is slightly above the percentages in 2014 and 2013, where 98% of the samples tested had no detectable levels of aflatoxins.
• One sample (1), or 0.5% of the 185 samples, showed aflatoxin levels greater than or equal to the LOD of 2.5 ppb, but less than 5 ppb.
• No samples (0), or 0.0% of the 185 samples, showed aflatoxin levels greater than or equal to 5 ppb, but less than 10 ppb.
• No samples (0), or 0.0%, of the 185 samples, showed aflatoxin levels greater than or equal to 10 ppb, but less than or equal to the FDA action level of 20 ppb.
• These results denote that 185 samples, or 100% of the 185 sample test results in 2015, were below or equal to the FDA action level of 20 ppb, compared to 100% and 99.4% of the samples tested in 2014 and 2013, respectively.
Comparing the 2015 aflatoxin survey results to the 2014 and 2013 survey results suggests that there were about the same level of incidents of aflatoxins among all ASDs in 2015 as in the 2014 and 2013 crop seasons. While similar, the 2015 crop season had a slightly higher percentage of samples below the LOD than 2014 and 2013. No samples exceeded the FDA action level in 2015 compared to none in 2014 and 1 (<1%) in 2013, which may be due, in part, to more favorable (less stressful) weather conditions in 2015 (see the “Crop and Weather Conditions” section for more information on the 2015 growing conditions). Weather was cool and wet during pollination and grain fill in 2015 and as a result, the corn plants were not under stress. These conditions were not conducive to aflatoxin formation.
I I I . QUALIT Y TEST RESULTS (cont inued)
Aflatoxins Testing Results
98 1 0 1 1 98 2 0 0 0
99.5
0.5
0.0
0.0
0.0
<2.5 ppb ≥2.5 ppb & <5 ppb
≥5 ppb & <10 ppb
≥10 ppb & ≤20 ppb
>20 ppb
Perc
ent o
f Sam
ples
Tes
ted
201320142015
Aflatoxin
201520142013
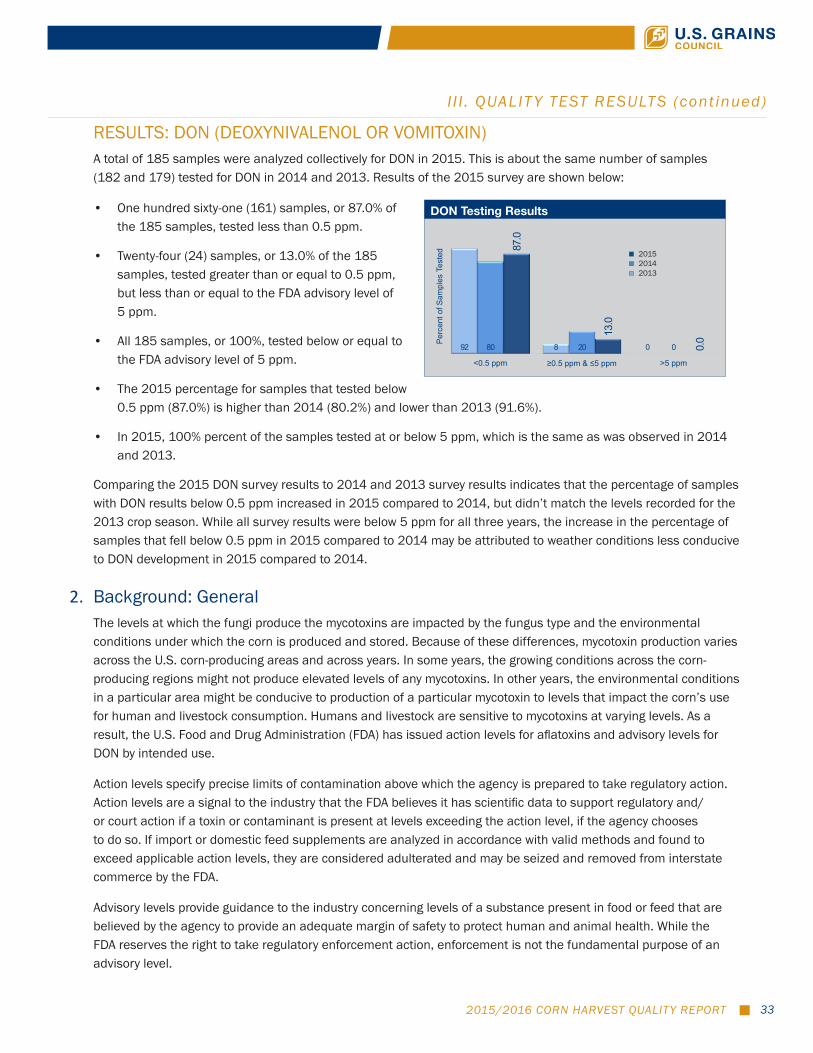
2015/2016 CORN HARVEST QUALITY REPORT 33
RESULTS: DON (DEOXYNIVALENOL OR VOMITOXIN)A total of 185 samples were analyzed collectively for DON in 2015. This is about the same number of samples (182 and 179) tested for DON in 2014 and 2013. Results of the 2015 survey are shown below:
• One hundred sixty-one (161) samples, or 87.0% of the 185 samples, tested less than 0.5 ppm.
• Twenty-four (24) samples, or 13.0% of the 185 samples, tested greater than or equal to 0.5 ppm, but less than or equal to the FDA advisory level of 5 ppm.
• All 185 samples, or 100%, tested below or equal to the FDA advisory level of 5 ppm.
• The 2015 percentage for samples that tested below 0.5 ppm (87.0%) is higher than 2014 (80.2%) and lower than 2013 (91.6%).
• In 2015, 100% percent of the samples tested at or below 5 ppm, which is the same as was observed in 2014 and 2013.
Comparing the 2015 DON survey results to 2014 and 2013 survey results indicates that the percentage of samples with DON results below 0.5 ppm increased in 2015 compared to 2014, but didn’t match the levels recorded for the 2013 crop season. While all survey results were below 5 ppm for all three years, the increase in the percentage of samples that fell below 0.5 ppm in 2015 compared to 2014 may be attributed to weather conditions less conducive to DON development in 2015 compared to 2014.
2. Background: General The levels at which the fungi produce the mycotoxins are impacted by the fungus type and the environmental conditions under which the corn is produced and stored. Because of these differences, mycotoxin production varies across the U.S. corn-producing areas and across years. In some years, the growing conditions across the corn-producing regions might not produce elevated levels of any mycotoxins. In other years, the environmental conditions in a particular area might be conducive to production of a particular mycotoxin to levels that impact the corn’s use for human and livestock consumption. Humans and livestock are sensitive to mycotoxins at varying levels. As a result, the U.S. Food and Drug Administration (FDA) has issued action levels for aflatoxins and advisory levels for DON by intended use.
Action levels specify precise limits of contamination above which the agency is prepared to take regulatory action. Action levels are a signal to the industry that the FDA believes it has scientific data to support regulatory and/or court action if a toxin or contaminant is present at levels exceeding the action level, if the agency chooses to do so. If import or domestic feed supplements are analyzed in accordance with valid methods and found to exceed applicable action levels, they are considered adulterated and may be seized and removed from interstate commerce by the FDA.
Advisory levels provide guidance to the industry concerning levels of a substance present in food or feed that are believed by the agency to provide an adequate margin of safety to protect human and animal health. While the FDA reserves the right to take regulatory enforcement action, enforcement is not the fundamental purpose of an advisory level.
I I I . QUALIT Y TEST RESULTS (cont inued)
DON Testing Results
92 8 0 80 20 0
87.0
13.0
0.0
<0.5 ppm ≥0.5 ppm & ≤5 ppm >5 ppm
Perc
ent o
f Sam
ples
Tes
ted
201320142015
DON
201520142013
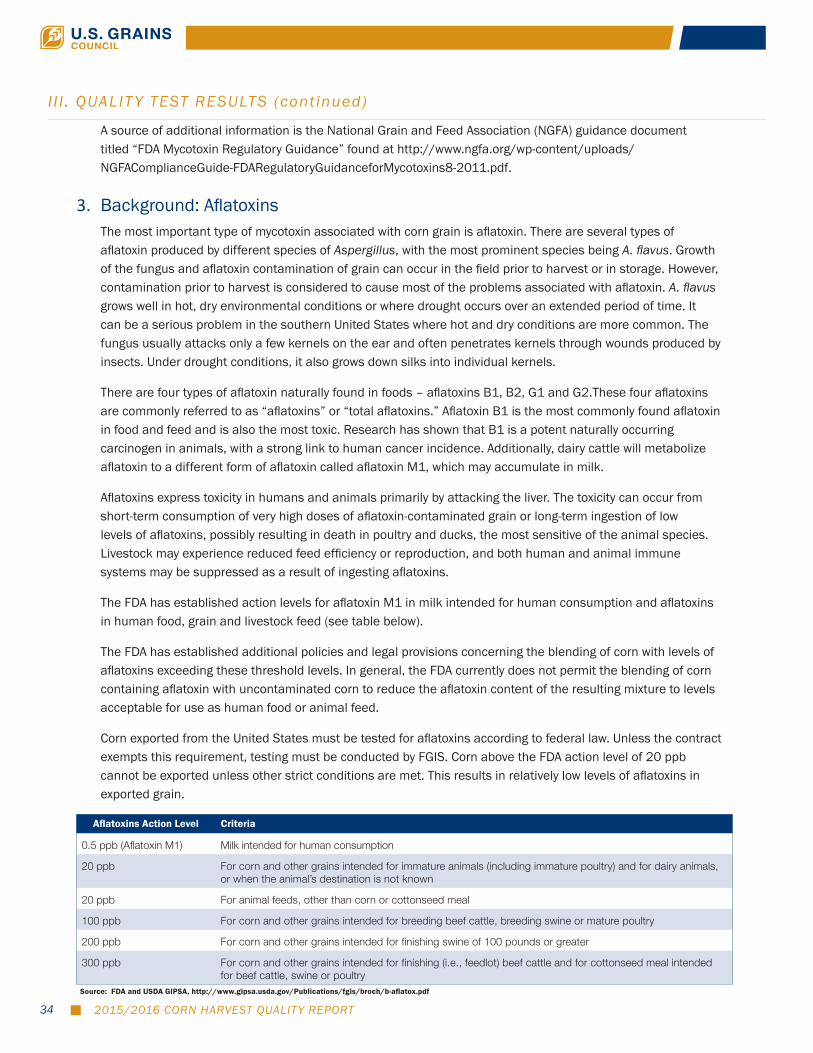
2015/2016 CORN HARVEST QUALITY REPORT34
A source of additional information is the National Grain and Feed Association (NGFA) guidance document titled “FDA Mycotoxin Regulatory Guidance” found at http://www.ngfa.org/wp-content/uploads/NGFAComplianceGuide-FDARegulatoryGuidanceforMycotoxins8-2011.pdf.
3. Background: AflatoxinsThe most important type of mycotoxin associated with corn grain is aflatoxin. There are several types of aflatoxin produced by different species of Aspergillus, with the most prominent species being A. flavus. Growth of the fungus and aflatoxin contamination of grain can occur in the field prior to harvest or in storage. However, contamination prior to harvest is considered to cause most of the problems associated with aflatoxin. A. flavus grows well in hot, dry environmental conditions or where drought occurs over an extended period of time. It can be a serious problem in the southern United States where hot and dry conditions are more common. The fungus usually attacks only a few kernels on the ear and often penetrates kernels through wounds produced by insects. Under drought conditions, it also grows down silks into individual kernels.
There are four types of aflatoxin naturally found in foods – aflatoxins B1, B2, G1 and G2.These four aflatoxins are commonly referred to as “aflatoxins” or “total aflatoxins.” Aflatoxin B1 is the most commonly found aflatoxin in food and feed and is also the most toxic. Research has shown that B1 is a potent naturally occurring carcinogen in animals, with a strong link to human cancer incidence. Additionally, dairy cattle will metabolize aflatoxin to a different form of aflatoxin called aflatoxin M1, which may accumulate in milk.
Aflatoxins express toxicity in humans and animals primarily by attacking the liver. The toxicity can occur from short-term consumption of very high doses of aflatoxin-contaminated grain or long-term ingestion of low levels of aflatoxins, possibly resulting in death in poultry and ducks, the most sensitive of the animal species. Livestock may experience reduced feed efficiency or reproduction, and both human and animal immune systems may be suppressed as a result of ingesting aflatoxins.
The FDA has established action levels for aflatoxin M1 in milk intended for human consumption and aflatoxins in human food, grain and livestock feed (see table below).
The FDA has established additional policies and legal provisions concerning the blending of corn with levels of aflatoxins exceeding these threshold levels. In general, the FDA currently does not permit the blending of corn containing aflatoxin with uncontaminated corn to reduce the aflatoxin content of the resulting mixture to levels acceptable for use as human food or animal feed.
Corn exported from the United States must be tested for aflatoxins according to federal law. Unless the contract exempts this requirement, testing must be conducted by FGIS. Corn above the FDA action level of 20 ppb cannot be exported unless other strict conditions are met. This results in relatively low levels of aflatoxins in exported grain.
I I I . QUALIT Y TEST RESULTS (cont inued)
Source: FDA and USDA GIPSA, http://www.gipsa.usda.gov/Publications/fgis/broch/b-aflatox.pdf
Aflatoxins Action Level Criteria
0.5 ppb (Aflatoxin M1) Milk intended for human consumption
20 ppb For corn and other grains intended for immature animals (including immature poultry) and for dairy animals, or when the animal’s destination is not known
20 ppb For animal feeds, other than corn or cottonseed meal
100 ppb For corn and other grains intended for breeding beef cattle, breeding swine or mature poultry
200 ppb For corn and other grains intended for finishing swine of 100 pounds or greater
300 ppb For corn and other grains intended for finishing (i.e., feedlot) beef cattle and for cottonseed meal intended for beef cattle, swine or poultry
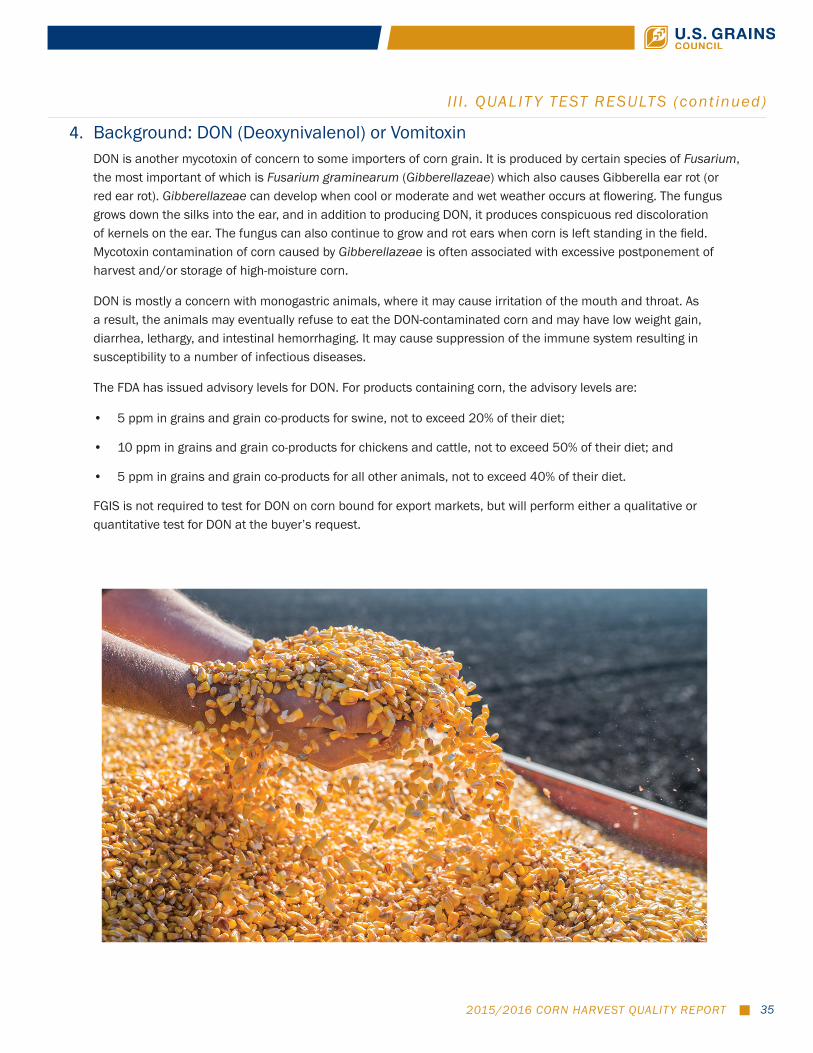
2015/2016 CORN HARVEST QUALITY REPORT 35
4. Background: DON (Deoxynivalenol) or VomitoxinDON is another mycotoxin of concern to some importers of corn grain. It is produced by certain species of Fusarium, the most important of which is Fusarium graminearum (Gibberellazeae) which also causes Gibberella ear rot (or red ear rot). Gibberellazeae can develop when cool or moderate and wet weather occurs at flowering. The fungus grows down the silks into the ear, and in addition to producing DON, it produces conspicuous red discoloration of kernels on the ear. The fungus can also continue to grow and rot ears when corn is left standing in the field. Mycotoxin contamination of corn caused by Gibberellazeae is often associated with excessive postponement of harvest and/or storage of high-moisture corn.
DON is mostly a concern with monogastric animals, where it may cause irritation of the mouth and throat. As a result, the animals may eventually refuse to eat the DON-contaminated corn and may have low weight gain, diarrhea, lethargy, and intestinal hemorrhaging. It may cause suppression of the immune system resulting in susceptibility to a number of infectious diseases.
The FDA has issued advisory levels for DON. For products containing corn, the advisory levels are:
• 5 ppm in grains and grain co-products for swine, not to exceed 20% of their diet;
• 10 ppm in grains and grain co-products for chickens and cattle, not to exceed 50% of their diet; and
• 5 ppm in grains and grain co-products for all other animals, not to exceed 40% of their diet.
FGIS is not required to test for DON on corn bound for export markets, but will perform either a qualitative or quantitative test for DON at the buyer’s request.
I I I . QUALIT Y TEST RESULTS (cont inued)
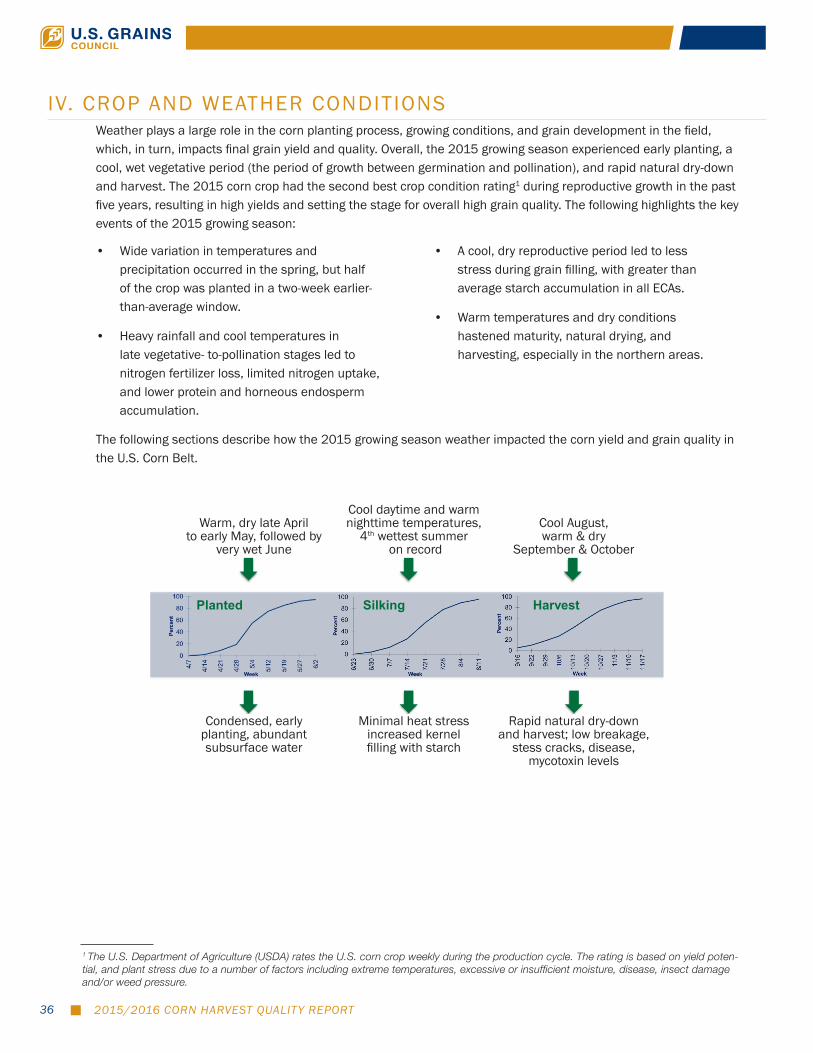
2015/2016 CORN HARVEST QUALITY REPORT36
Weather plays a large role in the corn planting process, growing conditions, and grain development in the field, which, in turn, impacts final grain yield and quality. Overall, the 2015 growing season experienced early planting, a cool, wet vegetative period (the period of growth between germination and pollination), and rapid natural dry-down and harvest. The 2015 corn crop had the second best crop condition rating1 during reproductive growth in the past five years, resulting in high yields and setting the stage for overall high grain quality. The following highlights the key events of the 2015 growing season:
IV. CROP AND WEATHER CONDITIONS
• Wide variation in temperatures and precipitation occurred in the spring, but half of the crop was planted in a two-week earlier-than-average window.
• Heavy rainfall and cool temperatures in late vegetative- to-pollination stages led to nitrogen fertilizer loss, limited nitrogen uptake, and lower protein and horneous endosperm accumulation.
• A cool, dry reproductive period led to less stress during grain filling, with greater than average starch accumulation in all ECAs.
• Warm temperatures and dry conditions hastened maturity, natural drying, and harvesting, especially in the northern areas.
1 The U.S. Department of Agriculture (USDA) rates the U.S. corn crop weekly during the production cycle. The rating is based on yield poten-tial, and plant stress due to a number of factors including extreme temperatures, excessive or insufficient moisture, disease, insect damage and/or weed pressure.
The following sections describe how the 2015 growing season weather impacted the corn yield and grain quality in the U.S. Corn Belt.
2015/2016 Corn Harvest Quality Report
2015 Growing Conditions and Impact on Crop Development
6
Condensed, early planting, abundant subsurface water
Minimal heat stress increased kernel filling with starch
Rapid natural dry-down and harvest; low breakage,
stress cracks, disease, mycotoxin levels
Planted Silking Harvest
Cool daytime and warm nighttime temperatures,
4th record wettest summer
Warm, dry late April to early May, followed
by very wet June
Cool August, warm & dry
September & October
Cool daytime and warm nighttime temperatures,
4th wettest summer on record
Cool August, warm & dry
September & October
Warm, dry late April to early May, followed by
very wet June
Minimal heat stress increased kernel filling with starch
Rapid natural dry-down and harvest; low breakage,
stess cracks, disease, mycotoxin levels
Condensed, early planting, abundant subsurface water
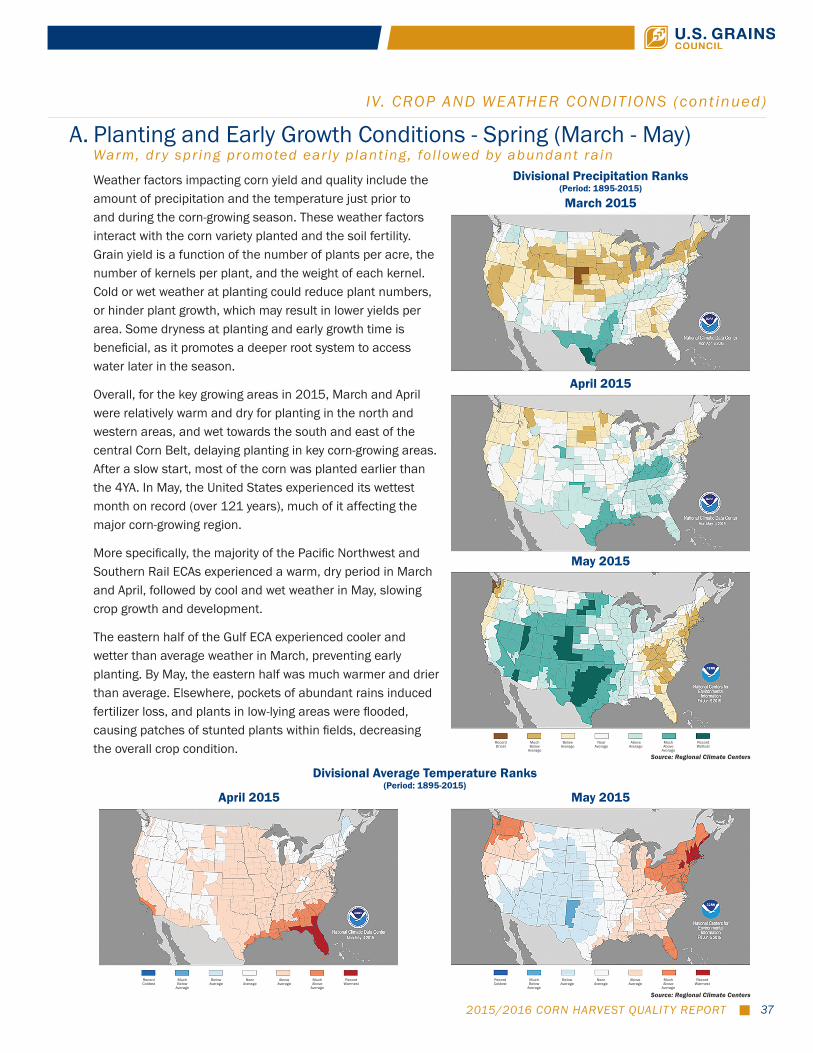
2015/2016 CORN HARVEST QUALITY REPORT 37
A. Planting and Early Growth Conditions - Spring (March - May)Warm, dr y spr ing promoted ear ly p lant ing, fo l lowed by abundant ra in
Weather factors impacting corn yield and quality include the amount of precipitation and the temperature just prior to and during the corn-growing season. These weather factors interact with the corn variety planted and the soil fertility. Grain yield is a function of the number of plants per acre, the number of kernels per plant, and the weight of each kernel. Cold or wet weather at planting could reduce plant numbers, or hinder plant growth, which may result in lower yields per area. Some dryness at planting and early growth time is beneficial, as it promotes a deeper root system to access water later in the season.
Overall, for the key growing areas in 2015, March and April were relatively warm and dry for planting in the north and western areas, and wet towards the south and east of the central Corn Belt, delaying planting in key corn-growing areas. After a slow start, most of the corn was planted earlier than the 4YA. In May, the United States experienced its wettest month on record (over 121 years), much of it affecting the major corn-growing region.
More specifically, the majority of the Pacific Northwest and Southern Rail ECAs experienced a warm, dry period in March and April, followed by cool and wet weather in May, slowing crop growth and development.
The eastern half of the Gulf ECA experienced cooler and wetter than average weather in March, preventing early planting. By May, the eastern half was much warmer and drier than average. Elsewhere, pockets of abundant rains induced fertilizer loss, and plants in low-lying areas were flooded, causing patches of stunted plants within fields, decreasing the overall crop condition.
IV. CROP AND WEATHER CONDITIONS (cont inued)
Divisional Average Temperature Ranks (Period: 1895-2015)
April 2015 May 2015
Record Coldest
Much Below
Average
Below Average
Near Average
Above Average
Much Above
Average
Record Warmest
Record Coldest
Much Below
Average
Below Average
Near Average
Above Average
Much Above
Average
Record Warmest
Source: Regional Climate Centers
April 2015
May 2015
Record Driest
Much Below
Average
Below Average
Near Average
Above Average
Much Above
Average
Record Wettest
Source: Regional Climate Centers
Divisional Precipitation Ranks (Period: 1895-2015)
March 2015
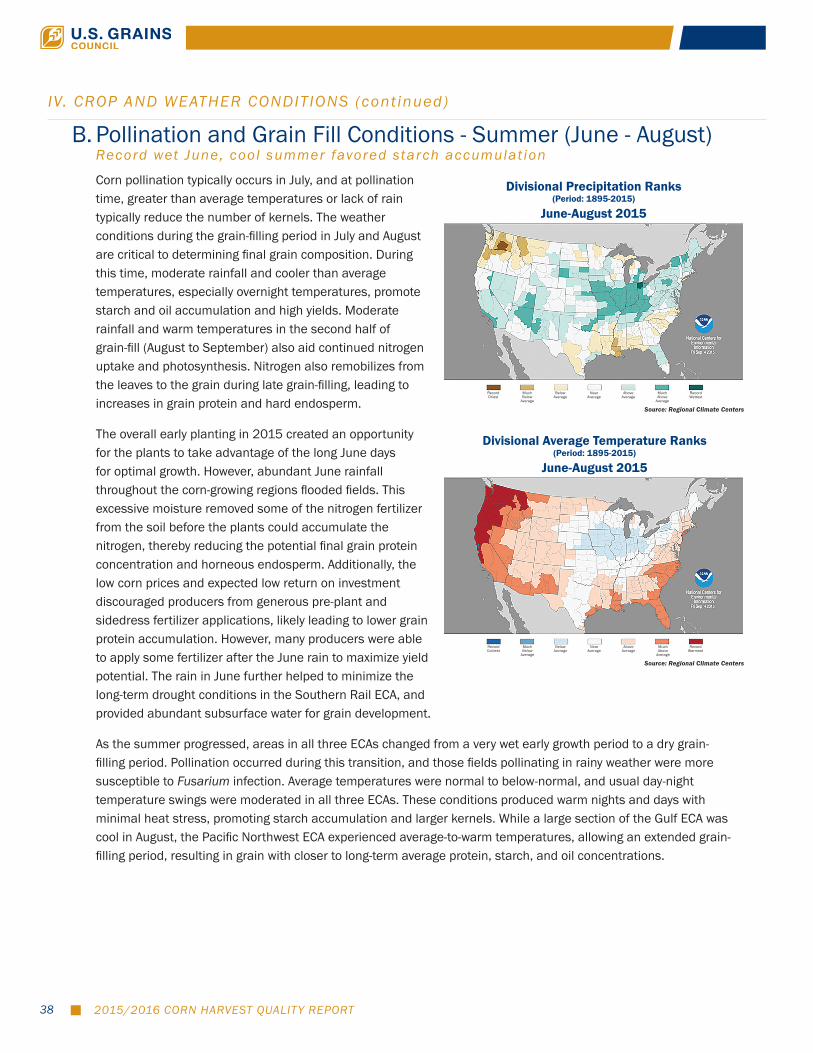
2015/2016 CORN HARVEST QUALITY REPORT38
B. Pollination and Grain Fill Conditions - Summer (June - August)Record wet June, cool summer favored starch accumulat ion
Corn pollination typically occurs in July, and at pollination time, greater than average temperatures or lack of rain typically reduce the number of kernels. The weather conditions during the grain-filling period in July and August are critical to determining final grain composition. During this time, moderate rainfall and cooler than average temperatures, especially overnight temperatures, promote starch and oil accumulation and high yields. Moderate rainfall and warm temperatures in the second half of grain-fill (August to September) also aid continued nitrogen uptake and photosynthesis. Nitrogen also remobilizes from the leaves to the grain during late grain-filling, leading to increases in grain protein and hard endosperm.
The overall early planting in 2015 created an opportunity for the plants to take advantage of the long June days for optimal growth. However, abundant June rainfall throughout the corn-growing regions flooded fields. This excessive moisture removed some of the nitrogen fertilizer from the soil before the plants could accumulate the nitrogen, thereby reducing the potential final grain protein concentration and horneous endosperm. Additionally, the low corn prices and expected low return on investment discouraged producers from generous pre-plant and sidedress fertilizer applications, likely leading to lower grain protein accumulation. However, many producers were able to apply some fertilizer after the June rain to maximize yield potential. The rain in June further helped to minimize the long-term drought conditions in the Southern Rail ECA, and provided abundant subsurface water for grain development.
As the summer progressed, areas in all three ECAs changed from a very wet early growth period to a dry grain-filling period. Pollination occurred during this transition, and those fields pollinating in rainy weather were more susceptible to Fusarium infection. Average temperatures were normal to below-normal, and usual day-night temperature swings were moderated in all three ECAs. These conditions produced warm nights and days with minimal heat stress, promoting starch accumulation and larger kernels. While a large section of the Gulf ECA was cool in August, the Pacific Northwest ECA experienced average-to-warm temperatures, allowing an extended grain-filling period, resulting in grain with closer to long-term average protein, starch, and oil concentrations.
IV. CROP AND WEATHER CONDITIONS (cont inued)
Divisional Precipitation Ranks (Period: 1895-2015)
June-August 2015
Record Driest
Much Below
Average
Below Average
Near Average
Above Average
Much Above
Average
Record Wettest
Divisional Average Temperature Ranks (Period: 1895-2015)
June-August 2015
Record Coldest
Much Below
Average
Below Average
Near Average
Above Average
Much Above
Average
Record Warmest
Source: Regional Climate Centers
Source: Regional Climate Centers

2015/2016 CORN HARVEST QUALITY REPORT 39
C. Harvest Conditions (September - October +)Extended warm, dr y weather hastened maturat ion and har vest .
At the end of the growing season, dry-down of the grain is dependent upon sunshine, temperature, humidity levels, seed hybrid, and soil moisture. Corn can most effectively dry down with the least adverse impact on quality with sunny, warm days with low humidity. Another weather concern at the end of the growing season is freezing temperatures. Early freezing before the grain can sufficiently dry down may lead to lower yield, lower test weight, and/or stress cracking. Also, if harvested prematurely, higher-moisture grain may be susceptible to greater breakage than drier grain.
Typically, 80% of the U.S. corn crop is harvested by the end of October. However, in 2015, the warm late summer temperatures and dry weather hastened maturity, natural dry-down, and harvest, especially in the Southern Rail ECA. There was also no widespread early freeze that would crack grain or lead to harvest and disease issues. The decreased horneous endosperm also led to softer kernels and less stress cracking during harvest.
Fusarium-based ear mold (Gibberella ear rot) is promoted by cool temperatures and wet weather soon after pollination, which was the case in 2015, especially in the Gulf and Southern Rail ECAs. However, the mycotoxin DON that is produced by Fusarium is often associated with harvest delay or storage of high-moisture corn. The 2015 season had a quicker harvest than 2014, resulting in lesser DON levels than last year.
Additionally, aflatoxin production is favored by hot, dry, and drought conditions. While it was dry in a large central portion of the corn-growing region, the plants were not heat- stressed. Therefore, the growing conditions were not conducive to the development of the fungi that produce aflatoxins.
IV. CROP AND WEATHER CONDITIONS (cont inued)
Divisional Average Temperature Ranks (Period: 1895-2015)
September 2015
Record Coldest
Much Below
Average
Below Average
Near Average
Above Average
Much Above
Average
Record Warmest
Source: Regional Climate Centers
Divisional Precipitation Ranks (Period: 1895-2015)
September 2015
Record Driest
Much Below
Average
Below Average
Near Average
Above Average
Much Above
Average
Record Wettest
Source: Regional Climate Centers
October 2015
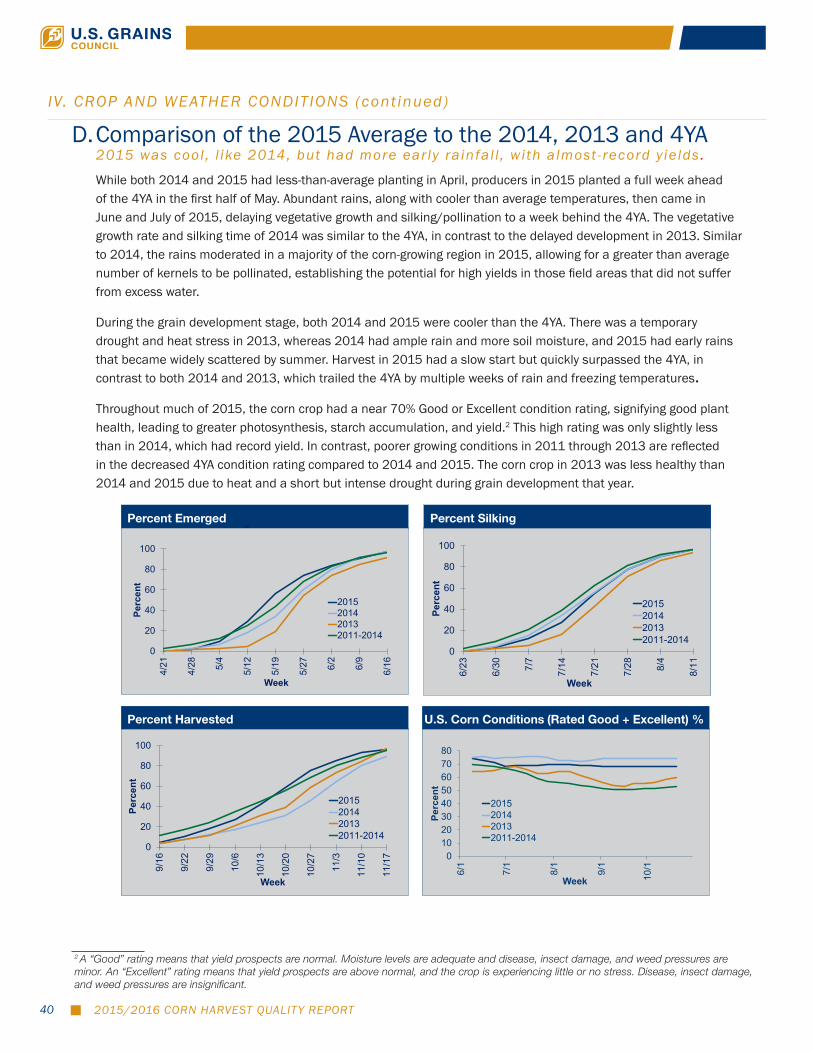
2015/2016 CORN HARVEST QUALITY REPORT40
D. Comparison of the 2015 Average to the 2014, 2013 and 4YA2015 was cool , l ike 2014, but had more ear ly ra infal l , wi th almost -record y ie lds .
While both 2014 and 2015 had less-than-average planting in April, producers in 2015 planted a full week ahead of the 4YA in the first half of May. Abundant rains, along with cooler than average temperatures, then came in June and July of 2015, delaying vegetative growth and silking/pollination to a week behind the 4YA. The vegetative growth rate and silking time of 2014 was similar to the 4YA, in contrast to the delayed development in 2013. Similar to 2014, the rains moderated in a majority of the corn-growing region in 2015, allowing for a greater than average number of kernels to be pollinated, establishing the potential for high yields in those field areas that did not suffer from excess water.
During the grain development stage, both 2014 and 2015 were cooler than the 4YA. There was a temporary drought and heat stress in 2013, whereas 2014 had ample rain and more soil moisture, and 2015 had early rains that became widely scattered by summer. Harvest in 2015 had a slow start but quickly surpassed the 4YA, in contrast to both 2014 and 2013, which trailed the 4YA by multiple weeks of rain and freezing temperatures.
Throughout much of 2015, the corn crop had a near 70% Good or Excellent condition rating, signifying good plant health, leading to greater photosynthesis, starch accumulation, and yield.2 This high rating was only slightly less than in 2014, which had record yield. In contrast, poorer growing conditions in 2011 through 2013 are reflected in the decreased 4YA condition rating compared to 2014 and 2015. The corn crop in 2013 was less healthy than 2014 and 2015 due to heat and a short but intense drought during grain development that year.
IV. CROP AND WEATHER CONDITIONS (cont inued)
Percent Emerged
0
20
40
60
80
100
4/21
4/28 5/
4
5/12
5/19
5/27 6/
2
6/9
6/16
Perc
ent
Week
% Emerged
2015201420132011-2014
Percent Silking
0
20
40
60
80
100
6/23
6/30 7/7
7/14
7/21
7/28 8/4
8/11
Perc
ent
Week
% Silking
2015201420132011-2014
Percent Harvested
0
20
40
60
80
100
9/16
9/22
9/29
10/6
10/1
3
10/2
0
10/2
7
11/3
11/1
0
11/1
7
Perc
ent
Week
% Harvested
2015201420132011-2014
2 A “Good” rating means that yield prospects are normal. Moisture levels are adequate and disease, insect damage, and weed pressures are minor. An “Excellent” rating means that yield prospects are above normal, and the crop is experiencing little or no stress. Disease, insect damage, and weed pressures are insignificant.
U.S. Corn Conditions (Rated Good + Excellent) %
01020304050607080
6/1
7/1
8/1
9/1
10/1
Perc
ent
Week
U.S. Corn Condition, rated Good + Excellent, %
2015201420132011-2014

2015/2016 CORN HARVEST QUALITY REPORT 41
A. U.S. Corn Production1
1. U.S. Average Production and Yields • According to the November 2015 USDA World
Agricultural Supply and Demand Estimates (WASDE) report, average U.S. corn yield for the 2015 crop is projected to be 10.6 mt/ha (169.3 bu/ac). This is 0.1 mt/ha (1.7 bu/ac) lower than the 2014 corn crop and the second highest average yield on record.
• The number of hectares harvested in 2015 is projected to be 32.7 million (80.7 mil ac). This is 1.0 mil ha (2.5 mil ac) less than in 2014. The projected 32.7 mil ha harvested in 2015 ranks 11th over the last 80 years and 7th-highest in the past 10 years.
• Total U.S. corn production for 2015 is projected to be 346.8 mmt (13,654 mil bu). This is about 14.3 mmt (562 mil bu) lower than 2014 and the third-largest U.S. corn crop on record.
• While 2015 saw the lowest number of harvested hectares since 2009, the 2015 crop experienced the second-highest average yield on record, thereby producing the third-largest U.S. corn crop on record.
V. U.S. CORN PRODUCTION, USAGE AND OUTLOOK
1 mt - metric ton; mmt - million metric tons; ha - hectare; bu - bushel; mil bu - million bushels; ac - acre.
34.0
35.4
35.4
33.7
32.7
31.031.532.032.533.033.534.034.535.035.536.0
7.0
7.5
8.0
8.5
9.0
9.5
10.0
10.5
11.0 Hectares H
arvested (million)
Yiel
d (m
t/ha)
U.S. Corn Yield and Harvested Area
Hectares Harvested (mil)
Yield (mt/ha)
Cro
p Ye
ar
P=ProjectedSource: USDA NASS
U.S. Corn Yield and Harvested Area
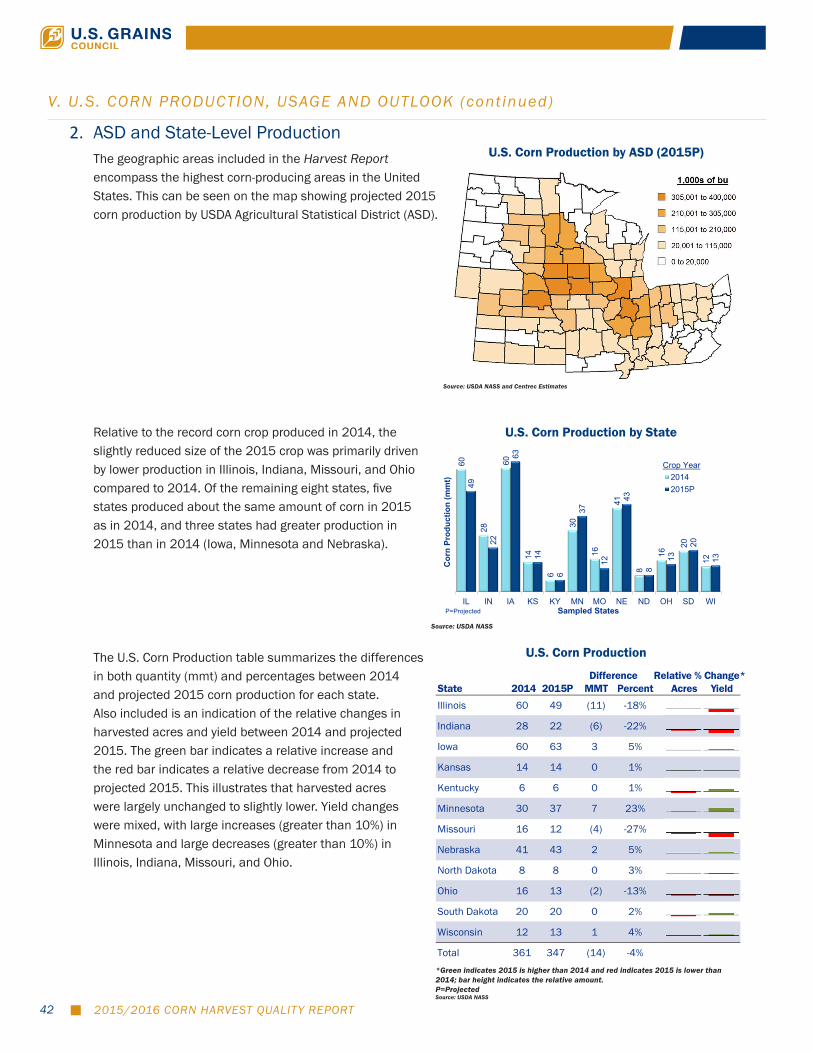
2015/2016 CORN HARVEST QUALITY REPORT42
2. ASD and State-Level ProductionThe geographic areas included in the Harvest Report encompass the highest corn-producing areas in the United States. This can be seen on the map showing projected 2015 corn production by USDA Agricultural Statistical District (ASD).
V. U.S. CORN PRODUCTION, USAGE AND OUTLOOK (cont inued)
*Green indicates 2015 is higher than 2014 and red indicates 2015 is lower than 2014; bar height indicates the relative amount.P=ProjectedSource: USDA NASS
State 2014 2015P MMT Percent Acres Yield
Illinois 60 49 (11) -18%
Indiana 28 22 (6) -22%
Iowa 60 63 3 5%
Kansas 14 14 0 1%
Kentucky 6 6 0 1%
Minnesota 30 37 7 23%
Missouri 16 12 (4) -27%
Nebraska 41 43 2 5%
North Dakota 8 8 0 3%
Ohio 16 13 (2) -13%
South Dakota 20 20 0 2%
Wisconsin 12 13 1 4%
Total 361 347 (14) -4%
Difference Relative % Change*
Source: USDA NASS and Centrec Estimates
U.S. Corn Production by ASD (2015P)
60
28
60
14
6
30
16
41
8
16
20
12
49
22
63
14
6
37
12
43
8
13
20
13
IL IN IA KS KY MN MO NE ND OH SD WI
Cor
n Pr
oduc
tion
(mm
t)
Sampled States
U.S. Corn Production by State
20142015P
P=Projected
Crop Year
Source: USDA NASS
U.S. Corn Production by State
U.S. Corn Production
Relative to the record corn crop produced in 2014, the slightly reduced size of the 2015 crop was primarily driven by lower production in Illinois, Indiana, Missouri, and Ohio compared to 2014. Of the remaining eight states, five states produced about the same amount of corn in 2015 as in 2014, and three states had greater production in 2015 than in 2014 (Iowa, Minnesota and Nebraska).
The U.S. Corn Production table summarizes the differences in both quantity (mmt) and percentages between 2014 and projected 2015 corn production for each state. Also included is an indication of the relative changes in harvested acres and yield between 2014 and projected 2015. The green bar indicates a relative increase and the red bar indicates a relative decrease from 2014 to projected 2015. This illustrates that harvested acres were largely unchanged to slightly lower. Yield changes were mixed, with large increases (greater than 10%) in Minnesota and large decreases (greater than 10%) in Illinois, Indiana, Missouri, and Ohio.

2015/2016 CORN HARVEST QUALITY REPORT 43
B. U.S. Corn Use and Ending Stocks• U.S. corn use for food, seed and other non-ethanol
industrial purposes has remained fairly constant over the past four completed marketing years.
• While the amount of corn used for ethanol production was lower in the 2012/2013 marketing year (MY12/13) relative to MY11/12, MY13/14 and MY14/15, the proportion of corn used for ethanol production to overall use has not changed greatly in the past four completed marketing years.
• After rebounding from MY12/13 to MY13/14, direct consumption of corn as a feed ingredient in domestic livestock and poultry rations has remained strong due to ample corn supplies and lower corn prices relative to other feed ingredients.
• U.S. corn exports have remained high since MY12/13, mostly due to record U.S. corn production and lower prices.
• The 2012 drought resulting in lower production greatly drew down the MY12/13 ending stocks, the lowest in many years. However, large crops since have helped rebuild ending stocks.
V. U.S. CORN PRODUCTION, USAGE AND OUTLOOK (cont inued)
Source: USDA WASDE and ERS
U.S. Corn Production and Disappearance
313
278
39 25
273
263
19 21
351
293
49 31
361
302
47 44
347
301
46 45
0
50
100
150
200
250
300
350
400
Production Total DomesticUse
Exports Ending Stocks
Mill
ion
Met
ric T
ons
Marketing Year
U.S. Corn Production and Disappearance
11/12 12/1313/14 14/1515/16P
P=Projected
Source: USDA WASDE and ERS
U.S. Corn Use
36
127
115
35
118
110
35
130
128
35
132
135
35
131
135
020406080
100120140160
Food, Seed,Other Non-ethanol
Ind. Use
Ethanol &Co-products
Feed and Residual Use
Mill
ion
Met
ric T
ons
Marketing Year
U.S. Corn Use
11/12 12/1313/14 14/1515/16P
P=Projected
2015/2016 CORN HARVEST QUALITY REPORT44
C. Outlook1. U.S. Outlook
• While slightly less than the record-setting size of the 2014 U.S. corn crop, the 2015 crop has created an abundant supply of corn for MY15/16. This ample supply has kept downward pressure on corn prices. The ample supply and low prices are major factors driving the projected domestic use of corn in MY15/16 to be the second-highest on record, behind only MY14/15.
• Corn use for food, seed and non-ethanol industrial (FSI) purposes is expected to remain largely unchanged in MY15/16 compared to MY14/15, continuing the pattern of the previous four marketing years.
• Projected MY15/16 corn use for ethanol is about the same as the previous marketing year. Low gasoline prices have increased domestic gasoline demand, therefore expanding the domestic ethanol market. However, the ethanol blend wall (the maximum level of ethanol that can be blended into gasoline) continues to limit U.S. consumption of ethanol.
• Domestic corn use for livestock and poultry feeding and for residual use is expected remain about the same in MY15/16 as in MY14/15, which was the highest level since MY07/08. Feed demand for corn is expected to be supported by low corn prices, the rebuilding of livestock herds, and the practice of feeding livestock longer.
• U.S. corn exports during MY15/16 are projected to be about 3.5% lower than last year and 6.3% lower than 2013/14. A strong currency and projected domestic demand for corn are currently decreasing the price competitiveness of U.S. corn exports. However, an ample supply will likely push U.S. exports higher than in MY11/12 and MY12/13.
• MY15/16 corn ending stocks are projected to be 1.6% higher than the previous marketing year primarily due to large corn crops in consecutive years. This will increase the stocks-to-use ratio for the third year in a row.
2. International OutlookGlobal Supply
• Global corn production during MY15/16 is expected to be slightly less than last year’s record-setting production, due to smaller crops in both the United States and other major corn-producing countries.
• Lower production for MY15/16 in Argentina, Brazil, the EU, Mexico, and Ukraine will offset greater production in Canada, China, Egypt, South Africa, and Southeast Asia.
• In addition to slightly lower U.S. exports, total non-U.S. exports are expected to be lower in MY15/16 than in MY14/15.
• Decreased exports are also expected from the key non-U.S. exporting countries--Argentina, Brazil, and Ukraine.
Global Demand
• Global corn use is expected to decrease very little in MY15/16 from MY14/15.
• Corn use is anticipated to be lower in MY15/16 in the EU, Ethiopia and Ukraine and higher in China, Brazil, Russia and Argentina compared to MY14/15.
• A slight increase in year-over-year imports is expected globally in MY15/16, with increases in EU imports, and slight increases in Egypt and Japan imports. These increased imports will be countered by China’s decrease in projected MY15/16 corn imports.
V. U.S. CORN PRODUCTION, USAGE AND OUTLOOK (cont inued)
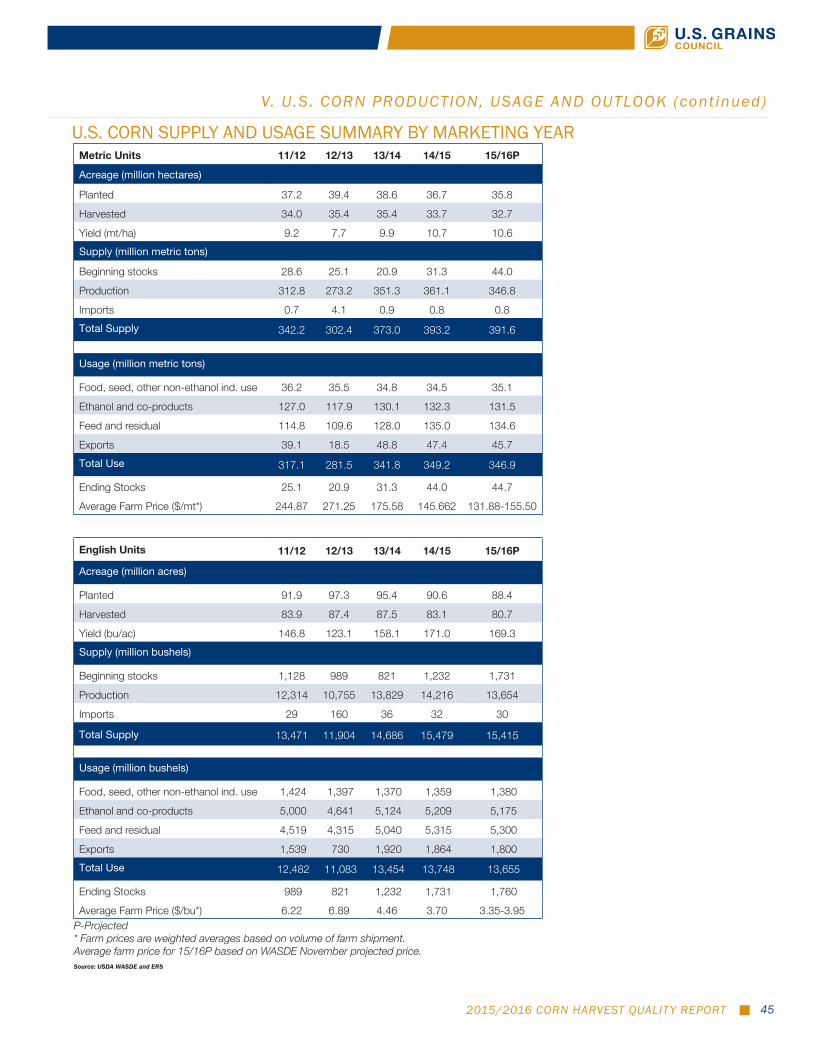
2015/2016 CORN HARVEST QUALITY REPORT 45
V. U.S. CORN PRODUCTION, USAGE AND OUTLOOK (cont inued)
Metric Units 11/12 12/13 13/14 14/15 15/16P
Acreage (million hectares)
Planted 37.2 39.4 38.6 36.7 35.8
Harvested 34.0 35.4 35.4 33.7 32.7
Yield (mt/ha) 9.2 7.7 9.9 10.7 10.6Supply (million metric tons)
Beginning stocks 28.6 25.1 20.9 31.3 44.0
Production 312.8 273.2 351.3 361.1 346.8
Imports 0.7 4.1 0.9 0.8 0.8Total Supply 342.2 302.4 373.0 393.2 391.6
Usage (million metric tons)
Food, seed, other non-ethanol ind. use 36.2 35.5 34.8 34.5 35.1
Ethanol and co-products 127.0 117.9 130.1 132.3 131.5
Feed and residual 114.8 109.6 128.0 135.0 134.6
Exports 39.1 18.5 48.8 47.4 45.7Total Use 317.1 281.5 341.8 349.2 346.9
Ending Stocks 25.1 20.9 31.3 44.0 44.7Average Farm Price ($/mt*) 244.87 271.25 175.58 145.662 131.88-155.50
English Units 11/12 12/13 13/14 14/15 15/16P
Acreage (million acres)
Planted 91.9 97.3 95.4 90.6 88.4
Harvested 83.9 87.4 87.5 83.1 80.7
Yield (bu/ac) 146.8 123.1 158.1 171.0 169.3Supply (million bushels)
Beginning stocks 1,128 989 821 1,232 1,731
Production 12,314 10,755 13,829 14,216 13,654
Imports 29 160 36 32 30
Total Supply 13,471 11,904 14,686 15,479 15,415
Usage (million bushels)
Food, seed, other non-ethanol ind. use 1,424 1,397 1,370 1,359 1,380
Ethanol and co-products 5,000 4,641 5,124 5,209 5,175
Feed and residual 4,519 4,315 5,040 5,315 5,300
Exports 1,539 730 1,920 1,864 1,800 Total Use 12,482 11,083 13,454 13,748 13,655
Ending Stocks 989 821 1,232 1,731 1,760 Average Farm Price ($/bu*) 6.22 6.89 4.46 3.70 3.35-3.95
P-Projected* Farm prices are weighted averages based on volume of farm shipment.Average farm price for 15/16P based on WASDE November projected price.Source: USDA WASDE and ERS
U.S. CORN SUPPLY AND USAGE SUMMARY BY MARKETING YEAR
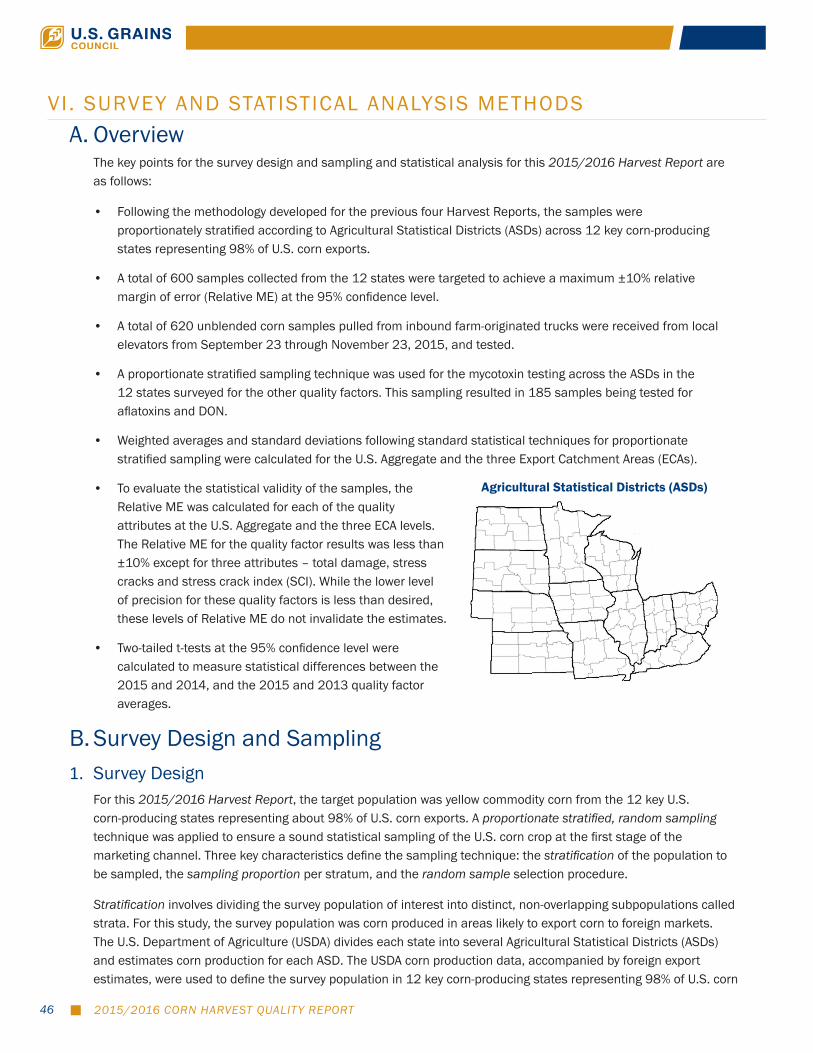
2015/2016 CORN HARVEST QUALITY REPORT46
VI . SURVEY AND STATISTICAL ANALYSIS METHODSA. Overview
The key points for the survey design and sampling and statistical analysis for this 2015/2016 Harvest Report are as follows:
• Following the methodology developed for the previous four Harvest Reports, the samples were proportionately stratified according to Agricultural Statistical Districts (ASDs) across 12 key corn-producing states representing 98% of U.S. corn exports.
• A total of 600 samples collected from the 12 states were targeted to achieve a maximum ±10% relative margin of error (Relative ME) at the 95% confidence level.
• A total of 620 unblended corn samples pulled from inbound farm-originated trucks were received from local elevators from September 23 through November 23, 2015, and tested.
• A proportionate stratified sampling technique was used for the mycotoxin testing across the ASDs in the 12 states surveyed for the other quality factors. This sampling resulted in 185 samples being tested for aflatoxins and DON.
• Weighted averages and standard deviations following standard statistical techniques for proportionate stratified sampling were calculated for the U.S. Aggregate and the three Export Catchment Areas (ECAs).
• To evaluate the statistical validity of the samples, the Relative ME was calculated for each of the quality attributes at the U.S. Aggregate and the three ECA levels. The Relative ME for the quality factor results was less than ±10% except for three attributes – total damage, stress cracks and stress crack index (SCI). While the lower level of precision for these quality factors is less than desired, these levels of Relative ME do not invalidate the estimates.
• Two-tailed t-tests at the 95% confidence level were calculated to measure statistical differences between the 2015 and 2014, and the 2015 and 2013 quality factor averages.
B. Survey Design and Sampling1. Survey Design
For this 2015/2016 Harvest Report, the target population was yellow commodity corn from the 12 key U.S. corn-producing states representing about 98% of U.S. corn exports. A proportionate stratified, random sampling technique was applied to ensure a sound statistical sampling of the U.S. corn crop at the first stage of the marketing channel. Three key characteristics define the sampling technique: the stratification of the population to be sampled, the sampling proportion per stratum, and the random sample selection procedure.
Stratification involves dividing the survey population of interest into distinct, non-overlapping subpopulations called strata. For this study, the survey population was corn produced in areas likely to export corn to foreign markets. The U.S. Department of Agriculture (USDA) divides each state into several Agricultural Statistical Districts (ASDs) and estimates corn production for each ASD. The USDA corn production data, accompanied by foreign export estimates, were used to define the survey population in 12 key corn-producing states representing 98% of U.S. corn
Agricultural Statistical Districts (ASDs)
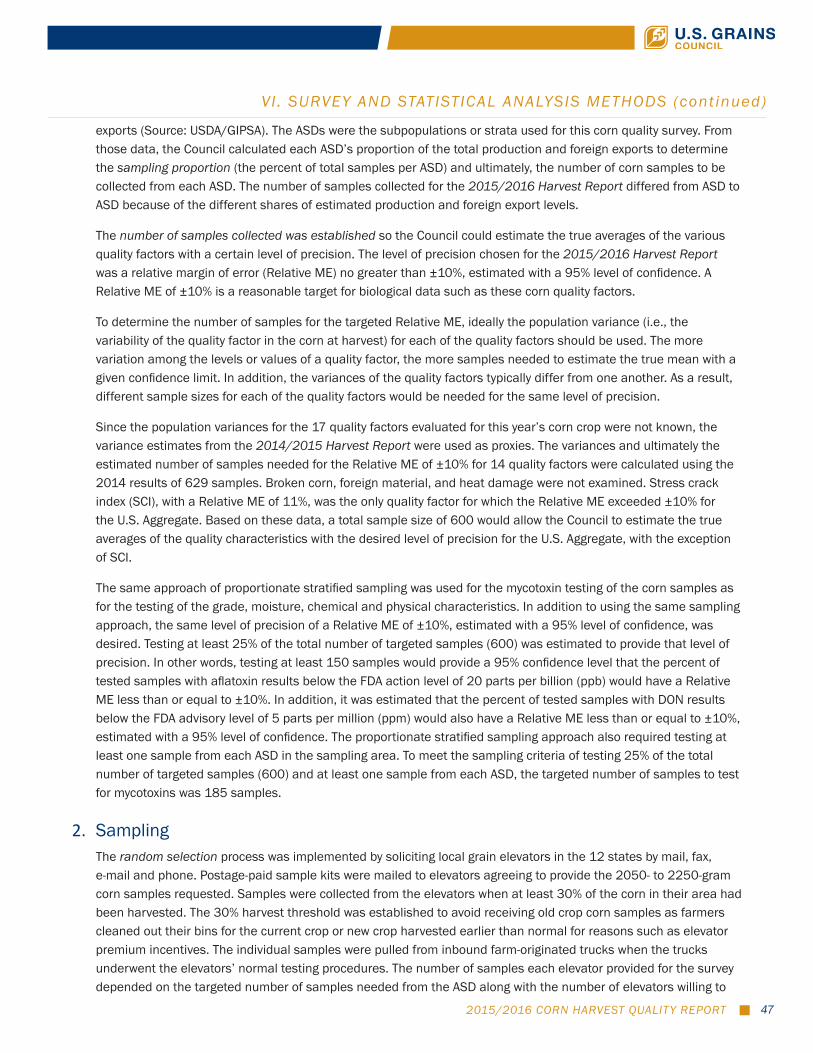
2015/2016 CORN HARVEST QUALITY REPORT 47
exports (Source: USDA/GIPSA). The ASDs were the subpopulations or strata used for this corn quality survey. From those data, the Council calculated each ASD’s proportion of the total production and foreign exports to determine the sampling proportion (the percent of total samples per ASD) and ultimately, the number of corn samples to be collected from each ASD. The number of samples collected for the 2015/2016 Harvest Report differed from ASD to ASD because of the different shares of estimated production and foreign export levels.
The number of samples collected was established so the Council could estimate the true averages of the various quality factors with a certain level of precision. The level of precision chosen for the 2015/2016 Harvest Report was a relative margin of error (Relative ME) no greater than ±10%, estimated with a 95% level of confidence. A Relative ME of ±10% is a reasonable target for biological data such as these corn quality factors.
To determine the number of samples for the targeted Relative ME, ideally the population variance (i.e., the variability of the quality factor in the corn at harvest) for each of the quality factors should be used. The more variation among the levels or values of a quality factor, the more samples needed to estimate the true mean with a given confidence limit. In addition, the variances of the quality factors typically differ from one another. As a result, different sample sizes for each of the quality factors would be needed for the same level of precision.
Since the population variances for the 17 quality factors evaluated for this year’s corn crop were not known, the variance estimates from the 2014/2015 Harvest Report were used as proxies. The variances and ultimately the estimated number of samples needed for the Relative ME of ±10% for 14 quality factors were calculated using the 2014 results of 629 samples. Broken corn, foreign material, and heat damage were not examined. Stress crack index (SCI), with a Relative ME of 11%, was the only quality factor for which the Relative ME exceeded ±10% for the U.S. Aggregate. Based on these data, a total sample size of 600 would allow the Council to estimate the true averages of the quality characteristics with the desired level of precision for the U.S. Aggregate, with the exception of SCI.
The same approach of proportionate stratified sampling was used for the mycotoxin testing of the corn samples as for the testing of the grade, moisture, chemical and physical characteristics. In addition to using the same sampling approach, the same level of precision of a Relative ME of ±10%, estimated with a 95% level of confidence, was desired. Testing at least 25% of the total number of targeted samples (600) was estimated to provide that level of precision. In other words, testing at least 150 samples would provide a 95% confidence level that the percent of tested samples with aflatoxin results below the FDA action level of 20 parts per billion (ppb) would have a Relative ME less than or equal to ±10%. In addition, it was estimated that the percent of tested samples with DON results below the FDA advisory level of 5 parts per million (ppm) would also have a Relative ME less than or equal to ±10%, estimated with a 95% level of confidence. The proportionate stratified sampling approach also required testing at least one sample from each ASD in the sampling area. To meet the sampling criteria of testing 25% of the total number of targeted samples (600) and at least one sample from each ASD, the targeted number of samples to test for mycotoxins was 185 samples.
2. SamplingThe random selection process was implemented by soliciting local grain elevators in the 12 states by mail, fax, e-mail and phone. Postage-paid sample kits were mailed to elevators agreeing to provide the 2050- to 2250-gram corn samples requested. Samples were collected from the elevators when at least 30% of the corn in their area had been harvested. The 30% harvest threshold was established to avoid receiving old crop corn samples as farmers cleaned out their bins for the current crop or new crop harvested earlier than normal for reasons such as elevator premium incentives. The individual samples were pulled from inbound farm-originated trucks when the trucks underwent the elevators’ normal testing procedures. The number of samples each elevator provided for the survey depended on the targeted number of samples needed from the ASD along with the number of elevators willing to
VI . SURVEY AND STATISTICAL ANALYSIS METHODS (cont inued)
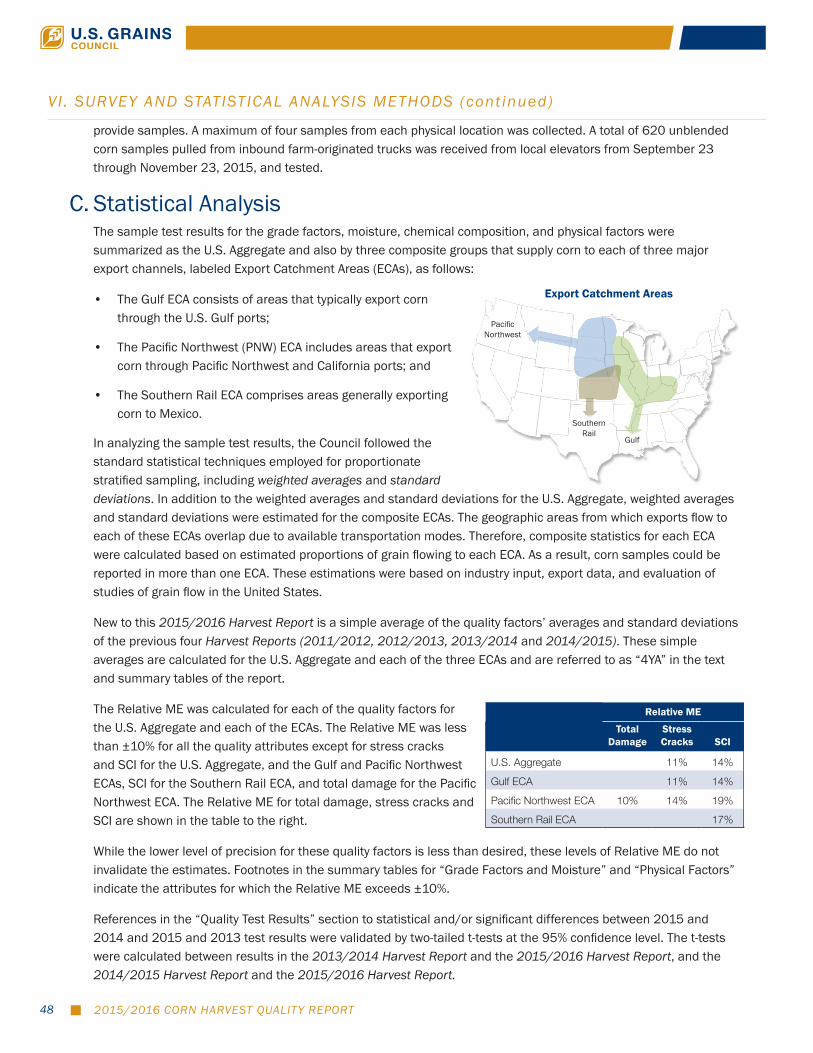
2015/2016 CORN HARVEST QUALITY REPORT48
provide samples. A maximum of four samples from each physical location was collected. A total of 620 unblended corn samples pulled from inbound farm-originated trucks was received from local elevators from September 23 through November 23, 2015, and tested.
C. Statistical AnalysisThe sample test results for the grade factors, moisture, chemical composition, and physical factors were summarized as the U.S. Aggregate and also by three composite groups that supply corn to each of three major export channels, labeled Export Catchment Areas (ECAs), as follows:
• The Gulf ECA consists of areas that typically export corn through the U.S. Gulf ports;
• The Pacific Northwest (PNW) ECA includes areas that export corn through Pacific Northwest and California ports; and
• The Southern Rail ECA comprises areas generally exporting corn to Mexico.
In analyzing the sample test results, the Council followed the standard statistical techniques employed for proportionate stratified sampling, including weighted averages and standard deviations. In addition to the weighted averages and standard deviations for the U.S. Aggregate, weighted averages and standard deviations were estimated for the composite ECAs. The geographic areas from which exports flow to each of these ECAs overlap due to available transportation modes. Therefore, composite statistics for each ECA were calculated based on estimated proportions of grain flowing to each ECA. As a result, corn samples could be reported in more than one ECA. These estimations were based on industry input, export data, and evaluation of studies of grain flow in the United States.
New to this 2015/2016 Harvest Report is a simple average of the quality factors’ averages and standard deviations of the previous four Harvest Reports (2011/2012, 2012/2013, 2013/2014 and 2014/2015). These simple averages are calculated for the U.S. Aggregate and each of the three ECAs and are referred to as “4YA” in the text and summary tables of the report.
The Relative ME was calculated for each of the quality factors for the U.S. Aggregate and each of the ECAs. The Relative ME was less than ±10% for all the quality attributes except for stress cracks and SCI for the U.S. Aggregate, and the Gulf and Pacific Northwest ECAs, SCI for the Southern Rail ECA, and total damage for the Pacific Northwest ECA. The Relative ME for total damage, stress cracks and SCI are shown in the table to the right.
While the lower level of precision for these quality factors is less than desired, these levels of Relative ME do not invalidate the estimates. Footnotes in the summary tables for “Grade Factors and Moisture” and “Physical Factors” indicate the attributes for which the Relative ME exceeds ±10%.
References in the “Quality Test Results” section to statistical and/or significant differences between 2015 and 2014 and 2015 and 2013 test results were validated by two-tailed t-tests at the 95% confidence level. The t-tests were calculated between results in the 2013/2014 Harvest Report and the 2015/2016 Harvest Report, and the 2014/2015 Harvest Report and the 2015/2016 Harvest Report.
V I . SURVEY AND STATISTICAL ANALYSIS METHODS (cont inued)
Pacific Northwest
Southern Rail
Gulf
Export Catchment Areas
Relative ME
Total Damage
Stress Cracks SCI
U.S. Aggregate 11% 14%
Gulf ECA 11% 14%
Pacific Northwest ECA 10% 14% 19%Southern Rail ECA 17%
2015/2016 CORN HARVEST QUALITY REPORT 49
VI I . TESTING ANALYSIS METHODSThe corn samples (each about 2200 grams) were sent directly from the local grain elevators to the Illinois Crop Improvement Association’s Identity Preserved Grain Laboratory (IPG Lab) in Champaign, Illinois. Upon arrival, the samples were dried, if needed, to a suitable moisture content to prevent any subsequent deterioration during the testing period. Next the samples were split into two 1100-gram subsamples using a Boerner divider while keeping the attributes of the grain sample evenly distributed between the two subsamples. One subsample was delivered to the Champaign-Danville Grain Inspection (CDGI) for grading. CDGI is the official grain inspection service provider for east-central Illinois as designated by USDA’s Federal Grain Inspection Service (FGIS). The grade testing procedures were in accordance with FGIS’s Grain Inspection Handbook and are described in the following section. The other subsample was analyzed at IPG Lab for the chemical composition and other physical factors following either industry norms or well-established procedures in practice for many years. IPG Lab has received accreditation under the ISO/IEC 17025:2005 International Standard for many of the tests. The full scope of accreditation is available at http://www.pjview.com/clients/pjl/viewcert.cfm?certnumber=1752.
A. Corn Grading Factors1. Test Weight
Test weight is a measure of the volume of grain that is required to fill a Winchester bushel (2,150.42 cubic inches) to capacity. Test weight is a part of the FGIS Official U.S. Standards for Corn grading criteria.
The test involves filling a test cup of known volume through a funnel held at a specific height above the test cup to the point where grain begins to pour over the sides of the test cup. A strike-off stick is used to level the grain in the test cup, and the grain remaining in the cup is weighed. The weight is then converted to and reported in the traditional U.S. unit, pounds per bushel (lb/bu).
2. Broken Corn and Foreign Material (BCFM)Broken corn and foreign material (BCFM) is part of the FGIS Official U.S. Standards for Grain and grading criteria.
The BCFM test determines the amount of all matter that passes through a 12/64th-inch round-hole sieve and all matter other than corn that remains on the top of the sieve. BCFM measurement can be separated into broken corn and foreign material. Broken corn is defined as all material passing through a 12/64th-inch round-hole sieve and retained on a 6/64th-inch round-hole sieve. Foreign material is defined as all material passing through the 6/64th-inch round-hole sieve and the coarse non-corn material retained on top of the 12/64th-inch round-hole sieve. BCFM is reported as a percentage of the initial sample by weight.
3. Total Damage/Heat DamageTotal damage is part of the FGIS Official U.S. Standards for Grain grading criteria.
A representative working sample of 250 grams of BCFM-free corn is visually examined by a trained and licensed inspector for content of damaged kernels. Types of damage include blue-eye mold, cob rot, dryer-damaged kernels (different from heat-damaged kernels), germ-damaged kernels, heat-damaged kernels, insect-bored kernels, mold-damaged kernels, mold-like substance, silk-cut kernels, surface mold (blight), mold (pink Epicoccum), and sprout-damaged kernels. Total damage is reported as the weight percentage of the working sample that is total damaged grain.
Heat damage is a subset of total damage and consists of kernels and pieces of corn kernels that are materially discolored and damaged by heat. Heat-damaged kernels are determined by a trained and licensed inspector visually inspecting a 250-gram sample of BCFM-free corn. Heat damage, if found, is reported separately from total damage.
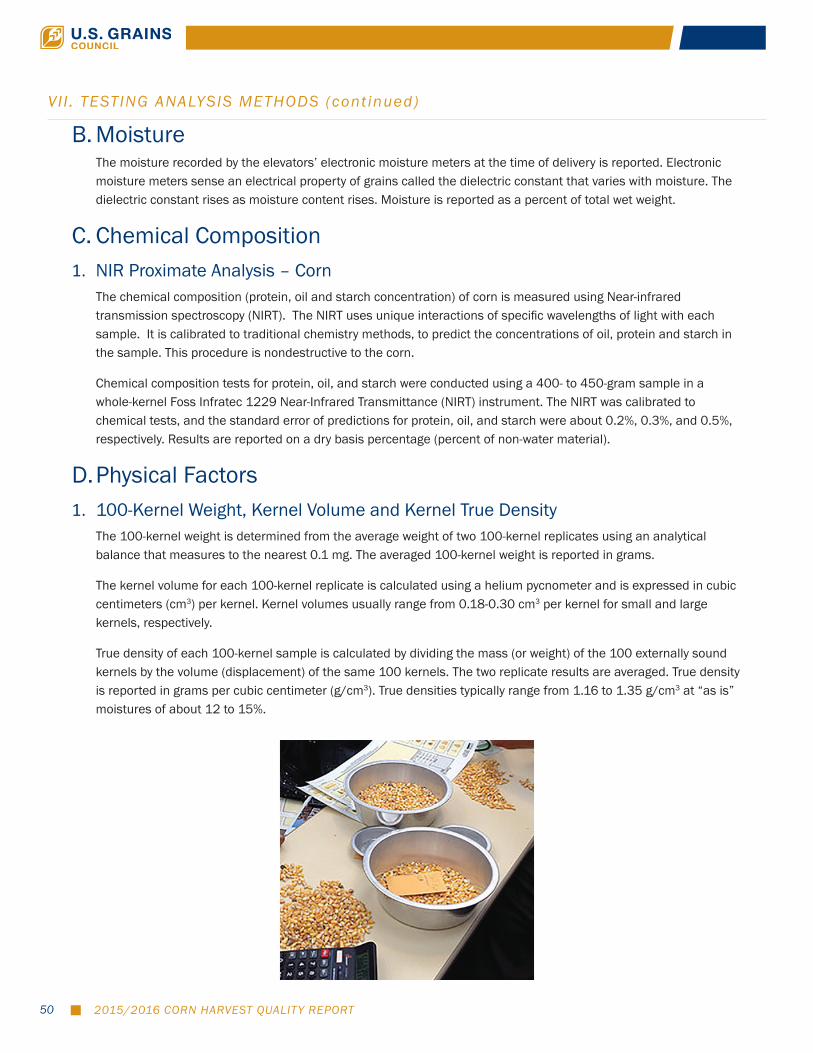
2015/2016 CORN HARVEST QUALITY REPORT50
B. MoistureThe moisture recorded by the elevators’ electronic moisture meters at the time of delivery is reported. Electronic moisture meters sense an electrical property of grains called the dielectric constant that varies with moisture. The dielectric constant rises as moisture content rises. Moisture is reported as a percent of total wet weight.
C. Chemical Composition1. NIR Proximate Analysis – Corn
The chemical composition (protein, oil and starch concentration) of corn is measured using Near-infrared transmission spectroscopy (NIRT). The NIRT uses unique interactions of specific wavelengths of light with each sample. It is calibrated to traditional chemistry methods, to predict the concentrations of oil, protein and starch in the sample. This procedure is nondestructive to the corn.
Chemical composition tests for protein, oil, and starch were conducted using a 400- to 450-gram sample in a whole-kernel Foss Infratec 1229 Near-Infrared Transmittance (NIRT) instrument. The NIRT was calibrated to chemical tests, and the standard error of predictions for protein, oil, and starch were about 0.2%, 0.3%, and 0.5%, respectively. Results are reported on a dry basis percentage (percent of non-water material).
D. Physical Factors1. 100-Kernel Weight, Kernel Volume and Kernel True Density
The 100-kernel weight is determined from the average weight of two 100-kernel replicates using an analytical balance that measures to the nearest 0.1 mg. The averaged 100-kernel weight is reported in grams.
The kernel volume for each 100-kernel replicate is calculated using a helium pycnometer and is expressed in cubic centimeters (cm3) per kernel. Kernel volumes usually range from 0.18-0.30 cm3 per kernel for small and large kernels, respectively.
True density of each 100-kernel sample is calculated by dividing the mass (or weight) of the 100 externally sound kernels by the volume (displacement) of the same 100 kernels. The two replicate results are averaged. True density is reported in grams per cubic centimeter (g/cm3). True densities typically range from 1.16 to 1.35 g/cm3 at “as is” moistures of about 12 to 15%.
VI I . TESTING ANALYSIS METHODS (cont inued)
2015/2016 CORN HARVEST QUALITY REPORT 51
2. Stress Crack AnalysisStress cracks are evaluated by using a backlit viewing board to accentuate the cracks. A sample of 100 intact kernels with no external damage is examined kernel by kernel. The light passes through the horneous or hard endosperm so the severity of the stress crack damage in each kernel can be evaluated. Kernels are sorted into four categories: (1) no cracks; (2) one crack; (3) two cracks; and (4) more than two cracks. Stress cracks, expressed as a percent, are all kernels containing one, two or more than two cracks divided by 100 kernels. Lower levels of stress cracks are always better since higher levels of stress cracks lead to more breakage in handling. If stress cracks are present, singles are better than doubles or multiples. Some corn end users will specify the acceptable level of cracks based on the intended use.
Stress crack index (SCI) is a weighted average of the stress cracks. This measurement indicates the severity of stress cracking. SCI is calculated as
SCI = [SSC x 1] + [DSC x 3] + [MSC x 5]
WhereSSC is the percentage of kernels with only one crack;
DSC is the percentage of kernels with exactly two cracks; and
MSC is the percentage of kernels with more than two cracks.
The SCI can range from 0 to 500, with a high number indicating numerous multiple stress cracks in a sample, which is undesirable for most uses.
3. Whole KernelsIn the whole kernels test, 50 grams of cleaned (BCFM-free) corn are inspected kernel by kernel. Cracked, broken, or chipped grain, along with any kernels showing significant pericarp damage, are removed. The whole kernels are then weighed and the result is reported as a percentage of the original 50-gram sample. Some companies perform the same test, but report the “cracked & broken” percentage. A whole kernels score of 97% equates to a cracked & broken rating of 3%.
4. Horneous (Hard) EndospermThe horneous (or hard) endosperm test is performed by visually rating 20 externally sound kernels, placed germ facing up, on a light table. Each kernel is rated for the estimated portion of the kernel’s total endosperm that is horneous endosperm. Soft endosperm is opaque and will block light, while horneous endosperm is translucent. The rating is made from standard guidelines based on the degree to which the soft endosperm at the crown of the kernel extends down toward the germ. The average of horneous endosperm ratings for the 20 externally sound kernels is reported. Ratings of horneous endosperm are made on a scale of 70 to 100%, though most individual kernels fall in the 70 to 95% range.
VI I . TESTING ANALYSIS METHODS (cont inued)

2015/2016 CORN HARVEST QUALITY REPORT52
VI I . TESTING ANALYSIS METHODS (cont inued)
E. Mycotoxin TestingDetection of mycotoxins in corn is complex. The fungi producing the mycotoxins often do not grow uniformly in a field or across a geographic area. As a result, the detection of any mycotoxin in corn, if present, is highly dependent upon the concentration and distribution of the mycotoxin among kernels in a lot of corn, whether a truck load, a storage bin or a rail car.
The objective of the FGIS sampling process is to minimize underestimating or overestimating the true mycotoxin concentration, since accurate results are imperative for corn exports. However, the objective of the 2015/2016 Harvest Report assessment of mycotoxins is only to report the frequency of occurrences of the mycotoxin in the current crop, but not specific levels of the mycotoxin in corn exports.
To report the frequency of occurrences of aflatoxins and DON for the 2015/2016 Harvest Report, IPG Lab performed the mycotoxin testing using FGIS protocol and approved test kits. FGIS’s protocol requires a minimum of a 908-gram (2-pound) sample from trucks to grind for aflatoxin testing and approximately a 200-gram sample to grind for DON testing. For this study, a 1000-gram laboratory sample was subdivided from the 2-kg survey sample of shelled kernels for the aflatoxin analysis. The 1-kg survey sample was ground in a Romer Model 2A mill so that 60-75% would pass a 20-mesh screen. From this well-mixed ground material, a 50-gram test portion was removed for each mycotoxin tested. EnviroLogix AQ 109 BG and AQ 254 BG quantitative test kits were used for the aflatoxin and DON analysis, respectively. The DON was extracted with water (5:1), while the aflatoxins were extracted with 50% ethanol (2:1). The extracts were tested using the Envirologix QuickTox lateral flow strips, and the mycotoxins were quantified by the QuickScan system.
The EnviroLogix quantitative test kits report specific concentration levels of the mycotoxin if the concentration level exceeds a specific level called a “Limit of Detection” (LOD). The LOD is defined as the lowest concentration level that can be measured with an analytical method that is statistically different from measuring an analytical blank (absence of a mycotoxin). The LOD will vary among different types of mycotoxins, test kits and commodity combinations. The LOD for the EnviroLogix AQ 109 BG and AQ 254 BG are 2.5 parts per billion (ppb) for aflatoxins and 0.3 parts per million (ppm) for DON.
A letter of performance has been issued by FGIS for the quantification of aflatoxins and DON using the Envirologix AQ 109 BG and AQ 254 BG kits, respectively.

2015/2016 CORN HARVEST QUALITY REPORT 53
VI I I . U.S. CORN GRADES AND CONVERSIONS
Corn Equivalents Metric Equivalents
1 bushel = 56 pounds (25.40 kilograms) 1 pound = 0.4536 kg
39.368 bushels = 1 metric ton 1 hundredweight = 100 pounds or 45.36 kg
15.93 bushels/acre = 1 metric ton/hectare 1 metric ton = 2204.6 lbs
1 bushel/acre = 62.77 kilograms/hectare 1 metric ton = 1000 kg
1 bushel/acre = 0.6277 quintals/hectare 1 metric ton = 10 quintals
56 lbs/bushel = 72.08 kg/hectoliter 1 quintal = 100 kg
1 hectare = 2.47 acres
U.S. CORN GRADES AND GRADE REQUIREMENTS
U.S. AND METRIC CONVERSIONS
Maximum Limits ofDamaged Kernels
Grade
Minimum Test Weight per Bushel
(Pounds)
Heat Damaged (Percent)
Total (Percent)
Broken Corn and Foreign Material
(Percent)
U.S. No. 1 56.0 0.1 3.0 2.0
U.S. No. 2 54.0 0.2 5.0 3.0
U.S. No. 3 52.0 0.5 7.0 4.0
U.S. No. 4 49.0 1.0 10.0 5.0
U.S. No. 5 46.0 3.0 15.0 7.0
U.S. Sample Grade is corn that: (a) Does not meet the requirements for the grades U.S. Nos. 1, 2, 3, 4, or 5; or (b) Contains stones with an aggregate weight in excess of 0.1 percent of the sample weight, 2 or more pieces of glass, 3 or more crotalaria seeds (Crotalaria spp.), 2 or more castor beans (Ricinus communis L.), 4 or more particles of an unknown foreign substance(s) or a commonly recognized harmful or toxic substance(s), 8 or more cockleburs (Xanthium spp.), or similar seeds singly or in combination, or animal filth in excess of 0.20 percent in 1,000 grams; or (c) Has a musty, sour, or commercially objectionable foreign odor; or (d) Is heating or otherwise of distinctly low quality.Source: Code of Federal Regulations, Title 7, Part 810, Subpart D, United States Standards for Corn
People’s Republic of China
BeijingTel1: +86-10-6505-1314Tel2: +86-10-6505-2320Fax: [email protected]
Egypt
CairoTel: [email protected]
Japan
TokyoTel: +81-3-6206-1041Fax: [email protected]
Korea
SeoulTel: +82-2-720-1891 Fax: +82-2-720-9008 [email protected]
Mexico
Mexico City Tel1: +52-55-5282-0244Tel2: +52-55-5282-0973Tel3: +52-55-5282-0977Fax: [email protected]
Middle East and Africa
TunisTel: +216-71-191-640Fax: [email protected]
South and Southeast Asia
Kuala LumpurTel: +603-2093-6826Fax: [email protected]
Taiwan
TaipeiTel1: +886-2-2523-8801 Fax: +886-2-2523-0149 [email protected]
Tanzania
Dar es SalaamTel: [email protected]
Western Hemisphere
Panama City Tel: +507-315-1008Fax: [email protected]
Tokyo
Taipei
Kuala Lumpur
SeoulBeijing
CairoTunis
Washington, D.C.
Mexico City
Panama City
Office
Regional Hub
Representative
Dar es Salaam
Developing Markets • Enabling Trade • Improving Lives
20 F Street, NW Suite 600
Washington, DC 20001
Phone: +202-789-0789
Fax: +202-898-0522
Email: [email protected]
Website: grains.org