2015 telecommunications market survey … services survey in... · 5 research background • the...
TRANSCRIPT

RESIDENTIAL RESULTS
06 APRIL 2016
2015 TELECOMMUNICATIONS MARKET SURVEY REPORT

Co
pyr
igh
t ©
2015
Th
e N
iels
en C
om
pan
y. C
on
fid
enti
al a
nd
pro
pri
etar
y.
2
DISCLAIMER • TRA does not make any representations or warranties, either express or implied, that:
• the information is free from inaccuracies, errors or omissions;
• the information is exhaustive;
• the information is of merchantable quality and fitness for a particular purpose.
• TRA, including its officers, board members, employees, agents and contractors, is not liable
for:
• any inaccuracy, error or omission in the information contained in this document; nor
• any loss, damage, cost or expense whether direct, indirect, consequential or special,
incurred by, or arising by reason of, any person using or relying on the information and
whether caused by reason of any inaccuracy, error, omission or misrepresentation in the
information or otherwise.
• TRA notes that the information contained in this report is based on a survey of a sample of
1196 residential consumers and as such may not necessarily represent the market or the
population as a whole.
• This survey fulfills the requirement to undertake research and publish information as set out
in Article 54 of the Law. It also fulfills the requirements of Article 25 to provide information to
the Regulator as set out in the Individual Licenses granted to the Operators mentioned in
this survey.

Co
pyr
igh
t ©
2015
Th
e N
iels
en C
om
pan
y. C
on
fid
enti
al a
nd
pro
pri
etar
y.
3
TABLE OF CONTENTS1. Introduction 4
a. Research Background 5
b. Research Objectives 6
3. Telecom Services 15
a. Fixed Line Service 16
b. Mobile Phone Services 26
d. Internet Service 48
c. International Calls 42
6. Appendix 68
a. Research Design & Methodology 70
2. Key Research Findings 7
e. OTT Application Usage 65

Research Background Research Objectives
INTRODUCTION
Co
pyr
igh
t ©
2015
Th
e N
iels
en C
om
pan
y. C
on
fid
enti
al a
nd
pro
pri
etar
y.
5
RESEARCH BACKGROUND
• The Telecommunications Regulatory Authority of Bahrain (TRA) was formed in October
2002. TRA is an independent body which has a direct responsibility to ensure effective
liberalization of the telecommunications market.
• During 2015, TRA has commissioned Nielsen to conduct a telecommunication market
survey with the objective of better understand the demand for telecommunications
services in Bahrain. This includes usage of and access to telecom services across various
users. It also outlines numerous areas of progress in the telecommunications sector in
Bahrain.
• The telecom users are divided into two broad segments (Residential and Business), thus
two separate modules were conducted to collect the required information.
• This report presents the results of residential survey, which was based on 1196 face-to-
face interviews conducted during May and June 2015.
• TRA has also conducted a similar survey in 2007, 2011 and 2014. The results of these
surveys can be found at http://www.tra.org.bh/en/media/consumer-and-business-
surveys/

Co
pyr
igh
t ©
2015
Th
e N
iels
en C
om
pan
y. C
on
fid
enti
al a
nd
pro
pri
etar
y.
6
ACCESS TO TELECOM
SERVICES IN BAHRAIN
USAGE OF TELECOM
SERVICES IN BAHRAIN
SATISFACTION WITH VARIOUS
TELECOM SERVICES
The key objectives of the 2015 survey are to understand the following
RESEARCH OBJECTIVES
SWITCHING BEHAVIOR
Where appropriate the results of the 2015 survey have been compared with the results from previous years surveys to identify the key trends
during this period

KEY SURVEY FINDINGS

Co
pyr
igh
t ©
2015
Th
e N
iels
en C
om
pan
y. C
on
fid
enti
al a
nd
pro
pri
etar
y.
8
ACCESS TO TELECOM SERVICES IN BAHRAIN- 100% of respondents have access to mobile phone, which is broadly comparable to previous years.
- Access to the internet continues to increase. 89% of respondents have access to internet at home compared with 80% in 2014.
- Fixed line access continues to fall, only 12% of respondents in 2015 survey have access to a fixed line service at home.
[Q6] Does this household have a fixed line telephone line?[Q21] Does this household have a mobile phone?[Q55] Do you have internet at home?
Base: All Respondents (n=1196)
Access to Telecom services in Bahrain
53%
99%
66%
67%
99%
30%
80%
100%
24%
89%
100%
12%Households with Fixed
Line
Individuals with Mobile
Phone
Households with Internet
access
2007 2011 2014 2015
KEY SURVEY FINDINGS 2015

Co
pyr
igh
t ©
2015
Th
e N
iels
en C
om
pan
y. C
on
fid
enti
al a
nd
pro
pri
etar
y.
9
27% 29% 31%
97%
27%
15%
90%
24%21%
Mobile broadband DSL Wimax
2011 2014 2015
Internet Connection Types
INTERNET ACCESS IN BAHRAIN- Mobile broadband has decreased from 97% in 2014 survey to 90% in 2015 survey.- In the 2015 survey, 63% used mobile data to access internet whereas 53% used mobile broadband via a
card, USB or a router
[Q57] Type of internet access
Base: All who have used internet (n=1061)
63%
53%
Mobile broadband network viahandsets (data added to voice)
Mobile broadband network viacard, USB or router
Mobile Broadband Types
Base: All who have used internet (n=1061)
KEY SURVEY FINDINGS 2015

Co
pyr
igh
t ©
2015
Th
e N
iels
en C
om
pan
y. C
on
fid
enti
al a
nd
pro
pri
etar
y.
10
Average Number Mobile Phone Calls and SMS Per Week
USAGE OF TELECOM SERVICES IN BAHRAIN- Average number of fixed line calls has slightly decreased in 2015 survey compared with the 2014 survey. - While average number of mobile phone calls has slightly decreased during the three years , the average
number of SMS witnessed a significant drop during the same period.
[Q13] On average, how many calls do you make each week from your fixed line phone?
[Q31] On average, how many calls do make each week from you mobile phone
[Q33] Could you please tell me in a typical week how many SMS do you send??
29
20
32
4
25
2
National Calls
SMS
2011 2014 2015
Base: All Respondents who use mobile phone (n=1195)
9
10
18
13
22
9
11
20
6
To a fixed line (National calls)
To a mobile phone (National calls)
International calls
2011 2014 2015
Average Number of Fixed Line Calls Per week
Base: All Respondents who use fixed line (n=144)
KEY SURVEY FINDINGS 2015

Co
pyr
igh
t ©
2015
Th
e N
iels
en C
om
pan
y. C
on
fid
enti
al a
nd
pro
pri
etar
y.
11
INTERNET RELATED ACTIVITIES- In 2015, 93% of respondents have used the internet in last three months, compared to 87% in 2014.- Overall, the proportion of respondents engaging in internet related activities has grown compared to 2014. - In particular, telephony services over VoIP has become more prominent in 2015 (44%) compared to 2014 (39%)- Social networking remains the main internet activity among respondents (74%).
[Q62] Have you used internet from any location in the last 3 months?
[Q65] For which of the following activities did you use the internet for private purposes (from any location) in the last three months?
Base: All who have used internet (n=1118)
76%
23%
87%
13%
93%
7%
Within last 3months
Not used in lastthree months
Internet Recent Usage Frequency
Base: All Respondents (n=1196)
Main Internet Activities (2015)
KEY SURVEY FINDINGS 2015
Social networking sites
74%Sending or receiving e-mail58%
Telephoning over the Internet/VoIP
45%Downloading movies, images, music etc.
44%

Co
pyr
igh
t ©
2015
Th
e N
iels
en C
om
pan
y. C
on
fid
enti
al a
nd
pro
pri
etar
y.
12
AVERAGE MONTHLY SPEND- The majority of respondents (97% in 2015) spend less than BD20 on their fixed line services.- The proportion of the respondents who spend more than BD10 but less than BD20 on their mobile phone
services has slightly decreased to 40% in 2015 compared to 43% in 2014.
[Q18] What is your household's average monthly bill on fixed line services?(including international calls)?[Q38] On average, how much do you spend on mobile phone service (including international calls) each month?
28%
64%
38%53%
31%
28%
54%
44%27%
5% 8% 1%14%
4% 1%
2007 2011 2014 2015
More thanBD 30
BD 20.1 -BD 30
BD 10.1 -BD 20
Less thanBD 10
34%47%
39%48%
32%
27% 43%40%
26%20%
14% 9%8% 5% 4% 3%
2007 2011 2014 2015
More than BD 30
Greater than BD 20but less than BD 30
Greater than BD 10but less than BD 20
Less than BD 10
Average monthly spend - Fixed LineAverage monthly spend - Mobile Phone
Service (including data)
Base: All who have used fixed line (n=144)Base: All who have used mobile phone line (n=1195)
KEY SURVEY FINDINGS 2015
Co
pyr
igh
t ©
2015
Th
e N
iels
en C
om
pan
y. C
on
fid
enti
al a
nd
pro
pri
etar
y.
13
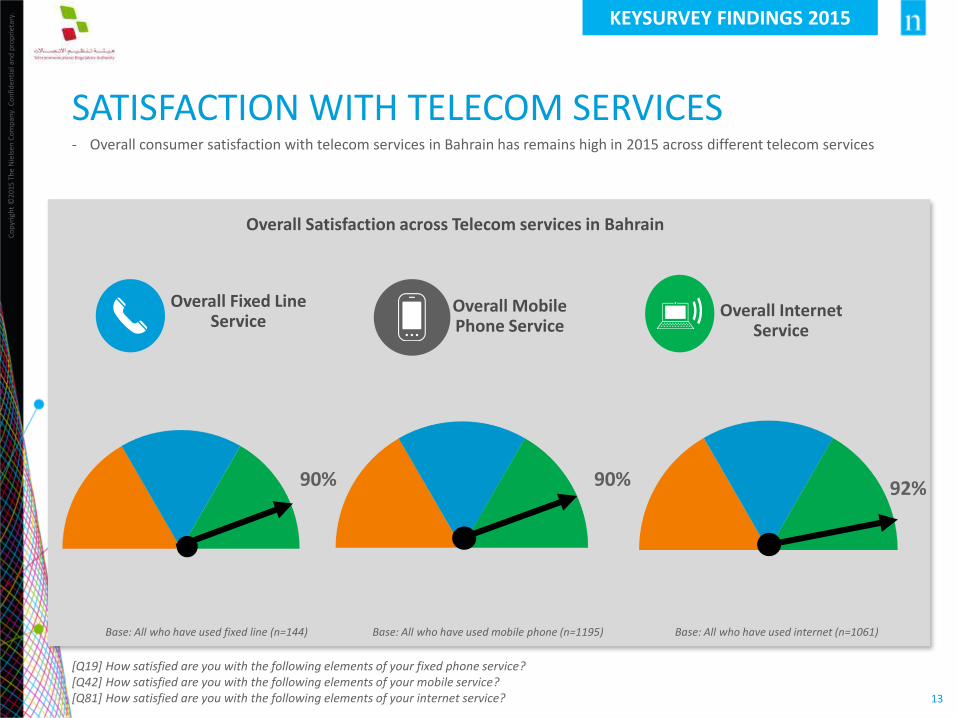
SATISFACTION WITH TELECOM SERVICES- Overall consumer satisfaction with telecom services in Bahrain has remains high in 2015 across different telecom services
[Q19] How satisfied are you with the following elements of your fixed phone service?[Q42] How satisfied are you with the following elements of your mobile service?[Q81] How satisfied are you with the following elements of your internet service?
Overall Satisfaction across Telecom services in Bahrain
Base: All who have used fixed line (n=144) Base: All who have used mobile phone (n=1195) Base: All who have used internet (n=1061)
KEYSURVEY FINDINGS 2015
90%
Overall Fixed Line Service
Overall Mobile Phone Service
Overall Internet Service
90% 92%

Co
pyr
igh
t ©
2015
Th
e N
iels
en C
om
pan
y. C
on
fid
enti
al a
nd
pro
pri
etar
y.
14
SWITCHING BETWEEN TELECOM SERVICES PROVIDERS
Between Fixed Line Providers
45%
28%
22%
15%
Quality of Services
Lower price
Other
BetterProcesses/Promoti…
53%
39%
18%
18%
10%
Price
Service Quality
Reliability
Range of Services…
Other
Between Mobile Phone Providers Between Internet Service Providers
- 12% of respondents who have a fixed line have switched their fixed line providers. Same percentage of respondents have switched their mobile service providers and slightly lower percentage of respondents (i.e. 10%) have switched their internet service providers.
- However, the main reason for switching between services providers different among the telecom service. It is “Quality of Service” in fixed line service, attractive promotion in mobile phone service and the price in internet service.
12
Yes No
12
Yes No
Reasons for Switching
10
Yes No
62%
29%
15%
10%
Attractivepromotion
Good price
The otheroperator had…
Goodservice/Not…
Fixed Line Mobile Phone Service International Calls Internet Service OTT Behavior
TELECOM SERVICES
Co
pyr
igh
t ©
2015
Th
e N
iels
en C
om
pan
y. C
on
fid
enti
al a
nd
pro
pri
etar
y.
16
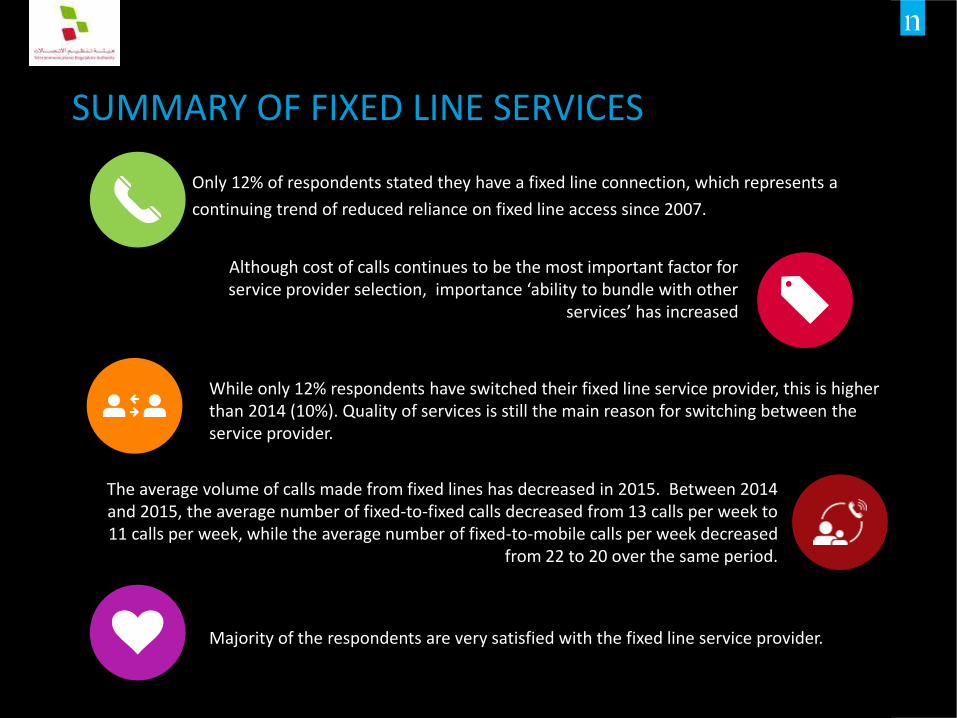
SUMMARY OF FIXED LINE SERVICES
Only 12% of respondents stated they have a fixed line connection, which represents a
continuing trend of reduced reliance on fixed line access since 2007.
While only 12% respondents have switched their fixed line service provider, this is higher than 2014 (10%). Quality of services is still the main reason for switching between the service provider.
Although cost of calls continues to be the most important factor for service provider selection, importance ‘ability to bundle with other
services’ has increased
The average volume of calls made from fixed lines has decreased in 2015. Between 2014 and 2015, the average number of fixed-to-fixed calls decreased from 13 calls per week to 11 calls per week, while the average number of fixed-to-mobile calls per week decreased
from 22 to 20 over the same period.
Majority of the respondents are very satisfied with the fixed line service provider.
Co
pyr
igh
t ©
2015
Th
e N
iels
en C
om
pan
y. C
on
fid
enti
al a
nd
pro
pri
etar
y.
17
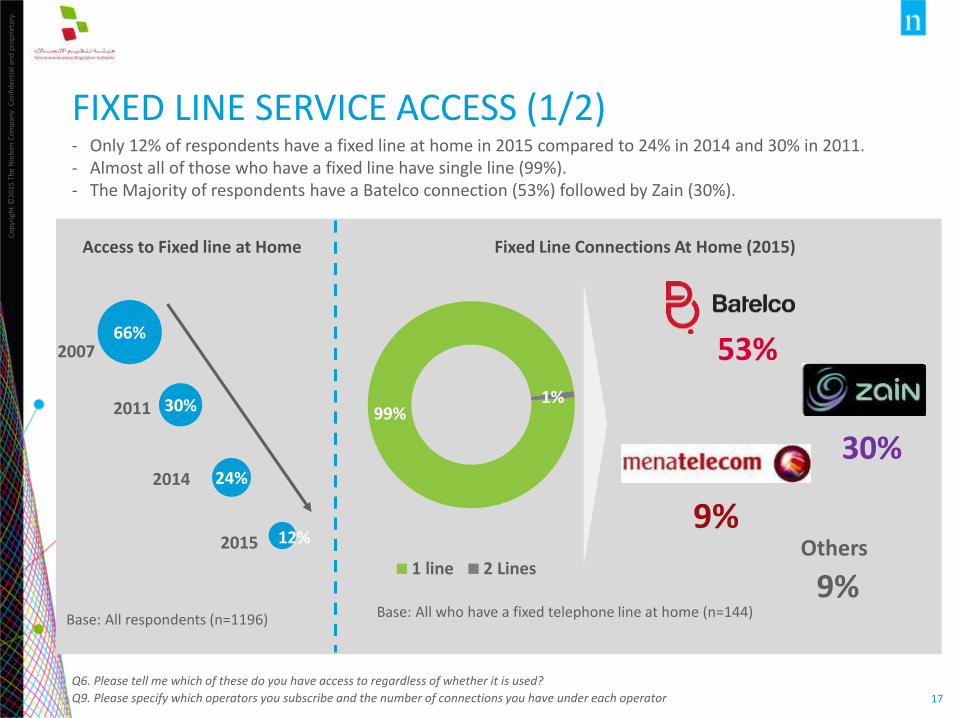
FIXED LINE SERVICE ACCESS (1/2)- Only 12% of respondents have a fixed line at home in 2015 compared to 24% in 2014 and 30% in 2011.- Almost all of those who have a fixed line have single line (99%).- The Majority of respondents have a Batelco connection (53%) followed by Zain (30%).
Q6. Please tell me which of these do you have access to regardless of whether it is used?
Q9. Please specify which operators you subscribe and the number of connections you have under each operator
Access to Fixed line at Home Fixed Line Connections At Home (2015)
99%1%
1 line 2 Lines
53%
30%
9%Others
9%Base: All who have a fixed telephone line at home (n=144)Base: All respondents (n=1196)
66%
30%
24%
12%
2007
2011
2014
2015

Co
pyr
igh
t ©
2015
Th
e N
iels
en C
om
pan
y. C
on
fid
enti
al a
nd
pro
pri
etar
y.
18
FIXED LINE SERVICE ACCESS (2/2)- While only 11% of respondents have previously cancelled their fixed line service at home to rely solely on
their mobile phone, the availability of a mobile phone is still the main reason for not having a fixed line at home.
Q7. Have you previously cancelled a fixed line service and instead relied solely on mobile service?
Q8 which of the following most closely describe your reasons for not having a fixed telephone?
Cancellation of fixed line for mobile connections
11%
89%
Yes
No
Reasons For Not Using Fixed Lines
86%
Base: All Respondents who don't have Fixed line telephone access (n=906)
Base: All respondents (n=1196) Base: All who have not used fixed line (n=1052)
×
√
5% 2%
Have a Mobile Phone, so I Don’t Need a Fixed Line
The Cost of Getting a Fixed Line is Too
High
Building That I Stay in, is Not Served by
Fixed Telephony

Co
pyr
igh
t ©
2015
Th
e N
iels
en C
om
pan
y. C
on
fid
enti
al a
nd
pro
pri
etar
y.
19
IMPORTANT FACTORS FOR SERVICE PROVIDER SELECTION- Although cost of calls continues to be the most important factor for service provider selection, its
importance has slightly deceased in 2015 while “Ability to bundle with other services” become more important in 2015 compared to 2014 results has increased .
[Q10]. What factors are most important to you when selecting a fixed line provider? Please rate the following factors on a 5 point importance scale where 5 means extremely important and 1 means not at all important
2%
5%
2%
2%
4%
6%
5%
6%
7%
8%
4%
16%
12%
20%
9%
5%
15%
8%
93%
90%
91%
82%
87%
75%
91%
89%
79%
85%
2014
2015
2014
2015
2014
2015
2014
2015
2014
2015
Co
st o
f ca
llsC
ost
of
line
ren
tal
Cu
sto
me
rse
rvic
eC
all q
ual
ity
Ab
ility
to
bu
nd
le w
ith
oth
erse
rvic
es
Not Important/Not at all Important Neither Important not unimportant Important/Extremely Important
Factors of selecting Service Provider
Base: All who have used fixed line (n=144)
Co
pyr
igh
t ©
2015
Th
e N
iels
en C
om
pan
y. C
on
fid
enti
al a
nd
pro
pri
etar
y.
20
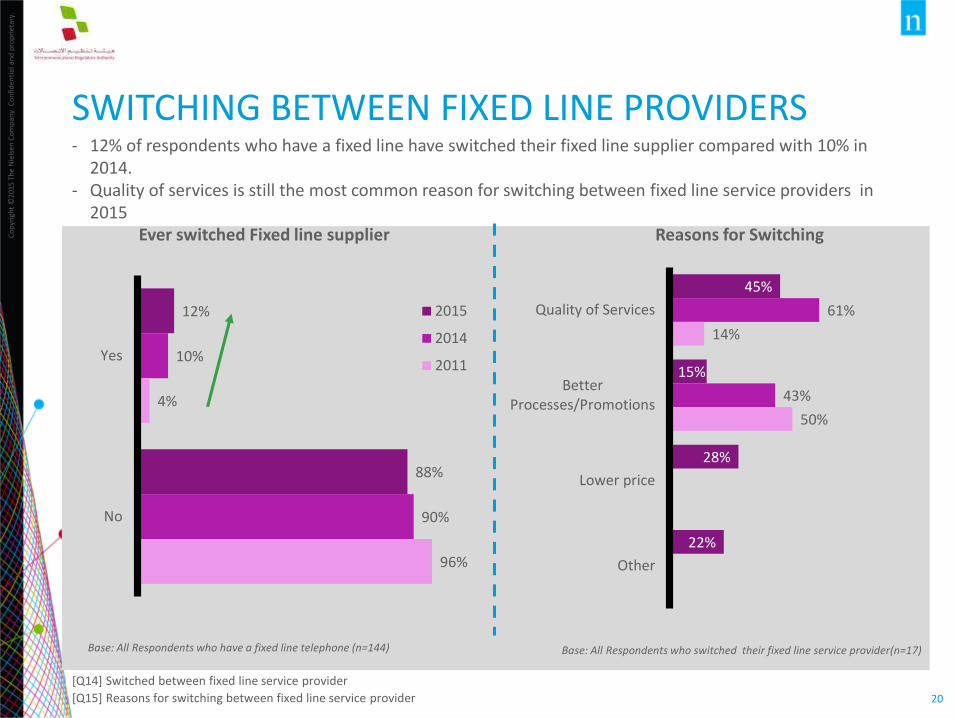
SWITCHING BETWEEN FIXED LINE PROVIDERS- 12% of respondents who have a fixed line have switched their fixed line supplier compared with 10% in
2014. - Quality of services is still the most common reason for switching between fixed line service providers in
2015
[Q14] Switched between fixed line service provider
[Q15] Reasons for switching between fixed line service provider
Base: All Respondents who switched their fixed line service provider(n=17)
12%
88%
10%
90%
4%
96%
Yes
No
2015
2014
2011
Ever switched Fixed line supplier Reasons for Switching
45%
15%
28%
22%
61%
43%
14%
50%
Quality of Services
BetterProcesses/Promotions
Lower price
Other
Base: All Respondents who have a fixed line telephone (n=144)
Co
pyr
igh
t ©
2015
Th
e N
iels
en C
om
pan
y. C
on
fid
enti
al a
nd
pro
pri
etar
y.
21
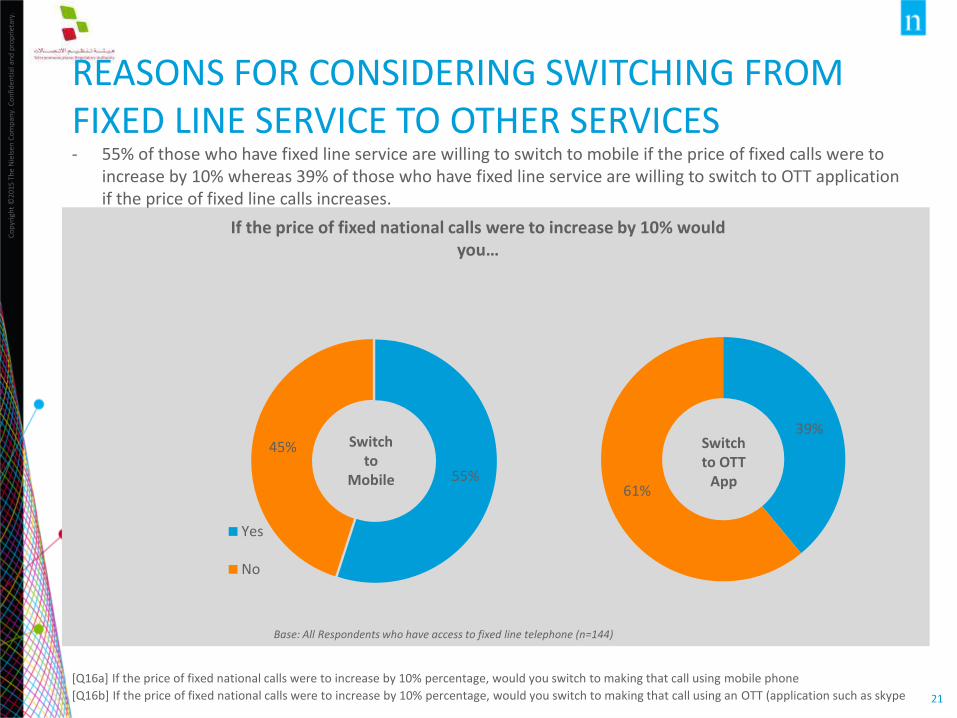
REASONS FOR CONSIDERING SWITCHING FROM FIXED LINE SERVICE TO OTHER SERVICES- 55% of those who have fixed line service are willing to switch to mobile if the price of fixed calls were to
increase by 10% whereas 39% of those who have fixed line service are willing to switch to OTT application if the price of fixed line calls increases.
[Q16a] If the price of fixed national calls were to increase by 10% percentage, would you switch to making that call using mobile phone
[Q16b] If the price of fixed national calls were to increase by 10% percentage, would you switch to making that call using an OTT (application such as skype
Base: All Respondents who have access to fixed line telephone (n=144)
55%
45%
Yes
No
39%
61%
If the price of fixed national calls were to increase by 10% would you…
Switch to OTT
App
Switch to
Mobile
Co
pyr
igh
t ©
2015
Th
e N
iels
en C
om
pan
y. C
on
fid
enti
al a
nd
pro
pri
etar
y.
22
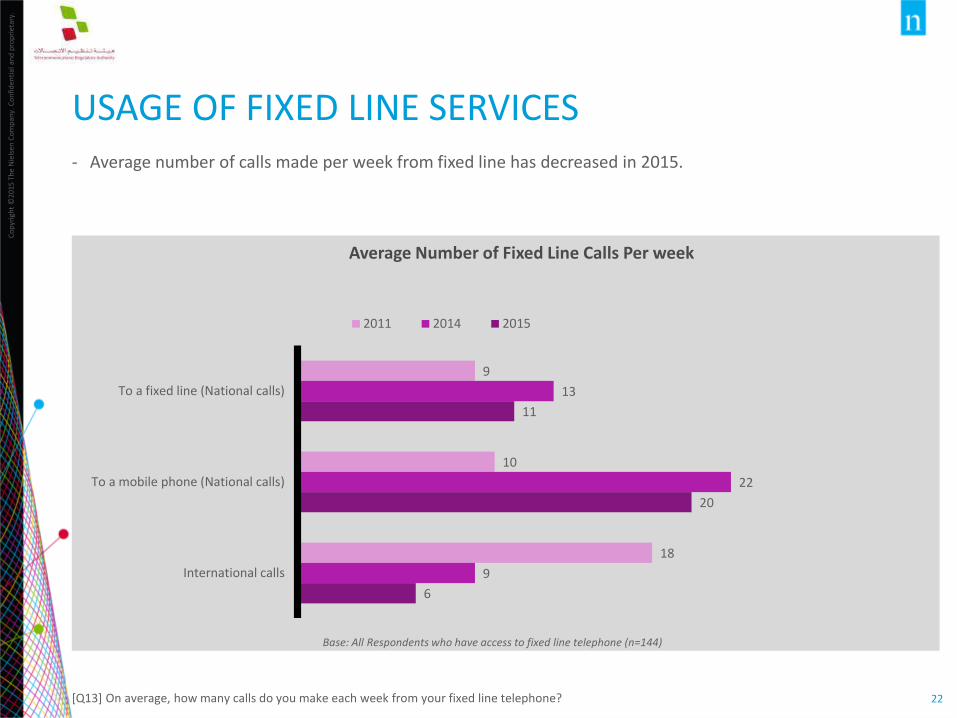
USAGE OF FIXED LINE SERVICES- Average number of calls made per week from fixed line has decreased in 2015.
[Q13] On average, how many calls do you make each week from your fixed line telephone?
Base: All Respondents who have access to fixed line telephone (n=144)
9
10
18
13
22
9
11
20
6
To a fixed line (National calls)
To a mobile phone (National calls)
International calls
2011 2014 2015
Average Number of Fixed Line Calls Per week
Co
pyr
igh
t ©
2015
Th
e N
iels
en C
om
pan
y. C
on
fid
enti
al a
nd
pro
pri
etar
y.
23
64%
38%
53%
28%
54%
44%
5% 8% 1%4% 1%
2011 2014 2015
Morethan BD30BD 20.1 -BD 30
BD 10.1 -BD 20
Lessthan BD10
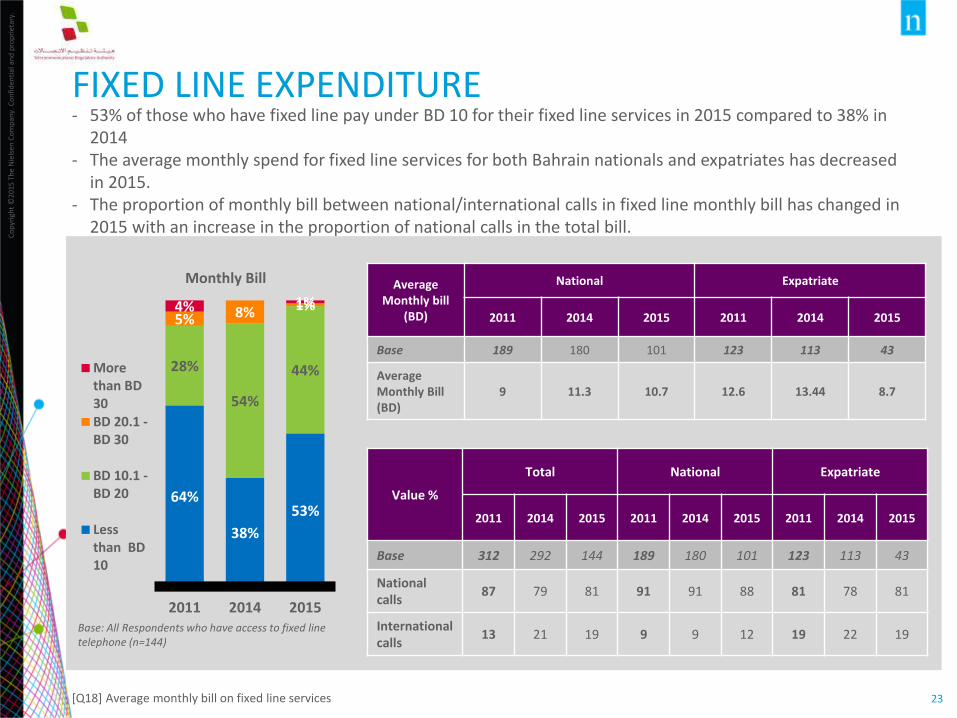
FIXED LINE EXPENDITURE - 53% of those who have fixed line pay under BD 10 for their fixed line services in 2015 compared to 38% in
2014- The average monthly spend for fixed line services for both Bahrain nationals and expatriates has decreased
in 2015.- The proportion of monthly bill between national/international calls in fixed line monthly bill has changed in
2015 with an increase in the proportion of national calls in the total bill.
[Q18] Average monthly bill on fixed line services
Monthly Bill Average Monthly bill
(BD)
National Expatriate
2011 2014 2015 2011 2014 2015
Base 189 180 101 123 113 43
Average Monthly Bill (BD)
9 11.3 10.7 12.6 13.44 8.7
Value %
Total National Expatriate
2011 2014 2015 2011 2014 2015 2011 2014 2015
Base 312 292 144 189 180 101 123 113 43
National calls
87 79 81 91 91 88 81 78 81
International calls
13 21 19 9 9 12 19 22 19Base: All Respondents who have access to fixed line telephone (n=144)

Co
pyr
igh
t ©
2015
Th
e N
iels
en C
om
pan
y. C
on
fid
enti
al a
nd
pro
pri
etar
y.
24
SATISFACTION LEVELS – FIXED LINE- Satisfaction with overall fixed line services has remained stable in 2015. However, satisfaction with ‘Quality
of customer service’ has dropped from 82% in 2014 to 74% in 2015.
[Q19] Satisfaction towards fixed line service
Base: All Respondents who have access to fixed line telephone (n=144)
Fixed Line Satisfaction Levels
0% 2% 0% 1% 1% 1% 1%9%
1% 2% 0% 2% 4% 1% 5% 9% 5%8%9%
8%16%
20%15%
20% 15% 20%
33%40%
42% 54% 37%
51%
33%
43%33% 30%
57%50% 45%
38%45%
23%
42%31%
42% 44%
2014 2015 2014 2015 2014 2015 2014 2015 2014 2015
Overall fixed telephoneservice
Quality of Service Quality of customerservice
Price of national calls Price of internationalcalls
Not at all satisfied Not satisfied Neither satisfied nor dissatisfied Fairly Satisfied Very satisfied

Co
pyr
igh
t ©
2015
Th
e N
iels
en C
om
pan
y. C
on
fid
enti
al a
nd
pro
pri
etar
y.
25
IMPROVEMENT SUGGESTIONS FOR FIXED LINE - Although “Reduce charges/tariff” is still the main suggestion for improvements (48% in 2015), the
proportion has dropped compared to previous years.
[Q20] Suggestions to improve fixed line service
Base: All Respondents who have access to fixed line telephone (n=144)
81%
42% 41%37%
74%
25%22% 21%
60%
48%
40%
32%
48%
37%
31%28%
Reduce charges / tariffs Improve the quality of fixed lineservice
Improve the range of services /features available for fixed line
Improve quality of customer servicewhen there is problem with the
service
2007 2011 2014 2015
Improvement suggestions
Fixed Line
Mobile Phone Service International Calls Internet Service OTT Behavior
TELECOM SERVICES

Co
pyr
igh
t ©
2015
Th
e N
iels
en C
om
pan
y. C
on
fid
enti
al a
nd
pro
pri
etar
y.
27
SUMMARY OF MOBILE PHONE SERVICESAll respondents have access to mobile phones. 41% of respondents have 2 or more SIM
cards and handsets. The primary reasons for having more than one active SIM card was to
use various promotions offered by different service providers.
12% have switched their mobile service providers compared to 7% by 2007. Attractive
promotion is the main reason for customers to have switched their service providers
A significant increase has been seen in the use of VAS in 2015 with browsing internet,
mobile information services, downloading games, ringtones, wallpapers, mobile banking,
and mobile VoIP being the major activities driving the growth
The majority of respondents are satisfied with the overall mobile service. It has improved
considerably since 2014 in most areas (i.e. price of national calls; quality of customer service;
voice quality etc.)
Number of SMS sent in a week as reported by respondents has dramatically reduced from 20 SMS in 2011 to only 2 SMS in 2015.

Co
pyr
igh
t ©
2015
Th
e N
iels
en C
om
pan
y. C
on
fid
enti
al a
nd
pro
pri
etar
y.
28
MOBILE PHONE ACCESS- Mobile phone access remains high with 100% of respondents having access to a mobile phone.- 41% of respondents have 2 or more active SIM cards.- “To take advantage of different promotions offered by different operators” still is the main reason for using
multiple SIM cards.
[Q21] Does this household have a mobile telephone?
[Q24] How many active SIM cards?
[Q25] You mentioned that you use more than one active SIM card for your needs; could you please tell us the reasons why do you use more than one SIM Cards?
Access to mobile phone
99%
99%
100%
100%
2007
2011
2014
2015
No. of active SIM cards
59%
32%
8%1%
1 line 2 Lines
3 lines 3+ lines
Base: All respondents (1196)Base: (All respondent who has mobile phone (n=1195)
Reasons for having
more than one
SIM card
2011 2014 2015
To take advantage of different promotions offered by different operators
54% 68% 60%
To have separate SIMs for business or personal use
40% 46% 42%
To use when traveling abroad
6% 6% 6%
Reasons for having more than one active SIM cards
Base: All Respondents who have more than one SIM card (n=480)
Co
pyr
igh
t ©
2015
Th
e N
iels
en C
om
pan
y. C
on
fid
enti
al a
nd
pro
pri
etar
y.
29
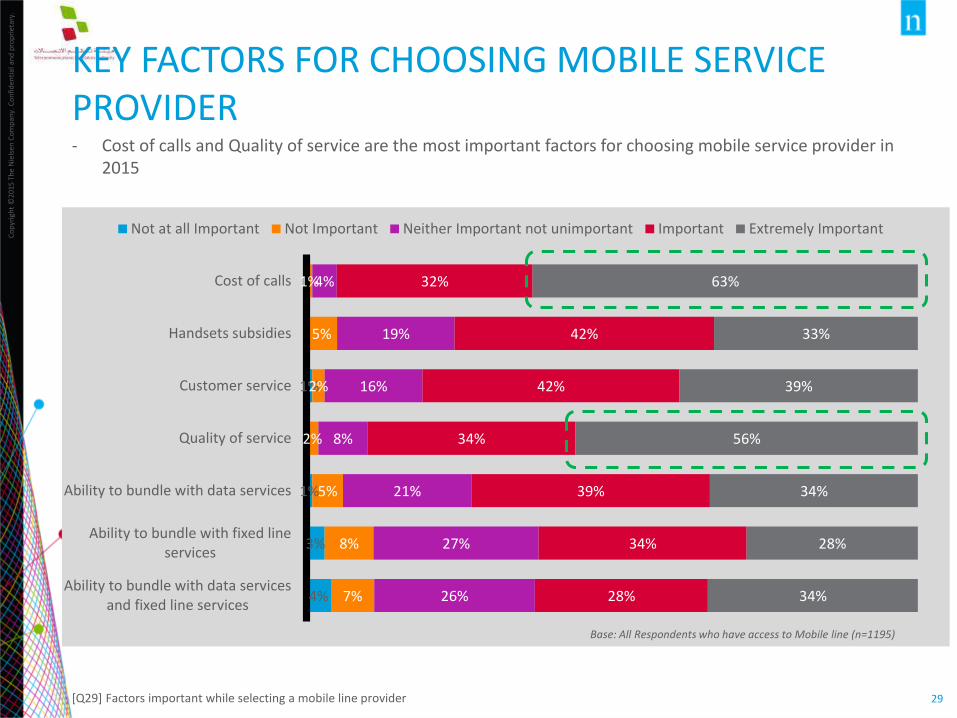
KEY FACTORS FOR CHOOSING MOBILE SERVICE PROVIDER - Cost of calls and Quality of service are the most important factors for choosing mobile service provider in
2015
[Q29] Factors important while selecting a mobile line provider
1%
1%
3%
4%
1%
5%
2%
2%
5%
8%
7%
4%
19%
16%
8%
21%
27%
26%
32%
42%
42%
34%
39%
34%
28%
63%
33%
39%
56%
34%
28%
34%
Cost of calls
Handsets subsidies
Customer service
Quality of service
Ability to bundle with data services
Ability to bundle with fixed lineservices
Ability to bundle with data servicesand fixed line services
Not at all Important Not Important Neither Important not unimportant Important Extremely Important
Base: All Respondents who have access to Mobile line (n=1195)
Co
pyr
igh
t ©
2015
Th
e N
iels
en C
om
pan
y. C
on
fid
enti
al a
nd
pro
pri
etar
y.
30
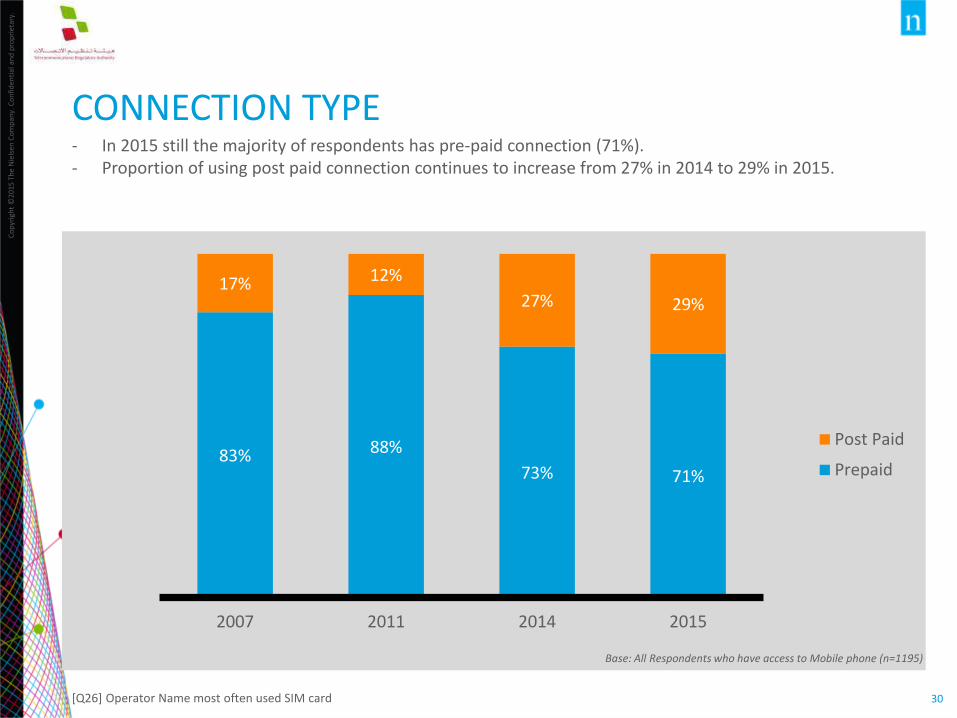
CONNECTION TYPE- In 2015 still the majority of respondents has pre-paid connection (71%).- Proportion of using post paid connection continues to increase from 27% in 2014 to 29% in 2015.
[Q26] Operator Name most often used SIM card
83% 88%
73% 71%
17% 12%
27% 29%
2007 2011 2014 2015
Post Paid
Prepaid
Base: All Respondents who have access to Mobile phone (n=1195)

Co
pyr
igh
t ©
2015
Th
e N
iels
en C
om
pan
y. C
on
fid
enti
al a
nd
pro
pri
etar
y.
31
TYPE OF MOBILE PHONE SUBSCRIPTION- The main reasons for using prepaid connection was “to manage respondents expenditures” whereas
“subscription being a part of good offer/package” was the main reason for using post paid connection
[Q26] Operator Name most often used SIM card
[Q27] Reason for using prepaid connection only
[Q28] Reason for using postpaid connection only
Connection Type
(2015)
71%
29%
Prepaid connection
Post-paid connection
46%
48%
27%
To avoid monthlypayment
To manage myexpenditures
Subscription waspart of a good offer
/package
Reason for using prepaid connection only
21%
44%
42%
Internationalroaming easier touse with postpaid
Subscription waspart of a good offer
/package
To avoid having torecharge phone
credit
Reason for using postpaid connection only
Base: All Respondents who have access to Mobile phone(n=1195)
Base: (All respondent who use mobile phones (n=848) Base: (All respondent who use mobile phones (n=377)

Co
pyr
igh
t ©
2015
Th
e N
iels
en C
om
pan
y. C
on
fid
enti
al a
nd
pro
pri
etar
y.
32
MOBILE CALLING PATTERNS- The average number of national calls from mobile has decreased from 32 calls per week in 2014 to 25 calls
per week in 2015.- 32% of all weekly calls made from mobile are international calls in 2015 compared with 20% in 2014
[Q31] On average, how many calls do make each week from you mobile phone
[Q39] What % of mobile phone spend are national and international calls
Type of callAverage no. of calls per week
2011 2014 2015
National Calls 29 32 25
International calls - 9 14
Base: All Respondents who have access to Mobile line (n=1195)
Type of call
(weekly calls)
% Value (Average)
2011 2014 2015
National Calls 75% 80% 68%
International calls 25% 20% 32%

Co
pyr
igh
t ©
2015
Th
e N
iels
en C
om
pan
y. C
on
fid
enti
al a
nd
pro
pri
etar
y.
33
SWITCHING MOBILE SERVICE PROVIDERS - Only 12% of respondents switched their mobile service provider in 2015, which is slightly more than the
2014 survey results (only 10% in 2014).- “Attractive promotion” and “good price” remain the main reasons for switching between mobile service
providers given by the 2015 survey respondents.
[Q34] Switched between mobile phone service provider
[Q36] Reasons for switching between mobile phone service provider
7%
16%
10%
12%
93%
84%
90%
88%
2007
2011
2014
2015
Yes No
Ever switched
Reason 2007 2011 2014 2015
Base: All who switched providers before
77 171 128 148
Attractive promotion 19% 62% 56% 62%
Good price 23% 45% 46% 29%
The other operator had better mobile coverage
20% 15%
Good service/Not happy with service of previous provider
14% 11% 13% 10%
Base: All Respondents who have access to Mobile line (n=1195)
Reasons for switching

Co
pyr
igh
t ©
2015
Th
e N
iels
en C
om
pan
y. C
on
fid
enti
al a
nd
pro
pri
etar
y.
34
FREQUENCY OF USING VAS (1/2)- Respondents reported that the frequency of usage on daily basis of value added services on mobile has
grown substantially. For instance, 59% of respondents reported that they never used mobile games in 2011; this percentage has decreased to 28% in 2014 and to 23% in 2015.
- Respondents also reported that the frequency of using SMS continues to fall as only 4% used SMS service ‘at least once a day’ compared to 18% in 2014 and 41% in 2011
[Q32] Please describe the frequency in which you use the following mobile services
Base: All Respondents who have access to Mobile line (n=1195)
24%31% 33%
41%
18%4% 8%
26%15%
9%
23% 22%
23%
18%
11%10%
15%
21%
4%
12%18%
8%
11%
15% 7%
15% 23%7%
10%
13%7%
27%
43%
14%
16%18%
56%
25%13%
20% 25% 27%
59%
28% 23%
2011 2014 2015 2011 2014 2015 2011 2014 2015
Checking email SMS Mobile games
At least once a day At least once a week At least once a month Less Often Never
Frequency of Using VAS
Co
pyr
igh
t ©
2015
Th
e N
iels
en C
om
pan
y. C
on
fid
enti
al a
nd
pro
pri
etar
y.
35
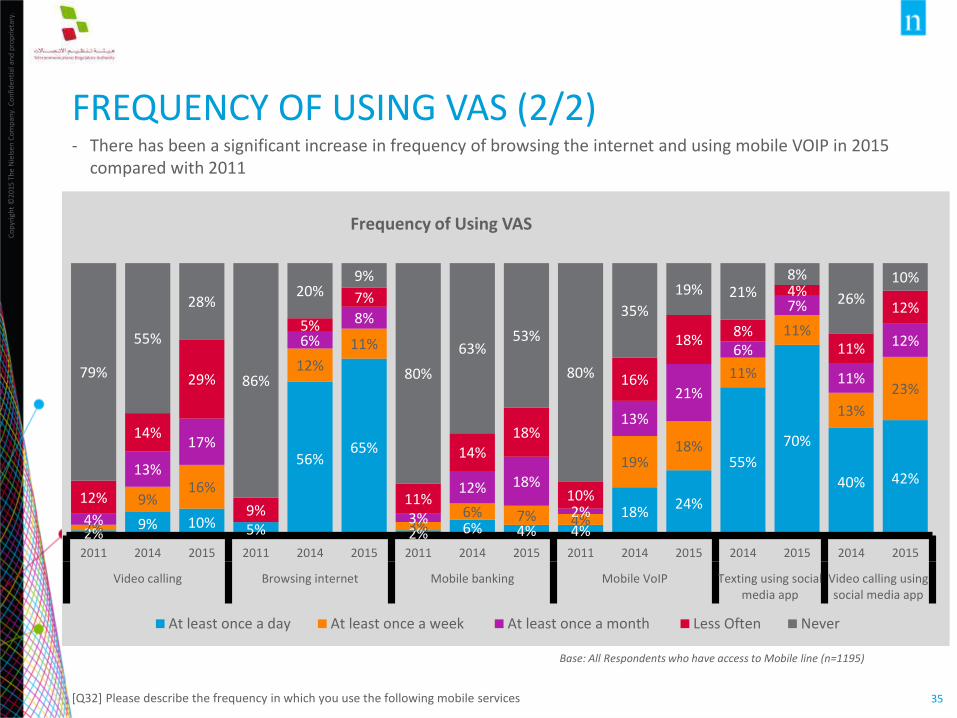
FREQUENCY OF USING VAS (2/2)- There has been a significant increase in frequency of browsing the internet and using mobile VOIP in 2015
compared with 2011
[Q32] Please describe the frequency in which you use the following mobile services
Base: All Respondents who have access to Mobile line (n=1195)
2%9% 10% 5%
56%65%
2% 6% 4% 4%18%
24%
55%
70%
40% 42%
2%
9%16%
12%
11%
3%6% 7% 4%
19%18%
11%
11%
13%
23%
4%
13%
17%
6%
8%
3%
12% 18%
2%
13%
21%
6%
7%
11%
12%
12%
14%
29%
9%
5%
7%
11%
14%18%
10%
16%
18%8%
4%
11%
12%
79%
55%
28%
86%
20%9%
80%
63%53%
80%
35%
19% 21%8%
26%
10%
2011 2014 2015 2011 2014 2015 2011 2014 2015 2011 2014 2015 2014 2015 2014 2015
Video calling Browsing internet Mobile banking Mobile VoIP Texting using socialmedia app
Video calling usingsocial media app
At least once a day At least once a week At least once a month Less Often Never
Frequency of Using VAS

Co
pyr
igh
t ©
2015
Th
e N
iels
en C
om
pan
y. C
on
fid
enti
al a
nd
pro
pri
etar
y.
36
WEEKLY SMS SENT- Number of SMS sent in a week as reported by respondents has dramatically reduced from 20 SMS in 2011 to only 2 SMS in 2015.
[Q33] Could you please tell me in a typical week how many SMS do you send
No of SMS Sent in a week 2007 2011 2014 2015
Base (who have mobile connection) 813 1043 1202 1195
1-5 29% 30% 22% 24%
6-10 31% 21% 10% 2%
11-15 9% 3% 1% 1%
16-20 11% 7% 1% 1%
More than 20 20% 11% 1% -
Average No of SMS in a week 15 20 4 2
Co
pyr
igh
t ©
2015
Th
e N
iels
en C
om
pan
y. C
on
fid
enti
al a
nd
pro
pri
etar
y.
37
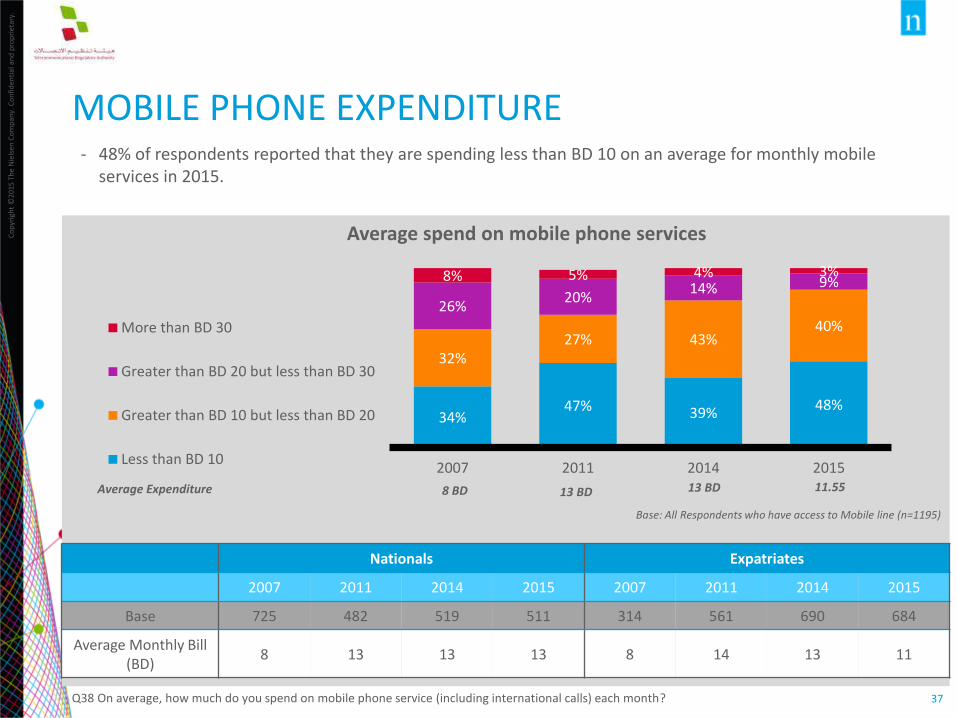
MOBILE PHONE EXPENDITURE- 48% of respondents reported that they are spending less than BD 10 on an average for monthly mobile
services in 2015.
Q38 On average, how much do you spend on mobile phone service (including international calls) each month?
Base: All Respondents who have access to Mobile line (n=1195)
34%47% 39%
48%
32%27% 43%
40%26%
20%14% 9%8% 5% 4% 3%
2007 2011 2014 2015
More than BD 30
Greater than BD 20 but less than BD 30
Greater than BD 10 but less than BD 20
Less than BD 10
Average spend on mobile phone services
8 BD 13 BDAverage Expenditure 13 BD
Nationals Expatriates
2007 2011 2014 2015 2007 2011 2014 2015
Base 725 482 519 511 314 561 690 684
Average Monthly Bill (BD)
8 13 13 13 8 14 13 11
11.55
Co
pyr
igh
t ©
2015
Th
e N
iels
en C
om
pan
y. C
on
fid
enti
al a
nd
pro
pri
etar
y.
38
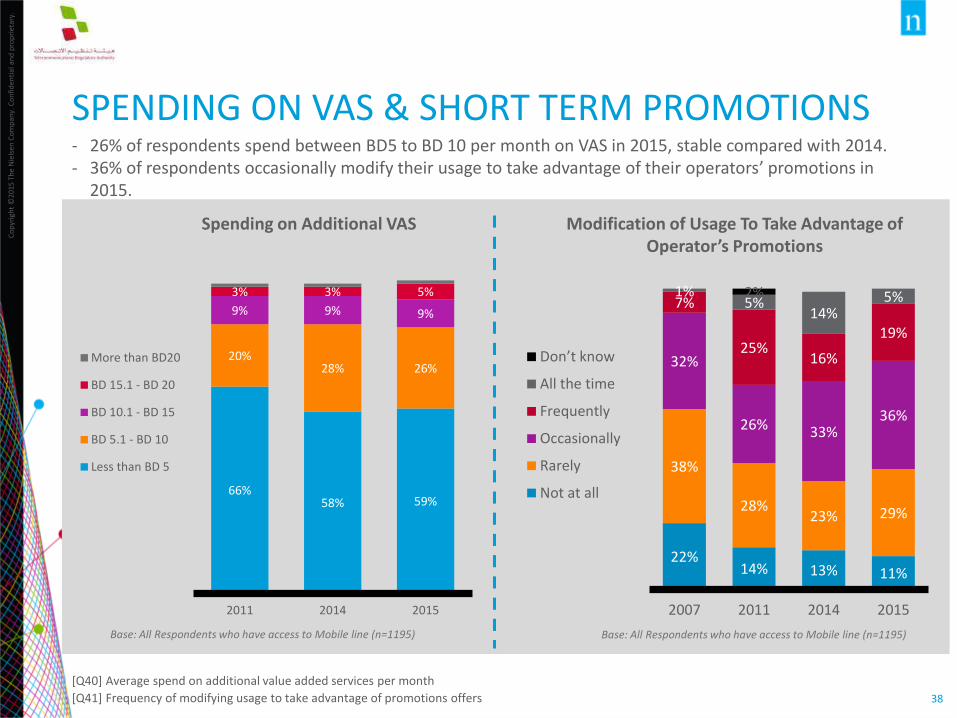
SPENDING ON VAS & SHORT TERM PROMOTIONS- 26% of respondents spend between BD5 to BD 10 per month on VAS in 2015, stable compared with 2014.- 36% of respondents occasionally modify their usage to take advantage of their operators’ promotions in
2015.
[Q40] Average spend on additional value added services per month
[Q41] Frequency of modifying usage to take advantage of promotions offers
Base: All Respondents who have access to Mobile line (n=1195)
66%58% 59%
20%28% 26%
9% 9% 9%
3% 3% 5%
2011 2014 2015
More than BD20
BD 15.1 - BD 20
BD 10.1 - BD 15
BD 5.1 - BD 10
Less than BD 5
Spending on Additional VAS
22%14% 13% 11%
38%
28%23% 29%
32%
26% 33%36%
7%
25%16%
19%
1%5%
14%5%2%
2007 2011 2014 2015
Don’t know
All the time
Frequently
Occasionally
Rarely
Not at all
Modification of Usage To Take Advantage of Operator’s Promotions
Base: All Respondents who have access to Mobile line (n=1195)
Co
pyr
igh
t ©
2015
Th
e N
iels
en C
om
pan
y. C
on
fid
enti
al a
nd
pro
pri
etar
y.
39
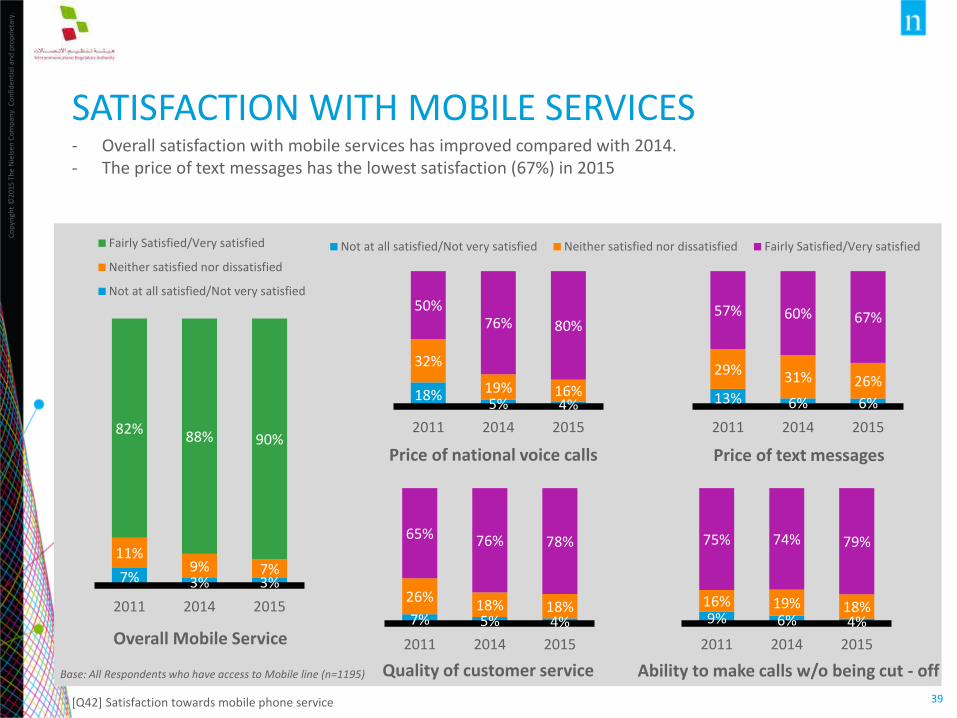
SATISFACTION WITH MOBILE SERVICES- Overall satisfaction with mobile services has improved compared with 2014. - The price of text messages has the lowest satisfaction (67%) in 2015
[Q42] Satisfaction towards mobile phone service
Base: All Respondents who have access to Mobile line (n=1195)
Overall Mobile Service
Not at all satisfied/Not very satisfied Neither satisfied nor dissatisfied Fairly Satisfied/Very satisfied
7% 3% 3%
11%9% 7%
82%88% 90%
2011 2014 2015
Fairly Satisfied/Very satisfied
Neither satisfied nor dissatisfied
Not at all satisfied/Not very satisfied
18%5% 4%
32%
19% 16%
50%76% 80%
2011 2014 2015
13% 6% 6%
29% 31% 26%
57% 60% 67%
2011 2014 2015
7% 5% 4%
26%18% 18%
65% 76% 78%
2011 2014 2015
9% 6% 4%
16% 19% 18%
75% 74% 79%
2011 2014 2015
Price of national voice calls Price of text messages
Quality of customer service Ability to make calls w/o being cut - off
Co
pyr
igh
t ©
2015
Th
e N
iels
en C
om
pan
y. C
on
fid
enti
al a
nd
pro
pri
etar
y.
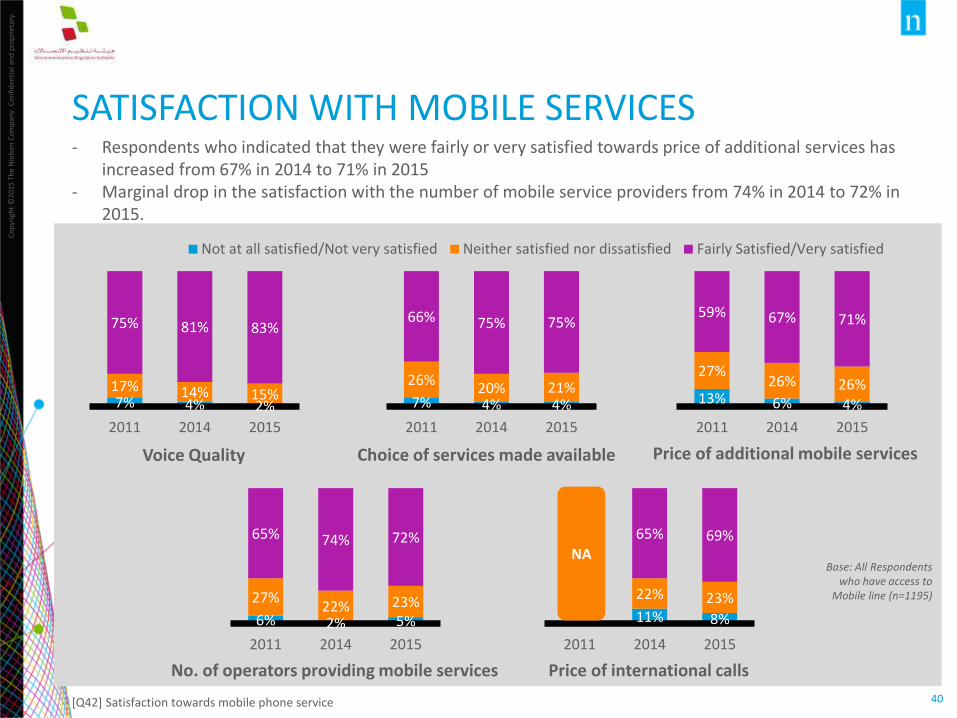
40
SATISFACTION WITH MOBILE SERVICES- Respondents who indicated that they were fairly or very satisfied towards price of additional services has
increased from 67% in 2014 to 71% in 2015- Marginal drop in the satisfaction with the number of mobile service providers from 74% in 2014 to 72% in
2015.
Base: All Respondents who have access to
Mobile line (n=1195)
Not at all satisfied/Not very satisfied Neither satisfied nor dissatisfied Fairly Satisfied/Very satisfied
7% 4% 2%17% 14% 15%
75% 81% 83%
2011 2014 2015
7% 4% 4%
26%20% 21%
66% 75% 75%
2011 2014 2015
6% 2% 5%
27%22% 23%
65% 74% 72%
2011 2014 2015
13% 6% 4%
27%26% 26%
59% 67% 71%
2011 2014 2015
Choice of services made available
No. of operators providing mobile services
Price of additional mobile servicesVoice Quality
11% 8%
22% 23%
65% 69%
2011 2014 2015
Price of international calls
NA
[Q42] Satisfaction towards mobile phone service

Co
pyr
igh
t ©
2015
Th
e N
iels
en C
om
pan
y. C
on
fid
enti
al a
nd
pro
pri
etar
y.
41
SUGGESTIONS FOR IMPROVEMENT- 65% of respondents to the 2015 survey stated that ‘Reduce Charges’ is a key area of improvement
followed by ‘Improve the quality of mobile services’
65%Reduce charges
52%Improve the
quality of mobile services
35%Improve the
range of services
available from mobile phone
28%Improve the
quality of customer
service when there is problem with the service
Base: All Respondents who have access to Mobile line (n=1195) [Q43] Suggestions to improve mobile phone service

Fixed Line Mobile Phone Service
International Calls Internet Service OTT Behavior
TELECOM SERVICES

Co
pyr
igh
t ©
2015
Th
e N
iels
en C
om
pan
y. C
on
fid
enti
al a
nd
pro
pri
etar
y.
43
SUMMARY OF INTERNATIONAL CALLS
60% of international calls are made using mobile phone, 34% of international calls are made by smart phone application and 6% by other services.
India is the top destination called from different mediums
60% of the respondents making international calls stated that if the price of fixed international calls were to increase by 10%, they would switch to mobile. 61% of the respondent making international calls stated that if the price of fixed international calls were to increase by 10%, they would switch to making that call using an OTT application such as skype
Co
pyr
igh
t ©
2015
Th
e N
iels
en C
om
pan
y. C
on
fid
enti
al a
nd
pro
pri
etar
y.
44
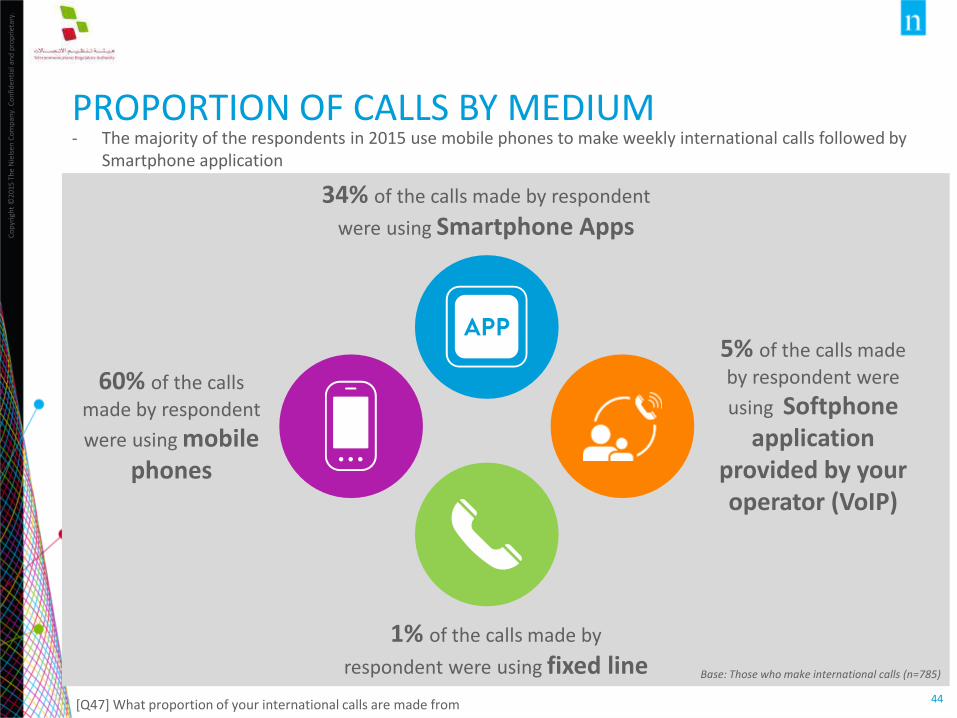
PROPORTION OF CALLS BY MEDIUM- The majority of the respondents in 2015 use mobile phones to make weekly international calls followed by
Smartphone application
1% of the calls made by
respondent were using fixed line
5% of the calls made
by respondent were
using Softphone application
provided by your operator (VoIP)
60% of the calls
made by respondent
were using mobile phones
34% of the calls made by respondent
were using Smartphone Apps
Base: Those who make international calls (n=785)
[Q47] What proportion of your international calls are made from

Co
pyr
igh
t ©
2015
Th
e N
iels
en C
om
pan
y. C
on
fid
enti
al a
nd
pro
pri
etar
y.
45
DESTINATIONS CALLED FROM DIFFERENT MEDIUMS - Among the 2015 respondents, India is the most popular destination for international calling across mediums
[[Q48/49/50/51]Countries called by medium
Mobile
Smart phone Applications
(i.e. Tango, Line, Viber and other)
Fixed LinePublic phone,
internet, personal computer
2011 2014 2015 2014 2015 2011 2014 2015 2014 2015
Base: All Respondents who make international calls regularly from…
628 717 770 445 656 166 120 42 203 241
India 44% 52% 64% 52% 64% 39% 31% 64% 37% 76%
Philippines 8% 13% 9% 16% 9% 7% 3% 9% 12% 2%
Bangladesh 5% 13% 7% 4% 5% 1% 5% 7% 27% 9%
Saudi Arabia 24% 9% 11% 13% 18% 43% 17% 11% 7% 6%
UAE 12% 6% 10% 14% 27% 16% 24% 10% 7% 13%
Qatar 5% 4% 4% 11% 10% 8% 23% 4% 3% 4%
Oman 4% 5% 4% 9% 5% 6% 15% 4% 9% 6%
Pakistan 14% 5% 6% 4% 6% 7% 0% 6% 8% 3%
Countries called by medium
Co
pyr
igh
t ©
2015
Th
e N
iels
en C
om
pan
y. C
on
fid
enti
al a
nd
pro
pri
etar
y.
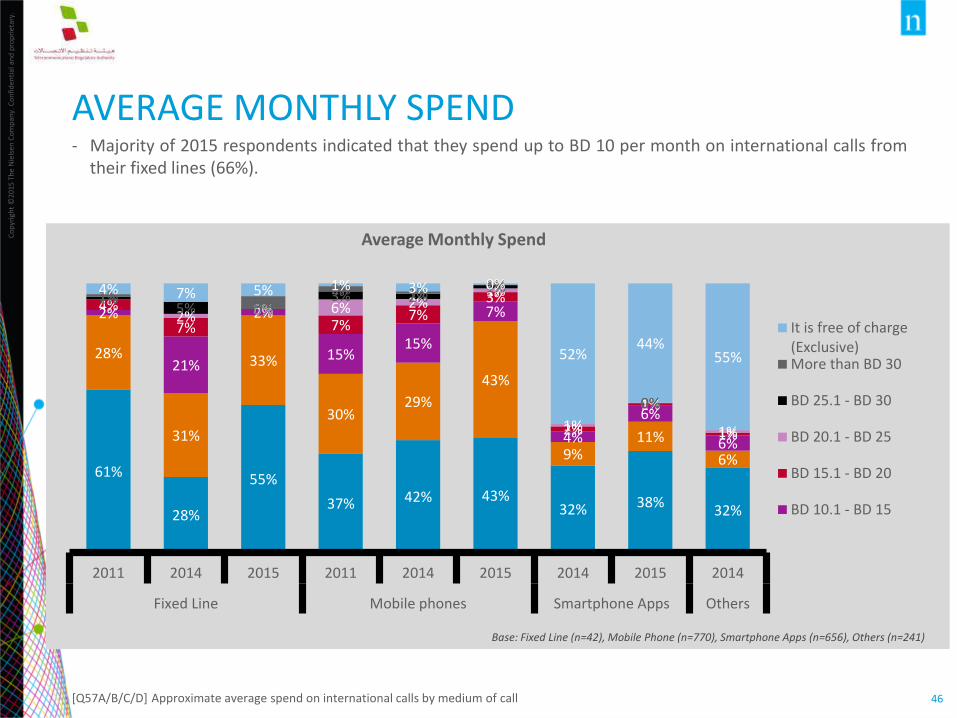
46
61%
28%
55%
37% 42% 43%32% 38%
32%
28%
31%
33%
30%29%
43%
9%11%
6%
2%
21%
2%
15%15%
7%
4%
6%
6%
4%
7%0%
7%7%
3%
2%
1%
1%
2% 0% 6% 2%1%
1%
0%
1%
1%5% 0%
3% 2%1%
0%
1% 5%2% 1% 0%
0%
4% 7% 5% 1% 3% 0%
52%44%
55%
2011 2014 2015 2011 2014 2015 2014 2015 2014
Fixed Line Mobile phones Smartphone Apps Others
It is free of charge(Exclusive)More than BD 30
BD 25.1 - BD 30
BD 20.1 - BD 25
BD 15.1 - BD 20
BD 10.1 - BD 15
AVERAGE MONTHLY SPEND- Majority of 2015 respondents indicated that they spend up to BD 10 per month on international calls from
their fixed lines (66%).
[Q57A/B/C/D] Approximate average spend on international calls by medium of call
Average Monthly Spend
Base: Fixed Line (n=42), Mobile Phone (n=770), Smartphone Apps (n=656), Others (n=241)

Co
pyr
igh
t ©
2015
Th
e N
iels
en C
om
pan
y. C
on
fid
enti
al a
nd
pro
pri
etar
y.
47
SWITCHING MODE OF INTERNATIONAL CALLS
60% of 2015 respondents making international calls stated that if the price
of fixed international calls were to increase by 10%, they would switch to mobile.
61% of the respondent making international calls stated that if the price
of fixed international calls were to increase by 10%, they would switch to
an OTT application such as skype
Base: All Respondents who make international calls (n=785)
Whereas…
[Q53] If the price of fixed international calls were to increase by 10%, would you switch to mobile.
[Q54] If the price of fixed international calls were to increase by 10%, would you switch to making that call using an OTT application such as skype

Fixed Line Mobile Phone Service International Calls
Internet Service OTT Behavior
TELECOM SERVICES

Co
pyr
igh
t ©
2015
Th
e N
iels
en C
om
pan
y. C
on
fid
enti
al a
nd
pro
pri
etar
y.
49
SUMMARY OF INTERNET SERVICES
The proportion of respondents who have access to the internet at home has increased from 67% in 2011, to 80% in 2014 and 89% in 2015
The proportion of respondents who used the internet within the last 3 months has also increased since 2014, from 87% in 2014 to 93% 2015. The majority of respondents who
used the internet in the last three months use it on a daily basis.
Social networking and sending and receiving emails are still the most common internet activities in 2015.
92% of respondents were satisfied with their overall internet service, while the most
common suggested improvement relates to reducing prices
A significant proportion of respondents would consider switching to mobile broadband if their current fixed broadband price increased by 10%.

Co
pyr
igh
t ©
2015
Th
e N
iels
en C
om
pan
y. C
on
fid
enti
al a
nd
pro
pri
etar
y.
50
ACCESS TO INTERNET- Access to internet at home has grown gradually from 67% in 2011, to 80% in 2014 and to 89% in 2015.
- Having access to internet elsewhere is the highest reason for not having internet at home (46%)
[Q55] Do you have internet at home?
[Q56] What are the reasons for not having access to the internet at home?
Access to Internet at Home Reasons For Not Having Internet at home
46%
23%
20%
14%
11%
20%
22%
30%
36%
32%
33%
21%
23%
23%
12%
Have access to Internet elsewhere
Access costs too high
Lack of time
Lack of skills or knowledge in using theinternet
Don't need Internet
2015 2014 2011
Base: All Respondents not having access to internet at home (n=135)Base: All respondents (n=1196)
53%
67%
80%
89%
2007
2011
2014
2015
Co
pyr
igh
t ©
2015
Th
e N
iels
en C
om
pan
y. C
on
fid
enti
al a
nd
pro
pri
etar
y.
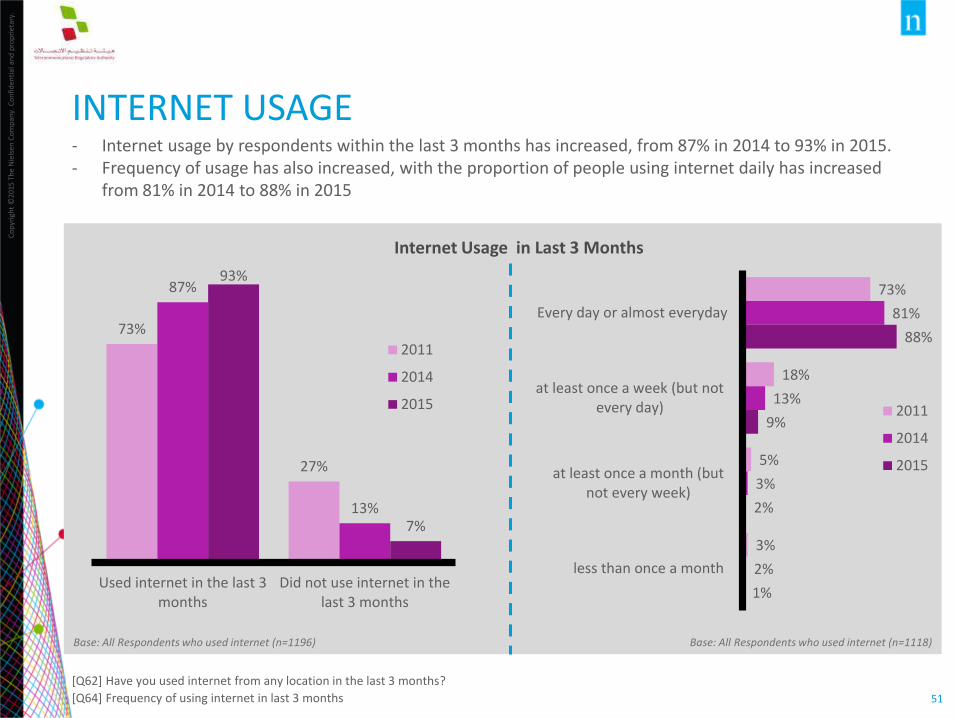
51
INTERNET USAGE - Internet usage by respondents within the last 3 months has increased, from 87% in 2014 to 93% in 2015.- Frequency of usage has also increased, with the proportion of people using internet daily has increased
from 81% in 2014 to 88% in 2015
[Q62] Have you used internet from any location in the last 3 months?
[Q64] Frequency of using internet in last 3 months
Internet Usage in Last 3 Months
73%
18%
5%
3%
81%
13%
3%
2%
88%
9%
2%
1%
Every day or almost everyday
at least once a week (but notevery day)
at least once a month (butnot every week)
less than once a month
2011
2014
2015
73%
27%
87%
13%
93%
7%
Used internet in the last 3months
Did not use internet in thelast 3 months
2011
2014
2015
Base: All Respondents who used internet (n=1196) Base: All Respondents who used internet (n=1118)

Co
pyr
igh
t ©
2015
Th
e N
iels
en C
om
pan
y. C
on
fid
enti
al a
nd
pro
pri
etar
y.
52
INTERNET USAGE PLACES - Home still the most popular place for using the internet with 84% of respondents used the internet at
home in the last three months.- Proportion of respondents using internet at work has grown from 57% in 2014 to 62% in 2015
[Q63] Venue of usage of internet in last 3 months
83%
30%23%
19%
11% 14%
5%
83%
57% 54%
26%21% 19%
15%
4%
84%
62%
51%
38%
26%
14%20%
5%
Home Work In mobility (i.e.while mobile)
Anotherperson's home
Commercialinternet accessfacility (not free
of charge)
Place ofeducation
Communityinternet accessfacility (free of
charge)
Other locations(where used)
2011 2014 2015
Base: All Respondents who used internet in last 3 months (n=1118)
Place of internet access

Co
pyr
igh
t ©
2015
Th
e N
iels
en C
om
pan
y. C
on
fid
enti
al a
nd
pro
pri
etar
y.
53
INTERNET RELATED ACTIVITIES (1/2)- Overall, proportion of respondents engaged with internet related activities has grown since 2014,
especially VOIP which increased from 14% in 2011 to 44% in 2015, purchasing or ordering goods/services which increased from 12% in 2011 to 35% in 2015.
- Social networking and sending and receiving emails are still the most common internet activities in 2015.
[Q65] For which of the following activities did you use the internet for private purposes (from any location) in the last three months?
Base: All Respondents who used internet in last 3 months (n=1118)
70%
69%
27%
35%
14%
26%
12%
37%
34%
28%
12%
15%
68%
53%
38%
46%
39%
27%
23%
30%
25%
40%
18%
23%
1%
74%
58%
50%
45%
44%
35%
35%
32%
32%
30%
28%
25%
20%
Social networking sites
Sending or receiving e-mail
Posting information or instant messaging
Downloading movies, images, music, watching TV or video, or listening toradio or music
Telephoning over the Internet/VoIP
Playing or downloading video games or computer games
Purchasing or ordering goods or services
Reading or downloading on-line newspapers or magazines electronic books
Education or learning activities
Downloading software
Internet banking
Interacting with general government Organizations
Watching Web television
2011
2014
2015

Co
pyr
igh
t ©
2015
Th
e N
iels
en C
om
pan
y. C
on
fid
enti
al a
nd
pro
pri
etar
y.
54
INTERNET CONNECTION TYPES - Mobile broadband is by far the most common connection type used by the respondents to access the
internet in 2015. 85% of respondents with internet access at home they have mobile broadband in 2015. 10% of respondents who use mobile broadband via handset has 2 or more connections.
[Q58a] What are all the types of internet access you or your family members used? Please let me know all the methods used to access internet at home [Q59b] How many of these connections do you have at home?
Base: All having the Internet connection at household (n=1061)
98% 96%89%
98%
2% 4%10%
2%
Fixed wiredbroadband (e.g.DSL and Fibre)
(n=256)
Fixed wirelessbroadband (e.g.
Wimax)(n=223)
Mobilebroadbandnetwork via
handsets (dataadded to voice)
(n=672)
Mobilebroadband
network via card,USB or router
(n=559)
1 Connection 2 Connection or more
Connection Types No. of Lines
27% 29% 31%
97%
27%
15%
90%
24% 21%
Mobile broadband DSL Wimax
2011 2014 2015

Co
pyr
igh
t ©
2015
Th
e N
iels
en C
om
pan
y. C
on
fid
enti
al a
nd
pro
pri
etar
y.
55
SWITCHING TO MOBILE BROADBAND (1/2)- 21% of respondents have replaced their fixed broadband service with mobile broadband service in 2015. - 68% of 2015 survey respondents primarily use mobile internet at home when fixed internet is also available
[Q73] Have you ever replaced your fixed broadband service with a mobile broadband service?
[Q68] Percentage of time spent online using mobile internet/fixed internet at home
Ever replaced Fixed broadband
with mobile broadband service
Base: All those who have switched service 2015 (n=109)
7%
4%
21%
93%
96%
79%
2011
2014
2015
No Yes
80%
43%
20%32%
20%
56%
80%68%
2007 2011 2014 2015
MobileInternet
FixedInternet
Internet Usage at home
Base: All those who have access of internet at home 2015 (n=1062), 2014 (n= 958)
Co
pyr
igh
t ©
2015
Th
e N
iels
en C
om
pan
y. C
on
fid
enti
al a
nd
pro
pri
etar
y.
56
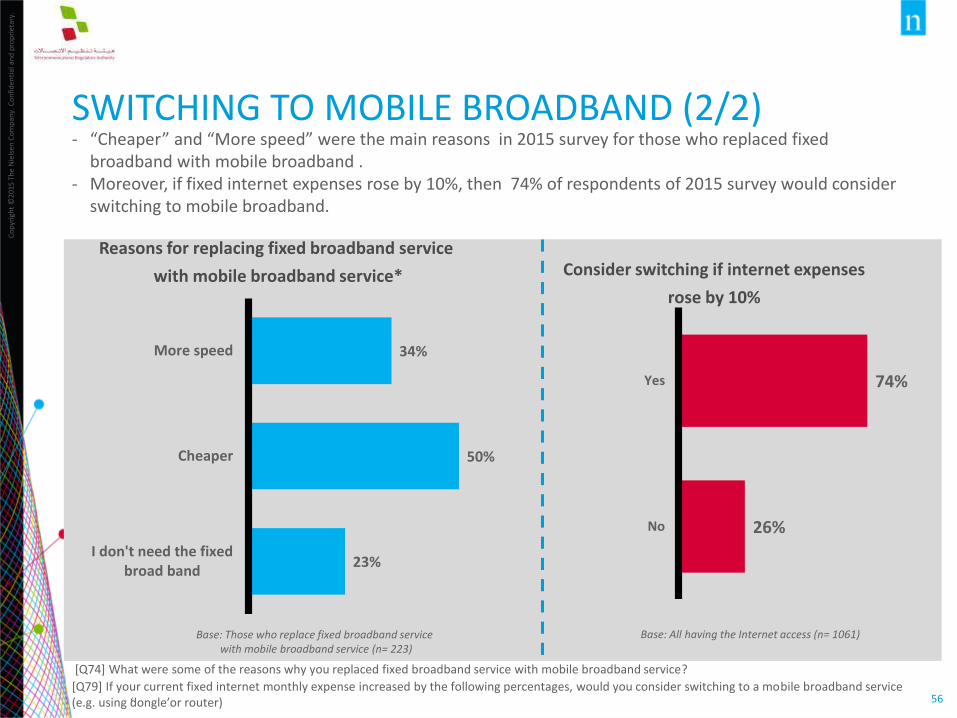
SWITCHING TO MOBILE BROADBAND (2/2) - “Cheaper” and “More speed” were the main reasons in 2015 survey for those who replaced fixed
broadband with mobile broadband .- Moreover, if fixed internet expenses rose by 10%, then 74% of respondents of 2015 survey would consider
switching to mobile broadband.
[Q74] What were some of the reasons why you replaced fixed broadband service with mobile broadband service?
[Q79] If your current fixed internet monthly expense increased by the following percentages, would you consider switching to a mobile broadband service (e.g. using ‘dongle’or router)
74%
26%
Yes
No
Consider switching if internet expenses
rose by 10%
Base: All having the Internet access (n= 1061)
Reasons for replacing fixed broadband service
with mobile broadband service*
34%
50%
23%
More speed
Cheaper
I don't need the fixedbroad band
Base: Those who replace fixed broadband servicewith mobile broadband service (n= 223)

Co
pyr
igh
t ©
2015
Th
e N
iels
en C
om
pan
y. C
on
fid
enti
al a
nd
pro
pri
etar
y.
57
IMPORTANT FACTORS FOR PURCHASING INTERNET SERVICE - Speed (95%) and price are the most important factors for respondents in 2015 survey when purchasing an
internet service
[Q61] What factors are most important to you when purchasing an internet service?
96%
92%
95%
95%
87%
89%
84%
85%
82%
81%
80%
74%
3%
6%
4%
4%
11%
9%
13%
13%
16%
15%
15%
20%
1%
2%
1%
1%
1%
2%
2%
2%
2%
4%
3%
6%
2014
2015
2014
2015
2014
2015
2014
2015
2014
2015
2014
2015
Pri
ceSp
eed
Dat
aA
llow
ance
Rel
iab
ility
Mo
bili
tyEa
se o
fin
stal
lati
on
Important/Extremely Important Neither Important not unimportant Not Important/Not at all ImportantBase: All having the Internet access (n= 1061)

Co
pyr
igh
t ©
2015
Th
e N
iels
en C
om
pan
y. C
on
fid
enti
al a
nd
pro
pri
etar
y.
58
INTERNET SPEEDS- Respondents experienced significant rise in the internet speed with 77% of responds in 2015 have
internet speed of 2 Mbps and above compared with 54% in 2014.
[Q59] What is the advertised speed/s of the below type of internet connection you subscribe to at home?
2007 2011 2014 2015
All respondents who access to internet
374 686 958 1061
1 Mbps or less 89% 19% 16% 23%
2Mbps to 5 Mbps 2% 61% 23% 49%
6 Mbps to 10 Mbps - 4% 18% 29%
More than 10Mbps - - 13% 18%
Don’t know 3% 16% 29% 3%
No Response 6%
Internet Speeds for connection at home
Co
pyr
igh
t ©
2015
Th
e N
iels
en C
om
pan
y. C
on
fid
enti
al a
nd
pro
pri
etar
y.
59
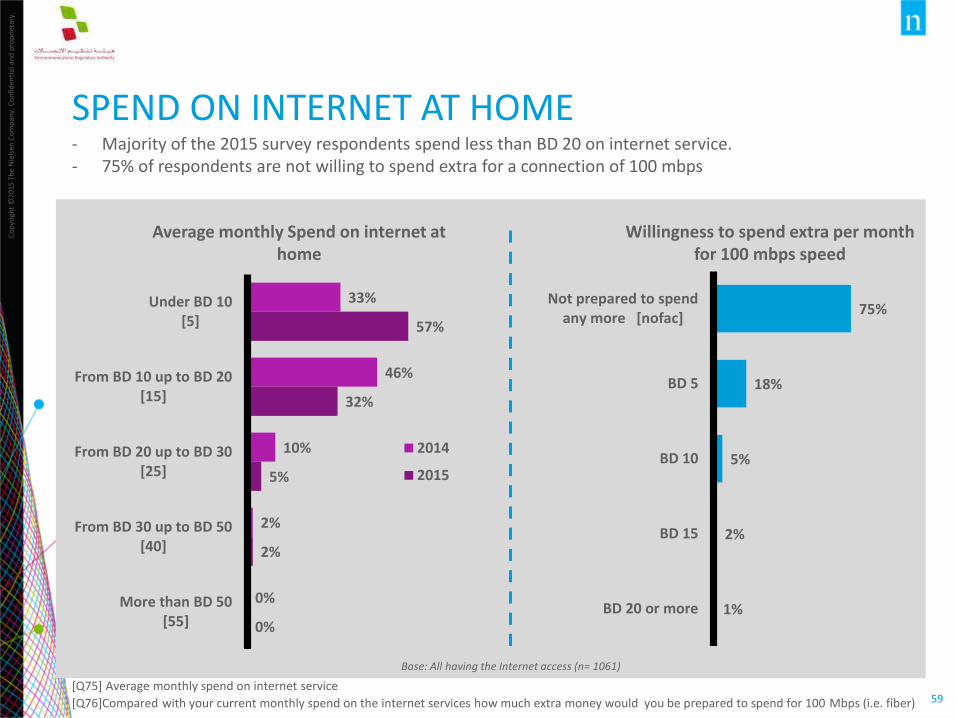
SPEND ON INTERNET AT HOME- Majority of the 2015 survey respondents spend less than BD 20 on internet service.- 75% of respondents are not willing to spend extra for a connection of 100 mbps
[Q75] Average monthly spend on internet service
[Q76]Compared with your current monthly spend on the internet services how much extra money would you be prepared to spend for 100 Mbps (i.e. fiber)
75%
18%
5%
2%
1%
Not prepared to spendany more [nofac]
BD 5
BD 10
BD 15
BD 20 or more
Base: All having the Internet access (n= 1061)
Willingness to spend extra per month for 100 mbps speed
Average monthly Spend on internet at home
33%
46%
10%
2%
0%
57%
32%
5%
2%
0%
Under BD 10[5]
From BD 10 up to BD 20[15]
From BD 20 up to BD 30[25]
From BD 30 up to BD 50[40]
More than BD 50[55]
2014
2015

Co
pyr
igh
t ©
2015
Th
e N
iels
en C
om
pan
y. C
on
fid
enti
al a
nd
pro
pri
etar
y.
60
SWITCHING INTERNET SERVICE PROVIDERS - 10% of respondents in 2015 survey have switched their service provider. - The main reasons for switching were “Price” (53%) followed by "Service Quality” (39%)
[Q69] Switched between internet service provider
10%
90%
Yes No
2014 Yes – 7%
Ever switched Internet
Service Provider (2015)
Reasons for Switching
Base: All having the Internet access (n= 1061)
Base: All who have switched (n= 109)
53%
39%
18%
5%
18%
5%
46%
52%
20%
15%
13%
Price
Service Quality
Reliability
Customer Service
Range of Servicesoffered
Other reasons
2015
2014

Co
pyr
igh
t ©
2015
Th
e N
iels
en C
om
pan
y. C
on
fid
enti
al a
nd
pro
pri
etar
y.
61
SATISFACTION WITH INTERNET SERVICE- Overall satisfaction with internet service is high in 2015 survey.
[Q81] Satisfaction towards internet service provider
[Q82] Suggestions to improve internet service provider
Satisfaction with Internet Service
Base: All having the Internet access (n= 1061)
6% 6%
92% 92%
2014 2015
Very/FairlySatisfied
Neithersatisfiednordissatisfied
Not at allsatisfied
Reliability of the internet service
Response of your service provider while dealing with
problems
Overall value for money of the internet service
3% 3%17% 17%
81% 79%
2014 2015
3% 2%11% 10%
87% 88%
2014 2015
3% 3%10% 13%
87% 84%
2014 2015
Very/Fairly Satisfied
Neither satisfied nordissatisfied
Not at all satisfied
Overall quality of internet service

Co
pyr
igh
t ©
2015
Th
e N
iels
en C
om
pan
y. C
on
fid
enti
al a
nd
pro
pri
etar
y.
62
SUGGESTIONS FOR IMPROVEMENT- The main suggestions for improvement provided by respondents in 2015 is reduction in charges (63%)
and quality of internet services (61%)
[Q81] Satisfaction towards internet service provider
[Q82] Suggestions to improve internet service provider
64%
61%
30%
63%
61%
36%
Reduce charges
Improve the quality of internet services
Improve the quality of customer service when there isproblem with the service
2014 2015
Suggestions for Improvements
Base: All having the Internet access (n= 1061)

Co
pyr
igh
t ©
2015
Th
e N
iels
en C
om
pan
y. C
on
fid
enti
al a
nd
pro
pri
etar
y.
63
EXCEEDING DOWNLOAD LIMIT - 47% of respondents who use the internet exceeded their monthly download limit in 2015 compared with
only 18% in 2014.- 87% of them accepted a slower service at no additional charge whereas only 13% of them paid a fee for
additional usage.
[Q77] For the internet package, have you ever exceeded your monthly downloaded limit
[Q78] Behavior after exceeded monthly download limit
Monthly Download Exceed Limit
18%
73%
9%
47% 45%
8%
Yes No DK
2014
2015
Base: All having the Internet access (n=1061)
Behavior after Exceeded Limit
59%
43%
87%
13%
Accept a slowerservice at no
additional charge
Pay a fee foradditional usage
Chart Title
2014
2015
Base: All who exceed their monthly downloaded limit (n=496)
Fixed Line Mobile Phone Service International Calls Internet Service
OTT Application Usage
TELECOM SERVICES

Co
pyr
igh
t ©
2015
Th
e N
iels
en C
om
pan
y. C
on
fid
enti
al a
nd
pro
pri
etar
y.
65
SUMMARY: OTT APPLICATION USAGE
95% of respondents in 2015 survey use “Whatsapp” application to communicate with their family and friends
With the absence of Instant messaging services, 74% of respondents stated that they would have made a phone call instead

Co
pyr
igh
t ©
2015
Th
e N
iels
en C
om
pan
y. C
on
fid
enti
al a
nd
pro
pri
etar
y.
66
OTT APP USAGE- 95% of 2015 survey respondents use WhatsApp to communicate with their family/relatives- 93% of respondents prefer using OTT App to send messages instead of SMS
[Q 83] Which of these means of communication do you use to communicate with friends and family at least once a day?
[Q 84] What proportion of your messaging do you do via
1%
1%
2%
3%
13%
26%
39%
95%
other socialnetwork
IMO
Direct calls
iMessages
Skype
Viber
Apps used to communicate with family/relatives at least once a day
SMS7%
OTT App93%
Preference to SMS/OTT App for messaging
Base: All having the Internet access (n=1061)

Co
pyr
igh
t ©
2015
Th
e N
iels
en C
om
pan
y. C
on
fid
enti
al a
nd
pro
pri
etar
y.
67
OTT APP USAGE – ALTERNATIVE TO OTT- 74%of the respondents stated that they would have made a phone call in case no IM service was available
the last time they used it. Almost same proportion of respondents (76%) indicated that they would have used their mobile phone to make a call in case no OTT app was available the last time they used it.
[Q85] Consider the last time you used an IM service to communicate, in the absence of that service what would you have done?
[Q86] Consider the last time you used an OTT app to make a call, in the absence of that service what would you have done?
6%
10%
16%
74%
Not sent themessage
Used SMS
Phone Call
Preference in case of absence of instant messaging service
Base: All having the Internet access (n=1061)
4%
7%
10%
11%
76%
Not madethe call
Phone callusing fixed
line
Used SMS
Phone callusing
mobile
Preference in case of absence of OTT app to make a call

APPENDIX
Co
pyr
igh
t ©
2015
Th
e N
iels
en C
om
pan
y. C
on
fid
enti
al a
nd
pro
pri
etar
y.
69
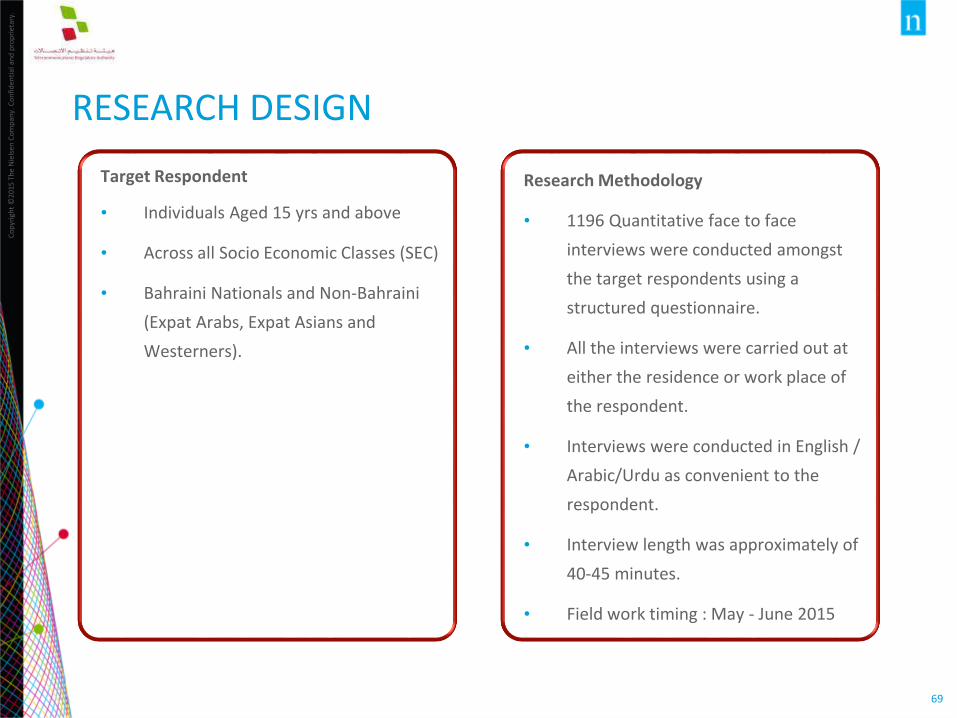
RESEARCH DESIGN
Target Respondent
• Individuals Aged 15 yrs and above
• Across all Socio Economic Classes (SEC)
• Bahraini Nationals and Non-Bahraini
(Expat Arabs, Expat Asians and
Westerners).
Research Methodology
• 1196 Quantitative face to face
interviews were conducted amongst
the target respondents using a
structured questionnaire.
• All the interviews were carried out at
either the residence or work place of
the respondent.
• Interviews were conducted in English /
Arabic/Urdu as convenient to the
respondent.
• Interview length was approximately of
40-45 minutes.
• Field work timing : May - June 2015
Co
pyr
igh
t ©
2015
Th
e N
iels
en C
om
pan
y. C
on
fid
enti
al a
nd
pro
pri
etar
y.
70
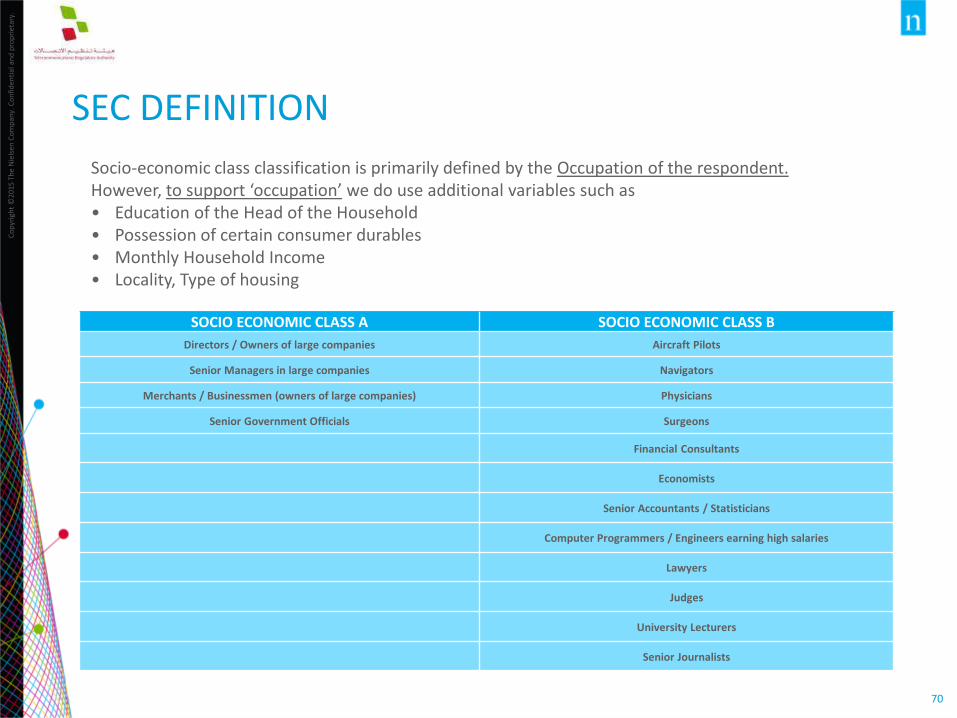
SEC DEFINITION
Socio-economic class classification is primarily defined by the Occupation of the respondent.However, to support ‘occupation’ we do use additional variables such as • Education of the Head of the Household• Possession of certain consumer durables • Monthly Household Income• Locality, Type of housing
SOCIO ECONOMIC CLASS A SOCIO ECONOMIC CLASS B
Directors / Owners of large companies Aircraft Pilots
Senior Managers in large companies Navigators
Merchants / Businessmen (owners of large companies) Physicians
Senior Government Officials Surgeons
Financial Consultants
Economists
Senior Accountants / Statisticians
Computer Programmers / Engineers earning high salaries
Lawyers
Judges
University Lecturers
Senior Journalists

Co
pyr
igh
t ©
2015
Th
e N
iels
en C
om
pan
y. C
on
fid
enti
al a
nd
pro
pri
etar
y.
71
SEC DEFINITIONSOCIO ECONOMIC CLASS C1 SOCIO ECONOMIC CLASS C2
TeachersEmployees in private offices/insurance companies (typist, clerks, book-keepers, accountants, telephone operators)
Technicians of Lower Grade Bank Employees, Cashiers
Junior Scientists of Lower Grade Lower-grade Civil Servants
Surveyors of Lower Grade Non-commissioned Officers
Aircraft Mechanics of Lower Grade Supervisors or salespeople or other employees/ raveling sales representatives
Legislative Assistants of Lower GradeTechnicians or technical assistants – not requiring higher education (nurses, medical assistants, draftsmen, electronically or mechanical assistants
Commercial Artists of Lower Grade Artisans self employed (carpenters, electricians, mechanics, plumbers)
Designers of Lower Grade Tailors self-employed
Bank Managers of Medium Enterprises (employing 5-10 people) Owners of groceries/kiosks/shopkeepers
Travel Agency Managers of Medium Enterprises (employing 5-10 people)
Owners of very small companies/merchants
Small Factory Managers of Medium Enterprises (employing 5-10 people) Other persons of equivalent incomes as above
Assistant Managers of large enterprises (employing more than 10 people)
Engineers / Accountants with low salaries
Others
Co
pyr
igh
t ©
2015
Th
e N
iels
en C
om
pan
y. C
on
fid
enti
al a
nd
pro
pri
etar
y.
72
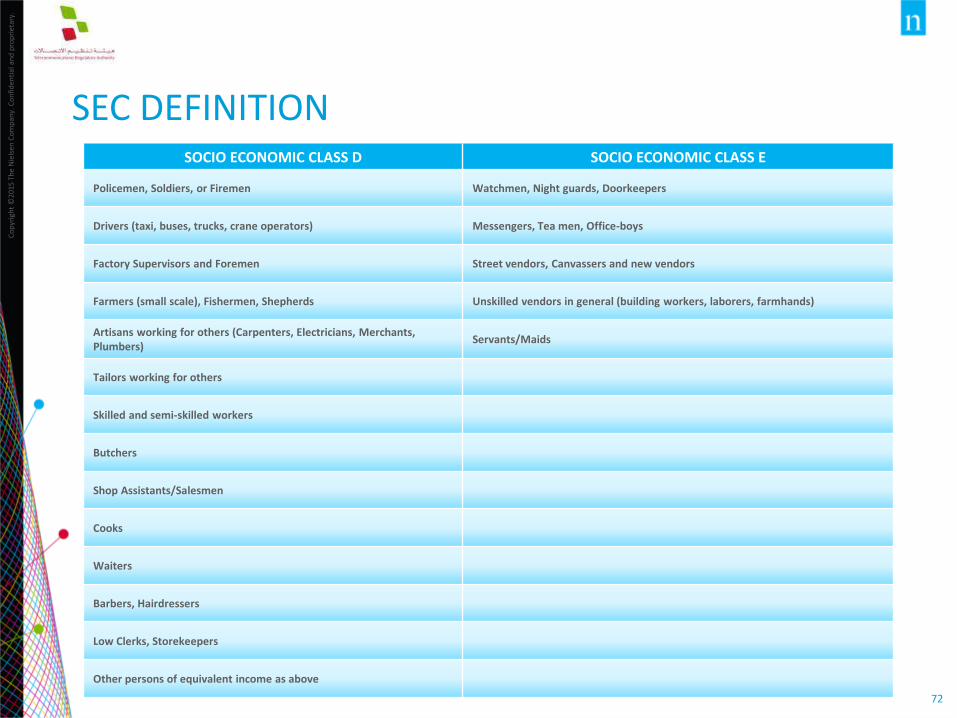
SEC DEFINITIONSOCIO ECONOMIC CLASS D SOCIO ECONOMIC CLASS E
Policemen, Soldiers, or Firemen Watchmen, Night guards, Doorkeepers
Drivers (taxi, buses, trucks, crane operators) Messengers, Tea men, Office-boys
Factory Supervisors and Foremen Street vendors, Canvassers and new vendors
Farmers (small scale), Fishermen, Shepherds Unskilled vendors in general (building workers, laborers, farmhands)
Artisans working for others (Carpenters, Electricians, Merchants, Plumbers)
Servants/Maids
Tailors working for others
Skilled and semi-skilled workers
Butchers
Shop Assistants/Salesmen
Cooks
Waiters
Barbers, Hairdressers
Low Clerks, Storekeepers
Other persons of equivalent income as above