2015 schooling in america survey
TRANSCRIPT

1 | www.edchoice.org
2015 SCHOOLING IN AMERICA SURVEY
Perspectives on School Choice, Common Core, and Standardized Testing
Polling Paper No. 24
June 30, 2015
With questions on the direction of K–12 education,
education spending, grades and preferences for
different types of schools, standardized testing,
Common Core, and a variety of school choice reforms
Paul DiPerna
Research Director
www.edchoice.org

2 | www.edchoice.org
Survey Project & Profile Title: 2015 Schooling in America Survey
Survey Sponsor
& Developer: Friedman Foundation for Educational Choice
Survey Data Collection
& Quality Control: Braun Research, Inc.
Interview Dates: April 22 to May 12, 2015
Interview Method: Live Telephone | 60% landline and 40% cell phone
Interview Length: 17.5 minutes (average)
Language(s): English, with Spanish option
Sample Frame
& Method: Dual Frame; Probability Sampling; Random Digit Dial (RDD)
Population Sample: National sample of adults (age 18+) living in the 50 U.S. States
and District of Columbia
Sample Size: National/General Public, N = 1,002
Margins of Error: National/General Public = ± 3.1 percentage points
Response Rates (RR)
using AAPOR RR3: Landline = 13.5%; Cell Phone = 13.5%
Weighting? Yes (Landline/Cell for National, then Age, Gender, Race, Ethnicity, Census Division/Region)
Oversampling? Yes (Latinos)*
Total Latinos, N = 532
(n=125 from National sample; n=407 from additional oversample)
* Latino and other race/ethnic results to be released at a later date.
The survey’s sponsor and sole funder was the Friedman Foundation for Educational Choice. For more information, contact: Paul DiPerna at [email protected]
The author is responsible for overall polling design; question wording and ordering; this paper’s analysis, charts, and writing; and any unintentional errors or misrepresentations.

3 | www.edchoice.org
June 30, 2015
TABLE OF CONTENTS
Page
4 National K–12 Profile and Context
7 Overview
10 Survey Findings and Snapshots
11 Issue Priority
13 Direction of K–12 Education
17 Federal Government Performance
20 Education Spending
23 Grades, Preferences for Types of Schools
33 Charter schools
39 School Vouchers
47 Education Savings Accounts (ESAs)
53 Tax-Credit Scholarships
58 Standardized Testing
62 Accountability and State Intervention
65 Common Core
70 Political Signals
76 Methods
77 Sample Design
78 Contact Procedures
79 Call Dispositions and Response Rates
80 Weighting Procedures and Analysis
82 About Us, Acknowledgements
86 Survey Questions and Topline Results

4 | www.edchoice.org
National K–12 Profile and Context
Trend NAEP Reading Avg Scores: 1971 | 1999 | 2012 1 249 | 253 | 257
Trend NAEP Math Avg Scores: 1973 | 1999 | 2012 1 263 | 272 | 278
Main NAEP Reading Avg Scores: 1992 | 2002 | 2013 2 256 | 257 | 259
Main NAEP Math Avg Scores: 1990 | 2000 | 2013 2 238 | 250 | 264
PISA Reading Avg Score (vs. OECD Avg) 3 498 (vs. 496)
PISA Math Avg Score (vs. OECD Avg) 3 481 (vs. 494)
PISA Science Avg Score (vs. OECD Avg) 3 497 (vs. 501)
Public High School Graduation Rate 4 81%
# Public School Students (sans Charter School Students) 6 47,206,216
# Public Charter School Students 7 2,267,814
# Private School Students 8 5,268,090
# Home School Students 9 1,567,732
% Public School Students (sans Charter School Students) 10 83.8%
% Public Charter School Students 10 4.0%
% Private School Students 10 9.4%
% Home School Students 10 2.8%
# Public School Districts 11 13,567
# Public Schools (sans Charter Schools) 12 92,375
# Public Charter Schools 12 6,079
# Private Schools 13 30,861
% Free and Reduced-Price Lunch 14 49.9%
% Individualized Education Program (IEP) 14 12.9%
% English Language Learners (ELL) 14 8.6%
$ Revenue Per Student 15 $12,152
$ “Total” Per Student Spending 15 $12,178
$ “Current” Per Student Spending 15 $10,667
$ “Instructional” Per Student Spending 15 $6,495

5 | www.edchoice.org
National Profile Notes
1. U.S. Department of Education, Institute of Education Sciences, National Center for Education
Statistics, National Assessment of Educational Progress (NAEP), Long-term Trend Assessment. Cross-
section averages of average reading scale scores of nine year olds, 13 year olds, and 17 year olds. Cross-
section averages of average mathematics scale scores of nine year olds, 13 year olds, and 17 year olds.
URLs: nces.ed.gov/programs/coe/indicator_cnj.asp
2. U.S. Department of Education, Institute of Education Sciences, National Center for Education
Statistics, National Assessment of Educational Progress (NAEP). Cross-section averages of
average reading scale scores of fourth, eighth-, and 12th-grade students. Cross-section averages
of average mathematics scale scores of fourth- and eighth-grade students.
URLs: nces.ed.gov/programs/coe/indicator_cnb.asp; nces.ed.gov/programs/coe/indicator_cnc.asp
3. U.S. Department of Education, Institute of Education Sciences, National Center for Education
Statistics, Condition of Education Statistics. Average scores of 15-year-old students on the Program for
International Student Assessment (PISA) literacy scales for reading, mathematics, and science.
URL: nces.ed.gov/programs/coe/indicator_cnk.asp
4. U.S. Department of Education, Institute of Education Sciences, National Center for Education
Statistics, Condition of Education Statistics. Average scores of 15-year-old students on the Program for
International Student Assessment (PISA) literacy scales for reading, mathematics, and science.
URL: nces.ed.gov/programs/coe/indicator_cnk.asp
5. U.S. Department of Education, Institute of Education Sciences, National Center for Education
Statistics, Condition of Education Statistics. Reported public high school graduation rates,
determined by the Averaged Freshman Graduation Rate (AFGR). Data for 2011–12 school year.
URL: nces.ed.gov/programs/coe/indicator_coi.asp
6. U.S. Department of Education, Institute of Education Sciences, National Center for Education Statistics,
Digest of Education Statistics. Total enrollment in public schools – students in pre-kindergarten through
12th grade – excluding public charter school students. Data for 2012–13 school year.
URL: nces.ed.gov/programs/digest/d14/tables/dt14_216.20.asp
7. U.S. Department of Education, Institute of Education Sciences, National Center for Education
Statistics, Digest of Education Statistics. Total enrollment in public charter schools – students in Pre-
kindergarten through 12th grade. Data for 2012–13 school year.
URL: nces.ed.gov/programs/digest/d14/tables/dt14_216.90.asp
8. U.S. Department of Education, Institute of Education Sciences, National Center for Education
Statistics, Digest of Education Statistics. Total enrollment in private schools—students in pre-
kindergarten through 12th grade. Data for 2011–12 school year.
URL: nces.ed.gov/programs/digest/d13/tables/dt13_205.20.asp
9. National- and state-level estimates reported by Ann Zeise for 2013–14 school year, accessed June 18,
2015: a2zhomeschooling.com/thoughts_opinions_home_school/numbers_homeschooled_students
10. Percentages are meant for general impressions only. Due to rounding, percentage totals may be
slightly greater or less than 100 percent.

6 | www.edchoice.org
11. U.S. Department of Education, Institute of Education Sciences, National Center for Education Statistics,
Digest of Education Statistics. Reporting total public school districts. Data for 2011–12 school year.
URL: nces.ed.gov/programs/digest/d13/tables/dt13_214.10.asp
12. U.S. Department of Education, Institute of Education Sciences, National Center for Education Statistics,
Digest of Education Statistics. Reporting total public schools (sans charter schools) and total public
charter schools. Data for 2012–13 school year.
URL: nces.ed.gov/programs/digest/d14/tables/dt14_216.30.asp
13. U.S. Department of Education, Institute of Education Sciences, National Center for Education Statistics,
Private School Universe Survey (PSS). Reporting total private schools. Data for 2011–12 school year.
URL: nces.ed.gov/surveys/pss/tables/table_2011_15.asp
14. U.S. Department of Education, Institute of Education Sciences, National Center for Education
Statistics, Common Core of Data (CCD), using the ElSi tableGenerator, based on data obtained
via "Local Education Agency (School District) Universe Survey", 2012–13 v.1a; "Public
Elementary/Secondary School Universe Survey", 2012–13 v.1a; "State Nonfiscal Public
Elementary/Secondary Education Survey", 2012–13 v.1a.
URL: nces.ed.gov/ccd/elsi/tableGenerator.aspx
15. Stephen Q. Cornman, Revenues and Expenditures for Public Elementary and Secondary Education: School Year
2011–12 (Fiscal Year 2012) (NCES 2014-30). U.S. Department of Education. Washington, D.C.: National
Center for Education Statistics (January 2015).
URL: nces.ed.gov/pubs2014/2014301.pdf
7 | www.edchoice.org
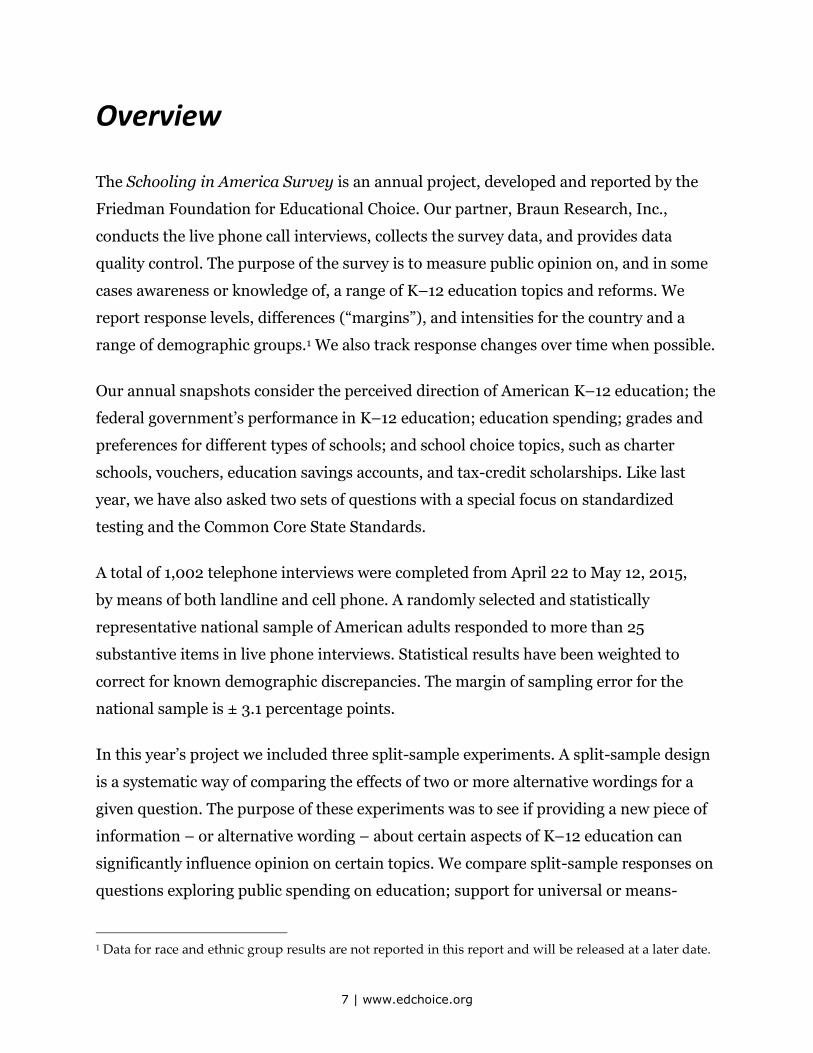
Overview
The Schooling in America Survey is an annual project, developed and reported by the
Friedman Foundation for Educational Choice. Our partner, Braun Research, Inc.,
conducts the live phone call interviews, collects the survey data, and provides data
quality control. The purpose of the survey is to measure public opinion on, and in some
cases awareness or knowledge of, a range of K–12 education topics and reforms. We
report response levels, differences (“margins”), and intensities for the country and a
range of demographic groups.1 We also track response changes over time when possible.
Our annual snapshots consider the perceived direction of American K–12 education; the
federal government’s performance in K–12 education; education spending; grades and
preferences for different types of schools; and school choice topics, such as charter
schools, vouchers, education savings accounts, and tax-credit scholarships. Like last
year, we have also asked two sets of questions with a special focus on standardized
testing and the Common Core State Standards.
A total of 1,002 telephone interviews were completed from April 22 to May 12, 2015,
by means of both landline and cell phone. A randomly selected and statistically
representative national sample of American adults responded to more than 25
substantive items in live phone interviews. Statistical results have been weighted to
correct for known demographic discrepancies. The margin of sampling error for the
national sample is ± 3.1 percentage points.
In this year’s project we included three split-sample experiments. A split-sample design
is a systematic way of comparing the effects of two or more alternative wordings for a
given question. The purpose of these experiments was to see if providing a new piece of
information – or alternative wording – about certain aspects of K–12 education can
significantly influence opinion on certain topics. We compare split-sample responses on
questions exploring public spending on education; support for universal or means-
1 Data for race and ethnic group results are not reported in this report and will be released at a later date.

8 | www.edchoice.org
tested school choice programs; and the importance of special interest endorsements.
Those comparisons tend to be salient considerations in state politics and reflect
undercurrents in education policy discussions.
Ground Rules and Organization
Before discussing the survey results, some brief ground rules for reporting national
sample and demographic subgroup responses in this paper. For each survey topic
(noted with a header at the top of the page), there is a sequence for reporting various
analytical frames. First, we note the raw responses levels for the national sample on a
given question. Following that initial observation, we consider the national sample’s
margin, hard/strong response levels, and the net intensity computed from the latter.
Recent trends are displayed in charts.
If we detect statistical significance on a given item, then we briefly report demographic
results and differences.2 Explicit subgroup comparisons/differences are statistically
significant with 95 percent confidence, unless otherwise clarified in the narrative.
Finally, we orient any listing of subgroups’ margins and intensities around “most/least
likely” to respond one way or the other, typically emphasizing the propensity to be
more/less positive. Lists of subgroups with respect to margins and intensities are
meant to be suggestive for further exploration and research beyond this project.
The organization of this paper has three sections. The first section describes key findings
and presents charts for additional context. The second section details the survey’s
methodology, summarizes response statistics, and provides additional technical
2 For terminology: We use the label “school parents” to refer to those respondents who said they have one or
more children in preschool through high school. We use the label “non-schoolers” for respondents without
children, or who may have children that are not in the PK-12 grade range. For terms regarding age groups:
“young adults” reflect respondents who are age 18 to 34; “middle-age adults” are 35 to 54; and “senior adults” or
“seniors” are 55 and older. In some instances we combine self-identified partisans (Democrats or Republicans)
with those who do not initially affiliate with one political party or the other, but in a follow-up question say they
do “lean” toward Democrats or Republicans are termed “Leaners.” The partisan labels that include Leaners are
“Democrats/Leaners” and “Republicans/Leaners.” Labels pertaining to income groups go as follows: “low-
income earners” < $40,000; “middle-income earners” ≥ $40,000 and < $80,000; “high-income earners” ≥ $80,000.

9 | www.edchoice.org
information on call dispositions for landline and cell phone interviews and weighting.
The third section lists the survey questions and results, allowing the reader to follow the
survey interview as it was conducted, with respect to item wording and ordering.

10 | www.edchoice.org
SECTION I Survey Findings
& Snapshots

11 | www.edchoice.org
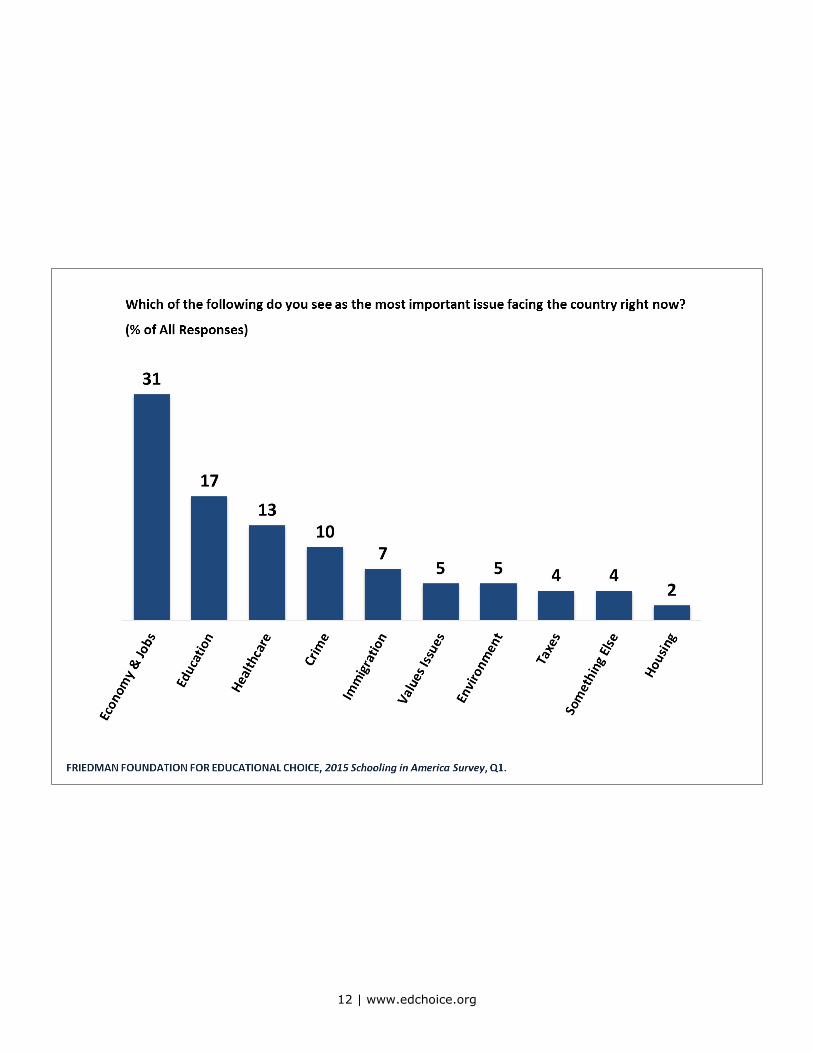
Issue Priority
Nearly one out of five respondents (17%) said “education” was the most
important issue facing the country right now, trailing only “economy and
jobs” (31%) as a first priority.
What else is important? Nearly 13% of respondents indicated “healthcare” as a
critical issue for the United States.
Independents (40%) are more likely to be concerned about the economy and
jobs, compared with Democrats (30%) and Republicans (29%).3
Certain demographic subgroups significantly differ from one another when saying
education is a top priority:
Urbanites (23%) are more likely to say education is a priority than people
living in small town (13%) and rural (12%) communities.
A higher proportion of Democrats (20%) are focused on education than
Republicans (14%) and Independents (12%).
More young adults (24%) put education at the top of their agenda for the
country, compared with middle-age adults (15%) and seniors (13%).
Middle-income earners (23%) are more likely to indicate education is a top
priority for the country than low-income earners (14%).
3 We are at least 95 percent confident of any noted significant differences comparing subgroups to the
national average or between two or more subgroups. Please consider that each subgroup has a unique
margin of error based on its adult population size in the United States and the unweighted sample size
obtained in this survey. We advise strong caution when interpreting results for subgroups with relatively
small sample sizes (for example, n ≤ 100). When I refer to subgroup sample sizes – for example in
forthcoming tables – those numbers represent the unweighted number of interviews.
12 | www.edchoice.org

13 | www.edchoice.org
Direction of K–12 Education
Americans are much more likely to think K–12 education has gotten off on
the “wrong track” (60%), compared with about one-third of adults (32%)
who say it is heading in the “right direction.” That is nearly identical to last
year’s results (58% wrong track vs. 33% right direction).
We observe negative attitudes about the direction of K–12 education across most
demographics. Most subgroup margins are greater than -20 percentage points. However,
some key differences stand out when making comparisons within certain demographic
categories, or comparing a subgroup to the national average:
Two subgroups are significantly more likely to say “right direction” than the
national average: Urbanites (40%) and Democrats/Leaners (38%).
Two subgroups are significantly more likely to say “wrong track” than the
national average: seniors (69%) and Republicans/Leaners (69%).
Urbanites (40%) are more likely to say “right direction” than counterparts in
small town (27%) and rural (26%) areas.
Democrats (38%) are significantly more positive than Independents (27%).
Democrats/Leaners (38%) are more positive than Republicans/Leaners (25%).
Young adults (38%) and middle-age adults (36%) are more likely to be
positive than seniors (22%).
All subgroup margins are negative. The largest are among: seniors (-47 points),
Republicans/Leaners (-44), Republicans (-41 points), rural residents (-41 points), and
small town residents (-39 points).

14 | www.edchoice.org
Right Direction Wrong Track Margin
% % N=
TOTAL 32 60 - 28 1,002
School Parent 39 56 - 17 234
Non-Schooler 29 62 - 33 763
COMMUNITY
Urban 40 52 - 12 211
Suburban 31 60 - 29 378
Small Town 27 66 - 39 248
Rural 26 67 - 41 149
PARTY ID
Democrat 38 54 - 16 353
Republican 27 68 - 41 270
Independent 27 63 - 36 245
Democrat/Lean 38 53 - 15 462
Republican/Lean 25 69 - 44 400
AGE GROUP
18 to 34 38 54 - 16 210
35 to 54 36 58 - 22 316
55 & Over 22 69 - 47 432
HOUSEHOLD INCOME
Under $40,000 31 61 - 30 297
$40,000 to $79,999 30 62 - 32 301
$80,000 & Over 29 63 - 34 276
Q5. In the United States, do you feel things in K-12 education are generally
going in the right direction, or do you feel things have generally gotten off
on the wrong track?
NOTE: Please consider that each subgroup has a unique margin of error based on its adult population size in the
United States and the sample size (N) obtained in this survey. We advise strong caution when interpreting
results for subgroups with small sample sizes. The subgroup sample sizes displayed in the far right column
represent the unweighted number of interviews. All other statistical results reported in this table and report
reflect weighted data, a standard procedure to correct for known demographic discrepancies.
SOURCE: Friedman Foundation for Educational Choice, 2015 Schooling in America Survey, Q5.

15 | www.edchoice.org

16 | www.edchoice.org

17 | www.edchoice.org
Federal Government Performance
The country is decidedly pessimistic about federal involvement in K–12
education. Nearly three-quarters of Americans have a dim view of the
federal government’s performance in K–12 education (77% say “fair” or
“poor”). Only 20 percent of respondents said “good” or “excellent.”
That prevailing negative attitude cuts across all demographics. Subgroup margins are
overwhelmingly negative—all but three wider than -50 percentage points. The largest
margins are among Republicans/Leaners (-71 points) and Independents (-69 points).
Intensities are also negative across the board. The largest are among Republicans/Leaners
(-50 points), Republicans (-48 points), and rural residents (-44 points).
Not surprisingly, views about the federal government’s involvement significantly differ
along partisan lines: Democrats (25%) are significantly more likely to give positive
ratings than Republicans (15%) and Independents (14%). Likewise, Democrats/Leaners
(26%) are more positive than Republicans/Leaners (12%).

18 | www.edchoice.org
Good/Excellent Fair/Poor Margin Intensity
% % N=
TOTAL 20 77 - 57 - 35 1,002
School Parent 22 75 - 53 - 30 234
Non-Schooler 19 77 - 58 - 37 763
COMMUNITY
Urban 26 71 - 45 - 28 211
Suburban 18 78 - 60 - 35 378
Small Town 17 79 - 62 - 37 248
Rural 17 77 - 60 - 44 149
PARTY ID
Democrat 25 73 - 48 - 23 353
Republican 15 79 - 64 - 48 270
Independent 14 83 - 69 - 40 245
Democrat/Lean 26 72 - 46 - 24 462
Republican/Lean 12 83 - 71 - 50 400
AGE GROUP
18 to 34 22 74 - 52 - 27 210
35 to 54 20 78 - 58 - 36 316
55 & Over 18 77 - 59 - 40 432
HOUSEHOLD INCOME
Under $40,000 22 75 - 53 - 28 297
$40,000 to $79,999 21 76 - 55 - 41 301
$80,000 & Over 16 82 - 66 - 41 276
Q6. Generally speaking, how would you rate the federal government’s handling
of matters in K-12 Education?
NOTE: Please consider that each subgroup has a unique margin of error based on its adult population size in the United
States and the sample size (N) obtained in this survey. We advise strong caution when interpreting results for subgroups
with small sample sizes. The subgroup sample sizes displayed in the far right column represent the unweighted number
of interviews. All other statistical results reported in this table and report reflect weighted data, a standard procedure to
correct for known demographic discrepancies. Intensity is measured by subtracting the combined percentages of "fair"
and "poor" responses from the combined percentages of "good" and "excellent" responses. The difference considers
only the most hardened views behind the positive or negative ratings.
SOURCE: Friedman Foundation for Educational Choice, 2015 Schooling in America Survey , Q6.

19 | www.edchoice.org

20 | www.edchoice.org
Education Spending
Nearly $10,700 is spent on each student in America’s public schools, on
average, and less than one out of six respondents (14%) could estimate the
correct per-student spending range for the national average.
About 21% of respondents believed $4,000 or less was being spent per
student in the nation’s public schools. Another 23% of the national sample
either said they “don’t know” or could not offer a spending number.
When considering “total expenditures” per student ($12,178 in 2011–12),
which is another government definition for spending in K–12 education, it is
even more likely Americans’ estimates are dramatically further off target.4
Respondents tended to underestimate rather than overestimate.
Two out of three respondents (67%) either underestimated educational
spending per student (with a cautious definition citing “current
expenditures”), or they could not give an answer or guess.
When given an actual per-student spending statistic, Americans are less likely to say public
school funding is at a level that is “too low.”
In a split-sample experiment, we asked two slightly different questions. On
version 6A, 60% of respondents said that public school funding was “too low.”
(up from 56% in 2014) However, on version 6B, which included a sentence
referring to data on per-student funding in America ($10,667), the proportion
saying “too low” shrank by 11 percentage points to 49%. (up from 47% in 2014)
4 “Current Expenditures” data include dollars spent on instruction, instruction-related support services,
and other elementary/secondary current expenditures, but exclude expenditures on long-term debt service,
facilities and construction, and other programs. “Total Expenditures” includes the latter categories.
See Stephen Q. Cornman, Revenues and Expenditures for Public Elementary and Secondary Education: School
Year 2011–12 (Fiscal Year 2012) (NCES 2014-30). U.S. Department of Education. Washington, D.C.:
National Center for Education Statistics (January 2015).
URL: nces.ed.gov/pubs2014/2014301.pdf

21 | www.edchoice.org

22 | www.edchoice.org

23 | www.edchoice.org
Grades, Preferences for Types of Schools
Americans are much more likely to give grades A or B to private/parochial schools in
their communities, compared with their local public schools. When considering only
those respondents who actually gave a grade, the local private schools (83% gave an A or
B) fare even better than public schools (46% gave an A or B).
When considering all responses, we see approximately 44% of voters give an
A or B to local public schools; 58% give an A or B to local private/parochial
schools; and 36% give those high grades to public charter schools. Only 4% of
respondents would give a D or F grade to private schools; 19% gave the same
low grades to public schools; and 8% suggested low grades for charter schools.
It is important to highlight that much higher proportions of respondents did not
express a view for private schools (31%) or charter schools (43%), compared with
the proportion that did not grade public schools (6%).
When examining only those responses giving grades to different school types
in their communities, we observed approximately 46% of the national sample
gave an A or B to local public schools; 83% graded an A or B to local
private/parochial schools; and 63% gave an A or B to charter schools. Only 4%
of respondents gave a D or F grade to private schools; 14% gave low grades to
charter schools; and 10% assigned poor grades to area public schools.
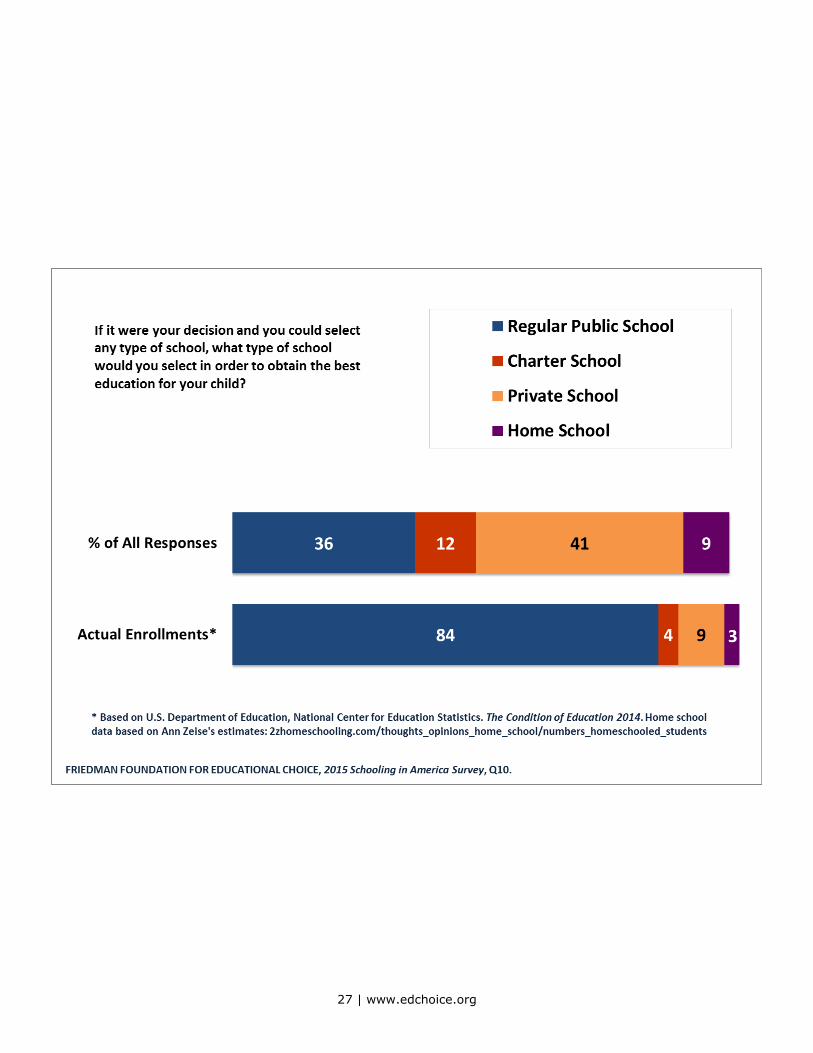
When asked for a preferred school type, a plurality of Americans chose a private school
(41%) as a first option for their child. A little more than one-third of respondents (36%)
would select a regular public school. Nearly equal proportions would select a public
charter school (12%) or opt to homeschool their child (9%).
Those private preferences signal a glaring disconnect with actual school
enrollment patterns in the United States. The reality check is profound. About
85% of K–12 students attend public schools across the country. Only about
8% of students enroll in private schools. Roughly 5% of students currently go

24 | www.edchoice.org
to public charter schools. It is estimated that just under 3% of the country’s
students are homeschooled.
In a follow-up question, more respondents in our survey prioritized “better
education/quality” (17%) than any other coded response to explain why they selected a
certain school type. Other school attributes cited as important include “individual
attention/one-on-one” (11%) and “better teachers/teachers/teaching” (11%).
Prominently cited school characteristics for choosing a specific school type:5
Public District School (N = 349)
16% DIVERSITY / VARIETY
16% SOCIALIZATION / PEERS / OTHER KIDS
11% BETTER EDUCATION / QUALITY
11% BETTER TEACHERS / TEACHERS / TEACHING
11% PUBLIC SCHOOL: POSITIVE MENTIONS
Private School (N = 416)
24% BETTER EDUCATION / QUALITY
17% INDIVIDUAL ATTENTION / ONE-ON-ONE
13% CLASS SIZE / STUDENT-TEACHER RATIO
Public Charter School (N = 107)
17% INDIVIDUAL ATTENTION / ONE-ON-ONE
14% BETTER EDUCATION / QUALITY
14% BETTER TEACHERS / TEACHERS / TEACHING
Home School (N = 95)
13% INDIVIDUAL ATTENTION / ONE-ON-ONE
8% BETTER EDUCATION / QUALITY
8% OUTCOMES / RESULTS / GRADUATION RATE
8% SAFETY / LESS DRUGS, VIOLENCE, BULLYING
5 For observed subgroups on this question and in tables, we provide the total number of unweighted
interviews (N). However, all percentages reflect the count of coded responses divided by the total
number of weighted interviews. Unweighted N’s are provided so the reader can roughly estimate and
judge the reliability of reported percentages.

25 | www.edchoice.org

26 | www.edchoice.org
27 | www.edchoice.org

28 | www.edchoice.org
Charter School Home School Private School Public School
% % % % N=
TOTAL 12 9 41 36 1,002
School Parent 11 8 43 37 234
Non-Schooler 12 9 40 35 763
COMMUNITY
Urban 12 8 39 37 211
Suburban 13 9 44 32 378
Small Town 9 10 41 36 248
Rural 11 10 38 40 149
PARTY ID
Democrat 11 6 39 42 353
Republican 10 12 45 30 270
Independent 11 10 43 32 245
Democrat/Lean 12 6 39 41 462
Republican/Lean 11 13 45 28 400
AGE GROUP
18 to 34 13 11 41 32 210
35 to 54 12 7 42 36 316
55 & Over 9 9 39 40 432
HOUSEHOLD INCOME
Under $40,000 12 9 41 36 297
$40,000 to $79,999 10 10 44 33 301
$80,000 & Over 8 12 38 38 276
Q10. If it were your decision and you could select any type of school, what type of school
would you select in order to obtain the best education for your child?
NOTE: Please consider that each subgroup has a unique margin of error based on its adult population size in the United States and the
sample size (N) obtained in this survey. We advise strong caution when interpreting results for subgroups with small sample sizes. The
subgroup sample sizes displayed in the far right column represent the unweighted number of interviews. All other statistical results
reported in this table and report reflect weighted data, a standard procedure to correct for known demographic discrepancies.
SOURCE: Friedman Foundation for Educational Choice, 2015 Schooling in America Survey , Q10.

29 | www.edchoice.org
30 | www.edchoice.org

31 | www.edchoice.org
BETTER EDUCATION / QUALITY 162
BETTER TEACHERS / TEACHERS / TEACHING 109
INDIVIDUAL ATTENTION / ONE-ON-ONE 109
ACADEMICS / CURRICULUM 75
CLASS SIZE / STUDENT-TEACHER RATIO 69
SOCIALIZATION / PEERS / OTHER KIDS 65
DISCIPLINE / STRUCTURE 63
DIVERSITY / VARIETY 59
ENVIRONMENT / CULTURE / COMMUNITY 53
STANDARDS / MORE CHALLENGING 48
Q11. What is the most important characteristic or attribute that would cause
you to choose a [INSERT SCHOOL TYPE FROM PREVIOUS QUESTION] for your
child? Please use one word, or a very short phrase.
Top 10 | Specific impressions offered by all respondents (N = 1,002) in the
national sample. Numbers represent counts (n), not percentages.
SOURCE: Friedman Foundation for Educational Choice, 2015 Schooling in America Survey , Q11.

32 | www.edchoice.org
BETTER EDUCATION / QUALITY 45
INDIVIDUAL ATTENTION / ONE-ON-ONE 40
BETTER TEACHERS / TEACHERS / TEACHING 33
ACADEMICS / CURRICULUM 28
CLASS SIZE / STUDENT-TEACHER RATIO 27
Q11. What is the most important characteristic or attribute that would cause
you to choose a [INSERT SCHOOL TYPE FROM PREVIOUS QUESTION] for your
child? Please use one word, or a very short phrase.
Top 5 | Specific impressions offered by school parents (N = 278) in the
national sample. Numbers represent counts (n), not percentages.
SOURCE: Friedman Foundation for Educational Choice, 2015 Schooling in America Survey , Q11.

33 | www.edchoice.org
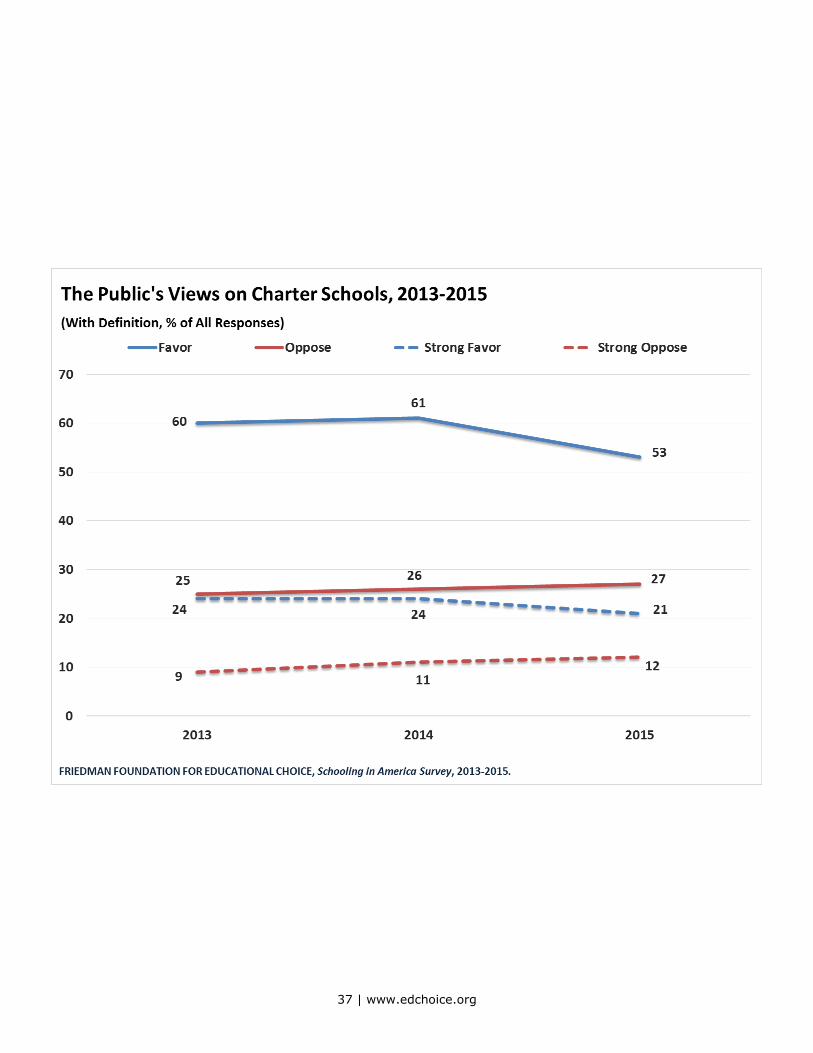
Charter Schools
Charter schools are supported by a substantial number of Americans. A
solid majority (53%) said they favor charter schools, whereas 27 percent of
respondents said they oppose charters. Support has dipped since last year,
although opposition is basically unchanged (2014: 61% favor vs. 26%
oppose). The margin of support for charter schools is large (+26 points).
Americans are almost twice as likely to express intensely positive responses
toward charters (21% “strongly favor” vs. 12% “strongly oppose”).
We asked a pair of questions about public charter schools. The first
question inquired an opinion without offering any definition. On this
baseline question, 42% of respondents said they favored charters and 21%
said they opposed them. (2014: 46% favor vs. 22% oppose) In the follow-
up question, respondents were given a definition for a charter school. With
this basic context, support rose 11 points to 53%, and opposition increased
six points to 27%.
The proportion of “don’t know” responses shrinks by 16 points (34% to 18%)
when comparing the baseline item to the definition item. Based on responses
to the former, the subgroups having the highest proportions either saying
they have never heard of or “don’t know” about charter schools are: young
adults (43%), small town residents (41%), and low-income earners (41%).
Positive views on charter schools span all observed demographics. Subgroup margins are
substantially large in the positive direction—all wider than +20 percentage points—except
for three subgroups: Democrats (+12 points), Democrats/Leaners (+14 points) and
seniors (+19 points). The largest margins are among Republicans/Leaners (+37 points),
Independents (+36 points), Republicans (+35 points), and young adults (+33 points).
Republicans (60%) and Independents (58%) are significantly more likely
to indicate support for charter schools than Democrats (47%). Likewise,

34 | www.edchoice.org
Republicans/Leaners (60%) are more positive than Democrats/Leaners
(47%) and the national sample average (53%).
Democrats (35%) are significantly more negative on charter schools than
Republicans (25%), Independents (22%), and the national average (27%).
Intensities are also positive nearly across the board. The largest are among Republicans
(+17 points), Republicans/Leaners (+17 points), and low-income earners (+16 points). The
net intensity among Democrats is essentially zero or even—the proportions of strongly
opposed an strongly favorable cancel each other out.
Republicans (29%) and Republicans/Leaners (28%) stand out as most likely
to say they “strongly favor” charter schools.

35 | www.edchoice.org

36 | www.edchoice.org
Favor Oppose Margin Intensity
% % N=
TOTAL 53 27 + 26 + 10 1,002
School Parent 54 30 + 24 + 8 234
Non-Schooler 53 26 + 27 + 10 763
COMMUNITY
Urban 53 23 + 30 + 9 211
Suburban 54 27 + 27 + 12 378
Small Town 50 29 + 21 + 7 248
Rural 55 34 + 21 + 9 149
PARTY ID
Democrat 47 35 + 12 even 353
Republican 60 25 + 35 + 17 270
Independent 58 22 + 36 + 13 245
Democrat/Lean 47 33 + 14 + 5 462
Republican/Lean 60 23 + 37 + 17 400
AGE GROUP
18 to 34 55 22 + 33 + 11 210
35 to 54 55 28 + 27 + 9 316
55 & Over 50 31 + 19 + 9 432
HOUSEHOLD INCOME
Under $40,000 54 24 + 30 + 16 297
$40,000 to $79,999 53 28 + 25 + 7 301
$80,000 & Over 56 31 + 25 + 8 276
Q13. Charter schools are public schools that have more control over their own
budget, staff, and curriculum, and are exempt from many existing public school
regulations. In general, do you favor or oppose charter schools?
NOTE: Please consider that each subgroup has a unique margin of error based on its adult population size in the United
States and the sample size (N) obtained in this survey. We advise strong caution when interpreting results for
subgroups with small sample sizes. The subgroup sample sizes displayed in the far right column represent the
unweighted number of interviews. All other statistical results reported in this table and report reflect weighted data,
a standard procedure to correct for known demographic discrepancies. Intensity is measured by subtracting the
percentage of "strongly oppose" responses from the percentage of "strongly favor" responses. The difference
considers only the most hardened views behind the support or opposition for a given policy or proposal.
SOURCE: Friedman Foundation for Educational Choice, 2015 Schooling in America Survey , Q13.
37 | www.edchoice.org

38 | www.edchoice.org

39 | www.edchoice.org
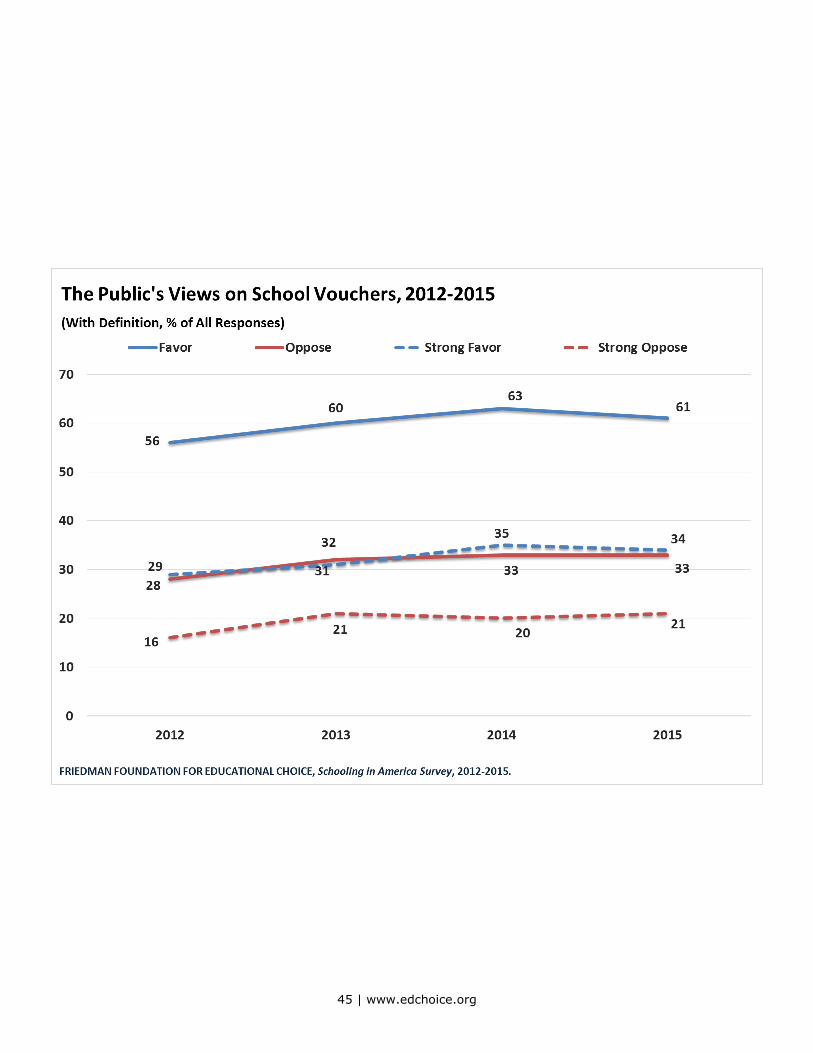
School Vouchers
Approximately six out of 10 Americans (61%) say they support school
vouchers, compared with 33% who said they oppose such a school choice
system. The levels are essentially unchanged since last year. (2014: 63% favor
vs. 33% oppose) The margin of support (+28 points) is nearly 10 times the
survey’s margin of error. Respondents were more likely to express an
intensely favorable view toward vouchers (34% “strongly favor” vs. 21%
“strongly oppose”).
Similar to the previous pair of charter school questions, our interviewers
asked baseline and follow-up questions about school vouchers. In the first
question, respondents were asked for their views on vouchers without a
definition or any other context. On this baseline question, 39% of the general
population said they favored vouchers, and 26% said they opposed such an
education policy. (2014: 43% favor vs. 21% oppose) In the follow-up question,
using a basic definition for a school voucher system, support rose 22 points to
61%, and opposition increased seven points to 33%.
The opinion change on vouchers – from baseline to follow-up – more than
doubles the positive margin, from +13 points to +28 points. The intensity for
vouchers also shifts in the positive direction, from +4 points to +13 points.
We estimate 35% of respondents were initially unfamiliar with school
vouchers. The proportion of “don’t know” responses shrinks by 29 points
(35% to 6%) when comparing the baseline item to the definition item. On the
former, the subgroups having the highest proportions either saying they have
never heard of or “don’t know” about school vouchers are young adults (47%)
and low-income earners (41%).
Like charter schools, all demographics express positive views on vouchers. Subgroup
margins are substantially large in the positive direction—greater than +20 percentage

40 | www.edchoice.org
points for most subgroups. The largest margin is among young adults (+40 points). The
smallest margin is among seniors (+7 points).
A surprising finding that goes against conventional wisdom is suburbanites (65%)
say they are significantly more supportive of vouchers than urbanites (54%).
Republicans (64%) and Independents (66%) are significantly more likely to
indicate support for school vouchers than Democrats (54%). Likewise,
Republicans/Leaners (65%) are more positive than Democrats/Leaners (56%).
Young adults (67%) and middle-age adults (65%) are more favorable toward
school vouchers than seniors (49%).
Low-income earners (66%) are significantly more supportive than high-
income earners (56%).
Seniors (42%) are significantly more negative on school vouchers than young
adults (27%), middle-age adults (30%), and the national average (33%).
Intensities are also positive nearly across the board. The largest are among school parents
(+25 points) and middle-age adults (+22 points). The lowest intensities are found among:
seniors (-2 points), Democrats (+5 points), Democrats/Leaners (+6 points), and high-
income earners (+4 points).
School parents (42%) and middle-age adults (41%) are most likely to say they
“strongly favor” school vouchers.
Seniors (30%) and high-income earners (29%) have the largest proportions
saying they “strongly oppose” school vouchers.
In a follow-up question, we learned the most common reasons for supporting school
vouchers are “access to schools having better academic outcomes” (38%) and “more
freedom and flexibility for parents” (28%). We also asked a similar follow-up to those
respondents opposed to school vouchers. By far the most common reason for opposing
school vouchers is the belief they “divert funding away from public schools” (57%).

41 | www.edchoice.org

42 | www.edchoice.org
Favor Oppose Margin Intensity
% % N=
TOTAL 61 33 + 28 + 13 1,002
School Parent 63 30 + 33 + 25 234
Non-Schooler 60 34 + 26 + 8 763
COMMUNITY
Urban 54 41 + 13 + 5 211
Suburban 65 29 + 36 + 14 378
Small Town 58 34 + 24 + 13 248
Rural 66 29 + 37 + 18 149
PARTY ID
Democrat 54 38 + 16 + 5 353
Republican 64 29 + 35 + 20 270
Independent 66 30 + 36 + 14 245
Democrat/Lean 56 37 + 19 + 6 462
Republican/Lean 65 29 + 36 + 20 400
AGE GROUP
18 to 34 67 27 + 40 + 18 210
35 to 54 65 30 + 35 + 22 316
55 & Over 49 42 + 7 - 2 432
HOUSEHOLD INCOME
Under $40,000 66 28 + 38 + 20 297
$40,000 to $79,999 61 32 + 29 + 14 301
$80,000 & Over 56 40 + 16 + 4 276
Q15. A school voucher system allows parents the option of sending their child to
the school of their choice, whether that school is public or private, including both
religious and non-religious schools. If this policy were adopted, tax dollars
currently allocated to a school district would be allocated to parents in the form
of a “school voucher” to pay partial or full tuition for their child’s school. In
general, do you favor or oppose a school voucher system?
SOURCE: Friedman Foundation for Educational Choice, 2015 Schooling in America Survey , Q15.
NOTE: Please consider that each subgroup has a unique margin of error based on its adult population size in the United
States and the sample size (N) obtained in this survey. We advise strong caution when interpreting results for subgroups
with small sample sizes. The subgroup sample sizes displayed in the far right column represent the unweighted number
of interviews. All other statistical results reported in this table and report reflect weighted data, a standard procedure to
correct for known demographic discrepancies. Intensity is measured by subtracting the percentage of "strongly oppose"
responses from the percentage of "strongly favor" responses. The difference considers only the most hardened views
behind the support or opposition for a given policy or proposal.

43 | www.edchoice.org

44 | www.edchoice.org
45 | www.edchoice.org

46 | www.edchoice.org

47 | www.edchoice.org
Education Savings Accounts (ESAs)
Six out of 10 Americans (62%) say they support an “education savings
account” system (“ESA”). The margin of support is large (+34 points) and
less one-third of respondents (28%) said they oppose ESAs. The support
level and margin have increased since last year (2014: 56% favor vs. 34%
oppose) Americans are twice as likely to express an intensely favorable view
toward ESAs (32% “strongly favor” vs. 16% “strongly oppose”).
All demographics are supportive of ESAs. With only a few exceptions, subgroup margins
are greater than +30 percentage points. The largest margins are among: young adults
(+59 points), low-income earners (+47 points), school parents (+44 points), urbanites
(+44 points), and Independents (+40 points). By far, the smallest margin is among
seniors (+4 points).
Urbanites (69%) are significantly more favorable toward ESAs than small
town residents (54%).
Young adults (75%) are significantly more supportive of ESAs than middle-
age adults (65%) and seniors (45%). The twenty point gap between middle-
age adults and seniors is also as significant difference.
Low-income earners (70%) are more likely to support ESAs than middle-
income earners (55%) and high-income earners (61%).
Seniors (41%) are significantly more negative on ESAs than young adults
(16%), middle-age adults (26%), and the national average (28%).
Intensities are also positive for nearly all demographic subgroups across the board.
Young adults (+32 points) clearly stand out as most intensely positive. On the other end
of the spectrum, seniors (-5 points) are the only subgroup to express a negative intensity.
Independents (39%) and young adults (39%) have the greatest proportions
saying they “strongly favor” ESAs.
Seniors (27%) have the largest proportion saying they “strongly oppose” ESAs.

48 | www.edchoice.org
A split sample experiment in the follow-up question reveals Americans are inclined
toward universal access to ESAs rather than means-tested eligibility based solely on
financial need.
In Split A, approximately two out of three respondents (66%) said they
agree with the statement that “ESAs should be available to all families,
regardless of incomes and special needs.” About 45% “strongly agree”
with that statement. Fewer than three out of 10 voters (27%) disagree
with that statement; 16% said they “strongly disagree.”
In the comparison sample, Split B, respondents were asked if they agree
with the statement “ESAs should only be available to families based on
financial need.” About one-third (36%) agreed with that statement, while
17% said “strongly agree.” More than half (56%) said they disagree with
means-testing ESAs, and 33% said they “strongly disagree.”

49 | www.edchoice.org
Favor Oppose Margin Intensity
% % N=
TOTAL 62 28 + 34 + 16 1,002
School Parent 67 23 + 44 + 23 234
Non-Schooler 60 30 + 30 + 13 763
COMMUNITY
Urban 69 25 + 44 + 21 211
Suburban 61 26 + 35 + 21 378
Small Town 54 33 + 21 + 7 248
Rural 62 32 + 30 + 10 149
PARTY ID
Democrat 60 30 + 30 + 10 353
Republican 61 28 + 33 + 17 270
Independent 65 25 + 40 + 22 245
Democrat/Lean 62 28 + 34 + 17 462
Republican/Lean 60 28 + 32 + 15 400
AGE GROUP
18 to 34 75 16 + 59 + 32 210
35 to 54 65 26 + 39 + 22 316
55 & Over 45 41 + 4 - 5 432
HOUSEHOLD INCOME
Under $40,000 70 23 + 47 + 22 297
$40,000 to $79,999 55 32 + 23 + 12 301
$80,000 & Over 61 30 + 31 + 13 276
Q19. An "education savings account," - often called an "ESA" - allows parents to
take their child out of a public district or charter school, and receive a payment
into a government-authorized savings account with restricted, but multiple uses.
Parents can then use these funds to pay for private school tuition, virtual
education programs, private tutoring or saving for future college expenses. In
general, do you favor or oppose this kind of “savings account system”?
NOTE: Please consider that each subgroup has a unique margin of error based on its adult population size in the United
States and the sample size (N) obtained in this survey. We advise strong caution when interpreting results for subgroups
with small sample sizes. The subgroup sample sizes displayed in the far right column represent the unweighted number of
interviews. All other statistical results reported in this table and report reflect weighted data, a standard procedure to
correct for known demographic discrepancies. Intensity is measured by subtracting the percentage of "strongly oppose"
responses from the percentage of "strongly favor" responses. The difference considers only the most hardened views
behind the support or opposition for a given policy or proposal.
SOURCE: Friedman Foundation for Educational Choice, 2015 Schooling in America Survey , Q19.

50 | www.edchoice.org

51 | www.edchoice.org

52 | www.edchoice.org

53 | www.edchoice.org
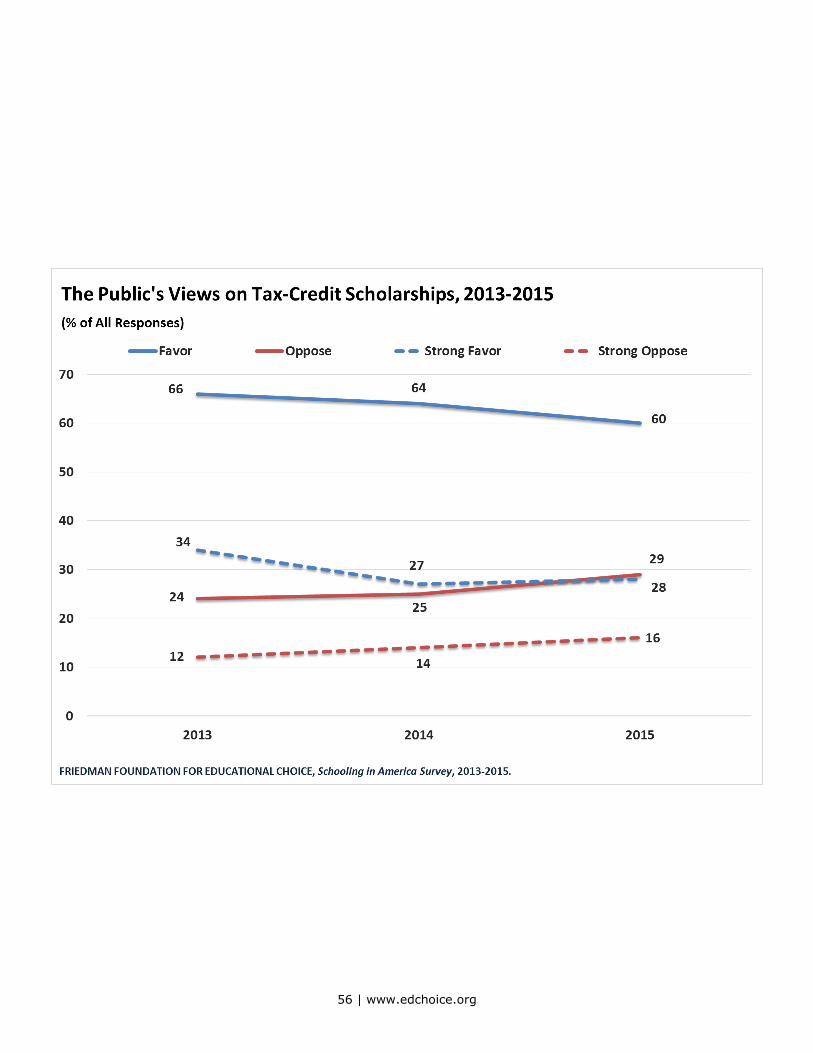
Tax-Credit Scholarships
Americans are more than twice as likely to support a tax-credit scholarship
program than they are to oppose one. Six out of 10 respondents (60%) said
they supported the reform, whereas 29 percent said they oppose tax-credit
scholarships. The result is slightly decreased since last year (2014: 64% favor
vs. 25% oppose). The margin is +31 percentage points. The general public is
almost twice as likely to express intensely positive responses toward tax-
credit scholarships (28% “strongly favor” vs. 16% “strongly oppose”).
With only two exceptions, observed subgroup margins are greater than +20 percentage
points. The largest margins are among: young adults (+52 points), urbanites (+48
points), low-income earners (+45 points), Republicans/Leaners (+41 points), and
Republicans (+39 points). Once again when it comes to a school choice reform, seniors
show the smallest margin of support (+8 points).
Urbanites (72%) are significantly more favorable toward tax-credit
scholarships than suburbanites (57%), small town residents (50%), and
the national sample average (60%).
Republicans (64%) are more supportive than Democrats (54%).
Similarly, Republicans/Leaners (65%) are significantly different than
Democrats/Leaners (57%).
Young adults (72%) are significantly more supportive of tax-credit scholarships
than middle-age adults (61%), seniors (47%), and the national average (60%).
Middle-age adults are also significantly more favorable to scholarships
compared with seniors.
Seniors (39%) are significantly more negative than young adults (20%),
middle-age adults (28%), and the national average (29%).
Net intensities are positive for all observed demographic subgroups, except
seniors (-2 points). Subgroups that are most intensely positive include: young

54 | www.edchoice.org
adults (+24 points), school parents (+22 points), urbanites (+22 points), and low-
income earners (+20 points).
Urbanites (38%) have the greatest proportion saying they “strongly favor” tax-
credit scholarships.
Seniors (23%) have the largest proportion saying they “strongly oppose” tax-
credit scholarships.

55 | www.edchoice.org
Favor Oppose Margin Intensity
% % N=
TOTAL 60 29 + 31 + 12 1,002
School Parent 61 27 + 34 + 22 234
Non-Schooler 59 30 + 29 + 8 763
COMMUNITY
Urban 72 24 + 48 + 22 211
Suburban 57 30 + 27 + 11 378
Small Town 50 35 + 15 + 3 248
Rural 62 27 + 35 + 14 149
PARTY ID
Democrat 54 33 + 21 + 8 353
Republican 64 25 + 39 + 13 270
Independent 62 29 + 33 + 11 245
Democrat/Lean 57 33 + 24 + 11 462
Republican/Lean 65 24 + 41 + 14 400
AGE GROUP
18 to 34 72 20 + 52 + 24 210
35 to 54 61 28 + 33 + 16 316
55 & Over 47 39 + 8 - 2 432
HOUSEHOLD INCOME
Under $40,000 67 22 + 45 + 20 297
$40,000 to $79,999 58 30 + 28 + 9 301
$80,000 & Over 55 37 + 18 + 6 276
Q22. A “tax credit” allows an individual or business to reduce the final amount of
a tax owed to government. Some states give tax credits to individuals and
businesses if they contribute money to nonprofit organizations that distribute
private school scholarships. A “tax-credit scholarship system” allows parents the
option of sending their child to the school of their choice, whether that school is
public or private, including both religious and non-religious schools. In general, do
you favor or oppose a tax-credit scholarship system?
NOTE: Please consider that each subgroup has a unique margin of error based on its adult population size in the United
States and the sample size (N) obtained in this survey. We advise strong caution when interpreting results for subgroups
with small sample sizes. The subgroup sample sizes displayed in the far right column represent the unweighted number of
interviews. All other statistical results reported in this table and report reflect weighted data, a standard procedure to
correct for known demographic discrepancies. Intensity is measured by subtracting the percentage of "strongly oppose"
responses from the percentage of "strongly favor" responses. The difference considers only the most hardened views
behind the support or opposition for a given policy or proposal.
SOURCE: Friedman Foundation for Educational Choice, 2015 Schooling in America Survey , Q22.
56 | www.edchoice.org

57 | www.edchoice.org

58 | www.edchoice.org
Standardized Testing
More than two out of five Americans (43%) believed students spend at least
16 or more days of the school year – nearly 10% of the academic year – on
standardized testing activities. That figure is essentially unchanged since
last year (42% in 2014).
High-income earners (49%) are significantly more likely to say “16 or more
school days” than low-income earners (38%).
Seniors (25%) are significantly more likely than young adults (11%) and
middle-age adults (12%) to say they “don’t know” or are unsure about
responding to this question.
A plurality of Americans (42%) said the amount of time spent on standardized
testing is “too high,” compared with 19% who said “too low.” Since last year,
those numbers have increased and decreased, respectively (2014: 36% too
high vs. 24% too low).
Views on testing diverge greatly among income groups. High-income earners
(58% too high vs. 14% too low) are much more likely to say “too high” than
low-income earners (30% too high vs. 25% too low), middle-income earners
(43% too high vs. 20% too low), and the national sample average.
Nearly half of school parents (47%) said the amount of time spent on
standardized testing is “too high;” however, that level is not significantly
different compared with non-schoolers (40%) or the national average (42%).
Among school parents, the “too high” sentiment is more than twice as high as
the proportion who said “too low” (19%).
A plurality of middle-age adults believe American schools spend too much
time on testing (45% too high vs. 20% too low). This subgroup’s “too high”
response is significantly greater than seniors’ (37%).

59 | www.edchoice.org

60 | www.edchoice.org
Too High About Right Too Low
% % % N=
TOTAL 42 31 19 1,002
School Parent 47 29 20 234
Non-Schooler 40 31 19 763
COMMUNITY
Urban 39 35 17 211
Suburban 46 28 20 378
Small Town 39 30 20 248
Rural 44 28 19 149
PARTY ID
Democrat 38 34 22 353
Republican 43 27 17 270
Independent 44 29 20 245
Democrat/Lean 39 35 22 462
Republican/Lean 44 28 15 400
AGE GROUP
18 to 34 42 32 21 210
35 to 54 45 28 20 316
55 & Over 37 32 17 432
HOUSEHOLD INCOME
Under $40,000 30 39 25 297
$40,000 to $79,999 43 29 20 301
$80,000 & Over 58 21 14 276
Q24. Do you believe the amount of time spent on standardized testing in
American schools is:
NOTE: Please consider that each subgroup has a unique margin of error based on its adult population size in the
United States and the sample size (N) obtained in this survey. We advise strong caution when interpreting
results for subgroups with small sample sizes. The subgroup sample sizes displayed in the far right column
represent the unweighted number of interviews. All other statistical results reported in this table and report
reflect weighted data, a standard procedure to correct for known demographic discrepancies.
SOURCE: Friedman Foundation for Educational Choice, 2015 Schooling in America Survey , Q24.

61 | www.edchoice.org

62 | www.edchoice.org
State Accountability and Intervention
When asked about what state government should do to intervene, if at all, in
low-performing schools, the highest proportion of respondents (41%) said
supplying vouchers/scholarships to affected families would be a useful state
intervention. Significantly smaller proportions believed converting district
schools to charter schools (26%), dismissing the school personnel (25%), or
closing the school (18%) would be useful to affected students and families.6
Republicans (33%) are significantly less likely than Democrats (44%) and
Independents (44%) to say the school choice option is more useful. That is a
surprising finding. In this circumstance, Republicans and Democrats switch
their relative positions with respect to advancing vouchers, scholarships, or
ESAs. It is also noteworthy that Democrats are more likely to say school
choice is more useful to affected families than other interventions.
Young adults (52%) are much more likely to say the school choice option is
more useful than middle-age adults (39%) and seniors (35%).
Low-income earners (47%) are significantly more likely to say the school
choice option is more useful than high-income earners (36%).
High-income earners (27%) are significantly more likely to rate the school
choice option a “1” (“least useful”) than low-income earners (16%), middle-
income earners (17%), and the national average (19%).
Nearly half of school parents (49%) rate the school closure/reassignment
option a “1” (“least useful”), which is significantly higher than the levels
observed for non-schoolers (38%) and the national average (41%).
6 We asked respondents to rate four types of potential accountability actions where the state could intervene
in a low-performing school. Ratings were based on a scale ranging from 1 to 5, where a “1” reflected a least
useful action to be taken by the state, and a “5” reflected a most useful action.

63 | www.edchoice.org

64 | www.edchoice.org
Supply a voucher,
scholarship, ESA
Convert district
schools to charters
Replace school
leadership, staff
Close the school and
reassign students
% % % % N=
TOTAL 41 26 25 18 1,002
School Parent 43 28 24 14 234
Non-Schooler 41 25 25 20 763
COMMUNITY
Urban 46 27 24 21 211
Suburban 41 25 24 13 378
Small Town 39 26 25 22 248
Rural 40 26 27 21 149
PARTY ID
Democrat 44 24 23 18 353
Republican 33 29 27 16 270
Independent 44 28 22 17 245
Democrat/Lean 45 24 22 18 462
Republican/Lean 38 30 28 18 400
AGE GROUP
18 to 34 52 25 26 18 210
35 to 54 39 28 26 17 316
55 & Over 35 24 23 19 432
HOUSEHOLD INCOME
Under $40,000 47 27 26 18 297
$40,000 to $79,999 43 24 21 19 301
$80,000 & Over 36 27 29 17 276
Q25. We would now like to ask what you believe state government should do to intervene – if at
all – in low-performing school districts and schools. On a scale from 1 to 5, please rate how useful
each one of the following actions would be to affected students and families in a low-performing
school? A "1" would reflect LEAST useful action; a "5" would reflect MOST useful action.
(reporting combined % of "4" and "5" responses)
NOTE: Please consider that each subgroup has a unique margin of error based on its adult population size in the United States and the sample size
(N) obtained in this survey. We advise strong caution when interpreting results for subgroups with small sample sizes. The subgroup sample sizes
displayed in the far right column represent the unweighted number of interviews. All other statistical results reported in this table and report
reflect weighted data, a standard procedure to correct for known demographic discrepancies.
SOURCE: Friedman Foundation for Educational Choice, 2015 Schooling in America Survey , Q25.

65 | www.edchoice.org
Common Core State Standards
Half of respondents (50%) said they support the Common Core State
Standards (Common Core) compared with 40 percent who said they oppose
this approach to developing and implementing state-level academic
standards. Sentiment has not changed since last year (2014: 50% favor vs.
41% oppose). The margin is +10 percentage points. Net intensity goes in the
negative direction (19% strongly favor vs. 24% strongly oppose).
Impressions toward the baseline question sends a more mixed message.
Without any context or definition, 40% of Americans say they support Common
Core, whereas the proportion in opposition is nearly equal (39%). Support on
the baseline has climbed six points since last year (2014: 34% support vs. 39%
oppose). The protocol used for this set of Common Core questions is similar to
the approach used for the voucher and charter school question pairs.
In the second/follow-up question – providing additional context to the purpose
and origins of the Common Core – respondents increased their support by 10
points to 50%, and opposition increased by one point to 40%.
We estimate one-fifth of respondents (20%) were initially unfamiliar with
Common Core. That result is down from 26% in 2014. The proportion of
“don’t know” responses shrinks by 11 points down to 9% when comparing
the baseline and context items.
School parents, suburbanites, and high-income earners are significantly more
likely than the national average to express a view about Common Core on the
baseline question.
Compared with responses to the school choice questions, demographic subgroup
margins are smaller in size, except among Democrats (+28 points), Democrats/Leaners
(+26 points), and urbanites (+25 points). Negative margins are observed among rural
residents (-6 points), Republicans/Leaners (-4 points), and Republicans (-3 points).

66 | www.edchoice.org
Democrats (60%) are significantly more supportive of Common Core
than Republicans (43%), Independents (50%), and the national average
(50%). Similarly, Democrats/Leaners (59%) are more positive than
Republicans/Leaners (43%).
Urbanites (57%) are more likely to support Common Core than rural residents
(43%). Conversely, small town residents (44%) and rural residents (49%) are
more significantly opposed to Common Core, compared with urbanites (32%).
Intensities are mostly negative across observed demographic subgroups. The largest
positive intensities are among Democrats (+7 points) and Democrats/Leaners (+5 points).
The largest negative are found among: Republicans/Leaners (-16 points), Republicans (-14
points), high-income earners (-13 points), and rural residents (-11 points).
Democrats (24%) and Democrats/Leaners (23%) are most likely to say they
“strongly favor” the Common Core.
Rural residents (33%), Republicans/Leaners (31%), high-income earners
(31%), and Republicans (30%) are most likely to say they “strongly
oppose” Common Core.

67 | www.edchoice.org

68 | www.edchoice.org
Favor Oppose Margin Intensity
% % N=
TOTAL 50 40 + 10 - 6 1,002
School Parent 47 46 + 1 - 7 234
Non-Schooler 51 38 + 13 - 6 763
COMMUNITY
Urban 57 32 + 25 + 1 211
Suburban 51 40 + 11 - 7 378
Small Town 47 44 + 3 - 8 248
Rural 43 49 - 6 - 11 149
PARTY ID
Democrat 60 32 + 28 + 7 353
Republican 43 46 - 3 - 14 270
Independent 50 42 + 8 - 9 245
Democrat/Lean 59 33 + 26 + 5 462
Republican/Lean 43 47 - 4 - 16 400
AGE GROUP
18 to 34 53 38 + 15 + 1 210
35 to 54 48 43 + 5 - 9 316
55 & Over 50 38 + 12 - 6 432
HOUSEHOLD INCOME
Under $40,000 51 39 + 12 - 2 297
$40,000 to $79,999 50 44 + 6 - 9 301
$80,000 & Over 52 43 + 9 - 13 276
Q27. The objective of the Common Core State Standards Initiative is to establish
similar academic standards and comparable tests across all states for students in
grades K-12. The standards were initially developed by the National Governors
Association and Council of Chief State School Officers. States and districts have
adopted the common standards and tests in association with U.S. Department of
Education incentives. In general, do you favor or oppose the “Common Core”?
NOTE: Please consider that each subgroup has a unique margin of error based on its adult population size in the United
States and the sample size (N) obtained in this survey. We advise strong caution when interpreting results for subgroups
with small sample sizes. The subgroup sample sizes displayed in the far right column represent the unweighted number of
interviews. All other statistical results reported in this table and report reflect weighted data, a standard procedure to
correct for known demographic discrepancies. Intensity is measured by subtracting the percentage of "strongly oppose"
responses from the percentage of "strongly favor" responses. The difference considers only the most hardened views
behind the support or opposition for a given policy or proposal.
SOURCE: Friedman Foundation for Educational Choice, 2015 Schooling in America Survey , Q27.

69 | www.edchoice.org

70 | www.edchoice.org
Political Signals
A candidate for public office is more likely to win over voters with affirming
positions on ESAs and school vouchers compared with a “pro” position on
Common Core (30%, 29%, and 18%, respectively). Support significantly
varies within certain demographic categories: Age, political party
allegiance, and household income earnings.
If an American has a particular view on ESAs, she or he is more than twice as
likely to vote for the pro-ESA candidate (30% “more likely” vs. 14% “less likely”).
Well above half of respondents (53%) signaled that an ESA position would not
make or break her/his vote, saying “no difference.” (2014: 27% more likely vs.
19% less likely; 51% no difference)
Support for a pro-ESA candidate, by subgroup
More Likely to Vote Margin
Age 18 to 34 40% +32 points
Low-income 37% +28 points
School Parent 37% +24 points
Independent 33% +20 points
Age 35 to 54 31% +18 points
Democrat 31% +15 points
Republican 28% +12 points
High-income 28% +9 points
Middle-income 26% +8 points
Age 55+ 21% even
Americans are more likely to vote for a pro-voucher candidate, rather than
oppose one (29% “more likely” vs. 21% “less likely”). Just less than half of

71 | www.edchoice.org
respondents (45%) said that vouchers are not a make-or-break issue. (2014: 27%
more likely vs. 16% less likely; 53% no difference)
Support for a pro-voucher candidate, by subgroup
More Likely to Vote Margin
Republican 36% +19 points
Age 18 to 34 33% +18 points
Low-income 31% +17 points
School Parent 34% +13 points
Independent 31% +9 points
Age 35 to 54 29% +9 points
Middle-income 26% +2 points
High-income 31% even
Democrat 24% -1 point
Age 55+ 24% -4 points
Americans are slightly less likely to vote for a pro-Common Core candidate,
rather than support one (18% “more likely” vs. 23% “less likely”). A majority of
respondents (54%) said Common Core did not make a difference. (2014: 16%
more likely vs. 24% less likely; 56% no difference)
Support for a pro-Common Core candidate, by subgroup
More Likely to Vote Margin
Democrat 21% +3 points
Age 18 to 34 24% +2 points
Low-income 19% -1 point
Independent 20% -2 points
Age 55+ 17% -4 points
Middle-income 18% -7 points
High-income 20% -9 points

72 | www.edchoice.org
Age 35 to 54 14% -10 points
School Parent 17% -13 points
Republican 15% -14 points
On the final substantive question in our survey, we conducted a third split-sample
experiment. To one-half of the national sample, we asked, “How influential to you is a
teachers’ union endorsement of a candidate for state office?” A clear plurality (46%) said
the union has a positive influence. One-quarter (25%) said the teachers’ union has a
negative influence. However, Americans are barely more likely to say the union signal has
a “strong positive influence” (18%), compared with a strong negative influence” (15%).
One out of five respondents (19%) said the endorsement “does not matter to me.”
Democrats (62%), Democrats/Leaners (60%), and urbanites (59%) have the
highest proportions saying a teachers’ union endorsement has a positive influence,
and each group is significantly higher than the national sample average.
Republicans/Leaners (42%), Republicans (39%), small town residents (37%), and
seniors (34%) have the highest proportions saying it has a negative influence, and
each group is significantly higher than the national sample average.
To the other half of the national sample, we asked “How influential to you is a parent
advocacy organization’s endorsement of a candidate for state office?” A slightly larger
proportion (50%) said the organization would have a positive influence. Only 16% said
such a group would have a negative influence. Roughly one out of four respondents said
the endorsement “does not matter to me.”
Democrats (59%) are significantly more likely than Republicans (43%) to say a
parent advocacy organization’ endorsement has a positive influence. Likewise,
Democrats/Leaners (57%) are significantly more likely than Republicans (44%) to
say a parent advocacy organization’ endorsement has a positive influence.

73 | www.edchoice.org

74 | www.edchoice.org

75 | www.edchoice.org
SECTION II Methods
& About Us

76 | www.edchoice.org
Methods
The “Schooling in America Survey” project, funded and developed by the Friedman
Foundation for Educational Choice and conducted by Braun Research, Inc. (BRI),
interviewed a statistically representative national sample of adults (age 18+) in the 50
U.S states and District of Columbia. Methodology included probability sampling and
random-digit dial. The unweighted national sample includes a total of 1,002 General
Population telephone interviews completed in English or Spanish from April 22 to May
12, 2015, by means of both landline and cell phone. Statistical results were weighted to
correct known demographic discrepancies. The margin of sampling error for the total
national sample is ± 3.1 percentage points.
During our study, we oversampled Latinos in the 50 U.S. states and District of Columbia
to bring total Latinos to N=532 (comprised of n=125 from the national sample dialing
and n=407 from oversample dialing). We offered respondents the option of whether to
progress through the interview in either English or Spanish. Results for Latinos and
other demographics based on race and ethnicity will be released at a later date.
For this entire project, a total of 19,600 calls were made. BRI’s live callers conducted all
phone interviews.
National sample:
o 10,600 in total – 6,300 landline; 4,300 cell
o Of these calls 3,776 (2,633 landline, 1,143 cell) were unusable phone
numbers (disconnected, fax, busy, non-residential, or non-answers, etc.);
o 5,752 (3,043 landline, 2,709 cell) were usable numbers but eligibility
unknown (including refusals and voicemail);
o 42 (6 landline, 36 cell) phone numbers were usable but not eligible for this
survey; and
o 25 (14 landline, 11 cell) people did not complete the survey.
o The average response rate of the landline interviews was 13.5%.
o The average response rate of the cell phone interviews was 13.5%.

77 | www.edchoice.org
Latino oversample
o 9,000 in total – 5,400 landline; 3,600 cell
o Of these calls 3,172 (2,256 landline, 916 cell) were unusable phone
numbers (disconnected, fax, busy, non-residential, or non-answers, etc.);
o 4,930 (2,621 landline, 2,309 cell) were usable numbers but eligibility
unknown (including refusals and voicemail);
o 477 (258 landline, 219 cell) phone numbers were usable but not eligible for
this survey; and
o 14 (11 landline, 3 cell) people did not complete the survey.
o The average response rate of the landline interviews was 10.7%.
o The average response rate of the cell phone interviews was 13.1%.
Details on call dispositions, landline and cell phone response rates, and weighting are
discussed in the following sections.
Sample Design
A combination of landline and cellular random digit dial (RDD) samples was used to
represent the General Population (adults age 18+ in the 50 U.S. states and District of
Columbia) who have access to either a landline or cellular telephone. Survey Sampling
International, LLC (SSI) provided both samples according to BRI specifications.
SSI starts with a database of all listed telephone numbers, updated on a four- to six-week
rolling basis, 25 percent of the listings at a time. All active blocks—contiguous groups of 100
phone numbers for which more than one residential number is listed—are added to this
database. Blocks and exchanges that include only listed business numbers are excluded.
Numbers for the landline sample were drawn with equal probabilities from active blocks
(area code + exchange + two-digit block number) that contained three or more
residential directory listings. The cellular sample was not list-assisted, but was drawn
through a systematic sampling from dedicated wireless 100-blocks and shared service
100-blocks with no directory-listed landline numbers.

78 | www.edchoice.org
Contact Procedures
Interviews were conducted from April 22 to May 12, 2015. As many as eight attempts
were made to contact every sampled telephone number. The sample was released for
interviewing in replicates, which are representative subsamples of the larger sample.
Using replicates to control the release of the sample ensures that complete call
procedures are followed for the entire sample. Calls were staggered over times of day
and days of the week to maximize the chance of making contact with potential
respondents. Each phone number received at least one daytime call.
The Hagan-Collier Method guided respondent selection. Respondents in the landline
sample were chosen by asking for the youngest adult male who is now at home. If the
youngest male was not home, then the next step would be to request an interview with the
youngest female at home. Interviews in the cell sample were conducted with the person
who answered the phone, as long as that person was an adult 18 years of age or older.
The survey’s margin of sampling error (MSE) is the largest 95% Confidence Interval for
any estimated proportion based on the total sample – the one around 50%. The national
sample’s margin of error for this survey is ± 3.1%. This means that in 95 of every 100
samples drawn using the same methodology, estimated proportions based on the entire
sample will be no more than 3.1 percentage points away from their true values in the
population. Sampling errors and statistical tests of significance do not address any
potential design effect due to weighting.
It is critical to note that the MSE is higher when considering the number of respondents
for a given demographic subgroup. For example, the MSE for a subgroup of 150
respondents is ± 8.0 percentage points.
In addition to sampling error, question wording, ordering, and other practical
difficulties when conducting surveys may introduce error or bias into the findings of
public opinion research.

79 | www.edchoice.org
Call Dispositions and Response Rates
We use the American Association for Public Opinion Research’s “Response Rate 3”
(AAPOR RR3) for computing response rates for landline and cell phone proportions of
the sample. The response rate is the percentage of known or assumed residential
households for which a completed interview was obtained.
Landline Cell Phone Landline Cell Phone
6,300 4,300 Total 1,327 972 Disconnected
6,300 4,300 Released 3 0 Fax
0 0 Unreleased 133 87 Government/Business
4,502 3,220 Usable 0 0 Cell Phone
1,798 1,080 Unusable . . Landline
4,467 2,966 Qualified 1,463 1,059 Unusable
71.5% 74.9% Est. Usability 1,047 82 No Answer
99.0% 92.0% Est. Eligibility 126 2 Busy
13.5% 13.5% Est. Response 1,173 84 Usability Unknown
601 401 Complete
14 11 Break-Off
615 412 Usable/Eligible
528 302 Refused
89 55 Language Barrier
1,217 1,315 Voice Mail
1,083 942 Call Back-Retry
114 89 Strong Refusal
12 6 Privacy Manager
3,043 2,709 Usable/Eligible Unknown
6 36 Under 18
6 35 Usable/Ineligible
13.5% 13.5% Response Rate
National Sample Call Dispositions
SUMMARY DETAIL

80 | www.edchoice.org
Weighting Procedures and Analysis
Weighting is generally used in survey analysis to compensate for sample designs and
patterns of non-response that might bias results. In this study the sample demographics
were balanced to population parameters.
Research provides evidence that participation in surveys tends to vary for different
subgroups of the population. Subgroup participation and cooperation may also vary
because of substantive interest regarding a survey’s topics and questions. To compensate
for these known and potential biases, the sample data are weighted for analysis.
The national sample was weighted using population parameters from the U.S. Census
Bureau’s 2010 Decennial Census for adults 18 years of age or older living in the 50 U.S.
states and the District of Columbia. Results were weighted on Landline/Cell Phone
usage first, and then Age, Race, Ethnicity, Gender, and Region. The initial weighting to
match current patterns of telephone status and relative usage of landline and cell
phones are based on the Center for Disease Control’s Early Release of Estimates From
the National Health Interview Survey (NHIS), July–December 2013.
For the total Latino sample results, we weighted to general population parameters for
total Latinos and weighted on Age, Race, Ethnicity, and Gender and Region, based on
the U.S Census Bureau’s 2013 American Community Survey (ACS), Five-year
Estimates. Please note that we could not use the dual method for weighting Latinos as
some phone usage (i.e., landline-only and dual-usage) statistics do not exist for this
population. When reporting race, age, gender, etc., only “wireless only” and “wireless
mostly” are reported. Also, since ‘Latino’ is an ethnicity and not a race, we can include
‘race’ as a weighting factor for Latinos, but Latinos are the ethnicity, which cannot serve
as a weighting factor.
Weighted and unweighted results are available on request.

81 | www.edchoice.org
AGE
18 - 24 10.2% 13.2% 13.1%
25 - 34 10.8% 17.0% 17.5%
35 - 44 12.4% 17.7% 17.5%
45 - 54 19.2% 18.8% 19.2%
55 - 64 19.1% 15.5% 15.6%
65+ 24.1% 16.8% 17.2%
[Refused] 4.4% 1.0% .
HISPANIC
Yes 12.5% 14.2% 14.2%
No 87.5% 85.8% 85.8%
RACE
Asian [or Pacific Islander] 3.3% 4.8% 4.9%
Black [or African American] 10.3% 11.8% 12.0%
White 72.3% 74.3% 74.7%
[Other] 11.2% 7.5% 8.5%
[DK] 1.0% 0.6% .
[Refused] 2.0% 1.0% .
GENDER
[Male] 49.5% 48.5% 48.5%
[Female] 50.5% 51.5% 51.5%
CENSUS REGION/DIVISION
NORTHEAST 18.8% 18.1% 18.3%
MIDWEST 21.3% 21.3% 21.7%
SOUTH 36.9% 37.2% 37.0%
WEST 23.1% 23.3% 23.0%
Weighting Results for National Sample
Pre-Weight Post-Weight Census Target

82 | www.edchoice.org
About the Author
Paul DiPerna is Research Director for the Friedman Foundation for Educational Choice.
He joined the Foundation in September 2006. Paul’s research interests include surveys
and polling on K–12 education and school choice policies. He has developed and
reported more than 25 state polls, four national polls, and other survey projects over the
last six years. He is also responsible for directing and managing all research projects
commissioned by the foundation. Paul has traveled to 28 states for his work. He
presents survey research findings and discusses school choice policies for audiences
including public officials, policy professionals, academics, and advocates.
Previously, Paul served as the assistant director for the Brown Center on Education
Policy at the Brookings Institution in Washington, D.C. His six years at Brookings
included projects evaluating the federal Blue Ribbon Schools Program and analyzing
student achievement in charter schools. Paul was a research analyst for the first five
issues of the Brown Center Report on American Education (2000–2004). He also
managed and coordinated the activities of the National Working Commission on
Choice in K–12 Education (2001–2005).
A native of Pittsburgh, Paul earned an M.A. in political science from the University of
Illinois (2000) and B.A. from the University of Dayton (1996).
Acknowledgements
A number of people made significant contributions during the course of this survey project.
Drew Catt played an important role verifying data in this report. We are grateful to the team
at Braun Research who assisted in project development, and for their excellent work in
conducting the interviews and collecting the data. I appreciate the time and commitments
from Paul Braun, Cynthia Miller, and Dave Oshman. Finally, we are of course grateful to the
respondents who generously agreed to participate in our survey interviews.
83 | www.edchoice.org
About the Survey Organization
Braun Research, Inc.
The Braun Research network of companies, founded in 1995, combined employ 39 full-
time and more than 236 part-time employees engaged in data collection via telephone,
and internet for various survey research firms, government and advertising agencies, local
community organizations, local and national business groups, foundations, universities
and academic entities, as well as religious organizations. In 20 years, Braun Research has
conducted almost 10,000 research projects by telephone, internet, and mail worldwide.
Nationally-known research firms have hired Braun Research, including the Gallup
Organization, the Pew Research Center, the Eagleton Poll, Mathematica Policy
Research, and The Washington Post. Braun Research has worked for the New Jersey
Department of Health and Human Services, as well as other government agencies
including the United States Departments of the Treasury and Defense, and the Center
for Disease Control.
The work we accomplish for other research firms requires us to perform all work up to
standards required by the various research organizations where we enjoy membership
and in some cases participate actively. Paul Braun is recognized as a leader in the field by
colleagues who asked him to serve on these committees. For example, Paul Braun is a
member of the MRA/CMOR committees on response rate improvement and in launching
a seal of quality for the industry. He has served as President of the New Jersey Chapter of
AAPOR, and he is currently serving on AMEC in North America.
Braun Research is a well-respected firm employing techniques and standards approved by
various survey research academic organizations and other affiliations including those with
whom Braun is an active member, including AAPOR (The American Association for Public
Opinion Research) and MRA/CMOR (Market Research Association/Council on Marketing
and Opinion Research) and CASRO (Council on American Survey Research Organizations).
84 | www.edchoice.org
About the Survey Sponsor and Developer
The Friedman Foundation for Educational Choice
The Friedman Foundation for Educational Choice is a 501(c)(3) nonprofit and
nonpartisan organization, solely dedicated to advancing Milton and Rose Friedman’s
vision of school choice for all children. First established as the Milton and Rose D.
Friedman Foundation in 1996, the Foundation continues to promote school choice as
the most effective and equitable way to improve the quality of K–12 education in
America. The Foundation is dedicated to research, education, and outreach on the vital
issues and implications related to choice in K–12 education.
Commitment to Methods & Transparency
The Friedman Foundation for Educational Choice is committed to research that adheres
to high scientific standards, and matters of methodology and transparency are taken
seriously at all levels of our organization. We are dedicated to providing high-quality
information in a transparent and efficient manner.
All individuals have opinions, and many organizations (like our own) have specific
missions or philosophical orientations. Scientific methods, if used correctly and
followed closely in well-designed studies, should neutralize these opinions and
orientations. Research rules and methods minimize bias. We believe rigorous
procedural rules of science prevent a researcher’s motives, and an organization’s
particular orientation, from pre-determining results. If research adheres to proper
scientific and methodological standards, its findings can be relied upon no matter who
has conducted it. If rules and methods are neither specified nor followed, then the biases
of the researcher or an organization may become relevant, because a lack of rigor opens
the door for those biases to affect the results. Our authors take full responsibility for
research design, analysis, charts, and any unintentional errors or misrepresentations.
They welcome any and all questions related to methods and findings.

85 | www.edchoice.org
SECTION III Survey Questions
& Topline Results

2015 Schooling in America Survey Questions and Topline Results
Interview Dates: April 22 to May 12, 2015
Sample Frame & Method: Dual Frame; Probability Sampling; Random Digit Dial (RDD)
Population Sample: National sample of adults (age 18+) living in the 50 U.S. States and District of Columbia
Sample Size: National/General Public, N = 1,002
Margins of Error: National/General Public = ± 3.1 percentage points
Displayed numbers in tables are percentages, unless otherwise noted.
Due to rounding, percentage totals for a given question may be slightly greater or less than 100%.
Hello, I am _____ calling for BR Interviewing in Princeton, New Jersey. We are conducting a telephone opinion survey and would like to know your opinions on some important issues. We are not selling anything or asking for donations. May I please speak to the youngest male aged 18 or over? [IF NO MALE, ASK:] May I please speak to the youngest female aged 18 or over? S1. Are you under 18 years old , OR are you 18 or older?
1) Under 18 2) 18 or older 9) DK/RF
“For this brief interview, if you are completely unsure about your answer or have no feelings for an answer, you can say ‘I Don’t Know.’” [ENTER AS “DK”]

D1. [CODE FOR REGION - UNWEIGHTED]
Northeast Midwest South West
TOTAL 18.8 21.3 36.9 23.1
D2. [CODE GENDER OF RESPONDENT; DO NOT ASK, UNLESS GENDER IS IN QUESTION - UNWEIGHTED]
Male Female
TOTAL 49.5 50.5
1. Which of the following do you see as the most important issue facing the country right now?
[RANDOMIZE RESPONSES 1-9 TO AVOID BIAS]
[IF DEPENDS, PROBE ONCE. IF STILL DEPENDS, ENTER AS “DK”]
Crime Economy
& Jobs Education Environment Healthcare Housing Immigration
Values Issues
Taxes
TOTAL 10 31 17 5 13 2 7 5 4

2. Are you currently the parent or guardian of a child who lives with you, and who is in any grade from preschool through high school?
[IF NEEDED: IF CHILD IS CURRENTLY ENROLLED OR ENTERING PRESCHOOL IN THE UPCOMING SCHOOL YEAR, ENTER "YES"] [IF NEEDED: IF YOUNGEST CHILD JUST GRADUATED IN 2015, ENTER "NO"] [IF DEPENDS, PROBE ONCE. IF STILL DEPENDS, ENTER AS “DK”]
Yes No
< PK No
> HS No Children
DK/Ref (VOL.)
TOTAL 28 3 19 50 < 1
3. (If Q2 = 1) How many of your children (or grandchildren) attend a:
Regular Public School
(or District School) Public Charter School Private School
TOTAL (% answering ≥ 1) 84 7 12

4. (If Q2 = 3) How many of your children (or grandchildren) attended a:
Regular Public School
(or District School) Public Charter School Private School
TOTAL (% answering ≥ 1) 84 7 20
5. In the United States, do you feel things in K–12 education are generally going in the right direction, or do you feel things have generally gotten off on the wrong track? [IF DEPENDS, PROBE ONCE. IF STILL DEPENDS, ENTER AS “DK”]
Right
Direction Wrong Track
DK/Ref (VOL.)
TOTAL 32 60 8
6. Generally speaking, how would you rate the federal government’s handling of matters in K–12 Education?
[IF DEPENDS, PROBE ONCE. IF STILL DEPENDS, ENTER AS “DK”]
Excellent Good Fair Poor DK/Ref (VOL.)
TOTAL 2 18 40 37 3

7. How much do you think is spent per year on each student in our country’s public schools? Your estimate (to the nearest thousand dollars) will represent the combined expenditures of local, state, and federal governments.
[OPEN-END. BASED ON RESPONSE, SELECT ONE OF THE FOLLOWING CATEGORIES] [IF DEPENDS, PROBE ONCE, OFFERING RANGE CATEGORIES. IF STILL DEPENDS, ENTER AS "DK"]
Less than
$4,000 $4,001 – $8,000
$8,001 – $12,000
$12,001 – $16,000
Over $16,000
DK/Ref (VOL.)
TOTAL 21 23 14 7 12 24
[RANDOMLY ASSIGN QUESTIONS 8A AND 8B]
8. (Split A) Do you believe that public school funding in the United States is at a level that is:
[ROTATE “TOO HIGH” AND “TOO LOW”]
[IF DEPENDS, PROBE ONCE. IF STILL DEPENDS, ENTER AS “DK”]
Too High About Right Too Low DK/Ref (VOL.)
TOTAL 11 22 60 8

8. (Split B) According to the most recent information available, in the United States $10,677 is being spent each year per student attending public schools. Do you believe that public school funding in TOTAL is at a level that is: [ROTATE “TOO HIGH” AND “TOO LOW”] [IF DEPENDS, PROBE ONCE. IF STILL DEPENDS, ENTER AS “DK”]
Too High About Right Too Low DK/Ref (VOL.)
TOTAL 11 33 49 7
9. In thinking about the schools in your area, what grade would you give…
[GRADE OPTIONS: A, B, C, D, or F] [ROTATE “REGULAR PUBLIC SCHOOLS,” “CHARTER SCHOOLS,” “PRIVATE OR PAROCHIAL SCHOOLS”] [IF DEPENDS, PROBE ONCE. IF STILL DEPENDS, ENTER AS “DK”]
TOTAL A B C D F DNA/DK/Ref
(VOL.)
Regular Public Schools 11 32 32 12 7 6
Charter Schools 10 26 13 5 3 33
Private Schools 24 34 8 3 1 31

10. If it were your decision and you could select any type of school, what type of school would you select in order to obtain the best education for your child?
[RANDOMIZE RESPONSES TO AVOID BIAS] [IF DEPENDS, PROBE ONCE. IF STILL DEPENDS, ENTER AS “DK”]
Charter School
Homeschool Private School
Regular Public School
DK/Ref (VOL.)
TOTAL 12 9 41 36 3

11. What is the most important characteristic or attribute that would cause you to
choose a [INSERT SCHOOL TYPE FROM PREVIOUS QUESTION] for your child? Please use one word, or a very short phrase.
[OPEN-END. IF DEPENDS, PROBE ONCE. IF STILL DEPENDS, ENTER AS “DK”] Top 10 | Specific impressions offered by respondents in the national sample. Numbers represent counts (n), not percentages.
BETTER EDUCATION / QUALITY 162
BETTER TEACHERS / TEACHERS / TEACHING 109
INDIVIDUAL ATTENTION / ONE-ON-ONE 109
ACADEMICS / CURRICULUM 75
CLASS SIZE / STUDENT-TEACHER RATIO 69
SOCIALIZATION / PEERS / OTHER KIDS 65
DISCIPLINE / STRUCTURE 63
DIVERSITY / VARIETY 59
ENVIRONMENT / CULTURE / COMMUNITY 53
STANDARDS / MORE CHALLENGING 48
SOURCE: Friedman Foundation for Educational Choice, 2015 Schooling in America Survey , Q11.

“For the remainder of this interview, if you are completely unsure about your answer or have no feelings for an answer, feel free to say ‘I Don’t Know.’” [ENTER AS “DK”]
12. Based on what you know, or have heard from others… In general, do you favor or oppose “charter schools”?
[PROBE:] Would you say strongly or somewhat favor/oppose? [IF DEPENDS, PROBE ONCE. IF STILL DEPENDS, ENTER AS “DK”]
Strongly
Favor Somewhat
Favor Somewhat
Oppose Strongly Oppose
DK/Ref (VOL.)
TOTAL 17 25 12 9 37
13. Charter schools are public schools that have more control over their own budget, staff, and curriculum, and are exempt from many existing public school regulations. In general, do you favor or oppose charter schools? [PROBE:] Would you say strongly or somewhat favor/oppose?
[IF DEPENDS, PROBE ONCE. IF STILL DEPENDS, ENTER AS “DK”]
Strongly
Favor Somewhat
Favor Somewhat
Oppose Strongly Oppose
DK/Ref (VOL.)
TOTAL 21 32 16 12 19

14. Based on what you know, or have heard from others… In general, do you favor or oppose “school vouchers”?
[PROBE:] Would you say strongly or somewhat favor/oppose? [IF DEPENDS, PROBE ONCE. IF STILL DEPENDS, ENTER AS “DK”]
Strongly
Favor Somewhat
Favor Somewhat
Oppose Strongly Oppose
DK/Ref (VOL.)
TOTAL 19 20 10 15 36
15. A school voucher system allows parents the option of sending their child to the school of their choice, whether that school is public or private, including both religious and non-religious schools. If this policy were adopted, tax dollars currently allocated to a school district would be allocated to parents in the form of a “school voucher” to pay partial or full tuition for their child’s school. In general, do you favor or oppose a school voucher system? [PROBE:] Would you say strongly or somewhat favor/oppose? [IF DEPENDS, PROBE ONCE. IF STILL DEPENDS, ENTER AS “DK”]
Strongly
Favor Somewhat
Favor Somewhat
Oppose Strongly Oppose
DK/Ref (VOL.)
TOTAL 34 27 12 21 7

16. [IF Q15 = “Strongly Favor” OR “Somewhat Favor”] What is the most important reason you say you favor school vouchers? Is your main reason that such a system provides:
[RANDOMIZE RESPONSES 1 to 5, TO AVOID BIAS] [IF DEPENDS, PROBE ONCE. IF STILL DEPENDS, ENTER AS “DK”]
TOTAL
Access to Religious Schools 6
Access to Safer Schools 6
Access to Schools Having Better Academics 38
Access to Schools Providing More Individual Attention 17
More Freedom and Flexibility for Parents 28
(Something Else/Other) 3
DK/Ref (VOL.) 2

17. [IF Q15 = “Strongly Oppose” OR “Somewhat Oppose”] What is the most important reason you say you oppose school vouchers? Is your main reason that such a system would:
[RANDOMIZE RESPONSES 1 to 5, TO AVOID BIAS] [IF DEPENDS, PROBE ONCE. IF STILL DEPENDS, ENTER AS “DK”]
TOTAL
Benefit Unaccountable Private Schools 7
Cause Fraudulent Behavior 9
Cause Student Transportation Problems 6
Divert Funding Away from Public Schools 57
Send Funding to Religious Schools 4
(Something Else/Other) 12
DK/Ref (VOL.) 5

18. Thinking ahead to the next election, if a candidate for Governor, State Senate, or State Representative supports school vouchers, would that make you more likely to vote for him or her, less likely, or make no difference whatsoever in your voting?
[IF DEPENDS, PROBE ONCE. IF STILL DEPENDS, ENTER AS “DK”]
More Likely No Difference Less Likely DK/Ref (VOL.)
TOTAL 29 45 21 5
19. An "education savings account" – often called an ESA – allows parents to take their child out of a public district or charter school, and receive a payment into a government-authorized savings account with restricted, but multiple uses. Parents can then use these funds to pay for private school tuition, tutoring, online education programs, special needs therapies, or save for future college expenses. In general, do you favor or oppose this kind of “savings account system”? [PROBE:] Would you say strongly or somewhat favor/oppose? [IF DEPENDS, PROBE ONCE. IF STILL DEPENDS, ENTER AS “DK”]
Strongly
Favor Somewhat
Favor Somewhat
Oppose Strongly Oppose
DK/Ref (VOL.)
TOTAL 32 29 12 16 11

[RANDOMLY ASSIGN QUESTIONS 20A AND 20B]
20. (Split A) Some people believe that education savings accounts should be available to all families, regardless of incomes and special needs. Do you agree or disagree with that statement? [PROBE:] Would you say strongly or somewhat agree/disagree? [IF DEPENDS, PROBE ONCE. IF STILL DEPENDS, ENTER AS “DK”]
Strongly
Agree Somewhat
Agree Somewhat Disagree
Strongly Disagree
DK/Ref (VOL.)
TOTAL 45 21 11 16 7
20. (Split B) Some people believe that education savings accounts should only be available to families based on
financial need. Do you agree or disagree with that statement? [PROBE:] Would you say strongly or somewhat agree/disagree? [IF DEPENDS, PROBE ONCE. IF STILL DEPENDS, ENTER AS “DK”]
Strongly
Agree Somewhat
Agree Somewhat Disagree
Strongly Disagree
DK/Ref (VOL.)
TOTAL 17 19 23 33 9

21. Thinking ahead to the next election, if a candidate for Governor, State Senate, or State Representative supports education savings accounts, would that make you more likely to vote for him or her, less likely, or make no difference whatsoever in your voting?
[IF DEPENDS, PROBE ONCE. IF STILL DEPENDS, ENTER AS “DK”]
More Likely No Difference Less Likely DK/Ref (VOL.)
TOTAL 30 53 14 3
22. A “tax credit” allows an individual or business to reduce the final amount of a tax owed to government. Some states give tax credits to individuals and businesses if they contribute money to nonprofit organizations that distribute private school scholarships. A “tax-credit scholarship system” allows parents the option of sending their child to the school of their choice, whether that school is public or private, including both religious and non-religious schools. In general, do you favor or oppose a tax-credit scholarship system? [PROBE:] Would you say strongly or somewhat favor/oppose? [IF DEPENDS, PROBE ONCE. IF STILL DEPENDS, ENTER AS “DK”]
Strongly
Favor Somewhat
Favor Somewhat
Oppose Strongly Oppose
DK/Ref (VOL.)
TOTAL 28 32 13 16 11

“Now we have some questions about a couple other education issues in the news.”
23. When thinking about standardized assessments and tests… How much time do you think a typical American student spends in a school year on preparing for standardized tests and taking these tests? Your estimate, in school days, will reflect total time for the state test and any additional standardized tests administered by the district or school.
[OPEN-END. BASED ON RESPONSE, SELECT ONE OF THE FOLLOWING CATEGORIES] [IF DEPENDS, PROBE ONCE, OFFERING RANGE CATEGORIES. IF STILL DEPENDS, ENTER AS "DK"]
5 or Less 6 to 10 11 to 15 16 or More DK/Ref (VOL.)
TOTAL 13 16 12 43 16
24. Do you believe the amount of time spent on standardized testing in American schools is:
[ROTATE “TOO HIGH” AND “TOO LOW”]
[IF DEPENDS, PROBE ONCE. IF STILL DEPENDS, ENTER AS “DK”]
Too High About Right Too Low DK/Ref (VOL.)
TOTAL 42 31 20 9

25. We would now like to ask what you believe state government should do to intervene – if at all – in low-performing school districts and schools.” On a scale from 1 to 5, please rate how useful each one of the following actions would be to affected students and families in a low-performing school? A “1” would reflect a LEAST useful action. A “5” would reflect a MOST useful action.
[RANDOMIZE RESPONSES 1 to 4, TO AVOID BIAS] [IF DEPENDS, PROBE ONCE. IF STILL DEPENDS, ENTER AS “DK”]
TOTAL
% “4” + “5”
Convert the district school to a public charter school 26
Dismiss and replace the school principal, teachers, and staff 25
Close the school and reassign students to a nearby district school 18
Supply a voucher, scholarship, or ESA to affected parents to enroll their child in another school, either private or public, regardless of location
41

26. Based on what you know, or have heard from others… In general, do you favor or oppose “the Common Core State Standards” in K-12 education? [PROBE:] Would you say strongly or somewhat favor/oppose? [IF DEPENDS, PROBE ONCE. IF STILL DEPENDS, ENTER AS “DK”]
Strongly
Favor Somewhat
Favor Somewhat
Oppose Strongly Oppose
DK/Ref (VOL.)
TOTAL 15 25 15 24 22
27. The objective of the Common Core State Standards Initiative is to establish similar academic standards and comparable tests across all states for students in grades K-12. The standards were initially developed by the National Governors Association and Council of Chief State School Officers. States and districts have adopted the common standards and tests in association with U.S. Department of Education incentives. In general, do you favor or oppose the “Common Core”? [PROBE:] Would you say strongly or somewhat favor/oppose? [IF DEPENDS, PROBE ONCE. IF STILL DEPENDS, ENTER AS “DK”]
Strongly
Favor Somewhat
Favor Somewhat
Oppose Strongly Oppose
DK/Ref (VOL.)
TOTAL 16 34 16 25 9

28. Thinking ahead to the next election, if a candidate for Governor, State Senator, or Representative supports the Common Core, would that make you more likely to vote for him or her, less likely, or make no difference whatsoever in your voting? [IF DEPENDS, PROBE ONCE. IF STILL DEPENDS, ENTER AS “DK”]
More Likely No Difference Less Likely DK/Ref (VOL.)
TOTAL 18 54 23 5
[RANDOMLY ASSIGN QUESTIONS 29A AND 29B]
29. (Split A) How influential to you is a teachers’ union endorsement of a candidate running for state office like Governor, State Senator, or State Representative? [PROBE:] Would you say strong or modest positive/negative? [IF DEPENDS, PROBE ONCE. IF STILL DEPENDS, ENTER AS “DK”]
Strong
Positive Modest Positive
Does Not Matter
Modest Negative
Strong Negative
DK/Ref (VOL.)
TOTAL 18 28 19 11 15 9

29. (Split B) How influential to you is a parent advocacy organization endorsement of a candidate running for state office like Governor, State Senator, or State Representative? [PROBE:] Would you say strong or modest positive/negative? [IF DEPENDS, PROBE ONCE. IF STILL DEPENDS, ENTER AS “DK”]
Strong
Positive Modest Positive
Does Not Matter
Modest Negative
Strong Negative
DK/Ref (VOL.)
TOTAL 15 34 25 11 5 10
“Now the following questions should be pretty quick, and for statistical purposes only.…”
30. Generally speaking, do you usually consider yourself a Republican, a Democrat, an Independent, or something else? [Code for Democrat, Republican, Independent, Libertarian, Other, or “DK”]
[IF DEPENDS, PROBE ONCE. IF STILL DEPENDS, ENTER AS “DK”]
Democrat Republican Independent Other Libertarian
(VOL.) DK/Ref (VOL.)
TOTAL 336 25 25 9 < 1 4

31. (ASK IF Q30 = INDEPEDNDENT/LIBERTARIAN/OTHER/DK/REF) As of today do you lean more to the Republican Party or more to the Democratic Party?
[IF DEPENDS, PROBE ONCE. IF STILL DEPENDS, ENTER AS “DK”]
Democrat Republican No Preference
(VOL.) DK/Ref (VOL.)
TOTAL 32 29 25 14
32. How would you best describe where you live? [IF DEPENDS, PROBE ONCE. IF STILL DEPENDS, ENTER AS “DK”]
Urban Suburban Small Town Rural DK/Ref (VOL.)
TOTAL 23 37 24 14 2

33. Which of the following age categories do you fall in?
[OPEN END, THEN CODE TO AGE CATEGORY]
18 to 34 35 to 54 55 & Over DK/Ref (VOL.)
TOTAL 30 37 32 1
34. Are you, yourself, of Hispanic or Latino origin, such as Mexican, Puerto Rican, Cuban, or some other Spanish background?
[IF DEPENDS, PROBE ONCE. IF STILL DEPENDS, ENTER AS “DK”]
Hispanic Not Hispanic DK/Ref (VOL.)
TOTAL 14 85 < 1

35. Which of the following best describes your race? [IF DEPENDS, PROBE ONCE. IF STILL DEPENDS, ENTER AS “DK”]
American Indian, Native American
Asian, Pacific Islander, Asian American
Black, African American
Mixed Race
White Other DK/Ref (VOL.)
TOTAL 1 5 12 3 74 4 2
36. Please stop me when I read the category that best describes your current annual household income, before taxes? [IF DEPENDS, PROBE ONCE. IF STILL DEPENDS, ENTER AS “DK”]
Under
$40,000 $40,000 to
$79,999 $80,000 & Over
DK/Ref (VOL.)
TOTAL 33 30 26 12
[PLEASE MAKE THE FOLLOWING TEXT AVAILABLE TO INTERVIEWERS ANYTIME A RESPONDENT ASKS ABOUT THE NATURE OF THE SURVEY SPONSOR OR FRIEDMAN FOUNDATION]
The Friedman Foundation for Educational Choice is an independent, nonprofit, nonpartisan research organization that studies attitudes toward K–12 education issues facing the states and the country. The Foundation has no connection to the government, political parties, or any campaigns. Reports about its surveys are made available free of charge on their website EdChoice dot ORG.