©2015 rsm us llp. all rights reserved....probability 33% q1'18 q2'18 q3'18...
TRANSCRIPT

©2015 RSM US LLP. All Rights Reserved. ©2015 RSM US LLP. All Rights Reserved.

©2015 RSM US LLP. All Rights Reserved. ©2015 RSM US LLP. All Rights Reserved.
US ECONOMIC OUTLOOK: ECONOMIC DECELERATION AMIDST OUTBREAK OF TRADE WAR
Joseph BrusuelasChief Economist RSM US LLP
August 2019
©2015 RSM US LLP. All Rights Reserved.
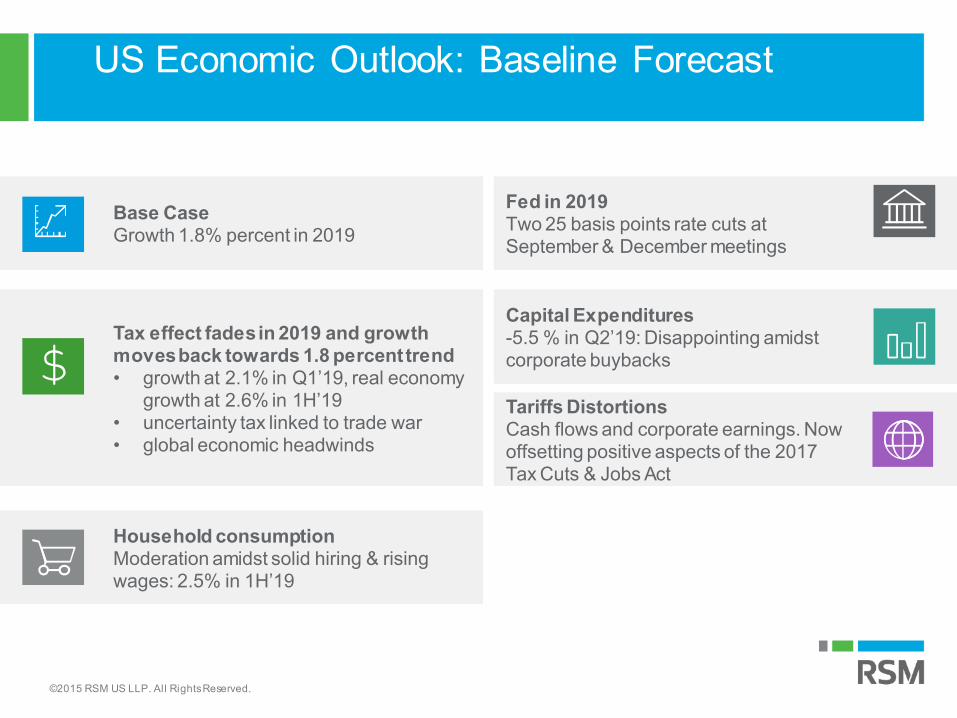
Base CaseGrowth 1.8% percent in 2019
Capital Expenditures-5.5 % in Q2’19: Disappointing amidst corporate buybacks
Tax effect fades in 2019 and growth moves back towards 1.8 percent trend• growth at 2.1% in Q1’19, real economy
growth at 2.6% in 1H’19• uncertainty tax linked to trade war• global economic headwinds
Tariffs DistortionsCash flows and corporate earnings. Now offsetting positive aspects of the 2017 Tax Cuts & Jobs Act
Household consumptionModeration amidst solid hiring & rising wages: 2.5% in 1H’19
Fed in 2019Two 25 basis points rate cuts at September & December meetings
US economic outlook
US Economic Outlook: Baseline Forecast

©2015 RSM US LLP. All Rights Reserved.
World’s largest economy but concentrated …

©2015 RSM US LLP. All Rights Reserved.
Rise of tech: market cap and brand value Number of employees
5
Source: Future of work book and HowMuchwebsite

©2015 RSM US LLP. All Rights Reserved.
75% of Venture Capital goes into the SF, NY, Boston or LA.$75B into 3,200 TMT companies in NY in the last 5 years.
6

©2015 RSM US LLP. All Rights Reserved.
Venture Capital investment maintains momentum from 2018.2Q marks sixth straight quarter with over $25B deployed.
7

©2015 RSM US LLP. All Rights Reserved.
First half of 2019 sets VC exit record.
8
• 34 venture-backed IPOs that pushed exit value to a record $138.3 Billion. • Including M&A activity, total venture-backed exit value for the first half of 2019 reached $188.5 billion,
eclipsing every full-year total on record.

©2015 RSM US LLP. All Rights Reserved.
2019 PE deals sees some signs of slowing in the first half of 2019 on the back of a record year last year. There is still $1.3 T in dry powder.
9

©2015 RSM US LLP. All Rights Reserved.
Private equity exit activity slows in 1H of 2019
10

©2015 RSM US LLP. All Rights Reserved.
2019 TMT IPO returns since public debut (through Aug 13)
11

©2015 RSM US LLP. All Rights Reserved.
12
90% of startups say finding skilled workers is challenging, compared with about 75% who say fundraising is a challenge.
2019 Startup Outlook report

©2015 RSM US LLP. All Rights Reserved.
Financial Conditions
• Narrower margins, volatility & rising wages• Equity valuations and volatility concern
• Volatility a proxy for disrupted cash flows due to trade policy• Corporate profits likely peaked following tax cuts• How to value companies with global supply chains
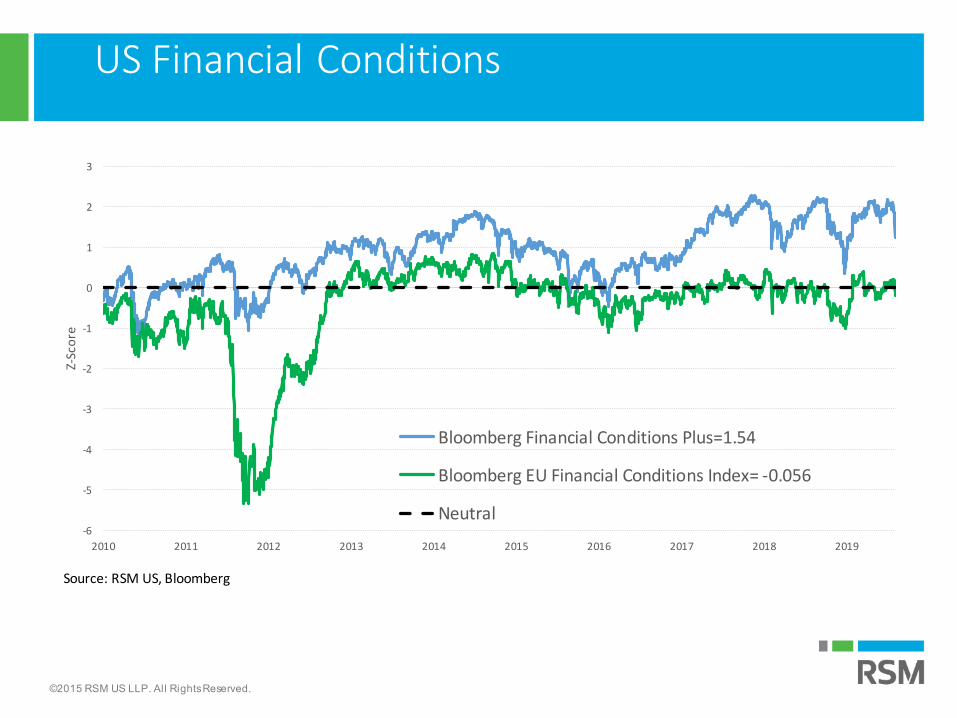
• Global financial conditions a net positive for growth• US financial conditions 1.89, -0.23 standard deviation above/below
neutral• Financial conditions important to watch given risk linked to trade policy• Risk of negative nominal yields should trade & financial conflict intensify
• Rate Drivers• Fed to cut rates by an additional 50 basis points in 2019
• Long term rates range between 1.50 percent and 1.75 percent in 2019. • Expect rising volatility
• US risk premium still negative
©2015 RSM US LLP. All Rights Reserved.
US Financial Conditions
-6
-5
-4
-3
-2
-1
0
1
2
3
2010 2011 2012 2013 2014 2015 2016 2017 2018 2019
Z-Sc
ore
Bloomberg Financial Conditions Plus=1.54
Bloomberg EU Financial Conditions Index= -0.056
Neutral
Source: RSM US, Bloomberg

©2015 RSM US LLP. All Rights Reserved.
US Yield Curve: Nominal
1.00
1.50
2.00
2.50
3.00
3.50
4.00
0 5 10 15 20 25 30
Yiel
d (%
)
Maturity
Changes in the U.S. Treasury yield curve since Q4 2018 Treasury yields as of November 7, 2018 and August 15, 2019
11/7/18 8/19/19
5-year yield
10-yearyield
Source: Bloomberg; RSM US
2-year yield
30-year yield

©2015 RSM US LLP. All Rights Reserved.
US Yield Curve: Real
-0.40
-0.20
0.00
0.20
0.40
0.60
0.80
1.00
1.20
0 5 10 15 20 25 30
Yiel
d (%
)
Maturity
Changes in the Real (inflation-adjusted) U.S. Treasury yield curve since Q4 2018 Treasury yields less inflation as of Nov. 7, 2018 and Aug. 15, 2019
11/7/18 Today zero
5-year yield
10-yearyield
Source: Bloomberg; RSM US
2-year yield
30-year yield

©2015 RSM US LLP. All Rights Reserved.
Yield Curve Inversion: Policy Sensitive Curve
©2015 RSM US LLP. All Rights Reserved.
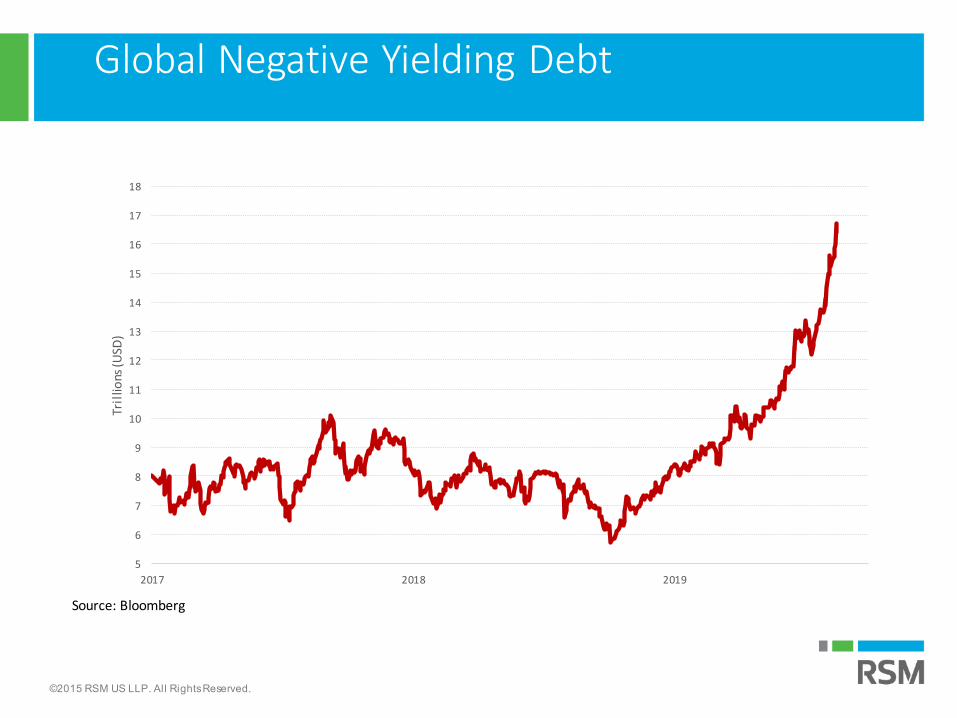
Global Negative Yielding Debt
5
6
7
8
9
10
11
12
13
14
15
16
17
18
2017 2018 2019
Tril
lions
(USD
)
Source: Bloomberg
©2015 RSM US LLP. All Rights Reserved.
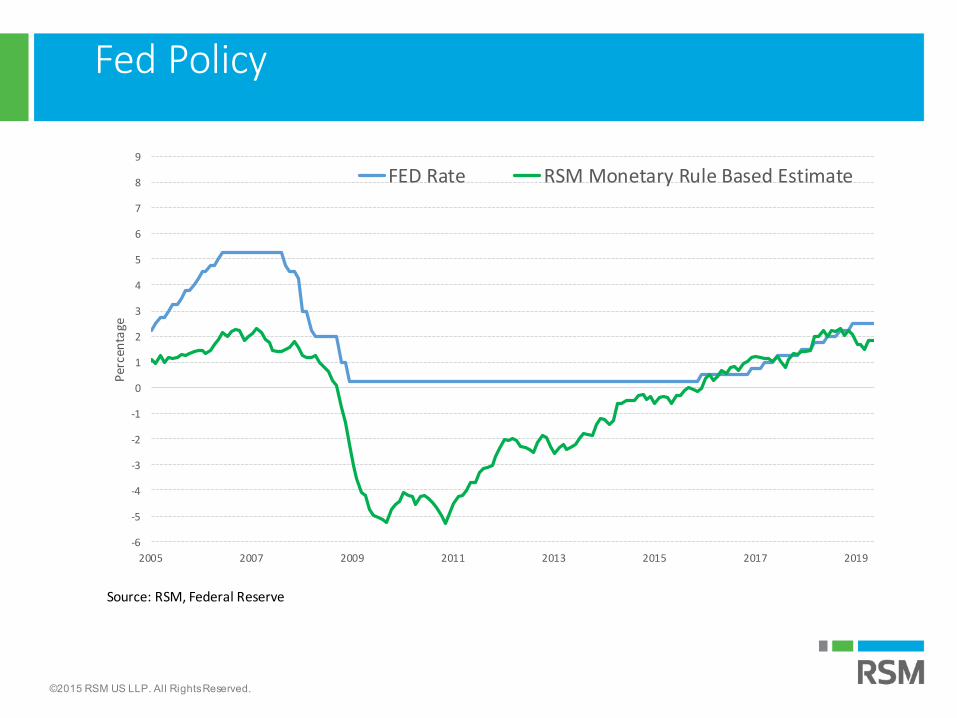
Fed Policy
-6
-5
-4
-3
-2
-1
0
1
2
3
4
5
6
7
8
9
2005 2007 2009 2011 2013 2015 2017 2019
Per
cen
tage
FED Rate RSM Monetary Rule Based Estimate
Source: RSM, Federal Reserve

©2015 RSM US LLP. All Rights Reserved.
US Economic Outlook
• Primary Themes• Growth Deceleration
• Topline 2.1%• Real final private demand at 2.65%• Growth & 2017 Tax Cut Peaked Q3’18
• GDP Decelerating towards 1.8% in 2019 and 1.4 in 2020• Recession risk rising: 2H’20• Recession probability 33%
• Employment growth slowing• Fed to Cut Rates by additional 50 basis points in 2019
• Ten year yield to trade between 1.50% and 1.75%• Yield Curve Inverted
• Inflation to move back towards 2% in 2019 and above in 2020• Deflation now a greater risk over medium to long term
• Risks to the Economic Outlook• Trade Wars• Corporate Debt Levels• Global Growth

©2015 RSM US LLP. All Rights Reserved.
Economic Growth
0
10
20
30
40
50
60
70
80
90
100
-6
-4
-2
0
2
4
6
8
10
1969 1974 1979 1984 1989 1994 1999 2004 2009 2014 2019
Real
GDP
(YO
Y %
)Real GDP growth at the end of economic booms/recoveries
Recession Real GDP by expenditure (YOY %) One
Source: BEA; NBER; Bloomberg; RSM US
1% GDPGrowth Threshold
Recovery from the Great Recession
Dot.com Boom Housing Boom
Reagan/Bush
Boom
Post-Vietnam Boom
Post-Oil Crisis Boom
©2015 RSM US LLP. All Rights Reserved.
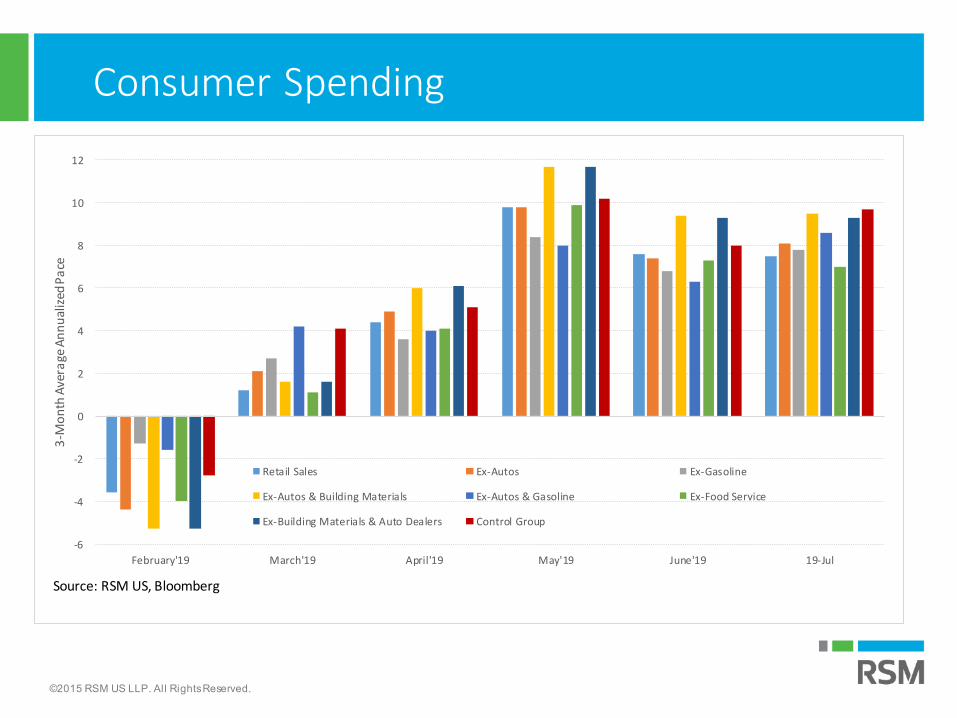
Consumer Spending
-6
-4
-2
0
2
4
6
8
10
12
February'19 March'19 April'19 May'19 June'19 19-Jul
3-M
on
th A
vera
ge A
nn
ual
ized
Pa
ce
Retail Sales Ex-Autos Ex-Gasoline
Ex-Autos & Building Materials Ex-Autos & Gasoline Ex-Food Service
Ex-Building Materials & Auto Dealers Control Group
Source: RSM US, Bloomberg

©2015 RSM US LLP. All Rights Reserved.
Growth Contribution: By Sector
-4
-3
-2
-1
0
1
2
3
4
5
6
2011 2012 2013 2014 2015 2016 2017 2018 2019
(QO
Q %
, SAA
R) (4
-qtr
mov
avg
)
Contributions to GDP growth by sectorGDP national accounts during the 2011-19 recovery period
Personal consumption Government consumption Investment Net Exports
Obama Administration
TrumpAdministration
Source: BEA; Bloomberg; RSM US

©2015 RSM US LLP. All Rights Reserved.
Economy Decelerates: Trade War
-4
-2
0
2
4
6
8
10
12
2011 2012 2013 2014 2015 2016 2017 2018 2019
(QO
Q %
, SAA
R) (4
-qtr
mov
avg
)
Growth of Exports and ImportsGDP national accounts during the 2011-19 recovery period
GDP Exports Imports
ObamaAdministration
TrumpAdministration
Source: BEA; Bloomberg; RSM US

©2015 RSM US LLP. All Rights Reserved.
Economy Decelerates: Trade War & Investment
-10
-5
0
5
10
15
20
25
30
2011 2012 2013 2014 2015 2016 2017 2018 2019
(QO
Q %
, SAA
R) (4
-qtr
mov
avg
)
Components of Investment GrowthGDP national accounts during the 2011-19 recovery period
Investment Residential Non-residential
ObamaAdministration
TrumpAdministration
Source: BEA; Bloomberg; RSM US

©2015 RSM US LLP. All Rights Reserved.
Economy Decelerates: US Consumer to the Rescue
-2
-1
0
1
2
3
4
5
6
2011 2012 2013 2014 2015 2016 2017 2018 2019
(QO
Q %
, SAA
R) (4
-qtr
mov
avg
)
Components of growth of personal consumption: goods & serv icesGDP national accounts during the 2011-19 recovery period
Personal consumption Goods Services
ObamaAdministration
TrumpAdministration
Source: BEA; Bloomberg; RSM US

©2015 RSM US LLP. All Rights Reserved.
Economy Decelerates: US Consumer to the Rescue
-2
0
2
4
6
8
10
12
2011 2012 2013 2014 2015 2016 2017 2018 2019
(QO
Q %
, SAA
R) (4
-qtr
mov
avg
)
Components in growth of consumption of goods: durables/non-durablesGDP national accounts during the 2011-19 recovery period
Goods Durables Non-durables
ObamaAdministration
TrumpAdministration
Source: BEA; Bloomberg; RSM US

©2015 RSM US LLP. All Rights Reserved.
The RSM US Middle Market Business Index increased to 132.3, rebounded significantly from 124.1 in the first quarter.
28
MIDDLE MARKET BUSINESS INDEX
123.8121.4
114.5 116.6119.8
115.6120.1
129.8132.1
125.7
132.2
136.7134.5134.4
132.0
124.1
132.3
80
85
90
95
100
105
110
115
120
125
130
135
140
Q2‘15 Q3‘15 Q4‘15 Q1‘16 Q2‘16 Q3‘16 Q4‘16 Q1‘17 Q2‘17 Q3‘17 Q4'17 Q1'18 Q2'18 Q3'18 Q4'18 Q1'19 Q2'19
PES
SIM
ISM
OP
TIM
ISM

©2015 RSM US LLP. All Rights Reserved.
US Growth Forecast 2018-2020
Recession Probability 33% Q1'18 Q2'18 Q3'18 Q4'18 Q1'19 Q2'19 Q3'19 Q4'19 Q1'20 Q2'20
Real GDP Q/Q 2.2 4.2 2.9 1.1 3.1 2.1 2.1 2 1.9 1.8
Unemployment 4.1 3.9 3.8 3.8 3.9 3.7 3.7 3.7 3.8 3.8
CPI 2.2 2.7 2.6 2.2 1.7 1.8 1.9 2 2.2 2.1
PCE Core 1.8 1.9 2 1.9 1.6 1.7 1.8 1.8 1.9 2
Central Bank Rate 1.75 2 2.25 2.5 2.5 2.4 2.2 2.05 1.81 1.81
3-Month Rate 2.31 2.34 2.4 2.8 2.6 2.63 2.25 2.25 2.01 2.01
2-Year Rate 2.27 2.53 2.82 2.49 2.26 2.43 1.86 1.86 1.88 1.91
10-Year Note 2.74 2.86 3.06 2.69 2.41 2.55 2.1 1.81 1.76 1.59
EUR/USD 1.23 1.17 1.16 1.15 1.12 1.18 1.14 1.16 1.16 1.15

©2015 RSM US LLP. All Rights Reserved.
Recession Probability Rising
0%
10%
20%
30%
40%
50%
60%
70%
80%
90%
100%
1970 1975 1980 1985 1990 1995 2000 2005 2010 2015 2020
Per
cen
tage
US Recession Probability: 32.88%
Recessions
Recession Probability
Source: RSM US, New York Federal Reserve

©2015 RSM US LLP. All Rights Reserved.
Supply chain• Supply chain mapping• NAFTA/WTO tariff review• Customs declarations infrastructure• Inventory levels and working capital
Licences and regulation• Trade marks and intellectual property• Contract reviews/re-negotiation
Banking• International debt exposure• Cash management and FX exposure• International accounts and lending lines
Productivity and efficiency• Automation• Top-down review• Diversification
Macro• Geo-political risk analysis• Global risks exposure• Business structure
Budgetary• Price shocks: labour costs, supply chains• Evaluate import/export additional cost• Lead time delays• Insurance adequacy
Financial modelling/
stress testing
01
03
06
05
04
Key considerationsTalent
• Staff requirements 07
02
End of Business Cycle Considerations

©2015 RSM US LLP. All Rights Reserved.
Housing Sector
• US Housing Sector• Four Issues
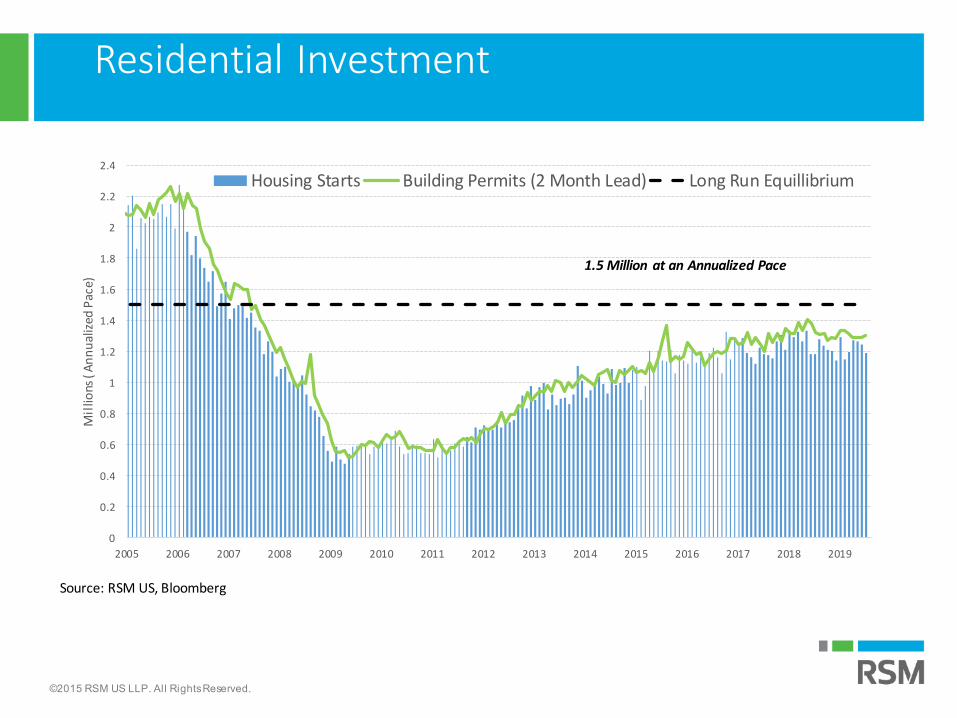
• Lack of Supply, Labor, Regulation & Affordability• Residential Investment and Sales
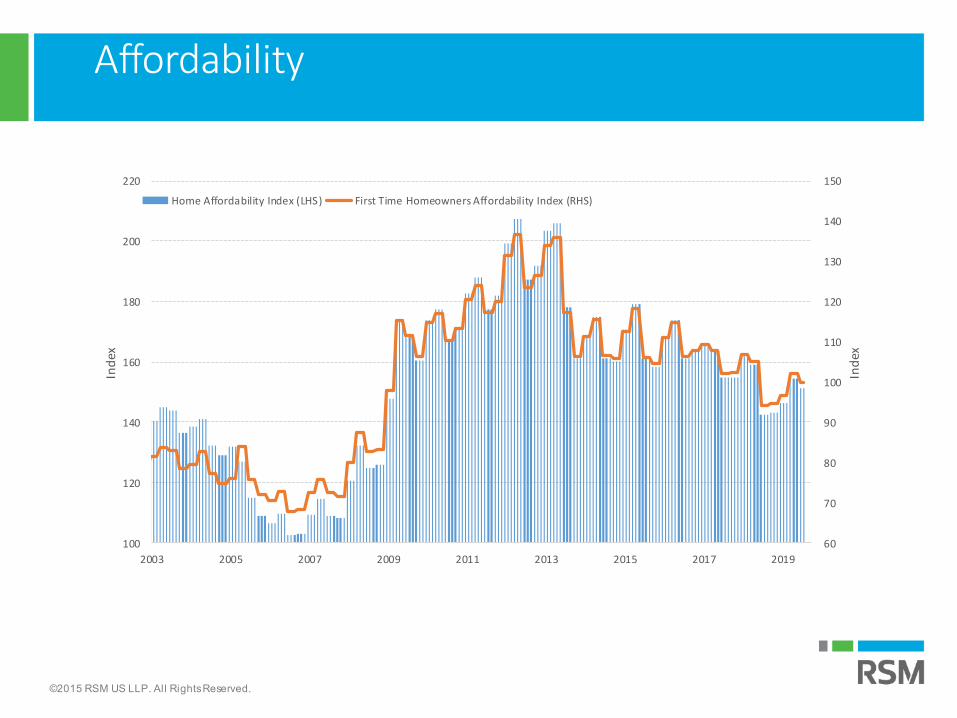
• Soft and well below long run capacity to produce• Affordability & Rates
• Still a constraint• Not expected big boost due to falling rates at this time
• Regulatory Outlook• One out of every four dollars dedicated to meeting local zoning and
ordinance • Fannie and Freddie
• Texas State and Local Conditions• Still strong• Austin-Round Rock only MSA with increasing pace of growth in
single family residencies
©2015 RSM US LLP. All Rights Reserved.
Residential Investment
0
0.2
0.4
0.6
0.8
1
1.2
1.4
1.6
1.8
2
2.2
2.4
2005 2006 2007 2008 2009 2010 2011 2012 2013 2014 2015 2016 2017 2018 2019
Mil
lions
( A
nn
ual
ized
Pac
e)
Housing Starts Building Permits (2 Month Lead) Long Run Equillibrium
Source: RSM US, Bloomberg
1.5 Million at an Annualized Pace
©2015 RSM US LLP. All Rights Reserved.
Affordability
60
70
80
90
100
110
120
130
140
150
100
120
140
160
180
200
220
2003 2005 2007 2009 2011 2013 2015 2017 2019
Ind
ex
Ind
ex
Home Affordability Index (LHS) First Time Homeowners Affordability Index (RHS)

©2015 RSM US LLP. All Rights Reserved.
Affordability
0
1
2
3
4
5
6
790
110
130
150
170
190
210
230
1999 2001 2003 2005 2007 2009 2011 2013 2015 2017 2019
Per
cen
tage
Ind
ex
Affordability Composite Index (LHS) 10-Year Yield (Percentage, RHS Inverted)
Source: RSM US, Bloomberg
©2015 RSM US LLP. All Rights Reserved.
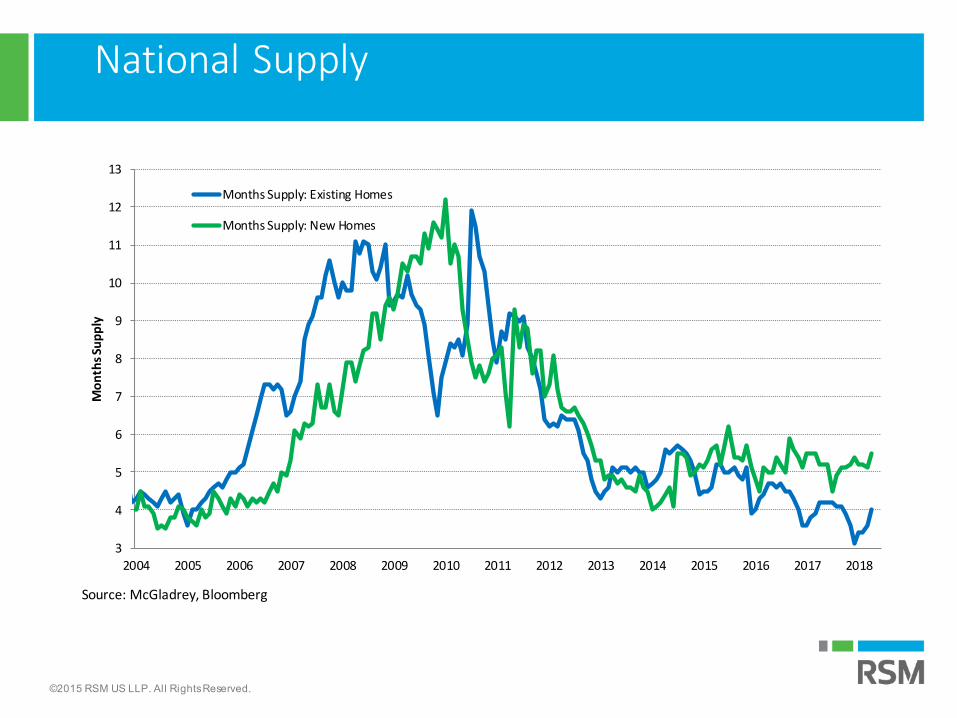
National Supply
3
4
5
6
7
8
9
10
11
12
13
2004 2005 2006 2007 2008 2009 2010 2011 2012 2013 2014 2015 2016 2017 2018
Mo
nth
s Su
pp
ly
Months Supply: Existing Homes
Months Supply: New Homes
Source: McGladrey, Bloomberg
©2015 RSM US LLP. All Rights Reserved.
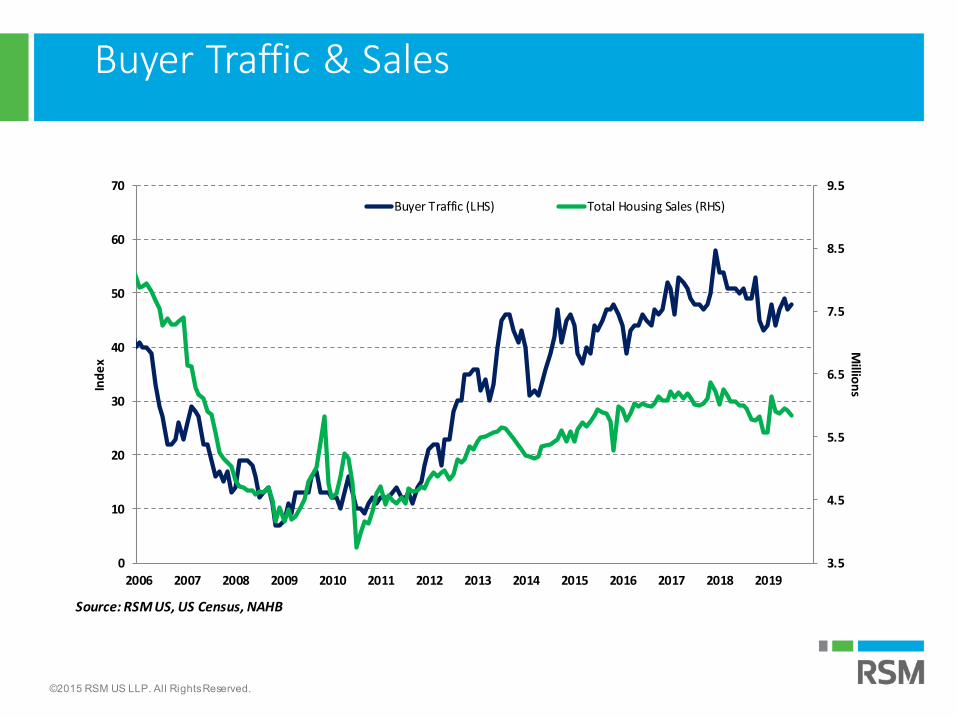
Buyer Traffic & Sales
3.5
4.5
5.5
6.5
7.5
8.5
9.5
0
10
20
30
40
50
60
70
2006 2007 2008 2009 2010 2011 2012 2013 2014 2015 2016 2017 2018 2019
Millio
nsIn
de
x
Buyer Traffic (LHS) Total Housing Sales (RHS)
Source: RSM US, US Census, NAHB

©2015 RSM US LLP. All Rights Reserved.
Homebuilder Sentiment & New Home Sales
0
0.2
0.4
0.6
0.8
1
1.2
1.4
1.6
0
10
20
30
40
50
60
70
80
90
1998 2000 2002 2004 2006 2008 2010 2012 2014 2016 2018
Mill
ion
s
Ind
ex
Homebuilders Sentiment (LHS)
New Home Sales (RHS)
Source: RSM US, Bloomberg

©2015 RSM US LLP. All Rights Reserved.
Remodeling Index
15
20
25
30
35
40
45
50
55
60
65
2003 2005 2007 2009 2011 2013 2015 2017 2019
Ind
ex
NAHB Remodeling Current Market Conditions Index
NAHB Remodeling Future Market Conditions Index
Source: National Association of Home Builders

©2015 RSM US LLP. All Rights Reserved.
Production and Manufacturing
• Industrial Production and Manufacturing• Noticeable deceleration in U.S. & global manufacturing
• Auto production & sales easing on rising rates and sagging demand
• Tariffs a risk to the sector• Global auto tariffs: Section 232
• Carries significant hit to domestic production & GDP• Equal to roughly a $100 billion tax hike
• NAFTA modernization• US ISM Manufacturing
• Softer global and domestic demand• Down -0.5% YOY
• Transportation indices flashing red• Global demand easing
• Global & US manufacturing recession in train• Collateral damage linked to U.S.-China trade spat
©2015 RSM US LLP. All Rights Reserved.
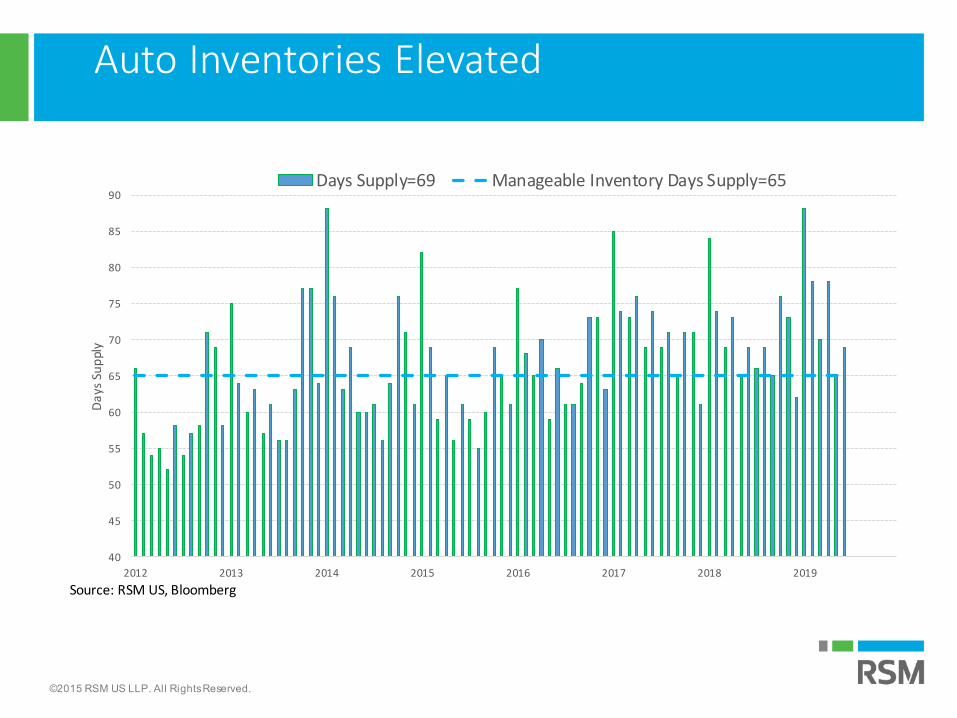
Auto Inventories Elevated
40
45
50
55
60
65
70
75
80
85
90
2012 2013 2014 2015 2016 2017 2018 2019
Da
ys S
up
ply
Days Supply=69 Manageable Inventory Days Supply=65
Source: RSM US, Bloomberg

©2015 RSM US LLP. All Rights Reserved.
Manufacturing: Rising Risk of Contraction
20
25
30
35
40
45
50
55
60
65
70
75
2003 2005 2007 2009 2011 2013 2015 2017 2019
Ind
ex
ISM Manufacturing ISM New Orders Contraction=Less Than 50 Recession= Less Than 43.1
Source: RSM US, Bloomberg

©2015 RSM US LLP. All Rights Reserved.
RSM Manufacturing Index: Rising Risk of Contraction
30
35
40
45
50
55
60
65
70
-6
-4
-2
0
2
4
6
1969 1974 1979 1984 1989 1994 1999 2004 2009 2014 2019
ISM
Inde
x
RSM
Mfg
. Out
look
(Z-s
core
)
RSM US Manufacturing Outlook Index and the ISM Manufacturing Index
RSM US Mfg Outlook (Z-Score) ISM Mfg PMI (RHS)
Source: Federal Reserve Banks; ISM; Bloomberg; RSM US

©2015 RSM US LLP. All Rights Reserved.
Global Manufacturing: Collateral Damage
40
42
44
46
48
50
52
54
56
58
60
62
64
2017 2018 2019
Ind
ex
Global Manufacturing Contraction
US PMI=51.2 JP Morgan Global PMI=49.3
German PMI=43.2 Chinese PMI=49.7
UK PMI=48 Contraction
Source: RSM US, Bloomberg

©2015 RSM US LLP. All Rights Reserved.
Transportation Indices Flashing Red

©2015 RSM US LLP. All Rights Reserved.
US Economic Outlook: Trade War
• US-China Trade War• GDP drag at 0.2 percentage points
• $62.5 billion direct increase in taxes• If tariffs on all $540 billion of Chinese imports its 0.5 percentage points
• $137.5 billion in direct taxes• Mexican Tariffs?
• 5% equivalent of a $18 billion dollar tax• 25% equivalent of a $90 billion dollar tax
• Auto Imports?• 25% on $350 billion in imports• Direct impact of $87.5 billion
• Global trade conflict• Direct and indirect impact of $426 billion increase in taxes on US
consumers and producers if all Chinese imports, auto imports & Mexican imports are subject to a 25% tariff.
©2015 RSM US LLP. All Rights Reserved.
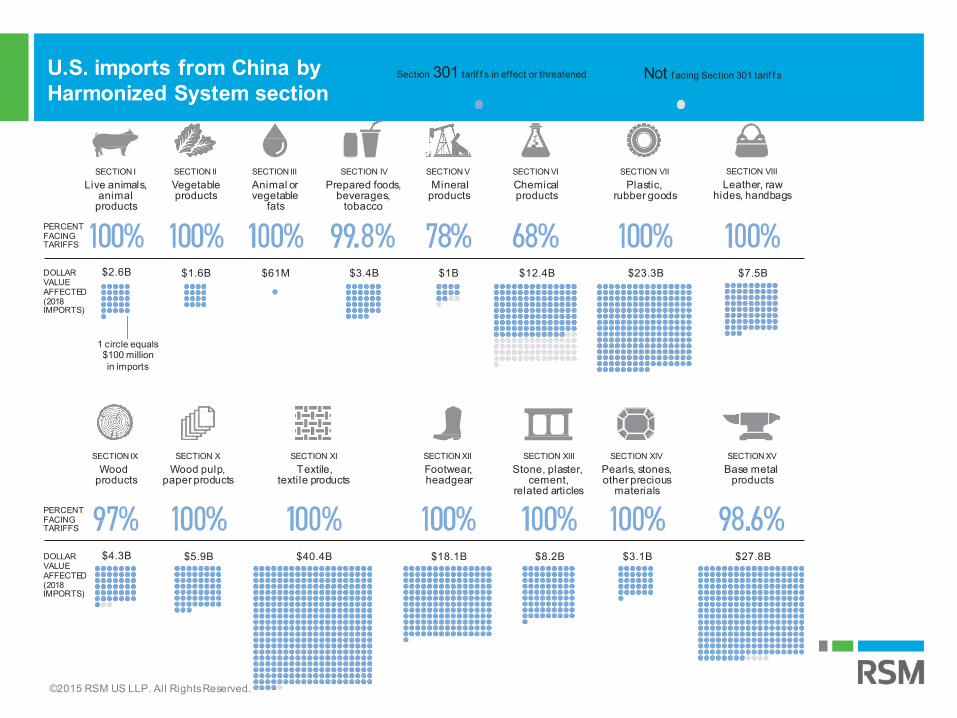
U.S. imports from China by Harmonized System section
Section 301 tarif f s in effect or threatened Not f acing Section 301 tarif f s
1 circle equals$100 million in imports
PERCENT FACING TARIFFS
SECTION ILive animals,
animal products
DOLLAR $2.6BVALUE AFFECTED (2018 IMPORTS)
SECTION IIVegetable products
$1.6B
SECTION IIIAnimal or vegetable
fats
$61M
SECTION IVPrepared foods,
beverages, tobacco
$3.4B
SECTION VMineral
products
$1B
SECTIONVIChemical products
$12.4B
SECTION VIIPlastic,
rubber goods
$23.3B
SECTION VIIILeather, raw
hides, handbags
$7.5B
PERCENT FACING TARIFFS
SECTION IXWood
products
DOLLAR $4.3BVALUE AFFECTED (2018 IMPORTS)
SECTION XWood pulp,
paper products
$5.9B
SECTION XITextile,
textile products
$40.4B
SECTION XIIFootwear, headgear
$18.1B
SECTION XIIIStone, plaster,
cement, related articles
$8.2B
SECTION XIVPearls, stones, other precious
materials
$3.1B
SECTION XVBase metal
products
$27.8B

©2015 RSM US LLP. All Rights Reserved.
Note: Goods listed under Chapters 98 and 99 (which comprise special classification provisions and similar designations) in the USA Trade database are not shown.
A series of 10-digit tariff codes that were exempted inthe$200 billion tariff round were included in the $300 billion tariff threat, and are classified as facing tariffs in this graphic.
Goods exempted by the USTR through the tariff exclusion process are not classified as facing tariffs. The exempted goods are based on the list published on the USTR website for the Section 301 exclusion process for Chinese tariffs, as of May 16, 2019 at 11:16 a.m. EDT.
DOLLAR VALUE AFFECTED (2018 IMPORTS)
PERCENT FACING TARIFFS
SECTION XVIMachinery, related
products
$244B
SECTION XVIIVehicles, aircraft, vessels
$18B
SECTION XVIIIOptical, photo,
measuring, related products
$9.4B $58.9B
SECTION XXMisc.
$285M
SECTION XXIWorks of art,
antiques
SECTION XIXArms,
ammunition, parts
$154M
U.S. imports from China by Harmonized System section Section 301 tariffs in ef f ect or threatened Not facing Section 301 tarif f s

©2015 RSM US LLP. All Rights Reserved.
Note: Sections 21 (w orks of art) and 22 (special classif ication provisions) not show n
U.S. imports by Harmonized System section, 2018BILLIONS OF DOLLARS
Dollar v alue of goods f rom MexicoHS Section Percent of all such imports
2: Vegetable products $14.1B 31%
17: Vehicles, aircraft, vessels and parts $95.2B 28%
16: Machinery and related products $127.1B 17%
4: Prepared foods, beverages, tobacco $11.1B 16%
18: Measuring, precision, other instruments $15.2B 16%
13: Stone, plaster and related articles $3.1B 13%
20: Miscellaneous manufactured goods $12.8B 12%
7: Plastic and rubber goods $8.3B 9.5%
15: Base metal products $12.9B 9.2%
14: Pearls and other preciousmaterials $5.3B 8.8%

©2015 RSM US LLP. All Rights Reserved.
U.S. imports by Harmonized System section, 2018BILLIONS OF DOLLARS
Dollar v alue of goods f rom MexicoHS Section Percent of all such imports
1: Live animals and animal products $2.8B 8.6%
5: Mineral products $16.4B 6.8%
10: Wood pulp, paper products $1.5B 5.8%
11: Textile and textile products $5.4B 4.7%
3: Animal or vegetable fats $201M 2.9%
8: Leather, raw hides, handbags $363M 2.5%
12: Footwear, headgear $715M 2.2%
19: Arms, ammunition $57M 2%
6: Chemical products $4.4B 1.9%
9: Wood products $399M 1.8%

©2015 RSM US LLP. All Rights Reserved.
State goods imports from Mexico, 2009 to 2018BY PERCENTAGE
R.I.
MASS.
CONN.
N.H.VT.
N.Y.
N.J.WYO.
ARK.
GA.OKLA.
MINN.
ALA.
DEL.
PA.IND.
KY. MD.UTAH
D.C.
N.D.IDAHO
HAWAII
S.D.
N.M.
NEV.
MONT.
MISS.LA.
ORE.
WASH.
TEXAS
OHIO
MICH.
IOWA
NEB.
FLA.
W.VA.
N.C. S.C.
VA.MO.
ARIZ.
WIS.
ILL.
COLO.CALIF.
KAN.
ALASKA
TENN.
50%
50%
50%
50%
50%
50%
25%
50%
25%
0%
25%
0%
0%
MAINE50%
25%
0%
25%
0%
25%
0%
25%
0%
25%
0%
©2015 RSM US LLP. All Rights Reserved.
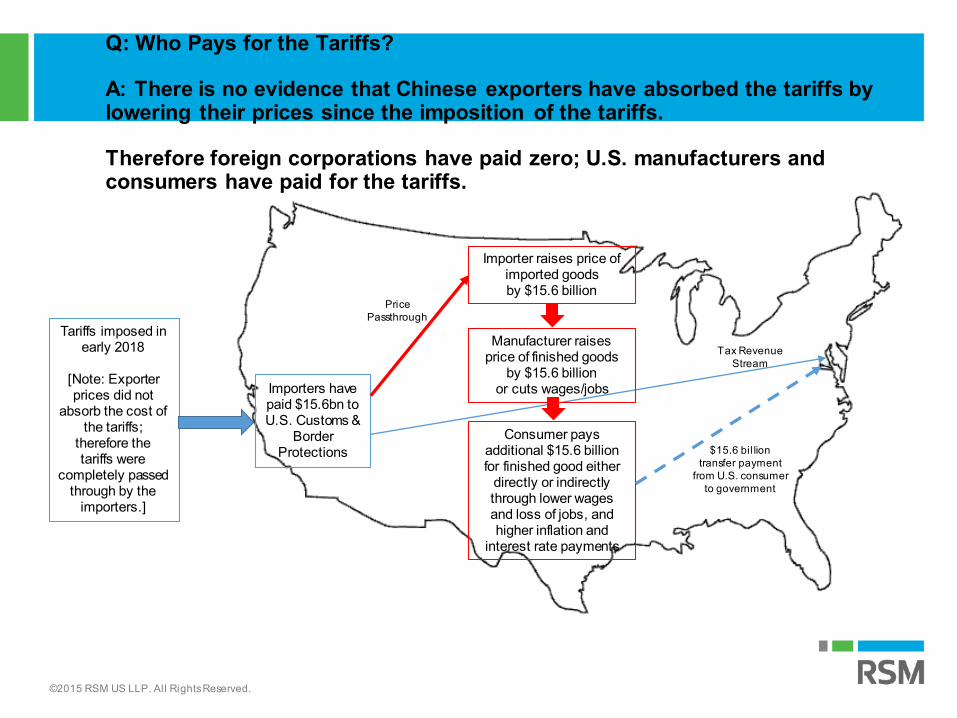
Q: Who Pays for the Tariffs?
A: There is no evidence that Chinese exporters have absorbed the tariffs by lowering their prices since the imposition of the tariffs.
Therefore foreign corporations have paid zero; U.S. manufacturers and consumers have paid for the tariffs.
Tariffs imposed in early 2018
[Note: Exporter prices did not
absorb the cost of the tariffs;
therefore the tariffs were
completely passed through by the
importers.]
Importers have paid $15.6bn to U.S. Customs &
Border Protections $15.6 bil lion
transfer paymentfrom U.S. consumer
to government
Importer raises price of imported goods by $15.6 billion
Manufacturer raises price of finished goods
by $15.6 billion or cuts wages/jobs
Consumer pays additional $15.6 billion for finished good either
directly or indirectly through lower wages and loss of jobs, and higher inflation and
interest rate payments
PricePassthrough
Tax Revenue Stream

©2015 RSM US LLP. All Rights Reserved.
U.S. experienced substantial increases in the prices of intermediates and final goods, large changes to its supplychain network, reductions in availability of imported varieties, and complete passthrough of the tariffs into domestic prices of imported goods.
Impact of Tariffs on Protected Intermediate Goods Industry (e.g., steel and aluminum)
Imposition of tariffs on intermediate
goods
Disruptions to existing
supply chain
Reductions in import choices
Pass-through of tariffs into
price of manufactured
goods
Decrease in domestic and export demand
for those finished goods
Decrease in manufacturing
jobs
Decrease in manufacturing
profits
Manufacturing Process ManufacturingCosts
Profitability / Stock Market Value Labor MarketImpact of
tariffs
Potential Feedback Loop

©2015 RSM US LLP. All Rights Reserved.
Potential Costs
Direct Costs for Manufacturing
Increased cost of imports of foreign goods
$3.0 bn/month
Potential increase in prices by protected domestic
producers ( ? )
Efficiency Losses
$1.4 bn/month
Cost of ManufacturingIncrease in Producer Price Inflation of 1 percentage
point (compared with 1990-2018 average rate of PPI of 2
percentage points)
Cost of Reorganization of Supply Chains -- Redirection
$165bn of trade per year will be redirected to avoid tariffs
(if tariffs were continued)
Cost of Reorganization of Supply Chains – Relocation
of FacilitiesImposition of large costs on
existing investments in U.S. and China
(if tariffs were continued)
Estimated Direct Costs
Estimated Potential Costs
We estimate the likely impact on U.S. consumers and find that by the end of 2018, 2 import tariffs were costing U.S. consumers and the firms that import foreign goods an additional $3 billion per month in added tax costs and another $1.4 billion dollars per month in deadweight welfare (efficiency) losses. Tariffs have also changed the pricing behavior of U.S. producers by protecting them from foreign competition and enabling them to raise prices and markups.

©2015 RSM US LLP. All Rights Reserved.
$0
$5B
$10B
$20B
$25B
JAN. ’18
APRIL ’18
JULY ’18
OCT. ’18
JAN. ’19
APRIL ’19
Jan. 2018: Solar panel and
washing machine tarif fs first take
ef f ect.*
March 2018: Steeland aluminum tariffs
f irst takeeffect.
July 2018:Section 301
tarif fs first take ef f ect.
August 2018: Additional
Section 301tarif fs take
ef f ect.
Sept. 2018:Additional
Section 301 tarif fs take
ef f ect.
*THtH first estimates tariffs for solar panels and washing machines in Feb. 2018
CUMULA-TIVE COST THROUGH JUNE 2019:
China: Section 301 tarif fs
Steel tariffs
Aluminum tariffs$599M Solar panel, washing
machine tariffs
$1.5B
$5.1B
$20B
Cumulative tariffs collected by Trump Administration actionsIN U.S.DOLLARS
$15B
$27.2B Total

©2015 RSM US LLP. All Rights Reserved.
US Economic Outlook: Labor Market
• US Labor Market Outlook: Robust • 2019 Monthly Job Creation: 140K Per Month• Unemployment Rate: 3.7%• Wages: 2.73% three month average annualized pace• Rebound in Prime Aged Workers
• 82% of prime aged workers 25-54 at work • Less than one unemployed individual per job opening• Tight labor market remains the major challenge for RSM Middle Market
clients• Finding willing and available workers primary challenge for firms

©2015 RSM US LLP. All Rights Reserved.
Tight Labor Market
0.0
0.5
1.0
1.5
2.0
2.5
3.0
3.5
4.0
4.5
5.0
5.5
6.0
6.5
7.0
2005 2007 2009 2011 2013 2015 2017 2019
Job
Op
en
ings
Pe
r P
ers
on
Number of Unemployed Persons Per Job Opening=.86
Source: RSM US, BLS

©2015 RSM US LLP. All Rights Reserved.
US Employment: Labor Supply Challenge
-1.50%
-1.00%
-0.50%
0.00%
0.50%
1.00%
1.50%
2.00%
2.50%
3.00%
2000 2001 2002 2003 2004 2005 2006 2007 2008 2009 2010 2011 2012 2013 2014 2015 2016 2017 2018 2019
Yea
r-O
ver-
Year
Per
cent
age
Ch
ang
e
Growth in U.S. Labor Supply=.57%
20-Year Average=.80
Steady State=.50
Source: RSM US, Bloomberg

©2015 RSM US LLP. All Rights Reserved.
US Economic Policy Outlook
• Policy Outlook:• Fiscal Deficits:
• Annual operating deficit of $1.3 trillion in FY 2019• Toward 5.5% of GDP in 18-24 months
• Spending• Large increase in defense and social outlays• Infrastructure: Likely not to happen• 2017 TCJA: 15% recovery of fiscal expenditure
• Causing significant increase in annual budget deficits• Regulation
• Regulatory relief for banks with under $250 billion AUM: Passed into law in May 2018.
• Significant win for the middle market• Has not yet derived an increase in residential investment
©2015 RSM US LLP. All Rights Reserved.
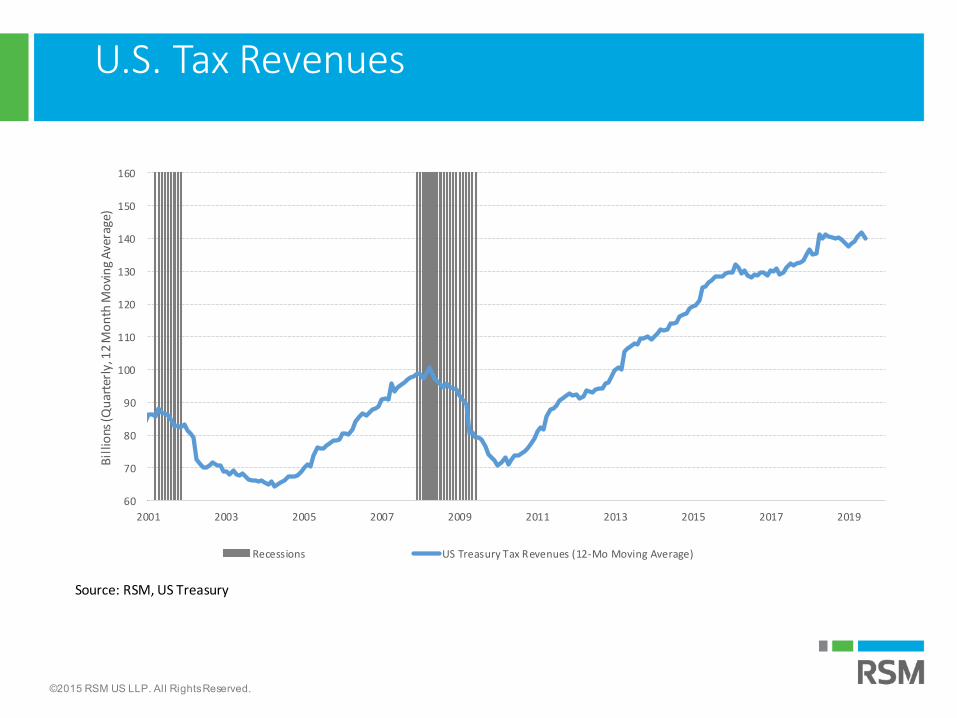
U.S. Tax Revenues
60
70
80
90
100
110
120
130
140
150
160
2001 2003 2005 2007 2009 2011 2013 2015 2017 2019
Bil
lions
(Qu
arte
rly,
12
Mo
nth
Mo
vin
g A
vera
ge)
Recessions US Treasury Tax Revenues (12-Mo Moving Average)
Source: RSM, US Treasury

©2015 RSM US LLP. All Rights Reserved.
Private Fixed Investment: Policy Key to Reversing Slide
12%
13%
14%
15%
16%
17%
18%
19%
20%
21%
1979 1984 1989 1994 1999 2004 2009 2014 2019
Pe
cen
tage
of G
DP
(No
min
al)
Source: RSM US, BEA
©2015 RSM US LLP. All Rights Reserved.
’10 ’12 ’14 ’16 ’18
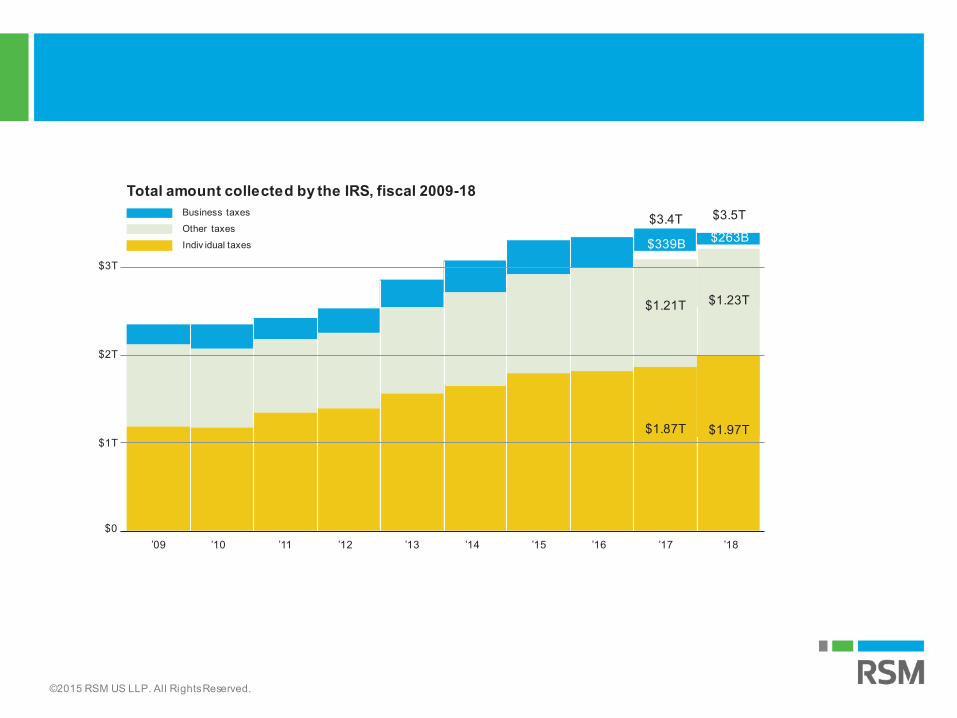
Total amount collected by the IRS, fiscal 2009-18Business taxesOther taxesIndiv idual taxes $263B$339B
$1.97T$1.87T
$1.23T$1.21T
$0
$1T
$2T
$3T
’09 ’17’15’13’11
$3.4T $3.5T

©2015 RSM US LLP. All Rights Reserved.
Total U.S. budget deficits or surpluses, 1968 to2018
–$1,200B
–$900B
–$600B
–$300B
–$1.41 trillion deficit in 2009
–$779billiondeficit
’68 ’70$0
’95’90’85’80’75
+$236 billion surplus in 2000
’05 ’10 ’15 ’18

©2015 RSM US LLP. All Rights Reserved.
Total U.S. budget deficit or surplus as a percentage of GDP
0%
9%
6%
3%
’68 ’70 ’95’90’85’80’75 ’15 ’18
3.9%50-yr.
average2.91%
9.8% in 2009
’05 ’10
Surplus was equal to2.3% of GDP in 2000

©2015 RSM US LLP. All Rights Reserved.
US-Global Economic Relations: Trade and Financial Conflicts
• U.S.-Global Trade Friction: Major 2019 Policy Issue• This is the major risk to the domestic economic outlook in 2019
• China, EU, & Auto Tariffs • Will shave 0.2-0.5 percent off growth in 2019 • Pricing to be impacted with upside risk to inflation• Auto tariffs equal to $100 billion tax hike
• Reduction of purchasing power, competiveness, rising prices. • China-US:
• Trade war has begun• Possible 25% on additional $300 billion in 2H 2019
• NAFTA Modernization: AT RISK Due to Potential Mexican Tariffs• First trade treaty that raises trade barriers• Higher prices for Canadians & American consumers• Mexico bears burden of adjustment

©2015 RSM US LLP. All Rights Reserved.
Goods affected by tariffs
$57BConsumer goods
$12B
$19BAutomotive vehicles, parts
$23B
$128BCapital goods (except autos)
$25B
$5BFood, feed, beverages
$28B
$75BIndustrial supplies and materials
$47B
IMPORTS
EXPORTS
CBO projects tariffs will reduce real GDP, consumption and investmentCBO also projected that recent trade actions, including tariffs set by the U.S. on imports, and on exports by trading partners, would reduce real GDP by about 0.1 by 2022. It also estimates that, by 2022, the tariffs will reduce real consumption by 0.1 percent and real private investment by 0.3 percent.
Tariff Costs by Industry

©2015 RSM US LLP. All Rights Reserved.
Loss in gross output by industry, 2020DEVIATION FROM BASELINE PROJECTION
REAL 2010 DOLLARS PERCENTAGE CHANGE
Computer, electronics –0.97%–$4.98B
Machinery, equipment –$2.68B –0.63%
Chemicals –$2.07B –0.39%
Fabricated metals –$1.73B –0.47%
Iron, steel –$1.5B –0.91%
Electrical equipment –$1.26B –1.01%
Furniture –$1.22B –0.56%
Air–, spacecraft –$1.05B –0.4%
Rubber, plastic –$880M –0.39%
Paper, pulp –$700M –0.41%
Non-metal minerals –$690M –0.58%
Non-ferrous metals –$650M –0.56%
Tariff Costs by Industry

©2015 RSM US LLP. All Rights Reserved.
More than 5,000 types of goods face tariffs from 5 to 25 percentChina will set tariffs based on eight-digit item codes (The Harmonized System classifies goods by up to six-digit codes, whilecountries may further classify goods with longer codes). The data below reflects U.S. exports at the six-digit level, the closestavailable, and may not completelyreflect the value of goods facing tariffs.
VALUE OF 2018 U.S. EXPORTS TO CHINA
TYPE OF GOOD, BY SECTION OF THE HARMONIZED SYSTEM
PERCENTAGE OFU.S. EXPORTS
I: Live animals, animal products 21%
4%
2%
3%
10%
8%
7%
23%
32%
$294M
$173M
$54M
$1.2B
$1.6B
$7.8B
$4.2B
$906M
$2.1B
II: Vegetable products
III: Animal, vegetable fats, related products
IV: Prepared food, beverages, related products
V: Mineral products
VI: Chemical or allied industry products
VII: Plastics, rubber products
VIII: Leather, fur, relatedproducts
IX: Wood, wood products*
0
0
0
0
38
7
12
250
13
6
30
8
58
12
31
151
58
23
92
51
79
42
76
304
Total number of eight-digit codes facing a ...
5% TARIFF 10% TARIFF 20% TARIFF 25% TARIFF
0 6 1 15
18
3
37
25
59
0
0
162
Chinese Retaliation

©2015 RSM US LLP. All Rights Reserved.
3%
4%
5%
2%
$1.7B
$2.7B
$16.9B
$301M
XIV: Pearls, precious or semiprecious stones, precious metals, related products
XV: Base metals and products
XVI: Machinery and mechanical appliances, electrical equipment
XVII: Vehicles, aircraft, vessels, associated transport equipment
XVIII: Optical, photographic, cinematographic,
0
33
0
149
9
4
135
306
40
16
309
562
17
5
other instruments 58 65 44 85 $8.4B 11%
XIX: Arms, ammunition 0 5 1 0 $1M 1%
XX: Miscellaneous manufactured articles 5 36 68 58 $553M 3%
XXI: Works of art, collectors’ pieces and antiques 0 4 3 1 $110M 1%
187
176
Total number of eight-digit codes facing a ...TYPE OF GOOD, BY SECTION OF THE HARMONIZED SYSTEM
5% TARIFF 10% TARIFF 20% TARIFF 25% TARIFFVALUE OF 2018 U.S. EXPORTS TO CHINA
PERCENTAGEOFU.S. EXPORTS
X: Wood pulp, related products 43 0 62 33 $2.6B 10%
XI: Textiles 0 89 104 531 $784M 4%
XII: Footwear, headgear, related products 0 11 9 41 $163M 8%
XIII: Stone, plaster, cement, glass, related products 0 69 23 77 $831M 7%
Chinese Retaliation

©2015 RSM US LLP. All Rights Reserved.
U.S. debt by holderBY PERCENTAGE
50%
China holds about 5 percent of U.S. debtChina is the largest foreign holder of U.S. debt, followed by Japan. MainlandChinese holdings of U.S. debt stood at about $1.1 tri l l ion in February 2019, according to theU.S. Treasury Department — slightly less than the $1.2 tri llion it held in February 2018.
Most U.S. debt is held by domestic investors, such as state and local governments, banks, insurance companies, mutual funds and bonds. The gross U.S. federal debt totaled $21.5 tri llion in 2018.
FOREIGN-HELD
Q1 ’02
Q1 ’04
Q1 ’06
Q1 ’08
Q1 ’10
Q1 ’12
Q1 ’14
Q1 ’16
Q1 ’18
DOMESTIC HOLDINGS
China Japan
All other countries

©2015 RSM US LLP. All Rights Reserved.
Foreign holdings of U.S. debtIN TRILLIONS OF DOLLARS
FEB. ’18
FEB. ’19
MAY ’18
AUG. ’18
NOV. ’18
China uses dollars to manage exchange ratesChinese holdings of U.S. debt also provide the country a strategic monetary advantage. By holding foreign exchange reservice, the country can better manage i ts currency’s (the renminbi) exchange rate.
“Were China to suddenly unload its reserve holdings, its currency’s exchange rate would rise, making Chinese exports more expensive in foreign markets,” wrote analysts at CSIS’ China Power Project, in an online post.
0
$1
$2
$3
$4
$5
CHINA
REST OFWORLD
JAPAN $1.07
$1.13
AS OF FEB. ’19
$2.70
$4.9total

©2015 RSM US LLP. All Rights Reserved.
Biggest import trading partner for US
Source: US Census Bureau

©2015 RSM US LLP. All Rights Reserved.
Biggest export trading partner for US
Source: US Census Bureau
©2015 RSM US LLP. All Rights Reserved.
Percentagechange
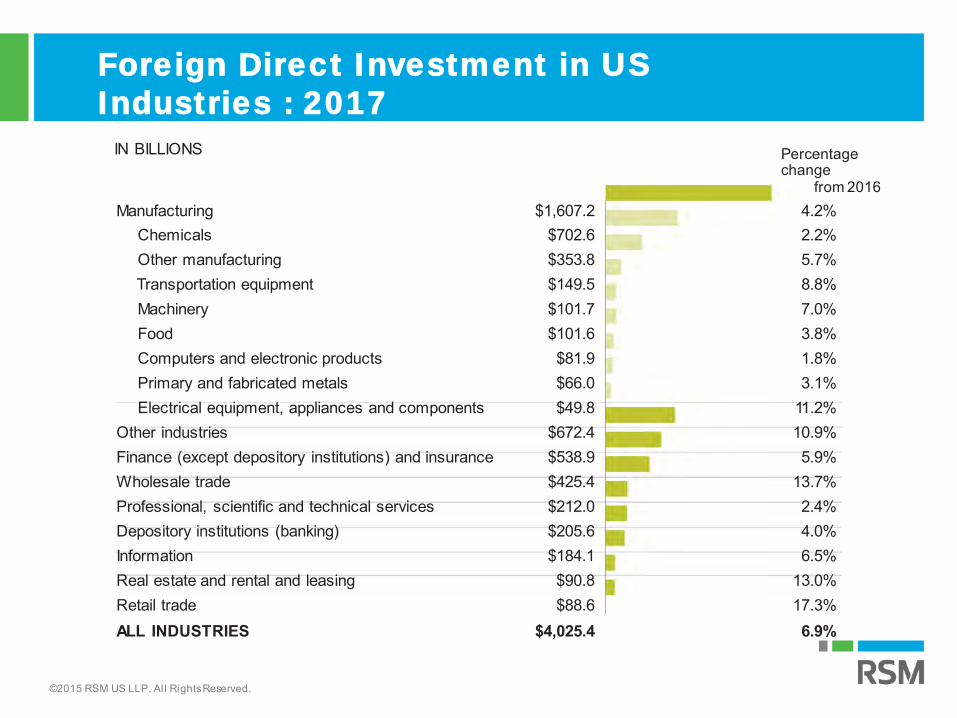
from 2016Manufacturing $1,607.2 4.2%
Chemicals $702.6 2.2%Other manufacturing $353.8 5.7%Transportation equipment $149.5 8.8%Machinery $101.7 7.0%Food $101.6 3.8%Computers and electronic products $81.9 1.8%Primary and fabricated metals $66.0 3.1%Electrical equipment, appliances and components $49.8 11.2%
Other industries $672.4 10.9%Finance (except depository institutions) and insurance $538.9 5.9%Wholesale trade $425.4 13.7%Professional, scientific and technical services $212.0 2.4%Depository institutions (banking) $205.6 4.0%Information $184.1 6.5%Real estate and rental and leasing $90.8 13.0%Retail trade $88.6 17.3%ALL INDUSTRIES $4,025.4 6.9%
Foreign Direct Investment in US
Industries : 2017
IN BILLIONS

©2015 RSM US LLP. All Rights Reserved.
The market facilitation program will provide payments to farmers based on the “severity of trade disruption” and “period of adjustment to new trade patterns,” both of which will be determinedby the affected farmer’s production.
The program is open from Sept. 4 through Jan. 15, 2019 for farmers that grow the particular crop, are “actively engaged” in farming and whose average adjusted gross income from 2014 to 2016 is less than $900,000.Farmers who qualify for the program will receive a payment based on half of their 2018 production and the rate for each crop.
Tariff Mitigation: Market facilitation program

©2015 RSM US LLP. All Rights Reserved.
Soybean production by county (selected states) 2017
Source: US Department of Agriculture/Federal Reserve Bank of St Louis
Note: Black outline represents the boundaries of the Eight District. Uncoloured areas represent counties where no estimates were reported.
Soybean production (bushels)
8,000,000
4,000,000 to 7,999,999
2,000,000 to 3,999,999
750,000 to 1,999,999
250,000 to 749,000
<25,000
©2015 RSM US LLP. All Rights Reserved.
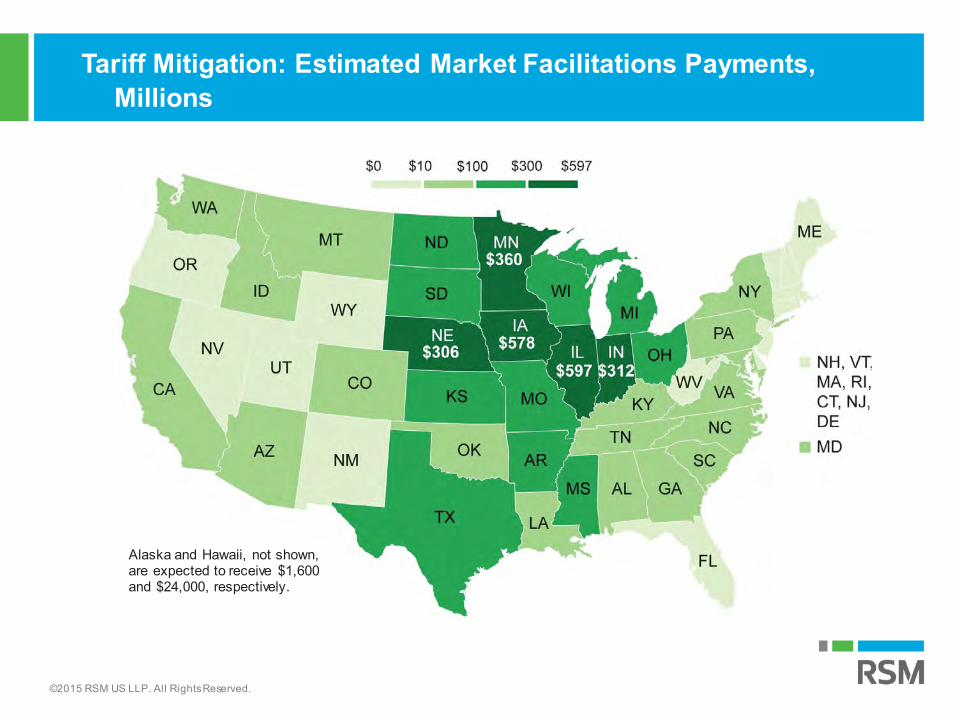
Alaska and Hawaii, not shown, are expected to receive $1,600 and $24,000, respectively.
Tariff Mitigation: Estimated Market Facilitations Payments, Millions
©2015 RSM US LLP. All Rights Reserved.
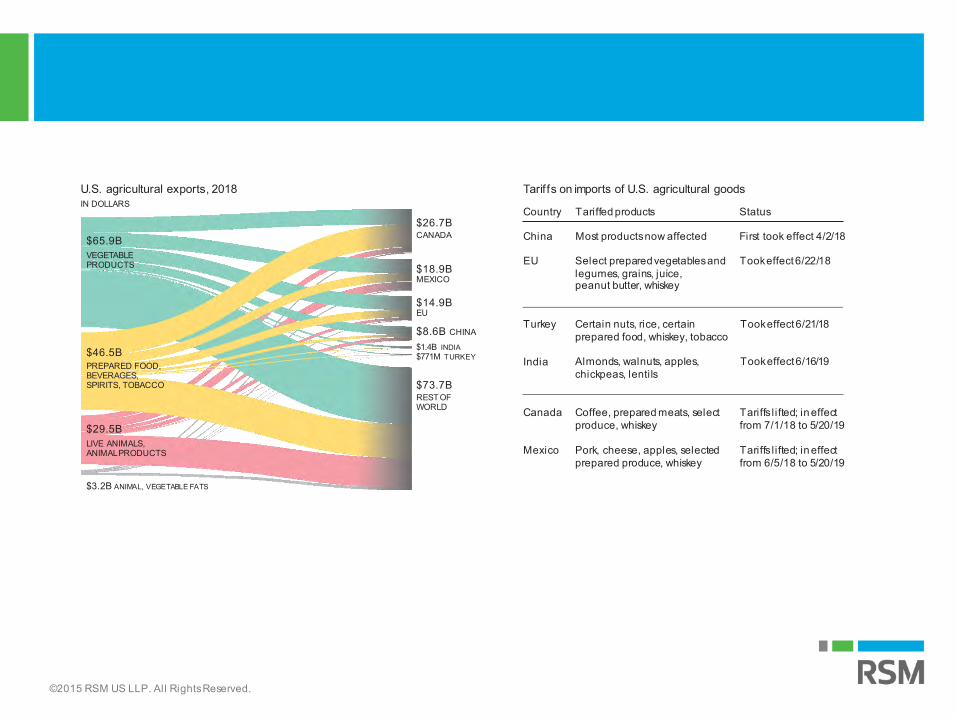
Canada Coffee, prepared meats, select produce, whiskey
Tariffs l ifted; in effect from 7/1/18 to 5/20/19
Mexico Pork, cheese, apples, selected prepared produce, whiskey
Tariffs l ifted; in effect from 6/5/18 to 5/20/19
Turkey
EU Select prepared vegetablesand legumes, grains, juice,peanut butter, whiskey
Took effect6/22/18
India
Certain nuts, rice, certain Took effect 6/21/18 prepared food, whiskey, tobacco
Almonds, walnuts, apples, Took effect 6/16/19 chickpeas, lentils
Tariffs on imports of U.S. agricultural goods
Country Tariffed products Status
China Most productsnow affected First took effect 4/2/18
$29.5BLIVE ANIMALS, ANIMALPRODUCTS
$46.5BPREPARED FOOD, BEVERAGES, SPIRITS, TOBACCO
$3.2B ANIMAL, VEGETABLE FATS
$26.7BCANADA
$18.9BMEXICO
$14.9BEU
$8.6B CHINA
$1.4B INDIA$771M TURKEY
$73.7BRESTOF WORLD
U.S. agricultural exports, 2018IN DOLLARS
$65.9BVEGETABLE PRODUCTS
©2015 RSM US LLP. All Rights Reserved.
50%
25%
0%
50%
25%
0%
50%
25%
25%
0%
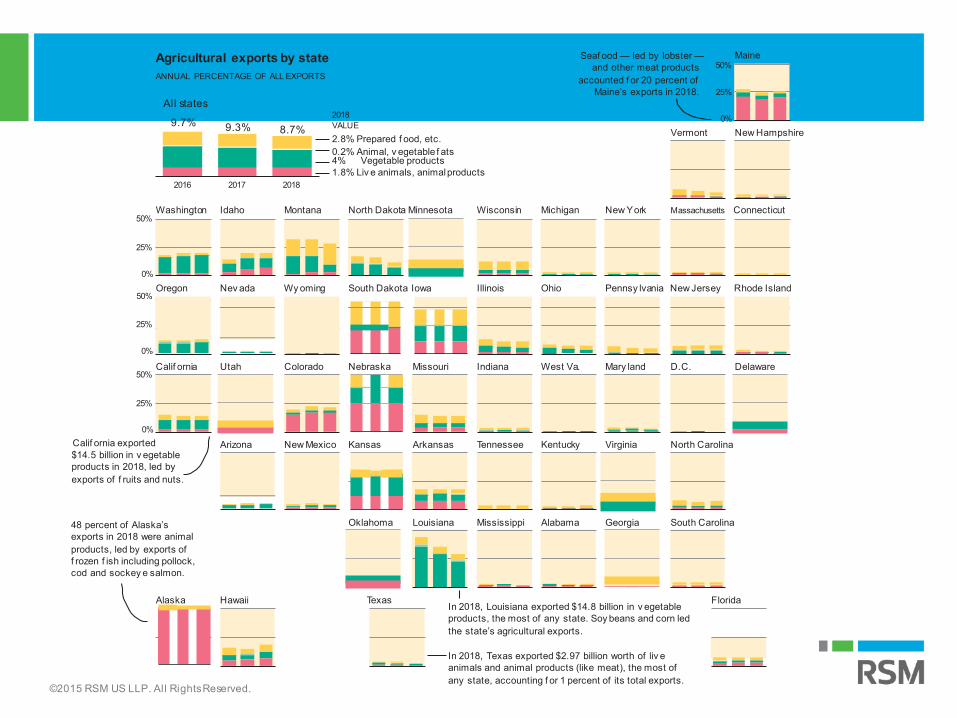
Agricultural exports by stateANNUAL PERCENTAGE OF ALL EXPORTS
In 2018, Texas exported $2.97 billion worth of liv e animals and animal products (like meat), the most of any state, accounting f or 1 percent of its total exports.
In 2018, Louisiana exported $14.8 billion in v egetable products, the most of any state. Soy beans and corn led the state’s agricultural exports.
0%Calif ornia exported$14.5 billion in v egetable products in 2018, led by exports of f ruits and nuts.
48 percent of Alaska’s exports in 2018 were animal products, led by exports of f rozen f ish including pollock, cod and sockey e salmon.
Seaf ood — led by lobster —and other meat products
accounted f or 20 percent of Maine’s exports in 2018.
Texas FloridaAlaska
Calif ornia
Oregon
Washington
Hawaii
Arizona
Utah
Nev ada
Idaho
New Mexico
Colorado
Wy oming
Montana
Kansas
Oklahoma
Nebraska
Arkansas
Louisiana
Missouri
South Dakota Iowa
North Dakota Minnesota
Tennessee
Mississippi
Indiana
Illinois
Wisconsin
Kentucky
Alabama
West Va.
Ohio
Michigan
Virginia
Georgia
Mary land
Pennsy lvania
New York
North Carolina
South Carolina
D.C.
Vermont
Maine50%
Delaware
New Jersey Rhode Island
Massachusetts Connecticut
New Hampshire
2016 2017 2018
9.3% 8.7%
All states
9.7%2018VALUE2.8% Prepared f ood, etc.0.2% Animal, v egetable f ats4% Vegetable products1.8% Liv e animals, animalproducts
©2015 RSM US LLP. All Rights Reserved.
This document contains general information, may be based on authorities that are subject to change, and is not a substitute for professional advice or services. This document does not constitute audit, tax, consulting, business, financial, investment, legal or other professional advice, and you should consult a qualified professional advisor before taking any action based on the information herein. RSM US LLP, its affiliates and related entities are not responsible for any loss resulting from or relating to reliance on this document by any person.
RSM US LLP is a limited liability partnership and the U.S. member firm of RSM International, a global network of independent audit, tax and consulting firms. The member firms of RSM International collaborate to provide services to global clients, but are separate and distinct legal entities that cannot obligate each other. Each member firm is responsible only for its own acts and omissions, and not those of any other party. Visit rsmus.com/about us for more information regarding RSM US LLP and RSM International. RSM® and the RSM logo are registered trademarks of RSM International Association. The power of being understood® is a registeredtrademark of RSM US LLP.
© 2015 RSM US LLP. All Rights Reserved.
RSM US LLP1185 Avenue of the AmericasNew York, New York 10036+1 800 274 3978www.rsmus.com