2015 north dakota beef report (as1775)
TRANSCRIPT
2016 North Dakota Beef Report
AS1815
(Photo by Lauren Hanna, NDSU)
2 2016 North Dakota Beef Report
2016 North Dakota Beef Report
Welcome to the 2016 North Dakota Beef Report.
North Dakota State University; the College of Agriculture, Food Systems, and Natural Resources; and the North Dakota Agricultural Experiment Station are pleased to be able to provide this report to the beef industry and cattle ranchers in the state. The report provides the most recent results from research related to beef cattle, beef products, and environmental and range sciences from North Dakota.
The beef research programs at the North Dakota Agricultural Experiment Station’s Main Station in Fargo and the Research Extension Centers across North Dakota are dedicated to serving the producers and stakeholders in North Dakota by developing new knowledge and technology to improve the management, efficiency, and production of high-quality cattle and beef using sustainable and safe approaches.
This report includes a broad range of research from on-campus departments, schools and centers, as well as Research Extension Centers across the state, and provides producers and stakeholders with one document that contains all beef-related research conducted at NDSU each year.
We thank the federal, state and industry sponsors who support our research programs. Without this support, this research would not be possible. We also thank all of the faculty, staff, and graduate and undergraduate students who have contributed to this work.
We hope you enjoy reading this research report and that the information is useful to your operation. We look forward to continuing to serve the North Dakota beef industry in the coming year and in the future.
Sincerely,
Ken Grafton Vice President for Agricultural AffairsDean of the College of Agriculture, Food Systems, and Natural ResourcesDirector of the North Dakota Agricultural Experiment Station
North Dakota is proud of its strong and prosperous beef industry. The success of the
industry doesn’t happen by chance, however. It takes the vision and commitment of industry leaders to identify needs and set goals.
One key component of that success is the industry leaders’ commitment to supporting beef research and Extension at NDSU.
Through the NDSU Extension Service, we are able to provide the beef industry with research-based information in the areas of genetics and reproduction, nutrition, animal care and health, range management, resource stewardship and market economics through our state and area Extension specialists.
I thank the beef industry for its continued support of NDSU Extension’s beef programs.
I also thank the dedicated NDSU animal scientists and Extension specialists for their innovative and valuable research and Extension programs. The results of their numerous projects are reported between the covers of this 2016 North Dakota Beef Report. The report contains a wealth of information on current applied and basic research and project results. I hope you take time to review this information for ideas and to stay abreast of the latest in beef research at NDSU.
I encourage you to contact the scientists or Extension specialists who are involved in these projects if you have questions or additional input. They always are interested in hearing your thoughts.
Thank you for your continued support of these beef research projects and the other animal science programs as well. We want to work together with you to support the successful future of North Dakota beef.
Sincerely,
Chris Boerboom Director of the NDSU Extension Service
2016 North Dakota Beef Report 3
ContentsWelcome ........................................................................... 2
Updates From Our Research Locations ....................... 5Kendall C. Swanson
Backgrounding and FinishingEvaluation of response to vaccination with a bacterial-produced plasmid DNA, Zelnate, on feedlot performance of weaned calves .................. 9
James J. Gaspers, Kendall C. Swanson, Faithe E. Keomanivong, Ananda B.P. Fontoura, Alison K. Ward, Evan Knutson and Gerald L. Stokka
Seasonlong grazing intensity and parasite load in yearling steers in the northern Great Plains ......... 12
Fara Brummer, Gerald Stokka and Claire Miller
Effect of two beef cattle yearling steer production systems on grazing and feedlot performance, carcass measurements and systems economics ........ 15
Sentürklü Songül, Douglas Landblom, Robert Maddock and Steve Paisley
Effects of feeding two levels of a pelleted 30 percent pea starch and 70 percent dry distillers grain feed in feedlot finishing diets on animal performance and carcass characteristics .................... 21
Chanda L. Engel
Discovering value in North Dakota calves: Dakota Feeder Calf Show feedout project XIV, 2015-2016 ........................................................................ 25
Karl Hoppe and Dakota Feeder Calf Show Livestock Committee
Growing and finishing feedlot performance of steers fed diets with rolled corn or rolled barley and medium- or low-fat dry distillers grains with solubles ...................................................... 28
Chanda L. Engel, Kendall C. Swanson and Vern L. Anderson
The influence of grain source and dried corn distillers grains plus solubles oil concentration on finishing cattle performance and feeding behavior .......................................................................... 32
Mary A. Rodenhuis, Faithe E. Keomanivong, James J. Gaspers1, Marc L. Bauer, Trent C. Gilbery, Sarah R. Underdahl, Chanda L. Engel, Vern L. Anderson and Kendall C. Swanson
Effect of grain type and dried distillers grain with solubles oil concentration on site of digestion .......... 36
Mary A. Rodenhuis, Faithe E. Keomanivong, Marc L. Bauer, Chanda L. Engel, Vern L. Anderson and Kendall C. Swanson
The influence of dry-rolled corn particle size and dried corn distillers grains plus solubles inclusion levels on rumen pH, ammonia and VFA concentration, total in vitro ruminal gas production and enteric methane emission ........ 39
Faithe E. Keomanivong, Megan C. Ruch, Jeng Hung Liu, Jim D. Kirsch, Carl R. Dahlen, Shafiqur Rahman, Md S. Borhan, Marc L. Bauer and Kendall C. Swanson
Cow/CalfEffects of maternal nutrition on fructose and expression of the fructose transporter GLUT5 in bovine tissues and fluids from days 16 to 50 of gestation .................................................................... 43
Nathaniel P. Greseth, Matthew S. Crouse, Kyle J. McLean, Mellissa R. Crosswhite, Nicolas Negrin Pereira, Alison K. Ward, Larry P. Reynolds, Carl. R. Dahlen, Bryan W. Neville, Pawel P. Borowicz and Joel S. Caton
Effects of pre-breeding administration of injectable trace mineral supplements on subsequent reproductive performance in beef herds .................................................................. 48
Mellissa. R. Crosswhite, Lourens. J. Havenga and Carl. R. Dahlen
The effects of nutrient restriction on interferon-tau and pregnancy-specific protein-B mRNA during the establishment of pregnancy in beef heifers ................................................................. 51
Kyle J. McLean, Carl R. Dahlen, Pawel P. Borowicz, Larry P. Reynolds and Joel S. Caton
The effects of nutrient restriction on expression of endogenous retroviruses mRNA during the establishment of pregnancy in beef heifers ............... 55
Kyle J. McLean, Carl R. Dahlen, Pawel P. Borowicz, Larry P. Reynolds and Joel S. Caton
A meta-analysis of the relationship of maternal weight and fetal sex on uterine blood flow and maternal heart rate in beef cows from mid to late gestation ..................................................... 59
Amelia R. Tanner, Marc L. Bauer, Victoria C. Kennedy, Bethany R. Mordhorst, Leticia E. Camacho, Kendall C. Swanson and Kimberly A. Vonnahme
4 2016 North Dakota Beef Report
Cow/Calf (continued)Effects of breeding system of origin (natural service or artificial insemination) on pregnancy rates, distribution of calving and calf weaning weights of commercial beef cow herds in North Dakota ................................................................. 62
Mellissa. R. Crosswhite, Danielle. N. Black, Tammi. L. Neville, Sarah. R. Underdahl and Carl. R. Dahlen
Effects of maternal nutritional status on nutrient transporter expression in bovine utero-placental tissue on days 16 to 50 of gestation ............................ 65
Matthew S. Crouse, Kyle J. McLean, Mellissa R. Crosswhite, Nicolas Negrin Pereira, Alison K. Ward, Lawrence P. Reynolds, Carl R. Dahlen, Bryan W. Neville, Pawel P. Borowicz and Joel S. Caton
Effects of cold temperatures on feed intake in beef cows .................................................................... 71
Jessica R. Schneider, Marc L. Bauer, Kendall C. Swanson, Trent C. Gilbery, Sarah R. Underdahl and Kimberly A. Vonnahme
Frequency of supplement delivery to cows on corn residue .............................................................. 73
Michael Undi, Bryan W. Neville, Fara A. Brummer and Stephanie M. Gross
Forages/GrazingQuality of hay from road right of ways in North Dakota............................................................. 76
Miranda A. Meehan, Kevin K. Sedivec, Fara Brummer and Carl R. Dahlen
Effects of grazing intensity and advancing season on chemical composition and in vitro organic matter disappearance in steers supplemented with dried distillers grains grazing mixed-grass prairie ......................................... 79
Kayla E. Chilcoat, Matthew S. Crouse, Bryan W. Neville and Joel S. Caton
Male FertilityThe use of testicular fine-needle aspiration, histology and immunohistochemistry for determining bull fertility at an early age .................. 83
Nicolas Negrin Pereira, Pawel Borowicz, Bryan Neville, Jordan Flaten and Carl R. Dahlen
The effect of Vitamin A treatment on testicular development in young peri-pubertal bulls ............... 86
Nicolas Negrin Pereira, Pawel Borowicz, Jordan Flaten, Bryan Neville and Carl R. Dahlen
Meat ScienceThe influence of beef quadriceps hot-processing on carcass chilling and beef round quality ................ 89
Christina A. Haye, Robert J. Maddock, Wanda L. Keller and Kasey R. Maddock-Carlin
Does beef inclusion in a modern diet influence risk factors for obesity-related metabolic disorders using a swine biomedical model ............... 92
Alexis M. Siomka, Korry Hintze and Eric P. Berg
2016 North Dakota Beef Report 5
Updates From Our Research Locations
This is always an exciting time of the year for me as I work on coordinating the publication of the annual
North Dakota Beef Report. Seeing all the great work that is being done in beef cattle research in North Dakota and helping get this information out to our producers and industry is enjoyable for me.
For this year’s report, I thought providing an update from our research locations on new happenings, such as new hires, updates in facilities, renewed focus on improving cattle quality and facilities, etc., would be a nice addition. Many new, exciting things are going on at our research locations aside from just the research results (see updates below from our research locations in no particular order).
I believe we are working hard toward improving our beef cattle research program to be one of the best in the country. We have much momentum and are aggressively improving and moving our program forward.
I am taking this opportunity to thank Ellen Crawford and Deb Tanner for their great contributions in editing and formatting the reports so that we can publish a great statewide combined report. I also thank the contributors to the North Dakota Beef Report, and thanks to all the employees and students who help with all of the research, teaching, and Extension activities related to beef cattle.
Our goal is to make this a comprehensive report describing research from across the state so readers have one report that provides results they can use to improve their operations or improve their business. I feel this statewide report has improved greatly during the first few years of its publication.
If you should have any questions about the research reported in this report, please do not hesitate to contact me or any of the authors of the individual reports. Thanks for your encouragement and support of beef cattle research in North Dakota.
Kendall Swanson North Dakota Beef Report Editor and ProfessorDepartment of Animal SciencesPhone: 701-231-6502email: [email protected]
NDSU Beef Teaching and Research UnitThe Beef Teaching and Research Unit has under-
gone some changes within the past year. It has been one year since my full-time employment, and we have made strides in strengthening our interdepartmental communication and upgraded livestock-handling equipment, and are progressing toward our ultimate cow-calf production goals.
Our Beef Committee, or “B Team,” as I like to call it, is made up of a group of staff and faculty members from the NDSU Animal Sciences Department, including me, who are passionate about NDSU’s beef program. This committee acts as the hub for ideas and concerns to be discussed to help solidify our beef program goals.
The committee is co-chaired by Kendall Swanson, an expert in beef cattle nutrition and physiology, and Gerald Stokka, who specializes in livestock steward-ship and beef cattle health. This committee has become more active to assist the beef unit manager in manage-ment decisions and deciding future directions for the program.
As a committee, we have developed a mission statement: “The NDSU Beef Teaching and Research Unit provides facilities and beef cattle to integrate re-search, teaching and Extension to serve the NDSU beef program, NDSU Animal Sciences and the community.” We also are working on better defining our vision for improving cattle genetics, nutrition programs, health programs and other management strategies.
We have been privileged to upgrade our livestock-handling equipment this past year. Having a safer, more modern handling system will aid in the flow and improve the safety of our animals, staff and students, as well as allowing handling of the animals to be com-pleted more diligently.
We have our herd of 200 breeding-age females broken into three separate groups of cattle: Purebred Angus, Purebred Simmental and 100 Commercial cows. I have approached managing these cattle the way the average North Dakota producer would, by expecting the cow to do her job.
With the utilization of NDSU’s beef experts, we have put in place a strict nutrition and health program in which I can provide the cow with everything she needs to be successful and provide us with a healthy calf every year.

6 2016 North Dakota Beef Report
With my background in agricultural economics, I also have started better tracking production costs and returns per cow and calf to aid in improving our man-agement and genetic selection programs.
Billy OgdahlNDSU Beef Teaching and Research Unit ManagerPhone: 701-799-0528email: [email protected]
NDSU Beef Cattle Research ComplexI can hardly believe that as of May this year, we
have been in operation for five years! We are in the midst of our 20th experiment at the
NDSU Beef Cattle Research Complex. This summer, we are implementing a heat watch system that assists ani-mal handlers in identifying behaviors (signs of estrous) of cycling heifers. This project is a cooperative effort utilizing heifers from the NDSU Dickinson Research Extension Center.
Combining the heat-detection information with data from our Insentec feed troughs, scientists hope to gain insight on cycling females’ feeding behaviors/efficiency during periods of estrous. This project is a multiyear study investigating the impact of frame size, efficiency and longevity in the commercial beef cow herd.
During the last five years, we have conducted research in heifer development, fetal programing with gestational cows, and backgrounding/finishing studies with growing cattle.
Utilizing the advanced technology of the Insentec feed system, NDSU animal scientists continue to invest their research energies in the sustainability of the North Dakota beef industry.
Trent GilberyNDSU Beef Cattle Research Complex ManagerPhone: 701-356-3284email: [email protected]
Carrington Research Extension CenterThe Carrington Research Extension Center (CREC)
has a new animal scientist – Dr. Uchenna Anele. He joined from Agriculture and Agri-Food Canada, Leth-bridge Research Center.
The primary research efforts at the CREC are focused on applied and interdisciplinary research on cow-calf and feedlot cattle. Anele is undertaking some studies on the use of exogenous enzymes to improve fiber digestion of several coproducts and crop residues generated in North Dakota and use of pre- and probiot-ics (synbiotics) in the feedlot. Anele is looking at maxi-mizing the value and use of byproducts generated in
the state with the intent of reducing the cost of finishing cattle.
The livestock unit at Carrington recently expanded its research capability with the addition of an in vitro gas fermentation technique and six cannulated steers for in situ assessment of the nutritional quality of feeds. These two techniques are being used to screen different synbiotics for use in feedlot trials this fall.
Uche Anele Animal ScientistPhone: 701-652-2951email: [email protected]
Central Grasslands Research Extension CenterThe Central Grasslands Research Extension Center
(CGREC) has research responsibilities covering range science, forage agronomy and animal sciences. Histori-cally, the range sciences research program has focused on long-term changes to plant communities in response to grazing management. The forage agronomy program has focused efforts toward variety testing and, recently, cropping systems utilizing cover crops.
The animal science programs are led by two scien-tists, Michael Undi and Bryan Neville. Undi’s research has focused on winter grazing systems, including grazing of crop residues, bale grazing and inter-seeding cover crops into growing corn, as well as supplementa-tion practices to improve animal performance and for-age digestibility of low-quality forages. Undi has further interest in quantifying forage intake under winter graz-ing systems.
Neville’s research has focused on utilizing dried distillers grains with solubles (DDGS) as a supplement to yearling beef cattle grazing native rangelands and has explored the possible implication of supplementation on subsequent feedlot performance as well as meat quality. More recent research is aimed at exploring the impacts of grazing intensity and advancing the season on forage intake and digestibility of yearling steers supplemented with DDGS.
In addition to the work conducted by scientists at CGREC, a number of collaborative efforts are ongoing with scientists from NDSU’s Animal Sciences Depart-ment, as well as scientists from the School of Natural Resources. Some of these efforts include:
•Managementstrategiestoimprovetheutilizationofartificial insemination in beef cows (Carl Dahlen)
•Understandingtheeffectsofmaternalnutritiononearly gestation (Joel Caton)
•Evaluatingtemperamentinbeefcattleasitrelatesto genetic and genomic merit (Lauren Hanna)
•MethodstocontrolKentuckybluegrassinvasionofnative rangelands (Ryan Limb)
2016 North Dakota Beef Report 7
The Central Grasslands REC also has an area Ex-tension specialist located at the center. Fara Brummer leads the Extension efforts at the CGREC. Brummer has worked to establish a number of events, most notably a Winter Grazing Workshop, which was held in the fall of 2015. Brummer also conducts a number of applied and on-farm research activities with county agents from the area, including a bale-grazing project conducted during the winter of 2015-2016.
Bryan Neville Director and Animal ScientistPhone: 701-424-3606email: [email protected]
Dickinson Research Extension CenterWhere is beef research at the Dickinson Research Ex-
tension Center? Perhaps a look at agriculture in general would be good.
Ideally, production agriculture will continue in its present role, but too often the words “sustainable” and “appeasement” are used side by side. The status quo is sufficient.
However, given current data and trends, the sustain-ability of current systems is a subject of spirited discus-sion, particularly if community and population trends are added to the equation. Expandable and, we hope, more sustainable systems need to be evaluated to assess current trends.
In the future, all avenues for additional compensa-tion need to be explored to enhance the economic vi-ability for beef producers and the rural areas associated with beef production. This compensation may come from not only beef but synergistic crop production.
For example, small-grain production systems that integrate rotational cropping practices, high-residue management and annual forages, with attention to wildlife habitat enhancement, could be used to diversify income while opening the door to other value-added opportunities for beef production in concert with crop production.
The Dickinson Research Extension Center, as part of NDSU, takes seriously the need for sustainable beef sys-tems. The center is striving to develop sustainable and integrated production strategies that match conditions of western North Dakota and surrounding regions. The inclusion of forages into traditional cropping systems can provide the resources necessary for the development of integrated production strategies that increase sustain-ability and profitability.
Forage-based cropping systems come closer to the climax native plant community present when home-steaders first arrived in this region. A need exists to
develop agro-ecosystems that optimize the balance between forage-based and grain-based crop/livestock systems reflective of the many individual ecosystems. These integrated systems must be synergistic to, or enhance the native and agronomic plant communities, thus providing the base for future beef production.
In addition, enhanced value for commodities pro-duced from forage-based systems is key. As the general population requires protein, a need met by meat and high-protein crops, meeting this demand is a unique opportunity that a forage-based system integrated with crop production can respond to, in addition to current cropland use.
These thoughts are changing how the Dickinson Research Extension Center addresses the future. Pre-vious work certainly has set baseline production for high-residue cropping systems, grassland systems and livestock systems. However further definition, integra-tion and refinement of these system efforts is critical. Beef production needs to think outside the box and the center also needs to do the same.
Challenging the limits of conventional thinking by linking the components of agricultural management systems with value-added opportunities to ensure long-term sustainability of beef and cropping systems within the environment is critical. In response, a new approach needs to be embraced, a concept of integrated agricul-tural systems that truly entwines crop, beef and forage production as a working unit for betterment of all.
Kris Ringwall Director and Extension Beef SpecialistPhone: 701-456-1103email: [email protected]
Hettinger Research Extension CenterThe Hettinger Research Extension Center (HREC)
is in southwestern North Dakota, four miles from South Dakota and 80 miles from Montana. The range, wildlife and livestock research scientists include Ben Geaumont (range and wildlife scientist) and Christopher Schauer (animal scientist).
Our livestock research facilities include a 200-head calf backgrounding feedlot, 1,000-head lamb finishing feedlot, and a cow herd and sheep flock that are utilized not only at the HREC but in collaboration with the U.S. Department of Agriculture Agricultural Research Ser-vice’s Northern Great Plains Research Lab in Mandan, N.D., a research project near Fort Yates, N.D., and the Central Grasslands REC and the Carrington REC.
Geaumont’s research focus is on evaluating graz-ing systems with cattle and sheep and their impact and synergies with wildlife, pollinators and rangeland
8 2016 North Dakota Beef Report
ecology. His current research projects are evaluating the interactions of wildlife and livestock on prairie dog-impacted grasslands, the utilization of cover crops and sheep grazing in winter wheat production systems. He also is starting a project this year to evaluate the impacts of patch burning in sheep and cattle grazing systems on Conservation Reserve Program lands and the associated impact on rangeland health, pollinators and wildlife habitat.
Schauer’s research focus is on nutritional manage-ment of cattle and sheep in the feedlot, nutritional impacts on male and female reproduction, and livestock management on the grazing systems research conducted by Geaumont. In addition to the previously mentioned collaborative research with Geaumont, Schauer’s cur-rent research is evaluating the impacts of dried distill-ers grains with solubles (DDGS) on male reproduction traits, and a variety of applied lamb finishing research projects evaluating DDGS, particle size, lasalocid, and the interactions of these on lamb growth and produc-tion.
Our newest addition to the HREC staff will be of interest to all livestock producers in the region, especial-ly cattle producers. Through the support of the North Dakota Stockmen’s Association, the North Dakota State Board of Agricultural Research and Education, and the HREC Advisory Board, the HREC was funded this bien-nium for an Extension livestock specialist who will focus on beef production systems.
Janna Kincheloe will start at the HREC this winter as the Extension livestock specialist after she completes her Ph.D. at South Dakota State University under the direc-tion of Ken Olson at the West River Ag Center in Rapid City, S.D. She is a former Extension agent from Montana and has spent her graduate career evaluating beef cattle production systems and working with livestock produc-ers in Montana and South Dakota.
She is our first Extension specialist in the 107-year history of the HREC, and we are excited to add her to our staff. Feel free to contact us if you have questions about her upcoming programs as she begins a new and exciting period for the HREC. She is looking forward to working with the Extension agents and livestock pro-ducers of the region.
We look forward to seeing everyone at the North Dakota Stockmen’s Association meeting this fall.
Christopher Schauer Director and Animal ScientistPhone: 701-567-4323email: [email protected]
2016 North Dakota Beef Report 9
Evaluation of response to vaccination with a bacterial-produced plasmid DNA, Zelnate, on feedlot performance of weaned calves James J. Gaspers1, Kendall C. Swanson1, Faithe E. Keomanivong1, Ananda B.P. Fontoura1, Alison K. Ward1, Evan Knutson1 and Gerald L. Stokka1
1Department of Animal Sciences, NDSU
Our objective was to evaluate the response of a vaccination protocol with Zelnate for bovine respiratory disease complex on growth performance and feeding behavior in recently weaned calves. The use of Zelnate by itself and in combination with a modified live vaccine did not negatively affect growth performance or feeding behavior.
Summary Bovine respiratory disease
complex (BRD) persists as the single most costly disease syndrome asso-ciated with commercial beef pro-duction in the U.S. To help combat this costly inefficiency, cattle pro-ducers have implemented vaccina-tion protocols for their beef herds. Exposing an animal to an antigen can affect their performance in the feedlot negatively (Stokka et al., 1994). To investigate the effects of vaccination on feedlot performance, newly weaned calves (n = 65) were adapted to the Insentec roughage feeders at NDSU’s Beef Cattle Re-search Center. Treatment one was a 2-milliliter (ml) sterile saline nega-tive control subcutaneously injected in the neck. Treatment two was a 2-ml MLV (IBR, PI3, BRSV, BVDV type 1 and 2) vaccine in combination with a Mannheimia haemolytica toxoid injected subcutaneously in the neck. Treatment three was 2 ml of Zelnate injected intramuscularly into the neck, and treatment four was a 2-ml MLV (IBR, PI3, BRSV, BVDV type 1 and 2) vaccine in combination with Mannheimia haemolytica toxoid and 2 ml of Zelnate. Calves were vac-
cinated on day 0 of the trial, and weights and blood samples were collected on days 0, 1, 3, 6 and 28 of the trial. Feeding intake and behav-ior were unaffected by the use of vaccines. All feedlot performance variables were not different among treatment groups. The use of an im-mune stimulant, Zelnate, by itself or in combination with a modified live virus to newly weaned calves may bolster the calves’ ability to fight off infectious agents without negatively affecting feeding behavior or feedlot performance.
Introduction In livestock, the major causes of
death preceding slaughter are due to infectious diseases (Babiuk, 2002). Bovine respiratory disease complex (BRD) persists as the single most costly disease syndrome associated with the commercial beef produc-tion in the U.S., accounting for losses in 2010 of 1,055,000 animals valued at $643 million (NASS, 2011). Increased morbidity and mortality, decreased weight gains, decreased feed utilization and decreased carcass quality account for the eco-nomic losses associated with BRD (Edwards, 2010).
BRD originally was termed “shipping fever” because signs often occur shortly after arrival at the feedlot (Urban-Chmiel and Grooms, 2012). The morbidity risk of BRD cases in feedlot cattle occurs in the first 45 days after arrival at the feedlot, and the highest risk occurs in weeks 1 to 3. After that, morbid-ity declines (Buhman et al., 2000; Edwards, 1996).
Vaccination for viruses and bacteria associated with BRD are widespread (Taylor et al., 2010). The viral component of BRD con-sists of bovine herpesvirus type 1, also known as infectious bovine rhinotracheitis (IBR); bovine viral diarrhea (BVD); parainfluenza virus type 3 (PI-3); and bovine respira-tory syncytial virus (BRSV) (Urban-Chmiel and Grooms, 2012). The bacterial component of BRD consists of Mannheimia haemolyticam, Pasteu-rella multocida and Histophilus somni (Urban-Chmiel and Grooms, 2012).
Killed and modified live vac-cines (MLV) are available in differ-ent combinations of viral pathogens (Urban-Chmiel and Grooms, 2012). The appropriate use of these vac-cines can reduce the risk of BRD (Urban-Chmiel and Grooms, 2012). The immune responses, which include antigen-specific antibod-ies, have been shown to confirm vaccine-induced protection against numerous diseases (Casadevall, 2004).
To elicit a vaccine response, the vaccine must provide enough sig-nals from the antigen, or with an ad-juvant, to trigger the inflammatory
10 2016 North Dakota Beef Report
reaction that is mediated by cells of the innate immune system (Hoebe et al., 2004). Injection of a vaccine antigen initiates an acute phase in-flammatory response, which devel-ops within minutes (Tizard, 2013). In addition, sentinel cells synthesize and secrete a mixture of molecules that trigger inflammation and initi-ates the first steps of the adaptive immune system (Tizard, 2013).
Immunity is achieved by the maintenance of antigen-specific immune effectors and/or by the induction of immune memory cells that can reactivate if re-exposed to the antigen. These antigen-specific antibodies have been shown to confirm vaccine-induced protection against numerous diseases.
The time required to induce antigen-specific antibodies is ap-proximately 14 days. This delayed response may not confer immunity in time to protect high-risk cattle entering the feedlot. Classically, this delayed response has been covered by the use of prophylactic antibiotic regimes across the first 14 to 28 days to at-risk cattle in the feedlot.
Zelnate is a bacterial-produced DNA liposome that has been shown to increase innate immune cell activity and decrease morbidity and mortality risks in calves exposed to challenge models (Bayer Health-care Animal Health). This ability to enhance the innate immune system and defend against Mannheimia haemolytica within 24 hours may improve feedlot calf health. In addi-tion, enhancing preventive vaccine protocols can result in a more judi-cious use of antimicrobial treatment regimens.
The objective of this study is to evaluate the response of a vac-cination protocol with Zelnate for bovine respiratory disease complex on feedlot performance in newly weaned backgrounding steers.
Experimental ProceduresAnimal care and use was ap-
proved by the Institutional Animal Care and Use Committee at NDSU, Fargo. This study utilized 65 weaned commercial Angus and Simmental beef calves born Jan. 1, 2015, to March 31, 2015, at NDSU beef barns.
At birth, the calves were vac-cinated with Inforce 3 (Zoetis; 100 Campus Drive, Florham Park, NJ 07932) administered via the in-tranasal route and Ultrabac C & D (Zoetis) administered via the subcutaneous route. On April 1, 2015, calves were vaccinated with Bovishield Gold 5 and Ultrabac 7 subcutaneously and received Decto-max administered via the subcuta-neous route. On Sept. 1, 2015, calves received Bovishield Gold VL5 and One Shot Ultra 7 subcutaneously and Dectomax as a pour-on.
Calves were weaned 30 days be-fore being transported to the NDSU Beef Cattle Research Complex. Upon arrival on Oct. 15, 2015, calves (n = 65, body weight [BW] = 797 ± 20.2) were trained for 21 days to the In-sentec Roughage Feeders (Insentec; Insentec B. V. Repelweg 10, 8316 PV Marknesse, The Netherlands).
Insentec Roughage Feeders measure feed intake and time of each visit, dry-matter intake (DMI), time spent at the feeder measured in minutes and the number of visits, and the number of meals can be calculated. Body weight was deter-mined on days minus 21, 0, 1, 3, 6, 28 and 29, and average daily gain (ADG), feed conversion ratio (FCR) and gain-to-feed ratio (G:F) were calculated.
Time spent at the feeder, the number of visits and meals were cal-culated on a 24-hour cycle. A meal is defined as a distinct, separate eating period and visit not separated by intervals longer than seven minutes.
On day 0, calves were blocked
by weight, randomly assigned and administered one of four possible treatments. Treatment one was a 2-ml sterile saline negative con-trol subcutaneously injected in the neck. Treatment two was a 2-ml MLV (IBR, PI3, BRSV, BVDV type 1 and 2) vaccine in combination with a Mannheimia haemolytica toxoid injected subcutaneously in the neck. Treatment three was 2 ml of Zelnate injected intramuscularly into the neck. Treatment four was a 2-ml MLV (IBR, PI3, BRSV, BVDV type 1 and 2) vaccine in combination with Mannheimia haemolytica toxoid and 2 ml of Zelnate.
All data were analyzed using the mixed procedure of SAS (SAS Ins. Inc., Cary, N.C.). Significance was determined with an alpha of P ≤ 0.05.
Results and Discussion During an immune response
to a pathogen, upregulated signal molecules can have adverse effects on temperature regulation, appetite, energy metabolism and endocrine functions (Klasing, 1988). This could be induced by vaccines with enough antigenic load or adjuvant to elicit a significant immune response. How-ever, in this study, feeding behavior and growth performance were not negatively affected by the injection of a modified live vaccine and adju-vant or a bacterial-produced DNA liposome (See tables 1 and 2).
Treatments one and three tended to have an increased DMI per minute vs. the other two treat-ments (P = 0.06). Treatment one was the negative sterile saline control and treatment three was the bacte-rial-produced DNA liposome. This tendency was only for an increase of a hundredth of a pound of feed (DM basis) per minute and was not associated with improved growth performance when compared across treatment groups.

2016 North Dakota Beef Report 11
The calves used in this study were exposed to vaccine antigens three times prior to the study, were from the same herd and were al-lowed to acclimate to their new environment for 21 days before the start of this study. Our results suggest that feeding behavior and growth performance were not nega-tively affected by the injection of a modified live vaccine and adjuvant or a bacterial-produced DNA lipo-some.
Results using high-stress ani-mals that are weaned, vaccinated and comingled with calves from different herds may have much different results. Further research is needed to evaluate unvaccinated, immune-naïve calves that are weaned and brought together in a backgrounding feedlot environment.
AcknowledgmentsThe authors thank Zoetis and
Bayer for the product support of this project and the staff of the NDSU Beef Cattle Research Complex for assistance with sampling, animal husbandry and handling.
Literature CitedBabiuk, L.A. 2002. Vaccinations: a man-
agement tool in veterinary medicine. Vet. J. 64:188-201.
Buhman, M.J., L.J. Perino, M.L. Galy-ean, T.E. Wittum, T.H. Montgomery and R.S. Swingle. 2000. Association between changes in eating and drink-ing behaviors and respiratory tract disease in newly arrived calves at a feedlot. Am. J. Vet. Res. 61:1163- Casa-devall, A. 2004. The methodology for determining the efficacy of antibody-mediated immunity. J. Immunol. Methods. 291:1-10.1168.
Edwards, T.A. 2010. Control methods for bovine respiratory disease for feedlot cattle. Vet. Clin. N. Am-Food An. 26(2)-273-284.
Hoebe, K., E. Janssen and B. Beutler. 2004. The interface between innate and adaptive immunity. Nat. Immu-nol. 5:971-974.
Klasing, K.C. 1988. Nutritional aspects of leukocytic cytokines. J. Nutr. 118:1436-1446.
Table 1. Influence of vaccination on feeding behavior in backgrounding steers.
Treatmenta
Item 1 2 3 4 SEMb P Value
DMI 18.1 18.3 19 18.7 0.59 0.67Eating events, no./day Visits 23.9 28.9 29.7 26.1 2.5 0.35 Meals/d 10.1 10.5 10.9 9.9 0.83 0.54Eating time, minutes Per visit 6.82 7.17 5.74 7.24 0.55 0.21 Per meal 16.3 17.5 15.2 18.2 1.2 0.25 Per day 157 171 161 173 5.8 0.15Feed DMI, lbs. Per visit 0.79 0.76 0.68 0.8 0.06 0.47 Per meal 1.89 1.86 1.79 2 0.13 0.77 Per minute 0.12 0.11 0.12 0.11 0.003 0.06
a1: Sterile saline, 2: Bovishield Gold/Oneshot, 3: Zelnate, 4: Bovishelied Gold/ Oneshot + Zelnate bStandard error of the mean (n = 65).
Table 2. Influence of vaccination on growth performance in backgrounding steers.
Treatmenta
Item 1 2 3 4 SEMb P Value
Initial BW, lbs. 802 782 793 799 19.9 0.89Final BW, lbs. 857 846 854 864 21.9 0.95Gain, lbs. 54.5 64.1 60.3 64.8 6.22 0.62Weight change 3 day 1.24 12.09 5.00 5.11 4.43 0.38 6 day 3.61 13.03 4.06 5.71 3.86 0.29ADGc 1.95 2.29 2.15 2.32 0.22 0.62G:F 0.10 0.12 0.11 0.10 0.01 0.47
a1: Sterile saline, 2: Bovishield Gold/Oneshot, 3: Zelnate, 4: Bovishelied Gold/ Oneshot + Zelnate bStandard error of the mean (n = 65). cCalculated by dividing the total gain calculated from the average initial and final weights by 28 days
NASS. 2011. Cattle and calf death losses. http://usda.mannlib.cornell.edu/ usda/current/CattDeath/CattDeath- 05-12-2011.pdf (access ed June 10, 2015)
Stokka, G.L., A.J. Edwards, M.F. Spire, R.T. Brandt Jr. and J.E. Smith. 1994. Inflammatory response to clostridial vaccines in feedlot cattle. J. Am. Vet. Med. Assoc. 204:415-419.
Taylor, J.D., R.W. Fulton, T.W. Lehenbau-er, D.L. Step and A.W. Confer. 2010. The epidemiology of bovine respira-
tory disease: what is the evidence for preventive measures? Can. Vet. J. 51(2):1351-1359.
Tizard, I.R., 2013. Innate immunity: The proinflammatory and antimicrobial mediators. In: I.R. Tizard, editor, Vet-erinary immunology an introduction, 9th ed. W.B. Saunders, Philadelphia, Pa. p. 21-29.
Urban-Chmiel, R., and D.L. Grooms. 2012. Prevention and control of bo-vine respiratory disease. J. Livestock Sci. 3:27-36.
12 2016 North Dakota Beef Report
Seasonlong grazing intensity and parasite load in yearling steers in the northern Great PlainsFara Brummer1, Gerald Stokka2 and Claire Miller3
1Central Grasslands Research Extension Center, NDSU 2Department of Animal Sciences, NDSU 3Veterinary Diagnostic Laboratory, NDSU
A study to evaluate parasite loads with respect to stocking rates in grazing steers was conducted at the Central Grassland Research Extension Center. Results of this study suggest that parasite loads differ in intensity as stocking rates increase, that injectable deworming efficacy is consistent with product claims, and that in spite of repeated seasonlong grazing in the northern Great Plains, parasite load is relatively low. This study also confirms that individual animal parasite load is highly variable and suggests that susceptible young animals may exhibit higher parasite loads in heavily grazed pastures than in moderately or lightly grazed pastures.
Summary Intestinal parasitism of graz-
ing ruminants can result in poor performance and compromised systems, especially in younger ani-mals, which are intrinsically more susceptible to infection (Stromberg and Gasbarre, 2006). In animals on pasture, the pattern of forage and fecal distribution is affected by the grazing system that is in place, which can be planned systematically to reduce transmission of parasites in grazing animals (Smith et. al, 2009). The intestinal parasite load in four long-term grazing intensity treatments from a light stocking rate to an extreme stocking rate was examined to evaluate the hypothesis that as cattle stocking rates increase in seasonlong systems, the parasite load within animals also increases. This study was conducted in the last year of a 26-year grazing intensity trial in the Missouri Coteau region
of the northern Great Plains at the Central Grasslands Research Exten-sion Center. Twelve pastures were stocked with yearling steers from mid-May to mid-October 2015 at four grazing intensities, as they had been for 25 years prior to this study: light (35 percent plant removal), moderate (50 percent plant remov-al), heavy (65 percent plant removal) and extreme (80 percent plant removal) (Patton and Nyren, 2015). Results demonstrated an increase in parasite load as grazing pressure increased through time. A difference in parasite egg counts per gram was detected among treatment groups (P ≤ 0.05) in July. Injectable worm-ing treatment before turnout proved effective in the early part of the grazing season because we found no difference among treatments in egg counts in June. In this study, the parasite load also appeared to be somewhat pasture-specific. We observed that the heaviest overall load was in pasture 6, which had an extreme stocking rate. As expected, individual animals within treatment groups showed variable susceptibil-
ity to parasitism. In August, indi-vidual animals in moderate, heavy and extreme treatments had eggs per gram (epg) at 100 or more. Egg counts of more than 100 epg is a baseline level for concern in animal performance and health (Stromberg et. al., 1997). This study demon-strates an association between high stocking density and increases in de-tectable parasite load, and supports the conclusion that yearling cattle performance may be impacted by increasing parasitism in seasonlong systems that are heavily stocked, even in the northern Great Plains, where the parasite load typically is not considered a significant issue.
Introduction Internal parasites in young graz-
ing animals can compromise perfor-mance due to parasitic gastroenteri-tis and/or competition for nutrients. Grazing management can encourage or discourage parasite load, depend-ing on cattle exposure to plant base level and time spent in pasture.
Weight gain in weaned, yearling ruminants typically occurs through pasturing on grass in the warmer months, so animal performance is essential for cost-effective returns. Intestinal parasites are common inhabitants of pastures, and high levels of parasitism can result in decreased gains, which will decrease the economic potential of the animal (Mertz et. al, 2009).
Intestinal parasites referred to as strongyles include many com-mon cattle pathogens, such as the cattle hookworm, barber’s pole worm, brown stomach worm and hair worm, and are implicated in reduced production in cattle (Fox,

2016 North Dakota Beef Report 13
1997). This group is in the nematode family and has a direct lifecycle in which eggs or young larvae are ingested, develop into adults within the digestive system of the animal and are finally shed in the manure as a second generation of eggs (Fo-reyt, 2001).
While some level of parasit-ism is normal, excessive loads can weaken animals, cause a decrease in feed intake and reduce the immune system. Gastrointestinal parasitism also can have a greater impact on younger grazing animals because they can be naive upon exposure (Stromberg and Gasbarre, 2006).
The potential parasite load is in-tensified as the animal grazes closer to the base of the plant near the ground (Silangwa, 1964). Although grazing animals typically will avoid manure-soiled areas, heavy grazing pressure for an extended time can expose them to more contaminated areas, which can increase the risk of acquiring a large worm burden.
Interventions, including de-worming cattle early in the season before turnout, can be beneficial to cattle producers. Unfortunately, deworming efficacy can be variable and, depending on the product used and the parasite being treated, can be as low as 42 percent (Gasbarre et. al., 2009).
Experimental Procedures This study was conducted at the
Central Grasslands Research Exten-sion Center in Stutsman County northwest of Streeter, N.D., in the Missouri Coteau region. Animal handling and care procedures in this study were approved by the NDSU Animal Care and Use Committee.
Twelve pastures were stocked with yearling steers starting May 13, 2015. These pastures have been grazed at the same intensities for 26 years. The target was to leave 65, 50, 35 and 20 percent of the forage produced in an average year on the
light, moderate, heavy and extreme treatments, respectively. Therefore, yearling cattle grazed 35 percent of the light treatment, 50 percent of the moderate treatment, 65 percent of the heavy treatment and 80 percent of the heavy treatment. Each graz-ing treatment was replicated three times.
Pasture size was 30 acres, on average. Grazing animals shared a common water source, although some pastures had individual open water.
Two hundred steers were al-located across the four treatment groups. Our study sampled a mini-mum of 10 animals from each rep-lication or 30 percent of the group, whichever was greater. Therefore, the light treatments with the low stocking rate had fewer sampled animals than the extreme treatment with the high stocking rate.
Prior to turnout, all animals were weighed and then randomly chosen from within assigned treat-ment groups for inclusion in the study. Fecal samples were collected rectally from these animals before deworming. All steers then were dewormed with Dectomax inject-able wormer subcutaneously at a dose of 1 cc/110 pounds of live body weight.
During the study period, all cattle were brought in from the pastures to a central point in the field and weighed monthly using a portable livestock chute and digital scale (Weigh-Tronix). Fecal samples were collected from the treatment steers at each weighing period. The same animals in each treatment group replication were used for sampling throughout the course of the study.
All steers also were implanted with Revalor-G to enhance live weight gains. On pasture, all ani-mals were supplemented daily with dry distillers grains with solubles at 0.3 percent of body weight.
Samples were processed for analysis using the Modified Stoll Test (Zajac and Conboy, 2012) and then analyzed under a microscope for the egg per gram of feces. Fecal samples were analyzed by the same two individuals for the duration of this study. Egg counts were trans-formed and geometric means were used for analyses (PROC GLM SAS 9.4) (Smothers et.al., 1999).
Results and DiscussionStrongyle egg counts differed
among certain treatment groups in May, prior to the administration of Dectomax; however, these differ-ences were not apparent in June, demonstrating the efficacy of the deworming treatment. In July (Fig-ure 1), strongyle egg counts began to increase.
The extreme treatment had sig-nificantly higher egg counts than the light treatment (P ≤ 0.05). Moderate and heavy fell between these two values but were not significantly different from each other. We also observed that pasture 6, an extreme treatment, had the greatest number of strongyle egg counts through the course of the study.
In August and September, egg counts per gram were above a baseline of 100 in 23 percent of the animal total in the extreme stocking rate treatment, indicating potentially significant economic parasitism (Zajazc and Conboy, 2012).
Individual animal egg counts were highest in August (Figure 2). Although not statistically different in August, the difference in indi-vidual animals within treatment groups is worth noting. The light grazing treatments all showed lower levels of egg counts throughout the course of the study. The moderate and heavily grazed pastures varied, with some pastures tending toward higher loads and others staying relatively low.

14 2016 North Dakota Beef Report
the growing forage was defoliated by grazing cattle before removal, fecal egg count means were consis-tently highest among treatments and significantly different in July.
Mid-July and August are pas-ture periods of lower forage quality in native and introduced pasture systems. Because this was the period of increased level of parasitism in this study with yearling cattle, per-formance could stagnate or decrease with the added burden of high levels of parasitism.
Ensuring that grazing yearling animals remain in peak performance to capitalize on ranch resources and investments is imperative. Grazing management should target animal movement and sustainable stocking rates to avoid risking high rates of gastrointestinal parasitism in graz-ing young animals.
Literature Cited Foreyt, W.J. 2001. Parasites of Cattle,
Sheep, and Goats. In: Veterinary Parasitology, Fifth Edition, Iowa State University Press
Fox, M., 1997. Pathophysiology of infec-tion with gastrointestinal nematodes in domestic ruminants: recent devel-opments. Vet. Parasitol. 72, 285-297
Gasbarre, L.C., L.L. Smith, J.R. Lichten-fels and P.A. Pilitt. 2009. The iden-tification of cattle nematode para-sites resistant to multiple classes of anthelmintics in a commercial cattle population in the U.S. Vet. Parasitol. 166: 281-285
Mertz, K.J., M.B. Hildreth and W.B. Ep-person. 2005. Assessment of the effect of gastrointestinal nematode infesta-tion on weight gain in grazing beef cattle. Am. J. Vet. Res. 226. 5: 779-783
Patton, B., and A. Nyren. 2015. Long-term Grazing Intensity Research in the Missouri Coteau Region of North Dakota: Livestock Response and Eco-nomics – Final Report. North Dakota State University Central Grasslands Research Extension Center 2015 Annual Report, Streeter, N.D. North Dakota State University – Central Grasslands Research Extension Cen-ter. P. 19-27.
3
treatment steers at each weighing period. The same animals in each treatment group replication were used for sampling throughout the course of the study.
All steers also were implanted with Revalor-G to enhance live weight gains. On pasture, all animals were supplemented daily with dry distillers grains with solubles at 0.3 percent of body weight.
Samples were processed for analysis using the Modified Stoll Test (Zajac and Conboy, 2012) and then analyzed under a microscope for the egg per gram of feces. Fecal samples were analyzed by the same two individuals for the duration of this study. Egg counts were transformed and geometric means were used for analyses (PROC GLM SAS 9.4) (Smothers et.al., 1999).
Results and Discussion
Strongyle Egg Counts and Grazing Treatment
Strongyle egg counts differed among certain treatment groups in May, prior to the administration of Dectomax; however, these differences were not apparent in June, demonstrating the efficacy of the deworming treatment. In July (Figure 1), strongyle egg counts began to increase.
The extreme treatment had significantly higher egg counts than the light treatment (P≤0.05). Moderate and heavy fell between these two values but were not significantly different from each other. We also observed that pasture 6, an extreme treatment, had the greatest number of strongyle egg counts through the course of the study.
In August and September, egg counts per gram were above a baseline of 100 in 23 percent of the animal total in the extreme stocking rate treatment, indicating potentially significant economic parasitism (Zajazc and Conboy, 2012).
Individual animal egg counts were highest in August (Figure 2). Although not statistically different in August, the difference in individual animals within treatment groups is worth noting. The light grazing treatments all showed lower levels of egg counts throughout the course of the study. The moderate and heavily grazed pastures varied, with some pastures tending toward higher loads and others staying relatively low.
Average daily gains of animals in this study were not analyzed relative to pasture load due to other variables in the study, such as protein supplementation and fluctuating forage quality.
1Data for egg counts per gram were transformed to a geometric means for comparitive analyses as represented in this figure.
Treatments labeled with the same letter are not statistically different at the p = 0.05 level.
1.0 2.3 1.9 3.00.0
0.5
1.0
1.5
2.0
2.5
3.0
3.5
4.0
Light Moderate Heavy Extreme
Ston
gyle
Egg
s/Gr
am
Stocking Rates
Figure 1: Strongyle Eggs/Gram1
July 2015
c
abbc
a
Figure 1. Srongyle Eggs/Gram1, July 20151Data for egg counts per gram were transformed to a geometric means for comparitive analyses as represented in this figure. Treatments labeled with the same letter are not statistically different at the p = 0.05 level.
4
Yearling cattle that graze on the northern Great Plains should capitalize on forage resources for maximum economic benefit to the producer. Gastrointestinal parasitism can affect performance because young animals still are developing immunity to parasites. A three-year study conducted on nine ranches in South Dakota showed that beef yearling gains were greater in dewormed animals, compared with control animals (Mertz et.al, 2005).
Our study examined parasite load relative to grazing treatment. While deworming products are effective and relatively inexpensive, efficacy of treatment, as expected, did not last for this five-monthlong seasonlong grazing study. Product efficacy was consistent within a four- to six-week window.
Seasonlong grazing potentially exposes grazing animals repeatedly to contaminated pastures, especially as grazing pressure increases with stocking rates. At the extreme level of grazing, in which 80 percent of the growing forage was defoliated by grazing cattle before removal, fecal egg count means were consistently highest among treatments and significantly different in July.
Mid-July and August are pasture periods of lower forage quality in native and introduced pasture systems. Because this was the period of increased level of parasitism in this study with yearling cattle, performance could stagnate or decrease with the added burden of high levels of parasitism.
Ensuring that grazing yearling animals remain in peak performance to capitalize on ranch resources and investments is imperative. Grazing management should target animal movement and sustainable stocking rates to avoid risking high rates of gastrointestinal parasitism in grazing young animals.
0
50
100
150
200
250
300
350
Stro
ngyl
e Eg
gs/G
ram
Stocking Rates
Figure 2: Individual Animal Strongyle Egg/Gram CountsAugust 2015
Light Moderate Heavy ExtremeFigure 2. Individual Animal Strongyle Egg/Gram Counts, August 2015
4
Yearling cattle that graze on the northern Great Plains should capitalize on forage resources for maximum economic benefit to the producer. Gastrointestinal parasitism can affect performance because young animals still are developing immunity to parasites. A three-year study conducted on nine ranches in South Dakota showed that beef yearling gains were greater in dewormed animals, compared with control animals (Mertz et.al, 2005).
Our study examined parasite load relative to grazing treatment. While deworming products are effective and relatively inexpensive, efficacy of treatment, as expected, did not last for this five-monthlong seasonlong grazing study. Product efficacy was consistent within a four- to six-week window.
Seasonlong grazing potentially exposes grazing animals repeatedly to contaminated pastures, especially as grazing pressure increases with stocking rates. At the extreme level of grazing, in which 80 percent of the growing forage was defoliated by grazing cattle before removal, fecal egg count means were consistently highest among treatments and significantly different in July.
Mid-July and August are pasture periods of lower forage quality in native and introduced pasture systems. Because this was the period of increased level of parasitism in this study with yearling cattle, performance could stagnate or decrease with the added burden of high levels of parasitism.
Ensuring that grazing yearling animals remain in peak performance to capitalize on ranch resources and investments is imperative. Grazing management should target animal movement and sustainable stocking rates to avoid risking high rates of gastrointestinal parasitism in grazing young animals.
0
50
100
150
200
250
300
350
Stro
ngyl
e Eg
gs/G
ram
Stocking Rates
Figure 2: Individual Animal Strongyle Egg/Gram CountsAugust 2015
Light Moderate Heavy Extreme
Average daily gains of animals in this study were not analyzed relative to pasture load due to other variables in the study, such as pro-tein supplementation and fluctuat-ing forage quality.
Yearling cattle that graze on the northern Great Plains should capitalize on forage resources for maximum economic benefit to the producer. Gastrointestinal parasit-ism can affect performance because young animals still are developing immunity to parasites. A three-year study conducted on nine ranches in South Dakota showed that beef yearling gains were greater in
dewormed animals, compared with control animals (Mertz et.al, 2005).
Our study examined parasite load relative to grazing treatment. While deworming products are ef-fective and relatively inexpensive, efficacy of treatment, as expected, did not last for this five-monthlong seasonlong grazing study. Product efficacy was consistent within a four- to six-week window.
Seasonlong grazing potentially exposes grazing animals repeatedly to contaminated pastures, especially as grazing pressure increases with stocking rates. At the extreme level of grazing, in which 80 percent of
2016 North Dakota Beef Report 15
Silangwa, A.M., and A.C. Todd. Vertical migration of trichostrongyle larvae in grasses. J Parasitol 1964. 50: 278-285
Smith, L.A., G. Marion, D.L. Swain, P.C.L. While and M.R. Hutchings. 2009. The effect of grazing man-agement on livestock exposure to parasites via the faecal-oral route. Preventative Veterinary Medicine. 91: 95-106
Smothers, C.D., F. Sun and A.D. Dayton. 1999. Comparison of arithmetic and geometric means as measures of a central tendency in cattle nematode populations. Vet. Parasitol. 81:211-224
Stromberg, B.E., and L.C. Gasbarre, 2006. Gastrointestinal Nematode Control Programs with an Emphasis on Cattle. Vet Clin Food Anim. 22: 543-565
Stromberg, B.E, R.J. Vatlhauer, J.C. Schlotthauer, G.H. Myers and D.L. Haggard. 1997. Production responses following strategic parasite control in a beef cow/calf herd. Vet. Parasitol. 68:315-322.
Zajac, A.M., and G.A. Conboy. Veteri-nary Clinical Parasitology. 2012. 8th ed. Blackwell Publishing, United Kingdom.
Effect of two beef cattle yearling steer production systems on grazing and feedlot performance, carcass measurements and systems economicsSentürklü Songül1,2, Douglas Landblom1, Robert Maddock3 and Steve Paisley4
1Dickinson Research Extension Center, NDSU 2Animal Science Department, Canakkale Onsekiz Mart Universitesi, BMYO, Canakkale, Turkey 3Animal Sciences Department, NDSU 4Animal Science Department, University of Wyoming, Laramie
A three-year study of a retained-ownership, vertically integrated, extended-grazing system for steers that included grazing of native and annual forages prior to feedlot entry was compared with a system in which steers were sent directly to the feedlot for growing and finishing. The results suggest that a long-term extended grazing system consisting of a combination of native range, annual forages and a shortened feedlot residency supports superior steer performance, acceptable meat quality and profitability.
SummaryIn western North Dakota,
yearling steers graze improved and native pastures and routinely are sold during an August-September time frame. Traditional feedlot finishing is a high-risk, low-profit-margin business in which risk is managed using risk management financial instruments. The research question, integrated into a diverse
cropping system, was to determine the impact of a long-term grazing period followed by a short-term feedlot finishing period on yearling steer performance, meat quality and profitability. To answer this question, a three-year study was designed using 288 yearling steers (96 steers/year) originating from two beef cattle herds maintained at the Dickinson Research Extension Center (DREC) that were divided into two frame score groups identi-fied as small frame (SF: average frame score of 3.80) and large frame (LF: average frame score of 5.58) and backgrounded at a modest average daily gain (ADG) of 1.33 pounds/
day. On the first week of May each year, the steers were assigned ran-domly to feedlot (FLOT) or grazing (GRAZ) treatments. Both treatment groups of steers were finished at the University of Wyoming’s Sustain-able Agriculture Research Exten-sion Center (SAREC) in Lingle. The GRAZ steers grazed native range from the first week of May until mid-August (108 days), field pea-barley (32 days) and unharvested grain corn (71 days) for a total graz-ing period of 211 days and a finish-ing period of 82 days. The FLOT control steers were in the feedlot for 218 days. SF steers grew slower in the grazing phase (P = 0.03) and feedlot finishing growth phase (P < 0.001) in comparison with the LF steers (P < 0.001). However, under grazing conditions, grazing cost and cost/pound of gain were less for the SF steers in comparison with the LF steers ($250.27 vs. $300.27/steer; $0.5567 vs. $0.6078/pound of gain). Delaying feedlot entry resulted in improved animal performance and profitability. In the feedlot, GRAZ LF steers had greater starting weight (P < 0.001), ending weight (P =
16 2016 North Dakota Beef Report
0.003), gain (P < 0.001) and ADG (P < 0.001). GRAZ steer compensatory feedlot gain for LF and SF steers was 26.8 and 24.0 percent greater, respec-tively, compared with the LF and SF FLOT treatment steers. GRAZ steer hot carcass weight (HCW) was greater for both frame score groups, compared with the FLOT steers (P = 0.005). Dressing percent (P < 0.001) and marbling score (P = 0.02) were greater for SF steers and rib-eye area was greater for the LF steers (P = 0.001). Quality grade did not differ between systems or frame score, and we found no meat tenderness (P = 0.48) or cooking loss (P = 0.43) dif-ferences between treatment groups. In the feedlot finishing phase, comparing the average FLOT and GRAZ systems, the finishing feed cost/pound of gain for the GRAZ system averaged 34.0 percent less (P < 0.001). Economic analysis of the vertical integration suggested that greater net return would be realized after delayed feedlot finishing, com-pared with selling the steers at the end of the 211-day grazing period. Net return from selling at the end of grazing was calculated to be $514.02 and $577.74/steer for the GRAZ LF and SF, respectively. At the end of finishing, the three-year average sys-tems net return/steer was $619.94, $499.90, $896.09 and $756.92 for the FLOT LF and SF, and GRAZ LF and SF, respectively. Regardless of frame score, grazing growing steers for an extended period of time was more profitable than traditional feedlot growing and finishing. The greater profitability among the GRAZ steers was realized from a combination of lower grazing and feedlot expenses, feedlot compensatory growth and greater HCW, resulting in a greater and profitable net return for the GRAZ system.
IntroductionThe forage quality of improved
and native grass species is highest in the spring and early summer and declines in the summer and into fall and early winter, which is one of the primary reasons yearling stocker cattle routinely are marketed during the August-September time frame in the northern Great Plains. Long-term grazing followed by a short-term feedlot period has the potential to be a profitable enterprise, but for-ages that provide adequate nutrition during the period when perennial forages have lost substantial nutri-ent quality are needed.
One potential solution for beef producers is to grow annual for-ages for grazing within a diverse crop rotation. Strategically plant-ing crop mixes and cover crops in a crop rotation preceding or following higher-value crops improves soil nutrient cycling and can provide for a longer-term forage source for year-ling steers before feedlot entry.
In an extensive review article comparing calf-fed with yearling-fed cattle, when body weight (BW) or age increased before feedlot entry, average daily gain (ADG), dry-matter intake (DMI) and hot carcass weight (HCW) increased, whereas gain:feed (G:F) and days on feed (DOF) decreased (Reuter and Beck, 2013). Adams et al. (2004) documented that increasing grazing length among gestating June-calving cows and feeding supplemental pro-tein increased net return of the calf at weaning and at slaughter.
Considering the effect that increased BW and age have on steer performance and carcass weight, the objective of this research was to evaluate, within the context of a retained-ownership, vertically integrated model, the impact of a long-term grazing period made pos-sible by integrating annual forage grazing into a diverse crop rotation followed by a short-term feedlot fin-
ishing period to determine the effect on yearling steer performance, meat quality and profitability.
Experimental ProceduresDuring a three-year period,
288 yearling steers (96 steers/year) from two crossbred beef cattle herds maintained at the Dickinson Re-search Extension Center were used for this study. Traditional and Low-line sired calves were divided into two frame score groups identified as small frame (SF: average frame score of 3.80) and large frame (LF: average frame score of 5.58).
After weaning each fall (2012, 2013 and 2014), the steers were managed as a single group and backgrounded by grazing unhar-vested corn that was supplemented with mixed hay (alfalfa, bromegrass, crested wheatgrass) and 2 pounds/steer/day of a 32 percent crude protein supplement until the end of April each year.
During the multiyear back-grounding period, the steers grew at a modest ADG of 1.33 pounds/day. The first week of May each year, the steers were assigned randomly to the feedlot (FLOT) or grazing (GRAZ) treatments.
FLOT treatment steers were shipped directly to the University of Wyoming’s Sustainable Agriculture Research Extension Center (SAREC) in Lingle for growing and finish-ing. The GRAZ steers grazed native range from the first week of May to mid-August (108 days) and then moved into a diverse crop rotation grazing field pea-barley intercrop (32 days) and unharvested corn (71 days).
The grazing season cost/steer for native range was determined using a constant cost/pound of BW of $0.00117 multiplied by the start weight and end weight to arrive at a daily grazing cost. Then, using one-half of the total number of days grazed, the first half and second
2016 North Dakota Beef Report 17
half grazing charges were added together to arrive at the total grazing charge/steer.
The annual forage grazing cost for the SF steers was reduced by 20.1 percent, based on SF heifer DMI results reported by Senturklu et al. (2015). The overall total grazing pe-riod was 211 days before shipment to the University of Wyoming’s SAREC feedlot.
The final finishing diet (AF Basis) consisted of 5 percent alfalfa hay, 79 percent whole corn, 14 per-cent haylage and 2 percent feedlot supplement with Rumensin (200 milligrams/head/day).
Due to system differences, the FLOT control steers were slaugh-tered in mid-December and GRAZ treatment steers were slaughtered in February-March at the Cargill Meat Solutions packing plant in Ft. Mor-gan, Colo. Warner-Bratzler shear force tenderness and cooking loss evaluations were conducted at the NDSU Meats Laboratory in Fargo.
Using a vertically integrated economic analysis approach, eco-nomics for the two systems and frame scores were evaluated to compare selling the steers at the end of the extended grazing period with selling them at the end of the feedlot finishing period.
Results and DiscussionFarming expenses for the an-
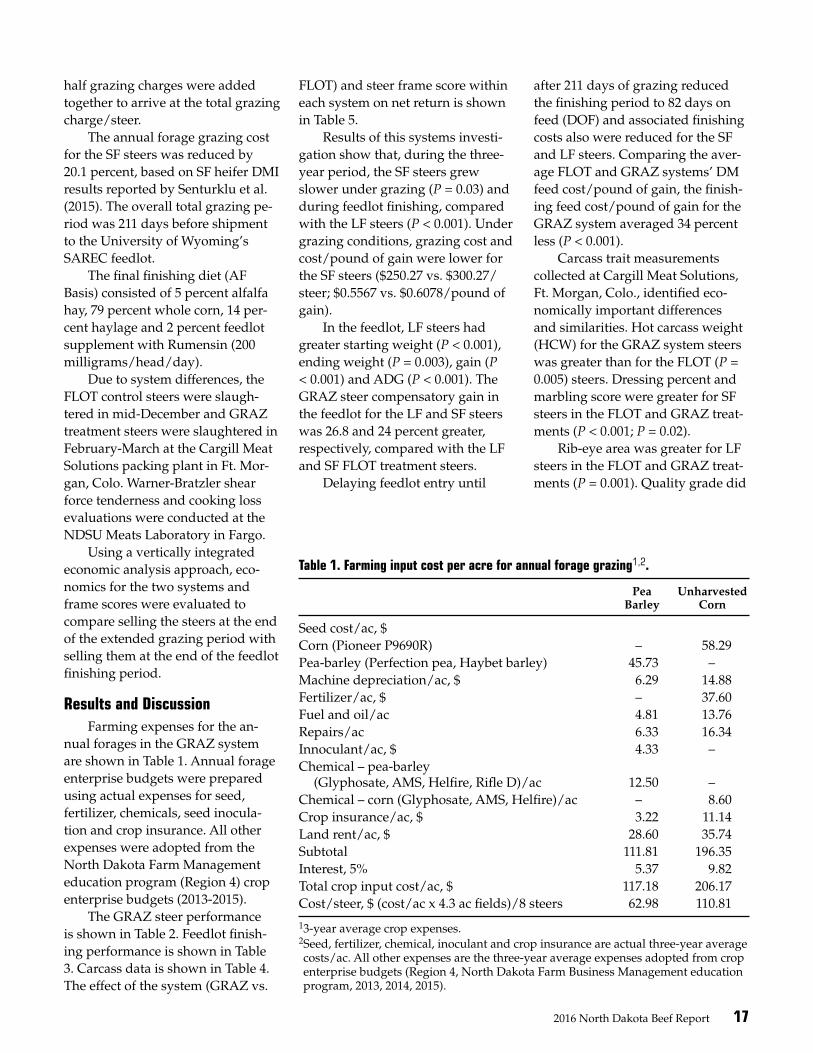
nual forages in the GRAZ system are shown in Table 1. Annual forage enterprise budgets were prepared using actual expenses for seed, fertilizer, chemicals, seed inocula-tion and crop insurance. All other expenses were adopted from the North Dakota Farm Management education program (Region 4) crop enterprise budgets (2013-2015).
The GRAZ steer performance is shown in Table 2. Feedlot finish-ing performance is shown in Table 3. Carcass data is shown in Table 4. The effect of the system (GRAZ vs.
Table 1. Farming input cost per acre for annual forage grazing1,2.
Pea Unharvested Barley Corn
Seed cost/ac, $ Corn (Pioneer P9690R) – 58.29Pea-barley (Perfection pea, Haybet barley) 45.73 –Machine depreciation/ac, $ 6.29 14.88Fertilizer/ac, $ – 37.60Fuel and oil/ac 4.81 13.76Repairs/ac 6.33 16.34Innoculant/ac, $ 4.33 –Chemical – pea-barley (Glyphosate, AMS, Helfire, Rifle D)/ac 12.50 –Chemical – corn (Glyphosate, AMS, Helfire)/ac – 8.60Crop insurance/ac, $ 3.22 11.14Land rent/ac, $ 28.60 35.74Subtotal 111.81 196.35Interest, 5% 5.37 9.82Total crop input cost/ac, $ 117.18 206.17Cost/steer, $ (cost/ac x 4.3 ac fields)/8 steers 62.98 110.81
13-year average crop expenses.2Seed, fertilizer, chemical, inoculant and crop insurance are actual three-year average costs/ac. All other expenses are the three-year average expenses adopted from crop enterprise budgets (Region 4, North Dakota Farm Business Management education program, 2013, 2014, 2015).
FLOT) and steer frame score within each system on net return is shown in Table 5.
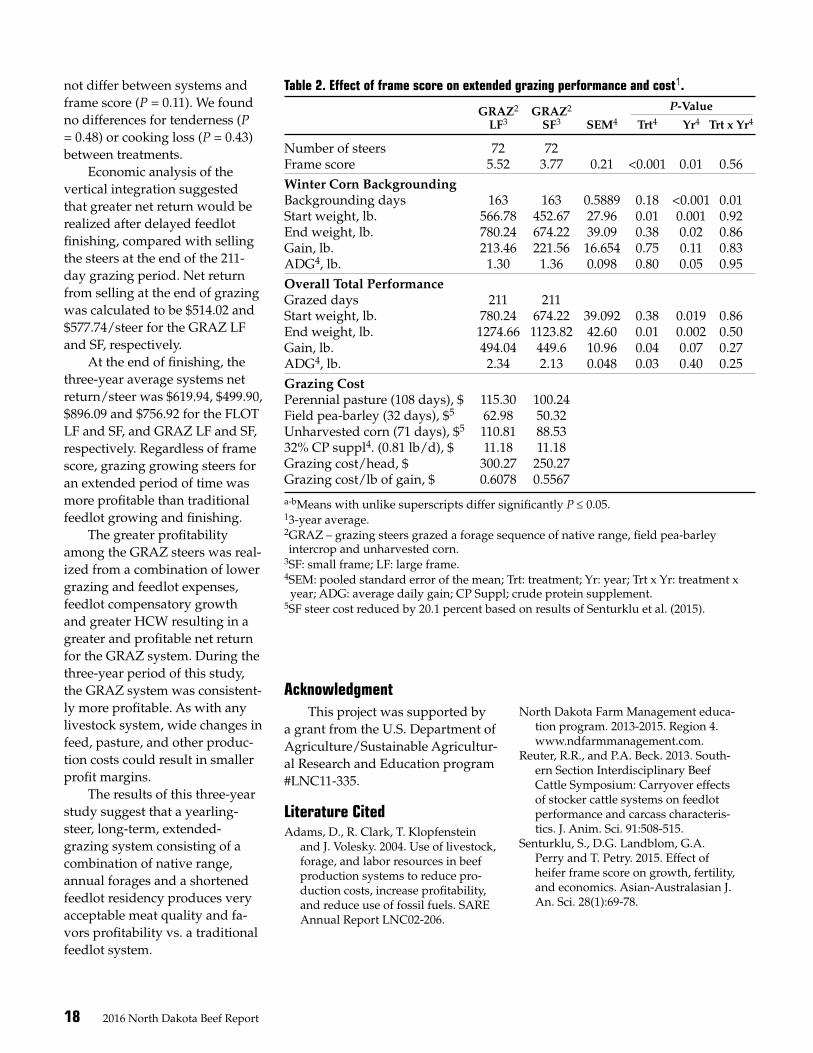
Results of this systems investi-gation show that, during the three-year period, the SF steers grew slower under grazing (P = 0.03) and during feedlot finishing, compared with the LF steers (P < 0.001). Under grazing conditions, grazing cost and cost/pound of gain were lower for the SF steers ($250.27 vs. $300.27/steer; $0.5567 vs. $0.6078/pound of gain).
In the feedlot, LF steers had greater starting weight (P < 0.001), ending weight (P = 0.003), gain (P < 0.001) and ADG (P < 0.001). The GRAZ steer compensatory gain in the feedlot for the LF and SF steers was 26.8 and 24 percent greater, respectively, compared with the LF and SF FLOT treatment steers.
Delaying feedlot entry until
after 211 days of grazing reduced the finishing period to 82 days on feed (DOF) and associated finishing costs also were reduced for the SF and LF steers. Comparing the aver-age FLOT and GRAZ systems’ DM feed cost/pound of gain, the finish-ing feed cost/pound of gain for the GRAZ system averaged 34 percent less (P < 0.001).
Carcass trait measurements collected at Cargill Meat Solutions, Ft. Morgan, Colo., identified eco-nomically important differences and similarities. Hot carcass weight (HCW) for the GRAZ system steers was greater than for the FLOT (P = 0.005) steers. Dressing percent and marbling score were greater for SF steers in the FLOT and GRAZ treat-ments (P < 0.001; P = 0.02).
Rib-eye area was greater for LF steers in the FLOT and GRAZ treat-ments (P = 0.001). Quality grade did
18 2016 North Dakota Beef Report
not differ between systems and frame score (P = 0.11). We found no differences for tenderness (P = 0.48) or cooking loss (P = 0.43) between treatments.
Economic analysis of the vertical integration suggested that greater net return would be realized after delayed feedlot finishing, compared with selling the steers at the end of the 211-day grazing period. Net return from selling at the end of grazing was calculated to be $514.02 and $577.74/steer for the GRAZ LF and SF, respectively.
At the end of finishing, the three-year average systems net return/steer was $619.94, $499.90, $896.09 and $756.92 for the FLOT LF and SF, and GRAZ LF and SF, respectively. Regardless of frame score, grazing growing steers for an extended period of time was more profitable than traditional feedlot growing and finishing.
The greater profitability among the GRAZ steers was real-ized from a combination of lower grazing and feedlot expenses, feedlot compensatory growth and greater HCW resulting in a greater and profitable net return for the GRAZ system. During the three-year period of this study, the GRAZ system was consistent-ly more profitable. As with any livestock system, wide changes in feed, pasture, and other produc-tion costs could result in smaller profit margins.
The results of this three-year study suggest that a yearling-steer, long-term, extended-grazing system consisting of a combination of native range, annual forages and a shortened feedlot residency produces very acceptable meat quality and fa-vors profitability vs. a traditional feedlot system.
Acknowledgment This project was supported by
a grant from the U.S. Department of Agriculture/Sustainable Agricultur-al Research and Education program #LNC11-335.
Literature CitedAdams, D., R. Clark, T. Klopfenstein
and J. Volesky. 2004. Use of livestock, forage, and labor resources in beef production systems to reduce pro-duction costs, increase profitability, and reduce use of fossil fuels. SARE Annual Report LNC02-206.
North Dakota Farm Management educa-tion program. 2013-2015. Region 4. www.ndfarmmanagement.com.
Reuter, R.R., and P.A. Beck. 2013. South-ern Section Interdisciplinary Beef Cattle Symposium: Carryover effects of stocker cattle systems on feedlot performance and carcass characteris-tics. J. Anim. Sci. 91:508-515.
Senturklu, S., D.G. Landblom, G.A. Perry and T. Petry. 2015. Effect of heifer frame score on growth, fertility, and economics. Asian-Australasian J. An. Sci. 28(1):69-78.
Table 2. Effect of frame score on extended grazing performance and cost1.
GRAZ2 GRAZ2 P-Value LF3 SF3 SEM4 Trt4 Yr4 Trt x Yr4
Number of steers 72 72 Frame score 5.52 3.77 0.21 <0.001 0.01 0.56Winter Corn Backgrounding Backgrounding days 163 163 0.5889 0.18 <0.001 0.01Start weight, lb. 566.78 452.67 27.96 0.01 0.001 0.92End weight, lb. 780.24 674.22 39.09 0.38 0.02 0.86Gain, lb. 213.46 221.56 16.654 0.75 0.11 0.83ADG4, lb. 1.30 1.36 0.098 0.80 0.05 0.95Overall Total Performance Grazed days 211 211 Start weight, lb. 780.24 674.22 39.092 0.38 0.019 0.86End weight, lb. 1274.66 1123.82 42.60 0.01 0.002 0.50Gain, lb. 494.04 449.6 10.96 0.04 0.07 0.27ADG4, lb. 2.34 2.13 0.048 0.03 0.40 0.25Grazing Cost Perennial pasture (108 days), $ 115.30 100.24 Field pea-barley (32 days), $5 62.98 50.32 Unharvested corn (71 days), $5 110.81 88.53 32% CP suppl4. (0.81 lb/d), $ 11.18 11.18 Grazing cost/head, $ 300.27 250.27 Grazing cost/lb of gain, $ 0.6078 0.5567
a-bMeans with unlike superscripts differ significantly P ≤ 0.05.13-year average.2GRAZ – grazing steers grazed a forage sequence of native range, field pea-barley intercrop and unharvested corn.3SF: small frame; LF: large frame.4SEM: pooled standard error of the mean; Trt: treatment; Yr: year; Trt x Yr: treatment x year; ADG: average daily gain; CP Suppl; crude protein supplement.5SF steer cost reduced by 20.1 percent based on results of Senturklu et al. (2015).

2016 North Dakota Beef Report 19
Table 3. Effect of steer frame score and extended grazing on feedlot finishing performance, efficiency and economics1.
FLOT2 FLOT2 GRAZ2 GRAZ2 P-Value LF3 SF3 LF3 SF3 SEM4 Trt4 Yr4 Trt x Yr4
Number of steers 24 24 24 24 Frame score 5.63 3.82 5.53 3.77 0.262 <0.001 0.001 0.56Growth Performance Grazing days – – 211 211 Feedlot days fed 218 218 82 82 3.51 <0.001 0.04 0.01 Start weight, lb. 767.3 671.4 1229.6 1086.4 42.63 <0.001 <0.001 0.85 End weight, lb. 1515.8 1312.1 1609.8 1400.8 51.93 0.003 <0.001 0.51 Gain, lb. 748.6a 640.9b 381.6c 314.8d 16.83 <0.001 0.01 0.09 ADG4, lb. 3.43c 2.93d 4.65a 3.84b 0.12 <0.001 0.94 0.46Feed Intake and Efficiency DM4 feed/steer/day, lb. 26.83 21.93 29.17 25.49 0.99 0.13 <0.01 <0.21 DM feed/lb. of gain, lb. 7.84 7.50 6.23 6.62 0.39 0.72 <0.05 <0.60Finishing Economics DM feed cost/lb. of gain, lb. 0.807a 0.786a 0.577b 0.612b 0.02 <0.001 <0.001 0.01
a-dMeans with different superscripts within a line are significantly different, (P ≤ 0.05).13-Year average.2FLOT steers moved directly to the feedlot for growing and finishing and GRAZ steers grazed a sequence of native range, field pea-barley intercrop and unharvested corn before transfer to the feedlot at the University of Wyoming.3SF: small frame; LF: large frame.4SEM: pooled standard error of the mean; Trt: treatment; Yr: year; Trt x Yr: treatment x year; ADG: average daily gain; DM: dry matter.
Table 4. Effect of steer frame score and extended grazing on carcass trait measurements and value1.
FLOT2 FLOT2 GRAZ2 GRAZ2 P-Value LF3 SF3 LF3 SF3 SEM4 Trt4 Yr4 Trt x Yr4
Hot carcass weight, lb. 875.70a 770.06b 931.68c 822.89d 29.64 0.01 <0.001 0.01Dressing percent, % 60.22a 61.09b 60.19a 60.84b 0.211 <0.001 <0.001 <0.001Fat depth, in. 0.48a 0.50a 0.40b 0.46a 0.204 0.031 <0.001 0.30Rib-eye area, sq. in. 13.13a 11.95b 13.93b 13.00c 0.247 0.001 <0.001 <0.001USDA yield grade 2.52 2.70 2.23 2.41 0.103 0.72 <0.001 0.95Marbling score 611.97a 640.68b 583.44b 631.36b 10.21 0.02 0.01 0.21Percent choice, % 93.06 94.24 91.67 97.22 2.73 0.10 0.04 0.19Carcass value/steer, $ 2042.47 1753.88 2243.61 2017.51 91.81 0.79 0.038 0.90Warner-Bratzler shear force, lb. 5.36 5.32 5.81 5.81 0.14 0.48 <0.001 0.29Cooking loss, % 17.85 17.61 17.50 15.40 1.17 0.43 <0.001 0.12
a-dMeans with different superscripts within a line are significantly different, (P ≤ 0.05).1Three-year average.2Steers were slaughtered at the Cargill Meat Solutions packing plant, Ft. Morgan, Colo. 2FLOT steers moved directly to the feedlot for growing and finishing, and GRAZ steers grazed a sequence of native range, field pea-barley intercrop and unharvested corn before transfer to the feedlot at the University of Wyoming.3SF: small frame; LF: large frame.4SEM: pooled standard error of the mean; Trt: treatment; Yr: year; Trt x Yr: treatment x year.
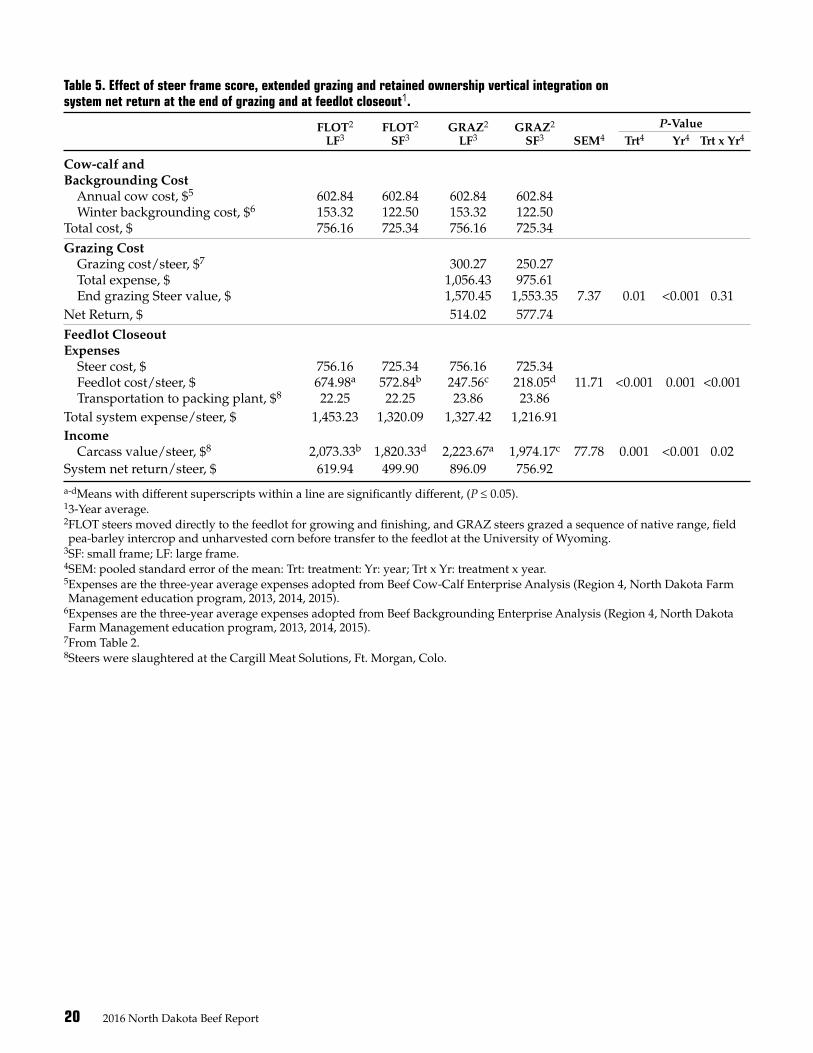
20 2016 North Dakota Beef Report
Table 5. Effect of steer frame score, extended grazing and retained ownership vertical integration on system net return at the end of grazing and at feedlot closeout1.
FLOT2 FLOT2 GRAZ2 GRAZ2 P-Value LF3 SF3 LF3 SF3 SEM4 Trt4 Yr4 Trt x Yr4
Cow-calf and Backgrounding Cost Annual cow cost, $5 602.84 602.84 602.84 602.84 Winter backgrounding cost, $6 153.32 122.50 153.32 122.50 Total cost, $ 756.16 725.34 756.16 725.34 Grazing Cost Grazing cost/steer, $7 300.27 250.27 Total expense, $ 1,056.43 975.61 End grazing Steer value, $ 1,570.45 1,553.35 7.37 0.01 <0.001 0.31Net Return, $ 514.02 577.74 Feedlot Closeout Expenses Steer cost, $ 756.16 725.34 756.16 725.34 Feedlot cost/steer, $ 674.98a 572.84b 247.56c 218.05d 11.71 <0.001 0.001 <0.001 Transportation to packing plant, $8 22.25 22.25 23.86 23.86 Total system expense/steer, $ 1,453.23 1,320.09 1,327.42 1,216.91 Income Carcass value/steer, $8 2,073.33b 1,820.33d 2,223.67a 1,974.17c 77.78 0.001 <0.001 0.02System net return/steer, $ 619.94 499.90 896.09 756.92
a-dMeans with different superscripts within a line are significantly different, (P ≤ 0.05).13-Year average. 2FLOT steers moved directly to the feedlot for growing and finishing, and GRAZ steers grazed a sequence of native range, field pea-barley intercrop and unharvested corn before transfer to the feedlot at the University of Wyoming.3SF: small frame; LF: large frame.4SEM: pooled standard error of the mean: Trt: treatment: Yr: year; Trt x Yr: treatment x year.5Expenses are the three-year average expenses adopted from Beef Cow-Calf Enterprise Analysis (Region 4, North Dakota Farm Management education program, 2013, 2014, 2015).6Expenses are the three-year average expenses adopted from Beef Backgrounding Enterprise Analysis (Region 4, North Dakota Farm Management education program, 2013, 2014, 2015).7From Table 2.8Steers were slaughtered at the Cargill Meat Solutions, Ft. Morgan, Colo.
2016 North Dakota Beef Report 21
Effects of feeding two levels of a pelleted 30 percent pea starch and 70 percent dry distillers grain feed in feedlot finishing diets on animal performance and carcass characteristicsChanda L. Engel1
1Carrington Research Extension Center, NDSU
A feed pellet made with 30 percent pea starch and 70 percent dry distillers grains with solubles (DDGS) fed at 15 or 30 percent of the diet dry matter was an effective feed ingredient that can be used to replace DDGS and some corn in feedlot finishing diets. The 30 percent inclusion level may result in a slight improvement in animal performance and feed efficiency vs. the 15 percent inclusion level. Pelleting pea starch with DDGS may allow for greater transportability of DDGS across the country and in export markets. Additional work to improve the manufacturing process would be warranted and valuable.
SummaryOne hundred seven Angus and
Angus-cross steers (1,006-pound initial body weight) were weighed individually, blocked by body weight and sorted into four weight blocks. Within block, cattle were assigned randomly and sorted into one of 12 pens. Pens were assigned randomly to one of three dietary treatments. Air-fractionated pea starch (PS) and corn dry distillers grains plus solubles (DDGS) were combined at a rate of 30 percent PS and 70 percent DDGS into a small diameter feed pellet (PS-DDGS). The three treatment diets were: control (Con), 15 percent PS-DDGS pel-let and 30 percent PS-DDGS pellet (15PS-DDGS and 30PS-DDGS). The Con diet included 20 percent DDGS (no PS). The two PS-DDGS diets in-cluded the 30 percent PS-70 percent DDGS pellet at 15 or 30 percent of the diet. Steers were weighed ap-proximately every 28 days and at
the time of marketing, for a total of four weight periods. Steers were fed an average of 101 days. Hot car-cass weights were recorded on the day of harvest. Carcass 12th rib fat thickness (BF), longissimus muscle area (LMA), and U.S. Department of Agriculture marbling score and yield grades (YG) were recorded following a 24-hour chill. Initial and final body weights were similar for Con, 15 and 30PS-DDGS treatments. Overall, we found a tendency for the 30PS-DDGS-fed cattle to have a lower feed to gain than cattle fed the 15PS-DDGS, and greater average daily gain (ADG) than for cattle on the 15PS-DDGS and Con treatments (P = 0.10). All additional perfor-mance parameters were similar among the three treatments (P ≥ 0.33). Hot carcass weight, YG, LMA and marbling score were similar for Con, 15 and 30PS-DDGS treatments. Final BF was similar for 30PS-DDGS and Con, but both were greater than 15PS-DDGS (P = 0.02; Table 3).
IntroductionNorth Dakota has a large and
expanding pea production and processing industry. Developments in field pea processing have made pea fiber, protein and flour fractions available as individual ingredients for use in human, pet food and live-stock markets.
Pea starch flour is a fine-pow-dered material made from dehulled seeds of field peas. Pea starch flour is created without any processing aids or chemical compounds. It has a nutritional profile of approximate-ly 90 percent dry matter, 13 percent crude protein and 87 percent total digestible nutrients (TDN).
Dry distillers grains with solu-bles (DDGS) is a widely used and valuable feed ingredient in feedlot diets. However, it tends to bridge and bind during transportation, reducing flowability and increas-ing unloading challenges. Pelleting distillers grain can improve the flowability and transportability of DDGS. However, DDGS alone does not pellet well.
Adding other feed ingredients such as pea flour, a byproduct of the dry-air-fractionation process of field peas, may improve pellet quality (Anderson and Koch, 2014). Small-scale milling has showed promising results with pelleting pea starch and DDGS, creating a durable, high-quality pellet.
The pelleting has not been tested in a commercial facility. Ad-ditionally, the true feeding value of pea starch for beef cattle has not
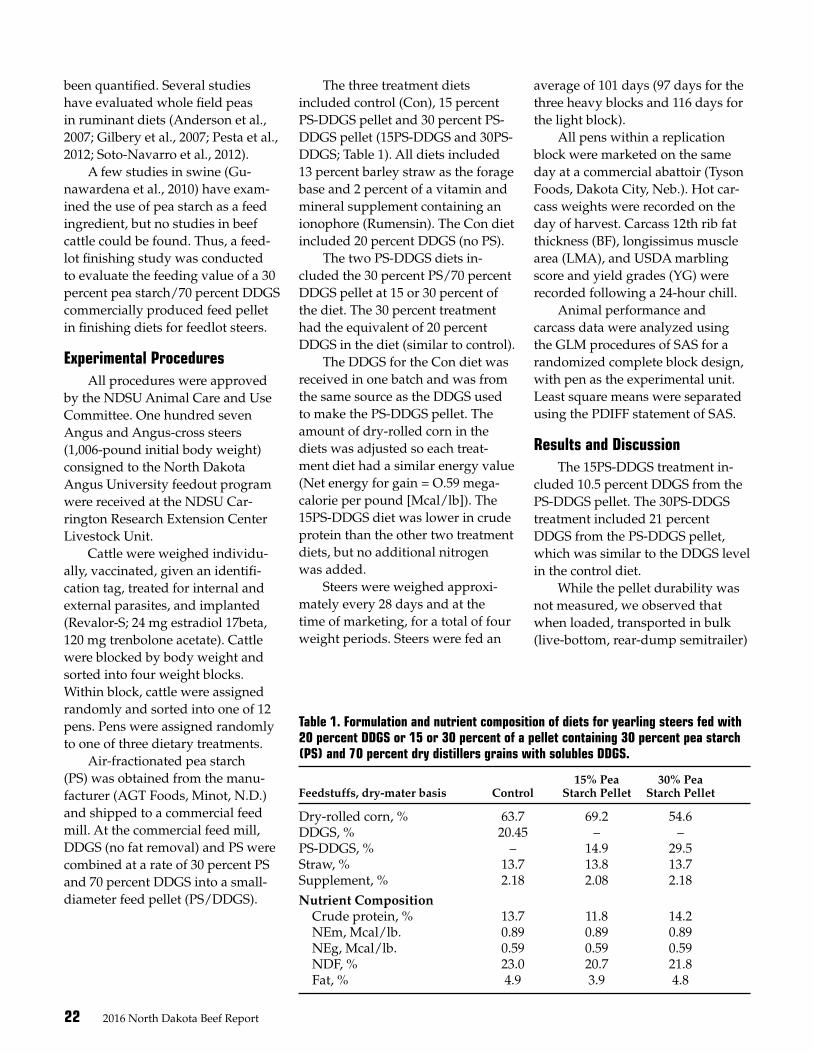
22 2016 North Dakota Beef Report
been quantified. Several studies have evaluated whole field peas in ruminant diets (Anderson et al., 2007; Gilbery et al., 2007; Pesta et al., 2012; Soto-Navarro et al., 2012).
A few studies in swine (Gu-nawardena et al., 2010) have exam-ined the use of pea starch as a feed ingredient, but no studies in beef cattle could be found. Thus, a feed-lot finishing study was conducted to evaluate the feeding value of a 30 percent pea starch/70 percent DDGS commercially produced feed pellet in finishing diets for feedlot steers.
Experimental ProceduresAll procedures were approved
by the NDSU Animal Care and Use Committee. One hundred seven Angus and Angus-cross steers (1,006-pound initial body weight) consigned to the North Dakota Angus University feedout program were received at the NDSU Car-rington Research Extension Center Livestock Unit.
Cattle were weighed individu-ally, vaccinated, given an identifi-cation tag, treated for internal and external parasites, and implanted (Revalor-S; 24 mg estradiol 17beta, 120 mg trenbolone acetate). Cattle were blocked by body weight and sorted into four weight blocks. Within block, cattle were assigned randomly and sorted into one of 12 pens. Pens were assigned randomly to one of three dietary treatments.
Air-fractionated pea starch (PS) was obtained from the manu-facturer (AGT Foods, Minot, N.D.) and shipped to a commercial feed mill. At the commercial feed mill, DDGS (no fat removal) and PS were combined at a rate of 30 percent PS and 70 percent DDGS into a small-diameter feed pellet (PS/DDGS).
The three treatment diets included control (Con), 15 percent PS-DDGS pellet and 30 percent PS-DDGS pellet (15PS-DDGS and 30PS-DDGS; Table 1). All diets included 13 percent barley straw as the forage base and 2 percent of a vitamin and mineral supplement containing an ionophore (Rumensin). The Con diet included 20 percent DDGS (no PS).
The two PS-DDGS diets in-cluded the 30 percent PS/70 percent DDGS pellet at 15 or 30 percent of the diet. The 30 percent treatment had the equivalent of 20 percent DDGS in the diet (similar to control).
The DDGS for the Con diet was received in one batch and was from the same source as the DDGS used to make the PS-DDGS pellet. The amount of dry-rolled corn in the diets was adjusted so each treat-ment diet had a similar energy value (Net energy for gain = O.59 mega-calorie per pound [Mcal/lb]). The 15PS-DDGS diet was lower in crude protein than the other two treatment diets, but no additional nitrogen was added.
Steers were weighed approxi-mately every 28 days and at the time of marketing, for a total of four weight periods. Steers were fed an
average of 101 days (97 days for the three heavy blocks and 116 days for the light block).
All pens within a replication block were marketed on the same day at a commercial abattoir (Tyson Foods, Dakota City, Neb.). Hot car-cass weights were recorded on the day of harvest. Carcass 12th rib fat thickness (BF), longissimus muscle area (LMA), and USDA marbling score and yield grades (YG) were recorded following a 24-hour chill.
Animal performance and carcass data were analyzed using the GLM procedures of SAS for a randomized complete block design, with pen as the experimental unit. Least square means were separated using the PDIFF statement of SAS.
Results and DiscussionThe 15PS-DDGS treatment in-
cluded 10.5 percent DDGS from the PS-DDGS pellet. The 30PS-DDGS treatment included 21 percent DDGS from the PS-DDGS pellet, which was similar to the DDGS level in the control diet.
While the pellet durability was not measured, we observed that when loaded, transported in bulk (live-bottom, rear-dump semitrailer)
Table 1. Formulation and nutrient composition of diets for yearling steers fed with 20 percent DDGS or 15 or 30 percent of a pellet containing 30 percent pea starch (PS) and 70 percent dry distillers grains with solubles DDGS.
15% Pea 30% Pea Feedstuffs, dry-mater basis Control Starch Pellet Starch Pellet
Dry-rolled corn, % 63.7 69.2 54.6DDGS, % 20.45 – –PS-DDGS, % – 14.9 29.5Straw, % 13.7 13.8 13.7Supplement, % 2.18 2.08 2.18Nutrient Composition Crude protein, % 13.7 11.8 14.2 NEm, Mcal/lb. 0.89 0.89 0.89 NEg, Mcal/lb. 0.59 0.59 0.59 NDF, % 23.0 20.7 21.8 Fat, % 4.9 3.9 4.8
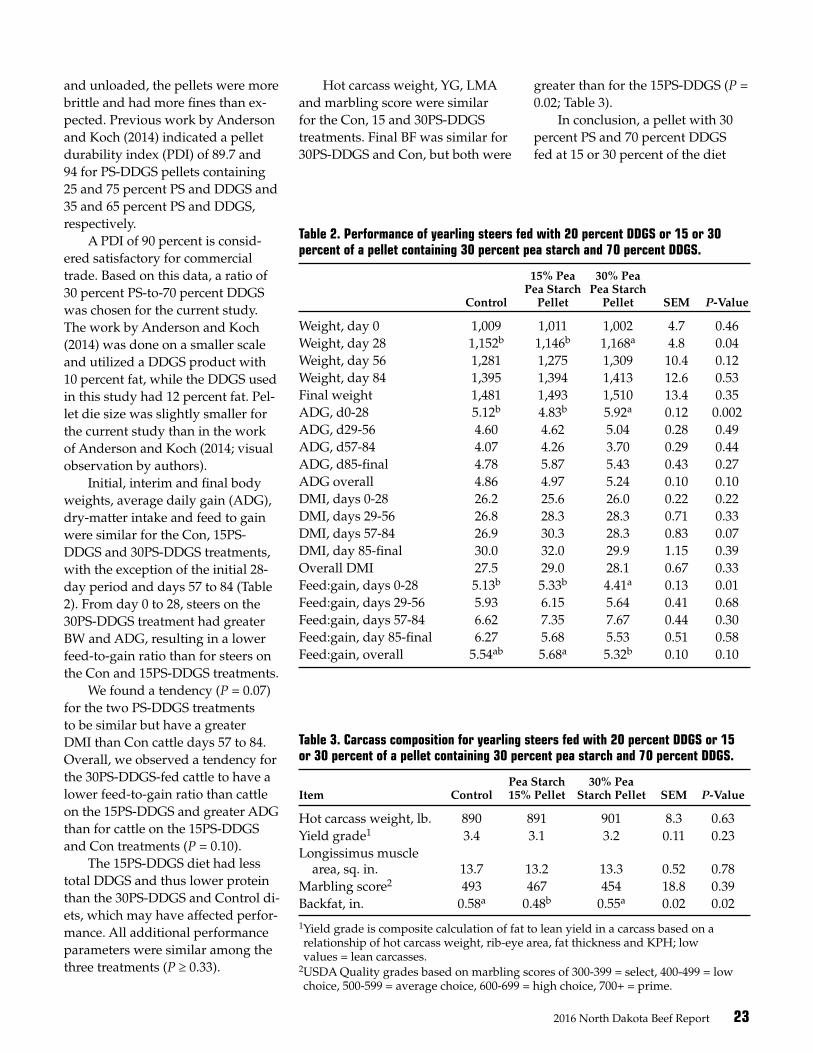
2016 North Dakota Beef Report 23
and unloaded, the pellets were more brittle and had more fines than ex-pected. Previous work by Anderson and Koch (2014) indicated a pellet durability index (PDI) of 89.7 and 94 for PS-DDGS pellets containing 25 and 75 percent PS and DDGS and 35 and 65 percent PS and DDGS, respectively.
A PDI of 90 percent is consid-ered satisfactory for commercial trade. Based on this data, a ratio of 30 percent PS-to-70 percent DDGS was chosen for the current study. The work by Anderson and Koch (2014) was done on a smaller scale and utilized a DDGS product with 10 percent fat, while the DDGS used in this study had 12 percent fat. Pel-let die size was slightly smaller for the current study than in the work of Anderson and Koch (2014; visual observation by authors).
Initial, interim and final body weights, average daily gain (ADG), dry-matter intake and feed to gain were similar for the Con, 15PS-DDGS and 30PS-DDGS treatments, with the exception of the initial 28-day period and days 57 to 84 (Table 2). From day 0 to 28, steers on the 30PS-DDGS treatment had greater BW and ADG, resulting in a lower feed-to-gain ratio than for steers on the Con and 15PS-DDGS treatments.
We found a tendency (P = 0.07) for the two PS-DDGS treatments to be similar but have a greater DMI than Con cattle days 57 to 84. Overall, we observed a tendency for the 30PS-DDGS-fed cattle to have a lower feed-to-gain ratio than cattle on the 15PS-DDGS and greater ADG than for cattle on the 15PS-DDGS and Con treatments (P = 0.10).
The 15PS-DDGS diet had less total DDGS and thus lower protein than the 30PS-DDGS and Control di-ets, which may have affected perfor-mance. All additional performance parameters were similar among the three treatments (P ≥ 0.33).
Table 2. Performance of yearling steers fed with 20 percent DDGS or 15 or 30 percent of a pellet containing 30 percent pea starch and 70 percent DDGS.
15% Pea 30% Pea Pea Starch Pea Starch Control Pellet Pellet SEM P-Value
Weight, day 0 1,009 1,011 1,002 4.7 0.46Weight, day 28 1,152b 1,146b 1,168a 4.8 0.04Weight, day 56 1,281 1,275 1,309 10.4 0.12Weight, day 84 1,395 1,394 1,413 12.6 0.53Final weight 1,481 1,493 1,510 13.4 0.35ADG, d0-28 5.12b 4.83b 5.92a 0.12 0.002ADG, d29-56 4.60 4.62 5.04 0.28 0.49ADG, d57-84 4.07 4.26 3.70 0.29 0.44ADG, d85-final 4.78 5.87 5.43 0.43 0.27ADG overall 4.86 4.97 5.24 0.10 0.10DMI, days 0-28 26.2 25.6 26.0 0.22 0.22DMI, days 29-56 26.8 28.3 28.3 0.71 0.33DMI, days 57-84 26.9 30.3 28.3 0.83 0.07DMI, day 85-final 30.0 32.0 29.9 1.15 0.39Overall DMI 27.5 29.0 28.1 0.67 0.33Feed:gain, days 0-28 5.13b 5.33b 4.41a 0.13 0.01Feed:gain, days 29-56 5.93 6.15 5.64 0.41 0.68Feed:gain, days 57-84 6.62 7.35 7.67 0.44 0.30Feed:gain, day 85-final 6.27 5.68 5.53 0.51 0.58Feed:gain, overall 5.54ab 5.68a 5.32b 0.10 0.10
Table 3. Carcass composition for yearling steers fed with 20 percent DDGS or 15 or 30 percent of a pellet containing 30 percent pea starch and 70 percent DDGS.
Pea Starch 30% Pea Item Control 15% Pellet Starch Pellet SEM P-Value
Hot carcass weight, lb. 890 891 901 8.3 0.63Yield grade1 3.4 3.1 3.2 0.11 0.23Longissimus muscle area, sq. in. 13.7 13.2 13.3 0.52 0.78Marbling score2 493 467 454 18.8 0.39Backfat, in. 0.58a 0.48b 0.55a 0.02 0.02
1Yield grade is composite calculation of fat to lean yield in a carcass based on a relationship of hot carcass weight, rib-eye area, fat thickness and KPH; low values = lean carcasses.2USDA Quality grades based on marbling scores of 300-399 = select, 400-499 = low choice, 500-599 = average choice, 600-699 = high choice, 700+ = prime.
Hot carcass weight, YG, LMA and marbling score were similar for the Con, 15 and 30PS-DDGS treatments. Final BF was similar for 30PS-DDGS and Con, but both were
greater than for the 15PS-DDGS (P = 0.02; Table 3).
In conclusion, a pellet with 30 percent PS and 70 percent DDGS fed at 15 or 30 percent of the diet
24 2016 North Dakota Beef Report
dry matter appears to have been an effective feed ingredient that can be used to replace bulk DDGS and some corn in feedlot finishing diets. In finishing diets, the 30 percent inclusion level may provide a slight improvement in animal perfor-mance and feed efficiency, compared with the 15 percent inclusion level.
While pellet quality was not as expected, the pellets in the current study still flowed from the bin and were acceptable in visual qual-ity. Pelleting PS with DDGS may allow for greater transportability of DDGS across the country and in export markets. Additional work to improve the manufacturing process would be warranted and valuable.
AcknowledgmentsThe authors thank AGT Foods
and Ingredients for donating the PulsePlus Flour V-6000 (pea starch feed ingredient) that was used in this trial. Also, thank you to Car-rington Research Extension Center livestock technicians Dale Burr and Tim Schroeder for the care and feed-ing of the livestock used in this trial.
Literature CitedAnderson, V., and K. Koch. 2014. Im-
proving the pellet quality of dried distillers grains with solubles by the addition of pea flour. 2014. North Dakota Beef Report. pg. 7-9.
Anderson, V., G. Lardy and B. Ilse. 2007. Field Pea Grain for Beef Cattle. NDSU Extension Service publication AS1301.
Gilbery, T.C., G.P. Lardy, S.A. Soto-Na-varro, M.L. Bauer and V.L. Anderson. 2007. Effect of field peas, chickpeas, and lentils on rumen fermentation,
digestion, microbial protein syn-thesis, and feedlot performance in receiving diets for beef cattle. J. Anim. Sci. 85:3045–3053.
Gunawardena, C.K., R.T. Zijlstra and E. Beltranena. 2010a. Characterization of the nutritional value of air-classified protein and starch fractions of field pea and zero-tannin faba bean in grower pigs. J. Anim. Sci. 88:660–670.
Pesta, A.C., A.H. Titlow, J.A. Hansen, A.L. Berger, S.A. Furman, M.K. Lu-ebbe, G.E. Erickson and K.H. Jenkins. 2012. Effects of feeding field peas in combination with distillers grains plus solubles in finishing and grow-ing diets on cattle performance and carcass characteristics. Prof. Anim. Sci. 28:534–540. Available from: http://digitalcommons.unl.edu/ani-malscifacpub
Soto-Navarro, S.A., A.M. Encinias, M.L. Bauer, G.P. Lardy and J.S. Caton. 2012. Feeding value of field pea as a protein source in forage-based diets fed to beef cattle. J. Anim. Sci. 90:585–591.

2016 North Dakota Beef Report 25
Discovering value in North Dakota calves: Dakota Feeder Calf Show feedout project XIV, 2015-2016Karl Hoppe1 and Dakota Feeder Calf Show Livestock Committee2
1Carrington Research Extension Center, NDSU2Turtle Lake, N.D.
The Dakota Feeder Calf Show feedout project assists cattle producers in identifying cattle with superior growth and carcass characteristics. The spread in average profitability between consignments from the top five herds and the bottom five herds was $200.21 per head for the 2015-2016 feeding period.
SummaryThe Dakota Feeder Calf Show
Feedout project was developed to discover the actual value of spring-born beef steer calves, provide comparisons between herds, and benchmark feeding and carcass performance. Cattle consigned to the feedout project were delivered to the Carrington Research Extension Center Livestock Unit on Oct. 17, 2015. After a 215-day feeding period with 0.98 percent death loss, cattle averaged 1,325.1 pounds (shrunk harvest weight). Feed required per pound of gain was 6.72 (dry-matter basis). Overall pen average daily gain was 3.21 pounds. Feed cost per pound of gain was $0.519 and total cost per pound of gain was $0.774. Profit ranged from $27.11 per head for pen-of-three cattle with superior growth and carcass traits to minus $322.85 per head. Substantial vari-ability in the feeding and carcass value of spring-born calves contin-ues to be discovered through partici-pation in the feedout project.
IntroductionDetermining calf value is a
learning experience for cow-calf producers. To remain competitive with other livestock and poultry in the meat industry, cow-calf produc-
ers need to identify superior genet-ics and management. Marketplace premiums are provided for calves that have exceptional feedlot perfor-mance and produce a high-quality carcass.
In addition, cost-effective feed-ing performance is needed to justify the expense of feeding cattle past weaning. Because North Dakota has low-cost feeds and a favorable climate, low cost per pound of gain can be accomplished (Hoppe et al., 1997).
Combining the low cost of gains with the identification of superior cattle, this ongoing feedlot project provides cattle producers with an understanding of cattle feeding and cattle selection in North Dakota.
Experimental ProceduresThe Dakota Feeder Calf Show
was developed for cattle produc-ers willing to consign steer calves to a show and feedout project. The calves were received in groups of three or four on Oct.17, 2015, at the Turtle Lake Weighing Station, Turtle Lake, N.D., for weighing, tagging, processing and showing. The calves were evaluated for conformation and uniformity, with the judges providing a discussion to the own-ers at the beginning of the feedout. The number of cattle consigned was 205, of which 176 competed in the pen-of-three contest.
The calves then were shipped to the Carrington Research Extension Center, Carrington, N.D., for feed-ing. Prior to shipment, calves were vaccinated, implanted, dewormed and injected with a prophylactic long-acting antibiotic. Cattle were implanted with Synovex S upon arrival. One calf was returned to an owner due to hoof and leg distress.
Calves then were sorted and placed on corn-based receiving diets. After an eight-week back-grounding period, the calves were transitioned to a 0.62 megacalorie of net energy for gain (Mcal NEg) per pound finishing diet. Cattle were weighed every 28 days, and updated performance reports were provided to the owners. Cattle were reimplanted with Revlor S.
An open house was held on Feb. 5, 2016, at the Carrington Research Extension Center Livestock Unit, where the owners reviewed the calves and discussed marketing conditions.
The cattle were harvested on May 3, 2016 (eight head), May 18, 2016 (92 head), and May 25, 2016 (102 head). The cattle were sold to Tyson Fresh Meats, Dakota City, Neb., on a grid basis with premi-ums and discounts based on carcass quality. Carcass data were collected after harvest.
Ranking in the pen-of-three competition was based on the best overall score. The overall score was determined by adding the index value for feedlot average daily gain (25 percent of score), marbling score (25 percent of score) and profit (25 percent of score) and subtracting in-dex value for calculated yield grade (25 percent of score). The Dakota Feeder Calf Show provided awards
26 2016 North Dakota Beef Report
Table 2. Correlation between profit and various production measures (pen-of-three).
Correlation coefficient
Profit and average birth date -0.2494Profit and average harvest weight 0.5082Profit and average daily gain 0.6205Profit and weight per day of age 0.3688Profit and marbling score 0.4656Profit and yield grade 0.3522
and recognition for the top-ranking pen of steers.
Results and DiscussionCattle consigned to the Dakota
Feeder Calf Show feedout proj-ect averaged 629.4 pounds upon delivery to the Carrington Research Extension Center Livestock Unit on Oct. 17, 2015. After an average 215-day feeding period, cattle averaged 1,325.1 pounds (at plant, shrunk weight). Death loss was 0.98 per-cent (two head) during the feeding period.
Average daily feed intake per head was 32.7 pounds on an as-fed basis and 21.6 pounds on a dry-mat-ter basis. Pounds of feed required per pound of gain were 10.2 on an as-fed basis and 6.7 pounds on a dry-matter basis.
The overall feed cost per pound of gain was $0.519. The overall yardage cost per pound of gain was $0.104. The combined cost per pound of gain, including feed, yard-age, veterinary, trucking and other expenses except interest, was $0.774.
Calves were priced by weight upon delivery to the feedlot. The pricing equation ($ per 100 pounds = (-0.130250942* initial calf weight, pounds) + 297.316269) was de-termined by regression analysis on local livestock auction prices reported for the weeks before and after delivery.
Overall, the carcasses contained U.S. Department of Agriculture Quality Grades at 2 percent Prime, 69.8 percent Choice or better (in-cluding 13.3 percent Certified Angus Beef), 25.7 percent Select, 1.5 percent Standard and 1 percent other, and USDA Yield Grades at 7.9 percent YG1, 43.56 percent YG2, 42.6 percent YG3, 5.4 percent YG4 and 0.50 per-cent YG5. One carcass (0.50 percent) was greater than 1,050 pounds.
Carcass value per 100 pounds (cwt) was calculated using the actual base carcass price plus premiums
and discounts for each carcass. The grid price received for May 3, 2016, was $196.01 Choice YG3 base with premiums: Prime $20, CAB $6, YG1 $6.50 and YG2 $3, and discounts: Select minus $9, Standard (no roll) minus $15, YG4 minus $8, YG5 mi-nus $20 and carcasses greater than 1,050 pounds minus $20.
The grid price received for May 18, 2016, was similar except the Choice YG3 base was $210.51 and the other discount (dark cutter and blood splash) was minus $55. The grid price received for May 25, 2016, was similar except the Choice YG3 base was $207.11 and the Select discount was minus $10.
Profit or loss accounted for ini-tial calf price, feed, yardage, veteri-nary, freight, brand inspection, beef checkoff, ultrasound and carcass data collection costs, and death loss. Interest costs on cattle or feeding expenses were not included in cal-culating profit or loss. Final carcass value was assessed using the actual grid pricing for the corresponding harvest group.
For all cattle placed on feed, the feedout calculated a $137.15 loss per head, with death loss included.
Results from the calves selected for the pen-of-three competition are listed in Table 1.
Overall, the pen-of-three calves averaged 418 days of age and 1,334.4 pounds per head at harvest. The overall pen-of-three feedlot average daily gain was 3.29 pounds, while weight per day of age was 3.18 pounds. The overall pen-of-three
marbling score was 462.7 (low choice, small marbling).
Correlations between profit and average birth date, harvest weight, average daily gain, weight per day of age or marbling score are shown in Table 2. The average harvest weight, average daily gain and weight per day of age were highly correlated to profitability.
The top-profit pen-of-three calves with superior genetics returned $27.11 per head, while the bottom pen-of-three calves returned minus $322.85 per head. The average of the five top-scoring pens of steers averaged minus $5.03 per head, while the average of the bottom five scoring pens of steers averaged minus $205.24 per head.
For the pen-of-three competi-tion, average profit/loss was minus $107.10 per head. The spread in prof-itability between the top and bottom five herds was $200.21 per head.
Calf value is improved with superior carcass and feedlot perfor-mance. Exceptional average daily gains, weight per day of age, harvest weight and marbling score can be found in North Dakota beef herds. Feedout projects provide a source of information for cattle producers to learn about feedlot performance and individual animal differences, and discover cattle value.
Literature CitedHoppe, K.F., V.L. Anderson, H. Hughes
and K. Alderin. 1997. Finishing North Dakota Calves in North Dakota or Kansas - Final Report. A Report on Agricultural Research and Extension in Central North Dakota. 38:7.

2016 North Dakota Beef Report 27
Table 1. Feeding performance – 2015-2016 Dakota Feeder Calf Show Feedout
Average Weight Average Average Average Average Feeding Best Three Average per Day of Harvest Daily Marbling Calculated Profit or Pen of Three Score Total Birth Date Age, lbs. Weight, lbs. Gain, lbs. Score1 Yield Grade Loss/Head
1 2.021 5-Apr-15 3.47 1424.49 3.77 513.67 2.77 $27.11 2 1.928 5-Mar-15 3.21 1387.78 3.22 666.33 3.22 $(26.83) 3 1.897 2-Mar-15 3.25 1436.45 3.42 492.33 2.53 $(11.49) 4 1.853 7-Apr-15 3.38 1391.24 3.84 519.33 3.38 $8.73 5 1.852 7-Mar-15 3.12 1375.39 3.57 572.33 3.26 $(22.65)
Average Top 5 herds 1.910 18-Mar-15 3.286 1,403.068 3.562 552.800 3.034 $(5.03)
6 1.795 9-Mar-15 3.23 1404.66 3.39 455.00 2.60 $(20.52) 7 1.791 19-Jan-15 3.11 1503.36 3.67 561.00 3.70 $5.20 8 1.781 18-Apr-15 3.51 1383.47 3.51 532.33 3.40 $2.65 9 1.776 6-Apr-15 3.44 1410.72 3.66 442.67 2.94 $(5.00) 10 1.775 27-Apr-15 3.56 1388.40 3.50 442.67 2.34 $(72.15) 11 1.763 18-Mar-15 3.10 1317.83 3.22 478.00 1.83 $(147.54) 12 1.761 20-Jan-15 3.21 1530.97 3.82 478.33 3.16 $(33.05) 13 1.755 1-Apr-15 3.20 1334.01 3.43 416.00 2.24 $(62.90) 14 1.747 17-Apr-15 3.02 1216.27 3.38 579.00 3.37 $(45.60) 15 1.732 4-Apr-15 3.00 1243.22 3.23 599.33 2.58 $(167.02) 16 1.727 17-Apr-15 3.40 1360.58 3.27 463.00 2.64 $(44.11) 17 1.723 25-Mar-15 3.39 1421.11 3.38 482.33 3.14 $(4.73) 18 1.704 13-Mar-15 3.28 1425.01 3.82 415.33 3.07 $(21.21) 19 1.640 1-Apr-15 3.31 1364.01 3.32 514.33 2.85 $(113.50) 20 1.634 21-Apr-15 3.16 1260.72 3.04 459.33 2.05 $(148.21) 21 1.613 21-Mar-15 2.85 1223.05 3.11 427.67 2.12 $(129.21) 22 1.606 1-Feb-15 3.33 1531.56 3.90 515.00 3.58 $(100.94) 23 1.580 4-Apr-15 3.01 1250.79 3.25 482.00 3.21 $(56.46) 24 1.579 2-Apr-15 3.35 1374.77 3.54 449.00 3.55 $(16.04) 25 1.562 29-Mar-15 3.30 1376.43 3.26 422.67 2.50 $(116.42) 26 1.537 8-Mar-15 3.27 1428.39 3.37 411.33 2.55 $(125.98) 27 1.504 12-Feb-15 2.88 1323.36 3.18 504.00 3.32 $(92.88) 28 1.498 16-Apr-15 3.24 1291.61 2.91 392.00 1.76 $(185.63) 29 1.494 2-May-15 3.17 1230.14 3.02 401.00 2.34 $(126.18) 30 1.491 15-Apr-15 3.36 1345.50 3.23 544.00 3.54 $(110.88) 31 1.476 12-Apr-15 3.12 1248.08 2.92 381.00 2.07 $(145.05) 32 1.466 28-Feb-15 2.98 1326.88 3.11 420.33 3.13 $(57.43) 33 1.456 27-Mar-15 3.10 1296.24 3.02 426.00 2.64 $(126.74) 34 1.453 3-Apr-15 3.09 1280.49 3.13 496.00 3.19 $(125.64) 35 1.412 16-Apr-15 3.24 1307.69 3.25 376.67 2.18 $(201.50) 36 1.404 10-Apr-15 3.38 1367.45 3.24 525.00 3.85 $(98.09) 37 1.368 14-Apr-15 3.18 1285.15 3.18 393.33 2.62 $(167.53) 38 1.365 3-Apr-15 3.41 1393.91 3.21 448.33 2.90 $(184.15) 39 1.362 19-Feb-15 2.81 1272.12 2.84 476.67 2.29 $(251.61) 40 1.360 11-Mar-15 3.63 1515.94 3.83 451.00 3.28 $(212.24) 41 1.360 20-Mar-15 2.80 1231.87 2.94 426.00 2.67 $(164.95) 42 1.318 8-Mar-15 3.23 1408.14 3.37 380.33 3.11 $(137.52) 43 1.288 26-Mar-15 2.83 1201.77 2.86 381.67 2.38 $(195.62) 44 1.287 8-May-15 2.83 1078.97 2.80 356.67 2.22 $(190.35) 45 1.238 30-Mar-15 2.99 1249.27 3.04 426.33 3.30 $(153.48)
46 1.225 30-Mar-15 2.98 1250.48 3.09 434.00 2.99 $(217.93) 47 1.215 1-May-15 3.27 1271.44 3.23 464.33 3.91 $(136.31) 48 1.213 7-May-15 2.98 1136.98 2.78 340.33 2.33 $(195.62) 49 1.003 12-Apr-15 3.24 1310.50 3.22 436.33 3.24 $(322.85)
Average bottom 5 herds 1.179 15-Apr-15 3.091 1,243.733 3.070 420.267 3.156 $(205.24)
Overall average - pens of three 1.559 27-Mar-15 3.187 1,334.462 3.291 462.687 2.855 $(107.10)Standard deviation 25.2 0.204 96.966 0.292 66.600 0.542 $79.11 number 49 49 49 49 49 49 49
1Marbling score 300-399 = select, 400-499 = low choice, 500-599 = average choice, 600-699 = high choice, 700-799 = low prime

28 2016 North Dakota Beef Report
Growing and finishing feedlot performance of steers fed diets with rolled corn or rolled barley and medium- or low-fat dry distillers grains with solublesChanda L. Engel1, Kendall C. Swanson2 and Vern L. Anderson1
1Carrington Research Extension Center, NDSU 2Department of Animal Sciences, NDSU
Feeding low- or medium-fat dried distillers grains with solubles (DDGS) at 26 percent of the diet dry matter to steers in growing and finishing diets appears to influence animal performance and carcass attributes similarly. When fed at similar diet dry-matter levels, rolled barley and rolled corn have similar effects on animal performance and carcass characteristics. Barley appears to result in similar feed efficiency with corn in the growing phase but showed improved feed efficiency in the finishing phase as a result of lower dry-matter intake and similar performance when compared with corn-based diets.
SummaryCrossbred steers (n = 154), with
an initial body weight (BW) of 684 pounds, were used in a 189-day growing and finishing feedlot study evaluating the effects of corn or barley and two fat levels of dry dis-tillers grains with solubles (DDGS). Steers were blocked by initial BW into four weight blocks and as-signed randomly to one of 16 pens. Pens were assigned to one of four dietary treatments within weight blocks. Treatments were arranged as a 2 × 2 factorial with grain type (dry rolled corn or dry rolled barley) as one factor and fat content of DDGS (med-fat, 9.6 percent fat or low-fat, 5.8 percent fat) as the other factor. No grain type (corn or barley) by DDGS fat level (9.6 or 5.8 percent fat) interactions were detected (P ≥ 0.29). Initial and final BW, average daily gain (ADG), dry-matter intake (DMI) and gain:feed (G:F; pounds BW gain/pound of feed consumed) were similar (P ≥ 0.11) for low- and
med-fat DDGS for the growing and finishing phases. Dressing percent, hot carcass weight (HCW), yield grade, longissimus muscle (LM) area, marbling score and back fat (BF) did not differ between DDGS treatments (P ≥ 0.18). Steers fed corn- and barley-based diets had similar initial and final growing (P ≥ 0.16) and finishing (P ≥ 0.17) BW and ADG. Growing DMI was similar (P = 0.37) for corn and barley grain, resulting in similar G:F in the growing phase (P = 0.26). However, cattle on the corn finishing diets had greater (P = 0.02) DMI than barley, resulting in a tendency (P = 0.08) for barley to be more efficient than corn during the finishing phase. Overall, barley-fed steers had greater (P = 0.002) G:F than corn-fed steers. The carcass parameters dressing percent, HCW, yield grade, LM area, mar-bling score and BF were all similar (P ≥ 0.09) for barley- and corn-fed cattle. Low-fat and medium-fat DDGS can be fed with corn and barley grain at similar levels with-out affecting animal performance. Additionally, rolled corn and rolled
barley are comparable grain sources for growing and finishing feedlot steers.
IntroductionCorn distillers grain (DG) is
produced at multiple ethanol plants in North Dakota. Primarily three moisture levels of corn distillers grain products are available: dry (about 90 to 95 percent dry matter, DDGS), modified (49 to 52 percent dry mater, MDGS) or wet (less than 48 percent dry matter, WDGS). The DDGS product is the most shelf stable and transportable due to the lower moisture content.
The current process for ethanol plants involves a step to remove corn oil (fat) from DG during ethanol production. Ethanol plants remove corn oil from DG for higher-value biodiesel and feed markets. Some plants remove a greater pro-portion of oil than others, resulting in fat levels of DG ranging from 4 to 10 percent, depending on the plant process.
Fat is high in energy, thus oil re-moval may alter the nutrient density of the resulting distillers grain feed-stuff. While certain nutrients such as protein are slightly increased, the main concern is a reduction in ener-gy value related to fat removal and its effect on animal performance.
A portion of the distillers grains produced in North Dakota is fed in the state, but the majority is ex-ported to other locations in the U.S., Canada and other international loca-tions. Typically, feedlot diets in the U.S. include corn grain as the prima-ry grain source. However, in Canada and at times in North Dakota, barley
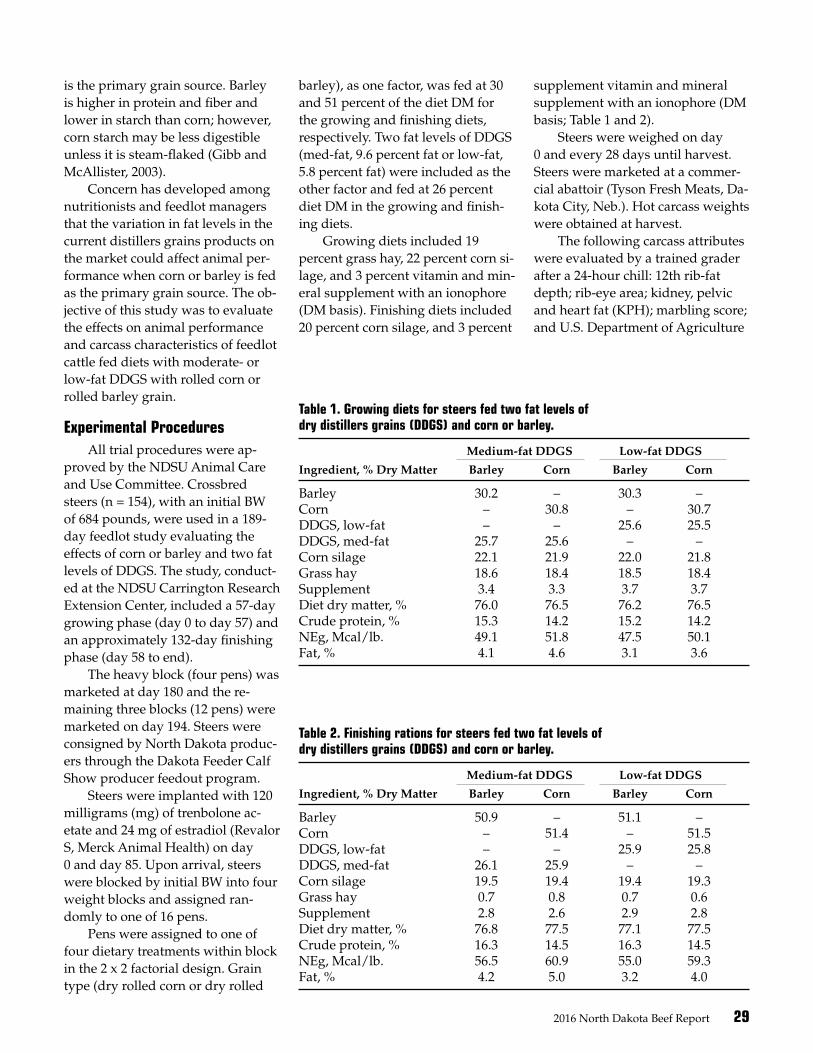
2016 North Dakota Beef Report 29
is the primary grain source. Barley is higher in protein and fiber and lower in starch than corn; however, corn starch may be less digestible unless it is steam-flaked (Gibb and McAllister, 2003).
Concern has developed among nutritionists and feedlot managers that the variation in fat levels in the current distillers grains products on the market could affect animal per-formance when corn or barley is fed as the primary grain source. The ob-jective of this study was to evaluate the effects on animal performance and carcass characteristics of feedlot cattle fed diets with moderate- or low-fat DDGS with rolled corn or rolled barley grain.
Experimental ProceduresAll trial procedures were ap-
proved by the NDSU Animal Care and Use Committee. Crossbred steers (n = 154), with an initial BW of 684 pounds, were used in a 189-day feedlot study evaluating the effects of corn or barley and two fat levels of DDGS. The study, conduct-ed at the NDSU Carrington Research Extension Center, included a 57-day growing phase (day 0 to day 57) and an approximately 132-day finishing phase (day 58 to end).
The heavy block (four pens) was marketed at day 180 and the re-maining three blocks (12 pens) were marketed on day 194. Steers were consigned by North Dakota produc-ers through the Dakota Feeder Calf Show producer feedout program.
Steers were implanted with 120 milligrams (mg) of trenbolone ac-etate and 24 mg of estradiol (Revalor S, Merck Animal Health) on day 0 and day 85. Upon arrival, steers were blocked by initial BW into four weight blocks and assigned ran-domly to one of 16 pens.
Pens were assigned to one of four dietary treatments within block in the 2 x 2 factorial design. Grain type (dry rolled corn or dry rolled
barley), as one factor, was fed at 30 and 51 percent of the diet DM for the growing and finishing diets, respectively. Two fat levels of DDGS (med-fat, 9.6 percent fat or low-fat, 5.8 percent fat) were included as the other factor and fed at 26 percent diet DM in the growing and finish-ing diets.
Growing diets included 19 percent grass hay, 22 percent corn si-lage, and 3 percent vitamin and min-eral supplement with an ionophore (DM basis). Finishing diets included 20 percent corn silage, and 3 percent
supplement vitamin and mineral supplement with an ionophore (DM basis; Table 1 and 2).
Steers were weighed on day 0 and every 28 days until harvest. Steers were marketed at a commer-cial abattoir (Tyson Fresh Meats, Da-kota City, Neb.). Hot carcass weights were obtained at harvest.
The following carcass attributes were evaluated by a trained grader after a 24-hour chill: 12th rib-fat depth; rib-eye area; kidney, pelvic and heart fat (KPH); marbling score; and U.S. Department of Agriculture
Table 1. Growing diets for steers fed two fat levels of dry distillers grains (DDGS) and corn or barley.
Medium-fat DDGS Low-fat DDGS
Ingredient, % Dry Matter Barley Corn Barley Corn
Barley 30.2 – 30.3 –Corn – 30.8 – 30.7DDGS, low-fat – – 25.6 25.5DDGS, med-fat 25.7 25.6 – –Corn silage 22.1 21.9 22.0 21.8Grass hay 18.6 18.4 18.5 18.4Supplement 3.4 3.3 3.7 3.7Diet dry matter, % 76.0 76.5 76.2 76.5Crude protein, % 15.3 14.2 15.2 14.2NEg, Mcal/lb. 49.1 51.8 47.5 50.1Fat, % 4.1 4.6 3.1 3.6
Table 2. Finishing rations for steers fed two fat levels of dry distillers grains (DDGS) and corn or barley.
Medium-fat DDGS Low-fat DDGS
Ingredient, % Dry Matter Barley Corn Barley Corn
Barley 50.9 – 51.1 –Corn – 51.4 – 51.5DDGS, low-fat – – 25.9 25.8DDGS, med-fat 26.1 25.9 – –Corn silage 19.5 19.4 19.4 19.3Grass hay 0.7 0.8 0.7 0.6Supplement 2.8 2.6 2.9 2.8Diet dry matter, % 76.8 77.5 77.1 77.5Crude protein, % 16.3 14.5 16.3 14.5NEg, Mcal/lb. 56.5 60.9 55.0 59.3Fat, % 4.2 5.0 3.2 4.0
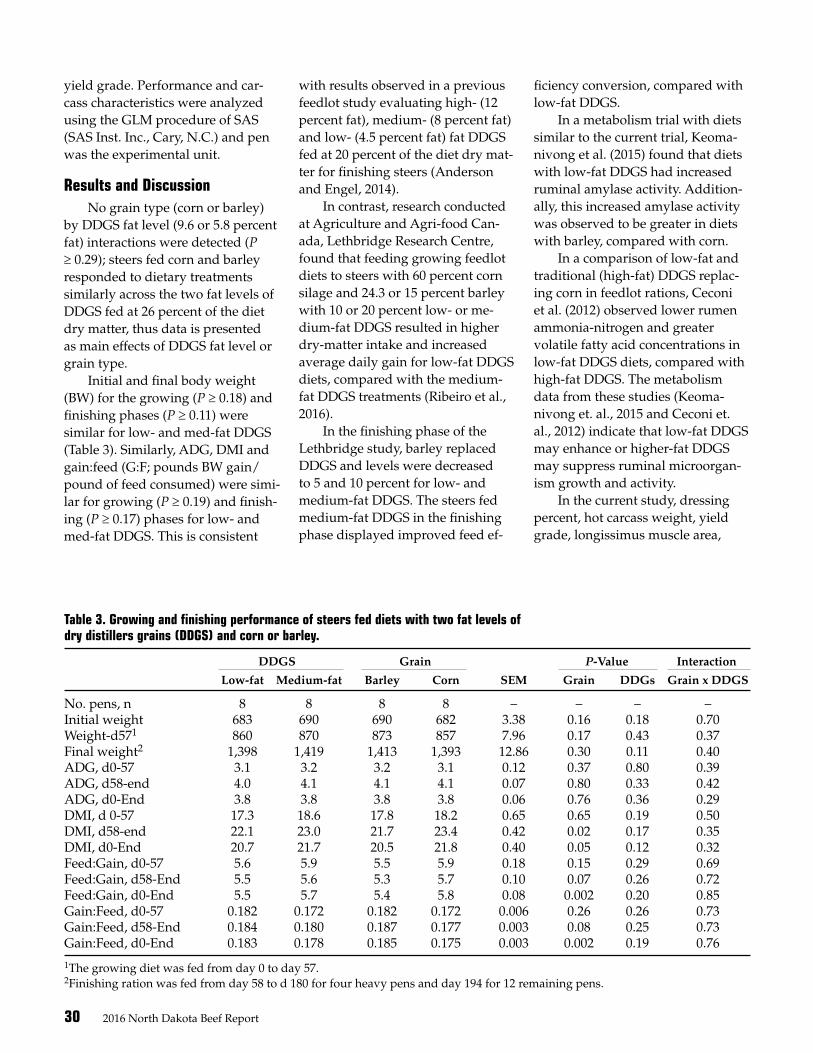
30 2016 North Dakota Beef Report
yield grade. Performance and car-cass characteristics were analyzed using the GLM procedure of SAS (SAS Inst. Inc., Cary, N.C.) and pen was the experimental unit.
Results and DiscussionNo grain type (corn or barley)
by DDGS fat level (9.6 or 5.8 percent fat) interactions were detected (P ≥ 0.29); steers fed corn and barley responded to dietary treatments similarly across the two fat levels of DDGS fed at 26 percent of the diet dry matter, thus data is presented as main effects of DDGS fat level or grain type.
Initial and final body weight (BW) for the growing (P ≥ 0.18) and finishing phases (P ≥ 0.11) were similar for low- and med-fat DDGS (Table 3). Similarly, ADG, DMI and gain:feed (G:F; pounds BW gain/pound of feed consumed) were simi-lar for growing (P ≥ 0.19) and finish-ing (P ≥ 0.17) phases for low- and med-fat DDGS. This is consistent
with results observed in a previous feedlot study evaluating high- (12 percent fat), medium- (8 percent fat) and low- (4.5 percent fat) fat DDGS fed at 20 percent of the diet dry mat-ter for finishing steers (Anderson and Engel, 2014).
In contrast, research conducted at Agriculture and Agri-food Can-ada, Lethbridge Research Centre, found that feeding growing feedlot diets to steers with 60 percent corn silage and 24.3 or 15 percent barley with 10 or 20 percent low- or me-dium-fat DDGS resulted in higher dry-matter intake and increased average daily gain for low-fat DDGS diets, compared with the medium-fat DDGS treatments (Ribeiro et al., 2016).
In the finishing phase of the Lethbridge study, barley replaced DDGS and levels were decreased to 5 and 10 percent for low- and medium-fat DDGS. The steers fed medium-fat DDGS in the finishing phase displayed improved feed ef-
ficiency conversion, compared with low-fat DDGS.
In a metabolism trial with diets similar to the current trial, Keoma-nivong et al. (2015) found that diets with low-fat DDGS had increased ruminal amylase activity. Addition-ally, this increased amylase activity was observed to be greater in diets with barley, compared with corn.
In a comparison of low-fat and traditional (high-fat) DDGS replac-ing corn in feedlot rations, Ceconi et al. (2012) observed lower rumen ammonia-nitrogen and greater volatile fatty acid concentrations in low-fat DDGS diets, compared with high-fat DDGS. The metabolism data from these studies (Keoma-nivong et. al., 2015 and Ceconi et. al., 2012) indicate that low-fat DDGS may enhance or higher-fat DDGS may suppress ruminal microorgan-ism growth and activity.
In the current study, dressing percent, hot carcass weight, yield grade, longissimus muscle area,
Table 3. Growing and finishing performance of steers fed diets with two fat levels of dry distillers grains (DDGS) and corn or barley.
DDGS Grain P-Value Interaction
Low-fat Medium-fat Barley Corn SEM Grain DDGs Grain x DDGS
No. pens, n 8 8 8 8 – – – –Initial weight 683 690 690 682 3.38 0.16 0.18 0.70Weight-d571 860 870 873 857 7.96 0.17 0.43 0.37Final weight2 1,398 1,419 1,413 1,393 12.86 0.30 0.11 0.40ADG, d0-57 3.1 3.2 3.2 3.1 0.12 0.37 0.80 0.39ADG, d58-end 4.0 4.1 4.1 4.1 0.07 0.80 0.33 0.42ADG, d0-End 3.8 3.8 3.8 3.8 0.06 0.76 0.36 0.29DMI, d 0-57 17.3 18.6 17.8 18.2 0.65 0.65 0.19 0.50DMI, d58-end 22.1 23.0 21.7 23.4 0.42 0.02 0.17 0.35DMI, d0-End 20.7 21.7 20.5 21.8 0.40 0.05 0.12 0.32Feed:Gain, d0-57 5.6 5.9 5.5 5.9 0.18 0.15 0.29 0.69Feed:Gain, d58-End 5.5 5.6 5.3 5.7 0.10 0.07 0.26 0.72Feed:Gain, d0-End 5.5 5.7 5.4 5.8 0.08 0.002 0.20 0.85Gain:Feed, d0-57 0.182 0.172 0.182 0.172 0.006 0.26 0.26 0.73Gain:Feed, d58-End 0.184 0.180 0.187 0.177 0.003 0.08 0.25 0.73Gain:Feed, d0-End 0.183 0.178 0.185 0.175 0.003 0.002 0.19 0.76
1The growing diet was fed from day 0 to day 57.2Finishing ration was fed from day 58 to d 180 for four heavy pens and day 194 for 12 remaining pens.

2016 North Dakota Beef Report 31
marbling score and back fat did not differ among DDGS treatments (P ≥ 0.18; Table 4). Anderson and Engel (2014) observed similar results for carcass characteristics in feedlot di-ets with three fat levels of distillers, with the exception of yield grade and marbling score.
Marbling score increased with increasing fat levels in DDGS and USDA yield grade was greater for high-fat but similar between me-dium- and low-fat DDGS diets. Similarly, Ribeiro et al. (2016) found carcass quality and liver abscesses were unaffected by type of DDGS and inclusion level.
In the current study, dietary fat levels ranged from 3.1 to 4.6 per-cent for the growing diets and 3.2 to 5 percent for the finishing diets (Table 1 and 2). Total dietary fat was 1 percent greater in the medium-fat DDGS diets, compared with the low-fat DDGS diets, when com-pared within the same grain type diets. Corn grain diets were slightly higher in total fat than the barley diets.
Steers fed corn- and barley-based diets had similar BW at trial initiation (P = 0.16), at the end of the
growing phase (P = 0.17) and at trial completion (P = 0.30). Growing and finishing phase ADG was similar (P ≥ 0.37) between grain sources. Growing DMI was similar (P = 0.65) for corn and barley grain (Table 3). However, cattle on the corn finish-ing diets had greater (P = 0.02) DMI than barley, resulting in similar (P = 0.26) growing phase G:F but had a tendency (P = 0.08) for barley to be more efficient than corn in the finishing phase.
Overall, barley-fed steers had greater (P = 0.002) G:F than corn-fed steers. Anderson and Ilse (2012) ob-served that as barley replaced corn at 0, 33, 67 and 100 percent of the diet for finishing steers, a linear de-crease in feed intake, similar overall gains and a linear improvement in feed efficiency. Pritchard and Rob-bins (1991) substituted rolled barley for 0, 25, 50, 75 or 100 percent whole shelled corn in finishing diets. In-creasing barley substitution resulted in decreased ADG and DMI but did not affect feed conversion.
We expected that as DMI de-creased, ADG also would decrease. However, the lack of difference in feed conversion would support the idea that the energy value of barley
may be underestimated (Owens et. al., 1997) and the energy value of corn may be overestimated (Zinn et al., 2002).
While corn is generally higher in starch than barley, differences in the kernel structure and starch matrix arrangement between these grains likely account for the differences in performance. The starch and protein fractions of barley are more digest-ible than they are in corn (Gibb and McAllister, 2003). The carcass pa-rameters for dressing percent, HCW, yield grade, LM area, marbling score and BF were all similar (P ≥ 0.09) for barley- and corn-fed cattle (Table 4).
Feeding low- or med-fat DDGS at 26 percent of the diet dry mat-ter in the growing and finishing phases appears to influence animal performance and carcass attributes similarly. When fed at similar diet dry-matter levels, rolled barley and rolled corn have similar effects on animal performance and carcass characteristics. Additionally, barley appears to result in similar feed efficiency with corn in the growing phase but may improve feed ef-ficiency, compared with corn in the finishing phase.
Table 4. Carcass performance for steers fed growing and finishing diets with two fat levels of dry distillers grains (DDGS) and corn or barley.
DDGS Grain P-Value Interaction
Low-fat Medium-fat Barley Corn SEM Grain DDGs Grain x DDGS
No. Pens, n 8 8 8 8 – – – –Shrunk dressing percent 63.6 63.2 63.0 63.9 0.004 0.09 0.46 0.88Hot carcass weight, lb. 838 853 846 846 7.2 1.00 0.18 0.41Yield grade1 3.1 3.1 3.1 3.2 0.12 0.47 0.85 0.73Longissimus muscle area, sq in. 13.6 13.5 13.6 13.5 0.18 0.55 0.94 0.09Marbling score2 455 475 451 478 10.15 0.10 0.19 0.29Back fat, in. 0.54 0.53 0.52 0.55 0.02 0.38 0.84 0.50
1Yield grade is composite calculation of fat to lean yield in a carcass based on a relationship of hot carcass weight, rib-eye area, fat thickness and KPH; low values = lean carcasses.2USDA Quality grades based on scores of 300-399 = select, 400-499 = low choice, 500-599 = average choice, 600-699 = high choice, 700+ = prime
32 2016 North Dakota Beef Report
Literature CitedAnderson, V.L., and C.L. Engel. 2014.
Effects of fat levels in distillers grain on feedlot finishing performance and carcass traits. Carringt. Res. Ext. Cen-ter, North Dakota State Univ. A Rep. Agric. Res. Ext. Cent. North Dakota 55:43-46.
Anderson, V.L., and B.R. Ilse. 2012. Ef-fect of reciprocal levels of hull-less barley and corn in finishing diets on feedlot performance and carcass characteristics. North Dakota Beef Rep.:41–43.
Ceconi, I., A. Dicostanzo and G.I. Craw-ford. 2012. Effect of low-fat dried distillers grains inclusion in finishing diets on feedlot cattle total tract di-gestibility and ruminal fermentation parameters. Project AIC125. Avail-able from: www.mncorn.org/sites/
mncorn.org/files/research/final-reports/201306/MNCG AURI AIC 125 Effect of low fat DDGS on Rumen Fermenation Final Report.pdf
Gibb, D.J., and T.A. McAllister. 2003. Corn compared to barley in feedlot diets. In: Agriculture. Available from: www1.agric.gov.ab.ca/$Department/deptdocs.nsf/all/fcd5589/$FILE/proceedings_3rdcanbarsymp.pdf#page=53
Keomanivong, F.E., M.A. Rodenhuis, M.C. Ruch, M.S. Crouse, J.D. Kirsch, M.L. Bauer and K.C. Swanson. 2015. The impact of barley- vs. corn-based diets with variable distillers fat inclu-sion levels on rumen α-amylase activ-ity. North Dakota Beef Rep.:11–13. Available from: www.ag.ndsu.edu/pubs/ansci/beef/as1775-03.pdf
Pritchard, R.H., and M.A. Robbins. 1991. Substitutlon of rolled barley for whole shelled corn in finishing diets for steers. South Dakota Beef Rep. 91:21–24. Available from: http://openprairie.sdstate.edu/cgi/view-content.cgi?article=1000&context=sd_beefreport_1991
Ribeiro, G.O., M. Hünerberg, D.J. Gibb and T.A. Mcallister. 2016. Effect of corn dried distillers’ grains plus solubles (DDGS) with medium and low residual oil content on growth performance of growing and finish-ing steers fed diets containing corn silage. Lethbridge, AB.
Zinn, R.A., F.N. Owens and R.A. Ware. 2002. Flaking corn: Processing mechanics, quality standards, and impacts on energy availability and performance of feedlot cattle 1. J. Anim. Sci 80:1145–1156.
The influence of grain source and dried corn distillers grains plus solubles oil concentration on finishing cattle performance and feeding behaviorMary A. Rodenhuis1, Faithe E. Keomanivong1, James J. Gaspers1, Marc L. Bauer1, Trent C. Gilbery1, Sarah R. Underdahl1, Chanda L. Engel2, Vern L. Anderson2 and Kendall C. Swanson1
1Department of Animal Sciences, NDSU 2Carrington Research Extension Center, NDSU
The objective of this experiment was to determine the effect of grain type (corn vs. barley) and oil concentration of dried corn distillers grains plus solubles (DDGS; moderate = 7.9 percent vs. low = 4.5 percent) on finishing performance, feeding behavior and carcass characteristics. Our data indicate that including a lower-fat DDGS, as compared with a moderate-fat DDGS, in a finishing diet may not influence finishing performance, feeding behavior or carcass measurements and that feeding barley-based diets resulted in decreased dry-matter intake and improved gain efficiency.
= six or seven steers per treatment): 1) corn and moderate-fat DDGS, 2) corn and low-fat DDGS, 3) barley and moderate-fat DDGS and 4) barley and low-fat DDGS. Intake and feeding behavior traits were calculated from data generated via the Insentec feeding system. Steers were slaughtered with an average body weight of 1,473 ± 9.7 pounds and were marketed in two groups at 119 (n = 40) and 155 (n = 41) days. Final body weight and aver-age daily gain were not affected (P ≥ 0.68) by grain type or DDGS oil concentration. Dry-matter intake decreased (P = 0.002) and gain:feed increased (P = 0.01) in steers fed barley-based diets. Daily visits to the feeder decreased (P = 0.05), but time eating per visit increased (P = 0.03) in steers fed barley-based diets,
SummaryEighty-one steers (944 ± 7.7
pounds of body weight) were used to determine the effect of grain type (corn vs. barley) and oil concentra-
tion of dried corn distillers grains plus solubles (DDGS; moderate = 7.9 percent vs. low = 4.5 percent) on finishing performance, feeding behavior and carcass characteris-tics. Steers were allotted by body weight to three pens. Within each pen, steers were assigned randomly to one of four dietary treatments (n
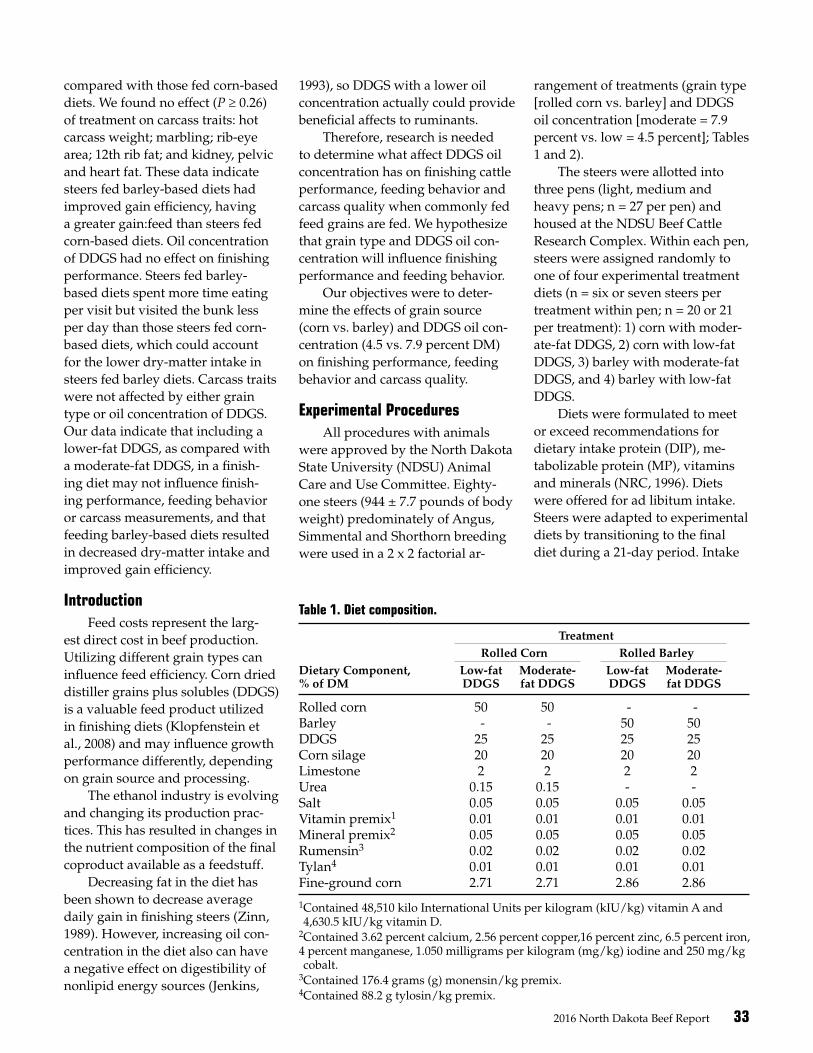
2016 North Dakota Beef Report 33
compared with those fed corn-based diets. We found no effect (P ≥ 0.26) of treatment on carcass traits: hot carcass weight; marbling; rib-eye area; 12th rib fat; and kidney, pelvic and heart fat. These data indicate steers fed barley-based diets had improved gain efficiency, having a greater gain:feed than steers fed corn-based diets. Oil concentration of DDGS had no effect on finishing performance. Steers fed barley-based diets spent more time eating per visit but visited the bunk less per day than those steers fed corn-based diets, which could account for the lower dry-matter intake in steers fed barley diets. Carcass traits were not affected by either grain type or oil concentration of DDGS. Our data indicate that including a lower-fat DDGS, as compared with a moderate-fat DDGS, in a finish-ing diet may not influence finish-ing performance, feeding behavior or carcass measurements, and that feeding barley-based diets resulted in decreased dry-matter intake and improved gain efficiency.
Introduction Feed costs represent the larg-
est direct cost in beef production. Utilizing different grain types can influence feed efficiency. Corn dried distiller grains plus solubles (DDGS) is a valuable feed product utilized in finishing diets (Klopfenstein et al., 2008) and may influence growth performance differently, depending on grain source and processing.
The ethanol industry is evolving and changing its production prac-tices. This has resulted in changes in the nutrient composition of the final coproduct available as a feedstuff.
Decreasing fat in the diet has been shown to decrease average daily gain in finishing steers (Zinn, 1989). However, increasing oil con-centration in the diet also can have a negative effect on digestibility of nonlipid energy sources (Jenkins,
1993), so DDGS with a lower oil concentration actually could provide beneficial affects to ruminants.
Therefore, research is needed to determine what affect DDGS oil concentration has on finishing cattle performance, feeding behavior and carcass quality when commonly fed feed grains are fed. We hypothesize that grain type and DDGS oil con-centration will influence finishing performance and feeding behavior.
Our objectives were to deter-mine the effects of grain source (corn vs. barley) and DDGS oil con-centration (4.5 vs. 7.9 percent DM) on finishing performance, feeding behavior and carcass quality.
Experimental ProceduresAll procedures with animals
were approved by the North Dakota State University (NDSU) Animal Care and Use Committee. Eighty-one steers (944 ± 7.7 pounds of body weight) predominately of Angus, Simmental and Shorthorn breeding were used in a 2 x 2 factorial ar-
rangement of treatments (grain type [rolled corn vs. barley] and DDGS oil concentration [moderate = 7.9 percent vs. low = 4.5 percent]; Tables 1 and 2).
The steers were allotted into three pens (light, medium and heavy pens; n = 27 per pen) and housed at the NDSU Beef Cattle Research Complex. Within each pen, steers were assigned randomly to one of four experimental treatment diets (n = six or seven steers per treatment within pen; n = 20 or 21 per treatment): 1) corn with moder-ate-fat DDGS, 2) corn with low-fat DDGS, 3) barley with moderate-fat DDGS, and 4) barley with low-fat DDGS.
Diets were formulated to meet or exceed recommendations for dietary intake protein (DIP), me-tabolizable protein (MP), vitamins and minerals (NRC, 1996). Diets were offered for ad libitum intake. Steers were adapted to experimental diets by transitioning to the final diet during a 21-day period. Intake
Table 1. Diet composition.
Treatment Rolled Corn Rolled BarleyDietary Component, Low-fat Moderate- Low-fat Moderate- % of DM DDGS fat DDGS DDGS fat DDGS
Rolled corn 50 50 - -Barley - - 50 50DDGS 25 25 25 25Corn silage 20 20 20 20Limestone 2 2 2 2Urea 0.15 0.15 - - Salt 0.05 0.05 0.05 0.05Vitamin premix1 0.01 0.01 0.01 0.01Mineral premix2 0.05 0.05 0.05 0.05Rumensin3 0.02 0.02 0.02 0.02Tylan4 0.01 0.01 0.01 0.01Fine-ground corn 2.71 2.71 2.86 2.86
1Contained 48,510 kilo International Units per kilogram (kIU/kg) vitamin A and 4,630.5 kIU/kg vitamin D.2Contained 3.62 percent calcium, 2.56 percent copper,16 percent zinc, 6.5 percent iron, 4 percent manganese, 1.050 milligrams per kilogram (mg/kg) iodine and 250 mg/kg cobalt.3Contained 176.4 grams (g) monensin/kg premix.4Contained 88.2 g tylosin/kg premix.
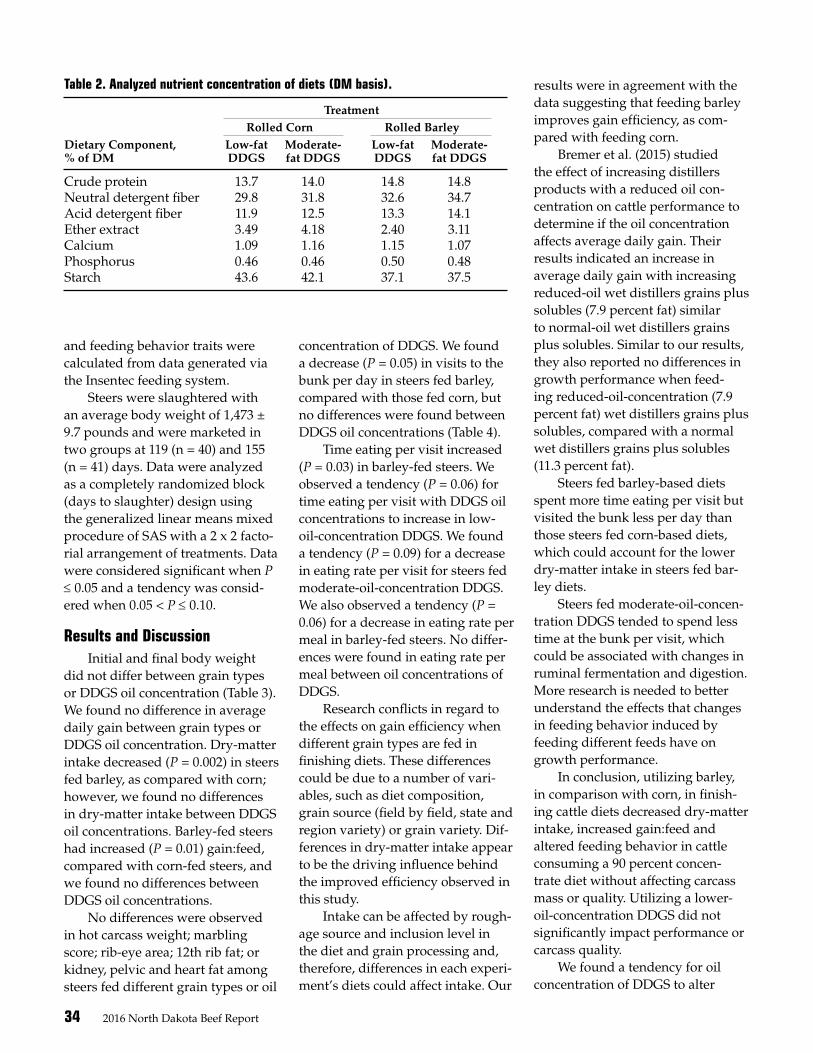
34 2016 North Dakota Beef Report
and feeding behavior traits were calculated from data generated via the Insentec feeding system.
Steers were slaughtered with an average body weight of 1,473 ± 9.7 pounds and were marketed in two groups at 119 (n = 40) and 155 (n = 41) days. Data were analyzed as a completely randomized block (days to slaughter) design using the generalized linear means mixed procedure of SAS with a 2 x 2 facto-rial arrangement of treatments. Data were considered significant when P ≤ 0.05 and a tendency was consid-ered when 0.05 < P ≤ 0.10.
Results and Discussion Initial and final body weight
did not differ between grain types or DDGS oil concentration (Table 3). We found no difference in average daily gain between grain types or DDGS oil concentration. Dry-matter intake decreased (P = 0.002) in steers fed barley, as compared with corn; however, we found no differences in dry-matter intake between DDGS oil concentrations. Barley-fed steers had increased (P = 0.01) gain:feed, compared with corn-fed steers, and we found no differences between DDGS oil concentrations.
No differences were observed in hot carcass weight; marbling score; rib-eye area; 12th rib fat; or kidney, pelvic and heart fat among steers fed different grain types or oil
concentration of DDGS. We found a decrease (P = 0.05) in visits to the bunk per day in steers fed barley, compared with those fed corn, but no differences were found between DDGS oil concentrations (Table 4).
Time eating per visit increased (P = 0.03) in barley-fed steers. We observed a tendency (P = 0.06) for time eating per visit with DDGS oil concentrations to increase in low-oil-concentration DDGS. We found a tendency (P = 0.09) for a decrease in eating rate per visit for steers fed moderate-oil-concentration DDGS. We also observed a tendency (P = 0.06) for a decrease in eating rate per meal in barley-fed steers. No differ-ences were found in eating rate per meal between oil concentrations of DDGS.
Research conflicts in regard to the effects on gain efficiency when different grain types are fed in finishing diets. These differences could be due to a number of vari-ables, such as diet composition, grain source (field by field, state and region variety) or grain variety. Dif-ferences in dry-matter intake appear to be the driving influence behind the improved efficiency observed in this study.
Intake can be affected by rough-age source and inclusion level in the diet and grain processing and, therefore, differences in each experi-ment’s diets could affect intake. Our
results were in agreement with the data suggesting that feeding barley improves gain efficiency, as com-pared with feeding corn.
Bremer et al. (2015) studied the effect of increasing distillers products with a reduced oil con-centration on cattle performance to determine if the oil concentration affects average daily gain. Their results indicated an increase in average daily gain with increasing reduced-oil wet distillers grains plus solubles (7.9 percent fat) similar to normal-oil wet distillers grains plus solubles. Similar to our results, they also reported no differences in growth performance when feed-ing reduced-oil-concentration (7.9 percent fat) wet distillers grains plus solubles, compared with a normal wet distillers grains plus solubles (11.3 percent fat).
Steers fed barley-based diets spent more time eating per visit but visited the bunk less per day than those steers fed corn-based diets, which could account for the lower dry-matter intake in steers fed bar-ley diets.
Steers fed moderate-oil-concen-tration DDGS tended to spend less time at the bunk per visit, which could be associated with changes in ruminal fermentation and digestion. More research is needed to better understand the effects that changes in feeding behavior induced by feeding different feeds have on growth performance.
In conclusion, utilizing barley, in comparison with corn, in finish-ing cattle diets decreased dry-matter intake, increased gain:feed and altered feeding behavior in cattle consuming a 90 percent concen-trate diet without affecting carcass mass or quality. Utilizing a lower-oil-concentration DDGS did not significantly impact performance or carcass quality.
We found a tendency for oil concentration of DDGS to alter
Table 2. Analyzed nutrient concentration of diets (DM basis).
Treatment Rolled Corn Rolled BarleyDietary Component, Low-fat Moderate- Low-fat Moderate- % of DM DDGS fat DDGS DDGS fat DDGS
Crude protein 13.7 14.0 14.8 14.8Neutral detergent fiber 29.8 31.8 32.6 34.7Acid detergent fiber 11.9 12.5 13.3 14.1Ether extract 3.49 4.18 2.40 3.11Calcium 1.09 1.16 1.15 1.07Phosphorus 0.46 0.46 0.50 0.48Starch 43.6 42.1 37.1 37.5
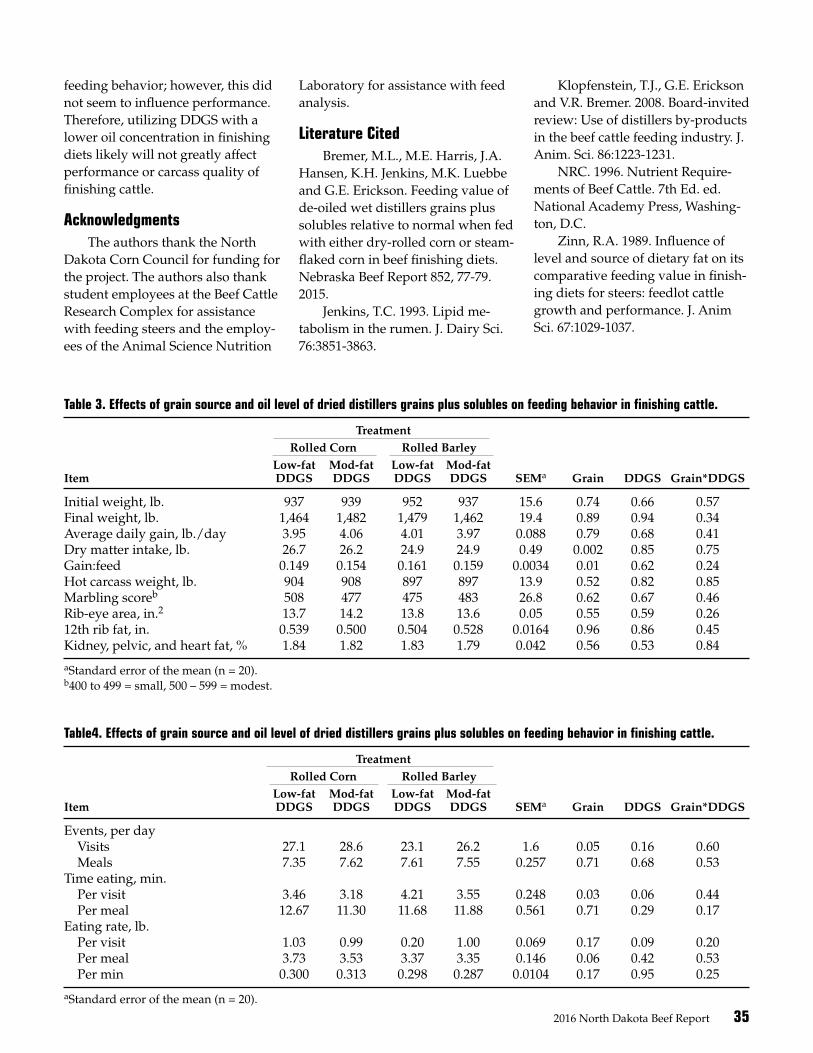
2016 North Dakota Beef Report 35
feeding behavior; however, this did not seem to influence performance. Therefore, utilizing DDGS with a lower oil concentration in finishing diets likely will not greatly affect performance or carcass quality of finishing cattle.
AcknowledgmentsThe authors thank the North
Dakota Corn Council for funding for the project. The authors also thank student employees at the Beef Cattle Research Complex for assistance with feeding steers and the employ-ees of the Animal Science Nutrition
Laboratory for assistance with feed analysis.
Literature CitedBremer, M.L., M.E. Harris, J.A.
Hansen, K.H. Jenkins, M.K. Luebbe and G.E. Erickson. Feeding value of de-oiled wet distillers grains plus solubles relative to normal when fed with either dry-rolled corn or steam-flaked corn in beef finishing diets. Nebraska Beef Report 852, 77-79. 2015.
Jenkins, T.C. 1993. Lipid me-tabolism in the rumen. J. Dairy Sci. 76:3851-3863.
Klopfenstein, T.J., G.E. Erickson and V.R. Bremer. 2008. Board-invited review: Use of distillers by-products in the beef cattle feeding industry. J. Anim. Sci. 86:1223-1231.
NRC. 1996. Nutrient Require-ments of Beef Cattle. 7th Ed. ed. National Academy Press, Washing-ton, D.C.
Zinn, R.A. 1989. Influence of level and source of dietary fat on its comparative feeding value in finish-ing diets for steers: feedlot cattle growth and performance. J. Anim Sci. 67:1029-1037.
Table 3. Effects of grain source and oil level of dried distillers grains plus solubles on feeding behavior in finishing cattle.
Treatment Rolled Corn Rolled Barley Low-fat Mod-fat Low-fat Mod-fat Item DDGS DDGS DDGS DDGS SEMa Grain DDGS Grain*DDGS
Initial weight, lb. 937 939 952 937 15.6 0.74 0.66 0.57Final weight, lb. 1,464 1,482 1,479 1,462 19.4 0.89 0.94 0.34Average daily gain, lb./day 3.95 4.06 4.01 3.97 0.088 0.79 0.68 0.41Dry matter intake, lb. 26.7 26.2 24.9 24.9 0.49 0.002 0.85 0.75Gain:feed 0.149 0.154 0.161 0.159 0.0034 0.01 0.62 0.24Hot carcass weight, lb. 904 908 897 897 13.9 0.52 0.82 0.85Marbling scoreb 508 477 475 483 26.8 0.62 0.67 0.46Rib-eye area, in.2 13.7 14.2 13.8 13.6 0.05 0.55 0.59 0.2612th rib fat, in. 0.539 0.500 0.504 0.528 0.0164 0.96 0.86 0.45Kidney, pelvic, and heart fat, % 1.84 1.82 1.83 1.79 0.042 0.56 0.53 0.84
aStandard error of the mean (n = 20).b400 to 499 = small, 500 – 599 = modest.
Table4. Effects of grain source and oil level of dried distillers grains plus solubles on feeding behavior in finishing cattle.
Treatment Rolled Corn Rolled Barley Low-fat Mod-fat Low-fat Mod-fat Item DDGS DDGS DDGS DDGS SEMa Grain DDGS Grain*DDGS
Events, per day Visits 27.1 28.6 23.1 26.2 1.6 0.05 0.16 0.60 Meals 7.35 7.62 7.61 7.55 0.257 0.71 0.68 0.53Time eating, min. Per visit 3.46 3.18 4.21 3.55 0.248 0.03 0.06 0.44 Per meal 12.67 11.30 11.68 11.88 0.561 0.71 0.29 0.17Eating rate, lb. Per visit 1.03 0.99 0.20 1.00 0.069 0.17 0.09 0.20 Per meal 3.73 3.53 3.37 3.35 0.146 0.06 0.42 0.53 Per min 0.300 0.313 0.298 0.287 0.0104 0.17 0.95 0.25
aStandard error of the mean (n = 20).

36 2016 North Dakota Beef Report
Effect of grain type and dried distillers grain with solubles oil concentration on site of digestionMary A. Rodenhuis1, Faithe E. Keomanivong1, Marc L. Bauer1, Chanda L. Engel2, Vern L. Anderson2 and Kendall C. Swanson1
The objective of this experiment was to determine the effects of grain type (corn vs. barley) and oil concentration of dried distillers grains plus solubles (DDGS; moderate = 7.9 percent vs. low = 4.5 percent ether extract) on site of digestion. Our data indicate that including a lower-fat DDGS, as compared with a moderate-fat DDGS, in a finishing diet may not have an influence on site of digestion of nonlipid nutrients in finishing cattle.
1Department of Animal Sciences, NDSU 2Carrington Research Extension Center, NDSU
Summary Eight Holstein steers (1,579 ±
137 pounds) were used in a 4 x 4 Latin Square design consisting of four periods and four dietary treat-ments, with two steers assigned per treatment per period to determine the impact of grain type (corn vs. barley) and DDGS oil concentration (DDGS; moderate = 7.9 percent vs. low = 4.5 percent) on intake and total-tract digestibility. Apparent ruminal dry-matter and intestinal digestibility as a percentage of intake decreased (P ≤ 0.03) in steers fed corn-based diets. We found no difference in total-tract dry-matter digestibility between grain types. No effects on dry-matter intake or digestibility were observed between steers fed low- and moderate-oil concentrations of DDGS. Starch in-take was greater (P = 0.01) in steers fed corn-based diets, and total-tract starch digestibility was greater (P = 0.01) in steers fed barley-based diets. We found no effects on intake or digestibility of starch between low- and moderate-oil concentra-tions of DDGS. Intake of total lipids increased (P < 0.001) in steers fed
corn diets as well as in steers fed diets with moderate oil of DDGS. Apparent ruminal lipid digestibility increased (P = 0.02) in steers fed moderate-oil DDGS, while intestinal lipid digestibility as a percent of intake was increased (P = 0.04) in steers fed low-oil DDGS. No differ-ences were found in lipid apparent ruminal digestibility or lipid intes-tinal digestibility between grain types. Total-tract lipid digestibility was increased (P < 0.001) in steers fed moderate-oil DDGS. In sum-mary, utilizing barley, as compared with corn, in finishing diets increas-es total-tract starch digestion, and decreasing the oil concentration of DDGS had no effect on site of diges-tion or total-tract digestibility of dry matter, crude protein and starch of the diets, although lipid digestibility was greater in steers fed moderate-fat DDGS. Therefore, utilizing low-oil DDGS in finishing diets may not affect digestibility of nonlipid nutrients in finishing cattle.
Introduction Feed costs represent the largest
expense in beef production. Grain type, specifically feeding barley vs. corn, can result in differences in di-gestibility and performance (Gozho
and Mutsvangwa, 2008). Corn dried distiller grains plus solubles (DDGS) is a valuable feed product utilized in finishing diets (Klopfenstein et al., 2008) and may influence growth performance differently, depending on grain source and processing.
The beef cattle National Re-search Council (NRC, 1996) reports DDGS having 11 percent ether extract on a dry-matter basis. This concentration has changed, how-ever, as the ethanol industry has evolved and extracts more oil from the corn, resulting in DDGS with a lower oil content of approximately 4 to 5 percent. This raises the question of what happens to the digestibility of this low-oil DDGS product.
We hypothesized that grain type and DDGS oil concentration would have an effect on site of digestion. Our objectives were to determine the effect of grain type and DDGS oil concentration on ruminal, intesti-nal and total-tract digestibility.
Experimental Procedures All animal care and handling
procedures were approved by the NDSU Animal Care and Use Com-mittee. Eight Holstein steers (1,579 ± 137 pounds) were used in a 4 x 4 Latin Square design consisting of four periods and four dietary treat-ments, with two steers assigned per treatment per period to determine the impact of grain type (corn vs. barley) and DDGS oil concentration (DDGS; moderate = 7.9 percent vs. low = 4.5 percent; Tables 1 and 2) on intake and total tract digestibility.
Steers were housed in indi-vidual tie stalls in a temperature-controlled environment at the North Dakota State University Animal

2016 North Dakota Beef Report 37
Nutrition and Physiology Center. Dietary treatments were offered to ensure ad libitum intake and 6 per-cent feed refusal daily. Treatments were 1) corn with moderate-fat DDGS, 2) corn with low-fat DDGS, 3) barley with moderate-fat DDGS and 4) barley with low-fat DDGS.
Steers were adapted from a high-forage diet to a high-concen-trate diet during a 21-day period. Then steers were adapted to their re-spective treatments during a seven-
day period followed by a seven-day sample (feed, feed refusals, feces, and duodenal and ileal digesta) collection period. Finally, a 10-day transition period occurred in which steers were transitioned to their next treatment diet.
Data were analyzed as a rep-licated 4 x 4 Latin Square, with a 2 x 2 factorial arrangement of treat-ments using generalized least square means mixed procedure in SAS. A P-value of less than or equal to 0.05
was considered a significant differ-ence, while a P-value of greater than 0.05 but less than 0.10 was consid-ered a tendency.
Results and Discussion We found no differences in dry-
matter intake between grain types (Table 3). Apparent ruminal dry-matter digestibility decreased (P = 0.02) in steers fed corn-based diets. Intestinal dry-matter digestibility as a percent of intake decreased (P < 0.03) in steers fed barley-based diets.
We observed no difference in total-tract dry-matter digestibility between grain types. No effects on dry-matter intake or digestibility were observed between steers fed low- or moderate-oil concentra-tions of DDGS. We also found no differences in crude protein intake between grain types.
We observed a tendency for ap-parent ruminal crude protein digest-ibility (percent of intake) to decrease (P = 0.06) in steers fed corn-based diets. We found a tendency (P = 0.09) for intestinal crude protein digestibility as a percent of intake to decrease in steers fed barley-based diets.
No differences were found in total-tract crude protein digestibil-ity between grain types. No effects were found on crude protein intake or digestibility between steers fed low- or moderate-oil concentrations of DDGS.
Starch intake was greater (P = 0.01) in steers fed corn-based diets than in steers fed barley-based diets. Apparent ruminal starch digestibil-ity and intestinal digestibility as a percent of intake did not differ be-tween grain types. Total-tract starch digestibility decreased (P = 0.01) in corn-based diets.
We found no effects on intake or digestibility of starch between low- and moderate-oil concentra-tions of DDGS. Intake of total lipids increased (P < 0.001) in steers fed
Table 1. Dietary composition.
Corn Barley
Dietary Component, Low-fat Moderate- Low-fat Moderate- % of dry matter DDGS fat DDGS DDGS fat DDGS
Rolled corn 50 50 – –Rolled barley – – 50 50DDGS 25 25 25 25Corn silage 20 20 20 20Limestone 2 2 2 2Urea 0.15 0.15 – – Salt 0.05 0.05 0.05 0.05Vitamin premix1 0.01 0.01 0.01 0.01Mineral premix2 0.05 0.05 0.05 0.05Rumensin3 0.02 0.02 0.02 0.02Tylan4 0.01 0.01 0.01 0.01Fine-ground corn 2.46 2.46 2.61 2.61Chromium oxide 0.25 0.25 0.25 0.25
1Contained 48,510 kilo International Units per kilogram (kIIU/kg) vitamin A and 4,630.5 kIU/kg vitamin D.2Contained 3.62 percent calcium, 2.56 percent copper,16 percent zinc, 6.5 percent iron, 4 percent manganese, 1.050 milligrams per kilogram (mg/kg) iodine and 250 mg/kg cobalt.3Contained 176.4 grams (g) monensin/kg premix.4Contained 88.2 g tylosin/kg premix.
Table 2. Analyzed nutrient concentration of diets.
Rolled Corn Rolled Barley
Dietary Component, Low-fat Moderate- Low-fat Moderate- % of dry matter DDGS fat DDGS DDGS fat DDGS
Crude protein 13.7 14.0 14.8 14.8Neutral detergent fiber 29.8 31.8 32.6 34.7Acid detergent fiber 11.9 12.5 13.3 14.1Ether extract 3.49 4.18 2.40 3.11Calcium 1.09 1.16 1.15 1.07Phosphorus 0.46 0.46 0.50 0.48Starch 43.6 42.1 37.1 37.5
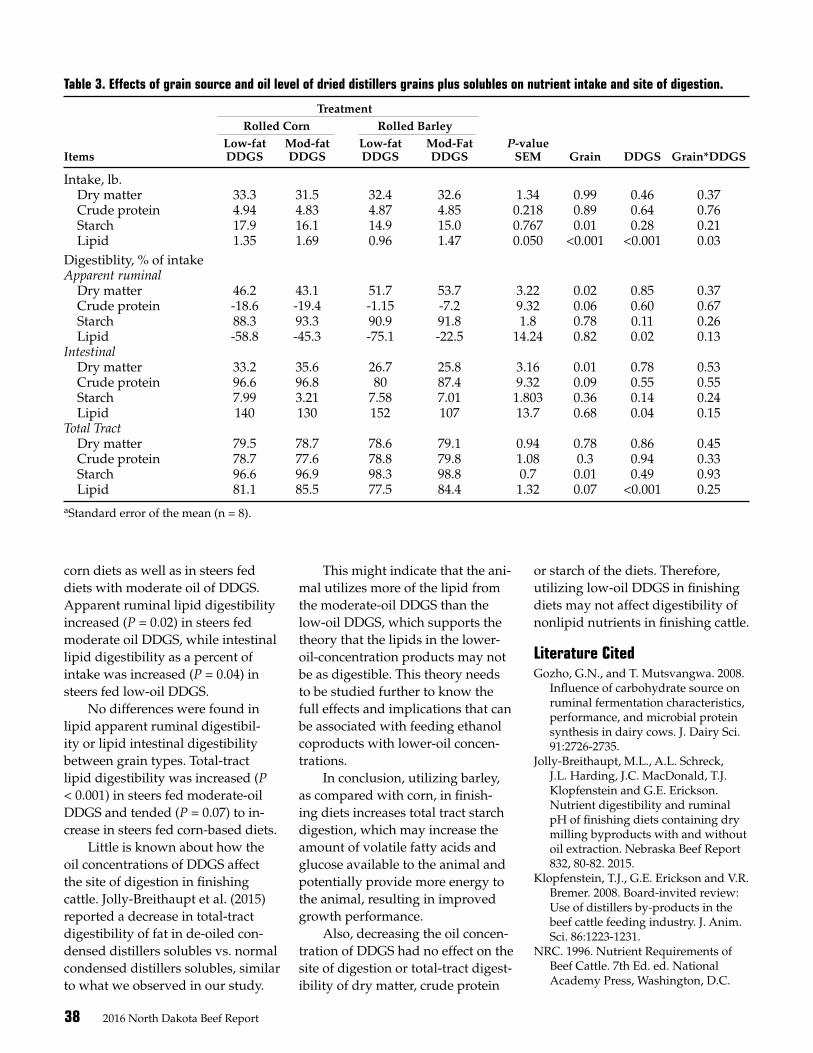
38 2016 North Dakota Beef Report
corn diets as well as in steers fed diets with moderate oil of DDGS. Apparent ruminal lipid digestibility increased (P = 0.02) in steers fed moderate oil DDGS, while intestinal lipid digestibility as a percent of intake was increased (P = 0.04) in steers fed low-oil DDGS.
No differences were found in lipid apparent ruminal digestibil-ity or lipid intestinal digestibility between grain types. Total-tract lipid digestibility was increased (P < 0.001) in steers fed moderate-oil DDGS and tended (P = 0.07) to in-crease in steers fed corn-based diets.
Little is known about how the oil concentrations of DDGS affect the site of digestion in finishing cattle. Jolly-Breithaupt et al. (2015) reported a decrease in total-tract digestibility of fat in de-oiled con-densed distillers solubles vs. normal condensed distillers solubles, similar to what we observed in our study.
This might indicate that the ani-mal utilizes more of the lipid from the moderate-oil DDGS than the low-oil DDGS, which supports the theory that the lipids in the lower-oil-concentration products may not be as digestible. This theory needs to be studied further to know the full effects and implications that can be associated with feeding ethanol coproducts with lower-oil concen-trations.
In conclusion, utilizing barley, as compared with corn, in finish-ing diets increases total tract starch digestion, which may increase the amount of volatile fatty acids and glucose available to the animal and potentially provide more energy to the animal, resulting in improved growth performance.
Also, decreasing the oil concen-tration of DDGS had no effect on the site of digestion or total-tract digest-ibility of dry matter, crude protein
or starch of the diets. Therefore, utilizing low-oil DDGS in finishing diets may not affect digestibility of nonlipid nutrients in finishing cattle.
Literature CitedGozho, G.N., and T. Mutsvangwa. 2008.
Influence of carbohydrate source on ruminal fermentation characteristics, performance, and microbial protein synthesis in dairy cows. J. Dairy Sci. 91:2726-2735.
Jolly-Breithaupt, M.L., A.L. Schreck, J.L. Harding, J.C. MacDonald, T.J. Klopfenstein and G.E. Erickson. Nutrient digestibility and ruminal pH of finishing diets containing dry milling byproducts with and without oil extraction. Nebraska Beef Report 832, 80-82. 2015.
Klopfenstein, T.J., G.E. Erickson and V.R. Bremer. 2008. Board-invited review: Use of distillers by-products in the beef cattle feeding industry. J. Anim. Sci. 86:1223-1231.
NRC. 1996. Nutrient Requirements of Beef Cattle. 7th Ed. ed. National Academy Press, Washington, D.C.
Table 3. Effects of grain source and oil level of dried distillers grains plus solubles on nutrient intake and site of digestion.
Treatment Rolled Corn Rolled Barley Low-fat Mod-fat Low-fat Mod-Fat P-value Items DDGS DDGS DDGS DDGS SEM Grain DDGS Grain*DDGS
Intake, lb. Dry matter 33.3 31.5 32.4 32.6 1.34 0.99 0.46 0.37 Crude protein 4.94 4.83 4.87 4.85 0.218 0.89 0.64 0.76 Starch 17.9 16.1 14.9 15.0 0.767 0.01 0.28 0.21 Lipid 1.35 1.69 0.96 1.47 0.050 <0.001 <0.001 0.03Digestiblity, % of intake Apparent ruminal Dry matter 46.2 43.1 51.7 53.7 3.22 0.02 0.85 0.37 Crude protein -18.6 -19.4 -1.15 -7.2 9.32 0.06 0.60 0.67 Starch 88.3 93.3 90.9 91.8 1.8 0.78 0.11 0.26 Lipid -58.8 -45.3 -75.1 -22.5 14.24 0.82 0.02 0.13Intestinal Dry matter 33.2 35.6 26.7 25.8 3.16 0.01 0.78 0.53 Crude protein 96.6 96.8 80 87.4 9.32 0.09 0.55 0.55 Starch 7.99 3.21 7.58 7.01 1.803 0.36 0.14 0.24 Lipid 140 130 152 107 13.7 0.68 0.04 0.15Total Tract Dry matter 79.5 78.7 78.6 79.1 0.94 0.78 0.86 0.45 Crude protein 78.7 77.6 78.8 79.8 1.08 0.3 0.94 0.33 Starch 96.6 96.9 98.3 98.8 0.7 0.01 0.49 0.93 Lipid 81.1 85.5 77.5 84.4 1.32 0.07 <0.001 0.25aStandard error of the mean (n = 8).
2016 North Dakota Beef Report 39
The influence of dry-rolled corn particle size and dried corn distillers grains plus solubles inclusion levels on rumen pH, ammonia and VFA concentration, total in vitro ruminal gas production and enteric methane emission Faithe E. Keomanivong1, Megan C. Ruch1, Jeng Hung Liu1, Jim D. Kirsch1, Carl R. Dahlen1, Shafiqur Rahman2, Md S. Borhan2, Marc L. Bauer1 and Kendall C. Swanson1
1Department of Animal Sciences, NDSU 2Department of Agricultural and Biosystems Engineering, NDSU
The objectives of this study were to determine the influence of dry-rolled corn particle size and dried distillers grains with solubles (DDGS) inclusion level on ruminal pH, ammonia (NH3) and volatile fatty acid (VFA) concentrations and in vitro ruminal gas production and methane (CH4) emission. No differences in rumen pH were seen among treatments. Rumen ammonia was greater in steers receiving 20 percent DDGS, while steers fed fine-rolled corn had greater concentrations of butyric acid than steers fed coarse-rolled treatments. Total gas production and methane concentration were unaffected by treatment.
SummaryEight cannulated Holstein steers
(1,159 ± 8 pounds) were used in a 4 x 4 Latin square design to examine the impact of coarse (2.5 millimeter [mm]) vs. fine-rolled corn (1.7 mm) and 20 vs. 40 percent DDGS inclu-sion on ruminal pH, ammonia and VFA concentrations, in vitro ruminal gas production and enteric methane emission. Steers were housed in individual tie stalls (3.3 by 7.2 feet) in a temperature-controlled environ-ment at the NDSU Animal Nutri-tion and Physiology Center. Dietary treatments (Table 1) were offered for ad libitum intake and consisted of 1) 65 percent coarse-rolled corn and 20 percent DDGS, 2) 45 percent coarse-rolled corn and 40 percent DDGS, 3) 65 percent fine-rolled corn and 20 percent DDGS and 4) 45 percent fine-rolled corn and 40 percent DDGS. Steers were provided experi-
mental diets for 14 days (seven days of diet adaptation and seven days of data collection). Results indicate no differences among dietary treat-ments in overall rumen pH. The concentration of NH3 was greater (P = 0.02) in cattle consuming 20 per-cent DDGS. Butyric acid concentra-tion was greater (P = 0.02) in cattle fed fine-rolled corn, while no other VFAs differed among treatments. No differences were observed in the amount and rate of total gas pro-duced or concentration of methane emitted.
Introduction Ethanol is a commonly pro-
duced alternative fuel that largely is manufactured using corn grown in the Midwestern U.S. The production of ethanol also supplies a byprod-uct known as dried corn distillers grains plus solubles (DDGS), which provides a valuable feed source for ruminants. Ensuring the amount
of corn grown to produce ethanol also allows much of the crop to be fed to cattle, which has proven to be extremely beneficial in regards to animal efficiency and environmental sustainability.
Methane is a greenhouse gas produced during enteric fermenta-tion of feed in ruminants and can be influenced by feed intake, type of carbohydrate in the diet, feed processing methods and changes in ruminal microflora. The high levels of starch found in corn-based rations have been shown to be beneficial to the environment because cattle fed these diets produce less methane due to reduced hydrogen produc-tion in the rumen. In addition, a greater feed efficiency provides a shorter time to market, allowing less opportunity of methane emission to occur (Swanson et al., 2014).
Unfortunately, in regard to distillers grains and methane pro-duction, variable results have been observed. For example, distillers grains contain greater concentra-tions of fat and fiber. The fat found in these byproducts may reduce or eliminate protozoa as well as methanogenic bacteria in the rumen, helping mitigate CH4 emissions by altering the hydrogen sink through bio-hydrogenation via propionate production (Massé et al., 2014). Fi-ber, however, is concentrated nearly three-fold during ethanol produc-tion and possesses greater metha-nogenic potential than that of starch (Behlke et al., 2008).

40 2016 North Dakota Beef Report
While a diet containing corn and DDGS offers a desirable nutrient profile, careful consideration must be taken when formulating such rations. Corn distillers grains com-monly are mixed with cattle rations in ranges from 10 to 50 percent (dry-matter [DM] basis), depending on the goal of supplementation. When used as a protein source, 10 to 15 percent inclusion usually is the most desirable, while an addition of 20 to 30 percent is more common when used as an energy source, with ap-proximately 40 to 50 percent gener-ally the upper limit (Klopfenstein et al., 2008).
The available information on particle size reduction of rolled corn is limited, but Loe et al. (2006) reported an increase in intake when offering finely vs. coarsely rolled corn. Grain particle size, level of rumen carbohydrate fermentation and level of neutral detergent fiber (NDF) also will impact rumen pH and may cause acidosis. With this in mind, developing feeding strategies is important to determine the opti-mum corn processing method and DDGS inclusion rates to obtain the greatest benefit from each ration.
Experimental ProceduresAll procedures involving ani-
mals were approved by the NDSU Animal Care and Use Committee. Eight cannulated Holstein steers (1,159 ± 8 pounds) were used in a 4 x 4 Latin square-designed experi-ment to examine the impact of dry-rolled corn processing and DDGS inclusion rate on ruminal pH, am-monia concentration, VFA profile, ruminal gas production and in vitro enteric methane emission in cattle.
Steers were housed in individu-al stalls in a temperature-controlled environment at the NDSU Animal Nutrition and Physiology Center. Dietary treatments (Table 1) were offered to ensure ad libitum intake
and approximately 6 percent feed refusal daily. Treatments consisted of 1) coarse-rolled (2.5 millimeters [mm]) and 20 percent DDGS, 2) coarse-rolled corn and 40 percent DDGS, 3) fine-rolled corn (1.7 mm) and 20 percent DDGS and 4) fine-rolled corn and 40 percent DDGS.
Diets were formulated to meet or exceed National Research Coun-cil (NRC) recommendations for degradable intake protein (DIP), me-tabolizable protein (MP), vitamins and minerals (NRC, 1996). Before the initiation of the experiment, steers were adapted to a high-grain diet during a period of 21 days. A preliminary period of seven days on the animals’ respective treatment preceded seven days of sample collection for each period. This was
followed by a three-day rest period in which steers were offered an in-termediate diet to allow all animals to return to a basal level.
Ruminal pH was determined using a wireless pH sensor (Kahne Ltd., Auckland, New Zealand), with measurements taken every five min-utes from days 3 to 5 of the collec-tion period. Sensors were calibrated with 7 and 4 pH solutions before each period and were inserted manually into the rumen and placed in the liquid phase of the ventral sac.
Ammonia and VFA concen-trations were quantified using a subsample of approximately 200 milliliters (mL) of rumen fluid col-lected from days 3 to 5 (at 2 a.m., 8 a.m., 2 p.m. and 8 p.m. on day 3; 4 a.m., 10 a.m., 4 p.m. and 10 p.m.
Table 1. Dietary composition and analyzed nutrient concentration of diets (DM basis).
Coarse-rolled corn Fine-rolled corn
20% 40% 20% 40% Dietary component, % of DM DDGS DDGS DDGS DDGS
Coarse-rolled corn 65.0 45.0 – –Fine-rolled corn – – 65.0 45.0Dried corn distillers grains with solubles 20.0 40.0 20.0 40.0Grass-legume hay 5.0 5.0 5.0 5.0Corn silage 5.0 5.0 5.0 5.0Limestone 1.56 1.90 1.56 1.90Urea 0.85 – 0.85 –Salt 0.20 0.20 0.20 0.20Vitamin premix 0.01 0.01 0.01 0.01Trace mineral premix 0.05 0.05 0.05 0.05Rumensin/Tylan premix 0.03 0.03 0.03 0.03Fine-ground corn 2.05 2.56 2.05 2.56Chromium oxide 0.25 0.25 0.25 0.25
Feed Analysis Dry matter, % of as fed 82.2 82.9 82.4 83.6 Organic matter, % of DM 94.9 93.7 95.1 93.8 Crude protein, % of DM 16.3 17.9 15.9 17.4 Neutral detergent fiber, % of DM 27.1 30.2 24.5 30.5 Acid detergent fiber, % of DM 9.02 11.1 8.47 11.0 Fat, % of DM 4.45 4.92 3.77 4.86 Calcium, % of DM 0.794 0.929 0.757 1.00 Phosphorus, % of DM 0.408 0.537 0.409 0.538
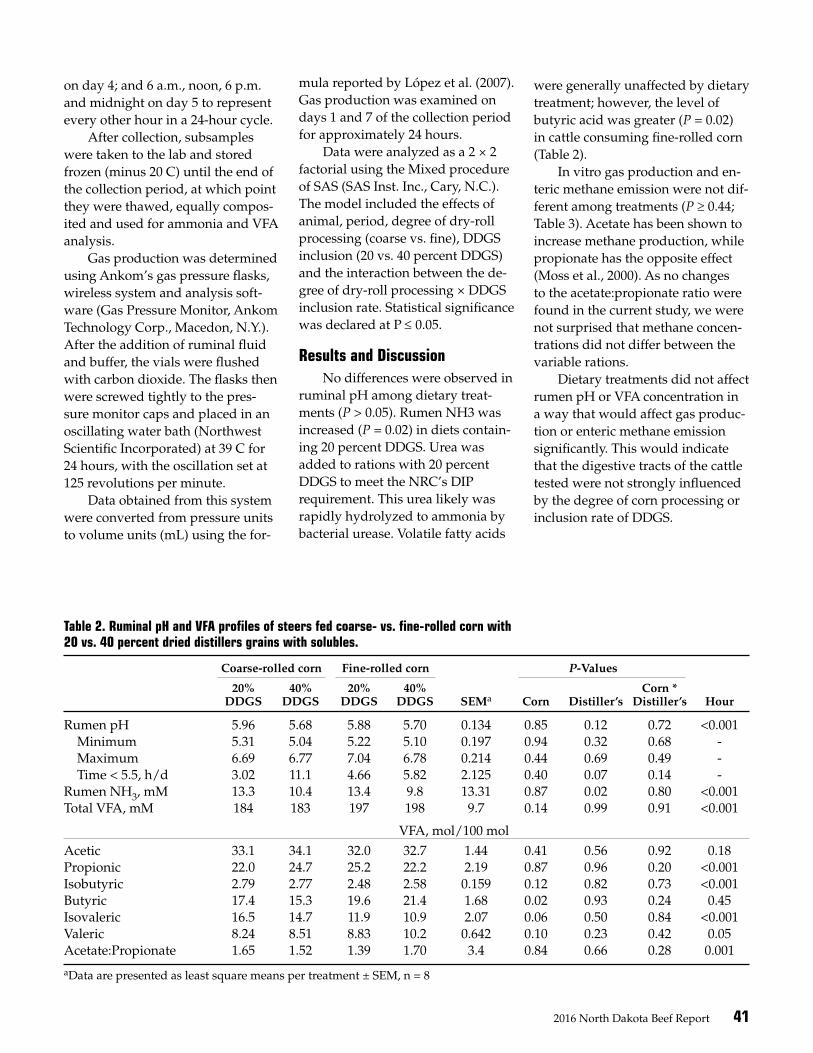
2016 North Dakota Beef Report 41
on day 4; and 6 a.m., noon, 6 p.m. and midnight on day 5 to represent every other hour in a 24-hour cycle.
After collection, subsamples were taken to the lab and stored frozen (minus 20 C) until the end of the collection period, at which point they were thawed, equally compos-ited and used for ammonia and VFA analysis.
Gas production was determined using Ankom’s gas pressure flasks, wireless system and analysis soft-ware (Gas Pressure Monitor, Ankom Technology Corp., Macedon, N.Y.). After the addition of ruminal fluid and buffer, the vials were flushed with carbon dioxide. The flasks then were screwed tightly to the pres-sure monitor caps and placed in an oscillating water bath (Northwest Scientific Incorporated) at 39 C for 24 hours, with the oscillation set at 125 revolutions per minute.
Data obtained from this system were converted from pressure units to volume units (mL) using the for-
mula reported by López et al. (2007). Gas production was examined on days 1 and 7 of the collection period for approximately 24 hours.
Data were analyzed as a 2 × 2 factorial using the Mixed procedure of SAS (SAS Inst. Inc., Cary, N.C.). The model included the effects of animal, period, degree of dry-roll processing (coarse vs. fine), DDGS inclusion (20 vs. 40 percent DDGS) and the interaction between the de-gree of dry-roll processing × DDGS inclusion rate. Statistical significance was declared at P ≤ 0.05.
Results and DiscussionNo differences were observed in
ruminal pH among dietary treat-ments (P > 0.05). Rumen NH3 was increased (P = 0.02) in diets contain-ing 20 percent DDGS. Urea was added to rations with 20 percent DDGS to meet the NRC’s DIP requirement. This urea likely was rapidly hydrolyzed to ammonia by bacterial urease. Volatile fatty acids
were generally unaffected by dietary treatment; however, the level of butyric acid was greater (P = 0.02) in cattle consuming fine-rolled corn (Table 2).
In vitro gas production and en-teric methane emission were not dif-ferent among treatments (P ≥ 0.44; Table 3). Acetate has been shown to increase methane production, while propionate has the opposite effect (Moss et al., 2000). As no changes to the acetate:propionate ratio were found in the current study, we were not surprised that methane concen-trations did not differ between the variable rations.
Dietary treatments did not affect rumen pH or VFA concentration in a way that would affect gas produc-tion or enteric methane emission significantly. This would indicate that the digestive tracts of the cattle tested were not strongly influenced by the degree of corn processing or inclusion rate of DDGS.
Table 2. Ruminal pH and VFA profiles of steers fed coarse- vs. fine-rolled corn with 20 vs. 40 percent dried distillers grains with solubles.
Coarse-rolled corn Fine-rolled corn P-Values
20% 40% 20% 40% Corn * DDGS DDGS DDGS DDGS SEMa Corn Distiller’s Distiller’s Hour
Rumen pH 5.96 5.68 5.88 5.70 0.134 0.85 0.12 0.72 <0.001 Minimum 5.31 5.04 5.22 5.10 0.197 0.94 0.32 0.68 - Maximum 6.69 6.77 7.04 6.78 0.214 0.44 0.69 0.49 - Time < 5.5, h/d 3.02 11.1 4.66 5.82 2.125 0.40 0.07 0.14 -Rumen NH3, mM 13.3 10.4 13.4 9.8 13.31 0.87 0.02 0.80 <0.001Total VFA, mM 184 183 197 198 9.7 0.14 0.99 0.91 <0.001
VFA, mol/100 molAcetic 33.1 34.1 32.0 32.7 1.44 0.41 0.56 0.92 0.18Propionic 22.0 24.7 25.2 22.2 2.19 0.87 0.96 0.20 <0.001Isobutyric 2.79 2.77 2.48 2.58 0.159 0.12 0.82 0.73 <0.001Butyric 17.4 15.3 19.6 21.4 1.68 0.02 0.93 0.24 0.45Isovaleric 16.5 14.7 11.9 10.9 2.07 0.06 0.50 0.84 <0.001Valeric 8.24 8.51 8.83 10.2 0.642 0.10 0.23 0.42 0.05Acetate:Propionate 1.65 1.52 1.39 1.70 3.4 0.84 0.66 0.28 0.001
aData are presented as least square means per treatment ± SEM, n = 8
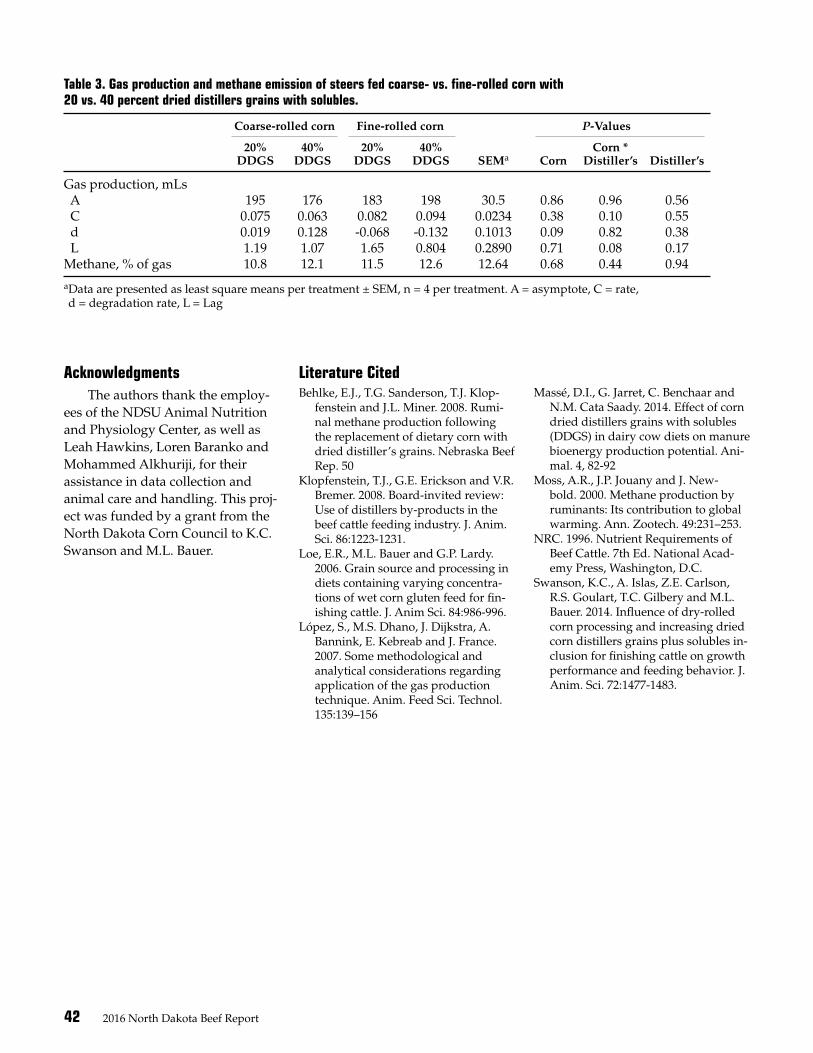
42 2016 North Dakota Beef Report
AcknowledgmentsThe authors thank the employ-
ees of the NDSU Animal Nutrition and Physiology Center, as well as Leah Hawkins, Loren Baranko and Mohammed Alkhuriji, for their assistance in data collection and animal care and handling. This proj-ect was funded by a grant from the North Dakota Corn Council to K.C. Swanson and M.L. Bauer.
Literature CitedBehlke, E.J., T.G. Sanderson, T.J. Klop-
fenstein and J.L. Miner. 2008. Rumi-nal methane production following the replacement of dietary corn with dried distiller’s grains. Nebraska Beef Rep. 50
Klopfenstein, T.J., G.E. Erickson and V.R. Bremer. 2008. Board-invited review: Use of distillers by-products in the beef cattle feeding industry. J. Anim. Sci. 86:1223-1231.
Loe, E.R., M.L. Bauer and G.P. Lardy. 2006. Grain source and processing in diets containing varying concentra-tions of wet corn gluten feed for fin-ishing cattle. J. Anim Sci. 84:986-996.
López, S., M.S. Dhano, J. Dijkstra, A. Bannink, E. Kebreab and J. France. 2007. Some methodological and analytical considerations regarding application of the gas production technique. Anim. Feed Sci. Technol. 135:139–156
Massé, D.I., G. Jarret, C. Benchaar and N.M. Cata Saady. 2014. Effect of corn dried distillers grains with solubles (DDGS) in dairy cow diets on manure bioenergy production potential. Ani-mal. 4, 82-92
Moss, A.R., J.P. Jouany and J. New-bold. 2000. Methane production by ruminants: Its contribution to global warming. Ann. Zootech. 49:231–253.
NRC. 1996. Nutrient Requirements of Beef Cattle. 7th Ed. National Acad-emy Press, Washington, D.C.
Swanson, K.C., A. Islas, Z.E. Carlson, R.S. Goulart, T.C. Gilbery and M.L. Bauer. 2014. Influence of dry-rolled corn processing and increasing dried corn distillers grains plus solubles in-clusion for finishing cattle on growth performance and feeding behavior. J. Anim. Sci. 72:1477-1483.
Table 3. Gas production and methane emission of steers fed coarse- vs. fine-rolled corn with 20 vs. 40 percent dried distillers grains with solubles.
Coarse-rolled corn Fine-rolled corn P-Values
20% 40% 20% 40% Corn * DDGS DDGS DDGS DDGS SEMa Corn Distiller’s Distiller’s
Gas production, mLs A 195 176 183 198 30.5 0.86 0.96 0.56 C 0.075 0.063 0.082 0.094 0.0234 0.38 0.10 0.55 d 0.019 0.128 -0.068 -0.132 0.1013 0.09 0.82 0.38 L 1.19 1.07 1.65 0.804 0.2890 0.71 0.08 0.17Methane, % of gas 10.8 12.1 11.5 12.6 12.64 0.68 0.44 0.94
aData are presented as least square means per treatment ± SEM, n = 4 per treatment. A = asymptote, C = rate, d = degradation rate, L = Lag

2016 North Dakota Beef Report 43
Effects of maternal nutrition on fructose and expression of the fructose transporter GLUT5 in bovine tissues and fluids from days 16 to 50 of gestation Nathaniel P. Greseth1, Matthew S. Crouse1, Kyle J. McLean1, Mellissa R. Crosswhite1, Nicolas Negrin Pereira1, Alison K. Ward1, Larry P. Reynolds1, Carl. R. Dahlen1, Bryan W. Neville2, Pawel P. Borowicz1 and Joel S. Caton1
1Department of Animal Sciences, NDSU 2Central Grasslands Research Extension Center, NDSU
The objectives of this study were to determine the effects of maternal nutritional status on fructose concentration in maternal and fetal fluids and the mRNA expression of the fructose transporter GLUT5 in maternal and fetal tissues on days 16, 34, and 50 of gestation. The expression of GLUT5 was not influenced by maternal nutritional status; however, the concentration of fructose in amniotic fluids was influenced by day of gestation and maternal nutritional status.
SummaryWe tested the hypothesis that
the concentration of fructose in ma-ternal and fetal fluids, and expres-sion of GLUT5 in utero-placental tissues, would be influenced by day of gestation and maternal nutri-tional status. Angus-cross heifers (n = 46, about 15 months of age; aver-age initial body weight [BW] = 716 pounds) were estrus synchronized, bred via artificial insemination (AI) and ovariohysterectomized on day 16, 34, or 50 of their respective gestations (n = 6 to 9/day). Some heifers (n = 6) were not bred to serve as nonpregnant (NP) controls and were ovariohysterectomized on day 16 of the synchronized estrous cycle. Immediately after AI, heif-ers were assigned randomly to one of two treatment groups: Control (CON) received 100 percent of the National Research Council (NRC, 2000) requirements to gain 1 pound per heifer daily, and restricted (RES) received only 60 percent of the CON diet. Tissues collected included:
caruncular tissue from the uterine horn ipsilateral to the corpus luteum (PC), from the uterine horn contra-lateral to the corpus luteum (NPC), inter-caruncular tissue from the uterine horn ipsilateral to the corpus luteum (PIC) and from the uterine horn contralateral to the corpus luteum (NPIC), as well as chorioal-lantoic tissue (FM). Fluids collected included: maternal serum, histo-troph collected from horn ipsilateral to the corpus luteum (P histotroph) and from the horn contralateral to the corpus luteum (NP histotroph), allantoic fluid and amniotic fluid. Fetal membranes, allantoic fluid and amniotic fluid were not collected in NP heifers due to the lack of the presence of fetal tissues and fluids in NP animals. Serum fructose concen-trations were greater (P < 0.01) in nonpregnant heifers, compared with pregnant heifers. Concentrations of fructose in P histotroph and NP histotroph were greater (P < 0.01) on day 50, compared with days 16 and 34. Amniotic fluid was influenced by a day × treatment interaction, with day 34 RES being greater (P = 0.04) than day 50 CON and RES heifers.
Expression of GLUT5 was greater on day 34 in PC (P = 0.02) and NPC (P < 0.01). In FM, day 16 was greater (P = 0.04), compared with days 34 and 50 of gestation. These results indi-cate that the expression of GLUT5 is not influenced by maternal nutri-tional status; however, concentra-tions of fructose in amniotic fluids are influenced by maternal nutri-tional status and day of gestation.
IntroductionFirst-service AI rates in beef
cows are approximately 90 percent (Bridges et al., 2013); however, by day 30, only 50 to 60 percent are vi-able embryos in beef cows. Further-more, fetal growth is vulnerable to maternal dietary nutrient deficien-cies during the first trimester of gestation (Wu et al., 2004).
Currently, fetal undernutrition occurs in grazing livestock world-wide (Wu et al., 2004). Early in gestation, trans-placental exchange has yet to be established; therefore, nutrients must be transported to the conceptus via nutrient transport-ers in the uterus and developing placenta, such as the fructose trans-porter GLUT5.
Fructose is the most abundant hexose sugar in fetal blood and fetal fluids of ungulates (Kim et al., 2012), and maternal undernutri-tion has been implicated in altered fructose transport (Zhang et al., 2015). Having an understanding of how maternal nutrition affects the mRNA expression and supply of fructose to the conceptus could lead to future research that may directly influence the flux of fructose from
44 2016 North Dakota Beef Report
the maternal to fetal systems in early gestation.
This research utilized a newly developed technique to ovariohys-terectomize cattle without slaughter to allow for an accurate analysis of fetal growth and development, as well as utero-placental tissues and fluids on days 16, 34 and 50 of early gestation in beef heifers.
In this study, we tested the hypothesis that the concentration of fructose in maternal and fetal fluids, along with the relative mRNA ex-pression of GLUT5 in maternal and fetal tissues, would be influenced by day of gestation and maternal nutritional status.
Experimental ProceduresAll animal procedures were
approved by the North Dakota State University Institutional Animal Care and Use Committee (IACUC num-bers A14053 and A16049). Cross-bred Angus heifers (n = 49, about 15 months of age; average initial BW = 716 pounds) were exposed to the 5-day CO-Synch + CIDR estrus synchronization protocol. Six heifers were not inseminated to serve as nonpregnant controls, but received an ovariohysterectomy on day 16 of the subsequent synchronized es-trous cycle. The remaining heifers (n = six to nine/day of gestation/treat-ment) were bred by AI to a common sire at 12 hours after observed estrus and ovariohysterectomized at days 16, 34, and 50 of gestation.
Immediately following the ovar-iohysterectomy, maternal caruncular (PC) and inter-caruncular tissue (PIC) were collected from the uter-ine horn ipsilateral to the corpus lu-teum, along with caruncular (NPC) and inter-caruncular tissue (NPIC) collected from the uterine horn con-tralateral to the corpus luteum. Also, fetal membranes (chorioallantois) were obtained.
Fetal membranes were collected only on days 16, 34, and 50 of gesta-
tion due to nonpregnant controls not having fetal membranes. All tissues were frozen immediately in liquid nitrogen-cooled isopentane and stored at minus 112 F.
Serum samples were obtained via jugular venipuncture on the day of ovariohysterectomy, and blood constituents were separated by cen-trifugation and stored at minus 20 F. Histotroph was obtained from the uterine horn ipsilateral to the corpus luteum (P histotroph) and from the uterine horn contralateral to the corpus luteum (NP histotroph) for pregnant and NP heifers.
Allantoic and amniotic fluids were collected on days 34 and 50 of gestation due to the limited presence of fetal fluids on day 16. Histotroph, allantoic and amniotic were snap-frozen in liquid nitrogen-cooled isopentane and stored at minus 20 F immediately after being obtained.
Fructose concentrations among fluid samples were determined by utilizing a colorimetric assay kit. Ex-pression of GLUT5 was determined by first isolating and purifying RNA from collected tissue samples, fol-lowed by real-time quantitative PCR (qPCR) to determine differences in mRNA expression of the fructose transporter in each tissue relative to a NP endometrium sample.
Results and DiscussionConcentrations of fructose in
maternal serum were greater (P < 0.01) in NP heifers, compared with pregnant heifers (Table 1). In P histotroph, fructose concentrations were greater (P < 0.01) on day 50, compared with days 16 and 34 (1.34, 0.18, and 0.63 millimolar [mM], respectively; SEM = 0.22).
Fructose concentrations also were greater (P < 0.01) on day 34 + 50, when compared with day 16 (Table 1). In NP histotroph, day 50 (0.97 mM) was greater (P = 0.01) than days 16 and 34 (0.10, and 0.36 mM, respectively; SEM = 0.20).
Additionally, fructose concen-trations were greater (P = 0.02) in NP histotroph on days 34 + 50, compared with day 16 (Table 1). Fructose concentrations in amniotic fluid were influenced by a day × treatment interaction, where day 34 RES (3.60 mM) was greater (P = 0.04) than the day 50 CON and RES treatments (2.57, and 1.55 mM, respectively; SEM = 0.29). Further-more, day 34 and 50 CON (3.30 and 2.57 mM, respectively) were greater than day 50 RES (1.55 mM; SEM = 0.29).
In PC, a main effect of day was observed; day 34 was greater (44.40-fold greater than NP; P = 0.02; Table 2) than day 16 and day 34 (4.79 and 6.49-fold greater than NP, respec-tively; SEM = 10.88).
In NPC, the expression of GLUT5 was greater (P < 0.01) on days 34 and 50, compared with day 16 (44.19, 36.60 and 3.22-fold greater than NP, respectively; Table 2). Furthermore, the relative expression of GLUT5 in pregnant heifers was greater (P = 0.02), compared with NP heifers.
A main effect of day was observed in FM where day 16 was greater (P = 0.04) than day 50 (80.17 and 27.39, respectively; SEM = 13.82; Table 2). Also, day 16 was greater, compared with day 34 + 50 (P = 0.03). The results show that as pregnancy advances, fructose and mRNA expression of GLUT5 changes significantly among various tissues and fluids measured in this study.
The low fructose concentration found in maternal serum is expected because fructose is not a main physi-ological fuel for the dam. The cause of the NP heifers having a greater fructose concentration in serum samples could be due to fructose being utilized by the conceptus. The greater mRNA expression of GLUT5 in pregnant heifers, com-pared with NP heifers in NPC, may
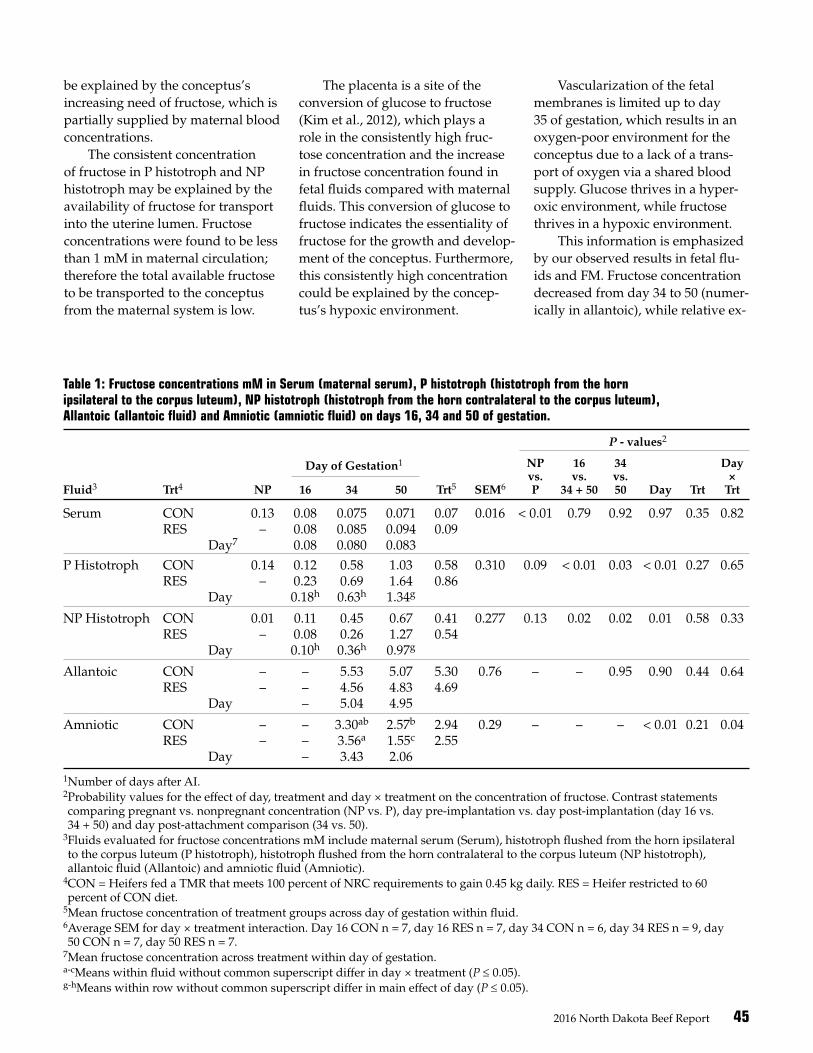
2016 North Dakota Beef Report 45
be explained by the conceptus’s increasing need of fructose, which is partially supplied by maternal blood concentrations.
The consistent concentration of fructose in P histotroph and NP histotroph may be explained by the availability of fructose for transport into the uterine lumen. Fructose concentrations were found to be less than 1 mM in maternal circulation; therefore the total available fructose to be transported to the conceptus from the maternal system is low.
The placenta is a site of the conversion of glucose to fructose (Kim et al., 2012), which plays a role in the consistently high fruc-tose concentration and the increase in fructose concentration found in fetal fluids compared with maternal fluids. This conversion of glucose to fructose indicates the essentiality of fructose for the growth and develop-ment of the conceptus. Furthermore, this consistently high concentration could be explained by the concep-tus’s hypoxic environment.
Vascularization of the fetal membranes is limited up to day 35 of gestation, which results in an oxygen-poor environment for the conceptus due to a lack of a trans-port of oxygen via a shared blood supply. Glucose thrives in a hyper-oxic environment, while fructose thrives in a hypoxic environment.
This information is emphasized by our observed results in fetal flu-ids and FM. Fructose concentration decreased from day 34 to 50 (numer-ically in allantoic), while relative ex-
Table 1: Fructose concentrations mM in Serum (maternal serum), P histotroph (histotroph from the horn ipsilateral to the corpus luteum), NP histotroph (histotroph from the horn contralateral to the corpus luteum), Allantoic (allantoic fluid) and Amniotic (amniotic fluid) on days 16, 34 and 50 of gestation.
P - values2
Day of Gestation1 NP 16 34 Day vs. vs. vs. × Fluid3 Trt4 NP 16 34 50 Trt5 SEM6 P 34 + 50 50 Day Trt Trt
Serum CON 0.13 0.08 0.075 0.071 0.07 0.016 < 0.01 0.79 0.92 0.97 0.35 0.82 RES – 0.08 0.085 0.094 0.09 Day7 0.08 0.080 0.083 P Histotroph CON 0.14 0.12 0.58 1.03 0.58 0.310 0.09 < 0.01 0.03 < 0.01 0.27 0.65 RES – 0.23 0.69 1.64 0.86 Day 0.18h 0.63h 1.34g
NP Histotroph CON 0.01 0.11 0.45 0.67 0.41 0.277 0.13 0.02 0.02 0.01 0.58 0.33 RES – 0.08 0.26 1.27 0.54 Day 0.10h 0.36h 0.97g
Allantoic CON – – 5.53 5.07 5.30 0.76 – – 0.95 0.90 0.44 0.64 RES – – 4.56 4.83 4.69 Day – 5.04 4.95
Amniotic CON – – 3.30ab 2.57b 2.94 0.29 – – – < 0.01 0.21 0.04 RES – – 3.56a 1.55c 2.55 Day – 3.43 2.06
1Number of days after AI. 2Probability values for the effect of day, treatment and day × treatment on the concentration of fructose. Contrast statements comparing pregnant vs. nonpregnant concentration (NP vs. P), day pre-implantation vs. day post-implantation (day 16 vs. 34 + 50) and day post-attachment comparison (34 vs. 50).3Fluids evaluated for fructose concentrations mM include maternal serum (Serum), histotroph flushed from the horn ipsilateral to the corpus luteum (P histotroph), histotroph flushed from the horn contralateral to the corpus luteum (NP histotroph), allantoic fluid (Allantoic) and amniotic fluid (Amniotic). 4CON = Heifers fed a TMR that meets 100 percent of NRC requirements to gain 0.45 kg daily. RES = Heifer restricted to 60 percent of CON diet. 5Mean fructose concentration of treatment groups across day of gestation within fluid.6Average SEM for day × treatment interaction. Day 16 CON n = 7, day 16 RES n = 7, day 34 CON n = 6, day 34 RES n = 9, day 50 CON n = 7, day 50 RES n = 7.7Mean fructose concentration across treatment within day of gestation. a-cMeans within fluid without common superscript differ in day × treatment (P ≤ 0.05).g-hMeans within row without common superscript differ in main effect of day (P ≤ 0.05).
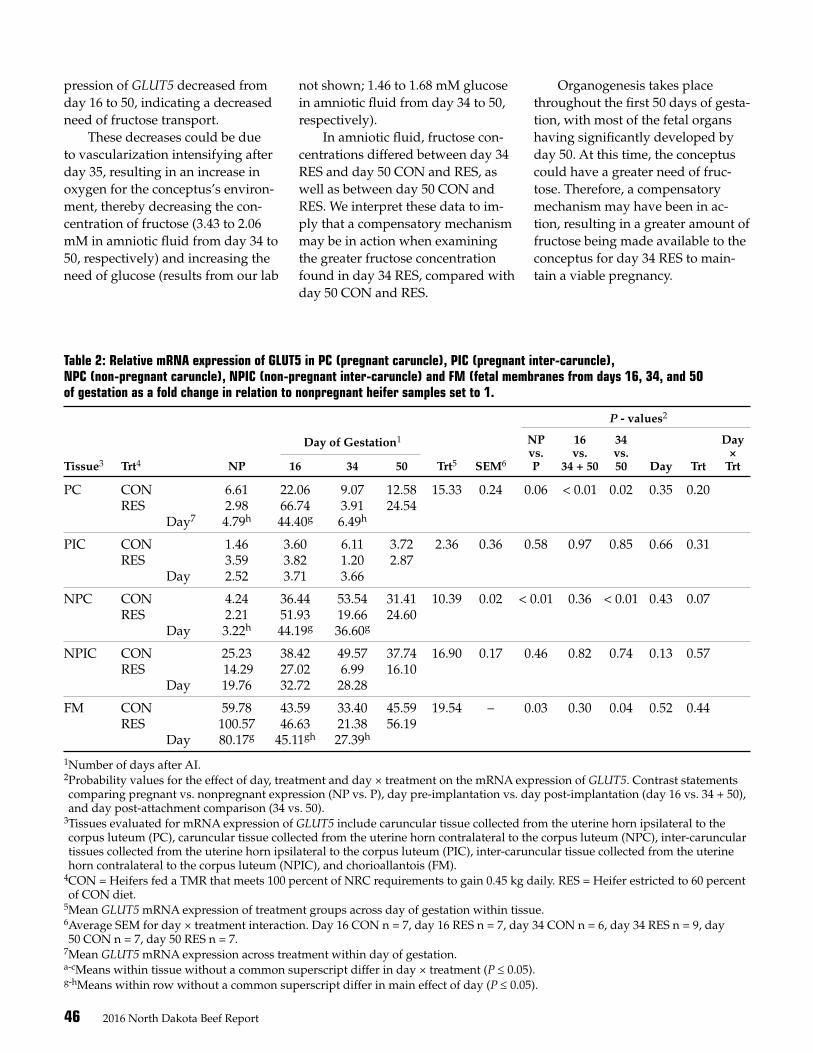
46 2016 North Dakota Beef Report
Table 2: Relative mRNA expression of GLUT5 in PC (pregnant caruncle), PIC (pregnant inter-caruncle), NPC (non-pregnant caruncle), NPIC (non-pregnant inter-caruncle) and FM (fetal membranes from days 16, 34, and 50 of gestation as a fold change in relation to nonpregnant heifer samples set to 1.
P - values2
Day of Gestation1 NP 16 34 Day vs. vs. vs. × Tissue3 Trt4 NP 16 34 50 Trt5 SEM6 P 34 + 50 50 Day Trt Trt
PC CON 6.61 22.06 9.07 12.58 15.33 0.24 0.06 < 0.01 0.02 0.35 0.20 RES 2.98 66.74 3.91 24.54 Day7 4.79h 44.40g 6.49h
PIC CON 1.46 3.60 6.11 3.72 2.36 0.36 0.58 0.97 0.85 0.66 0.31 RES 3.59 3.82 1.20 2.87 Day 2.52 3.71 3.66
NPC CON 4.24 36.44 53.54 31.41 10.39 0.02 < 0.01 0.36 < 0.01 0.43 0.07 RES 2.21 51.93 19.66 24.60 Day 3.22h 44.19g 36.60g
NPIC CON 25.23 38.42 49.57 37.74 16.90 0.17 0.46 0.82 0.74 0.13 0.57 RES 14.29 27.02 6.99 16.10 Day 19.76 32.72 28.28
FM CON 59.78 43.59 33.40 45.59 19.54 – 0.03 0.30 0.04 0.52 0.44 RES 100.57 46.63 21.38 56.19 Day 80.17g 45.11gh 27.39h
1Number of days after AI. 2Probability values for the effect of day, treatment and day × treatment on the mRNA expression of GLUT5. Contrast statements comparing pregnant vs. nonpregnant expression (NP vs. P), day pre-implantation vs. day post-implantation (day 16 vs. 34 + 50), and day post-attachment comparison (34 vs. 50).3Tissues evaluated for mRNA expression of GLUT5 include caruncular tissue collected from the uterine horn ipsilateral to the corpus luteum (PC), caruncular tissue collected from the uterine horn contralateral to the corpus luteum (NPC), inter-caruncular tissues collected from the uterine horn ipsilateral to the corpus luteum (PIC), inter-caruncular tissue collected from the uterine horn contralateral to the corpus luteum (NPIC), and chorioallantois (FM).4CON = Heifers fed a TMR that meets 100 percent of NRC requirements to gain 0.45 kg daily. RES = Heifer estricted to 60 percent of CON diet. 5Mean GLUT5 mRNA expression of treatment groups across day of gestation within tissue.6Average SEM for day × treatment interaction. Day 16 CON n = 7, day 16 RES n = 7, day 34 CON n = 6, day 34 RES n = 9, day 50 CON n = 7, day 50 RES n = 7.7Mean GLUT5 mRNA expression across treatment within day of gestation. a-cMeans within tissue without a common superscript differ in day × treatment (P ≤ 0.05).g-hMeans within row without a common superscript differ in main effect of day (P ≤ 0.05).
pression of GLUT5 decreased from day 16 to 50, indicating a decreased need of fructose transport.
These decreases could be due to vascularization intensifying after day 35, resulting in an increase in oxygen for the conceptus’s environ-ment, thereby decreasing the con-centration of fructose (3.43 to 2.06 mM in amniotic fluid from day 34 to 50, respectively) and increasing the need of glucose (results from our lab
not shown; 1.46 to 1.68 mM glucose in amniotic fluid from day 34 to 50, respectively).
In amniotic fluid, fructose con-centrations differed between day 34 RES and day 50 CON and RES, as well as between day 50 CON and RES. We interpret these data to im-ply that a compensatory mechanism may be in action when examining the greater fructose concentration found in day 34 RES, compared with day 50 CON and RES.
Organogenesis takes place throughout the first 50 days of gesta-tion, with most of the fetal organs having significantly developed by day 50. At this time, the conceptus could have a greater need of fruc-tose. Therefore, a compensatory mechanism may have been in ac-tion, resulting in a greater amount of fructose being made available to the conceptus for day 34 RES to main-tain a viable pregnancy.
2016 North Dakota Beef Report 47
When examining the greater concentrations found in day 50 CON, compared with day 50 RES, we interpret these data to imply that the conceptus could have a lower need of fructose at this time, which is supported by the decrease in fructose concentration observed from day 34 to 50 in amniotic fluid and the increased placental develop-ment and vascularization on day 34, compared with day 50.
This potential decreased need of fructose may have resulted in the lack of the aforementioned compensatory mechanism. There-fore, the greater concentration of fructose found in day 50 CON could be explained by the day 50 CON receiving 100 percent of NRC requirements, while the day 50 RES received only 60 percent of require-ments.
In PC and NPC, relative GLUT5 mRNA expression was greater on days 34 and 50, compared with day 16. We interpret these data to imply that the increase could be due to the critical period for maternal recognition (days 15 to 16) already passing (Senger, 2012), resulting in an increase in expression to compen-sate for the nutritional needs of the developing conceptus.
The FM had high mRNA expres-sion of GLUT5 relative to NP. We interpret this data to imply that the conversion of glucose to fructose may have an impact on the mRNA expression of GLUT5 in FM.
When examining the main effect of day seen in FM, the fold change relative to NP decreases from 80.17 at day 16 to 27.39-fold greater than
NP by day 50. We interpret these data to imply that sugars such as fructose are highly important in supplying energy for the elongation of the conceptus on days 12 to15 to ensure maternal recognition of pregnancy to occur by days 15 to 16 (Senger, 2012).
In conclusion, these data partially support our hypothesis that day of gestation and maternal nutritional status would impact mRNA expression of GLUT5 in utero-placental tissues and fructose concentration among maternal and fetal fluids. In partially keeping with our hypothesis, we found that day of gestation, but not a 40 percent global nutrient restriction, affects the relative expression of GLUT5 in PC, NPC and FM.
In addition, day of gestation, and not a 40 percent global nutrient restriction, affects fructose concen-tration in histotroph. Furthermore, maternal nutritional status and day of gestation affect fructose concen-tration in amniotic fluid.
With the establishment of these data, future research can be aimed at increasing efficiency of maternal and fetal nutrition. Specifically, provid-ing improvements to the dam’s nutrition at certain points of gesta-tion allows the conceptus to receive an appropriate amount of fructose throughout early gestation, which it needs for proper growth and devel-opment. Applications such as this may result in increased reproduc-tive efficiency and, ultimately, aid in supporting the increasing need of food by the growing world popula-tion.
Literature CitedBridges, G.A., M.L. Day, T.W. Geary and
L.H. Cruppe. 2013. Deficiencies in the uterine environment and failure to support embryonic development. J. Anim. Sci. 91:3002-3013
Elliot, I. Meat output must double by 2050. Feedstuffs. Accessed 8/5/2016: http://feedstuffsfoodlink.com/story-meat-ouput-must-double-by-2050-71-66920
Kim, J., G. Song, G. Wu and F.W. Bazer. 2012. Functional Roles of Fructose. PNAS. 109:E1619 – E1628.
Senger P.L. 2012. Early Embryogensis and Maternal Recognition of Preg-nancy. In:
Pathways to Pregnanncy and Parturi-tion. Current Conceptions Inc. Red-mond, Ore. P. 282.
Wu, G., F.W. Bazer, T.A. Cudd, C.J. Meininger and T.E. Spencer. 2004. Maternal nutrition and fetal develop-ment. J. of Nutrition. 9:2169-2172.
Zhang, S., T.R.H. Regnault, P.L. Barker, K.J. Botting, I.C. McMillen and C.M. McMillan, C.T. Roberts and J.L. Morrison. 2015. Placental adapta-tion in growth restriction. Nutrients. 7:360-389.
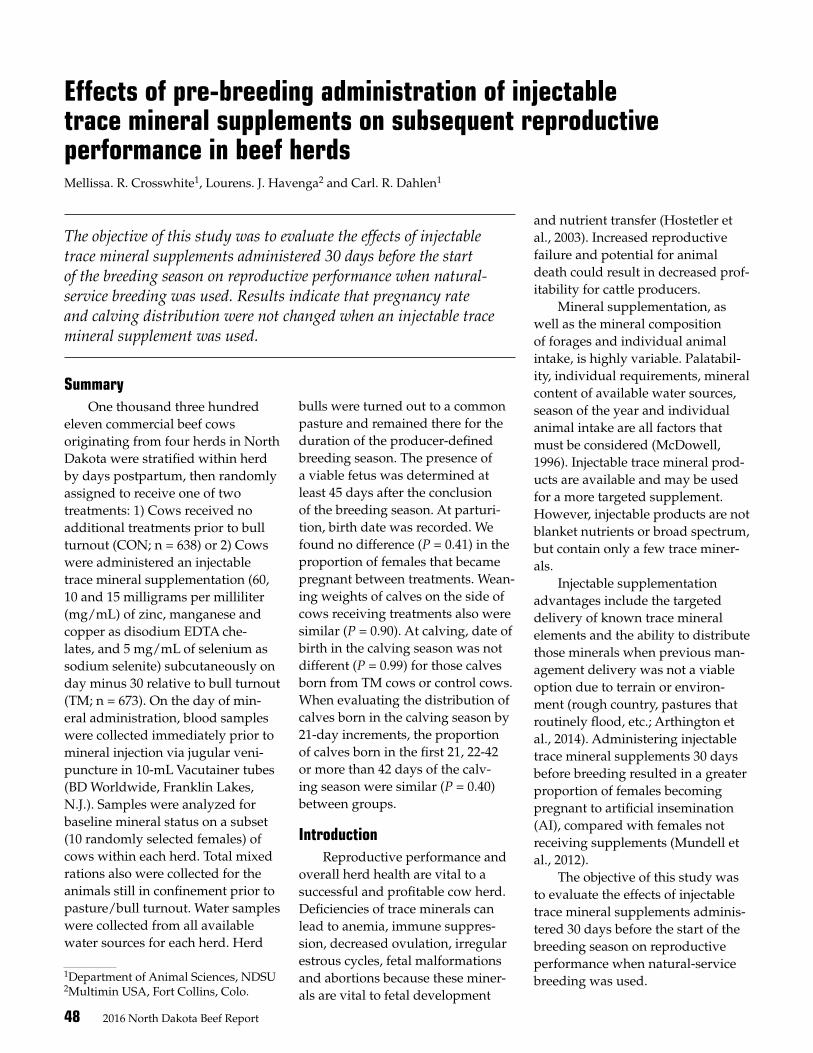
48 2016 North Dakota Beef Report
Effects of pre-breeding administration of injectable trace mineral supplements on subsequent reproductive performance in beef herds Mellissa. R. Crosswhite1, Lourens. J. Havenga2 and Carl. R. Dahlen1
1Department of Animal Sciences, NDSU 2Multimin USA, Fort Collins, Colo.
The objective of this study was to evaluate the effects of injectable trace mineral supplements administered 30 days before the start of the breeding season on reproductive performance when natural-service breeding was used. Results indicate that pregnancy rate and calving distribution were not changed when an injectable trace mineral supplement was used.
SummaryOne thousand three hundred
eleven commercial beef cows originating from four herds in North Dakota were stratified within herd by days postpartum, then randomly assigned to receive one of two treatments: 1) Cows received no additional treatments prior to bull turnout (CON; n = 638) or 2) Cows were administered an injectable trace mineral supplementation (60, 10 and 15 milligrams per milliliter (mg/mL) of zinc, manganese and copper as disodium EDTA che-lates, and 5 mg/mL of selenium as sodium selenite) subcutaneously on day minus 30 relative to bull turnout (TM; n = 673). On the day of min-eral administration, blood samples were collected immediately prior to mineral injection via jugular veni-puncture in 10-mL Vacutainer tubes (BD Worldwide, Franklin Lakes, N.J.). Samples were analyzed for baseline mineral status on a subset (10 randomly selected females) of cows within each herd. Total mixed rations also were collected for the animals still in confinement prior to pasture/bull turnout. Water samples were collected from all available water sources for each herd. Herd
bulls were turned out to a common pasture and remained there for the duration of the producer-defined breeding season. The presence of a viable fetus was determined at least 45 days after the conclusion of the breeding season. At parturi-tion, birth date was recorded. We found no difference (P = 0.41) in the proportion of females that became pregnant between treatments. Wean-ing weights of calves on the side of cows receiving treatments also were similar (P = 0.90). At calving, date of birth in the calving season was not different (P = 0.99) for those calves born from TM cows or control cows. When evaluating the distribution of calves born in the calving season by 21-day increments, the proportion of calves born in the first 21, 22-42 or more than 42 days of the calv-ing season were similar (P = 0.40) between groups.
IntroductionReproductive performance and
overall herd health are vital to a successful and profitable cow herd. Deficiencies of trace minerals can lead to anemia, immune suppres-sion, decreased ovulation, irregular estrous cycles, fetal malformations and abortions because these miner-als are vital to fetal development
and nutrient transfer (Hostetler et al., 2003). Increased reproductive failure and potential for animal death could result in decreased prof-itability for cattle producers.
Mineral supplementation, as well as the mineral composition of forages and individual animal intake, is highly variable. Palatabil-ity, individual requirements, mineral content of available water sources, season of the year and individual animal intake are all factors that must be considered (McDowell, 1996). Injectable trace mineral prod-ucts are available and may be used for a more targeted supplement. However, injectable products are not blanket nutrients or broad spectrum, but contain only a few trace miner-als.
Injectable supplementation advantages include the targeted delivery of known trace mineral elements and the ability to distribute those minerals when previous man-agement delivery was not a viable option due to terrain or environ-ment (rough country, pastures that routinely flood, etc.; Arthington et al., 2014). Administering injectable trace mineral supplements 30 days before breeding resulted in a greater proportion of females becoming pregnant to artificial insemination (AI), compared with females not receiving supplements (Mundell et al., 2012).
The objective of this study was to evaluate the effects of injectable trace mineral supplements adminis-tered 30 days before the start of the breeding season on reproductive performance when natural-service breeding was used.
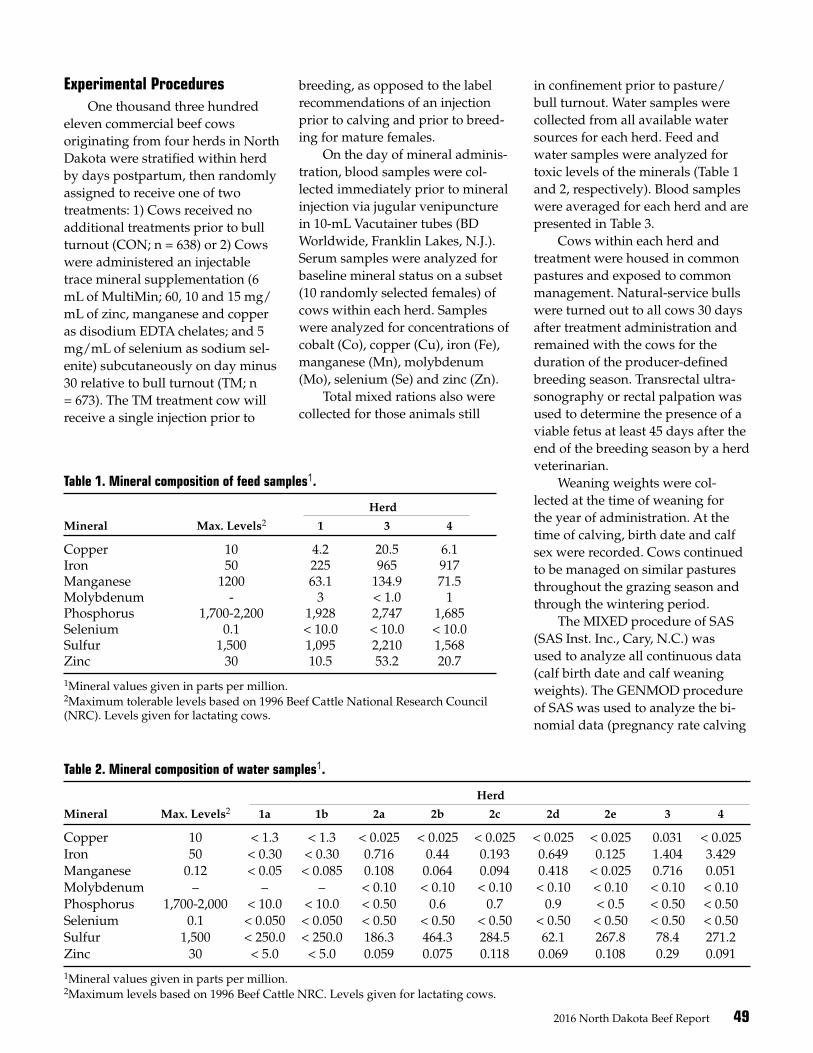
2016 North Dakota Beef Report 49
Experimental ProceduresOne thousand three hundred
eleven commercial beef cows originating from four herds in North Dakota were stratified within herd by days postpartum, then randomly assigned to receive one of two treatments: 1) Cows received no additional treatments prior to bull turnout (CON; n = 638) or 2) Cows were administered an injectable trace mineral supplementation (6 mL of MultiMin; 60, 10 and 15 mg/mL of zinc, manganese and copper as disodium EDTA chelates; and 5 mg/mL of selenium as sodium sel-enite) subcutaneously on day minus 30 relative to bull turnout (TM; n = 673). The TM treatment cow will receive a single injection prior to
breeding, as opposed to the label recommendations of an injection prior to calving and prior to breed-ing for mature females.
On the day of mineral adminis-tration, blood samples were col-lected immediately prior to mineral injection via jugular venipuncture in 10-mL Vacutainer tubes (BD Worldwide, Franklin Lakes, N.J.). Serum samples were analyzed for baseline mineral status on a subset (10 randomly selected females) of cows within each herd. Samples were analyzed for concentrations of cobalt (Co), copper (Cu), iron (Fe), manganese (Mn), molybdenum (Mo), selenium (Se) and zinc (Zn).
Total mixed rations also were collected for those animals still
in confinement prior to pasture/bull turnout. Water samples were collected from all available water sources for each herd. Feed and water samples were analyzed for toxic levels of the minerals (Table 1 and 2, respectively). Blood samples were averaged for each herd and are presented in Table 3.
Cows within each herd and treatment were housed in common pastures and exposed to common management. Natural-service bulls were turned out to all cows 30 days after treatment administration and remained with the cows for the duration of the producer-defined breeding season. Transrectal ultra-sonography or rectal palpation was used to determine the presence of a viable fetus at least 45 days after the end of the breeding season by a herd veterinarian.
Weaning weights were col-lected at the time of weaning for the year of administration. At the time of calving, birth date and calf sex were recorded. Cows continued to be managed on similar pastures throughout the grazing season and through the wintering period.
The MIXED procedure of SAS (SAS Inst. Inc., Cary, N.C.) was used to analyze all continuous data (calf birth date and calf weaning weights). The GENMOD procedure of SAS was used to analyze the bi-nomial data (pregnancy rate calving
Table 2. Mineral composition of water samples1.
Herd
Mineral Max. Levels2 1a 1b 2a 2b 2c 2d 2e 3 4
Copper 10 < 1.3 < 1.3 < 0.025 < 0.025 < 0.025 < 0.025 < 0.025 0.031 < 0.025Iron 50 < 0.30 < 0.30 0.716 0.44 0.193 0.649 0.125 1.404 3.429Manganese 0.12 < 0.05 < 0.085 0.108 0.064 0.094 0.418 < 0.025 0.716 0.051Molybdenum – – – < 0.10 < 0.10 < 0.10 < 0.10 < 0.10 < 0.10 < 0.10Phosphorus 1,700-2,000 < 10.0 < 10.0 < 0.50 0.6 0.7 0.9 < 0.5 < 0.50 < 0.50Selenium 0.1 < 0.050 < 0.050 < 0.50 < 0.50 < 0.50 < 0.50 < 0.50 < 0.50 < 0.50Sulfur 1,500 < 250.0 < 250.0 186.3 464.3 284.5 62.1 267.8 78.4 271.2Zinc 30 < 5.0 < 5.0 0.059 0.075 0.118 0.069 0.108 0.29 0.091
1Mineral values given in parts per million.2Maximum levels based on 1996 Beef Cattle NRC. Levels given for lactating cows.
Table 1. Mineral composition of feed samples1.
Herd
Mineral Max. Levels2 1 3 4
Copper 10 4.2 20.5 6.1Iron 50 225 965 917Manganese 1200 63.1 134.9 71.5Molybdenum - 3 < 1.0 1Phosphorus 1,700-2,200 1,928 2,747 1,685Selenium 0.1 < 10.0 < 10.0 < 10.0Sulfur 1,500 1,095 2,210 1,568Zinc 30 10.5 53.2 20.7
1Mineral values given in parts per million.2Maximum tolerable levels based on 1996 Beef Cattle National Research Council (NRC). Levels given for lactating cows.
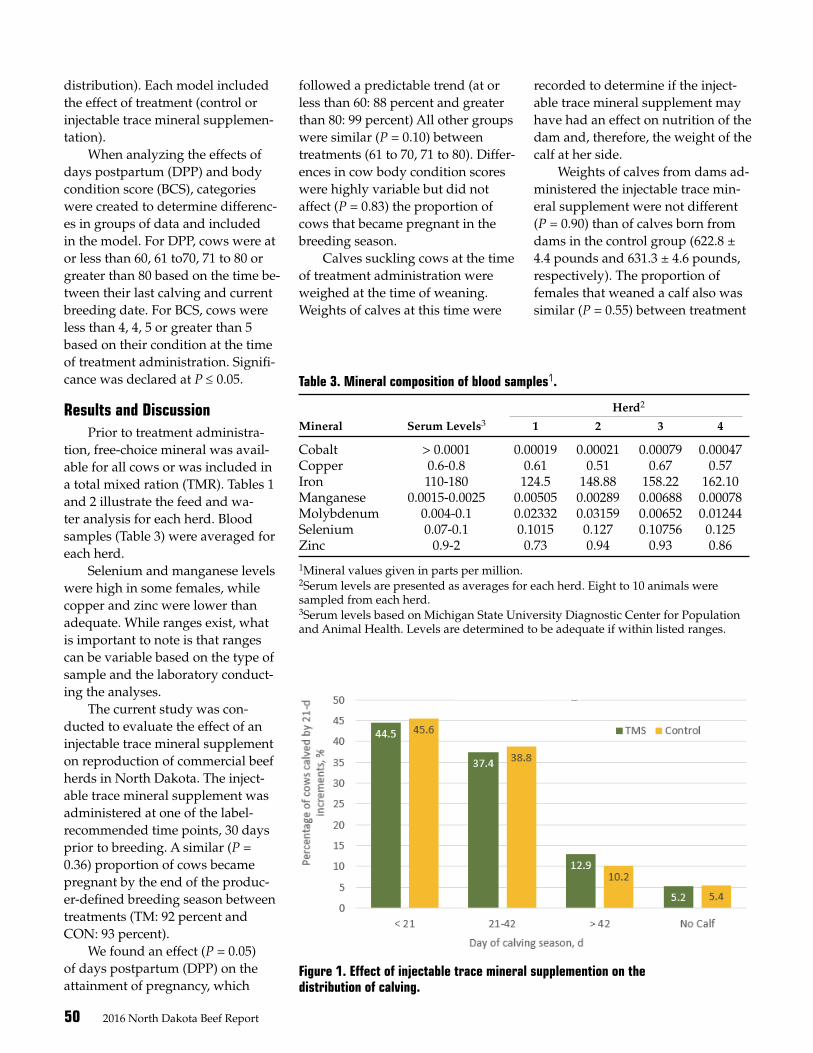
50 2016 North Dakota Beef Report
distribution). Each model included the effect of treatment (control or injectable trace mineral supplemen-tation).
When analyzing the effects of days postpartum (DPP) and body condition score (BCS), categories were created to determine differenc-es in groups of data and included in the model. For DPP, cows were at or less than 60, 61 to70, 71 to 80 or greater than 80 based on the time be-tween their last calving and current breeding date. For BCS, cows were less than 4, 4, 5 or greater than 5 based on their condition at the time of treatment administration. Signifi-cance was declared at P ≤ 0.05.
Results and DiscussionPrior to treatment administra-
tion, free-choice mineral was avail-able for all cows or was included in a total mixed ration (TMR). Tables 1 and 2 illustrate the feed and wa-ter analysis for each herd. Blood samples (Table 3) were averaged for each herd.
Selenium and manganese levels were high in some females, while copper and zinc were lower than adequate. While ranges exist, what is important to note is that ranges can be variable based on the type of sample and the laboratory conduct-ing the analyses.
The current study was con-ducted to evaluate the effect of an injectable trace mineral supplement on reproduction of commercial beef herds in North Dakota. The inject-able trace mineral supplement was administered at one of the label-recommended time points, 30 days prior to breeding. A similar (P = 0.36) proportion of cows became pregnant by the end of the produc-er-defined breeding season between treatments (TM: 92 percent and CON: 93 percent).
We found an effect (P = 0.05) of days postpartum (DPP) on the attainment of pregnancy, which
Figure 1. Effect of injectable trace mineral supplemention on the distribution of calving.
Table 3. Mineral composition of blood samples1.
Herd2
Mineral Serum Levels3 1 2 3 4 Cobalt > 0.0001 0.00019 0.00021 0.00079 0.00047 Copper 0.6-0.8 0.61 0.51 0.67 0.57 Iron 110-180 124.5 148.88 158.22 162.10 Manganese 0.0015-0.0025 0.00505 0.00289 0.00688 0.00078 Molybdenum 0.004-0.1 0.02332 0.03159 0.00652 0.01244 Selenium 0.07-0.1 0.1015 0.127 0.10756 0.125 Zinc 0.9-2 0.73 0.94 0.93 0.86 1Mineral values given in parts per million. 2Serum levels are presented as averages for each herd. Eight to 10 animals were sampled from each herd. 3Serum levels based on Michigan State University Diagnostic Center for Population and Animal Health. Levels are determined to be adequate if within listed ranges.
Table 3. Mineral composition of blood samples1.
Herd2
Mineral Serum Levels3 1 2 3 4
Cobalt > 0.0001 0.00019 0.00021 0.00079 0.00047Copper 0.6-0.8 0.61 0.51 0.67 0.57Iron 110-180 124.5 148.88 158.22 162.10Manganese 0.0015-0.0025 0.00505 0.00289 0.00688 0.00078Molybdenum 0.004-0.1 0.02332 0.03159 0.00652 0.01244Selenium 0.07-0.1 0.1015 0.127 0.10756 0.125Zinc 0.9-2 0.73 0.94 0.93 0.86
1Mineral values given in parts per million.2Serum levels are presented as averages for each herd. Eight to 10 animals were sampled from each herd. 3Serum levels based on Michigan State University Diagnostic Center for Population and Animal Health. Levels are determined to be adequate if within listed ranges.
followed a predictable trend (at or less than 60: 88 percent and greater than 80: 99 percent) All other groups were similar (P = 0.10) between treatments (61 to 70, 71 to 80). Differ-ences in cow body condition scores were highly variable but did not affect (P = 0.83) the proportion of cows that became pregnant in the breeding season.
Calves suckling cows at the time of treatment administration were weighed at the time of weaning. Weights of calves at this time were
recorded to determine if the inject-able trace mineral supplement may have had an effect on nutrition of the dam and, therefore, the weight of the calf at her side.
Weights of calves from dams ad-ministered the injectable trace min-eral supplement were not different (P = 0.90) than of calves born from dams in the control group (622.8 ± 4.4 pounds and 631.3 ± 4.6 pounds, respectively). The proportion of females that weaned a calf also was similar (P = 0.55) between treatment

2016 North Dakota Beef Report 51
groups (CON: 92 percent and TM: 92 percent).
At parturition, birth dates and sex were recorded. Date of birth in the calving season was not different (P = 0.99) for calves born from dams administered the injectable trace mineral supplementation, compared with calves born from control dams (25.7 ± 0.75 pounds and 24.6 ± 0.72 pounds, respectively). In addition, we found no difference (P > 0.40) in the distribution of calving when the calving season was divided into 21-day increments (Figure 1).
The incorporation of an inject-able trace mineral supplement
administered 30 days prior to bull turnout did not affect pregnancy at-tainment, weaning weights of calves or calving distribution. Although reproduction was not affected by treatments in this study, what is important to note is that overall pregnancy rates and calving were very good across herds.
Literature Cited Arthington, J.D., P. Moriel, P.G.M.A.
Martins, G.C. Lamb and L.J. Haven-ga. 2014. Effects of trace mineral in-jections on measures of performance and trace mineral status of pre-and postweaned beef calves. J. Anim. Sci. 92:2630-2640.
Hostetler, C.E., R.L. Kincaid and M.A. Mirando. 2003. The role of essential trace elements in embryonic and fetal development in livestock. Vet. J. 166:125-139.
McDowell, L.R. 1996. Feeding minerals to cattle on pasture. Anim. Feed. Sci. Tech. 60:247-271.
Mundell, L.R., J.R. Jaeger, J.W. Wag-goner, J.S. Stevenson, D.M. Grieger, L.A. Pacheco, J.W. Bolte, N.A. Aubel, G.J. Eckerle, M.J. Macek, S.M. Ensley, L.J. Havenga, and K.C. Olson. 2012. Effects of prepartum and postpartum bolus injections of trace minerals on performance of beef cows and calves grazing native range. Prof. Anim. Sci. 28:82-88.
The effects of nutrient restriction on interferon-tau and pregnancy-specific protein-B mRNA during the establishment of pregnancy in beef heifersKyle J. McLean1, Carl R. Dahlen1, Pawel P. Borowicz1, Larry P. Reynolds1 and Joel S. Caton1
1Department of Animal Sciences, NDSU
The objectives of this project were to elucidate the effects of maternal nutrient restriction on PSP-B and IFN-τ in placental formation, placental function and establishment of pregnancy. PSP-B and IFN-τ were expressed differentially during early gestation and may be important to the establishment of pregnancy.
SummaryWe hypothesize that pregnancy-
specific protein-B (PSP-B) and interferon-τ (INF-τ) will be ex-pressed differentially during early pregnancy (days 16 to 50) and will be influenced by plane of mater-nal nutrition. Commercial Angus crossbred heifers (n = 49; about 16 months of age; body weight [BW] = 713 ± 62 pounds) were maintained on a total mixed ration (TMR) and supplemented with dried distill-
ers grains with solubles. All heifers were subject to 5-day CO-Synch + CIDR estrus synchronization proto-col and artificial insemination (AI) to a single Angus sire (day of breed-ing = day 0). On the day of breeding, heifers were assigned randomly to dietary treatments. One-half were assigned to the control diet (CON) targeted to gain .45 kg/day and the remaining half were assigned to a restricted diet (RES) and received 60 percent of control diets. Heifers
were subjected to ovariohysterec-tomy on days 16, 34 and 50 of gesta-tion. Utero-placental tissues were obtained from the uterine horn ipsi-lateral (P) and contralateral (NP) to the corpora lutea (CL) and separated into maternal caruncle (CAR); ma-ternal endometrium, inter-caruncle (ICAR); and fetal membrane (FM) After being collected, all tissues were snap-frozen in liquid nitrogen-cooled 2-Methylbutane and stored at minus 80 C. Pregnancy-specific protein-B increased (P < 0.01) by 18,000-fold as gestation progressed in P-CAR. Pregnancy-specific protein-B was increased (P < 0.01) on days 34 and 50 (337.3 and 203.2 ± 60.9, respectively), compared with day 16 (10.4 ± 60.9). We found no interac-tions between stage of gestation and nutritional treatment for PSP-B (P = 0.22). In conclusion, maternal nutri-
52 2016 North Dakota Beef Report
ent restriction only influenced INF-τ, but PSP-B and INF-τ were expressed differentially in maternal and fetal tissues at critical time points during the first 50 days of gestation in beef heifers.
IntroductionPlacental development is closely
related to fetal growth and is sensi-tive to maternal nutrient supply from the earliest stages of pregnancy (Reynolds and Redmer, 2001) by facilitating the transfer of nutrient, gas and waste (Ramsey, 1982). In-adequate maternal nutrient supply leads to poor placental develop-ment, resulting in compromised fetal growth (Caton and Hess, 2010).
Twenty-one members of the pregnancy-associated glycoprotein (PAG) family have been discovered to date (Green et al., 2000). The assortment of PAG present may provide a multitude of binding sites and perform a variety of functions at and during the formation of the feto-maternal interface (Green et al., 1998).
The binucleated cells and modern PAGs seem to interact ex-tensively with maternal connective tissue that develops during placen-tal villi formation (Wooding et al., 2005). However, the exact functions of both types of PAG remain to be elucidated.
Researchers have speculated that PAGs may be involved in proteolytic activation of growth fac-tors and other molecules specific to pregnancy, protection of fetal tissues from maternal immune response, transport of hormones between fetal and maternal tissues, and cell-to-cell fusion (Wooding et al., 2005). Therefore, we hypothesize that pregnancy-specific protein-B (PSP-B) and interferon-τ (INF-τ) will be expressed differentially during early pregnancy (days 16 to 50) and will be influenced by plane of maternal nutrition.
Experimental ProceduresAll animal procedures were
conducted with approval from the Institutional Animal Care and Use Committee at North Dakota State University (A16049). Commercial Angus crossbred heifers (n = 49; about 16 months of age; BW = 713 ± 62 pounds) were transported 142 miles from the Central Grasslands Research Extension Center (Streeter, N.D.) to the Animal Nutrition and Physiology Center (North Dakota State University, Fargo, N.D.).
The heifers were housed in pens, with six heifers per pen, and individually fed daily in an elec-tronic head gate facility (American Calan; Northwood, N.H.) at 8 a.m. Heifers were maintained on a total mixed ration (TMR) (48.4 percent dry matter [DM], 5.3 percent crude protein [CP], 29.4 percent neutral detergent fiber [NDF], 6.8 percent ash), supplemented with dried distillers grains with solubles (87.5 percent DM, 31.3 percent CP, 53.4 percent NDF, 8.2 percent ash), and granted ad libitum access to water.
All heifers were subjected to 5-day CO-Synch + CIDR estrus synchronization protocol and arti-ficial insemination (AI) to a single Angus sire (day of breeding = day 0). On the day of breeding, heifers were assigned randomly to dietary treatments. One-half were assigned to control diet (CON) targeted to gain .45 kg/day and the remaining half were assigned to the restricted diet (RES) and received 60 percent of control diets.
Heifers were subjected to ovar-iohysterectomy on days 16, 34 and 50, as previously described, McLean et al., (2016). Thus, experimental de-sign for the pregnancy analysis was a 2 × 3 factorial design. Nonbred, nonpregnant control heifers (NP; n = 6) were ovariohysterectomized on day 16 of the luteal cycle following the synchronization cycle. The NP heifers and heifers that were ovario-
hysterectomized on days 16, 34 and 50 and fed the CON diet were used in a CRD to address comparisons of pregnancy status and establishment.
Pregnancy was confirmed via trans-rectal ultrasonography day 28 and again on the day of surgery (day beyond 28). During surgery, the left and right uterine arteries, left and right spiral arteries and the cer-vix were ligated and then the uterus was removed.
Uterine contents were held in place with a 24-centimeter (cm) Cra-foord Coarctation Clamp (Integra-Miltex; Plainsboro, N.J.) placed just cranial to the cervical ligatures dur-ing and after removal from the body cavity. Following surgery, heifers were kept in individual pens during recovery and stitches were removed 14 days after surgery (McLean et al., 2016), then the animals were returned to the control diets.
Immediately upon removal from the body cavity, tissues were trimmed of excess broad ligament, fat and nonreproductive tissues. Gravid uterus, individual and total ovarian, and CL weights were taken, as well as CL measurements for CL area before fixation, freezing and storage. Utero-placental tissues were obtained from the uterine horn ipsilateral (containing the embryo) to the CL (pregnant uterine horn), maternal caruncle (P-CAR) and ma-ternal endometrium, inter-caruncle, (P-ICAR).
Tissues were obtained in the uterine horn contralateral (opposite the embryo) to the CL (non-preg-nant horn), maternal caruncle (NP-CAR) and maternal endometrium, inter-caruncle, (NP-ICAR). Fetal membranes (FM) were collected on days 16, 34 and 50. After being col-lected, all tissues were snap-frozen in liquid nitrogen-cooled isopentane (Sigma-Aldrich; St. Louis, Mo.) and stored at minus 80 C.
Gene expression was analyzed for threshold cycle using a 7500 Fast
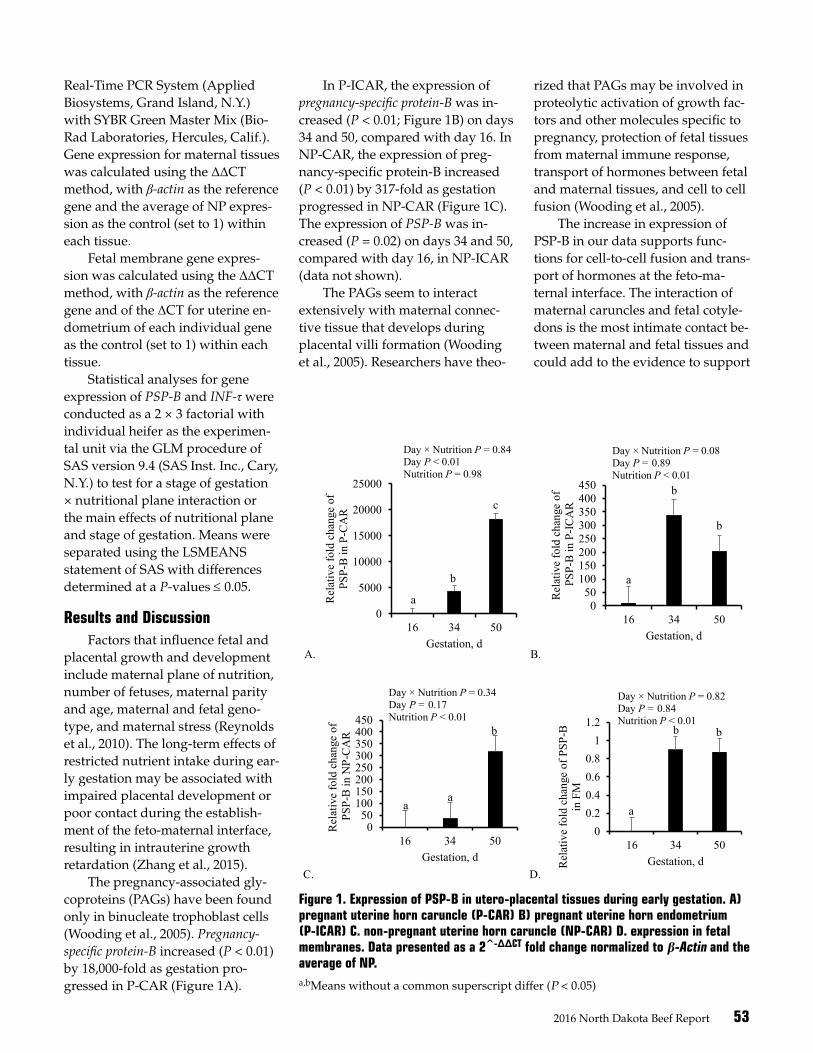
2016 North Dakota Beef Report 53
Real-Time PCR System (Applied Biosystems, Grand Island, N.Y.) with SYBR Green Master Mix (Bio-Rad Laboratories, Hercules, Calif.). Gene expression for maternal tissues was calculated using the ΔΔCT method, with β-actin as the reference gene and the average of NP expres-sion as the control (set to 1) within each tissue.
Fetal membrane gene expres-sion was calculated using the ΔΔCT method, with β-actin as the reference gene and of the ΔCT for uterine en-dometrium of each individual gene as the control (set to 1) within each tissue.
Statistical analyses for gene expression of PSP-B and INF-τ were conducted as a 2 × 3 factorial with individual heifer as the experimen-tal unit via the GLM procedure of SAS version 9.4 (SAS Inst. Inc., Cary, N.Y.) to test for a stage of gestation × nutritional plane interaction or the main effects of nutritional plane and stage of gestation. Means were separated using the LSMEANS statement of SAS with differences determined at a P-values ≤ 0.05.
Results and DiscussionFactors that influence fetal and
placental growth and development include maternal plane of nutrition, number of fetuses, maternal parity and age, maternal and fetal geno-type, and maternal stress (Reynolds et al., 2010). The long-term effects of restricted nutrient intake during ear-ly gestation may be associated with impaired placental development or poor contact during the establish-ment of the feto-maternal interface, resulting in intrauterine growth retardation (Zhang et al., 2015).
The pregnancy-associated gly-coproteins (PAGs) have been found only in binucleate trophoblast cells (Wooding et al., 2005). Pregnancy-specific protein-B increased (P < 0.01) by 18,000-fold as gestation pro-gressed in P-CAR (Figure 1A).
In P-ICAR, the expression of pregnancy-specific protein-B was in-creased (P < 0.01; Figure 1B) on days 34 and 50, compared with day 16. In NP-CAR, the expression of preg-nancy-specific protein-B increased (P < 0.01) by 317-fold as gestation progressed in NP-CAR (Figure 1C). The expression of PSP-B was in-creased (P = 0.02) on days 34 and 50, compared with day 16, in NP-ICAR (data not shown).
The PAGs seem to interact extensively with maternal connec-tive tissue that develops during placental villi formation (Wooding et al., 2005). Researchers have theo-
rized that PAGs may be involved in proteolytic activation of growth fac-tors and other molecules specific to pregnancy, protection of fetal tissues from maternal immune response, transport of hormones between fetal and maternal tissues, and cell to cell fusion (Wooding et al., 2005).
The increase in expression of PSP-B in our data supports func-tions for cell-to-cell fusion and trans-port of hormones at the feto-ma-ternal interface. The interaction of maternal caruncles and fetal cotyle-dons is the most intimate contact be-tween maternal and fetal tissues and could add to the evidence to support
Figure 1. Expression of PSP-B in utero-placental tissues during early gestation. A) pregnant uterine horn caruncle (P-CAR) B) pregnant uterine horn endometrium (P-ICAR) C. non-pregnant uterine horn caruncle (NP-CAR) D. expression in fetal membranes. Data presented as a 2̂ -ΔΔCT fold change normalized to β-Actin and the average of NP. a,bMeans without a common superscript differ (P < 0.05)
1 2
A. B.3
C. D. 4 Figure 1. Expression of PSP-B in utero-placental tissues during early gestation. A) pregnant 5 uterine horn caruncle (P-CAR) B) pregnant uterine horn endometrium (P-ICAR) C. non-6 pregnant uterine horn caruncle (NP-CAR) D. expression in fetal membranes. Data presented as 7 a 2^-ΔΔCT fold change normalized to β-Actin and the average of NP. a,b Means without a common 8 superscript differ (P < 0.05) 9 10
0
5000
10000
15000
20000
25000
16 34 50
Rel
ativ
e fo
ld c
hang
e of
PS
P-B
in P
-CA
R
Gestation, d
Day × Nutrition P = 0.84Day P < 0.01Nutrition P = 0.98
a
b
c
050
100150200250300350400450
16 34 50
Rel
ativ
e fo
ld c
hang
e of
PS
P-B
in P
-ICA
R
Gestation, d
Day × Nutrition P = 0.08Day P = 0.89Nutrition P < 0.01
a
b
b
050
100150200250300350400450
16 34 50
Rel
ativ
e fo
ld c
hang
e of
PS
P-B
in N
P-C
AR
Gestation, d
Day × Nutrition P = 0.34Day P = 0.17Nutrition P < 0.01
aa
b
00.20.40.60.8
11.2
16 34 50
Rel
ativ
e fo
ld c
hang
e of
PSP
-Bin
FM
Gestation, d
Day × Nutrition P = 0.82Day P = 0.84Nutrition P < 0.01
a
b b
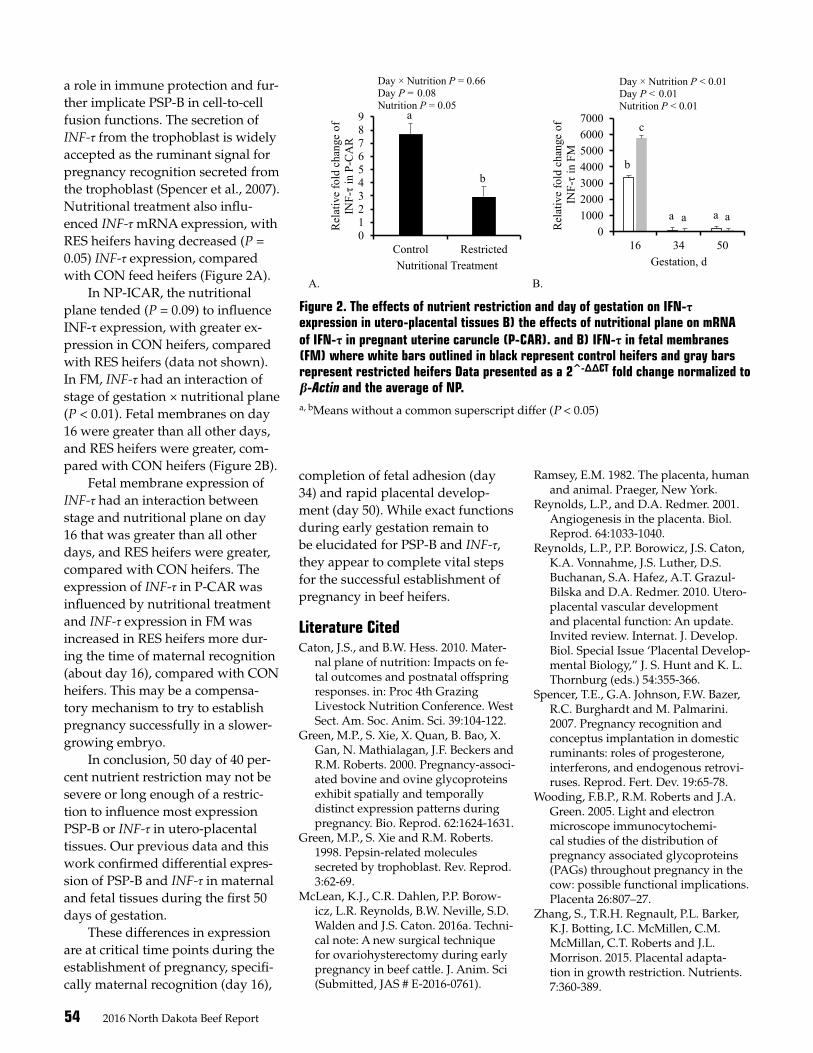
54 2016 North Dakota Beef Report
a role in immune protection and fur-ther implicate PSP-B in cell-to-cell fusion functions. The secretion of INF-τ from the trophoblast is widely accepted as the ruminant signal for pregnancy recognition secreted from the trophoblast (Spencer et al., 2007). Nutritional treatment also influ-enced INF-τ mRNA expression, with RES heifers having decreased (P = 0.05) INF-τ expression, compared with CON feed heifers (Figure 2A).
In NP-ICAR, the nutritional plane tended (P = 0.09) to influence INF-τ expression, with greater ex-pression in CON heifers, compared with RES heifers (data not shown). In FM, INF-τ had an interaction of stage of gestation × nutritional plane (P < 0.01). Fetal membranes on day 16 were greater than all other days, and RES heifers were greater, com-pared with CON heifers (Figure 2B).
Fetal membrane expression of INF-τ had an interaction between stage and nutritional plane on day 16 that was greater than all other days, and RES heifers were greater, compared with CON heifers. The expression of INF-τ in P-CAR was influenced by nutritional treatment and INF-τ expression in FM was increased in RES heifers more dur-ing the time of maternal recognition (about day 16), compared with CON heifers. This may be a compensa-tory mechanism to try to establish pregnancy successfully in a slower-growing embryo.
In conclusion, 50 day of 40 per-cent nutrient restriction may not be severe or long enough of a restric-tion to influence most expression PSP-B or INF-τ in utero-placental tissues. Our previous data and this work confirmed differential expres-sion of PSP-B and INF-τ in maternal and fetal tissues during the first 50 days of gestation.
These differences in expression are at critical time points during the establishment of pregnancy, specifi-cally maternal recognition (day 16),
completion of fetal adhesion (day 34) and rapid placental develop-ment (day 50). While exact functions during early gestation remain to be elucidated for PSP-B and INF-τ, they appear to complete vital steps for the successful establishment of pregnancy in beef heifers.
Literature CitedCaton, J.S., and B.W. Hess. 2010. Mater-
nal plane of nutrition: Impacts on fe-tal outcomes and postnatal offspring responses. in: Proc 4th Grazing Livestock Nutrition Conference. West Sect. Am. Soc. Anim. Sci. 39:104-122.
Green, M.P., S. Xie, X. Quan, B. Bao, X. Gan, N. Mathialagan, J.F. Beckers and R.M. Roberts. 2000. Pregnancy-associ-ated bovine and ovine glycoproteins exhibit spatially and temporally distinct expression patterns during pregnancy. Bio. Reprod. 62:1624-1631.
Green, M.P., S. Xie and R.M. Roberts. 1998. Pepsin-related molecules secreted by trophoblast. Rev. Reprod. 3:62-69.
McLean, K.J., C.R. Dahlen, P.P. Borow-icz, L.R. Reynolds, B.W. Neville, S.D. Walden and J.S. Caton. 2016a. Techni-cal note: A new surgical technique for ovariohysterectomy during early pregnancy in beef cattle. J. Anim. Sci (Submitted, JAS # E-2016-0761).
Figure 2. The effects of nutrient restriction and day of gestation on IFN-τ expression in utero-placental tissues B) the effects of nutritional plane on mRNA of IFN-τ in pregnant uterine caruncle (P-CAR). and B) IFN-τ in fetal membranes (FM) where white bars outlined in black represent control heifers and gray bars represent restricted heifers Data presented as a 2̂ -ΔΔCT fold change normalized to β-Actin and the average of NP. a, bMeans without a common superscript differ (P < 0.05)
A. B. 11 Figure 2. The effects of nutrient restriction and day of gestation on IFN-τ expression in utero-12 placental tissues B) the effects of nutritional plane on mRNA of IFN-τ in pregnant uterine 13 caruncle (P-CAR). and B) IFN-τ in fetal membranes (FM) where white bars outlined in black 14 represent control heifers and gray bars represent restricted heifers Data presented as a 2^-ΔΔCT 15 fold change normalized to β-Actin and the average of NP. a, b Means without a common 16 superscript differ (P < 0.05) 17 18
0123456789
Control Restricted
Rel
ativ
e fo
ld c
hang
e of
IN
F-τ
in P
-CA
R
Nutritional Treatment
Day × Nutrition P = 0.66Day P = 0.08Nutrition P = 0.05
a
b
01000200030004000500060007000
16 34 50
Rel
ativ
e fo
ld c
hang
e of
IN
F-τ
in F
M
Gestation, d
Day × Nutrition P < 0.01Day P < 0.01Nutrition P < 0.01
a a a a
b
c
Ramsey, E.M. 1982. The placenta, human and animal. Praeger, New York.
Reynolds, L.P., and D.A. Redmer. 2001. Angiogenesis in the placenta. Biol. Reprod. 64:1033-1040.
Reynolds, L.P., P.P. Borowicz, J.S. Caton, K.A. Vonnahme, J.S. Luther, D.S. Buchanan, S.A. Hafez, A.T. Grazul-Bilska and D.A. Redmer. 2010. Utero-placental vascular development and placental function: An update. Invited review. Internat. J. Develop. Biol. Special Issue ‘Placental Develop-mental Biology,” J. S. Hunt and K. L. Thornburg (eds.) 54:355-366.
Spencer, T.E., G.A. Johnson, F.W. Bazer, R.C. Burghardt and M. Palmarini. 2007. Pregnancy recognition and conceptus implantation in domestic ruminants: roles of progesterone, interferons, and endogenous retrovi-ruses. Reprod. Fert. Dev. 19:65-78.
Wooding, F.B.P., R.M. Roberts and J.A. Green. 2005. Light and electron microscope immunocytochemi-cal studies of the distribution of pregnancy associated glycoproteins (PAGs) throughout pregnancy in the cow: possible functional implications. Placenta 26:807–27.
Zhang, S., T.R.H. Regnault, P.L. Barker, K.J. Botting, I.C. McMillen, C.M. McMillan, C.T. Roberts and J.L. Morrison. 2015. Placental adapta-tion in growth restriction. Nutrients. 7:360-389.
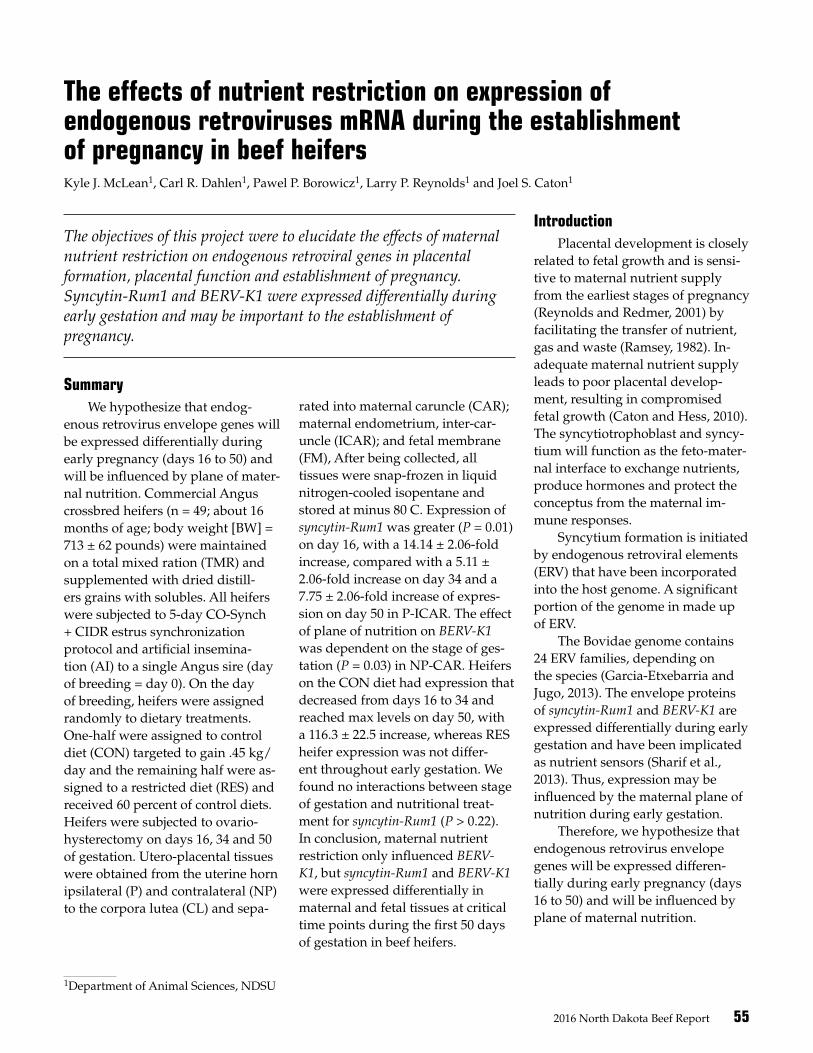
2016 North Dakota Beef Report 55
The effects of nutrient restriction on expression of endogenous retroviruses mRNA during the establishment of pregnancy in beef heifersKyle J. McLean1, Carl R. Dahlen1, Pawel P. Borowicz1, Larry P. Reynolds1 and Joel S. Caton1
1Department of Animal Sciences, NDSU
The objectives of this project were to elucidate the effects of maternal nutrient restriction on endogenous retroviral genes in placental formation, placental function and establishment of pregnancy. Syncytin-Rum1 and BERV-K1 were expressed differentially during early gestation and may be important to the establishment of pregnancy.
SummaryWe hypothesize that endog-
enous retrovirus envelope genes will be expressed differentially during early pregnancy (days 16 to 50) and will be influenced by plane of mater-nal nutrition. Commercial Angus crossbred heifers (n = 49; about 16 months of age; body weight [BW] = 713 ± 62 pounds) were maintained on a total mixed ration (TMR) and supplemented with dried distill-ers grains with solubles. All heifers were subjected to 5-day CO-Synch + CIDR estrus synchronization protocol and artificial insemina-tion (AI) to a single Angus sire (day of breeding = day 0). On the day of breeding, heifers were assigned randomly to dietary treatments. One-half were assigned to control diet (CON) targeted to gain .45 kg/day and the remaining half were as-signed to a restricted diet (RES) and received 60 percent of control diets. Heifers were subjected to ovario-hysterectomy on days 16, 34 and 50 of gestation. Utero-placental tissues were obtained from the uterine horn ipsilateral (P) and contralateral (NP) to the corpora lutea (CL) and sepa-
rated into maternal caruncle (CAR); maternal endometrium, inter-car-uncle (ICAR); and fetal membrane (FM), After being collected, all tissues were snap-frozen in liquid nitrogen-cooled isopentane and stored at minus 80 C. Expression of syncytin-Rum1 was greater (P = 0.01) on day 16, with a 14.14 ± 2.06-fold increase, compared with a 5.11 ± 2.06-fold increase on day 34 and a 7.75 ± 2.06-fold increase of expres-sion on day 50 in P-ICAR. The effect of plane of nutrition on BERV-K1 was dependent on the stage of ges-tation (P = 0.03) in NP-CAR. Heifers on the CON diet had expression that decreased from days 16 to 34 and reached max levels on day 50, with a 116.3 ± 22.5 increase, whereas RES heifer expression was not differ-ent throughout early gestation. We found no interactions between stage of gestation and nutritional treat-ment for syncytin-Rum1 (P > 0.22). In conclusion, maternal nutrient restriction only influenced BERV-K1, but syncytin-Rum1 and BERV-K1 were expressed differentially in maternal and fetal tissues at critical time points during the first 50 days of gestation in beef heifers.
IntroductionPlacental development is closely
related to fetal growth and is sensi-tive to maternal nutrient supply from the earliest stages of pregnancy (Reynolds and Redmer, 2001) by facilitating the transfer of nutrient, gas and waste (Ramsey, 1982). In-adequate maternal nutrient supply leads to poor placental develop-ment, resulting in compromised fetal growth (Caton and Hess, 2010). The syncytiotrophoblast and syncy-tium will function as the feto-mater-nal interface to exchange nutrients, produce hormones and protect the conceptus from the maternal im-mune responses.
Syncytium formation is initiated by endogenous retroviral elements (ERV) that have been incorporated into the host genome. A significant portion of the genome in made up of ERV.
The Bovidae genome contains 24 ERV families, depending on the species (Garcia-Etxebarria and Jugo, 2013). The envelope proteins of syncytin-Rum1 and BERV-K1 are expressed differentially during early gestation and have been implicated as nutrient sensors (Sharif et al., 2013). Thus, expression may be influenced by the maternal plane of nutrition during early gestation.
Therefore, we hypothesize that endogenous retrovirus envelope genes will be expressed differen-tially during early pregnancy (days 16 to 50) and will be influenced by plane of maternal nutrition.

56 2016 North Dakota Beef Report
Experimental ProceduresAll animal procedures were
conducted with approval from the Institutional Animal Care and Use Committee at North Dakota State University (A16049). Commercial Angus crossbred heifers (n = 49; about 16 months of age; BW = 713 ± 62 pounds) were transported 142 miles from the Central Grasslands Research Extension Center (Streeter, N.D.) to the Animal Nutrition and Physiology Center (North Dakota State University, Fargo, N.D.).
The heifers were housed in pens, with six heifers per pen, and individually fed daily in an elec-tronic head gate facility (American Calan; Northwood, N.H.) at 8 a.m. Heifers were maintained on a TMR (48.4 percent dry matter [DM], 5.3 percent crude protein [CP], 29.4 per-cent neutral detergent fiber [NDF], 6.8 percent ash), supplemented with dried distillers grains with solubles (87.5 percent DM, 31.3 percent CP, 53.4 percent NDF, 8.2 percent ash), and granted ad libitum access to water.
All heifers were subjected to 5-day CO-Synch + CIDR estrus synchronization protocol and AI to a single Angus sire (day of breed-ing = day 0; Bridges et al., 2008). On the day of breeding, heifers were assigned randomly to dietary treat-ments.
One half were assigned to a con-trol diet (CON) targeted to gain .45 kg/day and the remaining half were assigned to a restricted diet (RES) and received 60 percent of control diets.
Heifers were subjected to ovar-iohysterectomy on days 16, 34 and 50, as previously described, McLean et al., (2016a). Thus, experimental design for the pregnancy analysis was a 2 × 3 factorial design. Non-bred, nonpregnant control heifers (NP; n = 6) were ovariohysterecto-mized on day 16 of the luteal cycle
following the synchronization cycle. The NP heifers and heifers that were ovariohysterectomized on days 16, 34 and 50 and fed the CON diet were used in a CRD to address com-parisons of pregnancy status and establishment.
Pregnancy was confirmed via trans-rectal ultrasonography on day 28 and again on the day of surgery (day beyond 28). During surgery, the left and right uterine arteries, left and right spiral arteries and the cer-vix were ligated and then the uterus was removed.
Uterine contents were held in place with a 24-centimeter (cm) Cra-foord Coarctation Clamp (Integra-Miltex; Plainsboro, N.J.) placed just cranial to the cervical ligatures dur-ing and after removal from the body cavity. Following surgery, heifers were kept in individual pens during recovery and stitches were removed 14 days after surgery (McLean et al., 2016a), then the animals were returned to the control diets.
Immediately upon removal from the body cavity, tissues were trimmed of excess broad ligament, fat and nonreproductive tissues. Gravid uterus, individual and total ovarian, and CL weights were taken, as well as CL measurements for CL area before fixation, freezing and storage.
Utero-placental tissues were obtained from the uterine horn ipsilateral (containing the embryo) to the CL (pregnant uterine horn), maternal caruncle (P-CAR) and ma-ternal endometrium, inter-caruncle, (P-ICAR).
Tissues were obtained in the uterine horn contralateral (opposite the embryo) to the CL (nonpregnant horn), maternal caruncle (NP-CAR) and maternal endometrium, inter-caruncle, (NP-ICAR). Fetal mem-branes (FM) were collected on days 16, 34 and 50. After being collected, all tissues were snap-frozen in liquid nitrogen-cooled isopentane and
stored at minus 80 C. Gene expression was analyzed
for threshold cycle using a 7500 Fast Real-Time PCR System (Applied Biosystems, Grand Island, N.Y.) with SYBR Green Master Mix (Bio-Rad Laboratories, Hercules, Calif.). Gene expression for maternal tissues was calculated using the ΔΔCT method, with β-actin as the reference gene and the average of NP expres-sion as the control (set to 1) within each tissue.
Fetal membrane gene expres-sion was calculated using the ΔΔCT method, with β-actin as the reference gene and of the ΔCT for uterine en-dometrium of each individual gene as the control (set to 1) within each tissue.
Statistical analyses for gene expression of syncytin-Rum1 and BERV-K1 were conducted as a 2 × 3 factorial with individual heifer as the experimental unit via the GLM procedure of SAS version 9.4 (SAS Inst. Inc., Cary, N.Y.) to test for a stage of gestation × nutritional plane interaction or the main effects of nutritional plane and stage of gesta-tion. Means were separated using the LSMEANS statement of SAS with differences determined at a P-values ≤ 0.05.
Results and DiscussionFactors that influence fetal and
placental growth and development include maternal plane of nutrition, number of fetuses, maternal parity and age, maternal and fetal geno-type, and maternal stress (Reynolds et al., 2010). The long-term effects of restricted nutrient intake during ear-ly gestation may be associated with impaired placental development or poor contact during the establish-ment of the feto-maternal interface, resulting in intrauterine growth retardation (Zhang et al., 2015).
In P-CAR, we found no interac-tions between the stage of gestation and nutritional treatment for syncy-
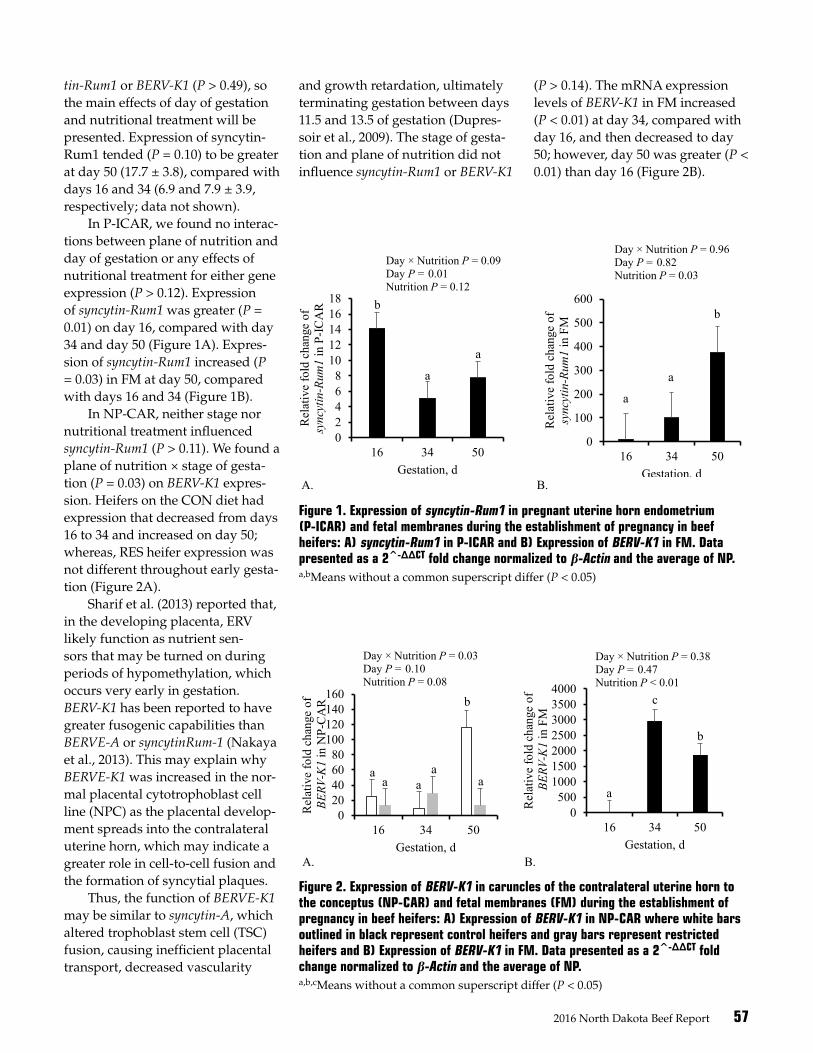
2016 North Dakota Beef Report 57
tin-Rum1 or BERV-K1 (P > 0.49), so the main effects of day of gestation and nutritional treatment will be presented. Expression of syncytin-Rum1 tended (P = 0.10) to be greater at day 50 (17.7 ± 3.8), compared with days 16 and 34 (6.9 and 7.9 ± 3.9, respectively; data not shown).
In P-ICAR, we found no interac-tions between plane of nutrition and day of gestation or any effects of nutritional treatment for either gene expression (P > 0.12). Expression of syncytin-Rum1 was greater (P = 0.01) on day 16, compared with day 34 and day 50 (Figure 1A). Expres-sion of syncytin-Rum1 increased (P = 0.03) in FM at day 50, compared with days 16 and 34 (Figure 1B).
In NP-CAR, neither stage nor nutritional treatment influenced syncytin-Rum1 (P > 0.11). We found a plane of nutrition × stage of gesta-tion (P = 0.03) on BERV-K1 expres-sion. Heifers on the CON diet had expression that decreased from days 16 to 34 and increased on day 50; whereas, RES heifer expression was not different throughout early gesta-tion (Figure 2A).
Sharif et al. (2013) reported that, in the developing placenta, ERV likely function as nutrient sen-sors that may be turned on during periods of hypomethylation, which occurs very early in gestation. BERV-K1 has been reported to have greater fusogenic capabilities than BERVE-A or syncytinRum-1 (Nakaya et al., 2013). This may explain why BERVE-K1 was increased in the nor-mal placental cytotrophoblast cell line (NPC) as the placental develop-ment spreads into the contralateral uterine horn, which may indicate a greater role in cell-to-cell fusion and the formation of syncytial plaques.
Thus, the function of BERVE-K1 may be similar to syncytin-A, which altered trophoblast stem cell (TSC) fusion, causing inefficient placental transport, decreased vascularity
Figure 1. Expression of syncytin-Rum1 in pregnant uterine horn endometrium (P-ICAR) and fetal membranes during the establishment of pregnancy in beef heifers: A) syncytin-Rum1 in P-ICAR and B) Expression of BERV-K1 in FM. Data presented as a 2 -̂ΔΔCT fold change normalized to β-Actin and the average of NP. a,bMeans without a common superscript differ (P < 0.05)
A. B. Figure 1. Expression of syncytin-Rum1 in pregnant uterine horn endometrium (P-ICAR) and fetal membranes during the establishment of pregnancy in beef heifers: A) syncytin-Rum1 in P-ICAR and B) Expression of BERV-K1 in FM. Data presented as a 2^-ΔΔCT fold change normalized to β-Actin and the average of NP. a,b Means without a common superscript differ (P < 0.05)
02468
1012141618
16 34 50
Rel
ativ
e fo
ld c
hang
e of
sy
ncyt
in-R
um1
in P
-ICA
R
Gestation, d
Day × Nutrition P = 0.09Day P = 0.01Nutrition P = 0.12
a
b
a
0
100
200
300
400
500
600
16 34 50
Rel
ativ
e fo
ld c
hang
e of
sy
ncyt
in-R
um1
in F
M
Gestation, d
Day × Nutrition P = 0.96Day P = 0.82Nutrition P = 0.03
a
a
b
Figure 2. Expression of BERV-K1 in caruncles of the contralateral uterine horn to the conceptus (NP-CAR) and fetal membranes (FM) during the establishment of pregnancy in beef heifers: A) Expression of BERV-K1 in NP-CAR where white bars outlined in black represent control heifers and gray bars represent restricted heifers and B) Expression of BERV-K1 in FM. Data presented as a 2 -̂ΔΔCT fold change normalized to β-Actin and the average of NP. a,b,cMeans without a common superscript differ (P < 0.05)
A. B.
Figure 2. Expression of BERV-K1 in caruncles of the contralateral uterine horn to the conceptus (NP-CAR) and fetal membranes (FM) during the establishment of pregnancy in beef heifers: A) Expression of BERV-K1 in NP-CAR where white bars outlined in black represent control heifers and gray bars represent restricted heifers and B) Expression of BERV-K1 in FM. Data presented as a 2^-ΔΔCT fold change normalized to β-Actin and the average of NP. a,b,c Means without a common superscript differ (P < 0.05)
020406080
100120140160
16 34 50
Rel
ativ
e fo
ld c
hang
e of
BE
RV-K
1 in
NP-
CA
R
Gestation, d
Day × Nutrition P = 0.03Day P = 0.10Nutrition P = 0.08
aa a
aa
b
0500
1000150020002500300035004000
16 34 50
Rel
ativ
e fo
ld c
hang
e of
BE
RV-K
1 in
FM
Gestation, d
Day × Nutrition P = 0.38Day P = 0.47Nutrition P < 0.01
a
c
b
and growth retardation, ultimately terminating gestation between days 11.5 and 13.5 of gestation (Dupres-soir et al., 2009). The stage of gesta-tion and plane of nutrition did not influence syncytin-Rum1 or BERV-K1
(P > 0.14). The mRNA expression levels of BERV-K1 in FM increased (P < 0.01) at day 34, compared with day 16, and then decreased to day 50; however, day 50 was greater (P < 0.01) than day 16 (Figure 2B).
58 2016 North Dakota Beef Report
As in rodents and humans, our data has determined that cattle have at least two ERV, syncytin-Rum1 and BERV-K1, that are expressed differ-entially in reproductive tissues dur-ing the establishment of pregnancy. However, in contrast to previous findings (Cornelis et al., 2013), these data indicated that maternal tissues do express mRNA for ERV and at times have increased mRNA ex-pression. This is in agreement with previous data from our laboratory (McLean et al., 2016b).
While differing expression levels are intriguing, the limited knowl-edge of function and pathways in which ERV are influencing the formation of the placenta and fetus and the establishment of pregnancy hinder the elucidation of the impor-tance of ERV during early gestation.
In conclusion, 50 days of 40 per-cent nutrient restriction may not be severe or long enough of a restric-tion to influence ERV expression in utero-placental tissues. Our previ-ous data and this work confirmed differential expression of syncytin-Rum1 and BERV-K1 in maternal and fetal tissues during the first 50 days of gestation. These differences in expression are at critical time points during the establishment of preg-nancy, specifically, maternal recog-nition (day 16), completion of fetal adhesion (day 34) and rapid placen-tal development (day 50).While ex-act functions during early gestation remain to be elucidated, ERV may complete vital steps for the success-ful establishment of pregnancy in beef heifers.
Literature CitedCaton, J.S., and B.W. Hess. 2010. Mater-
nal plane of nutrition: Impacts on fe-tal outcomes and postnatal offspring responses. in: Proc 4th Grazing Livestock Nutrition Conference. West Sect. Am. Soc. Anim. Sci. 39:104-122.
Cornelis, G., O. Heidmann, S.A. De-grelle, C. Vernochet, C. Lavialle, C. Letzelter, S. Bernard-Stoecklin, A. Hassanin, B. Mulot, M. Guillomot, I. Hue, T. Heidmann and A. Dupressoir. 2013. Captured retroviral envelope syncytin gene associated with the unique placental structure of higher ruminants. Proc. Natl. Acad. Sci. USA 110:E828-E837.
Dupressoir, A., C. Vernochet, O. Bawa, F. Harper, G. Pierron, P. Opolon and T. Heidmann. 2009. Syncytin-A knock-out mice demonstrate the critical role in placentation of a fusogenic, endogenous retrovirus-derived, enve-lope gene. Proc. Natl. Acad. Sci. USA 106:12127-12132.
Garcia-Etxebarria, K., and B.M. Jugo. 2013. Evolutionary history of bovine endogenous retroviruses in the Bo-vidae family. BMC Evol. Bio. 13:256-267.
McLean, K.J., C.R. Dahlen, P.P. Borow-icz, L.R. Reynolds, B.W. Neville, S.D. Walden and J.S. Caton. 2016a. Techni-cal note: A new surgical technique for ovariohysterectomy during early pregnancy in beef cattle. J. Anim. Sci (Submitted, JAS # E-2016-0761).
McLean, K.J., M.R. Crouse, M.S. Crosswhite, N. Negrin Pereira, C.R. Dahlen, P.P. Borowicz, L.R. Reynolds, A.K. Ward, B.W. Neville and J.S. Caton. 2016b. Rapid Communica-tion: Expression of an endogenous retroviral element, syncytin-Rum1, during early gestation in beef heif-ers. J. Anim. Sci. (Submitted, JAS # E-2016-0793).
Nakaya, Y., K. Koshi, S. Nakagawa, K. Hashizume and T. Miyazawa. 2013. Fematrin-1 is involved in fetoma-ternal cell-to-cell fusion in Bovinae placenta and has contributed to diversity of ruminant placentation. J. Virol. 87:10563–10572.
Ramsey, E.M. 1982. The placenta, human and animal. Praeger, New York.
Reynolds, L. P. and D. A. Redmer. 2001. Angiogenesis in the placenta. Biol. Reprod. 64:1033-1040.
Reynolds, L- P., P.-P. Borowicz, J.S. Ca-ton, K.A. Vonnahme, J.S. Luther, D.S. Buchanan, S.A. Hafez, A.T. Grazul-Bilska and D.A. Redmer. 2010. Utero-placental vascular development and placental function: An update. Invited review. Internat. J. Develop. Biol. Special Issue “Placental Devel-opmental Biology,” J.S. Hunt and K.L. Thornburg (eds.) 54:355-366.
Sharif, J., Y Shinkai and H. Koseki. 2013. Is there a role for endogenous retrovi-ruses to mediate long-term adaptive phenotypic response upon environ-mental inputs? Phil. Trans. R. Soc. B. 368:20110340-20110353.
Zhang, S., T.R.H. Regnault, P.L. Barker, K.J. Botting, I.C. McMillen, C.M. McMillan, C.T. Roberts and J.L. Morrison. 2015. Placental adapta-tion in growth restriction. Nutrients. 7:360-389.
2016 North Dakota Beef Report 59
A meta-analysis of the relationship of maternal weight and fetal sex on uterine blood flow and maternal heart rate in beef cows from mid to late gestationAmelia R. Tanner1, Marc L. Bauer1, Victoria C. Kennedy1, Bethany R. Mordhorst2, Leticia E. Camacho3, Kendall C. Swanson1 and Kimberly A. Vonnahme1
1Department of Animal Sciences, NDSU 2University of Missouri, Columbia 3University of Arizona, Tucson
Uterine blood flow plays a critical role in the development of the conceptus, allowing for the maternal-fetal exchange of nutrients, hormones, and wastes. This analysis found that cows carrying bull calves have higher uterine blood flow than those carrying heifer calves which could be contributing to heavier birth weights. Additionally, heavier cows tended to have greater uterine blood flow throughout mid-to late-pregnancy, accompanied by higher heart rates.
SummaryOur objective was to examine
the relationships among maternal body weight (BW), fetal sex, uterine blood flow and maternal heart rate in beef cows during mid to late ges-tation. Four studies were used in the analyses, with blood flow measure-ments taken via Doppler ultraso-nography on four days of gestation from 108 beef cows, which resulted in 333 total observations. Fetal sex, maternal BW class (100-pound increments) and BW class by fetal sex interactions were analyzed with generalized least squares (mixed procedure of SAS) with repeated measures. Day of gestation was in-cluded as a covariate, and treatment was nested within study. Linear, quadratic and cubic orthogonal contrasts were tested. Cows carrying bull calves (n = 82) had greater (P = 0.03) uterine blood flow from days 100 to 250 of gestation, compared with cows carrying heifer calves (n = 26; 4.9 vs. 4.1 ± 0.3 gallons/minute [gal/min]). As maternal BW
increased, uterine blood flow tended (P = 0.09) to increase linearly. Mater-nal heart rate also increased linearly (P = 0.02) as maternal BW increased. Fetal sex did not impact maternal heart rate (P = 0.13). In conclusion, the increase in uterine blood flow for male progeny may be contribut-ing to heavier birth weights when compared with their female coun-terparts. Also, increasing maternal weight may be associated with increased uterine blood flow and heart rate. The reason bull calves are heavier than heifer calves at birth may be due to the male’s ability to increase uterine blood flow.
IntroductionLittle is known about the physi-
ological role of fetal sex or maternal body weight on total uterine blood flow and maternal heart rate. Sex-specific differences in uterine blood flow have been observed at 120 days of gestation in beef heifers fed a protein-restricted diet, with heifers carrying male progeny experiencing higher uterine blood flow (Hernan-dez-Medrano et al., 2015). Those sex-specific blood flow differences
could not be detected after day 120 of pregnancy or independent of maternal diet.
The objective of this analysis was to examine the relationships among maternal BW, fetal sex, uter-ine blood flow and maternal heart rate in beef cows during mid to late gestation. We hypothesized that heavier cows would have greater uterine blood flow and heart rates, and cows carrying bull calves would have greater total uterine blood flow.
Experimental ProceduresA total of 108 multiparous
Angus or Angus x Continental cows from four independent studies were included in the analysis. Uterine blood flow changes were tracked from day 100 to day 250 of preg-nancy through transrectal Doppler ultrasonography measurements of the uterine artery with the ALOKA 3500 ultrasound.
A 7.5 MHz finger probe was inserted into the rectum and the bi-furcation of the external and internal iliac arteries were identified. Place-ment of the probe was immediately posterior to the first branch of the external iliac artery, measuring the descending uterine artery.
Three cardiac cycle waveform profiles from two to three ultra-sound measurements were collected of the uterine arteries ipsilateral (I; same horn) and contralateral (C; opposite horn) to the conceptus, with an average of all measurements accounting for one observation (n = 333; I + C = Total).
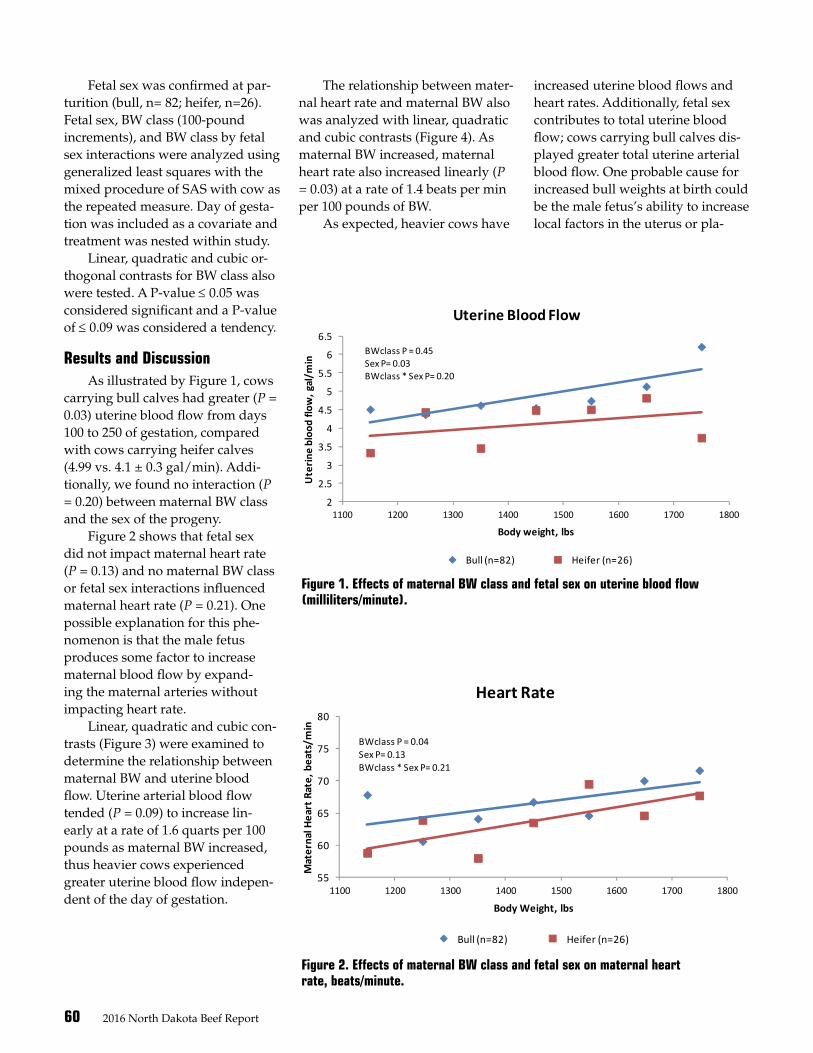
60 2016 North Dakota Beef Report
Fetal sex was confirmed at par-turition (bull, n= 82; heifer, n=26). Fetal sex, BW class (100-pound increments), and BW class by fetal sex interactions were analyzed using generalized least squares with the mixed procedure of SAS with cow as the repeated measure. Day of gesta-tion was included as a covariate and treatment was nested within study.
Linear, quadratic and cubic or-thogonal contrasts for BW class also were tested. A P-value ≤ 0.05 was considered significant and a P-value of ≤ 0.09 was considered a tendency.
Results and DiscussionAs illustrated by Figure 1, cows
carrying bull calves had greater (P = 0.03) uterine blood flow from days 100 to 250 of gestation, compared with cows carrying heifer calves (4.99 vs. 4.1 ± 0.3 gal/min). Addi-tionally, we found no interaction (P = 0.20) between maternal BW class and the sex of the progeny.
Figure 2 shows that fetal sex did not impact maternal heart rate (P = 0.13) and no maternal BW class or fetal sex interactions influenced maternal heart rate (P = 0.21). One possible explanation for this phe-nomenon is that the male fetus produces some factor to increase maternal blood flow by expand-ing the maternal arteries without impacting heart rate.
Linear, quadratic and cubic con-trasts (Figure 3) were examined to determine the relationship between maternal BW and uterine blood flow. Uterine arterial blood flow tended (P = 0.09) to increase lin-early at a rate of 1.6 quarts per 100 pounds as maternal BW increased, thus heavier cows experienced greater uterine blood flow indepen-dent of the day of gestation.
Figure 1. Effects of maternal BW class and fetal sex on uterine blood flow (milliliters/minute).
Figure 2. Effects of maternal BW class and fetal sex on maternal heart rate, beats/minute.
Figure 1. Effects of maternal BW class and fetal sex on uterine blood flow (milliliters/minute).
Figure 2. Effects of maternal BW class and fetal sex on maternal heart rate, beats/minute.
2
2.5
3
3.5
4
4.5
5
5.5
6
6.5
1100 1200 1300 1400 1500 1600 1700 1800
Ute
rine
bloo
d flo
w, g
al/m
in
Body weight, lbs
Uterine Blood Flow
Bull (n=82) Heifer (n=26)
BWclass P = 0.45Sex P= 0.03BWclass * Sex P= 0.20
Figure 2. Effects of maternal BW class and fetal sex on maternal heart rate, beats/minute.
Figure 3. Effects of maternal BW class on uterine blood flow (gallons/minute).
55
60
65
70
75
80
1100 1200 1300 1400 1500 1600 1700 1800
Mat
erna
l Hea
rt R
ate,
bea
ts/m
in
Body Weight, lbs
Heart Rate
Bull (n=82) Heifer (n=26)
BWclass P = 0.04Sex P= 0.13BWclass * Sex P= 0.21
3.0
3.5
4.0
4.5
5.0
5.5
6.0
1100 1200 1300 1400 1500 1600 1700 1800
Ute
rine
bloo
d flo
w, g
al/m
in
Body weight, lbs
Uterine Blood Flow
Mean Predicted
m= 0.20 gal per 100 lbs of BW
BWclass Linear P = 0.09BWclass Quadratic P = 0.92BWclass Cubic P = 0.92
Figure 4. Effects of maternal BW class on maternal heart rate, beats/minute.
58
60
62
64
66
68
70
72
1100 1200 1300 1400 1500 1600 1700 1800
Hear
t rat
e, b
pm
Body weight, lbs
Heart Rate
mean predicted
m= 1.4 bpm per 100 lbs of BW
BWclass Linear P = 0.03BWclass Quadratic P = 0.38BWclass Cubic P = 0.39
The relationship between mater-nal heart rate and maternal BW also was analyzed with linear, quadratic and cubic contrasts (Figure 4). As maternal BW increased, maternal heart rate also increased linearly (P = 0.03) at a rate of 1.4 beats per min per 100 pounds of BW.
As expected, heavier cows have
increased uterine blood flows and heart rates. Additionally, fetal sex contributes to total uterine blood flow; cows carrying bull calves dis-played greater total uterine arterial blood flow. One probable cause for increased bull weights at birth could be the male fetus’s ability to increase local factors in the uterus or pla-
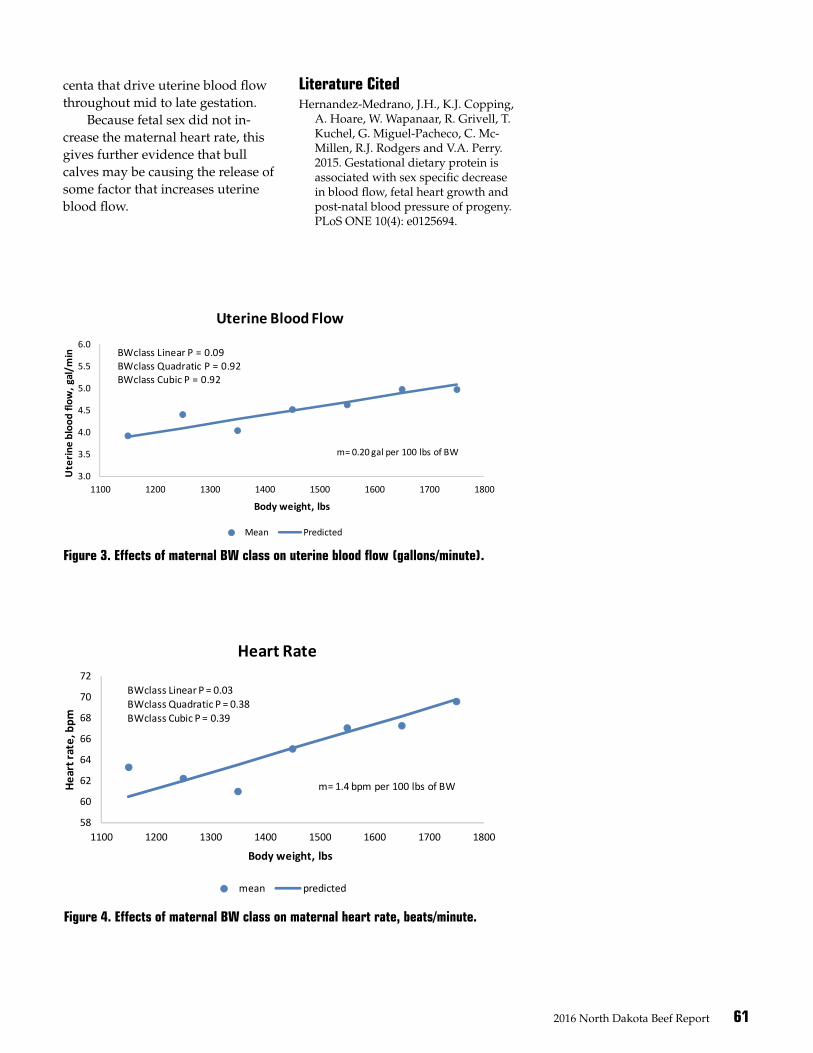
2016 North Dakota Beef Report 61
Figure 3. Effects of maternal BW class on uterine blood flow (gallons/minute).
Figure 4. Effects of maternal BW class on maternal heart rate, beats/minute.
Figure 2. Effects of maternal BW class and fetal sex on maternal heart rate, beats/minute.
Figure 3. Effects of maternal BW class on uterine blood flow (gallons/minute).
55
60
65
70
75
80
1100 1200 1300 1400 1500 1600 1700 1800
Mat
erna
l Hea
rt R
ate,
bea
ts/m
in
Body Weight, lbs
Heart Rate
Bull (n=82) Heifer (n=26)
BWclass P = 0.04Sex P= 0.13BWclass * Sex P= 0.21
3.0
3.5
4.0
4.5
5.0
5.5
6.0
1100 1200 1300 1400 1500 1600 1700 1800
Ute
rine
bloo
d flo
w, g
al/m
in
Body weight, lbs
Uterine Blood Flow
Mean Predicted
m= 0.20 gal per 100 lbs of BW
BWclass Linear P = 0.09BWclass Quadratic P = 0.92BWclass Cubic P = 0.92
Figure 4. Effects of maternal BW class on maternal heart rate, beats/minute.
58
60
62
64
66
68
70
72
1100 1200 1300 1400 1500 1600 1700 1800
Hear
t rat
e, b
pm
Body weight, lbs
Heart Rate
mean predicted
m= 1.4 bpm per 100 lbs of BW
BWclass Linear P = 0.03BWclass Quadratic P = 0.38BWclass Cubic P = 0.39
centa that drive uterine blood flow throughout mid to late gestation.
Because fetal sex did not in-crease the maternal heart rate, this gives further evidence that bull calves may be causing the release of some factor that increases uterine blood flow.
Literature CitedHernandez-Medrano, J.H., K.J. Copping,
A. Hoare, W. Wapanaar, R. Grivell, T. Kuchel, G. Miguel-Pacheco, C. Mc-Millen, R.J. Rodgers and V.A. Perry. 2015. Gestational dietary protein is associated with sex specific decrease in blood flow, fetal heart growth and post-natal blood pressure of progeny. PLoS ONE 10(4): e0125694.
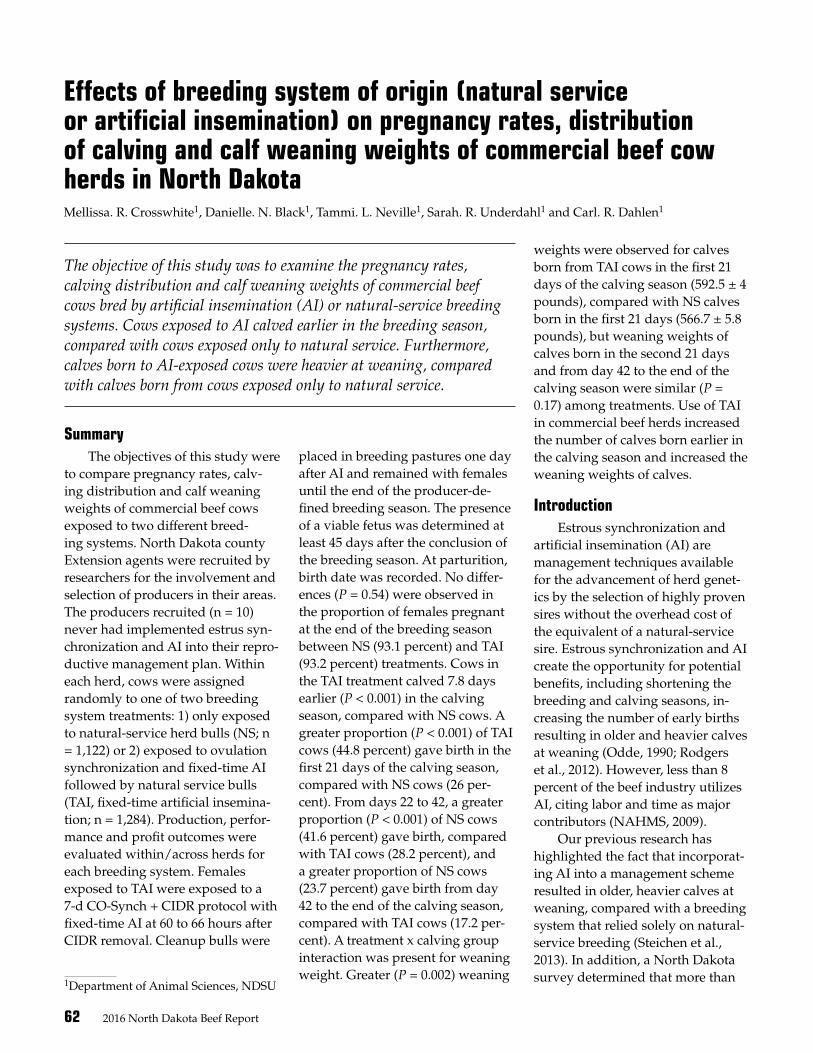
62 2016 North Dakota Beef Report
Effects of breeding system of origin (natural service or artificial insemination) on pregnancy rates, distribution of calving and calf weaning weights of commercial beef cow herds in North DakotaMellissa. R. Crosswhite1, Danielle. N. Black1, Tammi. L. Neville1, Sarah. R. Underdahl1 and Carl. R. Dahlen1
1Department of Animal Sciences, NDSU
The objective of this study was to examine the pregnancy rates, calving distribution and calf weaning weights of commercial beef cows bred by artificial insemination (AI) or natural-service breeding systems. Cows exposed to AI calved earlier in the breeding season, compared with cows exposed only to natural service. Furthermore, calves born to AI-exposed cows were heavier at weaning, compared with calves born from cows exposed only to natural service.
SummaryThe objectives of this study were
to compare pregnancy rates, calv-ing distribution and calf weaning weights of commercial beef cows exposed to two different breed-ing systems. North Dakota county Extension agents were recruited by researchers for the involvement and selection of producers in their areas. The producers recruited (n = 10) never had implemented estrus syn-chronization and AI into their repro-ductive management plan. Within each herd, cows were assigned randomly to one of two breeding system treatments: 1) only exposed to natural-service herd bulls (NS; n = 1,122) or 2) exposed to ovulation synchronization and fixed-time AI followed by natural service bulls (TAI, fixed-time artificial insemina-tion; n = 1,284). Production, perfor-mance and profit outcomes were evaluated within/across herds for each breeding system. Females exposed to TAI were exposed to a 7-d CO-Synch + CIDR protocol with fixed-time AI at 60 to 66 hours after CIDR removal. Cleanup bulls were
placed in breeding pastures one day after AI and remained with females until the end of the producer-de-fined breeding season. The presence of a viable fetus was determined at least 45 days after the conclusion of the breeding season. At parturition, birth date was recorded. No differ-ences (P = 0.54) were observed in the proportion of females pregnant at the end of the breeding season between NS (93.1 percent) and TAI (93.2 percent) treatments. Cows in the TAI treatment calved 7.8 days earlier (P < 0.001) in the calving season, compared with NS cows. A greater proportion (P < 0.001) of TAI cows (44.8 percent) gave birth in the first 21 days of the calving season, compared with NS cows (26 per-cent). From days 22 to 42, a greater proportion (P < 0.001) of NS cows (41.6 percent) gave birth, compared with TAI cows (28.2 percent), and a greater proportion of NS cows (23.7 percent) gave birth from day 42 to the end of the calving season, compared with TAI cows (17.2 per-cent). A treatment x calving group interaction was present for weaning weight. Greater (P = 0.002) weaning
weights were observed for calves born from TAI cows in the first 21 days of the calving season (592.5 ± 4 pounds), compared with NS calves born in the first 21 days (566.7 ± 5.8 pounds), but weaning weights of calves born in the second 21 days and from day 42 to the end of the calving season were similar (P = 0.17) among treatments. Use of TAI in commercial beef herds increased the number of calves born earlier in the calving season and increased the weaning weights of calves.
Introduction Estrous synchronization and
artificial insemination (AI) are management techniques available for the advancement of herd genet-ics by the selection of highly proven sires without the overhead cost of the equivalent of a natural-service sire. Estrous synchronization and AI create the opportunity for potential benefits, including shortening the breeding and calving seasons, in-creasing the number of early births resulting in older and heavier calves at weaning (Odde, 1990; Rodgers et al., 2012). However, less than 8 percent of the beef industry utilizes AI, citing labor and time as major contributors (NAHMS, 2009).
Our previous research has highlighted the fact that incorporat-ing AI into a management scheme resulted in older, heavier calves at weaning, compared with a breeding system that relied solely on natural-service breeding (Steichen et al., 2013). In addition, a North Dakota survey determined that more than
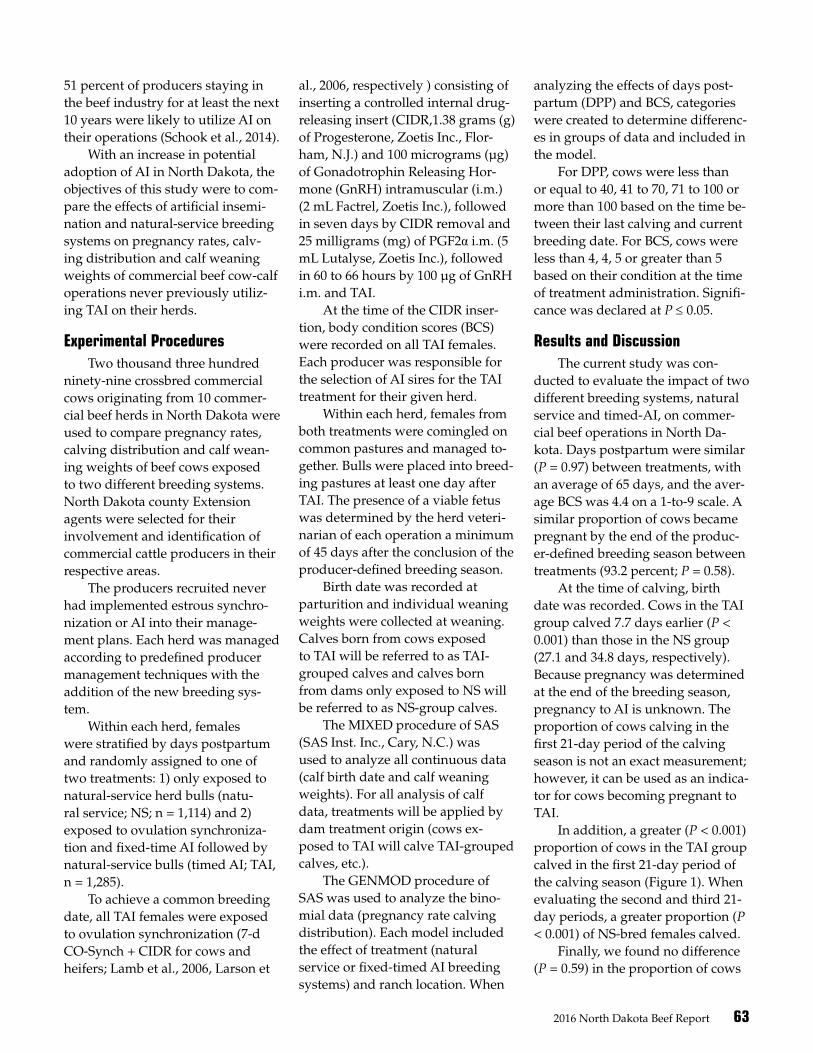
2016 North Dakota Beef Report 63
51 percent of producers staying in the beef industry for at least the next 10 years were likely to utilize AI on their operations (Schook et al., 2014).
With an increase in potential adoption of AI in North Dakota, the objectives of this study were to com-pare the effects of artificial insemi-nation and natural-service breeding systems on pregnancy rates, calv-ing distribution and calf weaning weights of commercial beef cow-calf operations never previously utiliz-ing TAI on their herds.
Experimental ProceduresTwo thousand three hundred
ninety-nine crossbred commercial cows originating from 10 commer-cial beef herds in North Dakota were used to compare pregnancy rates, calving distribution and calf wean-ing weights of beef cows exposed to two different breeding systems. North Dakota county Extension agents were selected for their involvement and identification of commercial cattle producers in their respective areas.
The producers recruited never had implemented estrous synchro-nization or AI into their manage-ment plans. Each herd was managed according to predefined producer management techniques with the addition of the new breeding sys-tem.
Within each herd, females were stratified by days postpartum and randomly assigned to one of two treatments: 1) only exposed to natural-service herd bulls (natu-ral service; NS; n = 1,114) and 2) exposed to ovulation synchroniza-tion and fixed-time AI followed by natural-service bulls (timed AI; TAI, n = 1,285).
To achieve a common breeding date, all TAI females were exposed to ovulation synchronization (7-d CO-Synch + CIDR for cows and heifers; Lamb et al., 2006, Larson et
al., 2006, respectively ) consisting of inserting a controlled internal drug-releasing insert (CIDR,1.38 grams (g) of Progesterone, Zoetis Inc., Flor-ham, N.J.) and 100 micrograms (µg) of Gonadotrophin Releasing Hor-mone (GnRH) intramuscular (i.m.) (2 mL Factrel, Zoetis Inc.), followed in seven days by CIDR removal and 25 milligrams (mg) of PGF2α i.m. (5 mL Lutalyse, Zoetis Inc.), followed in 60 to 66 hours by 100 µg of GnRH i.m. and TAI.
At the time of the CIDR inser-tion, body condition scores (BCS) were recorded on all TAI females. Each producer was responsible for the selection of AI sires for the TAI treatment for their given herd.
Within each herd, females from both treatments were comingled on common pastures and managed to-gether. Bulls were placed into breed-ing pastures at least one day after TAI. The presence of a viable fetus was determined by the herd veteri-narian of each operation a minimum of 45 days after the conclusion of the producer-defined breeding season.
Birth date was recorded at parturition and individual weaning weights were collected at weaning. Calves born from cows exposed to TAI will be referred to as TAI-grouped calves and calves born from dams only exposed to NS will be referred to as NS-group calves.
The MIXED procedure of SAS (SAS Inst. Inc., Cary, N.C.) was used to analyze all continuous data (calf birth date and calf weaning weights). For all analysis of calf data, treatments will be applied by dam treatment origin (cows ex-posed to TAI will calve TAI-grouped calves, etc.).
The GENMOD procedure of SAS was used to analyze the bino-mial data (pregnancy rate calving distribution). Each model included the effect of treatment (natural service or fixed-timed AI breeding systems) and ranch location. When
analyzing the effects of days post-partum (DPP) and BCS, categories were created to determine differenc-es in groups of data and included in the model.
For DPP, cows were less than or equal to 40, 41 to 70, 71 to 100 or more than 100 based on the time be-tween their last calving and current breeding date. For BCS, cows were less than 4, 4, 5 or greater than 5 based on their condition at the time of treatment administration. Signifi-cance was declared at P ≤ 0.05.
Results and Discussion The current study was con-
ducted to evaluate the impact of two different breeding systems, natural service and timed-AI, on commer-cial beef operations in North Da-kota. Days postpartum were similar (P = 0.97) between treatments, with an average of 65 days, and the aver-age BCS was 4.4 on a 1-to-9 scale. A similar proportion of cows became pregnant by the end of the produc-er-defined breeding season between treatments (93.2 percent; P = 0.58).
At the time of calving, birth date was recorded. Cows in the TAI group calved 7.7 days earlier (P < 0.001) than those in the NS group (27.1 and 34.8 days, respectively). Because pregnancy was determined at the end of the breeding season, pregnancy to AI is unknown. The proportion of cows calving in the first 21-day period of the calving season is not an exact measurement; however, it can be used as an indica-tor for cows becoming pregnant to TAI.
In addition, a greater (P < 0.001) proportion of cows in the TAI group calved in the first 21-day period of the calving season (Figure 1). When evaluating the second and third 21-day periods, a greater proportion (P < 0.001) of NS-bred females calved.
Finally, we found no difference (P = 0.59) in the proportion of cows
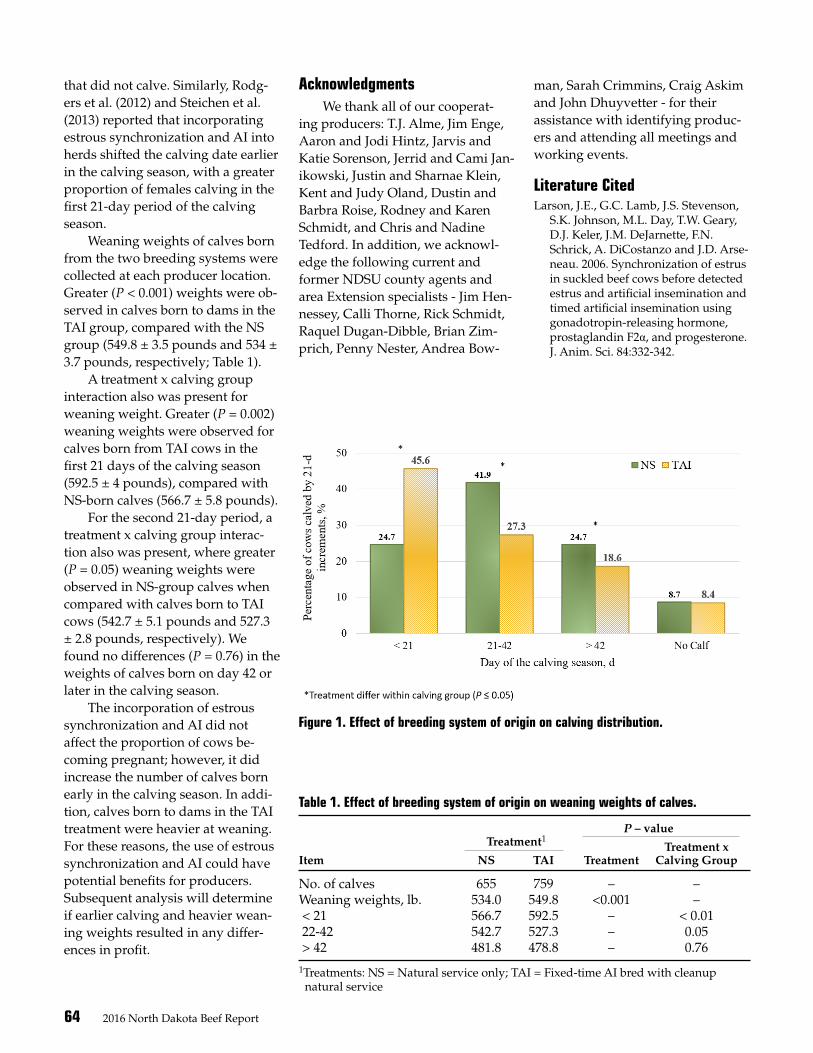
64 2016 North Dakota Beef Report
that did not calve. Similarly, Rodg-ers et al. (2012) and Steichen et al. (2013) reported that incorporating estrous synchronization and AI into herds shifted the calving date earlier in the calving season, with a greater proportion of females calving in the first 21-day period of the calving season.
Weaning weights of calves born from the two breeding systems were collected at each producer location. Greater (P < 0.001) weights were ob-served in calves born to dams in the TAI group, compared with the NS group (549.8 ± 3.5 pounds and 534 ± 3.7 pounds, respectively; Table 1).
A treatment x calving group interaction also was present for weaning weight. Greater (P = 0.002) weaning weights were observed for calves born from TAI cows in the first 21 days of the calving season (592.5 ± 4 pounds), compared with NS-born calves (566.7 ± 5.8 pounds).
For the second 21-day period, a treatment x calving group interac-tion also was present, where greater (P = 0.05) weaning weights were observed in NS-group calves when compared with calves born to TAI cows (542.7 ± 5.1 pounds and 527.3 ± 2.8 pounds, respectively). We found no differences (P = 0.76) in the weights of calves born on day 42 or later in the calving season.
The incorporation of estrous synchronization and AI did not affect the proportion of cows be-coming pregnant; however, it did increase the number of calves born early in the calving season. In addi-tion, calves born to dams in the TAI treatment were heavier at weaning. For these reasons, the use of estrous synchronization and AI could have potential benefits for producers. Subsequent analysis will determine if earlier calving and heavier wean-ing weights resulted in any differ-ences in profit.
AcknowledgmentsWe thank all of our cooperat-
ing producers: T.J. Alme, Jim Enge, Aaron and Jodi Hintz, Jarvis and Katie Sorenson, Jerrid and Cami Jan-ikowski, Justin and Sharnae Klein, Kent and Judy Oland, Dustin and Barbra Roise, Rodney and Karen Schmidt, and Chris and Nadine Tedford. In addition, we acknowl-edge the following current and former NDSU county agents and area Extension specialists - Jim Hen-nessey, Calli Thorne, Rick Schmidt, Raquel Dugan-Dibble, Brian Zim-prich, Penny Nester, Andrea Bow-
man, Sarah Crimmins, Craig Askim and John Dhuyvetter - for their assistance with identifying produc-ers and attending all meetings and working events.
Literature Cited Larson, J.E., G.C. Lamb, J.S. Stevenson,
S.K. Johnson, M.L. Day, T.W. Geary, D.J. Keler, J.M. DeJarnette, F.N. Schrick, A. DiCostanzo and J.D. Arse-neau. 2006. Synchronization of estrus in suckled beef cows before detected estrus and artificial insemination and timed artificial insemination using gonadotropin-releasing hormone, prostaglandin F2α, and progesterone. J. Anim. Sci. 84:332-342.
Table 1. Effect of breeding system of origin on weaning weights of calves.
P – value
Treatment1 Treatment x
Item NS TAI Treatment Calving Group
No. of calves 655 759 – –Weaning weights, lb. 534.0 549.8 <0.001 – < 21 566.7 592.5 – < 0.01 22-42 542.7 527.3 – 0.05 > 42 481.8 478.8 – 0.76
1Treatments: NS = Natural service only; TAI = Fixed-time AI bred with cleanup natural service
Figure 1. Effect of breeding system of origin on calving distribution.
2016 North Dakota Beef Report 65
National Animal Health Management Service (NAHMS). 2009a. Part II. Ref-erence of beef cow-calf management practices in the United States, 2007-08. Page: 5-23. Natl. Anim. Health Monit. Serv., Fort Collins, Colo.
Odde, K.G. 1990. A review of synchroni-zation of estrus in postpartum cattle. J. Anim. Sci. 68: 817-830.
Rodgers, J.R., S.L. Bird, J.E. Larson, N. DiLorenzo, C.R. Dahlen, A. DiCostan-zo and G.C. Lamb. 2011. An economic evaluation of estrous synchroniza-
tion and timed artificial insemination in suckled beef cows. J. Anim. Sci. 90:4055-4062.
Schook, M.R., D.N. Black, J.C. Hadrich, G.P. Lardy and C.R. Dahlen. 2014. Abstract: The North Dakota beef industry survey II: Comparing herd management and production practic-es among producers planning to exit the industry and producers planning to remain in production. American Society of Animal Science Midwest Section Meeting. Des Moines, Iowa.
Steichen, P.L., S.I. Klein, Q.P. Larson, K.M. Bischoff, V.R.G. Mercadante, G.C. Lamb, C.S. Schauer, B.W. Neville and C.R. Dahlen. 2013. Effects of natural service ad artificial insemi-nation breeding systems on calving characteristics and weaning weights. The 2013 North Dakota Beef Report. Pg. 6-8.
Effects of maternal nutritional status on nutrient transporter expression in bovine utero-placental tissue on days 16 to 50 of gestationMatthew S. Crouse1, Kyle J. McLean1, Mellissa R. Crosswhite1, Nicolas Negrin Pereira1, Alison K. Ward1, Lawrence P. Reynolds1, Carl R. Dahlen1, Bryan W. Neville2, Pawel P. Borowicz1 and Joel S. Caton1
1Department of Animal Sciences, NDSU 2Central Grasslands Research Extension Center, NDSU
The objectives of this study were to determine the effect of a 40 percent global nutrient restriction on the messenger ribonucleic acid (mRNA) expression of nutrient transporters known for their roles in transporting arginine (CAT-1, CAT-2 and CAT-3) and glucose (GLUT1) across the uterine endometrium and fetal membranes to the fetus from days 16 to 50 of gestation. The results indicate that a 40 percent global nutrient restriction only affects mRNA expression of arginine transporter CAT-2 and not any other transporter investigated.
SummaryWe hypothesized that mater-
nal nutrition and day of gestation would impact mRNA expression of nutrient transporters GLUT1, CAT-1, CAT-2 and CAT-3 in beef heifers. Crossbred Angus heifers (n = 49) were synchronized, bred via artificial insemination (AI), assigned to nutritional treatment (CON = 100 percent of requirements for 1
pound/day of gain and RES = 60 percent of CON) and ovariohys-terectomized on days 16, 34 or 50 of gestation (n = six to nine/day). Nonpregnant (NP) controls were not bred and ovariohysterectomized on day 16 of the synchronized estrous cycle (n = 6). The resulting arrange-ment of treatments was a 2 × 3 facto-rial + 1. Caruncle (CAR), intercarun-cular endometrium (ICAR) and fetal membranes (FM) were obtained from the pregnant uterine horn im-
mediately following ovariohyster-ectomy. For NP controls, only CAR and ICAR were obtained. The rela-tive expression of the glucose trans-porter GLUT1 and cationic amino acid transporters CAT-1, CAT-2 and CAT-3 was determined for each tis-sue utilizing NP-CAR and NP-ICAR tissue as the baseline. For FM, NP endometrium served as the baseline. We found no interaction of day and treatment in FM for any genes (P ≥ 0.05). Expression of GLUT1 and CAT-1 showed a day effect, being greater (P < 0.05) in FM on days 34 and 50, compared with day 16. In CAR, we found no day × treatment interaction, and CAT-3 expression tended (P = 0.06) to be greater in CON vs. RES heifers. Addition-ally, expression of GLUT1, CAT-1 and CAT-2 in CAR were greater (P < 0.01) on day 16, compared with days 34 and 50, day 34 compared with day 50, and days 16 and 34 compared with day 50, respectively. In ICAR, CAT-2 showed a day ×
66 2016 North Dakota Beef Report
treatment interaction, being greater (P = 0.01) on day 50 CON, compared with all other groups. Transporter CAT-3 tended (P = 0.09) to be greater in day × treatment in ICAR on day 16 CON, compared with all other days and treatments. The expression of GLUT1 was greater (P < 0.01) in ICAR on day 16 than all other days. Arginine transporter CAT-1 was greater (P < 0.01) in ICAR on days 34 and 50, compared with day 16. These results partially support our hypothesis and indicate that day was a more influential factor for mRNA expression of utero-placental glucose and cationic amino acid transporters than maternal nutri-tional status in heifers during early pregnancy.
IntroductionFetal growth is vulnerable to
maternal dietary nutrient deficien-cies during the first trimester of gestation (Wu et al., 2004). During the first 50 days of gestation, organ-ogenesis is taking place. This time period of gestation is a critical devel-opmental window with significant cellular and tissue differentiation. Nutritional influences may alter the mammalian phenotype through affecting gene regulatory mecha-nisms involved in DNA synthesis and replication, thus “imprinting” potential susceptibilities to chronic disease and metabolic issues into the genome (Waterland and Jirtle, 2004).
Currently, fetal undernutrition occurs in grazing livestock world-wide (Wu et al., 2004). Maternal un-dernutrition has been implicated in fetal growth restriction and altered placental growth, reduced amino acid and glucose transport, and increased apoptosis and autophagy, which overall can yield decreased fetal growth during gestation (Zhang et al., 2015).
Before the establishment of hemotrophic nutrition, the placenta is developing and the fetus begins
to utilize increasing quantities of glucose and amino acids (Groebner et al., 2011). Thus, the expression of glucose and amino acid transporters in the utero-placenta becomes essen-tial to the viability of the conceptus.
Therefore, we studied the utero-placental glucose transporter GLUT1 (SLC2A1), which is present in most tissues throughout the body and is ubiquitous across species. The amino acid transporters investigated are CAT-1, CAT-2 and CAT-3 (SL-C7A1, SLC7A2 and SLC7A3), whose substrates are cationic amino acids such as arginine and lysine, which are directly linked to angiogenesis and cell proliferation.
In this experiment, we tested the hypothesis that mRNA for glucose and cationic amino acid transporters in utero-placental tissues would be expressed differentially due to day of gestation and maternal nutri-tional status.
Experimental ProceduresProtocols described herein were
approved by the North Dakota State University Institutional Animal Care and Use Committee. Crossbred An-gus heifers (n = 49, about 15 months of age; average initial body weight [BW] = 722 pounds) were exposed to the 5-d CO-Synch + CIDR estrus synchronization protocol. Six heif-ers were not inseminated to serve as nonpregnant (NP) controls but received ovariohysterectomy for tissue collections on day 16 of the synchronized estrous cycle. The re-maining heifers (n = six to nine/day of gestation/treatment) were bred by AI to a common sire at 12 hours after observed estrus and ovariohys-terectomized at days 16, 34 or 50 of gestation.
Heifers were housed at the NDSU Animal Nutrition and Physiology Center. Heifers were ac-climated to individual bunk feeding for two weeks before the beginning of the trial.
Immediately following AI, heif-ers were assigned randomly to one of two treatment groups. Control heifers (CON) received 100 percent of National Research Council (NRC, 2000) requirements for 0.45 kilogram per day (kg/d) gain to reach 80 per-cent of mature BW at first calving. Restricted heifers (RES) were placed on a 40 percent global nutrient restriction, which was accomplished by reducing total diet delivery 60 percent of the control delivery.
The diet was delivered via total mixed ration (TMR) and consisted of grass hay (73.4 percent neutral detergent fiber [NDF], 8 percent crude [CP]), corn silage (55.6 percent NDF, 6.3 percent CP), alfalfa hay-lage, (48.9 percent NDF, 16.4 percent CP), grain supplement, (32.6 percent NDF, 24.1 percent CP) and dried distillers grains (53.4 percent NDF, 31.3 percent CP), on a dry-matter (DM) basis.
Immediately following ovario-hysterectomy (McLean et al., 2016), utero-placental tissues (caruncle, CAR; intercaruncular endometrium, ICAR; fetal membrane [chorioal-lantois], FM; cotyledon, COT; intercotyledonary placenta ICOT; and amnion, AMN) were obtained from the uterine horn containing the conceptus, as previously described (Grazul-Bilska et al., 2010, 2011). Fetal membranes also were collected only from heifers that were bred due to a lack of FM in NP controls.
On day 50 of gestation, FM was split into COT and ICOT. Amnion was collected only on day 50. Once collected, all tissues were frozen in liquid nitrogen-cooled isopentane and stored at minus 112 F.
The RNA was extracted from each tissue and purified. The level of mRNA expression of each transport-er within the tissue was established using polymerase chain reaction (PCR) to determine differences in mRNA expression of the transport-ers across days of early gestation.
2016 North Dakota Beef Report 67
Results and Discussion The mRNA expression of glu-
cose transporter GLUT1 was greater (P < 0.01) in AMN, compared with COT and ICOT (0.67 vs. 0.24 and 0.29, respectively; Table 1). Arginine transporter CAT-1 mRNA expression was greater (P = 0.02) in AMN when compared with COT and ICOT (0.30 vs. 0.22 and 0.17, respectively; Table 1).
Cationic amino acid transporter CAT-2 mRNA expression was great-er (P = 0.05) in AMN, compared with ICOT (3.27 vs. 0.82, respective-ly). The level of expression of CAT-3 was greater (P < 0.01) in AMN, compared with COT and ICOT (7.64 vs. 0.73 and 2.75, respectively)
We found no day × treatment interaction or main effect of treat-ment for any gene in FM (P > 0.05). Expression of GLUT1 was greater (P = 0.04) on day 50 of gestation, com-pared with day 16 (0.38 vs. 0.15, re-spectively; Table 2). Cationic amino acid transporter CAT-1 expression was greater (P < 0.01) on days 34 and 50, compared with day 16 (0.23 and 0.22 vs. 0.05, respectively; Table 2). The mRNA expression of CAT-2 tended to be greater (P = 0.09) on day 50 of gestation, compared with day 16.
We also found no day × treat-ment interaction (P ≥ 0.05) on the mRNA expression of GLUT1, CAT-1, CAT-2 or CAT-3 in CAR. Expression of CAT-3 showed a tendency (P = 0.06) to be greater across day of ges-tation in CON vs. RES (2.60 vs. 1.16; Table 3). Expression of GLUT1 was greater (P < 0.01) on day 16 of gesta-tion, compared with days 34 and 50 (2.89 vs. 0.85 and 1.14 respectively).
The mRNA expression of CAT-1 was greater (P < 0.01) on day 34, compared with days 16 and 50 (5.22 vs. 1.47 and 0.51 respectively; Table 3). Additionally, mRNA expression of CAT-1 tended to be greater (P = 0.09) in the post-implantation (days
Table 1. Relative expression of nutrient transporters GLUT1, CAT-1, CAT-2 and CAT-3 in AMN, COT and ICOT on day 50 of gestation using NP endometrium as a baseline value set to 1.
Gene1 AMN2 COT3 ICOT4 SEM5 P-value6
GLUT1 0.67a 0.24b 0.29b 0.07 < 0.01CAT-1 0.30a 0.22b 0.17b 0.03 0.02CAT-2 3.27a 1.42ab 0.82b 0.66 0.05CAT-3 7.64a 0.73b 2.75b 1.38 < 0.01
1Gene = GLUT1 – Glucose transporter solute carrier family 2 member 1. CAT-1, CAT-2 and CAT-3 – Cationic amino acid transporters of arginine and lysine, solute carrier family 7 member 1, 2 and 3.2Amnion taken on day 50 of gestation.3Cotyledons taken from fetal membranes on day 50 of gestation.4Intercotyledonary tissue (fetal membrane tissue not including cotyledons; taken from fetal membranes on day 50 of gestation).5Average SEM was used within gene; AMN n = 11, COT n = 14, ICOT n =146Probability values for the effect of tissue on level of expression of individual genes.a-bMeans within gene without a common superscript differ by tissue (P ≤ 0.05).
34 and 50) vs. implantation (day 16). Expression of cationic amino acid transporter CAT-2 was greater (P = 0.02) on day 34, compared with day 16 of gestation (14.67 vs. 4.36, respectively). In addition, CAT-2 mRNA expression showed a ten-dency (P = 0.06) to be greater in pregnant vs. NP heifers.
The expression of CAT-2 showed a day × treatment interaction (P = 0.01) being greater, with day 50 CON heifers having greater expres-sion, compared with days 16 and 50 RES and day 34 CON heifers (Table 4). The cationic amino acid trans-porter CAT-3 tended (P = 0.09) to be greater in day 16 CON, compared with all other days and treatments.
The mRNA expression of GLUT1 was greater (P < 0.01) on day 16 of gestation compared with day 34 (2.11 vs. 0.75). Arginine and Lysine transporter CAT-1 was greater (P < 0.01) on days 34 and 50, compared with day 16 (14.62 and 11.13 vs. 0.58, respectively). Addi-tionally, CAT-1 mRNA expression was greater in ICAR (P < 0.01) in pregnant, compared with NP heifers (8.78 vs. 1, respectively).
Fertilization rates for first-service AI are approximately 90 percent in beef heifers (Bridges et al., 2013); however, by day 30 of gestation, only 50 to 60 percent of heifers maintain a viable pregnancy. Moreover, Thatcher et al., (1994) indicated that up to 40 percent of all embryonic loss occurs before day 40 of gestation in sheep and cattle.
Glucose and amino acids, specif-ically arginine, are crucial for proper energy metabolism and growth, and are key regulators of mTOR, which is linked to angiogenesis and cell proliferation, causing increased fetal growth and mitigating apoptosis (Tan and Miyamoto, 2016
The expression of all transport-ers investigated was greatest on day 50 in AMN, compared with COT and ICOT. Amniotic fluid contains the nutrient reserve from which the conceptus draws to meet its ener-getic and growth requirements prior to transplacental exchange. The re-ported data further demonstrate the increased emphasis on transport of nutrients across the AMN to provide nutrients to the conceptus.

68 2016 North Dakota Beef Report
Before the establishment of transplacental exchange, nutrient transporters are the only method of supplying nutrients to the con-ceptus. Therefore, evaluating the concentration of nutrients in the maternal and fetal fluids (serum, histotroph, and allantoic and amni-otic fluids) is of interest to determine whether nutrient restriction dur-ing early gestation affects nutrient concentrations in maternal and fetal fluids or nutrient transport capacity, thereby altering the abundance of nutrients available for transport to the conceptus.
We interpret these data to imply that a 40 percent global maternal nutritional restriction may affect the mRNA expression of some (CAT-2) but not all utero-placental nutrient transporters investigated in this study. The effects of day of gestation on the mRNA expression of glucose and cationic amino acid transporters reflect the changing nutrient supply and demand curve necessary for proper conceptus growth. Moreover, additional knowledge in this area will facilitate increased efficien-cies of beef cattle production and contribute to meeting the projected world food demands.
Table 2. Level of expression of nutrient transporters GLUT1, CAT-1, CAT-2 and CAT-3 in fetal membranes (FM) due to CON and RES dietary treatments from days 16 to 50 of gestation in beef heifers using NP endometrium as a baseline value set to 1.
Day of Gestation2 P – values3
Gene1 Trt4 16 34 50 Trt5 SEM6 Day Trt Day × Trt
GLUT1 CON 0.11 0.25 0.38 0.25 0.08 0.04 0.70 0.90 RES 0.19 0.27 0.38 0.28 Day7 0.15h 0.26gh 0.38g
CAT-1 CON 0.04 0.22 0.22 0.16 0.17 < 0.01 0.70 0.99 RES 0.05 0.24 0.23 0.17 Day 0.05h 0.23g 0.22g
CAT-2 CON 0.42 0.84 1.97 1.08 0.66 0.09 0.87 0.82 RES 0.24 1.16 1.57 0.99 Day 0.33 1.00 1.77
CAT-3 CON 0.08 3.94 5.20 3.07 2.21 0.39 0.61 0.57 RES 2.38 0.93 3.02 2.11 Day 1.23 2.43 4.11
1Gene = GLUT1 – Glucose transporter solute carrier family 2 member 1. CAT-1, CAT-2 and CAT-3 – Cationic amino acid transporters of arginine and lysine, solute carrier family 7 member 1, 2 and 3.2Day of Gestation = number of days after AI. Each gene of interest expression value is reported as a fold change in relation to NP endometrium level of gene expression. 3Probability values for the effect of day, treatment and day × treatment on the level of expression of individual genes.4CON = Heifers fed a diet that meets 100% of NRC requirements to gain 1 pound daily. RES = Heifers restricted to 60% of CON diet.5Mean gene expression of treatment group across day of gestation within tissue and gene of interest.6Average SEM used within gene. d 16 CON n = 7, d 16 RES n = 7, d 34 CON n = 6, d 34 RES n = 9, d 50 CON n = 7, d 50 RES n = 77Mean gene expression across treatment within day and gene of interest.a-cMeans within gene and tissue without a common superscript differ in day × treatment (P ≤ 0.05).g-hMeans within row lacking common superscript differ in main effect of day (P ≤ 0.05).
AcknowledgmentsWe thank the North Dakota
State Board of Agricultural Research and Education and the U.S. De-partment of Agriculture’s National Institute of Food and Agriculture and Agriculture and Food Research Initiative (2016-67016-24942) for research support. We also express appreciation to personnel at the NDSU Animal Nutrition and Physi-ology Center, NDSU Animal Science Nutrition Laboratory and Animal Science Reproductive Physiology Laboratory, and Animal Science graduate students Jordan Hieber and Evan Knutson for their assis-tance in completing this project.
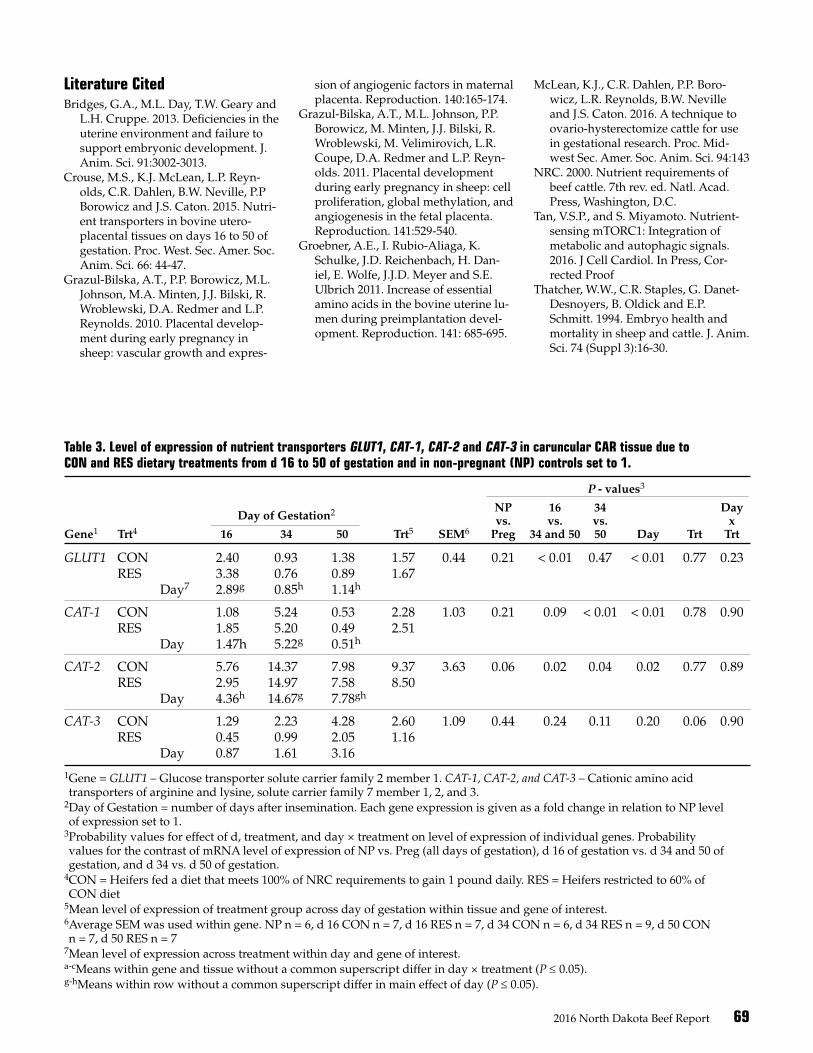
2016 North Dakota Beef Report 69
Literature CitedBridges, G.A., M.L. Day, T.W. Geary and
L.H. Cruppe. 2013. Deficiencies in the uterine environment and failure to support embryonic development. J. Anim. Sci. 91:3002-3013.
Crouse, M.S., K.J. McLean, L.P. Reyn-olds, C.R. Dahlen, B.W. Neville, P.P Borowicz and J.S. Caton. 2015. Nutri-ent transporters in bovine utero-placental tissues on days 16 to 50 of gestation. Proc. West. Sec. Amer. Soc. Anim. Sci. 66: 44-47.
Grazul-Bilska, A.T., P.P. Borowicz, M.L. Johnson, M.A. Minten, J.J. Bilski, R. Wroblewski, D.A. Redmer and L.P. Reynolds. 2010. Placental develop-ment during early pregnancy in sheep: vascular growth and expres-
sion of angiogenic factors in maternal placenta. Reproduction. 140:165-174.
Grazul-Bilska, A.T., M.L. Johnson, P.P. Borowicz, M. Minten, J.J. Bilski, R. Wroblewski, M. Velimirovich, L.R. Coupe, D.A. Redmer and L.P. Reyn-olds. 2011. Placental development during early pregnancy in sheep: cell proliferation, global methylation, and angiogenesis in the fetal placenta. Reproduction. 141:529-540.
Groebner, A.E., I. Rubio-Aliaga, K. Schulke, J.D. Reichenbach, H. Dan-iel, E. Wolfe, J.J.D. Meyer and S.E. Ulbrich 2011. Increase of essential amino acids in the bovine uterine lu-men during preimplantation devel-opment. Reproduction. 141: 685-695.
McLean, K.J., C.R. Dahlen, P.P. Boro-wicz, L.R. Reynolds, B.W. Neville and J.S. Caton. 2016. A technique to ovario-hysterectomize cattle for use in gestational research. Proc. Mid-west Sec. Amer. Soc. Anim. Sci. 94:143
NRC. 2000. Nutrient requirements of beef cattle. 7th rev. ed. Natl. Acad. Press, Washington, D.C.
Tan, V.S.P., and S. Miyamoto. Nutrient-sensing mTORC1: Integration of metabolic and autophagic signals. 2016. J Cell Cardiol. In Press, Cor-rected Proof
Thatcher, W.W., C.R. Staples, G. Danet-Desnoyers, B. Oldick and E.P. Schmitt. 1994. Embryo health and mortality in sheep and cattle. J. Anim. Sci. 74 (Suppl 3):16-30.
Table 3. Level of expression of nutrient transporters GLUT1, CAT-1, CAT-2 and CAT-3 in caruncular CAR tissue due to CON and RES dietary treatments from d 16 to 50 of gestation and in non-pregnant (NP) controls set to 1.
P - values3
Day of Gestation2
NP 16 34 Day vs. vs. vs. x Gene1 Trt4 16 34 50 Trt5 SEM6 Preg 34 and 50 50 Day Trt Trt
GLUT1 CON 2.40 0.93 1.38 1.57 0.44 0.21 < 0.01 0.47 < 0.01 0.77 0.23 RES 3.38 0.76 0.89 1.67 Day7 2.89g 0.85h 1.14h
CAT-1 CON 1.08 5.24 0.53 2.28 1.03 0.21 0.09 < 0.01 < 0.01 0.78 0.90 RES 1.85 5.20 0.49 2.51 Day 1.47h 5.22g 0.51h
CAT-2 CON 5.76 14.37 7.98 9.37 3.63 0.06 0.02 0.04 0.02 0.77 0.89 RES 2.95 14.97 7.58 8.50 Day 4.36h 14.67g 7.78gh
CAT-3 CON 1.29 2.23 4.28 2.60 1.09 0.44 0.24 0.11 0.20 0.06 0.90 RES 0.45 0.99 2.05 1.16 Day 0.87 1.61 3.16
1Gene = GLUT1 – Glucose transporter solute carrier family 2 member 1. CAT-1, CAT-2, and CAT-3 – Cationic amino acid transporters of arginine and lysine, solute carrier family 7 member 1, 2, and 3.2Day of Gestation = number of days after insemination. Each gene expression is given as a fold change in relation to NP level of expression set to 1.3Probability values for effect of d, treatment, and day × treatment on level of expression of individual genes. Probability values for the contrast of mRNA level of expression of NP vs. Preg (all days of gestation), d 16 of gestation vs. d 34 and 50 of gestation, and d 34 vs. d 50 of gestation. 4CON = Heifers fed a diet that meets 100% of NRC requirements to gain 1 pound daily. RES = Heifers restricted to 60% of CON diet5Mean level of expression of treatment group across day of gestation within tissue and gene of interest.6Average SEM was used within gene. NP n = 6, d 16 CON n = 7, d 16 RES n = 7, d 34 CON n = 6, d 34 RES n = 9, d 50 CON n = 7, d 50 RES n = 77Mean level of expression across treatment within day and gene of interest.a-cMeans within gene and tissue without a common superscript differ in day × treatment (P ≤ 0.05).g-hMeans within row without a common superscript differ in main effect of day (P ≤ 0.05).
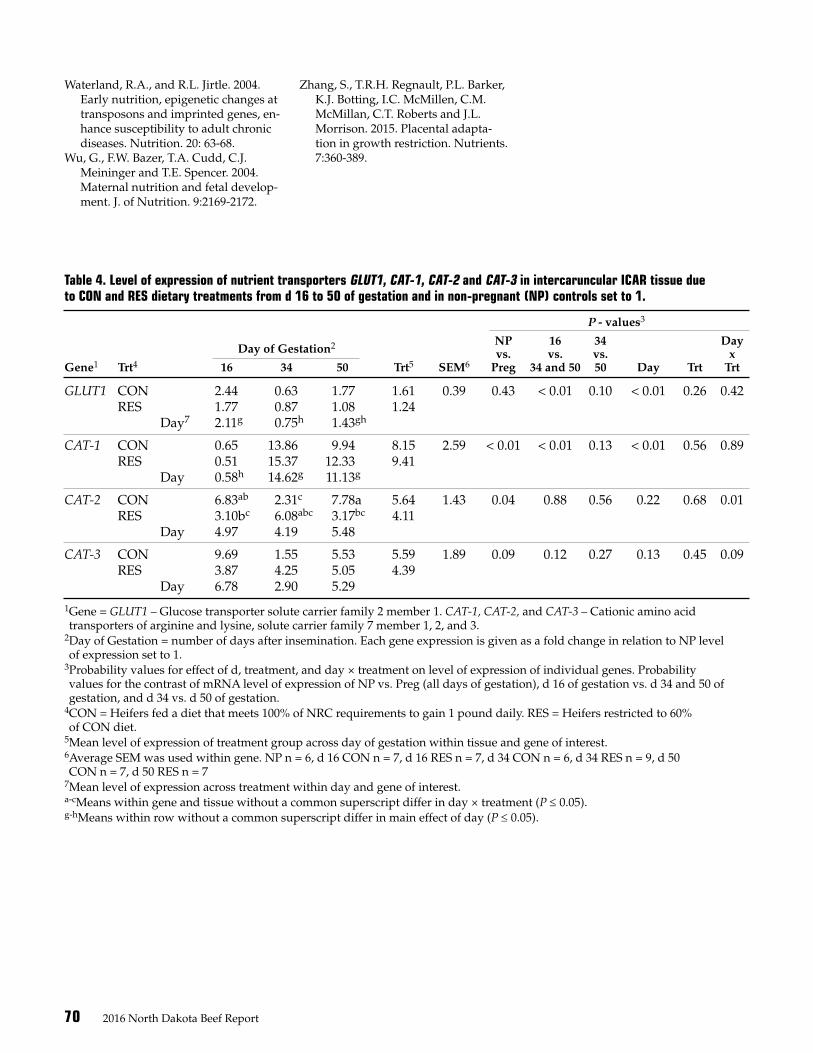
70 2016 North Dakota Beef Report
Waterland, R.A., and R.L. Jirtle. 2004. Early nutrition, epigenetic changes at transposons and imprinted genes, en-hance susceptibility to adult chronic diseases. Nutrition. 20: 63-68.
Wu, G., F.W. Bazer, T.A. Cudd, C.J. Meininger and T.E. Spencer. 2004. Maternal nutrition and fetal develop-ment. J. of Nutrition. 9:2169-2172.
Zhang, S., T.R.H. Regnault, P.L. Barker, K.J. Botting, I.C. McMillen, C.M. McMillan, C.T. Roberts and J.L. Morrison. 2015. Placental adapta-tion in growth restriction. Nutrients. 7:360-389.
Table 4. Level of expression of nutrient transporters GLUT1, CAT-1, CAT-2 and CAT-3 in intercaruncular ICAR tissue due to CON and RES dietary treatments from d 16 to 50 of gestation and in non-pregnant (NP) controls set to 1.
P - values3
Day of Gestation2
NP 16 34 Day vs. vs. vs. x Gene1 Trt4 16 34 50 Trt5 SEM6 Preg 34 and 50 50 Day Trt Trt
GLUT1 CON 2.44 0.63 1.77 1.61 0.39 0.43 < 0.01 0.10 < 0.01 0.26 0.42 RES 1.77 0.87 1.08 1.24 Day7 2.11g 0.75h 1.43gh
CAT-1 CON 0.65 13.86 9.94 8.15 2.59 < 0.01 < 0.01 0.13 < 0.01 0.56 0.89 RES 0.51 15.37 12.33 9.41 Day 0.58h 14.62g 11.13g
CAT-2 CON 6.83ab 2.31c 7.78a 5.64 1.43 0.04 0.88 0.56 0.22 0.68 0.01 RES 3.10bc 6.08abc 3.17bc 4.11 Day 4.97 4.19 5.48
CAT-3 CON 9.69 1.55 5.53 5.59 1.89 0.09 0.12 0.27 0.13 0.45 0.09 RES 3.87 4.25 5.05 4.39 Day 6.78 2.90 5.29
1Gene = GLUT1 – Glucose transporter solute carrier family 2 member 1. CAT-1, CAT-2, and CAT-3 – Cationic amino acid transporters of arginine and lysine, solute carrier family 7 member 1, 2, and 3.2Day of Gestation = number of days after insemination. Each gene expression is given as a fold change in relation to NP level of expression set to 1.3Probability values for effect of d, treatment, and day × treatment on level of expression of individual genes. Probability values for the contrast of mRNA level of expression of NP vs. Preg (all days of gestation), d 16 of gestation vs. d 34 and 50 of gestation, and d 34 vs. d 50 of gestation. 4CON = Heifers fed a diet that meets 100% of NRC requirements to gain 1 pound daily. RES = Heifers restricted to 60% of CON diet.5Mean level of expression of treatment group across day of gestation within tissue and gene of interest.6Average SEM was used within gene. NP n = 6, d 16 CON n = 7, d 16 RES n = 7, d 34 CON n = 6, d 34 RES n = 9, d 50 CON n = 7, d 50 RES n = 77Mean level of expression across treatment within day and gene of interest.a-cMeans within gene and tissue without a common superscript differ in day × treatment (P ≤ 0.05).g-hMeans within row without a common superscript differ in main effect of day (P ≤ 0.05).
2016 North Dakota Beef Report 71
Effects of cold temperatures on feed intake in beef cowsJessica R. Schneider1, Marc L. Bauer1, Kendall C. Swanson1, Trent C. Gilbery1, Sarah R. Underdahl1 and Kimberly A. Vonnahme1
1Department of Animal Sciences, NDSU
The objective of this study was to measure the response in intake by cows fed a forage-based diet to cold temperatures. Results indicate cows ate more as the temperature declined during months when they were acclimating to the cold temperature. When cows were acclimated to the cold temperature, intake changed little across temperatures. Cows ate more during warmer temperatures in February, which was the opposite of earlier months. This may not be completely due to temperature because cows were in late pregnancy at this time as well.
SummaryForty-seven pregnant beef cows
(1,453 pounds of body weight) were fed initially a diet (6.7 percent crude protein) of 45 percent grass hay, 45 percent wheat straw and 10 percent partially de-sugared molas-ses. One group was supplemented with dry-rolled corn at 0.3 percent of body weight, and the other was just fed the hay-based diet. All cows wore radio-frequency identification tags to monitor individual intake. Feed intake of cows was measured in November, December, January and February (115 to 224 days of gestation). Cows fed the control diet gained 1.0 pound/day and lost 0.2 body condition score units (9-point scale). Cows fed supplement gained 1.5 pounds/day and 0.2 score units. In November and December, intake increased due to temperatures getting colder (P < 0.01). In Janu-ary, feed intake did not respond to temperature change (P = 0.07). In February, feed intake increased when the temperature warmed (P < 0.01). During January and Febru-ary, the cows’ response to colder
temperatures was different than in November and December. We hypothesize these differences were because cows had longer to become acclimatized to colder temperatures, having thicker hair coats and higher metabolism rates.
IntroductionTemperatures have been shown
to affect feed intake of beef cattle when they move toward extremes of heat or cold. Outside the range of 59 to 77 F, cattle try to maintain their critical temperatures by heating or cooling. Effects are more likely to be shown if the environmental changes are through time because daily in-take is more variable as the result of many factors.
In temperatures below 59 F, in-take will increase gradually to pro-vide more heat to the animal’s core. Above 77 F, the animal will reduce feed intake to reduce internal heat.
Acclimation to colder tempera-tures happens in a few ways. As days grow shorter, the coats of cattle will grow thicker, adding insulation, to keep the internal temperature steady. But while the coat is grow-
ing, feed intake will need to pro-duce the extra heat. Once the coat is grown in and body temp stabilizes, intake will level off. We hypoth-esized that beef cows will increase their feed intake as temperatures become colder.
Experimental ProceduresForty-seven pregnant beef cows
(Angus cross) were housed at the NDSU Beef Cattle Research Com-plex and were part of an experi-ment measuring the effect of corn supplementation on blood flow to the uterus and development of the calf, including lifetime effects on growth, carcass and meat traits. The cow’s starting average body weight was 1,453 pounds and average body condition score was 5.2 on a 9-point scale.
Cows were weighed monthly throughout the duration of the study. The starting diet (dry basis) consisted of 45 percent grass hay, 45 percent wheat straw and 10 percent partially de-sugared beet molasses. The diet contained 6.7 percent crude protein (CP), 67 percent neutral de-tergent fiber (NDF), 42 percent acid detergent fiber (ADF), 0.37 percent calcium (Ca) and 0.12 percent phos-phorus (P).
After Dec. 2, the diet changed to 60 percent grass hay, 30 percent wheat straw and 10 percent par-tially de-sugared beet molasses. The new analysis was 7.0 percent CP, 65 percent NDF, 38 percent ADF, 0.33 percent Ca and 0.14 percent P. One group was supplemented with dry-rolled corn at 0.3 percent of body weight and the other was just fed the hay-based diet.
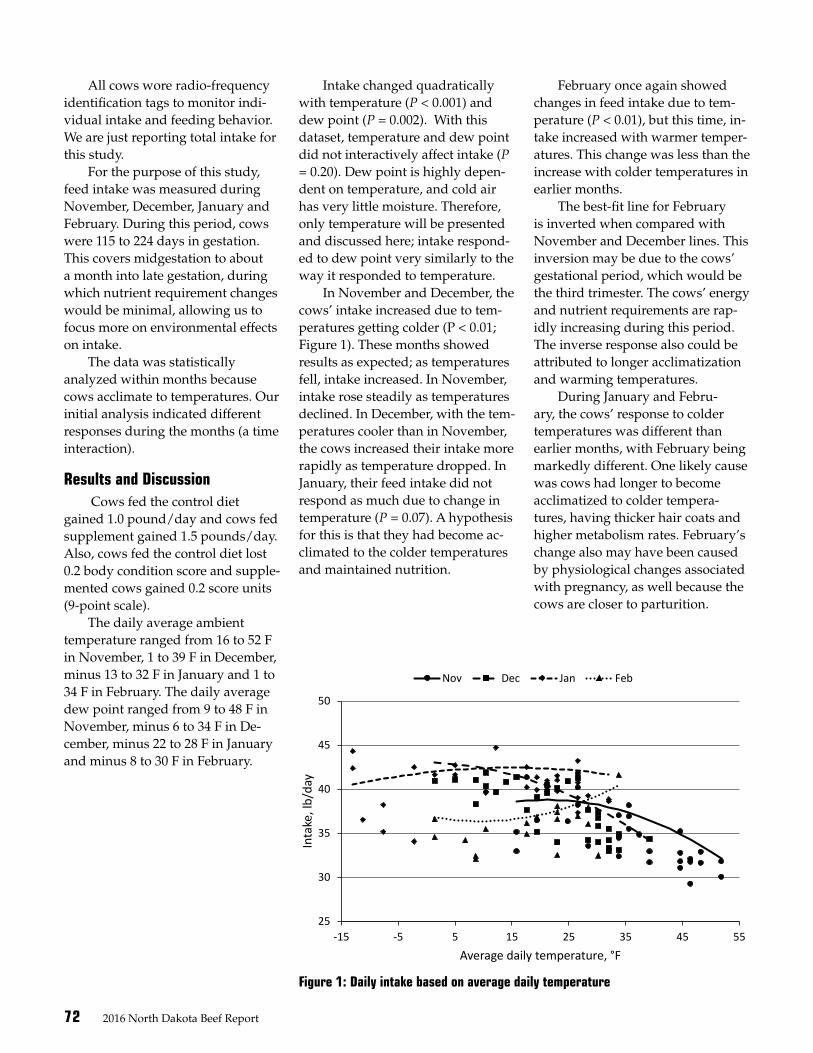
72 2016 North Dakota Beef Report
All cows wore radio-frequency identification tags to monitor indi-vidual intake and feeding behavior. We are just reporting total intake for this study.
For the purpose of this study, feed intake was measured during November, December, January and February. During this period, cows were 115 to 224 days in gestation. This covers midgestation to about a month into late gestation, during which nutrient requirement changes would be minimal, allowing us to focus more on environmental effects on intake.
The data was statistically analyzed within months because cows acclimate to temperatures. Our initial analysis indicated different responses during the months (a time interaction).
Results and Discussion Cows fed the control diet
gained 1.0 pound/day and cows fed supplement gained 1.5 pounds/day. Also, cows fed the control diet lost 0.2 body condition score and supple-mented cows gained 0.2 score units (9-point scale).
The daily average ambient temperature ranged from 16 to 52 F in November, 1 to 39 F in December, minus 13 to 32 F in January and 1 to 34 F in February. The daily average dew point ranged from 9 to 48 F in November, minus 6 to 34 F in De-cember, minus 22 to 28 F in January and minus 8 to 30 F in February.
Intake changed quadratically with temperature (P < 0.001) and dew point (P = 0.002). With this dataset, temperature and dew point did not interactively affect intake (P = 0.20). Dew point is highly depen-dent on temperature, and cold air has very little moisture. Therefore, only temperature will be presented and discussed here; intake respond-ed to dew point very similarly to the way it responded to temperature.
In November and December, the cows’ intake increased due to tem-peratures getting colder (P < 0.01; Figure 1). These months showed results as expected; as temperatures fell, intake increased. In November, intake rose steadily as temperatures declined. In December, with the tem-peratures cooler than in November, the cows increased their intake more rapidly as temperature dropped. In January, their feed intake did not respond as much due to change in temperature (P = 0.07). A hypothesis for this is that they had become ac-climated to the colder temperatures and maintained nutrition.
Figure 1: Daily intake based on average daily temperature
Figure 1: Daily intake based on average daily temperature
25
30
35
40
45
50
-15 -5 5 15 25 35 45 55
Inta
ke, l
b/da
y
Average daily temperature, °F
Nov Dec Jan Feb
February once again showed changes in feed intake due to tem-perature (P < 0.01), but this time, in-take increased with warmer temper-atures. This change was less than the increase with colder temperatures in earlier months.
The best-fit line for February is inverted when compared with November and December lines. This inversion may be due to the cows’ gestational period, which would be the third trimester. The cows’ energy and nutrient requirements are rap-idly increasing during this period. The inverse response also could be attributed to longer acclimatization and warming temperatures.
During January and Febru-ary, the cows’ response to colder temperatures was different than earlier months, with February being markedly different. One likely cause was cows had longer to become acclimatized to colder tempera-tures, having thicker hair coats and higher metabolism rates. February’s change also may have been caused by physiological changes associated with pregnancy, as well because the cows are closer to parturition.
2016 North Dakota Beef Report 73
Frequency of supplement delivery to cows on corn residueMichael Undi1, Bryan W. Neville1, Fara A. Brummer1 and Stephanie M. Gross1
Central Grasslands Research Extension Center, NDSU
Methods of supplementing grazing cattle in winter should aim to reduce winter feed costs, which are the single highest annual cost in a cow-calf operation. This study examined the effect of daily, every third day and every sixth day supplement delivery on the performance of cows grazing corn residue. Supplements such as distillers dried grains with solubles (DDGS) can be fed every third day with no detrimental effects on animal performance.
SummaryThis study was conducted to
evaluate the effects of the frequency of delivering distillers dried grains with solubles (DDGS) as a supple-ment to cows grazing corn residue in the northern Great Plains. The 36-day study was conducted in the fall of 2015, with 80 first- and second-calf cows (1,146 ± 76 pounds body weight [BW]) in their second trimester. Ten cows were assigned to one of eight 10-acre paddocks of corn residue. Four treatments with two replications per treatment were: 1) grazing corn residue with no supplementation (control), 2) graz-ing corn residue plus DDGS deliv-ered daily (daily), 3) grazing corn residue plus DDGS delivered every third day (3 d) and 4) grazing corn residue plus DDGS delivered every sixth day (6 d). The DDGS was fed at 0.35 percent BW per day. Body weight and body condition scores were recorded on two consecutive days at the beginning and end of the study. Gusty winds in excess of 60 mph prior to harvest resulted in approximately 890 pounds/acre of corn grain on the ground. Above-normal temperatures were encountered through the six-week
course of the study. Average daily gain was greater (P < 0.05) follow-ing daily (3.5 ± 0.26 pounds) and every third day supplement deliv-ery (3.6 ± 0.26 pounds) relative to control (2.7 ± 0.26 pounds) or every sixth day supplement delivery (2.6 ± 0.26 pounds). Body condition score change was greater (P < 0.05) following daily supplement de-livery (0.7 ± 0.08) relative to every sixth day supplement delivery (0.4 ± 0.08). Results show that, under certain conditions such as mild weather and excessive grain drop, cows grazing corn residue may not require supplementation until later in the grazing season. Secondly, supplement can be fed every third day with no detrimental effects on animal performance.
IntroductionCorn residue, which includes
dropped ears, leaves and husks, and stalks remaining after the corn harvest, is a readily available feed resource for winter grazing in corn-growing areas of North Dakota (Lardy, 2011), but the low protein and mineral contents of corn residue can lead to poor animal perfor-mance. Improving the nutrient supply to cows grazing corn residue can be accomplished by targeted
supplementation that provides miss-ing nutrients in corn residue.
For supplements such as distill-ers grains with solubles (DDGS) that can be fed in loose form, the most common practice is to feed the supplement daily. Producers are interested in supplement delivery methods that reduce labor costs, as is the case when delivering the supplement less frequently.
Reducing supplement delivery frequency can reduce labor and fuel costs, provided animals continue to consume feed and maintain good nutrient status (Schauer et al., 2005). Also, reducing the frequency of supplement delivery may improve forage utilization because animals spend less time at the feeding trough (Brundyn et al., 2005).
Several studies (Brundyn et al., 2005; Schauer et al., 2005; Loy et al., 2007; Canesin et al., 2014; Klein et al., 2014) have demonstrated the benefits of reducing the frequency of supplement delivery to grazing ani-mals. These studies were conducted in warm-weather grazing situations.
Winters in North Dakota, char-acterized by cold temperatures, low wind chills and freezing rain, offer unique challenges that need to be taken into account when evaluat-ing supplements for winter grazing. This study was conducted to evalu-ate the effect of frequency of supple-ment delivery to cows grazing corn residue on animal performance in a northern climate.
Experimental ProceduresAnimal handling and care
procedures were approved by the NDSU Animal Care and Use Com-mittee. This study was conducted in the fall of 2015 (Nov. 9 to Dec. 16) at
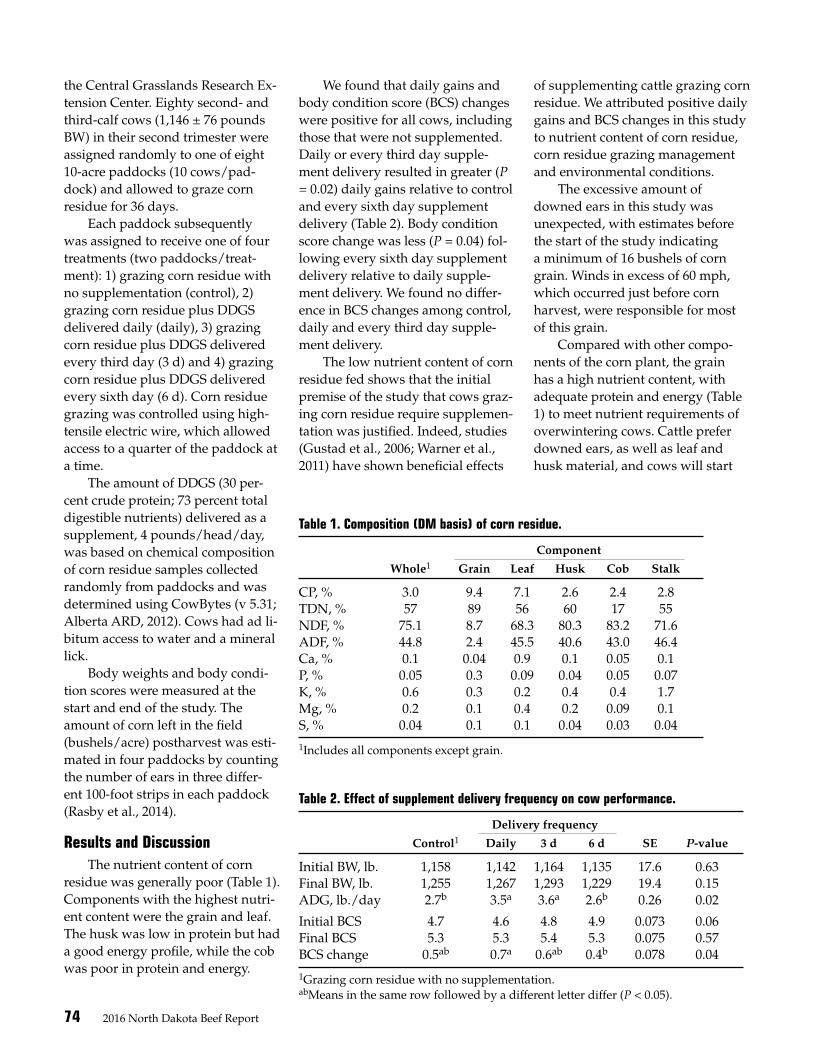
74 2016 North Dakota Beef Report
the Central Grasslands Research Ex-tension Center. Eighty second- and third-calf cows (1,146 ± 76 pounds BW) in their second trimester were assigned randomly to one of eight 10-acre paddocks (10 cows/pad-dock) and allowed to graze corn residue for 36 days.
Each paddock subsequently was assigned to receive one of four treatments (two paddocks/treat-ment): 1) grazing corn residue with no supplementation (control), 2) grazing corn residue plus DDGS delivered daily (daily), 3) grazing corn residue plus DDGS delivered every third day (3 d) and 4) grazing corn residue plus DDGS delivered every sixth day (6 d). Corn residue grazing was controlled using high-tensile electric wire, which allowed access to a quarter of the paddock at a time.
The amount of DDGS (30 per-cent crude protein; 73 percent total digestible nutrients) delivered as a supplement, 4 pounds/head/day, was based on chemical composition of corn residue samples collected randomly from paddocks and was determined using CowBytes (v 5.31; Alberta ARD, 2012). Cows had ad li-bitum access to water and a mineral lick.
Body weights and body condi-tion scores were measured at the start and end of the study. The amount of corn left in the field (bushels/acre) postharvest was esti-mated in four paddocks by counting the number of ears in three differ-ent 100-foot strips in each paddock (Rasby et al., 2014).
Results and DiscussionThe nutrient content of corn
residue was generally poor (Table 1). Components with the highest nutri-ent content were the grain and leaf. The husk was low in protein but had a good energy profile, while the cob was poor in protein and energy.
We found that daily gains and body condition score (BCS) changes were positive for all cows, including those that were not supplemented. Daily or every third day supple-ment delivery resulted in greater (P = 0.02) daily gains relative to control and every sixth day supplement delivery (Table 2). Body condition score change was less (P = 0.04) fol-lowing every sixth day supplement delivery relative to daily supple-ment delivery. We found no differ-ence in BCS changes among control, daily and every third day supple-ment delivery.
The low nutrient content of corn residue fed shows that the initial premise of the study that cows graz-ing corn residue require supplemen-tation was justified. Indeed, studies (Gustad et al., 2006; Warner et al., 2011) have shown beneficial effects
of supplementing cattle grazing corn residue. We attributed positive daily gains and BCS changes in this study to nutrient content of corn residue, corn residue grazing management and environmental conditions.
The excessive amount of downed ears in this study was unexpected, with estimates before the start of the study indicating a minimum of 16 bushels of corn grain. Winds in excess of 60 mph, which occurred just before corn harvest, were responsible for most of this grain.
Compared with other compo-nents of the corn plant, the grain has a high nutrient content, with adequate protein and energy (Table 1) to meet nutrient requirements of overwintering cows. Cattle prefer downed ears, as well as leaf and husk material, and cows will start
Table 1. Composition (DM basis) of corn residue.
Component
Whole1 Grain Leaf Husk Cob Stalk
CP, % 3.0 9.4 7.1 2.6 2.4 2.8TDN, % 57 89 56 60 17 55NDF, % 75.1 8.7 68.3 80.3 83.2 71.6ADF, % 44.8 2.4 45.5 40.6 43.0 46.4Ca, % 0.1 0.04 0.9 0.1 0.05 0.1P, % 0.05 0.3 0.09 0.04 0.05 0.07K, % 0.6 0.3 0.2 0.4 0.4 1.7Mg, % 0.2 0.1 0.4 0.2 0.09 0.1S, % 0.04 0.1 0.1 0.04 0.03 0.04
1Includes all components except grain.
Table 2. Effect of supplement delivery frequency on cow performance.
Delivery frequency
Control1 Daily 3 d 6 d SE P-value
Initial BW, lb. 1,158 1,142 1,164 1,135 17.6 0.63Final BW, lb. 1,255 1,267 1,293 1,229 19.4 0.15ADG, lb./day 2.7b 3.5a 3.6a 2.6b 0.26 0.02
Initial BCS 4.7 4.6 4.8 4.9 0.073 0.06Final BCS 5.3 5.3 5.4 5.3 0.075 0.57BCS change 0.5ab 0.7a 0.6ab 0.4b 0.078 0.04
1Grazing corn residue with no supplementation.abMeans in the same row followed by a different letter differ (P < 0.05).
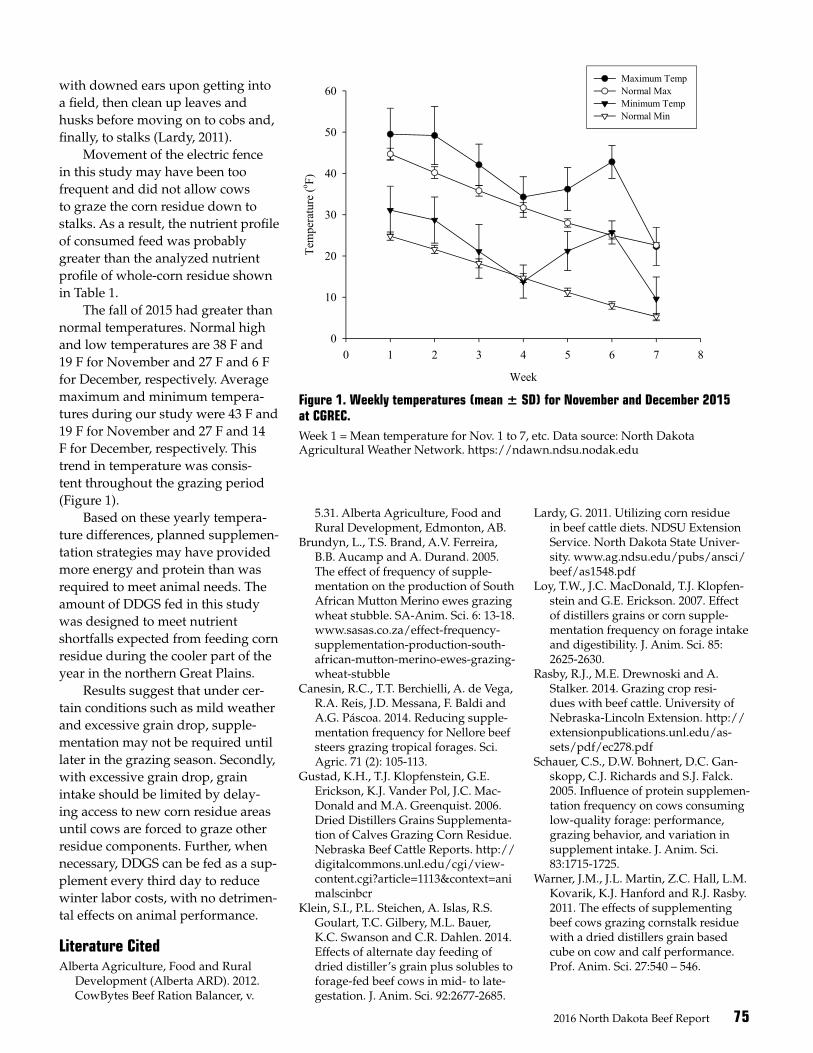
2016 North Dakota Beef Report 75
with downed ears upon getting into a field, then clean up leaves and husks before moving on to cobs and, finally, to stalks (Lardy, 2011).
Movement of the electric fence in this study may have been too frequent and did not allow cows to graze the corn residue down to stalks. As a result, the nutrient profile of consumed feed was probably greater than the analyzed nutrient profile of whole-corn residue shown in Table 1.
The fall of 2015 had greater than normal temperatures. Normal high and low temperatures are 38 F and 19 F for November and 27 F and 6 F for December, respectively. Average maximum and minimum tempera-tures during our study were 43 F and 19 F for November and 27 F and 14 F for December, respectively. This trend in temperature was consis-tent throughout the grazing period (Figure 1).
Based on these yearly tempera-ture differences, planned supplemen-tation strategies may have provided more energy and protein than was required to meet animal needs. The amount of DDGS fed in this study was designed to meet nutrient shortfalls expected from feeding corn residue during the cooler part of the year in the northern Great Plains.
Results suggest that under cer-tain conditions such as mild weather and excessive grain drop, supple-mentation may not be required until later in the grazing season. Secondly, with excessive grain drop, grain intake should be limited by delay-ing access to new corn residue areas until cows are forced to graze other residue components. Further, when necessary, DDGS can be fed as a sup-plement every third day to reduce winter labor costs, with no detrimen-tal effects on animal performance.
Literature CitedAlberta Agriculture, Food and Rural
Development (Alberta ARD). 2012. CowBytes Beef Ration Balancer, v.
Figure 1. Weekly temperatures (mean ± SD) for November and December 2015 at CGREC. Week 1 = Mean temperature for Nov. 1 to 7, etc. Data source: North Dakota Agricultural Weather Network. https://ndawn.ndsu.nodak.edu
9
Week
0 1 2 3 4 5 6 7 8
Tem
pera
ture
(o F)
0
10
20
30
40
50
60Maximum Temp Normal MaxMinimum TempNormal Min
Figure 1. Weekly temperatures (mean ± SD) for November and December 2015 at CGREC.
Week 1 = Mean temperature for Nov. 1 to 7, etc. Data source: North Dakota Agricultural Weather Network. https://ndawn.ndsu.nodak.edu
5.31. Alberta Agriculture, Food and Rural Development, Edmonton, AB.
Brundyn, L., T.S. Brand, A.V. Ferreira, B.B. Aucamp and A. Durand. 2005. The effect of frequency of supple-mentation on the production of South African Mutton Merino ewes grazing wheat stubble. SA-Anim. Sci. 6: 13-18. www.sasas.co.za/effect-frequency-supplementation-production-south-african-mutton-merino-ewes-grazing-wheat-stubble
Canesin, R.C., T.T. Berchielli, A. de Vega, R.A. Reis, J.D. Messana, F. Baldi and A.G. Páscoa. 2014. Reducing supple-mentation frequency for Nellore beef steers grazing tropical forages. Sci. Agric. 71 (2): 105-113.
Gustad, K.H., T.J. Klopfenstein, G.E. Erickson, K.J. Vander Pol, J.C. Mac-Donald and M.A. Greenquist. 2006. Dried Distillers Grains Supplementa-tion of Calves Grazing Corn Residue. Nebraska Beef Cattle Reports. http://digitalcommons.unl.edu/cgi/view-content.cgi?article=1113&context=animalscinbcr
Klein, S.I., P.L. Steichen, A. Islas, R.S. Goulart, T.C. Gilbery, M.L. Bauer, K.C. Swanson and C.R. Dahlen. 2014. Effects of alternate day feeding of dried distiller’s grain plus solubles to forage-fed beef cows in mid- to late-gestation. J. Anim. Sci. 92:2677-2685.
Lardy, G. 2011. Utilizing corn residue in beef cattle diets. NDSU Extension Service. North Dakota State Univer-sity. www.ag.ndsu.edu/pubs/ansci/beef/as1548.pdf
Loy, T.W., J.C. MacDonald, T.J. Klopfen-stein and G.E. Erickson. 2007. Effect of distillers grains or corn supple-mentation frequency on forage intake and digestibility. J. Anim. Sci. 85: 2625-2630.
Rasby, R.J., M.E. Drewnoski and A. Stalker. 2014. Grazing crop resi-dues with beef cattle. University of Nebraska-Lincoln Extension. http://extensionpublications.unl.edu/as-sets/pdf/ec278.pdf
Schauer, C.S., D.W. Bohnert, D.C. Gan-skopp, C.J. Richards and S.J. Falck. 2005. Influence of protein supplemen-tation frequency on cows consuming low-quality forage: performance, grazing behavior, and variation in supplement intake. J. Anim. Sci. 83:1715-1725.
Warner, J.M., J.L. Martin, Z.C. Hall, L.M. Kovarik, K.J. Hanford and R.J. Rasby. 2011. The effects of supplementing beef cows grazing cornstalk residue with a dried distillers grain based cube on cow and calf performance. Prof. Anim. Sci. 27:540 – 546.
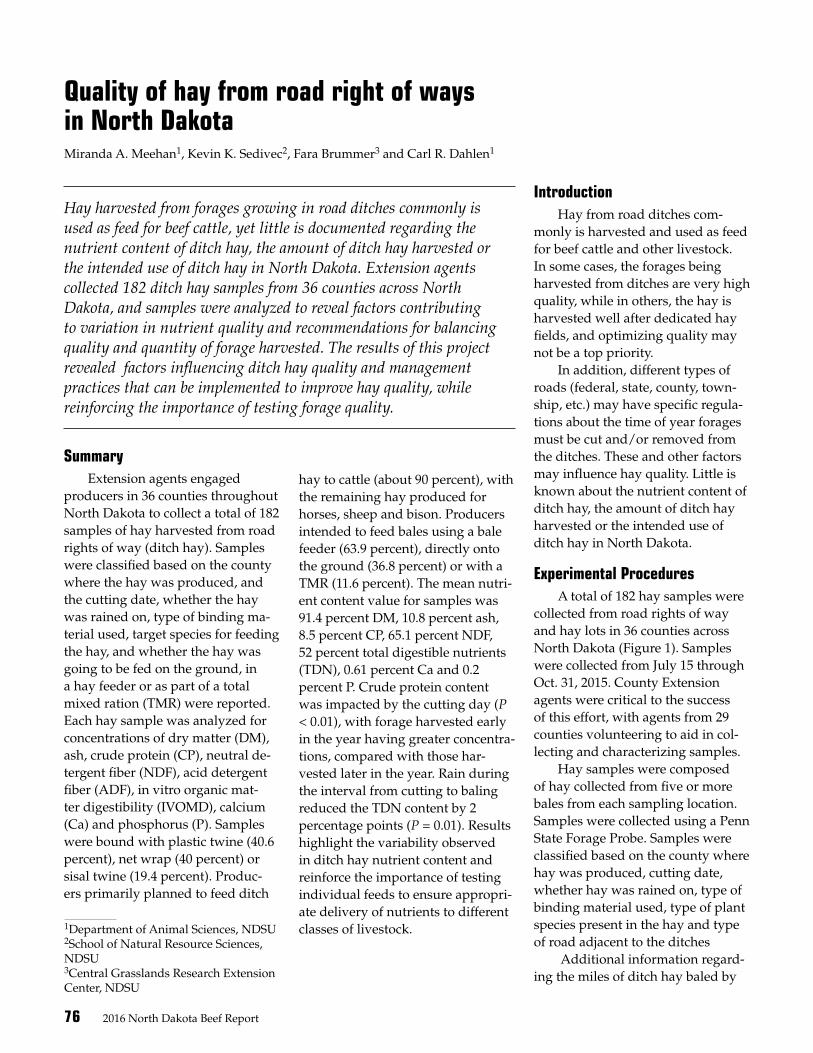
76 2016 North Dakota Beef Report
Quality of hay from road right of ways in North DakotaMiranda A. Meehan1, Kevin K. Sedivec2, Fara Brummer3 and Carl R. Dahlen1
1Department of Animal Sciences, NDSU 2School of Natural Resource Sciences, NDSU 3Central Grasslands Research Extension Center, NDSU
Hay harvested from forages growing in road ditches commonly is used as feed for beef cattle, yet little is documented regarding the nutrient content of ditch hay, the amount of ditch hay harvested or the intended use of ditch hay in North Dakota. Extension agents collected 182 ditch hay samples from 36 counties across North Dakota, and samples were analyzed to reveal factors contributing to variation in nutrient quality and recommendations for balancing quality and quantity of forage harvested. The results of this project revealed factors influencing ditch hay quality and management practices that can be implemented to improve hay quality, while reinforcing the importance of testing forage quality.
SummaryExtension agents engaged
producers in 36 counties throughout North Dakota to collect a total of 182 samples of hay harvested from road rights of way (ditch hay). Samples were classified based on the county where the hay was produced, and the cutting date, whether the hay was rained on, type of binding ma-terial used, target species for feeding the hay, and whether the hay was going to be fed on the ground, in a hay feeder or as part of a total mixed ration (TMR) were reported. Each hay sample was analyzed for concentrations of dry matter (DM), ash, crude protein (CP), neutral de-tergent fiber (NDF), acid detergent fiber (ADF), in vitro organic mat-ter digestibility (IVOMD), calcium (Ca) and phosphorus (P). Samples were bound with plastic twine (40.6 percent), net wrap (40 percent) or sisal twine (19.4 percent). Produc-ers primarily planned to feed ditch
hay to cattle (about 90 percent), with the remaining hay produced for horses, sheep and bison. Producers intended to feed bales using a bale feeder (63.9 percent), directly onto the ground (36.8 percent) or with a TMR (11.6 percent). The mean nutri-ent content value for samples was 91.4 percent DM, 10.8 percent ash, 8.5 percent CP, 65.1 percent NDF, 52 percent total digestible nutrients (TDN), 0.61 percent Ca and 0.2 percent P. Crude protein content was impacted by the cutting day (P < 0.01), with forage harvested early in the year having greater concentra-tions, compared with those har-vested later in the year. Rain during the interval from cutting to baling reduced the TDN content by 2 percentage points (P = 0.01). Results highlight the variability observed in ditch hay nutrient content and reinforce the importance of testing individual feeds to ensure appropri-ate delivery of nutrients to different classes of livestock.
IntroductionHay from road ditches com-
monly is harvested and used as feed for beef cattle and other livestock. In some cases, the forages being harvested from ditches are very high quality, while in others, the hay is harvested well after dedicated hay fields, and optimizing quality may not be a top priority.
In addition, different types of roads (federal, state, county, town-ship, etc.) may have specific regula-tions about the time of year forages must be cut and/or removed from the ditches. These and other factors may influence hay quality. Little is known about the nutrient content of ditch hay, the amount of ditch hay harvested or the intended use of ditch hay in North Dakota.
Experimental ProceduresA total of 182 hay samples were
collected from road rights of way and hay lots in 36 counties across North Dakota (Figure 1). Samples were collected from July 15 through Oct. 31, 2015. County Extension agents were critical to the success of this effort, with agents from 29 counties volunteering to aid in col-lecting and characterizing samples.
Hay samples were composed of hay collected from five or more bales from each sampling location. Samples were collected using a Penn State Forage Probe. Samples were classified based on the county where hay was produced, cutting date, whether hay was rained on, type of binding material used, type of plant species present in the hay and type of road adjacent to the ditches
Additional information regard-ing the miles of ditch hay baled by
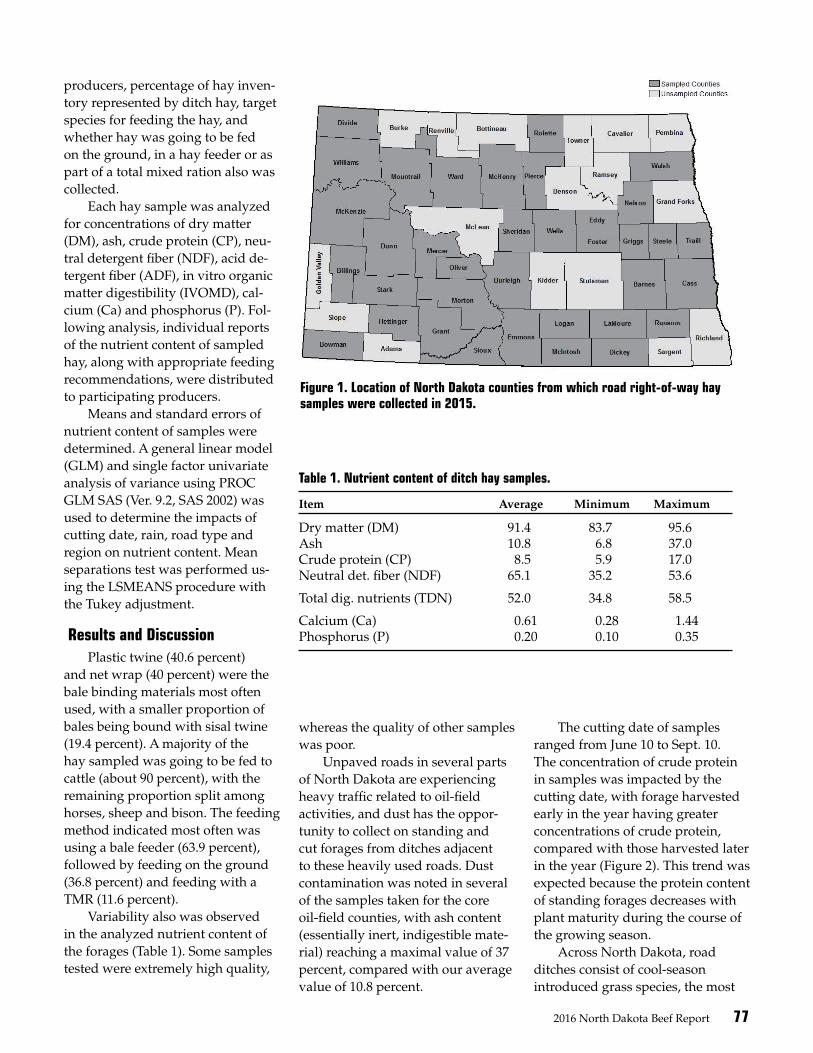
2016 North Dakota Beef Report 77
producers, percentage of hay inven-tory represented by ditch hay, target species for feeding the hay, and whether hay was going to be fed on the ground, in a hay feeder or as part of a total mixed ration also was collected.
Each hay sample was analyzed for concentrations of dry matter (DM), ash, crude protein (CP), neu-tral detergent fiber (NDF), acid de-tergent fiber (ADF), in vitro organic matter digestibility (IVOMD), cal-cium (Ca) and phosphorus (P). Fol-lowing analysis, individual reports of the nutrient content of sampled hay, along with appropriate feeding recommendations, were distributed to participating producers.
Means and standard errors of nutrient content of samples were determined. A general linear model (GLM) and single factor univariate analysis of variance using PROC GLM SAS (Ver. 9.2, SAS 2002) was used to determine the impacts of cutting date, rain, road type and region on nutrient content. Mean separations test was performed us-ing the LSMEANS procedure with the Tukey adjustment.
Results and DiscussionPlastic twine (40.6 percent)
and net wrap (40 percent) were the bale binding materials most often used, with a smaller proportion of bales being bound with sisal twine (19.4 percent). A majority of the hay sampled was going to be fed to cattle (about 90 percent), with the remaining proportion split among horses, sheep and bison. The feeding method indicated most often was using a bale feeder (63.9 percent), followed by feeding on the ground (36.8 percent) and feeding with a TMR (11.6 percent).
Variability also was observed in the analyzed nutrient content of the forages (Table 1). Some samples tested were extremely high quality,
whereas the quality of other samples was poor.
Unpaved roads in several parts of North Dakota are experiencing heavy traffic related to oil-field activities, and dust has the oppor-tunity to collect on standing and cut forages from ditches adjacent to these heavily used roads. Dust contamination was noted in several of the samples taken for the core oil-field counties, with ash content (essentially inert, indigestible mate-rial) reaching a maximal value of 37 percent, compared with our average value of 10.8 percent.
The cutting date of samples ranged from June 10 to Sept. 10. The concentration of crude protein in samples was impacted by the cutting date, with forage harvested early in the year having greater concentrations of crude protein, compared with those harvested later in the year (Figure 2). This trend was expected because the protein content of standing forages decreases with plant maturity during the course of the growing season.
Across North Dakota, road ditches consist of cool-season introduced grass species, the most
Figure 1. Location of North Dakota counties from which road right-of-way hay samples were collected in 2015.
others, the hay is harvested well after dedicated hay fields, and optimizing quality may not be a top priority.
In addition, different types of roads (federal, state, county, township, etc.) may have specific regulations about the time of year forages must be cut and/or removed from the ditches. These and other factors may influence hay quality. Little is known about the nutrient content of ditch hay, the amount of ditch hay harvested or the intended use of ditch hay in North Dakota.
Experimental Procedures
A total of 182 hay samples were collected from road rights of way and hay lots in 36 counties across North Dakota (Figure 1). Samples were collected from July 15 through Oct. 31, 2015. County Extension agents were critical to the success of this effort, with agents from 29 counties volunteering to aid in collecting and characterizing samples.
Figure 1. Location of North Dakota counties from which road right-of-way hay samples were collected in 2015.
Hay samples were composed of hay collected from five or more bales from each sampling location. Samples were collected using a Penn State Forage Probe. Samples were classified based on the county where hay was produced, cutting date, whether hay was rained on, type of binding material used, type of plant species present in the hay and type of road adjacent to the ditches
Table 1. Nutrient content of ditch hay samples.
Item Average Minimum Maximum
Dry matter (DM) 91.4 83.7 95.6Ash 10.8 6.8 37.0Crude protein (CP) 8.5 5.9 17.0Neutral det. fiber (NDF) 65.1 35.2 53.6
Total dig. nutrients (TDN) 52.0 34.8 58.5
Calcium (Ca) 0.61 0.28 1.44Phosphorus (P) 0.20 0.10 0.35
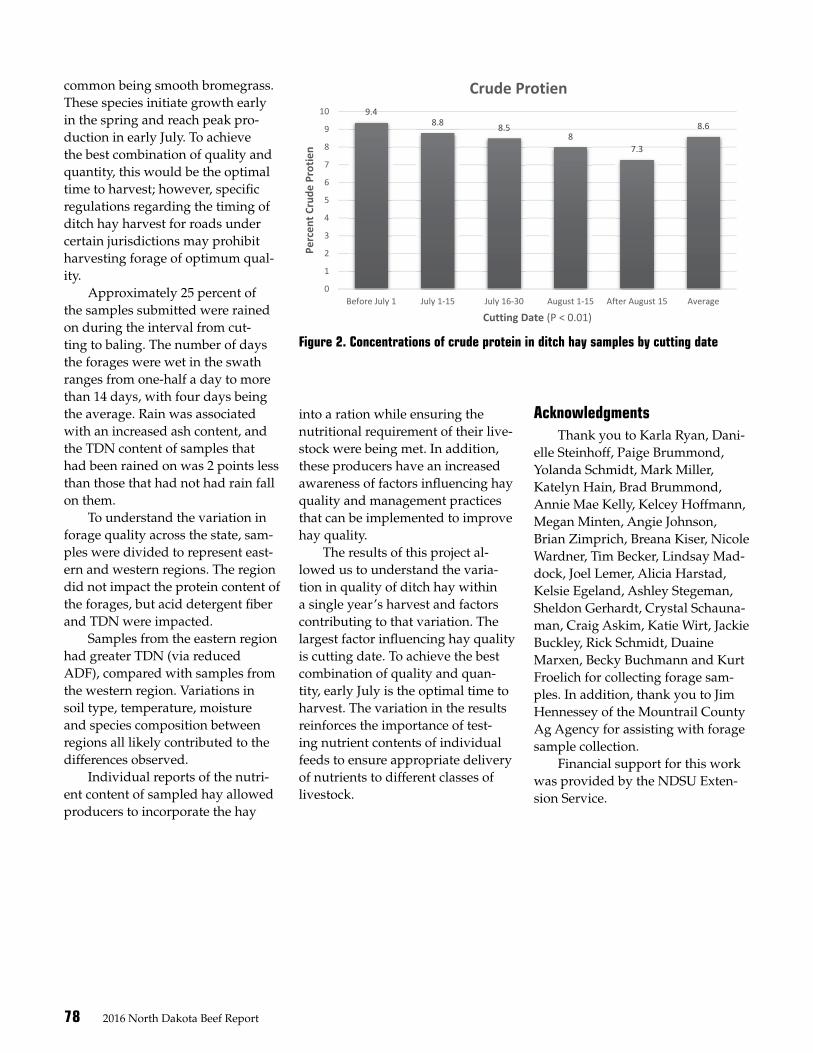
78 2016 North Dakota Beef Report
common being smooth bromegrass. These species initiate growth early in the spring and reach peak pro-duction in early July. To achieve the best combination of quality and quantity, this would be the optimal time to harvest; however, specific regulations regarding the timing of ditch hay harvest for roads under certain jurisdictions may prohibit harvesting forage of optimum qual-ity.
Approximately 25 percent of the samples submitted were rained on during the interval from cut-ting to baling. The number of days the forages were wet in the swath ranges from one-half a day to more than 14 days, with four days being the average. Rain was associated with an increased ash content, and the TDN content of samples that had been rained on was 2 points less than those that had not had rain fall on them.
To understand the variation in forage quality across the state, sam-ples were divided to represent east-ern and western regions. The region did not impact the protein content of the forages, but acid detergent fiber and TDN were impacted.
Samples from the eastern region had greater TDN (via reduced ADF), compared with samples from the western region. Variations in soil type, temperature, moisture and species composition between regions all likely contributed to the differences observed.
Individual reports of the nutri-ent content of sampled hay allowed producers to incorporate the hay
Figure 2. Concentrations of crude protein in ditch hay samples by cutting date
The cutting date of samples ranged from June 10 to Sept. 10. The concentration of crude
protein in samples was impacted by the cutting date, with forage harvested early in the year having greater concentrations of crude protein, compared with those harvested later in the year (Figure 2). This trend was expected because the protein content of standing forages decreases with plant maturity during the course of the growing season.
Across North Dakota, road ditches consist of cool-season introduced grass species, the most common being smooth bromegrass. These species initiate growth early in the spring and reach peak production in early July. To achieve the best combination of quality and quantity, this would be the optimal time to harvest; however, specific regulations regarding the timing of ditch hay harvest for roads under certain jurisdictions may prohibit harvesting forage of optimum quality.
Figure 2. Concentrations of crude protein in ditch hay samples by cutting date
Approximately 25 percent of the samples submitted were rained on during the interval
from cutting to baling. The number of days the forages were wet in the swath ranges from one-half a day to more than 14 days, with four days being the average. Rain was associated with an increased ash content, and the TDN content of samples that had been rained on was 2 points less than those that had not had rain fall on them.
To understand the variation in forage quality across the state, samples were divided to represent eastern and western regions. The region did not impact the protein content of the forages, but acid detergent fiber and TDN were impacted.
9.48.8 8.5
87.3
8.6
0
1
2
3
4
5
6
7
8
9
10
Before July 1 July 1-15 July 16-30 August 1-15 After August 15 AveragePe
rcen
t Cru
de P
rotie
nCutting Date (P < 0.01)
Crude Protien
into a ration while ensuring the nutritional requirement of their live-stock were being met. In addition, these producers have an increased awareness of factors influencing hay quality and management practices that can be implemented to improve hay quality.
The results of this project al-lowed us to understand the varia-tion in quality of ditch hay within a single year’s harvest and factors contributing to that variation. The largest factor influencing hay quality is cutting date. To achieve the best combination of quality and quan-tity, early July is the optimal time to harvest. The variation in the results reinforces the importance of test-ing nutrient contents of individual feeds to ensure appropriate delivery of nutrients to different classes of livestock.
AcknowledgmentsThank you to Karla Ryan, Dani-
elle Steinhoff, Paige Brummond, Yolanda Schmidt, Mark Miller, Katelyn Hain, Brad Brummond, Annie Mae Kelly, Kelcey Hoffmann, Megan Minten, Angie Johnson, Brian Zimprich, Breana Kiser, Nicole Wardner, Tim Becker, Lindsay Mad-dock, Joel Lemer, Alicia Harstad, Kelsie Egeland, Ashley Stegeman, Sheldon Gerhardt, Crystal Schauna-man, Craig Askim, Katie Wirt, Jackie Buckley, Rick Schmidt, Duaine Marxen, Becky Buchmann and Kurt Froelich for collecting forage sam-ples. In addition, thank you to Jim Hennessey of the Mountrail County Ag Agency for assisting with forage sample collection.
Financial support for this work was provided by the NDSU Exten-sion Service.
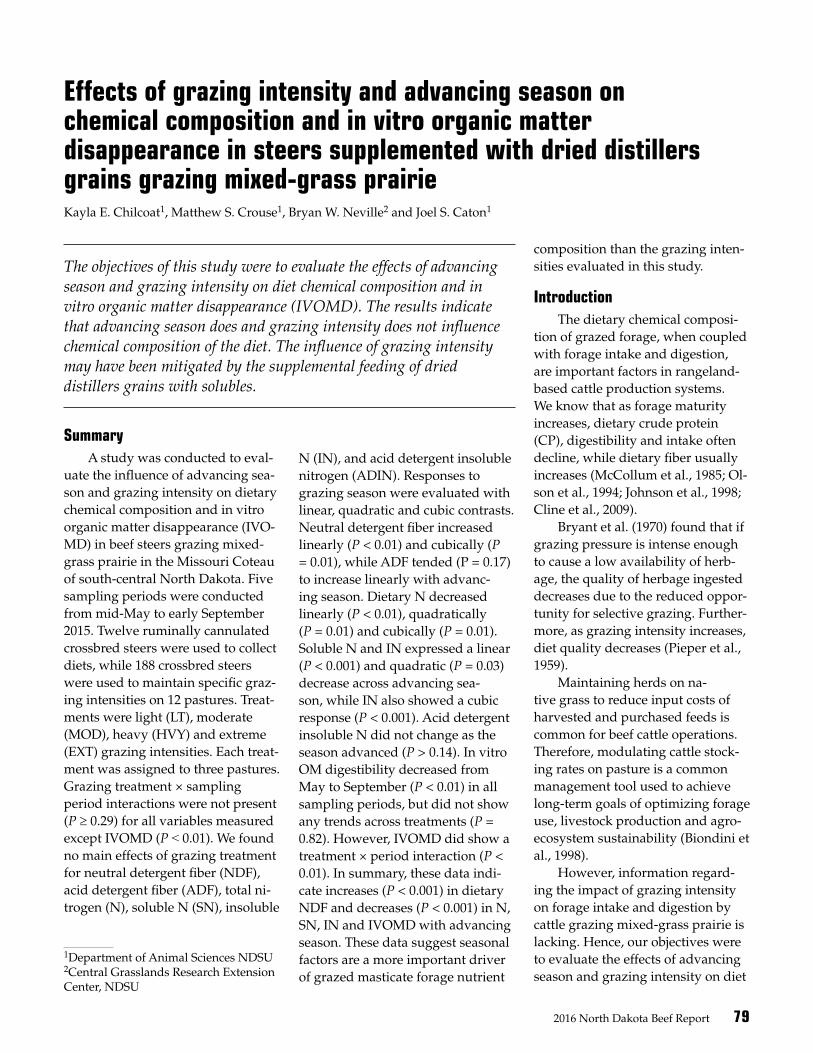
2016 North Dakota Beef Report 79
Effects of grazing intensity and advancing season on chemical composition and in vitro organic matter disappearance in steers supplemented with dried distillers grains grazing mixed-grass prairieKayla E. Chilcoat1, Matthew S. Crouse1, Bryan W. Neville2 and Joel S. Caton1
1Department of Animal Sciences NDSU 2Central Grasslands Research Extension Center, NDSU
The objectives of this study were to evaluate the effects of advancing season and grazing intensity on diet chemical composition and in vitro organic matter disappearance (IVOMD). The results indicate that advancing season does and grazing intensity does not influence chemical composition of the diet. The influence of grazing intensity may have been mitigated by the supplemental feeding of dried distillers grains with solubles.
Summary A study was conducted to eval-
uate the influence of advancing sea-son and grazing intensity on dietary chemical composition and in vitro organic matter disappearance (IVO-MD) in beef steers grazing mixed-grass prairie in the Missouri Coteau of south-central North Dakota. Five sampling periods were conducted from mid-May to early September 2015. Twelve ruminally cannulated crossbred steers were used to collect diets, while 188 crossbred steers were used to maintain specific graz-ing intensities on 12 pastures. Treat-ments were light (LT), moderate (MOD), heavy (HVY) and extreme (EXT) grazing intensities. Each treat-ment was assigned to three pastures. Grazing treatment × sampling period interactions were not present (P ≥ 0.29) for all variables measured except IVOMD (P < 0.01). We found no main effects of grazing treatment for neutral detergent fiber (NDF), acid detergent fiber (ADF), total ni-trogen (N), soluble N (SN), insoluble
N (IN), and acid detergent insoluble nitrogen (ADIN). Responses to grazing season were evaluated with linear, quadratic and cubic contrasts. Neutral detergent fiber increased linearly (P < 0.01) and cubically (P = 0.01), while ADF tended (P = 0.17) to increase linearly with advanc-ing season. Dietary N decreased linearly (P < 0.01), quadratically (P = 0.01) and cubically (P = 0.01). Soluble N and IN expressed a linear (P < 0.001) and quadratic (P = 0.03) decrease across advancing sea-son, while IN also showed a cubic response (P < 0.001). Acid detergent insoluble N did not change as the season advanced (P > 0.14). In vitro OM digestibility decreased from May to September (P < 0.01) in all sampling periods, but did not show any trends across treatments (P = 0.82). However, IVOMD did show a treatment × period interaction (P < 0.01). In summary, these data indi-cate increases (P < 0.001) in dietary NDF and decreases (P < 0.001) in N, SN, IN and IVOMD with advancing season. These data suggest seasonal factors are a more important driver of grazed masticate forage nutrient
composition than the grazing inten-sities evaluated in this study.
IntroductionThe dietary chemical composi-
tion of grazed forage, when coupled with forage intake and digestion, are important factors in rangeland-based cattle production systems. We know that as forage maturity increases, dietary crude protein (CP), digestibility and intake often decline, while dietary fiber usually increases (McCollum et al., 1985; Ol-son et al., 1994; Johnson et al., 1998; Cline et al., 2009).
Bryant et al. (1970) found that if grazing pressure is intense enough to cause a low availability of herb-age, the quality of herbage ingested decreases due to the reduced oppor-tunity for selective grazing. Further-more, as grazing intensity increases, diet quality decreases (Pieper et al., 1959).
Maintaining herds on na-tive grass to reduce input costs of harvested and purchased feeds is common for beef cattle operations. Therefore, modulating cattle stock-ing rates on pasture is a common management tool used to achieve long-term goals of optimizing forage use, livestock production and agro-ecosystem sustainability (Biondini et al., 1998).
However, information regard-ing the impact of grazing intensity on forage intake and digestion by cattle grazing mixed-grass prairie is lacking. Hence, our objectives were to evaluate the effects of advancing season and grazing intensity on diet
80 2016 North Dakota Beef Report
chemical composition and in vitro OM digestibility (IVOMD) by steers grazing mixed-grass prairie in the Missouri Coteau of south central North Dakota.
Experimental ProceduresProtocols described herein were
approved by the North Dakota State University Institutional Animal Care and Use Committee. Angus-cross beef steers (n = 188; 706 ± 77.6 pounds initial body weight [BW] were used to establish grazing pres-sure, and 12 ruminally cannulated steers (600 ± 74.1 pounds) co-grazed with the noncannulated animals.
All steers had free access to water and trace mineral salt blocks (salt 95.5 to 98.5 percent, zinc 3,500 parts per million [ppm], iron 2,000 ppm, manganese 1,800 ppm, copper 280 to 420 ppm, iodine 100 ppm and cobalt 60 ppm; American Stockman Hi-Salt with EDDI; North American Salt Co., Overland Park, Kan.).
Steers were fed dried distillers grains with solubles (DDGS) daily at sunrise at 0.3 percent of their BW. All animals were weighed every 28 days to determine gains as the grazing season progressed, as well as to adjust the DDGS fed. All steers were implanted with Revalor-G (40 milligrams [mg] of trenbolone acetate and 8 mg estradiol; Intervet Inc., Millsboro, Del.) one day before being turned out on pasture.
The grazing trial was conducted at the Central Grasslands Research Extension Center (CGREC) on the Missouri Coteau in south-central North Dakota. The study site had been divided into 12 pastures of ap-proximately 31.9 acres each in 1989. Cattle grazed from May 15 to Sept. 11, 2015. Patton and Nyren (2014) re-ported the botanical composition of the plant communities at the study site the year before this study.
The most common grasses in 2014 were Kentucky bluegrass (Poa pratensis L.), western wheatgrass
(Pascopyrum smithii A.), sun sedge (Carex inops), green needlegrass (Nassella viridula), obtuse sedge (Carex obtusata Lilj.) and blue grama (Bouteloua gracilis). Common forbs were heath aster (Symphyotrichum ericoides), common dandelion (Tarax-acum officinale) and western yarrow (Achillea millefolium L.). Buckbrush (Symphoricarpos occidentalis) was the only common shrub.
Steers were stocked at densi-ties so that at the end of the grazing season, 65 (LT), 50 (MOD), 35 (HVY) and 20 percent (EXT) of an aver-age annual above-ground biomass remained at the end of the graz-ing season. Each of the cannulated steers was assigned to a pasture at random, with each treatment hav-ing three pastures. Animals were removed at the end of the grazing season when forage utilization on half of the pastures had reached desired grazing intensity.
Five 10-day collection periods were conducted for May, June, July, August and September. Sampling periods began with collection of diet samples.
At sunrise, cannulated steers were restrained and subjected to total ruminal evacuation. Ruminal digesta was removed physically from each cannulated steer and the rumen then was double-rinsed with water to assure complete removal of contents.
Steers then were allowed to graze on their assigned pastures for 30 to 45 minutes. Then ruminal masticate samples were removed, labeled and immediately placed on ice. Previously collected ruminal contents were placed back in the animal. All samples then were fro-zen at minus 20 C for later analysis.
Masticate samples were lyophi-lized (Genesis 25LL, Virtis, Gardiner, N.Y.). Dry matter, ash and CP were determined using AOAC (1990). Neutral detergent fiber and ADF of diet samples were determined using
ANKOM procedures (ANKOM, Macedon, N.Y.). Acid detergent insoluble N was calculated as N remaining in the ADF residue.
Soluble N was extracted with 0.15 M NaCl according to the proce-dure of Waldo and Goering (1979). In vitro OM digestibilities (Tilley and Terry, 1963) were conducted to determine IVOMD. Masticate forage and ruminal fluid collected from each animal was used for in vitro determinations.
Chemical composition and IVOMD were analyzed as a re-peated measures design using a mixed model approach in SAS (SAS Inst. Inc., Cary, N.Y.). Effects for sampling period, grazing treatment and period × treatment interactions were included in the model. In the absence of interactions, orthogonal contrasts were used to determine linear, quadratic and cubic, respons-es across the grazing season (sam-pling period).
Sampling period × grazing treat-ment interactions (P ≤ 0.05) were detected for IVOMD; therefore, the simple effect means were separated using the LSMEANS statement in SAS. The procedures of SAS were used for all statistical analysis and P-values ≤ 0.05 were considered different.
Results and DiscussionNo treatment × period interac-
tions (P > 0.05) were observed for diet analyses, with the exception of interactions of IVOMD, which will be discussed later in this section. Therefore, main effect means are reported for grazing intensity treat-ment and grazing period (Table 1).
Organic matter, NDF and ADF of cattle diets were not affected (P > 0.05) by grazing intensity. Crude protein, total N, soluble N (SN), insoluble N (IN) and ADIN also did not differ among grazing intensity treatments (P > 0.05).
Table 1 shows the effects of

2016 North Dakota Beef Report 81
grazing intensity and advancing season on the chemical composi-tion of the diet as well as IVOMD. Neutral detergent fiber and ADF changed with advancing season (P < 0.01). These results coincided with Olson et al. (1994) for south-central North Dakota, Johnson et al. (1998) for western North Dakota and Mc-Collum et al. (1985) for south-central New Mexico.
Neutral detergent fiber in-creased with advancing season (P < 0.01 and P = 0.01, respectively for a linear and cubic response) and ADF tended (P = 0.17; linear) to increase as the season advanced. These responses are supported by previ-ous data from south-central North Dakota (Olson et al., 1994) and west-ern North Dakota (Johnson et al., 1998), as well as south-central New Mexico (McCollum et al., 1985); these researchers observed similar responses.
Nitrogen (percent of OM) de-creased linearly (P < 0.01), quadrati-cally (P < 0.01) and cubically (P < 0.01) as the season advanced. Typi-cally, forage masticate N concentra-tion declines with increasing forage maturity associated with advancing season. Such was the case in our study and the work of others within the region (Olson, et al., 1994; John-son, et al., 1998; Cline et al., 2009). Soluble N decreased (P < 0.01) in a linear fashion, whereas IN data were represented by declining linear, quadratic and cubic responses (P < 0.01).
McCollum et al. (1985) also found that N, SN and IN decreased with advancing grazing season. In the present study, ADIN was not im-pacted by advancing season. How-ever, Cline et al. (2009) observed an increase in ADIN from late June to mid-November.
We found a sampling period × by grazing intensity interaction (P = 0.01; Table 1) for in vitro organic matter disappearance (IVOMD); therefore, interactive means are discussed (data not shown). In vitro OM digestibility decreased from May to September (P < 0.05) in all grazing intensities. In May, IVOMD was similar across all grazing in-tensities (P > 0.05). In June, LT and MOD had greater (P < 0.05) IVOMD, compared with HVY, while EXT was similar to all grazing intensi-ties (75.7, 73.4, 62.9 and 69.1 ± 2.8 percent, respectively).
In July, LT had the lowest and HVY the greatest IVOMD (P < 0.05). In August, LT had similar (P > 0.05) IVOMD, compared with all other grazing intensities, while MOD was lower (P < 0.05) than HVY. In September, IVOMD was 52.5, 44.9, 50.3, and 42.8 ± 5.1 percent; P > 0.05) for LT, MOD, HVY and EXT grazing intensities.
Table 1. Effects of grazing intensity and advancing season on dietary chemical composition and in vitro OM digestibility (IVOMD) in steers grazing mixed-grass prairie.
Grazing Intensity (TRT)1 Grazing Period (PD)2
P-value3
TRT Item LT MOD HVY EXT SEM4 May Jun Jul Aug Sep SEM5 TRT PD × PD L Q C
No. of Observations 15 15 15 15 - 12 12 12 12 12 – – – – – – -OM, % 81.3 82.2 80.6 82.3 1.49 74.6 82.4 83.9 83.7 83.2 3.08 0.83 0.05 0.44 0.02 0.02 0.16
- - - - - - - - - - - - - - - - - - - - - - Percentage of OM - - - - - - - - - - - - - - - - - - - - - NDF 67.5 69.6 70.7 65.6 2.05 58.4 69.9 67.5 70.7 75.2 3.81 0.34 <0.01 0.89 <0.01 0.32 0.01ADF 38.5 40.2 41.5 36.1 1.85 37.2 38.5 37.1 39.5 43.1 4.05 0.25 <0.01 0.87 0.17 0.33 0.44CP 18.7 17.7 17.8 19.6 0.63 29.9 18.3 16.9 14.9 12.3 0.86 0.18 <0.01 0.63 <0.01 <0.01 <0.01N 2.99 2.84 2.85 3.14 0.10 4.78 2.92 2.70 2.38 1.97 0.14 0.18 <0.01 0.63 <0.01 <0.01 <0.01Soluble N 0.70 0.73 0.69 0.82 0.06 1.08 0.81 0.66 0.57 0.55 0.09 0.36 <0.01 0.29 <0.01 0.03 0.73Insoluble N 2.28 2.11 2.16 2.32 0.08 3.70 2.11 2.05 1.81 1.42 0.12 0.22 <0.01 0.59 <0.01 <0.01 <0.01ADIN 0.48 0.42 0.44 0.47 0.04 0.52 0.37 0.47 0.44 0.45 0.06 0.77 0.26 0.93 0.70 0.31 0.15IVOMD 60.4 62.6 63.4 60.6 2.62 75.9 70.3 62.1 52.8 47.6 3.35 0.82 <0.01 0.01 0.97 0.97 0.14
1LT = light, MOD = moderate, HVY = heavy and EXT = extreme grazing intensities.2Grazing period collections were May (May 11 to 22), Jun (June 10 to 19), Jul (July 8 to 17), Aug (Aug. 5 to 14), and Sep (Sept. 2 to 11).3Significance level of the F-test for treatment (TRT), period (PD), treatment by period (TRT × PD), linear (L), quadratic (Q) and cubic (C) effects for items.4Standard error of mean for grazing intensity, n = 15. Most conservative standard error mean values were used.5Standard error of mean for grazing period, n = 12. Most conservative standard error mean values were used.
82 2016 North Dakota Beef Report
The results of this study dem-onstrate that grazed forage by beef cattle in the Missouri Coteau in-crease in fiber and decrease in N as season advances. Grazing intensity had little impact on grazed forage nutrient composition. Consequently, previously observed differences in livestock production due to graz-ing intensity in the Missouri Co-teau must be driven by changes in dietary intake or in vivo diges-tion. Additional research accessing changes in intake and rates of diges-tion are needed.
AcknowledgmentsThe authors thank the North
Dakota State Board of Agricultural Research and Education and Mid-west Forage Association for research support. Appreciation is expressed to personnel at the NDSU Animal Science Nutrition Laboratory and CGREC employees Stephanie Gross, Megan Gross, Cody Molle, Rodney Schmidt and Fara Brummer for their assistance in completing this project.
Literature CitedAOAC. 1990. Official Methods of Analy-
sis (15th Ed.). Vol. 1. Association of Official Analytical Chemists, Arling-ton, Va.
Biondini, M.E., B.D. Patton and P.E. Nyren. 1998. Grazing intensity and ecosystem processes in a northern mixed-grass prairie, USA. Eco. Soc. Of Am. 8:469-479.
Bryant, T.T., R.E. Blaser, R.L. Hammes and J.P. Fontenot. 1970. Symposium on pasture methods for maximum production in beef cattle: Effect of grazing management on animal and area output. J. Animal. Sci. 30:153-158.
Cline, H.J., B.W. Neville, G.P. Lardy and J.S. Caton. 2009. Influence of advanc-ing season on dietary composition, intake, site of digestion, and micro-bial efficiency in beef steers grazing season-long or twice-over rotation native range pastures in western North Dakota. J. Anim. Sci. 88:2812-2824.
Johnson, J.A., J.S. Caton, W. Poland, D.R. Kirby and D.V. Dhuyvetter. 1998. Influence of season in dietary compo-sition, intake, and digestion by beef steers grazing mixed-grass prairie in the northern Great Plains. J. Anim. Sci. 76:1682-1690.
McCollum, F.T., M.L. Galyean, L.J. Kyrsl and J.D. Wallace. 1985. Cattle grazing blue grama rangeland I. Seasonal di-ets and rumen fermentation. J. Range Manage. 38:539-543.
Olson, K.C., J.S. Caton, D.R. Kirby and P.L. Norton. 1994. Influence of yeast culture supplementation and advanc-ing season on steers grazing mixed-grass prairie in the northern Great Plains: I. Dietary composition, intake, and in situ nutrient disappearance. J. Anim. Sci. 72:2149-2157.
Patton, B.D., and A. Nyren. 2014. Long-term grazing intensity research in the Missouri Coteau region of North Dakota: Effects on plant produc-tion and composition. North Dakota State University, Central Grasslands Research Extension Center.
Pieper, R.D., C.W. Cook and L.E. Harris. 1959. Effect of intensity of grazing upon nutrient content of the diet. J. Anim. Sci. 18:1031-1037.
Tilley, A.M.J., and R.A. Terry. 1963. A two-stage technique for the in vitro digestibility of forage crops. J. Br. Grassl. Soc. 18:104.
Waldo, D.R., and H.K. Goering. 1979. Insolubility of proteins in ruminant feeds by four methods. J. Anim. Sci. 49:1560-1568.

2016 North Dakota Beef Report 83
The use of testicular fine-needle aspiration, histology and immunohistochemistry for determining bull fertility at an early age Nicolas Negrin Pereira1, Pawel Borowicz1, Bryan Neville2, Jordan Flaten1 and Carl R. Dahlen1
1Department of Animal Sciences, NDSU 2Central Grasslands Research Extension Center, NDSU
The objective of the study was to assess the use of different techniques to allow for early, low-cost, reliable and low-invasive methodologies for the determination of Sertoli cell populations and germ cells in the bull. The techniques are: fine-needle aspiration with a fine needle (FNA-F), fine-needle aspiration with a gross needle (FNA-G), classic histology cuts and immunohistochemistry (androgen receptor expression by fluorescence). A significant correlation exists between histology and immunohistochemistry measurements, which positions the immunohistochemistry technique as a novel, very specific and reliable methodology for precocious determination of future fertility in young bulls.
SummaryTesticular parenchyma samples
from 14 young peri-pubertal bulls were taken for the assessment of four different techniques: fine-needle aspiration using two differ-ent needle calibers or by open cut for histology (hematoxylin/eosin) or immunofluorescence (androgen receptor expression). For fine-needle aspiration, we used two different needle calibers attached to a sy-ringe: 22G (FNA F) or 16G (FNA G). Once the needle was inserted in the testicular parenchyma, a vacuum was produced inside the syringe by pulling back the plunger. A smear was obtained by expelling the sample onto a glass slide. Then it was air-dried, fixed with 70 percent alcohol and stained with hematoxy-lin/eosin. Tissue samples were cut into 4- by 4-millimeter (mm) pieces using a microtome blade, fixed in a 10 percent formaldehyde solution,
embedded in paraffin and cut into sections 5 micrometers (µm) thick using a microtome. Samples were stained with hematoxylin-eosin for histology or incubated sequentially with mouse monoclonal antibody to androgen receptor and goat-antirabbit (IgG CF633) fluorescent stain. To evaluate slides, images were taken at 200 times (FNA and histology) or 100 times magnifica-tion (immunohistochemistry) using an epifluorescence microscope equipped with a camera. Within each image, four to six seminiferous tubules within the five randomly chosen fields were selected for determination of Sertoli cell number and germ cell number. The ratio of germ to Sertoli cells was calculated and the CORR procedure of SAS was used to determine correlation of this ratio among each respective evaluation technique. Differences were considered significant at P < 0.05. A correlation coefficient of 0.58 (P < 0.001) was observed among the technique of histology (5.27 ±
0.41) and AR expression through fluorescence (4.44 ± 0.60) for germ cells/Sertoli cell ratio. No signifi-cant correlations were found among FNA techniques and histology or immunohistochemistry cell ratios. Expression of AR by fluorescence in Sertoli cells represents a new, highly specific technique for precocious de-tection of more potential fertile bulls as young peri-pubertal calves.
IntroductionFertility in the bull can be de-
fined as the ability to produce viable calves. This characteristic of the bull is key in beef farm profitability. In the U.S., more than 95 percent of the herds rely on natural service. An early and accurate fertility predic-tion technique in the bull could have a great impact on profitability of beef operations (Wiltbank et al., 1986).
A bull breeding examination has proven to be a reliable and cost-effective technique to detect those animals that are satisfactory potential breeders and those not apt for their use (Barth et al., 2002). The inclusion of semen analysis has improved the effectiveness of this examination, but a significant range of different fertility levels still occurs within those bulls classified as apt for breeding (Chenoweth and McPherson, 2016).
Researchers have demonstrated for several years the importance that the final establishment of the Sertoli cell population has in deter-mining future daily sperm produc-tion in most mammals (Berndston et al., 1987; P.J. O’Shaughnessy et al., 2011). The relationship between
84 2016 North Dakota Beef Report
the size of the Sertoli cell popula-tion and number of germ cells has been used as a tool for determining fertility in different mammal species (Berndston et al., 1987). Determining the size of the Sertoli cell popula-tion in the bull at an early age can be a powerful tool in detecting those individuals with a potential higher sperm capacity.
The fine-needle aspiration technique has been used for several years in human and stallion tes-ticles, providing a reliable, low-cost, diagnostic, low-invasive tool with minimal complications for cytology studies in the testis (Aridogan et al., 2003; Leme et al., 2012).
Expression of AR has been described in specific cells within the mammalian testis, such as in Leydig and peritubular myoid cells being expressed exclusively in Sertoli cells within the seminiferous tubules but not being expressed by germ cells (O’Hara et al., 2015).
Hardly any information is avail-able about the application of differ-ent techniques for the determination of Sertoli and germ cell populations in the male calf and their potential use for detecting higher daily sperm producers later in adult life as bulls. The aim of this study was the com-parison of four different techniques for determining Sertoli and germ cell population sizes in the peri-pubertal bulls: FNA F (22G needle), FNA G (16 G needle), classic his-tology cuts (hematoxylin/eosin stain) and immunofluorescence (AR expression).
Experimental ProceduresFourteen Aberdeen Angus and
Shorthorn bull calves (287 ± 3.3 days of age, 683 ± 29 pounds) from the North Dakota State University Beef Unit were used in the study. Previous to castration, bulls were restrained and given epidural anes-thesia.
The scrotum skin was opened using a scalpel and the testicles exposed. Plexus pampiniform, testicular artery and vas deferens were crushed and severed using an emasculator to prevent bleeding.
Testicular tissue samples were obtained for evaluation via: 1) fine-needle aspiration with a fine needle (FNA F) using a sterile 22-gauge, 1¼-inch needle, 2) fine-needle aspiration with a gross needle (FNA G) using a sterile 16-gauge, 1¼-inch needle, 3) histology cut (stained with hematoxylin and eosin) and 3) immunofluorescence (androgen receptor expression).
For the FNA techniques, needles were connected to a 5- or 10-millili-ter (ml) syringe and gently inserted perpendicularly into the testicular parenchyma. Once fully inserted in the parenchyma, the plunger was pulled back to produce a vacuum inside the syringe.
The needle was moved back-ward and forward within the testis two or three times for approximately four seconds. Once the needle was outside the testicle, a syringe filled with air was reattached to the needle and the plunger pressed to expel the sample onto a glass slide.
A smear was produced by sliding a second glass slide at an angle, extending the sample on the glass surface. The slide then was air-dried, fixed in 70 percent alcohol and stained with hematoxylin-eosin.
For histological examination, 4- by 4-mm testis parenchyma samples from the same region of each testis were taken and placed in a 10 per-cent formaldehyde fixative solution, embedded in paraffin and cut in 5-µm-thick sections using a micro-tome (Leica Biosystems Inc., Buffalo Grove, Ill.). Slides for histology were stained with hematoxylin-eosin.
Immunohistochemistry sections were submerged in sodium citrate buffer and placed in an antigen retriever (2100 Retriever, Aptum
Biologics, UK) and incubated sequentially using mouse monoclo-nal antibody to androgen receptor (ab9474, abcam, Cambridge, Mass.) at 4 C overnight with agitation, and then stained with goat-antirabbit IgG CF633 fluorescent stain.
For each slide or tissue sec-tion, images were taken at 200 times magnification (FNA smears and histology slides) or 100 times magnification (immunohistochem-istry slides) using a Zeiss Imager M2 epifluorescence microscope equipped with Zeiss piezo auto-mated stage and AxioCam HRm camera (Carl Zeiss International, Jena, Germany). Image analysis (Image-Pro Plus, Media Cybernetics Inc., Bethesda, Md.) was performed for images of five randomly chosen fields. Within each image, four to six seminiferous tubules were selected randomly for Sertoli and germ cells individual cell counts using the Image-Pro Plus image analysis software (Media Cybernetics Inc., Rockville, Md.).
The germ cell to Sertoli cell ratio was calculated by dividing the total number of germ cells by the total number of Sertoli cells within each tubule. The mean of all ratios were determined for each testicle and analyzed using the correlation pro-cedure of SAS (SAS Inst. Inc., Cary, N.C.). Significant differences were considered when P < 0.05.
Results and DiscussionThe different ratios between to-
tal germ cells and Sertoli cells were determined for each technique and presented in Table 1.
A correlation of 0.58 was ob-served (P = 0.001) between germ-to-Sertoli cell ratios obtained via histology and ratios obtained via immunohistochemistry (Table 2). In addition, a correlation of 0.69 was observed in germ-to-Sertoli ratio obtained via FNA F and FNA G techniques (P = 0.001). No cor-
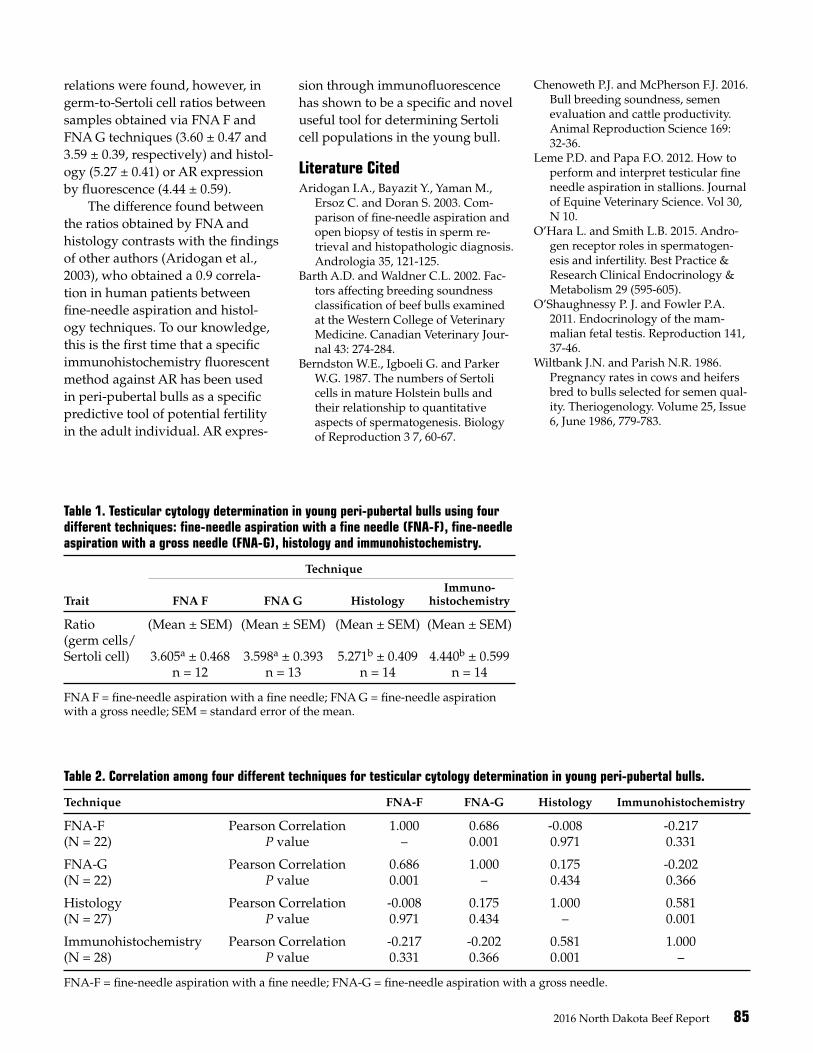
2016 North Dakota Beef Report 85
relations were found, however, in germ-to-Sertoli cell ratios between samples obtained via FNA F and FNA G techniques (3.60 ± 0.47 and 3.59 ± 0.39, respectively) and histol-ogy (5.27 ± 0.41) or AR expression by fluorescence (4.44 ± 0.59).
The difference found between the ratios obtained by FNA and histology contrasts with the findings of other authors (Aridogan et al., 2003), who obtained a 0.9 correla-tion in human patients between fine-needle aspiration and histol-ogy techniques. To our knowledge, this is the first time that a specific immunohistochemistry fluorescent method against AR has been used in peri-pubertal bulls as a specific predictive tool of potential fertility in the adult individual. AR expres-
sion through immunofluorescence has shown to be a specific and novel useful tool for determining Sertoli cell populations in the young bull.
Literature CitedAridogan I.A., Bayazit Y., Yaman M.,
Ersoz C. and Doran S. 2003. Com-parison of fine-needle aspiration and open biopsy of testis in sperm re-trieval and histopathologic diagnosis. Andrologia 35, 121-125.
Barth A.D. and Waldner C.L. 2002. Fac-tors affecting breeding soundness classification of beef bulls examined at the Western College of Veterinary Medicine. Canadian Veterinary Jour-nal 43: 274-284.
Berndston W.E., Igboeli G. and Parker W.G. 1987. The numbers of Sertoli cells in mature Holstein bulls and their relationship to quantitative aspects of spermatogenesis. Biology of Reproduction 3 7, 60-67.
Table 1. Testicular cytology determination in young peri-pubertal bulls using four different techniques: fine-needle aspiration with a fine needle (FNA-F), fine-needle aspiration with a gross needle (FNA-G), histology and immunohistochemistry.
Technique
Immuno- Trait FNA F FNA G Histology histochemistry
Ratio (Mean ± SEM) (Mean ± SEM) (Mean ± SEM) (Mean ± SEM)(germ cells/ Sertoli cell) 3.605a ± 0.468 3.598a ± 0.393 5.271b ± 0.409 4.440b ± 0.599 n = 12 n = 13 n = 14 n = 14
FNA F = fine-needle aspiration with a fine needle; FNA G = fine-needle aspiration with a gross needle; SEM = standard error of the mean.
Table 2. Correlation among four different techniques for testicular cytology determination in young peri-pubertal bulls.
Technique FNA-F FNA-G Histology Immunohistochemistry
FNA-F Pearson Correlation 1.000 0.686 -0.008 -0.217(N = 22) P value – 0.001 0.971 0.331
FNA-G Pearson Correlation 0.686 1.000 0.175 -0.202(N = 22) P value 0.001 – 0.434 0.366
Histology Pearson Correlation -0.008 0.175 1.000 0.581(N = 27) P value 0.971 0.434 – 0.001
Immunohistochemistry Pearson Correlation -0.217 -0.202 0.581 1.000(N = 28) P value 0.331 0.366 0.001 –
FNA-F = fine-needle aspiration with a fine needle; FNA-G = fine-needle aspiration with a gross needle.
Chenoweth P.J. and McPherson F.J. 2016. Bull breeding soundness, semen evaluation and cattle productivity. Animal Reproduction Science 169: 32-36.
Leme P.D. and Papa F.O. 2012. How to perform and interpret testicular fine needle aspiration in stallions. Journal of Equine Veterinary Science. Vol 30, N 10.
O’Hara L. and Smith L.B. 2015. Andro-gen receptor roles in spermatogen-esis and infertility. Best Practice & Research Clinical Endocrinology & Metabolism 29 (595-605).
O’Shaughnessy P. J. and Fowler P.A. 2011. Endocrinology of the mam-malian fetal testis. Reproduction 141, 37-46.
Wiltbank J.N. and Parish N.R. 1986. Pregnancy rates in cows and heifers bred to bulls selected for semen qual-ity. Theriogenology. Volume 25, Issue 6, June 1986, 779-783.
86 2016 North Dakota Beef Report
The effect of Vitamin A treatment on testicular development in young peri-pubertal bullsNicolas Negrin Pereira1, Pawel Borowicz1, Jordan Flaten1, Bryan Neville2 and Carl R. Dahlen1
1Department of Animal Sciences, NDSU 2Central Grasslands Research Extension Center, NDSU
The establishment of the final number of Sertoli cells in the bull calf testicle around puberty is one of the key determining factors of the animal’s adult fertility. Vitamin A administration did not have any significant effect in testicular development in peri-pubertal bull calves.
SummaryFourteen Angus and Short-
horn bull calves between 11 and 12 months of age were assigned randomly to one of two treatments: 1) Intramuscular injection of 1 million International Units (IU) of vitamin A (Vit A) or 2) no treatment (Control). Scrotal circumference (SC) was measured in all bull calves at the time of the treatment applica-tion and 11 days later at castration. Testes and epididymis were dis-sected and weighed, and samples of parenchyma were collected from each testicle. Samples were fixed in formaldehyde, embedded in paraf-fin and cut. Slides were deparaf-finized with successive washes of xylene and alcohol. After antigen re-trieval and blocking with 10 percent normal goat serum, sections were incubated sequentially with mouse monoclonal antibody to androgen receptor and goat-antirabbit (IgG CF633) fluorescent stain. Samples were examined under a fluorescent microscope and the images captured with a digital camera and processed using Image-Pro Plus software. Effects of treatment on SC, testicu-lar weight, testicular parenchyma weight and epididymis weight, number of Sertoli cells, germ cell,
and ratio of germ cells to Sertoli cells within the seminiferous tubule (ST) were analyzed using the ANOVA procedure of SAS. No differences were observed among treatments for SC (1.63 ± 0.26 vs. 2.17 ± 0.17), testicular weight (228.169 ± 17.002 vs. 221.792 ± 24.983), testicular pa-renchyma weight (grams [g]) (141.02 ± 11.82 vs. 131.46 ± 14.49), epididy-mis weight (g) (12.01 ± 1.10 vs. 9.43 ± 1.01), number of Sertoli cells/ST (45.56 ± 3.14 vs. 48.04 ± 2.18), num-ber of germ cells/ST (217.29 ± 26.83 vs. 156.04 ± 16.75) and the ratio of germ cells/Sertoli cell (5.03 ± 0.93 vs. 3.30 ± 0.43) for vitamin A and control, respectively. These results suggest that vitamin A has no posi-tive effect on fertility when adminis-tered in peri-pubertal bulls.
IntroductionMore than 95 percent of our beef
herds rely on natural service as the main breeding system. Very little information is available about inter-ventions administered during the peri-pubertal period in the bull and their ramifications on adult fertility.
Sperm production in the bull is influenced early in life through the establishment of the definite number of Sertoli cells in the testicle, which nourish developing sperm before puberty, when they stop replicat-ing (Sharpe et al., 2003). Bulls with
a larger Sertoli cell population have greater daily sperm production (DSP), testicular weight and SC, compared with bulls having fewer Sertoli cells (Berndston et al., 1987).
Recent findings showed that the proportion of Sertoli cell numbers was higher in bulls that produced good-quality semen with higher numbers of viable spermatozoa after thawing in comparison with bulls that had lower proportions of Sertoli cells (Rajak et al., 2016). Sertoli cell proliferation has a specific window of time that extends from the fetal stage at midgestation up to six to 10 weeks in the newborn calf (Moura et al, 1997).
Recent findings suggest that influencing the final number of Sertoli cells in the bull testis is pos-sible once differentiated (Zakhidov et al., 2015). Several factors have been described as having an effect on Sertoli cell replication, such as thyroid hormone (T3), testosterone (T), follicle-stimulating hormone (FSH), insulin growth factor (IGF-I) and vitamin A through its active compounds retinoic acid (RA) and retinol (RE) (Lucas et al., 2014).
Retinoic acid also has been re-ported to interact with transforming growth factor beta (TGF-β) in vari-ous other tissues, not limited to the testis, affecting cell proliferation and differentiation (Cupp et al., 1999).
Retinoic acid receptors RARα and RARα have been discovered in rat Sertoli cell nucleus (Livera et al., 2002), and the fundamen-tal role of RA in spermatogenesis has been known for several years, where animals deficient in vitamin A are sterile with a complete halt in spermatogenesis. This was demon-
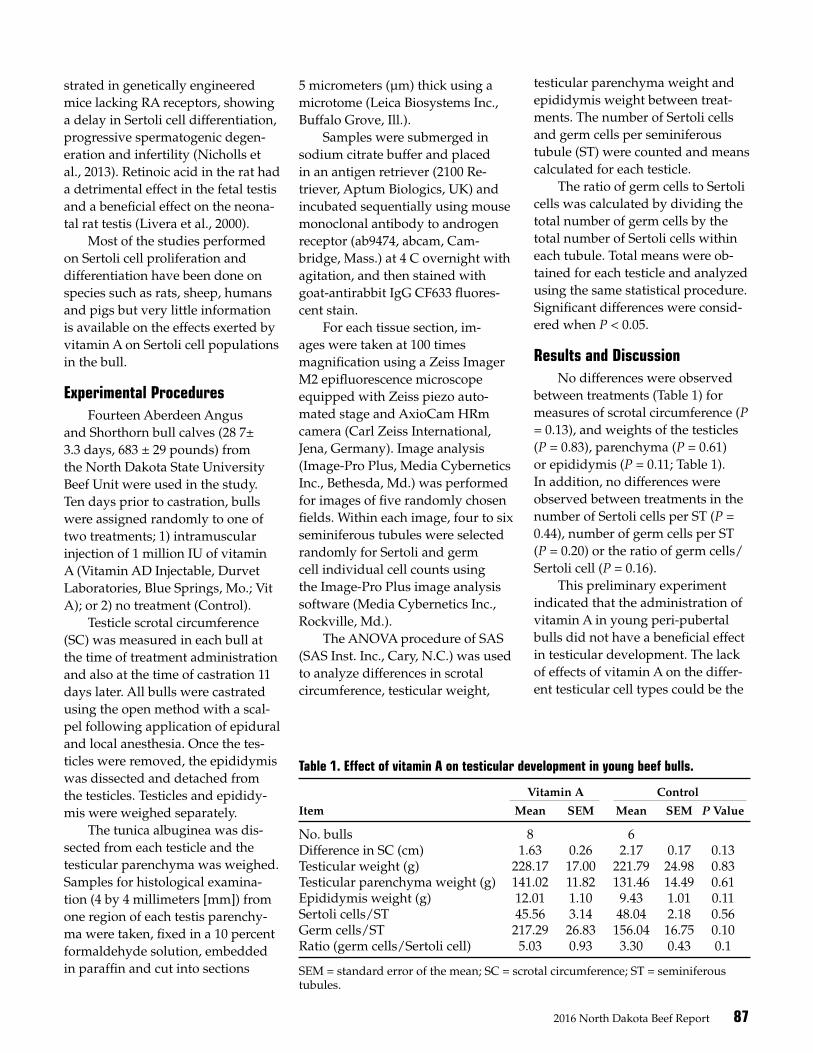
2016 North Dakota Beef Report 87
strated in genetically engineered mice lacking RA receptors, showing a delay in Sertoli cell differentiation, progressive spermatogenic degen-eration and infertility (Nicholls et al., 2013). Retinoic acid in the rat had a detrimental effect in the fetal testis and a beneficial effect on the neona-tal rat testis (Livera et al., 2000).
Most of the studies performed on Sertoli cell proliferation and differentiation have been done on species such as rats, sheep, humans and pigs but very little information is available on the effects exerted by vitamin A on Sertoli cell populations in the bull.
Experimental ProceduresFourteen Aberdeen Angus
and Shorthorn bull calves (28 7± 3.3 days, 683 ± 29 pounds) from the North Dakota State University Beef Unit were used in the study. Ten days prior to castration, bulls were assigned randomly to one of two treatments; 1) intramuscular injection of 1 million IU of vitamin A (Vitamin AD Injectable, Durvet Laboratories, Blue Springs, Mo.; Vit A); or 2) no treatment (Control).
Testicle scrotal circumference (SC) was measured in each bull at the time of treatment administration and also at the time of castration 11 days later. All bulls were castrated using the open method with a scal-pel following application of epidural and local anesthesia. Once the tes-ticles were removed, the epididymis was dissected and detached from the testicles. Testicles and epididy-mis were weighed separately.
The tunica albuginea was dis-sected from each testicle and the testicular parenchyma was weighed. Samples for histological examina-tion (4 by 4 millimeters [mm]) from one region of each testis parenchy-ma were taken, fixed in a 10 percent formaldehyde solution, embedded in paraffin and cut into sections
5 micrometers (µm) thick using a microtome (Leica Biosystems Inc., Buffalo Grove, Ill.).
Samples were submerged in sodium citrate buffer and placed in an antigen retriever (2100 Re-triever, Aptum Biologics, UK) and incubated sequentially using mouse monoclonal antibody to androgen receptor (ab9474, abcam, Cam-bridge, Mass.) at 4 C overnight with agitation, and then stained with goat-antirabbit IgG CF633 fluores-cent stain.
For each tissue section, im-ages were taken at 100 times magnification using a Zeiss Imager M2 epifluorescence microscope equipped with Zeiss piezo auto-mated stage and AxioCam HRm camera (Carl Zeiss International, Jena, Germany). Image analysis (Image-Pro Plus, Media Cybernetics Inc., Bethesda, Md.) was performed for images of five randomly chosen fields. Within each image, four to six seminiferous tubules were selected randomly for Sertoli and germ cell individual cell counts using the Image-Pro Plus image analysis software (Media Cybernetics Inc., Rockville, Md.).
The ANOVA procedure of SAS (SAS Inst. Inc., Cary, N.C.) was used to analyze differences in scrotal circumference, testicular weight,
testicular parenchyma weight and epididymis weight between treat-ments. The number of Sertoli cells and germ cells per seminiferous tubule (ST) were counted and means calculated for each testicle.
The ratio of germ cells to Sertoli cells was calculated by dividing the total number of germ cells by the total number of Sertoli cells within each tubule. Total means were ob-tained for each testicle and analyzed using the same statistical procedure. Significant differences were consid-ered when P < 0.05.
Results and DiscussionNo differences were observed
between treatments (Table 1) for measures of scrotal circumference (P = 0.13), and weights of the testicles (P = 0.83), parenchyma (P = 0.61) or epididymis (P = 0.11; Table 1). In addition, no differences were observed between treatments in the number of Sertoli cells per ST (P = 0.44), number of germ cells per ST (P = 0.20) or the ratio of germ cells/Sertoli cell (P = 0.16).
This preliminary experiment indicated that the administration of vitamin A in young peri-pubertal bulls did not have a beneficial effect in testicular development. The lack of effects of vitamin A on the differ-ent testicular cell types could be the
Table 1. Effect of vitamin A on testicular development in young beef bulls.
Vitamin A Control
Item Mean SEM Mean SEM P Value
No. bulls 8 6 Difference in SC (cm) 1.63 0.26 2.17 0.17 0.13Testicular weight (g) 228.17 17.00 221.79 24.98 0.83Testicular parenchyma weight (g) 141.02 11.82 131.46 14.49 0.61Epididymis weight (g) 12.01 1.10 9.43 1.01 0.11Sertoli cells/ST 45.56 3.14 48.04 2.18 0.56Germ cells/ST 217.29 26.83 156.04 16.75 0.10Ratio (germ cells/Sertoli cell) 5.03 0.93 3.30 0.43 0.1
SEM = standard error of the mean; SC = scrotal circumference; ST = seminiferous tubules.
88 2016 North Dakota Beef Report
reflection of an already differentiat-ed and stable Sertoli cell population because previous studies indicate that the end of Sertoli cell division occurs before 30 to 40 weeks of age in the bull (Rawlings et al., 2008).
The lack of information about precise time frames for obtain-ing beneficial effects on testicular development in the bull by the ap-plication of different treatment and management strategies highlights the need for further research.
Literature CitedBerndston W.E., Gaius Igboeli and
Parker W.G. 1987. The numbers of Sertoli cells in mature Holstein bulls and their relationship to quantitative aspects of spermatogenesis. Biology of Reproduction 3 7, 60-67.Cupp A.S., Dufour J.M., Kim G., Skinner M.K. and Kwan Hee Kim. 1999. Action of retinoids on embryonic and early postnatal testis development. Endo-crinology. Vol. 140.
Livera G., Rouiller-Fabre V., Durand P. and Habert R._ 2000 Multiple effects of Retinoids on the development of Sertoli, Germ and Leydig cells of fetal and neonatal rat testis in culture. Bi-ology of Reproduction 62, 1303-1314.
Livera G, Rouiller-Fabre V, Pairault C, Levacher C and Habert R._ 2002. Reg-ulation and perturbation of testicular functions by vitamin A. Reproduction 124, 173-180.
Lucas T.F.G., Nascimento A.R., Pisolato R., Pimenta M.T., Lazari M.F.M. and Porto C.S. 2014. Receptors and signal-ing pathways involved in prolif-eration and differentiation of Sertoli cells. Spermatogenesis 4 e28138. Lan-des Bioscience.
Moura A.A. and Erickson B.H. 1997. Age-related changes in peripheral hormone concentrations and their relationships with testis size and number of Sertoli and germ cells in yearling beef bulls. Journal of Repro-duction and Fertility 111, 183-190.
Nicholls P.K., Harrison C.A., Rainczuk K.E., Vogl A.W. and Stanton P.G. 2013. Retinoic acid promotes Sertoli cell differentiation and antagonizes activing-induced proliferation. Mo-lecular and Cellular Endocrinology 377:33-43.
Rajak S.K., Thippeswamy V.B., Kumare-san A., Shankar Layek S., Mohanty T.K., Gaurav M.K., Chakravarty A.K., Datta T.K., Manimaran A. and Prasad S. 2016. Testicular citology indicates differences in Sertoli cell counts between “good freezer” and “poor freezer” bulls. Indian Journal of Ex-perimental Biology. Vol. 54, 17-25.
Rawlings N., Evans ACO, Chandolia R.K. and Bagu E.T. 2008. Sexual maturation in the bull. Reproductive Domestic Animals 43, (295-301).
Sharpe R.M., McKinnell C., Kivlin C. and Fisher J.S. 2003. Proliferation and functional maturation of Sertoli cells, and their relevance to disorders of testis function in adulthood. Repro-duction 125, 769-784
Zakhidov S.T. and Marshak T.L. 2015 Ex-perimental evidence of profileration and reproduction of highly differen-tiated Sertoli cells. Biology Bulletin Vol.42 N°4 (287-295).

2016 North Dakota Beef Report 89
The influence of beef quadriceps hot-processing on carcass chilling and beef round qualityChristina A. Hayes1, Robert J. Maddock1, Wanda L. Keller1 and Kasey R. Maddock-Carlin1
1Department of Animal Sciences, NDSU
This project evaluated the impact of hot-carcass boning on beef round meat quality attributes in a small processor setting. Temperature and pH declines were monitored on chilling beef carcasses that had one carcass side where the beef knuckle was separated from the femur within 1.5 hours of stunning. Beef quality tenderness and shelf-life attributes were evaluated after aging. Our research indicates that hot-boning techniques applied in a small processing setting may not create added value to the beef round.
SummaryThe objective of the present
study was to determine the effects of partial hot-boning on meat quality attributes in deep and superficial portions of the beef semimembranosus (SM). At the entrance of the carcass-chilling cooler during slaughter (60 to 90 minutes postmortem), the beef knuckle (quadriceps) was partially hot-boned on one side of each beef carcass (n = 15), whereas the oppo-site side remained intact through-out the 48-hour chilling period. Randomized treatments were deep SM hot-boned (DH) or cold-boned (DC), and superficial SM hot-boned (SH) or cold-boned (SC). Post-mortem temperature decline was monitored every 10 minutes for 24 hours and post-mortem pH decline was recorded at 45 minutes, three hours, and 24 hours. Samples were collected after 24 hours (protein degradation and protease activity measurements) and 10 days (tender-ness and display life evaluation) of aging in an air-chilled cooler. The deep portion of the SM had a slower chill rate and a sharper pH decline when compared with the superficial SM, regardless of hot-boning treat-
ment. No treatment differences were observed for beef color L* and b* values (P > 0.05). By day 4 of display life, both deep muscle treatments were less red (P < 0.001) when com-pared with superficial SM locations. Modified hot-boning did not (P > 0.49) influence tenderness in deep or superficial portions of the SM.
IntroductionCompared with traditional bon-
ing of refrigerated carcasses, partial hot-boning (limited separation of meat from the skeleton pre-rigor) is a well-established technique used to optimize meat processing param-eters, including processing time, chilling costs and contamination reduction (Kastner, 1977; Røtterud et al., 2006). Inconsistent meat quality attributes of the SM are possibly due to variations in pH and temperature decline between the deep and super-ficial muscle locations (Tarrant and Mothersil, 1977; Seyfert et al., 2005; Sawyer et al., 2007).
Generally, the deep portion of the SM is a larger, thicker muscle, exhibiting a slower chill rate and more rapid pH decline than its superficial counterpart. As a result, meat from the inner SM tends to
have inconsistent color stability and protein functionality.
Tenderness differences within the beef round muscle are well-doc-umented (Johnson et al., 1988; Kim et al., 2010). Limited studies have investigated how partial hot-boning of the SM might affect post-mortem determinants of meat quality in view of differences in chilling and pH conditions of the superficial and deep SM.
Therefore, the objective of this study was to examine the effects of partial hot-boning on pre-rigor temperature and pH decline and subsequent proteolysis of the super-ficial and deep portions of the SM in relation to beef palatability traits.
Experimental Procedures Fifteen market-weight beef heif-
ers were purchased from area com-mercial feedlots and harvested at the U.S. Department of Agriculture-inspected meat laboratory at North Dakota State University during a period of six months. The carcasses were split and one half of each carcass was assigned randomly to a hot-boning technique conducted 60 to 90 minutes after stunning, where the quadriceps complex, along with the patella, was separated from the insertion at the distal end of the fe-mur, whereas the other half of each carcass remained as a control.
Following the hot-boning pro-cedure, temperature and pH were monitored in the deep and superfi-cial portions of the SM for 24 hours. At 24 hours post-mortem, muscle biopsies were taken within the SM. Samples collected at 24 hours post-mortem were frozen immediately for measurement of troponin-T

90 2016 North Dakota Beef Report
Figure. 2. Mean temperature fall [± standard deviation] of bovine semimembranosus muscle with modified processing conditions up to 22 hours post-mortem (n = 15 per treatment). Treatments were deep SM hot-boned (DH) or cold-boned (DC), and superficial SM hot-boned (SH) or cold-boned (SC).
5
Figure 1. Means of decline in pH at one, three and 24 hours post-mortem relative to the temperature of the SM muscle location. Heat and cold shortening windows adapted from Thompson, J. 2002. Meat Sci. 62:295-308. Treatments on beef semimembranosus muscle were deep hot-boned (DH) or cold-boned (DC), and superficial SM hot-boned (SH) or cold-boned (SC).
Figure. 2. Mean temperature fall [± standard deviation] of bovine semimembranosus muscle with modified processing conditions up to 22 hours post-mortem (n = 15 per treatment). Treatments were deep SM hot-boned (DH) or cold-boned (DC), and superficial SM hot-boned (SH) or cold-boned (SC).
5
5.5
6
6.5
7
7.5
510152025303540
Mus
cle
pH
Muscle temperature, °C
SCDCSHDH
Coldshortening
window
1 h
Heat shortening
window
3 h
24 h
40
50
60
70
80
90
100
2 4 6 8 10 12 14 16 18 20 22
Tem
pera
ture
, °F
Time post mortem, h
SCDCSHDH
Trt: P < 0.01
degradation by Western blot, as well as for calpain 1 and calpain 2 activ-ity by casein zymograms (Melody et al., 2004).
Hanging carcasses were air-chilled in a dark cooler for 10 days at 36 F, upon which steaks were cut from deep and superficial portions of the SM for immediate display life assessment and Warner-Bratzler shear force measurement for tender-ness.
Results and DiscussionThe pH declined from an aver-
age value of 6.66 at one hour post-mortem to 5.68 at 24 hours post-mortem in the four muscle locations and their corresponding treatments (n = 15 per treatment; Figure 1). Treatments DH and DC had similar (P > 0.05) pH decline, indicating that hot-boning was not enough to slow pH decline in the deep portion of the SM.
SC and SH pH decline values were similar (P > 0.05). Differences between superficial and deep for either boning treatment were sig-nificant (P < 0.05) at 45 minutes and three hours post-mortem; however, all treatments had similar pH values 24 hours post-mortem.
Temperature decline was similar (Figure 2) among all muscle loca-tions monitored. As expected, the superficial muscles investigated (SC and SH) had a faster rate of decline than those locations from the deep SM. Treatments DH and DC had similar temperature decline rates, indicating that partial hot-boning was not enough to hasten tempera-ture decline in the deep portion of the SM.
The temperature of the cooling chamber during the SM treatment oscillated around 41 F during the first 12 hours and reached 36 F at the end of chilling. While 36 F is con-sistent with similar studies investi-gating beef hot-boning treatments
(Seyfert et al., 2005; Pivotto et al., 2014), the warmer temperature ob-served during the first 12 hours may have adversely influenced the speed at which the SM muscle temperature dropped.
No treatment differences (P > 0.05) were observed for beef color L* and b* values. By day 4 of display life, both deep muscle treatments
were less red (P < 0.001) when compared with superficial SM loca-tions. However, by day 10 of display life, only the SC-treated SM had a greater a* value (P < 0.01), compared with all other treatments.
Shear force values did not differ (P > 0.49) between hot- and cold-boned SM muscle locations (Table 1). However, at 24 hours post-mor-
5
Figure 1. Means of decline in pH at one, three and 24 hours post-mortem relative to the temperature of the SM muscle location. Heat and cold shortening windows adapted from Thompson, J. 2002. Meat Sci. 62:295-308. Treatments on beef semimembranosus muscle were deep hot-boned (DH) or cold-boned (DC), and superficial SM hot-boned (SH) or cold-boned (SC).
Figure. 2. Mean temperature fall [± standard deviation] of bovine semimembranosus muscle with modified processing conditions up to 22 hours post-mortem (n = 15 per treatment). Treatments were deep SM hot-boned (DH) or cold-boned (DC), and superficial SM hot-boned (SH) or cold-boned (SC).
5
5.5
6
6.5
7
7.5
510152025303540
Mus
cle
pH
Muscle temperature, °C
SCDCSHDH
Coldshortening
window
1 h
Heat shortening
window
3 h
24 h
40
50
60
70
80
90
100
2 4 6 8 10 12 14 16 18 20 22
Tem
pera
ture
, °F
Time post mortem, h
SCDCSHDH
Trt: P < 0.01
Figure 1. Means of decline in pH at one, three and 24 hours post-mortem relative to the temperature of the SM muscle location. Heat and cold shortening windows adapted from Thompson, J. 2002. Meat Sci. 62:295-308. Treatments on beef semimembranosus muscle were deep hot-boned (DH) or cold-boned (DC), and superficial SM hot-boned (SH) or cold-boned (SC).
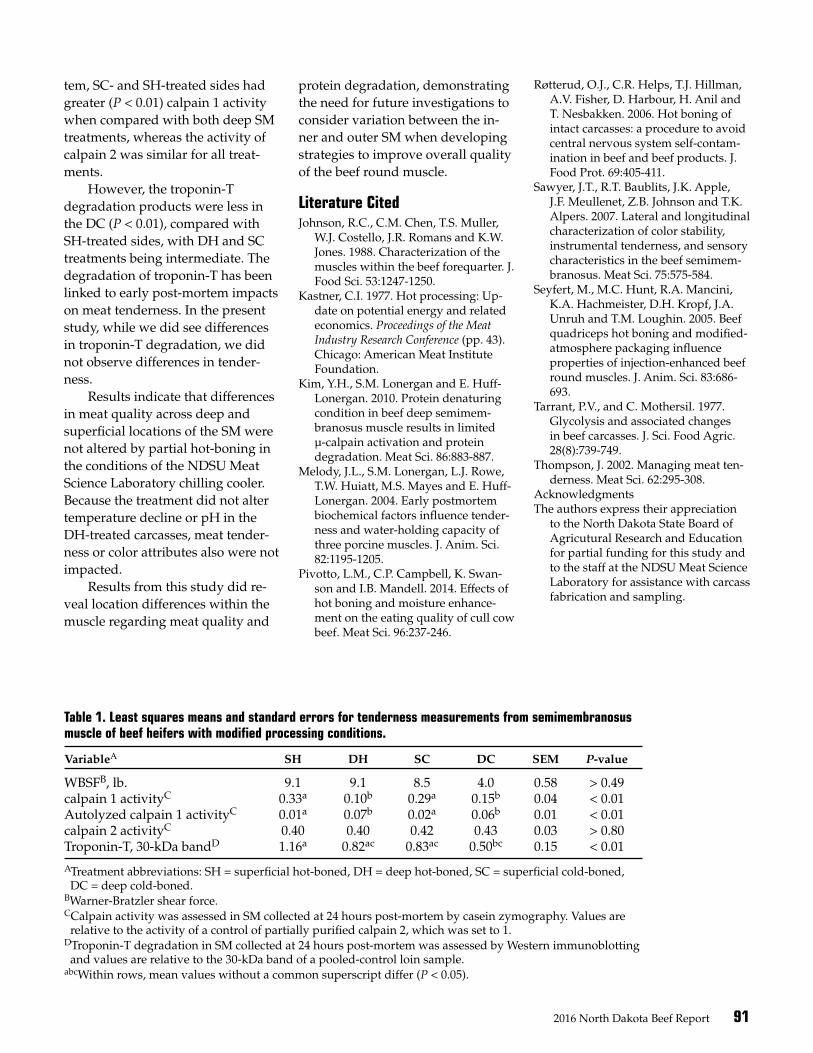
2016 North Dakota Beef Report 91
tem, SC- and SH-treated sides had greater (P < 0.01) calpain 1 activity when compared with both deep SM treatments, whereas the activity of calpain 2 was similar for all treat-ments.
However, the troponin-T degradation products were less in the DC (P < 0.01), compared with SH-treated sides, with DH and SC treatments being intermediate. The degradation of troponin-T has been linked to early post-mortem impacts on meat tenderness. In the present study, while we did see differences in troponin-T degradation, we did not observe differences in tender-ness.
Results indicate that differences in meat quality across deep and superficial locations of the SM were not altered by partial hot-boning in the conditions of the NDSU Meat Science Laboratory chilling cooler. Because the treatment did not alter temperature decline or pH in the DH-treated carcasses, meat tender-ness or color attributes also were not impacted.
Results from this study did re-veal location differences within the muscle regarding meat quality and
Table 1. Least squares means and standard errors for tenderness measurements from semimembranosus muscle of beef heifers with modified processing conditions.
VariableA SH DH SC DC SEM P-value
WBSFB, lb. 9.1 9.1 8.5 4.0 0.58 > 0.49calpain 1 activityC 0.33a 0.10b 0.29a 0.15b 0.04 < 0.01Autolyzed calpain 1 activityC 0.01a 0.07b 0.02a 0.06b 0.01 < 0.01calpain 2 activityC 0.40 0.40 0.42 0.43 0.03 > 0.80Troponin-T, 30-kDa bandD 1.16a 0.82ac 0.83ac 0.50bc 0.15 < 0.01
ATreatment abbreviations: SH = superficial hot-boned, DH = deep hot-boned, SC = superficial cold-boned, DC = deep cold-boned.BWarner-Bratzler shear force.CCalpain activity was assessed in SM collected at 24 hours post-mortem by casein zymography. Values are relative to the activity of a control of partially purified calpain 2, which was set to 1.DTroponin-T degradation in SM collected at 24 hours post-mortem was assessed by Western immunoblotting and values are relative to the 30-kDa band of a pooled-control loin sample.abcWithin rows, mean values without a common superscript differ (P < 0.05).
protein degradation, demonstrating the need for future investigations to consider variation between the in-ner and outer SM when developing strategies to improve overall quality of the beef round muscle.
Literature CitedJohnson, R.C., C.M. Chen, T.S. Muller,
W.J. Costello, J.R. Romans and K.W. Jones. 1988. Characterization of the muscles within the beef forequarter. J. Food Sci. 53:1247-1250.
Kastner, C.I. 1977. Hot processing: Up-date on potential energy and related economics. Proceedings of the Meat Industry Research Conference (pp. 43). Chicago: American Meat Institute Foundation.
Kim, Y.H., S.M. Lonergan and E. Huff-Lonergan. 2010. Protein denaturing condition in beef deep semimem-branosus muscle results in limited µ-calpain activation and protein degradation. Meat Sci. 86:883-887.
Melody, J.L., S.M. Lonergan, L.J. Rowe, T.W. Huiatt, M.S. Mayes and E. Huff-Lonergan. 2004. Early postmortem biochemical factors influence tender-ness and water-holding capacity of three porcine muscles. J. Anim. Sci. 82:1195-1205.
Pivotto, L.M., C.P. Campbell, K. Swan-son and I.B. Mandell. 2014. Effects of hot boning and moisture enhance-ment on the eating quality of cull cow beef. Meat Sci. 96:237-246.
Røtterud, O.J., C.R. Helps, T.J. Hillman, A.V. Fisher, D. Harbour, H. Anil and T. Nesbakken. 2006. Hot boning of intact carcasses: a procedure to avoid central nervous system self-contam-ination in beef and beef products. J. Food Prot. 69:405-411.
Sawyer, J.T., R.T. Baublits, J.K. Apple, J.F. Meullenet, Z.B. Johnson and T.K. Alpers. 2007. Lateral and longitudinal characterization of color stability, instrumental tenderness, and sensory characteristics in the beef semimem-branosus. Meat Sci. 75:575-584.
Seyfert, M., M.C. Hunt, R.A. Mancini, K.A. Hachmeister, D.H. Kropf, J.A. Unruh and T.M. Loughin. 2005. Beef quadriceps hot boning and modified-atmosphere packaging influence properties of injection-enhanced beef round muscles. J. Anim. Sci. 83:686-693.
Tarrant, P.V., and C. Mothersil. 1977. Glycolysis and associated changes in beef carcasses. J. Sci. Food Agric. 28(8):739-749.
Thompson, J. 2002. Managing meat ten-derness. Meat Sci. 62:295-308.
AcknowledgmentsThe authors express their appreciation
to the North Dakota State Board of Agricutural Research and Education for partial funding for this study and to the staff at the NDSU Meat Science Laboratory for assistance with carcass fabrication and sampling.
92 2016 North Dakota Beef Report
Does beef inclusion in a modern diet influence risk factors for obesity-related metabolic disorders using a swine biomedical modelAlexis M. Siomka1, Korry Hintze2 and Eric P. Berg1
1Department of Animal Sciences, NDSU2Utah State University
Using swine as a model for humans, the objectives of this project were to determine if replacing sugar (total Western diet [TWD]) with beef (total Western diet-cooked ground beef [TWD-GB]) in a total Western diet would alter body composition, the onset of puberty and risk factors for obesity-related disorders. The results showed that gilts on the TWD-GB diet had greater growth during the test period due to an increase in fat-free lean growth as evidenced by greater longissimus muscle area. TWD-GB had significantly less total cholesterol due to a decrease in low-density lipoprotein cholesterol (LDLch) and high-density lipoprotein cholesterol (HDLch). The reproductive tracts were prepubertal across both treatments; however, follicular development was observed in the TWD-GB gilts. No differences were observed with blood chemistry at the end of the test period.
SummaryUsing swine as a model for
humans, this study was conducted to determine if replacing sugar in a total Western diet (TWD) with nutrient-dense beef (TWD-GB) would alter body composition, onset of puberty and risk factors for obesity-related disorders. Twenty-four Berkshire gilts were obtained at weaning, assigned to one of two dietary treatments (TWD vs. TWD-GB) and pair-fed at 3.7 percent body weight (BW) for 91 days. Through time, TWD-GB gilts had superior BW gain (P < 0.01). At the end of the test, TWD-GB gilts had larger cross-sectional longissimus muscle area (P < 0.0001), less subcutaneous fat depth (P = 0.0005) and greater per-centage of lean BW (P < 0.0001) than swine on the TWD. Reproductive tracts were prepubertal across treat-
ments; however, follicular develop-ment was observed in TWD-GB gilts. Sodium, hematocrit, hemoglo-bin and insulinlike growth factor 1 were higher and ionic calcium lower for TWD-GB gilts, compared with TWD gilts.
IntroductionRed meat and dietary fat have
been targeted as the cause of in-creased obesity and obesity-related metabolic disorders in children and adults in the U.S. and abroad. Many shifts have occurred in dietary recommendations from the U.S. Department of Agriculture through the years.
Recent dietary advice suggest-ing limiting the intake of red meat is unnecessarily restrictive and may have led to many unintended health consequences (Binnie et al., 2014). Obesity and Type 2 diabetes mellitus are common and growing, and are
related problems (Centers for Dis-ease Control and Prevention, 2011).
Obesity has become so preva-lent that it is considered to be a worldwide epidemic and a public health concern; however, the cause of these obesity-related diseases is unclear. The major determinants driving obesity are complex but clearly involve interactions with our environment, particularly related to food supply, eating behaviors and genetics, as well as public policies (Dixon, 2010).
To maintain a healthy lifestyle, an understanding of the impor-tance of a proper diet and nutrition is essential. The nutritional state of an individual might change in accordance with the type (or types) of dietary patterns he/she follows at any given time in his/her life. Ultimately, poor diet can result in decreased metabolic efficiency and may lead to nutrient disorders or an unbalance of nutritional conditions in the body.
Using swine as a model for hu-mans, the objectives of this project were to determine if replacing sugar with nutrient-dense beef in a total Western diet (TWD) will alter body composition, the onset of puberty and risk factors for obesity-related metabolic disorders. The TWD for this project was developed for swine using information obtained from the 2007-2008 National Health and Nu-trition Examination Survey, “What We Eat in America.”
Nutrient requirements for swine are known definitively down to the specific requirements for individual amino acids. Human diets are much less formulated because of the diffi-
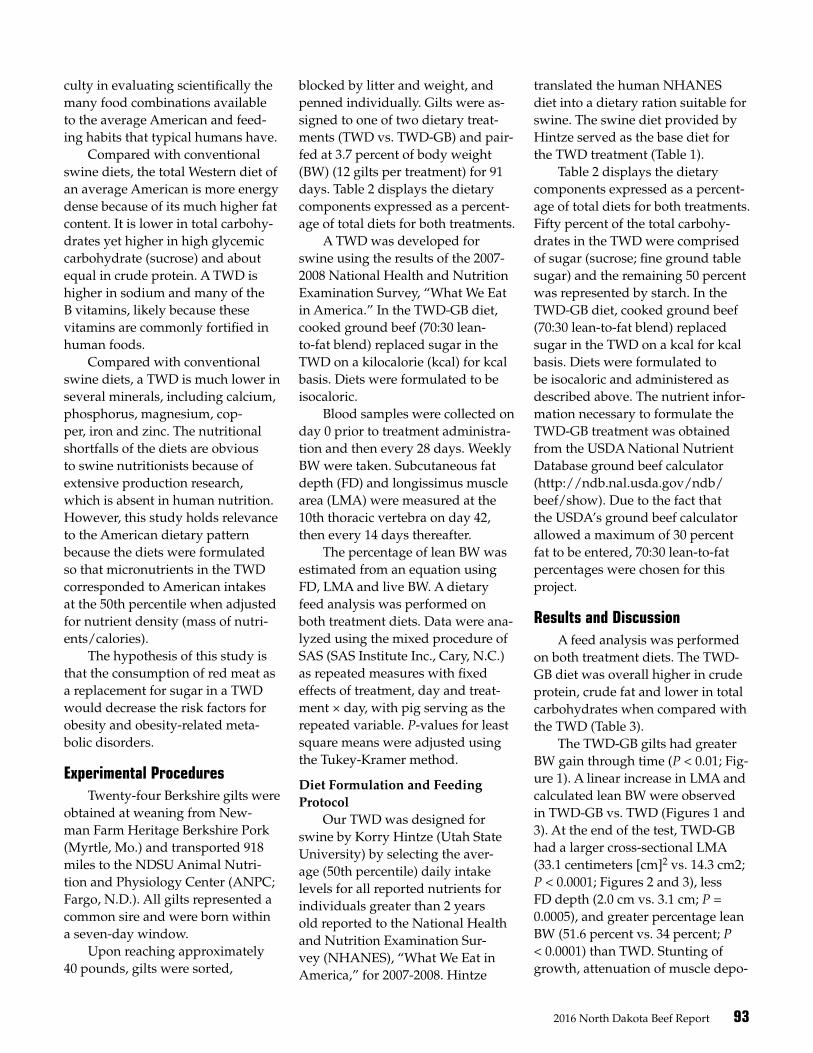
2016 North Dakota Beef Report 93
culty in evaluating scientifically the many food combinations available to the average American and feed-ing habits that typical humans have.
Compared with conventional swine diets, the total Western diet of an average American is more energy dense because of its much higher fat content. It is lower in total carbohy-drates yet higher in high glycemic carbohydrate (sucrose) and about equal in crude protein. A TWD is higher in sodium and many of the B vitamins, likely because these vitamins are commonly fortified in human foods.
Compared with conventional swine diets, a TWD is much lower in several minerals, including calcium, phosphorus, magnesium, cop-per, iron and zinc. The nutritional shortfalls of the diets are obvious to swine nutritionists because of extensive production research, which is absent in human nutrition. However, this study holds relevance to the American dietary pattern because the diets were formulated so that micronutrients in the TWD corresponded to American intakes at the 50th percentile when adjusted for nutrient density (mass of nutri-ents/calories).
The hypothesis of this study is that the consumption of red meat as a replacement for sugar in a TWD would decrease the risk factors for obesity and obesity-related meta-bolic disorders.
Experimental ProceduresTwenty-four Berkshire gilts were
obtained at weaning from New-man Farm Heritage Berkshire Pork (Myrtle, Mo.) and transported 918 miles to the NDSU Animal Nutri-tion and Physiology Center (ANPC; Fargo, N.D.). All gilts represented a common sire and were born within a seven-day window.
Upon reaching approximately 40 pounds, gilts were sorted,
blocked by litter and weight, and penned individually. Gilts were as-signed to one of two dietary treat-ments (TWD vs. TWD-GB) and pair-fed at 3.7 percent of body weight (BW) (12 gilts per treatment) for 91 days. Table 2 displays the dietary components expressed as a percent-age of total diets for both treatments.
A TWD was developed for swine using the results of the 2007-2008 National Health and Nutrition Examination Survey, “What We Eat in America.” In the TWD-GB diet, cooked ground beef (70:30 lean-to-fat blend) replaced sugar in the TWD on a kilocalorie (kcal) for kcal basis. Diets were formulated to be isocaloric.
Blood samples were collected on day 0 prior to treatment administra-tion and then every 28 days. Weekly BW were taken. Subcutaneous fat depth (FD) and longissimus muscle area (LMA) were measured at the 10th thoracic vertebra on day 42, then every 14 days thereafter.
The percentage of lean BW was estimated from an equation using FD, LMA and live BW. A dietary feed analysis was performed on both treatment diets. Data were ana-lyzed using the mixed procedure of SAS (SAS Institute Inc., Cary, N.C.) as repeated measures with fixed effects of treatment, day and treat-ment × day, with pig serving as the repeated variable. P-values for least square means were adjusted using the Tukey-Kramer method.
Diet Formulation and Feeding Protocol
Our TWD was designed for swine by Korry Hintze (Utah State University) by selecting the aver-age (50th percentile) daily intake levels for all reported nutrients for individuals greater than 2 years old reported to the National Health and Nutrition Examination Sur-vey (NHANES), “What We Eat in America,” for 2007-2008. Hintze
translated the human NHANES diet into a dietary ration suitable for swine. The swine diet provided by Hintze served as the base diet for the TWD treatment (Table 1).
Table 2 displays the dietary components expressed as a percent-age of total diets for both treatments. Fifty percent of the total carbohy-drates in the TWD were comprised of sugar (sucrose; fine ground table sugar) and the remaining 50 percent was represented by starch. In the TWD-GB diet, cooked ground beef (70:30 lean-to-fat blend) replaced sugar in the TWD on a kcal for kcal basis. Diets were formulated to be isocaloric and administered as described above. The nutrient infor-mation necessary to formulate the TWD-GB treatment was obtained from the USDA National Nutrient Database ground beef calculator (http://ndb.nal.usda.gov/ndb/beef/show). Due to the fact that the USDA’s ground beef calculator allowed a maximum of 30 percent fat to be entered, 70:30 lean-to-fat percentages were chosen for this project.
Results and DiscussionA feed analysis was performed
on both treatment diets. The TWD-GB diet was overall higher in crude protein, crude fat and lower in total carbohydrates when compared with the TWD (Table 3).
The TWD-GB gilts had greater BW gain through time (P < 0.01; Fig-ure 1). A linear increase in LMA and calculated lean BW were observed in TWD-GB vs. TWD (Figures 1 and 3). At the end of the test, TWD-GB had a larger cross-sectional LMA (33.1 centimeters [cm]2 vs. 14.3 cm2; P < 0.0001; Figures 2 and 3), less FD depth (2.0 cm vs. 3.1 cm; P = 0.0005), and greater percentage lean BW (51.6 percent vs. 34 percent; P < 0.0001) than TWD. Stunting of growth, attenuation of muscle depo-
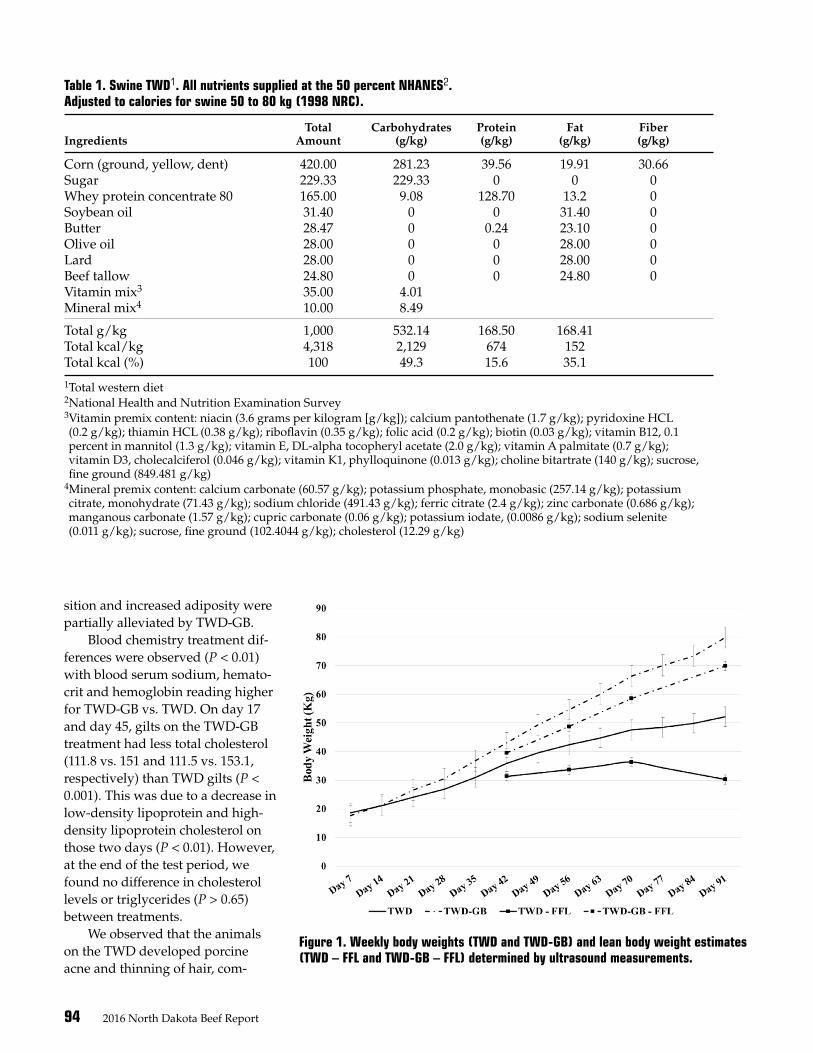
94 2016 North Dakota Beef Report
Table 1. Swine TWD1. All nutrients supplied at the 50 percent NHANES2. Adjusted to calories for swine 50 to 80 kg (1998 NRC).
Total Carbohydrates Protein Fat Fiber Ingredients Amount (g/kg) (g/kg) (g/kg) (g/kg)
Corn (ground, yellow, dent) 420.00 281.23 39.56 19.91 30.66Sugar 229.33 229.33 0 0 0Whey protein concentrate 80 165.00 9.08 128.70 13.2 0Soybean oil 31.40 0 0 31.40 0Butter 28.47 0 0.24 23.10 0Olive oil 28.00 0 0 28.00 0Lard 28.00 0 0 28.00 0Beef tallow 24.80 0 0 24.80 0Vitamin mix3 35.00 4.01 Mineral mix4 10.00 8.49
Total g/kg 1,000 532.14 168.50 168.41 Total kcal/kg 4,318 2,129 674 152 Total kcal (%) 100 49.3 15.6 35.1
1Total western diet2National Health and Nutrition Examination Survey3Vitamin premix content: niacin (3.6 grams per kilogram [g/kg]); calcium pantothenate (1.7 g/kg); pyridoxine HCL (0.2 g/kg); thiamin HCL (0.38 g/kg); riboflavin (0.35 g/kg); folic acid (0.2 g/kg); biotin (0.03 g/kg); vitamin B12, 0.1 percent in mannitol (1.3 g/kg); vitamin E, DL-alpha tocopheryl acetate (2.0 g/kg); vitamin A palmitate (0.7 g/kg); vitamin D3, cholecalciferol (0.046 g/kg); vitamin K1, phylloquinone (0.013 g/kg); choline bitartrate (140 g/kg); sucrose, fine ground (849.481 g/kg)4Mineral premix content: calcium carbonate (60.57 g/kg); potassium phosphate, monobasic (257.14 g/kg); potassium citrate, monohydrate (71.43 g/kg); sodium chloride (491.43 g/kg); ferric citrate (2.4 g/kg); zinc carbonate (0.686 g/kg); manganous carbonate (1.57 g/kg); cupric carbonate (0.06 g/kg); potassium iodate, (0.0086 g/kg); sodium selenite (0.011 g/kg); sucrose, fine ground (102.4044 g/kg); cholesterol (12.29 g/kg)
sition and increased adiposity were partially alleviated by TWD-GB.
Blood chemistry treatment dif-ferences were observed (P < 0.01) with blood serum sodium, hemato-crit and hemoglobin reading higher for TWD-GB vs. TWD. On day 17 and day 45, gilts on the TWD-GB treatment had less total cholesterol (111.8 vs. 151 and 111.5 vs. 153.1, respectively) than TWD gilts (P < 0.001). This was due to a decrease in low-density lipoprotein and high-density lipoprotein cholesterol on those two days (P < 0.01). However, at the end of the test period, we found no difference in cholesterol levels or triglycerides (P > 0.65) between treatments.
We observed that the animals on the TWD developed porcine acne and thinning of hair, com-
Figure 1. Weekly body weights (TWD and TWD-GB) and lean body weight estimates (TWD – FFL and TWD-GB – FFL) determined by ultrasound measurements.
The TWD-GB gilts had greater BW gain through time (P < 0.01; Figure 1). A linear increase in LMA and calculated lean BW were observed in TWD-GB vs. TWD (Figures 1 and 3). At the end of the test, TWD-GB had a larger cross-sectional LMA (33.1 centimeters [cm]2 vs. 14.3 cm2; P < 0.0001; Figures 2 and 3), less FD depth (2.0 cm vs. 3.1 cm; P = 0.0005), and greater percentage lean BW (51.6 percent vs. 34 percent; P < 0.0001) than TWD. Stunting of growth, attenuation of muscle deposition and increased adiposity were partially alleviated by TWD-GB.
Figure 1. Weekly body weights (TWD and TWD-GB) and lean body weight estimates (TWD – FFL and TWD-GB – FFL) determined by ultrasound measurements.
Figure 2. Cross-sectional LMA comparison between littermate gilt pair 3 (TWD-GB) and 4 (TWD) collected at slaughter
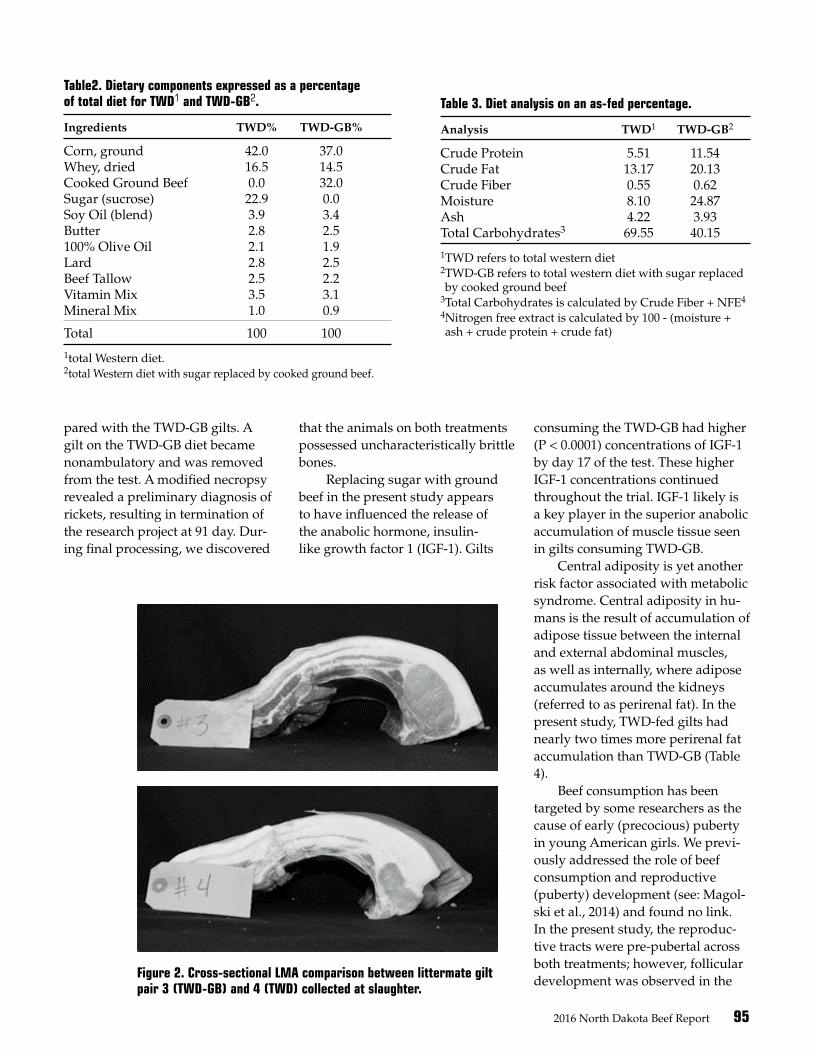
2016 North Dakota Beef Report 95
consuming the TWD-GB had higher (P < 0.0001) concentrations of IGF-1 by day 17 of the test. These higher IGF-1 concentrations continued throughout the trial. IGF-1 likely is a key player in the superior anabolic accumulation of muscle tissue seen in gilts consuming TWD-GB.
Central adiposity is yet another risk factor associated with metabolic syndrome. Central adiposity in hu-mans is the result of accumulation of adipose tissue between the internal and external abdominal muscles, as well as internally, where adipose accumulates around the kidneys (referred to as perirenal fat). In the present study, TWD-fed gilts had nearly two times more perirenal fat accumulation than TWD-GB (Table 4).
Beef consumption has been targeted by some researchers as the cause of early (precocious) puberty in young American girls. We previ-ously addressed the role of beef consumption and reproductive (puberty) development (see: Magol-ski et al., 2014) and found no link. In the present study, the reproduc-tive tracts were pre-pubertal across both treatments; however, follicular development was observed in the
Table2. Dietary components expressed as a percentage of total diet for TWD1 and TWD-GB2.
Ingredients TWD% TWD-GB%
Corn, ground 42.0 37.0Whey, dried 16.5 14.5Cooked Ground Beef 0.0 32.0Sugar (sucrose) 22.9 0.0Soy Oil (blend) 3.9 3.4Butter 2.8 2.5100% Olive Oil 2.1 1.9Lard 2.8 2.5Beef Tallow 2.5 2.2Vitamin Mix 3.5 3.1Mineral Mix 1.0 0.9
Total 100 100
1total Western diet.2total Western diet with sugar replaced by cooked ground beef.
Table 3. Diet analysis on an as-fed percentage.
Analysis TWD1 TWD-GB2
Crude Protein 5.51 11.54Crude Fat 13.17 20.13Crude Fiber 0.55 0.62Moisture 8.10 24.87Ash 4.22 3.93Total Carbohydrates3 69.55 40.15
1TWD refers to total western diet 2TWD-GB refers to total western diet with sugar replaced by cooked ground beef3Total Carbohydrates is calculated by Crude Fiber + NFE4
4Nitrogen free extract is calculated by 100 - (moisture + ash + crude protein + crude fat)
Figure 2. Cross-sectional LMA comparison between littermate gilt pair 3 (TWD-GB) and 4 (TWD) collected at slaughter.
Figure 3. Longissimus muscle area (cm2) at the 10th thoracic vertebra through time for gilts consuming a total Western diet (TWD) versus a TWD-GB where cooked ground beef replaced dietary sugar on a kcal for kcal basis.
Blood chemistry treatment differences were observed (P < 0.01) with blood serum sodium, hematocrit and hemoglobin reading higher for TWD-GB vs. TWD. On day 17 and day 45, gilts on the TWD-GB treatment had less total cholesterol (111.8 vs. 151 and 111.5 vs. 153.1, respectively) than TWD gilts (P < 0.001). This was
pared with the TWD-GB gilts. A gilt on the TWD-GB diet became nonambulatory and was removed from the test. A modified necropsy revealed a preliminary diagnosis of rickets, resulting in termination of the research project at 91 day. Dur-ing final processing, we discovered
that the animals on both treatments possessed uncharacteristically brittle bones.
Replacing sugar with ground beef in the present study appears to have influenced the release of the anabolic hormone, insulin-like growth factor 1 (IGF-1). Gilts
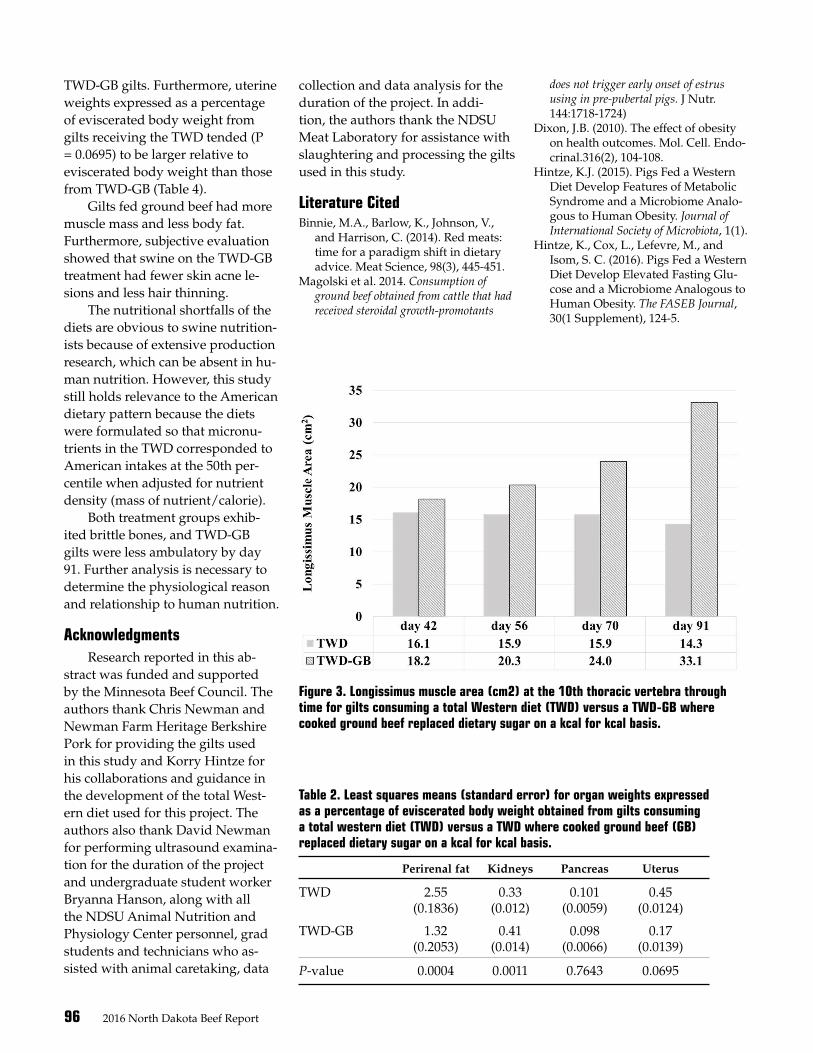
96 2016 North Dakota Beef Report
Figure 3. Longissimus muscle area (cm2) at the 10th thoracic vertebra through time for gilts consuming a total Western diet (TWD) versus a TWD-GB where cooked ground beef replaced dietary sugar on a kcal for kcal basis.
Figure 3. Longissimus muscle area (cm2) at the 10th thoracic vertebra through time for gilts consuming a total Western diet (TWD) versus a TWD-GB where cooked ground beef replaced dietary sugar on a kcal for kcal basis.
Blood chemistry treatment differences were observed (P < 0.01) with blood serum sodium, hematocrit and hemoglobin reading higher for TWD-GB vs. TWD. On day 17 and day 45, gilts on the TWD-GB treatment had less total cholesterol (111.8 vs. 151 and 111.5 vs. 153.1, respectively) than TWD gilts (P < 0.001). This was
Table 2. Least squares means (standard error) for organ weights expressed as a percentage of eviscerated body weight obtained from gilts consuming a total western diet (TWD) versus a TWD where cooked ground beef (GB) replaced dietary sugar on a kcal for kcal basis.
Perirenal fat Kidneys Pancreas Uterus
TWD 2.55 0.33 0.101 0.45 (0.1836) (0.012) (0.0059) (0.0124)
TWD-GB 1.32 0.41 0.098 0.17 (0.2053) (0.014) (0.0066) (0.0139)
P-value 0.0004 0.0011 0.7643 0.0695
TWD-GB gilts. Furthermore, uterine weights expressed as a percentage of eviscerated body weight from gilts receiving the TWD tended (P = 0.0695) to be larger relative to eviscerated body weight than those from TWD-GB (Table 4).
Gilts fed ground beef had more muscle mass and less body fat. Furthermore, subjective evaluation showed that swine on the TWD-GB treatment had fewer skin acne le-sions and less hair thinning.
The nutritional shortfalls of the diets are obvious to swine nutrition-ists because of extensive production research, which can be absent in hu-man nutrition. However, this study still holds relevance to the American dietary pattern because the diets were formulated so that micronu-trients in the TWD corresponded to American intakes at the 50th per-centile when adjusted for nutrient density (mass of nutrient/calorie).
Both treatment groups exhib-ited brittle bones, and TWD-GB gilts were less ambulatory by day 91. Further analysis is necessary to determine the physiological reason and relationship to human nutrition.
AcknowledgmentsResearch reported in this ab-
stract was funded and supported by the Minnesota Beef Council. The authors thank Chris Newman and Newman Farm Heritage Berkshire Pork for providing the gilts used in this study and Korry Hintze for his collaborations and guidance in the development of the total West-ern diet used for this project. The authors also thank David Newman for performing ultrasound examina-tion for the duration of the project and undergraduate student worker Bryanna Hanson, along with all the NDSU Animal Nutrition and Physiology Center personnel, grad students and technicians who as-sisted with animal caretaking, data
collection and data analysis for the duration of the project. In addi-tion, the authors thank the NDSU Meat Laboratory for assistance with slaughtering and processing the gilts used in this study.
Literature CitedBinnie, M.A., Barlow, K., Johnson, V.,
and Harrison, C. (2014). Red meats: time for a paradigm shift in dietary advice. Meat Science, 98(3), 445-451.
Magolski et al. 2014. Consumption of ground beef obtained from cattle that had received steroidal growth-promotants
does not trigger early onset of estrus using in pre-pubertal pigs. J Nutr. 144:1718-1724)
Dixon, J.B. (2010). The effect of obesity on health outcomes. Mol. Cell. Endo-crinal.316(2), 104-108.
Hintze, K.J. (2015). Pigs Fed a Western Diet Develop Features of Metabolic Syndrome and a Microbiome Analo-gous to Human Obesity. Journal of International Society of Microbiota, 1(1).
Hintze, K., Cox, L., Lefevre, M., and Isom, S. C. (2016). Pigs Fed a Western Diet Develop Elevated Fasting Glu-cose and a Microbiome Analogous to Human Obesity. The FASEB Journal, 30(1 Supplement), 124-5.

2016 North Dakota Beef Report 97

North Dakota State University does not discriminate on the basis of age, color, gender expression/identity, genetic information, marital status, national origin, physical and mental disability, pregnancy, public assistance status, race, religion, sex, sexual orientation, or status as a U.S. veteran. Direct inquiries to: Vice Provost for Faculty and Equity and Title IX/ADA Coordinator, Old Main 201, 701-231-7708. This publication will be made available in alternative formats for people with disabilities upon request, 701-231-7881.
2016 North Dakota Beef Report
(Photo by Lauren Hanna, NDSU)
(Photo by Rick Bohn, Central Grasslands REC)
(Photo by Sarah Underdahl, NDSU)
(Photo by Kendall Swanson, NDSU)
(Photo by Chanda Engel, Carrington REC)
(Photo by Sarah Underdahl, NDSU)
(Photo by Lawrence Reynolds, NDSU)