2015 nature awareness study
TRANSCRIPT

2015 Nature Awareness Study Population survey on nature and biological diversity

Imprint
Published byFederal Ministry for the Environment, Nature Conservation, Building and Nuclear Safety (BMUB)Public Relations Division · 11055 Berlin · GermanyE-mail: [email protected] · Website: www.bmub.bund.de/english
Federal Agency for Nature Conservation (BfN)Division: I 2.2 – Nature Conservation and SocietyKonstantinstraße 110 · 53179 BonnE-mail: [email protected] · Internet: www.bfn.de
Edited byDr. Jonna Küchler-Krischun, Mira Nürnberg (BMUB, Divsion: N I 1), Dr. Christiane Schell (BfN, Department: I 2),Prof. Dr. Karl-Heinz Erdmann (BfN, Divsion: I 2.2), Andreas Wilhelm Mues (BfN, Divsion: I 2.2) Concept and project managmentProject management: Dr. Christoph Schleer (SINUS-Institute)Dr. Fritz Reusswig (Potsdam Institute for Climate Impact Research)Project team: Dr. Marc Calmbach and Tamina Hipp (SINUS-Institute)In collaboration with:Sociotrend GmbH (support with statistical analysis)Ipsos GmbH (survey implementation)Supervised by the Federal Ministry for the Environment, Nature Conservation, Building and Nuclear Safety(BMUB, Dr. Jonna Küchler-Krischun) and the Federal Agency for Nature Conservation (BfN, Andreas Wilhelm Mues)
Translation byMaxine Demharter
Project reference number for this study3514 82 3400F+E project
DesignA Vitamin Kreativagentur GmbH, Berlinwww.avitamin.de
Picture creditsSee Title page: ‘Storchensafari2’ by Klaus Günther, BleckedeSee Page 4: BMUB/Harald FranzenSee Page 6: Photothek/Ute Grabowsky
DateOctober 2016

3
2015 Nature Awareness > Contents
Contents
Forewords . . . . . . . . . . . . . . . . . . . . . . . . . . . . . . . . . . . . . . . . . . . . . . . . . . . . . . . . 4
Summary and recommendations . . . . . . . . . . . . . . . . . . . . . . . . . . . . . . . . . . . . . . . . 8 1 Introduction. . . . . . . . . . . . . . . . . . . . . . . . . . . . . . . . . . . . . . . . . . . . . . . . . . . . 17
1.1 Objectives and concept . . . . . . . . . . . . . . . . . . . . . . . . . . . . . . . . . . . . . . . . . . 171.2 Introduction to the Sinus-Milieus . . . . . . . . . . . . . . . . . . . . . . . . . . . . . . . . . . . 181.3 Explanatory notes on this brochure. . . . . . . . . . . . . . . . . . . . . . . . . . . . . . . . . . 22
2 Agrarian landscapes. . . . . . . . . . . . . . . . . . . . . . . . . . . . . . . . . . . . . . . . . . . . . . . 24
2.1 Associations with agrarian landscapes. . . . . . . . . . . . . . . . . . . . . . . . . . . . . . . . 242.2 Perceived changes and subjects of protection . . . . . . . . . . . . . . . . . . . . . . . . . . . 262.3 Production methods, agricultural policy and genetic engineering . . . . . . . . . . . . . 31
3 Urban nature . . . . . . . . . . . . . . . . . . . . . . . . . . . . . . . . . . . . . . . . . . . . . . . . . . . 42
3.1 Urban nature: understanding and relevance . . . . . . . . . . . . . . . . . . . . . . . . . . . . 433.2 Accessibility and frequency of using urban nature;
satisfaction with inner-city nature . . . . . . . . . . . . . . . . . . . . . . . . . . . . . . . . . . 483.3 Social importance of urban nature . . . . . . . . . . . . . . . . . . . . . . . . . . . . . . . . . . 503.4 Personal importance of urban nature . . . . . . . . . . . . . . . . . . . . . . . . . . . . . . . . 54
4 Renewable energies and the countryside . . . . . . . . . . . . . . . . . . . . . . . . . . . . . . . . . 56
4.1 Energy transition. . . . . . . . . . . . . . . . . . . . . . . . . . . . . . . . . . . . . . . . . . . . . . 564.2 Acceptance of landscape-altering measures . . . . . . . . . . . . . . . . . . . . . . . . . . . . 59
5 General attitudes towards nature and nature conservation . . . . . . . . . . . . . . . . . . . . . 61
5.1 Personal importance of nature . . . . . . . . . . . . . . . . . . . . . . . . . . . . . . . . . . . . . 615.2 Perception of risks to nature . . . . . . . . . . . . . . . . . . . . . . . . . . . . . . . . . . . . . . 635.3 Sustainable use and conservation of nature . . . . . . . . . . . . . . . . . . . . . . . . . . . . 65
6 Biodiversity . . . . . . . . . . . . . . . . . . . . . . . . . . . . . . . . . . . . . . . . . . . . . . . . . . . . 70
6.1 Awareness of biodiversity: overall indicator . . . . . . . . . . . . . . . . . . . . . . . . . . . . 716.2 Sub-indicator: knowledge . . . . . . . . . . . . . . . . . . . . . . . . . . . . . . . . . . . . . . . . 726.3 Sub-indicator: attitude . . . . . . . . . . . . . . . . . . . . . . . . . . . . . . . . . . . . . . . . . . 746.4 Sub-indicator: willingness to act . . . . . . . . . . . . . . . . . . . . . . . . . . . . . . . . . . . 78
References. . . . . . . . . . . . . . . . . . . . . . . . . . . . . . . . . . . . . . . . . . . . . . . . . . . . . . . . 80
List of figures. . . . . . . . . . . . . . . . . . . . . . . . . . . . . . . . . . . . . . . . . . . . . . . . . . . . . . 83
List of tables . . . . . . . . . . . . . . . . . . . . . . . . . . . . . . . . . . . . . . . . . . . . . . . . . . . . . . 85
Basic count . . . . . . . . . . . . . . . . . . . . . . . . . . . . . . . . . . . . . . . . . . . . . . . . . . . . . . . 87
List of footnotes . . . . . . . . . . . . . . . . . . . . . . . . . . . . . . . . . . . . . . . . . . . . . . . . . . . . 102

4
2015 Nature Awareness > Foreword
Foreword
Dear Reader,
In the ‘2015 Nature Awareness Study’, citizens send extremely strong messages to agricultural policy makers. Agricultural issues to do with nature con-servation and animal protection play an important role for the bulk of the population. 92 percent of those surveyed speak out in favour of farmers giving greater consideration to the impact of their actions on nature. When it comes to food production, a clear majority of citizens (93 percent) think it important to consider animal welfare. There is no doubt in my mind that our treatment of farm animals leaves a lot to be desired. Animal husbandry too often takes place in highly cramped conditions, and this has a considerable impact on the ecological balance – there is an urgent need to revise the prevailing mindset and way of doing things in this respect. The results of this study prove that greater government intervention and regulation would have substantial backing from the population.
Another aspect of great interest to me is the deploy-ment of genetic engineering in agriculture – a highly topical issue. Based on the findings presented here, it becomes clear that a broad majority in Germany is positioning themselves against genetic engineering. 79 percent voice objections to the use of genetically modified farm animal feed, and 76 percent think it
is important to ban the use of genetically modified organisms in agriculture on principle. In contrast, there is strong approval for increasing consumption of regional products and for organic farming. The fig-ures indicate a clear standpoint on the part of society and form a good basis for banning any deployment of genetic engineering in food production.
The results from the study clearly show how citizens envisage a form of agriculture that is compatible with nature and ethically defensible. Around three in four respondents were even prepared to accept higher costs. I see this as evidence that we as a society are ready for change. The results also give me welcome support in implementing my Nature Conservation Campaign 2020; this calls for a marked change in subsidy policy and renewed efforts to bring about ecologically sound use of agricultural land. After all, farming is the main cause of declining biological diversity.
For me as the Federal Minister for the Environment, Nature Conservation, Building and Nuclear Safety, the results of the study on urban nature are especially important. It is here that two policy areas covered by my ministry come together. The ‘2015 Nature Aware-ness Study’ tells us for the first time in truly repre-sentative form how important our citizens find the
Dr. Barbara Hendricks

5
2015 Nature Awareness > Foreword
natural spaces within their cities. This will also feed into the current debates on ‘Greenery in the city’.
94 percent of respondents take the view that nature should be accessible in all parts of the city/town as far as possible. The bulk of people associate urban nature with quality of life, health, recreation and exercise. It is particularly interesting to note that those on the lowest incomes and elderly people make dispropor-tionately frequent use of urban green open spaces. Many such people neither have the privilege of own-ing a ‘country cottage’ nor do they have the means to ‘drive out into the countryside’. Hence they have to rely far more on urban nature attractions.
Another interesting result is that the population has learned to appreciate not only the recreational and lei-sure value of urban nature but also that urban green open spaces form vital habitats for animals and plants as well as being beneficial in terms of climate protec-tion and climate adaptation. The study reveals that the conservation and promotion of urban nature must become an urban development priority if we are to protect nature and climate, and safeguard our quality of life along with social justice.
For me, one insight to emerge from this year’s study discloses a concrete need for action: the figures reflect an unmistakable generation difference when it comes to nature awareness – up to 20 percentage points. On average, the group of 18 to 29-year-olds seems to perceive matters of nature conservation differently to the older generation. What does this result mean for objectives that affect society as a whole, such as nature conservation and the model of sustainable development? What kind of modern approach tailored to the target group could be adopted in order to render nature tangible for a generation growing up in a digitalised, technology-driven and urbanised era? We want to look into this more closely, together and in exchange with the younger generation. We are keen to actively involve adolescents and young adults along with their ideas on protecting nature and to enter into a dialogue with them. After all, nature conservation thrives on social endorsement and commitment in which all age groups play their part.
With the ‘2015 Nature Awareness Study’ presented here, you have access for the fourth time to a survey conducted every two years on social awareness of nature, nature conservation, and biological diversity. The ‘Nature Awareness Study’ is published jointly by the Federal Ministry for the Environment, Nature Conservation, Building and Nuclear Safety (BMUB) and the Federal Agency for Nature Conservation (BfN).
Surveying 2,000 randomly selected individuals from all parts of Germany, the study delivers represent-ative and significant data of great benefit to policy makers as well as to companies, scientists and nature conservation associations. At national level, the study reports on the state of social awareness with regard to biodiversity, the protection of which is an objective of the National Strategy on Biodiversity. At international level, it furnishes evidence for progress being made within Germany with regard to the implementation of Article 13 of the UN Convention on Biodiversity; this Article is all about providing information and raising awareness.
Over and above the routine questions that are crucial for observing developments over time, each new ‘Na-ture Awareness Study’ includes two new focal areas to allow scope for current questions of importance in nature conservation policy. The new study includes for the first time the topics ‘Urban nature’ and ‘Agrarian landscapes’. Both these areas also play a major role in the current Nature Conservation Campaign 2020 of the BMUB.
I hope you find this a stimulating read!
Dr. Barbara Hendricks Federal Minister for the Environment, Nature Conservation, Building and Nuclear Safety (BMUB)
6
2015 Nature Awareness > Foreword
Foreword
When asked about his relationship to nature, Mr. K. says: “Now and then, I would like to see a couple of trees when I step out of the house. Particularly because, thanks to their different appearance, according to the time of day and the season, they attain such a special degree of reality. Also, in the cities, in the course of time, we become confused, because we always see only commodities, houses and railways which would be empty and pointless if they were uninhabited and unused. In our peculiar social order, after all, human beings, too, are counted among such commodities, and so, at least to me, as I am not a joiner, there is some-thing reassuringly self-sufficient about trees, something that’s indifferent to me, and I hope that they have something about them that, even for the joiner, can’t be exploited.” “Why, if you want to see trees, do you not sometimes simply take a trip into the countryside?” he was asked. Mr. K. replied in astonishment: “I said, I would like to see them when I step out of the house.”
B. Brecht: Mr. K. and nature (translated by Martin Chalmers)
Dear Reader,
In my opinion, the above quote expresses perfectly what many of us are moved by when we think about our personal relationship to nature – especially since most people lead a life in or on the periphery of a city. The ‘2015 Nature Awareness Study’ presented here documents in hard figures the importance attached by citizens in Germany to being able to experience nature within their immediate urban environment. One of the questions asked was what nature in the city/town actually meant to them. 43 percent sponta-neously say “trees” – this is the second most common association with urban nature and, as such, shows
‘solidarity’ with Mr. K. as cited above. The only response given more frequently is “parks and green public spaces” (63 percent of respondents). People in Germany consider urban nature a valuable asset: 61 percent of Germans find it “very important” for nature to be accessible in all parts of a city/town as far as possible, while a further 33 percent find it “some-what important”. Questions were also asked about the importance of general functions and the personal importance of urban nature. It becomes clear that, on a broader level, great importance is attributed to urban nature, both in terms of human well-being and
Prof. Dr. Beate Jessel

7
2015 Nature Awareness > Foreword
as a habitat for flora and fauna. On a more personal note, respondents consider urban greenery to be of relevance mainly in terms of its impact on their own quality of life, as a space for recreation and relaxation, and because of its impact on their health.
Furthermore, the ‘2015 Nature Awareness Study’ examines for the first time how the population in Germany perceives domestic agriculture and agrarian landscapes. The respondents voiced considerable unease about industrialised agricultural production, particularly regarding the deployment of chemical pest and weed control, and genetically modified plants. Many of the questions linked to agricultural policy draw clear-cut opinions from respondents. For example, the majority endorse a two-pronged approach involving stricter laws and regulations to protect nature as well as the funding of ecologically sound agricultural practices.
With regard to the agrarian landscapes, the majo-rity of Germans say that many features they always considered typical, such as wild flowers, wild herbs, bees and butterflies, have been in decline over the past 10 years. It is, however, the older respondents who observe these changes. This would indicate that the younger generations lack the opportunity to compare today’s situation with the variety that existed in pre-vious decades and therefore take a less serious view of the declining biodiversity than older people.
I also find it especially striking that by focusing on urban nature and agrarian landscapes, the current ‘2015 Nature Awareness Study’ has revealed more clearly than ever the difference between city/town and country dwellers when it comes to their percep-tion of the natural world. All in all, the rural popula-tion appears more sensitive to the continuing loss of biodiversity within agrarian landscapes and is more convinced than city/town dwellers that agriculture must work in closer harmony with nature – doubtless due to their specific day-to-day experiences which re-main beyond the reach of those living in the (big) cit-ies. Parallel to this, we see how urban nature as a space in which to experience the natural world takes on ever greater importance the larger the resident population,
and how it represents an essential way of interacting with nature. Nevertheless, people’s true appreciation of nature doesn’t increase to the same degree! The residents of major cities with over 500,000 inhabitants are particularly inclined to attribute less importance in principle and less personal importance to urban na-ture than those living in smaller towns. These results provide food for thought, especially with regard to the factors contributing to a positive relationship between man and nature, which in turn is an important basis for a society geared towards protecting nature.
I’d like to end by referring to the research results on the energy transition in Germany. The energy transi-tion is a large-scale national project involving exten-sive changes in terms of landscape and technology. The previous ‘Nature Awareness Studies’ have already shown how citizens basically support the energy transition. After a slight drop in acceptance down to 56 percent in 2013, the ‘2015 Nature Awareness Study’ records an increase back up to 61 percent. The majo-rity of Germans take a fundamentally positive view of supplying the bulk of our energy via renewables. From a nature conservation perspective, however, any further development in this respect must definitely take place in a nature-friendly manner, not least to maintain the high degree of acceptance. This involves taking the interests of nature and landscape conserva-tion very seriously at the planning stage and ensuring that they are fed into the decision-making process as coherent and timely input. Not only must transparent procedures be deployed to enlighten the population concerned about the consequences of the measures for natural scenery, wildlife conservation and biotope protection, but efforts should also be made to involve citizens as much as possible. The ‘Nature Awareness Study’ can point the way towards numerous ap-proaches for tailoring information campaigns and involvement processes to specific target groups.
Prof. Dr. Beate Jessel President of the Federal Agency for Nature Conservation

8
2015 Nature Awareness > Summary and recommendations
Summary and recommendations
Agrarian landscapes
Here, for the first time, agrarian landscapes constitute a focal area of the ‘Nature Awareness Studies’. The sur-vey looks at how people in Germany perceive agrarian landscapes and what form of agriculture they would like to see.
Public appraisal varies as to whether selected natural features of the agrarian landscapes have tended to grow, decline or remain constant over the past 10 years. For instance, when it comes to bees and wild flowers, the majority say they have noticed a decline, whereas the situation for grassland and birds is thought to have remained constant (although this is contradicted by the available facts – cf. inter alia BfN 2014 and Sudfeldt et al. 2013). Whether or not people notice a decrease in features of the agrarian landscape depends very much on their age: the 50 to 65 year olds are always the group most likely to claim a decline, while the people under 30 are always least likely to do so. Similar is true for the var-ious features of the agrarian landscape and their worthiness of protection. The rate of approval here is basically high, with 65 percent of the general population saying they consider it very important to protect birds. But here again, it is primarily the 50–65 age group who con-sistently speak out very clearly in favour of protection (very important: 73 percent), as opposed to the people under 30 (54 percent). What is more, women consistently emphasize more strongly than men the importance of protecting the specific features of the agrarian land-scape, and people with mid-level formal education also manifest greater sensitivity when it comes to protection worthiness than those with a basic or advanced level of formal education.
Responses to the question of how agriculture impacts on nature and biodiversity reflect very clearly the unease within the population about industrialised agricultural production. People are most critical of chemical pest and weed control: 66 percent of the gen-eral population believe such procedures to be “very harmful” to nature and biological diversity, while a further 25 percent tend towards this opinion. Ranked next in the list of perceived risks are genetically modi-fied plants (very harmful: 45 percent, slightly harm-
ful: 31 percent) and the use of artificial fertilisers (very harmful: 35 percent, slightly harmful: 39 percent). A smaller number of people also name the spreading of conventional manure and slurry as a burden on the ecosystem (very harmful: 13 percent, slightly harmful: 22 percent). In most cases, respond-ent age is an important factor for how people estimate the potential risk: in the 50-65 age group, for example, 70 percent find chemical pest and weed control very harmful to nature and biodiversity, whereas just 59 percent of the people under 30 take this view.
In the ‘2015 Nature Awareness Study’, the population takes a very clear position on many of the agricultural policy areas surveyed. For instance, a vast majority of 93 percent indicate that animal husbandry should take animal welfare into account (very important: 65 percent, somewhat important: 28 percent). When it comes to agricultural decision-mak-ing, 64 percent find it very important to considering the impact on nature of any action taken, while a further 28 percent consider it somewhat important. An expansion of organic farming meets with the approval of 84 percent (very important: 46 percent, somewhat important: 38 percent). Here again, age plays a part, with just 57 percent of the people under 30 finding considering of animal welfare very impor-tant, compared to 74 percent of the 50 to 65 year olds. In addition, a significantly greater number of women than men adopt a stronger pro-nature conservation stance in their responses on agricultural policy.
People were also asked about their support for concrete measures of agricultural policy aimed at incor-porating more nature conservation into agriculture. Although 65 percent of the population fully believe or tend to believe that more nature conservation in agri-culture would make food products far more expensive, and even though people referred back to the cost factor again when asked about political measures, the study presented here substantiates strong public support for corresponding measures. What we are actually seeing here is the emergence of a dual strategy: the majority of respondents agree with both stricter laws and regula-tions to protect nature (I agree strongly: 45 percent, I agree somewhat: 38 percent) and state funding for a

9
2015 Nature Awareness > Summary and recommendations
more ecologically sound form of agriculture (I agree strongly: 30 percent, I agree somewhat: 44 percent). Here, women manifest stronger approval than the general population, a disproportionately low num-ber of people under 30 are in favour of stronger laws and regulations, and a disproportionately low num-ber of people with a lower level of formal education are in favour of funding. Inhabitants of major cities (population: over 500,000) plead the case for both measures less strongly, whereas citizens from smaller municipalities support them far more vehemently, in particular stricter laws and regulations.
As already shown in the previous ‘Nature Awareness Studies’, there is strong rejection among the population when it comes to genetic engineering in agricul-ture. The current ‘Nature Awareness Study’ provides more detailed results in this respect: 79 percent reject completely or at least tend to reject the idea of geneti-cally modified farm animal feed, and 76 percent con-sider it very important or at least somewhat important for genetically modified organisms to be banned from agriculture. This level of rejection, however, has fallen slightly compared to the previous studies: in 2009, as many as 87 percent of citizens still approved of such a ban. The study presented here also reveals that the younger generation of 18 to 29 year olds are less scep-tical than other age groups about genetic engineering: for example, 34 percent of this age category agree strongly or at least somewhat that they wouldn’t have a problem with consuming genetically modified food. The figure for the general public is merely 25 percent, and among the over-65 year olds as low as 17 percent, i.e. only half as many people as in the youngest group in the survey. Furthermore, men view the deployment of genetic engineering in agriculture slightly less critically than women.
It emerges that the size of someone’s city/town has a significant effect on how they respond to ques-tions on agrarian landscapes: inhabitants of smaller towns and villages are more conscious than people from major cities of the declining features in agrar-ian landscapes and their worthiness of protection; they are also more critical of farming techniques, they are more supportive of the measures to promote eco-friendlier farming surveyed here, and they view
the deployment of genetic engineering in agricul-ture with greater scepticism. Here, it is important to note the basic connection between the variables ‘age’, ‘education’ and ‘city/town size’ as revealed when sur-veying agrarian landscapes and urban nature, the new topics included in the ‘2015 Nature Awareness Study’: in smaller towns, the 50 to 65 age group is clearly over-represented in the sample but under-represented in the larger major cities. Similar is true of the group with mid-level educational attainment: these people are over-represented in smaller towns but under-rep-resented in the larger major cities (see here Chapter 2 and Chapter 3).
Recommendations:The fundamentally strong support amongst the population for ecofriendly agriculture represents a sound starting point for a rigorous implemen-tation of corresponding agricultural policies. It is a strong argument for the rapid realisation of the Nature Conservation Campaign 2020 of the Federal Environment Ministry (BMUB 2015 a), which spe-cifically examines EU agricultural policy and the promotion of an eco-friendlier form of agriculture. The population is firmly behind policies that use rigorous legislation and the subsidisation of nature conservation to increase the accountability of the farming sector. This is a precondition for bringing about an agricultural system that is more envi-ronmentally compatible, that safeguards animal well-being, and that promotes the sustainable use of biodiversity.
Alongside the precautionary principle of averting potential risks and impairments, the rejection of genetic engineering in agriculture as expressed by the population gives occasion for policy makers to pay closer attention to citizens’ health risk con-cerns, also at EU and international level. It is up to government and the relevant organisations to keep driving the societal discourse on genetic engineer-ing forward and provide objective information. In doing so, they should not only focus on scientific facts but also render the sociological and economic aspects more transparent. It is above all vital for the younger generation, with their less sceptical stand on the deployment of genetic engineering and the consumption of genetically modified food, to de-velop an awareness of the ecological and societal

10
2015 Nature Awareness > Summary and recommendations
pros and cons of genetic engineering and also to recognize who stands to benefit and who stands to lose from this technology.
Furthermore, the connection between area protection and animal welfare should be moved more to the fore in the future: grassland conser-vation and species-appropriate husbandry go hand in hand.
But the consumer should also take greater responsibility. Government and the relevant organi sations can do more to align consumer attitudes with nature conservation, and their will to act expediently with the way they ultimately behave. In order to reduce the discrepancy between attitudes and actions, it is crucial for government and non-government players to set a good example and spark incentives for alterna-tives to conventional consumption.
An ecofriendly form of consumption can also be promoted by specifically seeking to raise awareness among players in the food industry (including discounters and supermarkets) of the potentially vast market for eco-friendly products, and by offering support with the restructuring of their businesses and product ranges.
Nor must the desire for an eco-friendly agri-cultural system remain confined to Germany. Instead, targeted efforts should be made to inform the public that farming and consumption at both the local and global level raise questions of social justice that don’t just affect the consum-er in Germany but draw on and harm natural resources on a global scale as well as reinforcing post-colonial structures. One critical aspect to consider here is the over-production and export orientation of the national meat industry.
The results of the ‘2015 Nature Awareness Study’ show clearly which target groups should be focused on more closely in the future when it comes to raising awareness of the agriculture-re-lated decline of biodiversity and the need to safe-guard areas of unspoiled nature within agrarian landscapes.
Far more attention than before must be devot-ed to the generation of people under 30 when communicating nature conservation. Bearing in mind the statement “You only protect what you know”, it is fair to assume from the study results that people under 30 lack a comparison with past circumstan ces, and that they are less inclined to notice changes to the agrarian landscape, thus developing less awareness of the need to protect biodiversity. The less critical attitude of the people under 30 regarding the status quo of industrial farming production and aspects such as animal welfare or the deployment of pesticides also gives pause for thought.
It is also worth noting the different appraisals voiced by the urban and rural population, al-though here one can safely assume that the rural population speaks ‘from experience’ gained from its daily confrontation with agriculture, while the attitudes expressed by inhabitants of larger major cities in particular are based on their spatial and personal distance from agrarian landscapes.
There is evidence of a more marked distance to nature among both the people under 30 and the inhabitants of the larger major cities. An en-hanced thrust with the help of focused informa-tion and education programmes is recommended in order to render transparent the correlations between agricultural production and damage to the natural environment, strengthen personal action in areas such as shopping behaviour, and help steer political opinion towards eco-friendlier farming. Another recommendation that stands to reason with regard to younger and urban target groups is the fundamental promotion of man’s relationship with nature via positive experiences with nature acquired at an early stage; this would create an awareness of what it means to lose biodiversity and how important it is to conserve nature. One good approach in this respect might be to offer cross-generational projects that incor-porate the knowledge and life experience of older people.

11
2015 Nature Awareness > Summary and recommendations
Urban nature
Another area that was examined more closely for the first time in the ‘2015 Nature Awareness Study’ is that of urban nature. Open questions on urban nature designated to produce people’s spontaneous interpre-tation of nature in the city/town clearly reveal: Urban nature is understood first and foremost in spatial terms. 82 percent of the population think of parks and public green spaces, 43 percent mention water bodies, 37 percent gardens. Vegetation likewise represents an important aspect: it is named in this respect by 65 percent of the population, with trees accounting for the bulk of responses (43 percent). Concrete ways in which urban nature contributes to a fulfilled and hence “good life for human beings” are mentioned to a far more frequent degree than is the case with open questions on agrarian landscapes. For example, 23 percent spontaneously associate urban nature with places for sport and exercise, 17 percent mention quality of life and recreation, while 7 percent refer to leisure facilities. A certain appreciation within the population for other advantages of the urban eco system is expressed in as far as 6 percent spontaneous-ly associate urban nature with something that requires protection.
Evaluations concerning the importance of selected urban nature features are in line with spontaneous associations, with the highest importance being attributed to public parks (very important: 80 percent, somewhat important: 17 percent), roadside trees and plants (very important: 70 percent, somewhat impor-tant: 24 percent) and water bodies (very important: 60 percent, somewhat important: 33 percent). Women, and also people educated to mid-level and the 50 to 65 year olds, are more likely than the public in general to evaluate individual elements of urban nature as “important”. By contrast, a disproportionately lower number of men and people aged between 18 and 29 evaluate the same elements of urban nature as “important”. Here again, similarly to the findings on agrarian landscapes, there appears to be a link between the city/town size and the way people respond: while those living in cities with over 500,000 inhabitants attach great importance to urban nature, this propor-tion is slightly smaller than in places with smaller resident populations (take for example ‘Importance of roadside trees and plants’ – resident population of over 500,000: 63 percent in the answer category “very important”; resident population of 100,000 to 500,000: 77 percent in the answer category “very important”, population average: 71 percent).
Urban wasteland, i.e. land where nature is left to evolve spontaneously, meets with approval in the ‘2015 Nature Awareness Study’: a majority of 69 percent of the population endorse unmanaged urban areas (agree strongly: 25 percent, agree somewhat: 44 percent). It is however also important to realize that 30 percent take a negative view of such urban areas (somewhat against: 24 percent, completely against: 6 percent).
The accessibility of urban nature proves to be a major issue for people in Germany: 61 percent find this “very important”, a further 33 percent “somewhat impor-tant”. The number of women, the over-50s and people with mid-level educational attainment who consider it very important is greater than the population average. By contrast, the under-30s, men, and people with a higher level of formal education adopt this stance to a lesser degree. A milieu comparison shows that fewer members of the Escapist and Precarious social milieus attach importance to the accessibility of inner-city/town nature, whereas many of the Liberal Intellectuals do so (very important: Escapists: 53 percent, Precari-ous: 51 percent, Liberal Intellectuals: 75 percent).
A high level of satisfaction with the urban nature attractions also emerges: four in five Germans are satisfied with the ‘range of green spaces’ in their city/town (very satisfied: 34 percent, somewhat satisfied: 46 percent). This high level of satisfaction is more pronounced among the over-65s than the under-30s and stronger among women than men.
It is fair to say that people make very frequent use of urban nature: 9 percent of the population claim to use it daily, 30 percent several times a week, a further 34 percent at least several times a month. Older people over 65, women, better educated people and people on a low income use the range of inner-city/town nature more frequently than the population average, whereas the under-30s and people aged from 50 to 65 as well as men do so less frequently. What is more, access to urban nature is sought far more frequently the larger the city/town. For example, 38 percent of those living in places with 20,000 to 500,000 inhabitants use urban nature daily or several times a week, whereas the figure for those living in cities with over 500,000 inhabitants is 47 percent.
The questions on the social importance of urban nature clearly show that people in Germany consider urban nature to be most important for the well-being of the population (very important: 72 percent), followed by its importance as a habitat for animals and

12
2015 Nature Awareness > Summary and recommendations
plants, and for the look of the city/town (very impor-tant: 68 percent). Urban nature meets with less response as an argument for the market value of building plots and buildings (very important: 41 percent). Barring the economic argument, people with mid-level educational attainment, those between the ages of 50 and 65 and women agree more strongly than the population average with the survey items on the functions of urban nature, whereas men and the under-30s agree less strongly. The city/town size again plays a part here: the importance of all urban nature functions surveyed is rated lowest in cities with over 500,000 inhabitants. The highest importance is attributed to urban nature functions within the lifeworlds of the Socio-ecological and Liberal Intellec-tual milieus, and the lowest among the Precarious and Escapist milieus.
What is more, the results of the study show the high personal importance that citizens attach to urban nature. For instance, 92 percent state that urban nature is personally very important or at least somewhat important to them as space for recreation and relaxa-tion, and 91 percent emphasize the role of urban nature for their own quality of life and their health. Women, people with mid-level formal education, and the over-50s generally ascribe higher personal impor-tance to urban nature than men, the under-30s and people with a lower or higher level of formal educa-tion. The influence of city/town size is likewise discernible: in cities with over 500,000 inhabitants, the importance of urban nature is rated lower for all personal concerns surveyed than in medium-sized towns (20,000 to 100,000 inhabitants).
The appraisal of urban nature also reveals substantial differences between the different social milieus. With-in the socially more advantaged milieus such as the Social-ecologicals or the Liberal Intellectuals, for ex-ample, urban nature is accorded very high importance for quality of life (74 percent and 82 percent, respec-tively). Members of the socially disadvantaged milieus, on the other hand, attach far less importance to urban nature: within the Precarious milieu a mere 49 percent say that urban nature plays a very important role for their own quality of life, in the Escapist milieu as few as 44 percent.
Recommendations:The strong importance of urban nature for human beings can be seen as a motivation for retaining and continuing to expand such areas. Besides ‘typical’ elements such as municipal parks and roadside trees, greater focus should be placed on other forms such as green facade and green roof systems, with recog-nition being given to their great importance for the well-being of urban dwellers. The results presented here support corresponding urban planning consid-erations and measures, and also the acknowledge-ment and funding of inner-city gardening activities geared towards nature conservation. Greater support should be given to projects such as urban gardening and inter-cultural gardens in this respect, with a view to boosting nature awareness in urban areas.
The findings of the ‘2015 Nature Awareness Study’ provide strong backing for the Nature Conserva-tion Campaign 2020 of the Federal Environment Ministry, which aims inter alia to improve the conservation and tangibility of biodiversity in towns and municipalities.
In urban planning, it is always important to consider the possibility that urban wasteland can polarize the population. It therefore makes sense to involve the population in relevant cases/areas from the beginning and take their wishes and con-cerns seriously. Special attention should be given to highlighting the added value of urban wasteland for man and nature.
Not only the appreciation expressed, but also class-related effects clearly demonstrate the great potential of urban nature for promoting fulfilling, appreciative relations between man and nature. To this end, however, there is a need for low-thresh-old offerings to allow in particular the socially disadvantaged and the younger generations the chance to encounter urban nature. A possible focus might be the personal benefit to be gained from spending time in (urban) natural surroundings. For socially disadvantaged people, this could be the recreational and health effect of spending time there with friends and family for free, and for the under-30s it could be the opportunity offered by nature to enjoy a change from their hectic, technol-ogy-dominated everyday routine, and also a chance to engage in sport and exercise. The results of the

13
2015 Nature Awareness > Summary and recommendations
‘2015 Nature Awareness Study’ also document that the corresponding measures should begin by focusing on the city dwellers, who deviate from the population average on a number of questions.
Energy transition
After a slight drop in approval of the energy transition in 2013, the results of the ‘2015 Nature Awareness Study’ show a renewed increase in the values: 61 percent of citizens view this large-scale social pro-ject to supply the bulk of power from renewables as the right way to go (2013: 56 percent, 2011: 63 percent). At 29 percent of the overall population, the group of those who are undecided about energy transition has remained virtually stable compared to the previous survey (2013: 30 percent, 2011: 26 percent). The group opposed to the energy transition continues to repre-sent a minority in 2015 at 7 percent (2013: 10 percent, 2011: 6 percent).
The considerable differences between the social mi-lieus persist. It is mainly the socially advantaged who support the energy transition, while the less well-off aren’t as inclined to express approval. Nonetheless, the energy transition has indeed been able to acquire countless supporters in the latter population group: in 2013, only 33 percent of the Precarious milieu thought the energy transition was a good thing, but in 2015 this figure rose to 48 percent, and so is now back to the level recorded in 2011 (47 percent). At 51 percent in 2015, the Escapist milieu manifests a notable increase in its support compared to the previous surveys (2011 and 2013: 45 percent each). It is also striking to note that while the energy transition is still supported by the majority of the socially advantaged and conser-vation-oriented Social-ecological milieu (74 percent), there are signs of it weakening over time (approval in 2013: 81 percent, in 2011: 84 percent).
Approval of concrete measures for energy transition shows similar distribution patterns as in the previous surveys. The measures still enjoying the greatest support or at least acceptance are the expansion of wind energy plants (offshore and onshore) and photo-
voltaic plants, along with the changes that these bring to the landscape: approval here ranges between 80 and 74 percent overall. Approval for expanding the culti-vation of energy crops and for biogas plants (answer category “I think it’s a good thing” and “I’d accept it”: between 61 and 67 percent). The least popular poten-tial manifestations of a changing energy industry remain an increased rate of forest logging (26 percent approval or acceptance), and the further expansion of the high-voltage grid (37 percent).
A higher level of education goes hand in hand with strong approval for the expansion of wind energy and solar energy plants. In municipalities with a maxi-mum of 20,000 inhabitants, the proportion of those supporting a possible expansion of wind energy is clearly under-represented (mean: 28 percent, small town with 5,000 to 20,000 inhabitants: 20 percent, village with under 5,000 inhabitants: 13 percent).
Recommendations:Besides the enduring economic debate on the energy transition, it will also become increasingly important in future to incorporate its social dimension. The issue of social justice should be given more weight when planning the transformation of the energy system, and citizens should be seen as codesigners of and participants in the energy transition: the energy transition continues to represent a cost factor, particularly for members of the less privileged classes, and its practical realisa-tion at local level can create an area of conflict that needs to be tackled with a transparent approach.
Efforts must be made to explain to citizens in detail the interdependencies between nature conserva-tion and the energy transition, and also the oppor-tunities presented by an eco-friendly expansion of the project. An energy transition is without doubt in the interests of nature conservation, but not every measure is appropriate in every case and at any cost. For this reason, the Nature Conservation Campaign 2020 of the Federal Environment Minis-try expressly stipulates that the sites for renewable energy plants must be managed with ecofriendliness in mind.
14
2015 Nature Awareness > Summary and recommendations
Relationship to nature and basic attitudes to nature conservationAs shown in the predecessor studies, the majority of the population attribute high importance to their personal relationship to nature: in the current study, 94 percent agree (strongly: 69 percent, somewhat: 25 percent) that nature is part of a good life. 92 percent agree (strongly: 59 percent, somewhat: 33 percent) that it’s important in raising their children to help them discover nature, and 90 percent agree (strongly: 55 percent, somewhat: 35 percent) that it makes them happy to spend time in natural surroundings. Howev-er, differences emerge between the various population groups – albeit at a high level. For example, older peo-ple and women generally rate a life in and with nature more highly than do younger people and men. What is more, people with mid-level formal education also show a slightly stronger bond with nature. Vast dif-ferences emerge between the different social milieus when it comes to the importance of nature for people’s own life and well-being. For example, only half the members of the socially disadvantaged Precarious and Escapist milieus, respectively, strongly agree that nature is part of a good life. In all other milieus, this is the case among well over half the members (between 62 and 86 percent).
Interestingly, it also becomes clear from the data of the present Nature Awareness Study that the strength of the personal relationship to nature is influenced by seasonal changes. The 2015 and 2009 Nature Awareness Studies that were conducted in summer record a far stronger relationship to nature than in the 2011 and 2013 ‘winter surveys’. This effect was not observed in this form for other sets of questions.
The population in Germany is aware that nature is at risk: 83 percent feel angry that so many people treat nature so recklessly (agree strongly: 47 percent, agree somewhat: 36 percent). Women, people over the age of 50 and people with mid-level educational attainment are more bothered by this than men and people between 18 and 29. 65 percent are afraid that hardly any intact natural environment will be left for the coming generations (agree strongly: 22 percent, agree somewhat: 43 percent), and 49 percent feel threatened by the destruction of nature in their own country (agree strongly: 12 percent, agree somewhat: 37 percent). On the other hand, just 22 percent feel
that people worry too much about the destruction of nature (agree strongly: 7 percent, agree somewhat: 15 percent). Men take this stance more frequently than women, and people aged between 18 and 29 more fre-quently than other age groups. From the social milieu perspective, it becomes clear that less socially advan-taged groups of people are more likely to strongly or at least somewhat agree that people worry too much about the destruction of nature (Escapists: 35 percent, Precarious: 36 percent).
Nature conservation enjoys strong support: 93 percent of the population strongly or at least some-what agree that it is man’s duty to protect nature, and 86 percent take the view that nature conservation in Germany represents a major political task (agree strongly: 45 percent, agree somewhat: 41 percent). On the other hand, however, 44 percent strongly or at least somewhat agree that it’s impossible as an individual to make any real contribution towards protecting nature, and only 24 percent consider themselves completely responsible for conserving nature (somewhat responsible: a further 47 percent). The sense of personal responsibility here depends very much on age: 29 percent of the 50 to 65 year olds strongly agree with the statement, whereas just 19 percent of the people under 30 take this position. The youngest group in the survey is also significantly less likely to take the view that nature conservation in Germany represents a major political task (79 percent compared to the population average of 86 percent).
As in the previous surveys, statements on the sustainable use of nature meet with strong approval within the population: between 56 and 62 percent agree strongly with the content in question, a fur-ther 31 to 35 percent agree somewhat. This includes statements that emphasize using nature in terms of a lasting conservation of animal and plant species along with the characteristic features and beauty of nature and landscape, that keep an eye on ways for future generations to be able to use nature, or that address the issue of showing consideration for people in poor-er countries. Women, people with mid-level educa-tion, and citizens between the ages of 50 and 65 show an above-average degree of support for the principles of a sustainable use of nature, whereas the figures for men and people aged between 18 and 29 are lower than the population average.

15
2015 Nature Awareness > Summary and recommendations
Recommendations:It is fair to conclude from the results of the Nature Awareness Study that the expression of positive attitudes and views on nature and nature conserva-tion represents a social norm. This can be exploited in the communication of nature conservation. However, it is vital here to consider the discrepancy between different social groups. Well-off milieus already manifest very strong nature aware-ness, but need to be made even more aware of the responsibility they bear for their resource-intensive lifestyle. This also means – in a nutshell – that greater demands can be made of these milieus. However, the socially disadvantaged milieus show a less pronounced form of nature awareness and should be encouraged to seek contact with nature so that they can develop a more appreciative relationship to their natural environment.
Although nature conservation is perceived more as our human duty than as an important political task, citizens often feel unable to become active themselves. In future, therefore, still more could be done in terms of environmental education, lobbying and also policy to demonstrate and disseminate concrete courses of action (including lowthreshold measures). Furthermore, associations and policy makers should step up targeted funding for innovative nature conservation networks, some of which may still be at the fledgling stage; one possi-bility in this respect is to use the new media to plan high-profile activities with relevant groups.
Biodiversity
The Convention on Biological Diversity (CBD; United Nations 1992) was signed at the 1992 World Summit in Rio de Janeiro in order to counter declining biodiver-sity at international level. In Germany, the domestic implementation of this convention takes place within the framework of the National Strategy on Biodiver-sity (NBS). With a view to enhancing social awareness of biodiversity, the objective was drafted that “in the year 2015 […], at least 75 percent of the population will rate the conservation of biological diversity as one
of the top priorities for society.” (BMU 2007, p. 60ff). Achievement of this target has been measured via the ‘Public awareness of biodiversity’ indicator, comput-ed every 2 years since 2009 by the Nature Awareness Studies. It captures the proportion of the population that attributes high social relevance to conserving biodiversity and that meets the necessary conditions with regard to the three sub-components (knowledge, attitude, and behaviour). Since the overall indicator corresponds to the percentage of people who meet the requirements in all three sub-areas the value for the overall indicator is inherently lower than that for the lowest sub-indicator. People may fulfil individual sub-indicators to a far higher degree.
The current measured data verifies that in 2015, 24 percent of the population fulfil the conditions of the indicator. No statistically significant improvement has taken place since the start of the surveys, with fluctuations in the measured data since 2009 totaling a maximum of 3 percent. This means that in 2015, awareness for biodiversity in Germany is still a long way off the declared target.
The knowledge indicator taken by itself has remained relatively stable since 2009, at 40 to 42 percent (2015: 41 percent), but in 2015 the section of the population purporting to know what the term ‘biodiversity’ means is showing signs that people’s understanding of the term is now more limited. The number of people familiar with the term has fluctuated between 40 and 44 percent of the overall population since the surveys started (2015: 42 percent). Between 2009 and 2013, understanding of the term appeared to have broad-ened within this group (but not notably beyond it) to produce an interpretation of biodiversity as some-thing that embraces not only the diversity of species but also the diversity of ecosystems and the genetic diversity within a species. In 2015, knowledge about species diversity has fallen by 7 percent compared to 2013, and is now correctly assigned by only 88 percent of those familar with the term. Knowledge of biodi-versity as pertaining to the diversity of the ecosystems has dropped from 70 percent in 2013 to 54 percent in 2015, while knowledge about genetic diversity has fallen from 41 percent in 2013 to 30 percent in 2015. Younger people under the age of 30, those with a higher level of formal education, and people with a high net household income are shown to know more

16
2015 Nature Awareness > Summary and recommendations
about the forms of biodiversity. The upmarket milieus generally manifest far better knowledge of biodiversi-ty than socially less advantaged milieus.
The ‘attitudes’ sub-indicator, with a current measure-ment reading of 53 percent compared to the previous surveys, remains relatively unchanged (2009 and 2013: 54 percent, 2011: 51 percent). Here again: upmarket milieus generally show more definitive attitudes towards the threat to and personal importance of bio-diversity than the socially disadvantaged milieus.
There is a welcome development emerging for the willingness to act sub-indicator: people’s willingness to make a personal contribution to conserving bio-diversity has risen by 9 percent since the last survey (2013: 50 percent, 2015: 59 percent). This indicates that there is considerable willingness in Germany to take expedient action, above all in terms of low-threshold options such as purchasing regional fruit and vege-tables, or signing a petition in favour of conserving biodiversity.
Whether people are prepared to contribute towards conserving biodiversity themselves depends on age, but also on the degree of formal education. For example, 64 percent of the 50 to 65 year olds are “very willing” to purchase fruit and vegetables from their region, whereas just 47 percent of the 18 to 29 year olds claim the same. 22 percent of those with a higher level of formal education are “very willing” to write a letter to the government or the authorities in question in which they point out the need to protect biodiversi-ty. Among those with a lower level of formal educa-tion, only 13 percent can imagine doing so. Further-more, there are many areas where women are shown to be more willing than men to take action.
The social milieus again play a role for the willingness to act: the socially better-off tend to voice greater will-ingness to behave in an expedient way than socially more disadvantaged groups.
Recommendations:The findings of the ‘biodiversity’ social indica-tor match the findings of basic social scientific research in leading us to conclude that it is not pri-marily knowledge about diversity within the pop-ulation that counts as much as the need to focus on promoting a willingness to behave in an expedient way. Contrary to the knowledge sub-indicator, positive values can be recorded here; this crucial factor seems to pave the way for the establishment of an eco-friendly society.
Furthermore, one has to admit that the attitudes expressed are often out of sync with actual actions. In order to minimise this discrepancy in future, it is important to present people with concrete, easy to implement behavioural options. There is also a need to communicate more vig-orously the negative consequences of damage to biodiversity for people’s own lives and region – not just to create concern (which would merely impact on willingness to take expedient action), but also to lend transparency to moral issues surrounding the initiators and victims behind man’s destruction of nature and thus to promote social discourse on the subject.
A form of communication especially geared to specific target groups is here again of great impor-tance. Well-off milieus can be assigned a pioneer-ing role, but they should also be encouraged to see this as their social responsibility. In this context, one should not be frightened of initiating a sufficiency debate on what really is necessary for a good life and what kind of lifestyle is defensible from the perspective of sustainability and fairness. As for the socially disadvantaged classes, the call for a positive relationship to nature remains a key recommenda-tion for promoting a stronger willingness to behave expediently in order to protect biodiversity.

17
2015 Nature Awareness > Introduction
1 Introduction
The ‘2015 Nature Awareness Study’ is a representative population survey on how the German people view nature and biodiversity. It is the fourth in a series of studies that has been organised every 2 years since 2009 by the Federal Ministry for the Environment, Nature Conservation, Building and Nuclear Safety (BMUB) and the Federal Agency for Nature Con-servation (BfN). The survey sheds light on what the population understands by nature, how it perceives and experiences nature, how it campaigns for na-ture conservation, and how it rates current issues surrounding nature conservation policy. The survey monitors social trends to provide the public with continuous feedback on nature awareness within the German population. It also provides all those committed to nature conservation in an official and voluntary capacity with pointers for related concepts and strategies.
The previous Nature Awareness Studies met with great public interest and verified the strong support of the population for matters of nature conserva-tion and biodiversity. However, in order for social change to evolve in such a way that sustainability, eco-friendliness, etc. go without saying, one has to factor in nature conservation goals to a greater extent and offer active support when it comes to lifeworlds, political decisions, and the established structures of production, trade and consumption. Policy makers for nature conservation policies and those active in nature conservation associations, municipalities or state institutions can make an essential contribution here, for example via information, communication and education measures. Substantiated insights are required into areas such as values, behavioural mo-tives and lifestyles within society, not least because of the existing discrepancies between people’s declared intention and their actual everyday behaviour: the ‘2015 Nature Awareness Study’ presented here also plays its part in this.
The underlying population for this study is the Ger-man-speaking resident population aged 18 and over. A total of 2,054 people were interviewed in the compu-ter-assisted face-to-face interviews (CAPI) in May and June 2015. The study was designed by SINUS Markt- and Sozialforschung GmbH in close consultation with the clients. The data was collected by Ipsos GmbH,
with evaluation and interpretation being undertaken jointly by SINUS, Dr. Fritz Reusswig from the Potsdam Institute for Climate Impact Research (PIK) along with the BMUB and BfN. A working group of experts was on hand to advise the project team: Dr. Jan Barkmann (University of Göttingen), Prof. Dr. Ulrich Gebhard (University of Hamburg), Dr. Astrid Häger (University of Berlin), Rieke Hansen (University of Munich), Prof. Dr. Wolfgang Schumacher (University of Bonn), Prof. Dr. Volker Stocké (University of Kassel), and Peter Werner (Institut Wohnen und Umwelt GmbH [IWU] – Institute for Housing and the Environment).
A final scientific report with in-depth analyses of the survey results is planned for the summer of 2016. As in the case of the previous studies, upon completion of the research project the dataset will be made available as an SPSS file of the scientific research community via the Data Archive for the Social Sciences at the GESIS – Leibniz Institute for the Social Sciences.
This brochure along with the preceding studies and the respective in-depth reports can be downloaded from the BfN website (www.bfn.de/naturbewusstsein.html). The English brochure of basic data will be available online from June 2016 at www.bfn.de/ nature-awareness-study.html.
1.1 Objectives and concept
The Nature Awareness Study is designed as a tool for the continuous monitoring every 2 years of the population’s awareness of nature, nature conservation and biodiversity. The intention is to make available up-to-date and empirically validated data with which to draft substantiated pointers and strategies for the success and acceptance of nature conservation policy, communication and education. The size of the sample and the random selection of respondents means that the survey is representative for the whole of Germany.
The ‘Nature Awareness Study’ on the one hand com-prises a basic framework of constant questions with which to identify trends in nature awareness. On the other hand, each survey focuses on new topics that tie in with current public debate and conservation policy.

18
2015 Nature Awareness > Introduction
The following topics have been carried over from the previous studies:
› man’s relationship with nature / personal impor-tance of nature;
› appraisal of the threat to nature; › attitudes towards the protection and use of nature; › acceptance of the energy transition and appraisal
of altered landscapes in the course of the energy transition;
› and knowledge, attitudes and willingness to act expediently to prevent the loss of and maintain biodiversity.
The first three topic areas deal with the core of nature awareness within society. The task here is a milieu- specific mapping of this core over time in terms of its essence, different characteristics and changing elements. The fourth point was first taken up in the 2011 Nature Awareness Survey to illustrate how the population feels about the impact of the energy tran-sition on nature and the look of the landscape. The debates revolving around how politics, industry and society can promote the energy transition also have a direct bearing on nature conservation and mustn’t be allowed to stall, which is why this area was pursued further in 2013 and 2015.
Biological diversity is an integral part of every Nature Awareness Study. It measures social awareness of the value of biological diversity to produce the so-called social indicator for the National Strategy, of which regular reports are a mandatory component.
New topics in the ‘2015 Nature Awareness Study’ are
› ‘Agrarian landscapes’ and › ‘Urban nature’.
Use of our agrarian landscapes is changing all the time. Climate change, the energy transition or chang-ing market conditions for agricultural products are essential drivers of this development, so it is espe-cially important to devote greater attention to nature conservation in such areas. It is all too often the case that the targets pursued in commercial land use seem irreconcilable with the objective of protecting animal and plant species along with their habitats. This study presents results that show how the German people ap-praise the development of birds, wild plants, meadows, grazing land and other features of agricultural land.
How much importance do they attach to conserving the diversity of agrarian landscapes? How do they evaluate the deployment of genetic engineering in agriculture, and to what extent would they endorse financial support for farming in the interests of nature conservation, even if paid for with taxpayers’ money?
The idea that green urban spaces influence the quality of life isn’t new; anyone who takes the time to walk through a park knows how calming it is. But green urban spaces have far more than recreation to offer to stressed city dwellers: they also improve air quality and are beneficial for the urban climate thanks to their ability to regulate high temperatures. What is more, they provide an important habitat for animals and plants. But how does general public view this? How important is their urban nature? How important do they consider green spaces to be? And how often do they actually frequent urban nature facilities? These questions are addressed for the first time in the ‘2015 Nature Awareness Study’.
1.2 Introduction to the Sinus-Milieus
Sociodemographic attributes such as age, education and gender are often not enough to explain individual attitudes, patterns of behaviour and means of access-ing nature. How people experience and use nature and what they feel towards it, depends just as much, if not more, on their lifestyles and basic values.
For this reason, the sociocultural approach of the Sinus-Milieus has been integrated into the research design of the Nature Awareness Studies since 2009 as a means of enhancing the sociodemographic analysis with lifestyle- and value-related components.
Sinus-Institut bases its determination of target groups on an analysis of the different lifeworlds in our society. Unlike traditional social stratification or lifestyle models, this is a socio-cultural classification. Basic values that determine lifestyle and goals in life are taken into account, along with everyday attitudes towards work, family, leisure and consumption. The Sinus-Milieus thus highlight the individual within their lifeworld as a holistic frame of reference.
Figure 1 shows the Sinus-Milieus in Germany in 2015. The milieus are positioned in a plane between two

19
2015 Nature Awareness > Introduction
axes: socio-cultural basic values and social status. So-cial status refers to where the milieu stands in society in terms of education, income and occupatio nal pres-tige, and is tied to the existence of economic, cultural, social and symbolic assets. The higher the location of a milieu in this chart, the more up-market the social class1 of its members; the further to the right its position, the more modern its basic orientation in a socio-cultural sense. However, the boundaries between the milieus are fluid. It is in the nature of so-cial reality that lifeworlds cannot be delimited in the same (apparently) exact way – for instance by income or educational attainment – as social classes. We refer to this as the indeterminacy principle of everyday reality. Indeed, one of the fundamental features of the milieu concept is that there are points of contact and overlap between the different milieus.
As a scientifically validated model, the Sinus-Milieus reflect the socio-cultural changes in our society. The horizontal axis of the Sinus-Milieu model visualises the change of values in Germany since the 1950s by consolidating the respective defining values into corresponding basic orientations. Basic orientation includes not only values in the stricter sense (such as duty, achievement, family, security, order, personal
fulfilment, participation and autonomy) but also everyday attitudes and goals in life.
Basic orientations crucially define the way that people in our society live and think: for the 1950s generation, it was largely traditional values based on duty and or-der (Clinging on to & preserving) that were important. In the following decades, standard of living, status and property grew in social importance (Having & en-joying). In the 1970s, personal fulfilment, emancipa-tion and authenticity became the new guiding social principles (Being & changing). The 1980s and 1990s saw a shift in the spectrum of social values towards pleasure, multiple options, a faster pace of life and pragmatism (Doing & experiencing). There has been evidence of accelerated social change since the turn of the millennium. Increasing complexity and insecu-rities (for example in the context of digitalisation and globalisation) have emerged as new challenges; these are being met through different kinds of reorientation such as exploration, refocusing or the formation of new syntheses (Overcoming limitations).
Brief illustrative profiles of the Sinus-Milieus are given below.
Figure 1: The Sinus-Milieus in Germany 2015
Social Status and Basic Orientation
Clinging on to PreservingTradition
Having & enjoying Being & changingModernisation / Individualisation
Doing & experiencing Overcoming limitationsReorientation
Basic Values
Soci
al s
tatu
s
Traditional milieu13 %
New middle class milieu13 %
Established Conservatives
milieu10 %
Precarious milieu 9 %
Socio-ecological milieu
7 %
Liberal Intellectual milieu
7 %
High Achiever
milieu8 % Movers and
Shakers milieu8 %
Adaptive Pragmatist milieu
10 %
Escapist milieu 15 %
Low
erM
iddl
e H
ighe
r
20
2015 Nature Awareness > Introduction
Up-market milieusThe Established Conservative milieu represents the classic Establishment. A key concern for members of this milieu is the preservation of proven traditions and ways of life. In contrast, they reject post-modern arbitrariness and hedonistic thrill-seeking, instead preferring to see themselves as a responsible social elite. Their actions are driven by a need to achieve, paired with a belief in personal responsibility. They are very interested in society, politics and the Church, show relatively strong social engagement and defend their right to have a say in matters. Many aspire to be social opinion leaders.
Sociodemographic attributes
› Milieu in the middle to older age group: focus from 40 to 70, average age: 51
› Intermediate to advanced educational attainment, 30 percent have a university degree (overall: 14 percent)
› Often married, children in the household › Company employees in executive and highly quali-
fied posts, senior officials; well off, high incomes
The Liberal Intellectual milieu is the enlightened academic elite, with a liberal, cosmopolitan outlook on life, post-material roots and the desire to lead a self-determined existence. This mostly very well-off milieu supports a view of the world based on global thinking and detachment from any kind of ideolo-gy. Its members regard the growing complexity that comes with a global world as a challenge, and they endorse cultural pluralism. This milieu typically seeks intellectual stimulus via art, music or culture. Liberal Intellectuals accept the meritocracy, but also feel duty bound to work towards a better and fairer world.
Sociodemographic attributes
› Middle age groups: focus 40 to 60, average age: 46 › High level of formal education; highest percentage
of university degrees of all the milieus › Often married, with children in the household › Disproportionately high number works full- or
part-time; above-average number of independent professionals, along with many highly qualified company employees and executives; high net household income
The High Achievers have a competitive mindset in every aspect of life (job, leisure, sport). They are keen
to tackle challenges successfully and be among the best. Their view of the world is shaped by neo-liberal convictions; they have a penchant for efficiency, a global mindset, a cosmopolitan lifestyle, free markets and deregulation. They have a rigorously individual-istic idea of achievement and possess absolute self-be-lief. The members of this milieu like to get things done, and see themselves as smart, dynamic and visionary. The new media are a natural part of their day-to-day life. They are wary on principle of compla-cency, self-satisfaction, dogma and ideology.
Sociodemographic attributes
› Age focus: 30 to 50; average age: 42 › Men are slightly over-represented › High proportion of singles; couples without and
with (younger) children › Many with advanced educational qualifications
and a degree › Largest percentage of working people of all the mi-
lieus; many work in highly qualified and executive positions, and many are independent professionals; high net household income
The Movers and Shakers milieu has a very young membership that sees itself as a post-modern avant-garde. They reject pressure and are averse to antiquated roles and routines. They are resistant to ideological straitjackets, preferring instead to tran-scend boundaries and experience new things. Many Movers and Shakers are in unconventional careers (for instance the creative sector) and have patchwork biographies. Their search for movement, innovation and inspiration leads them to practice mental and geographical mobility, preferably in urban niche locations.
Sociodemographic attributes
› The youngest milieu: two thirds are under 30; average age: 29
› Many singles, with and without children of their own; many still live with their parents
› High level of formal education: disproportionately high number hold the university entrance certifi-cate
› An above-average number of school/university stu-dents and trainees; many have never yet had a job; above-average household income (affluent parental home); those in jobs are on average to high income.

21
2015 Nature Awareness > Introduction
Middle-class milieusThe New Middle Class milieu represents society’s down-to-earth mainstream. These people strive for a harmonious life in ordered circumstances. Life re-volves around the family and immediate neighbour-hood, with a dense network of friends, neighbours and relatives. Many milieu members worry about slipping down the social ladder and are afraid of not being able to keep pace with society when it comes to technology, social status and income; there is a fear of not being able to cope with the demands of a globa-lised world in the long term. They see themselves as average consumers who form the middle-class back-bone of society.
Sociodemographic attributes
› Middle age group and older people from the age of 40; average age: 51
› Intermediate level of educational attainment; small number of academics
› High proportion of married people compared with other milieus; often older children living at home, but also ‘empty nesters’
› Slightly over-represented in the eastern German Länder
› Predominantly working; junior clerks/middle managers, skilled workers; 26 percent are already retired; average income brackets
The Adaptive Pragmatic milieu embodies the well-qualified, partly over-conformist, ambitious and non-ideological young centre of society. A typical facet of this milieu is its balancing act between an achievement and family orientation, between a need for adventure and a sense of security, and also between retaining their autonomy and having firm roots. They display pronounced utilitarianism, are benefit rather than risk oriented, and identify with our achievement- and competition-oriented society. The Adaptive Pragmatics shun extremes. They want to make life as pleasant as possible for themselves and be able to afford the things they like, while retaining a flexible and realistic approach to life.
Sociodemographic attributes
› Age focus under 50; average age: 38 › Half are married, often with no children or young
children › Middle to higher level of education (intermediate
and/or university entrance certificate), or still in education/training
› Junior clerks, middle managers, qualified company employees, and skilled workers; disproportionately
large number of part-timers or trainees; average to upper income brackets (many double earners)
Firmly embedded in the Socialecological milieu is a strong scepticism of growth and globalisation. Its members’ view of the world is dominated by idealism and a sense of mission. Many see themselves as the conscience of society, as the bearers of global respon-sibility and relentless critics of wrongdoing. They follow the principle of sustainability when it comes to consumption, generally aiming to follow a rigorously ecological lifestyle on a daily basis in areas such as nutrition, living, energy and mobility. However, they are not hostile per se to technology and accept, for instance, innovative technologies that tackle environ-mental problems.
Sociodemographic attributes
› Broad age range: 30 to 60; average age: 50 › Women over-represented › High proportion of divorcees › High level of formal education
Highest share of part-timers by comparison with other milieus; many qualified company employees and senior officials, also self-employed persons and free-lancers; average income bracket
Lower-middle-class / lower-class milieusThe Traditional milieu represents the war/post-war generation with a penchant for public safety and order. Its view of the world is shaped by conformity and traditional ideas of morality, and also hierarchi-cal, authoritarian structures; its members are often critical of moral decline and foreign infiltration. Their actions are guided by humility and the need to adapt to requirements; they don’t aspire to lofty goals but are instead happy to adhere to routines, rituals and customs. This explains the unease felt about change and the disinclination to get involved in anything new or different.
Sociodemographic attributes
› The oldest milieu: focus on the over-60 age seg-ment; average age: 68
› A high proportion of women, and also many retired people/pensioners and widow(er)s
› A mostly lower level of formal schooling (primary/lower secondary level)
› Low to average incomes
The Precarious milieu is the lower class striving for orientation and participation. The pronounced consumerism of the Precarious (or those able to afford

22
2015 Nature Awareness > Introduction
it) is foiled by the challenges they face in everyday life. These people are preoccupied with getting to grips with demands of work and family, keeping their job and not slipping (further) into social decline. There is a strong desire within this milieu to belong to society. Its members consider themselves to be socially disad-vantaged through no fault of their own and feel like victims of global change and political reforms. Their experience of disadvantage and exclusion often leads to embitterment, although they have little inclination to protect about their lot in life.
Sociodemographic attributes
› Middle age groups and older people, focus on the over-50 age cohort; average age: 54
› A disproportionately high number of singles and widow(er)s; highest proportion of divorcees of all the milieus
› Mostly lower levels of education (lower secondary level, with or without an apprenticeship)
› Around two thirds are non-working (retirees, pen-sioners and unemployed persons); disproportion-ately high number of manual and skilled workers; low net household income
The Escapist milieu is characterised by a strong drive towards fun and adventure. The prevailing world view of Escapists is that it’s better to keep the rules and demands of the achievement society at arm’s length. They’re convinced that life has more to offer than just work. Living in the here and now, they worry as little as possible about the future and prefer to drift along. They pursue an egocentric life strate-gy, avoiding restrictive obligations or stress as much as they can and aiming to get the best out of life for themselves without too much effort. A typical facet of the Escapist milieu is its enthusiasm for change, living life to the full and experimenting with new things, accompanied by a low frustration threshold and little inclination to do without.
Sociodemographic attributes
› Younger age groups: up to the age of 40; average age: 38
› High proportion of singles (with and without a partner in the household); only half have children
› No clear focus regarding formal education › Junior clerks and middle managers, manual and
skilled workers; a slightly above-average rate of unemployment
› A disproportionately high percentage of school/university students and trainees/apprentices; dis-tribution of income in keeping with the underlying population
1.3 Explanatory notes on this brochure
The results of the ‘2015 Nature Awareness Study’ are presented below. The new topics (Chapter 2: Agrarian landscape and Chapter 3: Urban nature) are described in greater detail than the areas already outlined and discussed in the previous surveys. The key findings are illustrated in diagrams and tables. All answer cate-gories are given for the scaled-response questions. The latter largely entail 4-level scales, with the first two levels indicating the extent of agreement (for example “Agree strongly”, “Agree somewhat”), and the last two levels indicating the extent of di sagreement (“Don’t really agree, “Don’t agree at all”). The “Don’t know/no comment” category is occasionally included – this category wasn’t offered as an option but merely used by the interviewer when respondents were unable or disinclined to evaluate a question or statement.
The percentages given were rounded to the nearest whole number in the interests of legibility and com-prehensibility. In cases where the sum of the values in all answer categories added up to more or less than 100 percent, a maximum adjustment of 1.4 percentage points was made in the “Don’t know/no comment” category. In very rare cases this proved insufficient, and so here the highest values had to be slightly ad-justed in addition.
The databases were analysed according to differences in the response behaviour of different population groups. The following demographic characteristics were taken into account here: level of formal educa-tion (low, mid-level, high)2, gender, age (18 to 29, 30 to 49, 50 to 65, 66 and over) and net household income (up to 999 euros, 1,000 to 1,999 euros, 2,000 to 3,499 euros, 3,500 euros and more). As described in Chap-ter 1.2, the Sinus-Milieus have been integrated into the survey to allow evaluation according to milieu affiliation. Significant differences are explained in the running text. In addition, any particularly interesting findings have been visualised in figures or tables.
Established testing procedures taken from the field of empirical research were used to test the statistical importance of differentiations. Any differences in response behaviour between sections of the popu-

23
2015 Nature Awareness > Introduction
lation were tested using the chi-squared test (com-pare Sedlmeier 2013, Eid 2013, or Janssen and Laatz 2010). This is based on the confidence intervals of 95 percent (over- or under-represented) or 99 percent (heavily over- or under-represented) commonly used for social scientific purposes. Hence, attributes are interpreted as being over-represented (above-average) or under-represented (below average) in the sample if this can be claimed with a probability of at least 95 Percent (level of importance of p < .05). Attributes are viewed as being heavily over-represented or heav-ily under-represented if a probability of 99 Percent (importance level of p <.01) can be set. The over- (black numbers) and under-representations (white numbers) are colour coded in the figures and explained in the legends. In time series, i.e. sets of questions that are repeated in each survey, the importance of any change over time was tested using parametric (t-tests) and non-parametric test procedures (Mann-Whitney-Test).
Both the level of agreement and frequency of oc-currence of any one attribute within a sub-group is colour coded and explained in the legend, as already outlined above. In addition, the numbers have also been colour coded: over-represented values and state-ments of agreement (for example “Strongly agree”/ “Somewhat agree”) are printed in black, and the un-der-represented values and statements of non-agree-ment (“Don’t really agree”/”Don’t agree at all”) are printed in white. This means that all colour codes can be distinguished from one another, even in a black and white document.
In the milieu charts, the overlaps between two milieus are marked in the colour of the milieu that manifests the higher percentage value for the answer category in question.
An overview of the response behaviour of the overall population is given in the basic count in the Appen-dix. All questions are listed here in tabular form in the same order in which they appeared in the question-naire.
As in the ‘2013 Nature Awareness Study’, the social desirability effect was again examined in the study presented here. This phenomenon describes response distortion and is familiar from attitude and behaviour research: in order to avoid social rejection as a result of answering truthfully, respondents anticipate what is socially acceptable and answer accordingly. The social desirability scale of Winkler et al. (2006) has been incorporated in order to determine the tendency to give socially desirable responses.
Due to lack of space, the analysis of the social desira-bility effect along with other in-depth analyses will appear in the final scientific report. This report focuses on selected topics and can be downloaded in the sum-mer of 2016 with the other materials from www.bfn.de/naturbewusstsein.html.

24
2015 Nature Awareness > Agrarian landscapes
2 Agrarian landscapes
The number of agricultural businesses in modern, heavily urbanised industrial and service societies is in steady decline. Ever fewer people are employed in a sector that used to shape the working environment and lifeworld of the vast majority. At the same time, there is an unprecedented level of business consoli-dation and intensified production. These days, media and advertising largely portray agriculture from its beautiful, restorative perspective, perhaps also show-ing the wild sides of the cultural landscape. In con-trast to this, we are rarely shown the large expanses of land devoted to high-level food and fodder produc-tion. And even when the media focus is specifically on agriculture, we see images of happy cows, lush grazing land, and spruce farmhouses, but are given no impres-sion of the industrial farming complexes behind most of our agricultural production today.
Washed-out plains, monocultures, or the livestock housing systems used in factory farming show the other side. If we look at the social forces leading to these agrarian landscape, it is important to mention not just factors such as the agricultural policy shaped by the stipulations of the European Union (EU) and retail price pressure, but also consumer preferences and acceptance: it is purchase behaviour in the super-market along with political action that decides the appearance of our agrarian landscapes and the extent of their biodiversity. In Germany, it seems one thing is certain when it comes to foodstuffs: they must be cheap. The German food trade is renowned for its tough price competition. But it is precisely this price pressure that often makes it difficult if not impossi-ble for farmers to opt for eco-friendlier products and production methods.
These are unfavourable parameters for eco-friendly agriculture. Even though the market share of organic foods (certified according to the German or Europe-an organic seal) has increased, organic foods are still considered unduly expensive, as shown not least by the ‘2013 Nature Awareness Study’.
Added to this are the various hurdles that make it difficult for famers to produce in ways more aligned with nature. There are plenty of examples. Despite the
reform of the Renewable Energy Act (EEG) of 2014, it is in many cases more profitable to grow energy crops than to produce food. Land prices have increased considerably, particularly since the 2007/08 finan-cial crisis when investors outside the agricultural sector started to show increasing interest in land as an investment; this raises return expectations and hence the cost pressure on agricultural production. Swit ching to organic methods and processes poses technical, organisational and also financial challenges for the farms. In many ways, despite efforts at reform, the European Agricultural Policy with its incen-tives (including subsidies) still stands in the way of eco-friendlier farming.
Having already been featured in the ‘2013 Nature Awareness Study’, agrarian landscapes and agricultu-ral production methods now form a focal area of the present study and have been subjected to further sys-tematic exploration based on the following questions: What is the public perception of Germany’s agrarian landscapes? Do people believe there have been notice-able changes to these agrarian landscapes over the past 10 years? Do they think nature-friendly land-scape features such as hedgerows and green/flower verges actually belong in an agrarian landscape? What do they think of the different agricultural production methods, and their impact on nature and society? How do they view genetically modified organisms? And ultimately: should farming aim to step up its nature conservation measures and, if so, who should pay for it?
2.1 Associations with agrarian landscapes
In order to understand how the German people per-ceives its agrarian landscapes, respondents were first asked to express freely their spontaneous thoughts in this respect.
‘Agrarian landscapes’ conjure up first and foremost images of farmland such as fields and arable land, meadows and grazing land, and of monocultures.

25
2015 Nature Awareness > Agrarian landscapes
The vast majority of these free associations with areas of Germany used for agriculture concern natural eco-systems that have a bearing on human self-interest, economic aspects and the safeguarding of livelihoods: for 62 percent of respondents, agrarian landscapes’ trigger spontaneous images of ‘farmland’ (cf. Figure 2). Main responses in this category are fields (named by 32 percent of respondents), but also meadows and grazing land (26 percent), and monocultures (14 percent).3 The ‘crop plants’ category follows in sec-ond place with 51 percent of responses. Cereals domi-nate here (29 percent), followed by maize (20 percent), vegetables/salad vegetables (17 percent), rapeseed (15 percent) and fruit (14 percent). 7 percent think of potatoes, and 4 percent name wine or wine-growing.
Whereas half the respondents associate agrarian landscapes with crop plants, almost one third (also) think of ‘farm animals’ (32 percent mention elements from this category). They think first and foremost of large livestock such as cattle (11 percent), but also mid-sized animals such as pigs, sheep and goats (5 percent), and small livestock (rabbits, poultry: 4 percent); more abstract terms such as cattle breeding or farm ani-mals are mentioned by 13 percent. 4 percent are also reminded in this context of factory farming or battery farming/caging. In contrast to farm animals, ‘wildlife’
(especially birds, insects and butterflies) is mentioned only rarely – by 6 percent of respondents.
Respondents spontaneously name ‘agro-businesses’ to the same degree as ‘farm animals’ (34 percent) – including farms, buildings and stabling, and also equipment and agricultural machines. 22 percent of respondents think of the ‘materials’ involved in agri-cultural production: pesticides (9 percent), fertiliser (6 percent), along with slurry/(liquid) manure (6 per-cent) are the most common responses here.
20 percent of respondents made associations with elements from the ‘Other vegetation and green spaces’ category, mainly forests (7 percent), trees (5 percent), flower fields (4 percent), plants (4 percent), and also hedgerows/shrubs/bushes (3 percent). A glance at the general popularity of trees, tree-lined avenues or wild herbs reveals the relatively weak manifestation of this category: as shown in the following chapter, the protection of these farmland elements is particularly important to most respondents. Despite this, only a fifth spontaneously link them to ‘agrarian landscapes’. Water bodies such as streams, rivers, lakes, ponds/pools or marshes are named even more rarely (8 per-cent in total).
Figure 2: Associations with agrarian landscapes, indications sorted by categories
I’d like you to tell me your spontaneous thoughts on the land in Germany that is used for agriculture, i. e. our agrarian landscapes. Please name as many terms and ideas as you can think of. (Open question).
70
60
50
40
30
20
10
0
Farmlan
d
Crop plan
ts
Farm an
imals
Fertilis
er/Pes
t contro
l
Other
vegeta
tion an
d green sp
aces
Foodstuffs
Negati
ve co
mments
Politics/
Economic
situati
on
Protec
ted re
source
Wate
r bodies
Altern
ative
energ
ies
Wild
anim
als
Geneti
c enginee
ring or
geneti
c man
ipulation
Beautif
ul landsca
pes/re
gions
Quality
of life
Agro-b
usines
ses/P
lants/
Machines
62
51
34 32
22 2015
12 10 9 8 8 6 6 3 3
Data in percent
26
2015 Nature Awareness > Agrarian landscapes
15 percent of responses relate to ‘Foodstuffs’. A point to note here is that 6 percent of responses in this category remain on an abstract level (elements such as foodstuffs or nutrition); in contrast, healthy foods and organic foods are mentioned by just 3 percent of respondents, and regional foods by just 1 percent. The current agrarian landscape is brought into play as a ‘protected resource’ by 9 percent of respondents, with 5 percent associating this with nature conservation and 2 percent animal protection. The ‘Alternative energies’ category is of a comparable order: a total of 8 percent of respondents mentioned it, while men-tions for biogas plants (4 percent) and wind farms (3 percent) lead those for solar energy plants (1 per-cent). ‘Genetic engineering or genetic manipulation’ is named by 6 percent of the people surveyed. Just 3 per-cent spontaneously associate ‘Beautiful landscapes’, ‘Natural heritage’ and ‘Villages’ with Germany’s agrarian landscapes. The ‘Quality of life’ association is made just as rarely (3 percent).
Instead, the term ‘agrarian landscapes’ also triggers several explicitly ‘negative associations’ (12 percent of overall responses). However, it is less the smell or stench (1 percent) that draws negative attention and more the destruction and disfigurement of nature as a result of agriculture (6 percent). Isolated mention is also made of water pollution (1 percent), the lack of ecological management (1 percent), species decline within the agricultural landscape (1 percent), con-sumption/making money (1 percent) and food scan-dals/antibiotics/BSE (1 percent). Another point worth noting is that the issue of agrarian landscapes also sparks associations to do with ‘Politics and econom-ics’ (10 percent), particularly with regard to subsidies (4 percent) and land consolidation/agrarian reform (2 percent).
If one adds to the explicitly negative responses the implicitly negative or at least ambivalent comments (for example factory farming and caging, genetic ma-nipulation), it is fair to assume a certain discrepancy between people’s actual idea of agrarian landscapes and what they think such landscapes should be like – as expressed in the desire for ‘healthy’ and organi-cally grown foodstuffs, and the criticism of prevailing agricultural methods. This is shown in the course of the chapter.
2.2 Perceived changes and subjects of protection
This section deals with the changes that the popula-tion has noticed in the agrarian landscape over the past 10 years and the importance that people attribute to protecting certain features of the agrarian land-scape.
Two thirds of the German people believe that the bee population has declined.
For five of the ten agrarian landscape features sur-veyed (see Figure 3), the number of Germans who believe that these have declined is greater than those who think they have remained stable. This is true for bees (perceived decline: 66 percent of respondents), butterflies (decline: 55 percent), wild plants and herbs (decline: 47 percent), green/flower verges (decline: 45 percent), as well as frogs and toads (decline: 44 per-cent). For the following features, however, the prevai-ling perception is one of stability: streams and ponds (remained stable: 44 percent), grassland (remained sta-ble: 45 percent), tree-lined avenues (remained stable: 46 percent), birds (remained stable: 43 percent), and also trees, hedgerows and bushes (remained stable: 49 percent). Very few Germans believe the respective agrarian landscape features have increased in magni-tude (see Figure 3).
Why do the Germans particularly notice the decline in the bee population? As verified in the Red Lists (Westrich et al. 2011), heavy losses in the numbers of wild bees have been objectively recorded. However, when assessing this issue, the respondents were most probably thinking less about the several hundred species of wild bees in Germany and more about the risk to honey bees: the reports in the mass media play a major role here. They place the blame not only on the deployment of pesticides in farming but also on climate change. On the other hand, the fact that beekeeping is a relatively widespread leisure pursuit could indeed be another relevant aspect here (the German Beekeepers Association had approx. 100,000 active members in 2014); this could well bring about a certain multiplier effect through everyday com-munication via the direct sale of honey for example. In contrast, grassland is another important nature conservation topic and yet is largely lacking these kinds of multiplier and media effects. Although the current risk to grassland and the need to protect it form an important building block in expert circles when it comes to the preservation of biodiversity (cf.

27
2015 Nature Awareness > Agrarian landscapes
BfN 2014), this is hardly reflected in the mass me-dia reports. The amount of grassland in Germany decreased by a good 5 percent between 2003 and 2012 (cf. BfN 2014, p. 10), but 56 percent of Germans think it remained stable or even that it increased. At the other end of the scale, 41 percent of respondents have no-ticed a decline in grassland. Similar observations can be made for birds: 55 percent of Germans have per-ceived a stable or increase in the bird population over the past 10 years, whereas 40 percent have noticed a
decline – and the latter are right in this assumption: over the past 25 years, 27 percent of the bird species that breed in Germany have suffered a decline to a greater or less degree (cf. BfN 2015 and Sudfeldt et al. 2013). The situation of many bird species is especially critical on and around farmland. Intensive farming means that the numbers of those birds that breed on arable land, meadows or grazing land are continuing to drop (cf. BMUB 2014).4
Figure 3: Evaluation of the development of agrarian landscape features
How do you evaluate the development of the following features in areas used for farming over the past 10 years?
Bees
Butterflies
Wild plants and herbs
Green/flower verges
Frogs and toads
Streams and ponds
Grassland such as meadows and grazing land
Street plantings
Birds
Trees, hedgerows and bushes
6622 6622
4344
41
4146
4043
3649
443811
11
4736
11 94540
5532
More increased
I don’t know / I can’t asses
0 10 20 30 40 50 60 70 80 90 100
Data in percent
8
8
4
5
6
4
4
7
9
3
3
5
1
10
12
14
45
Stayed the same
More decreased
11
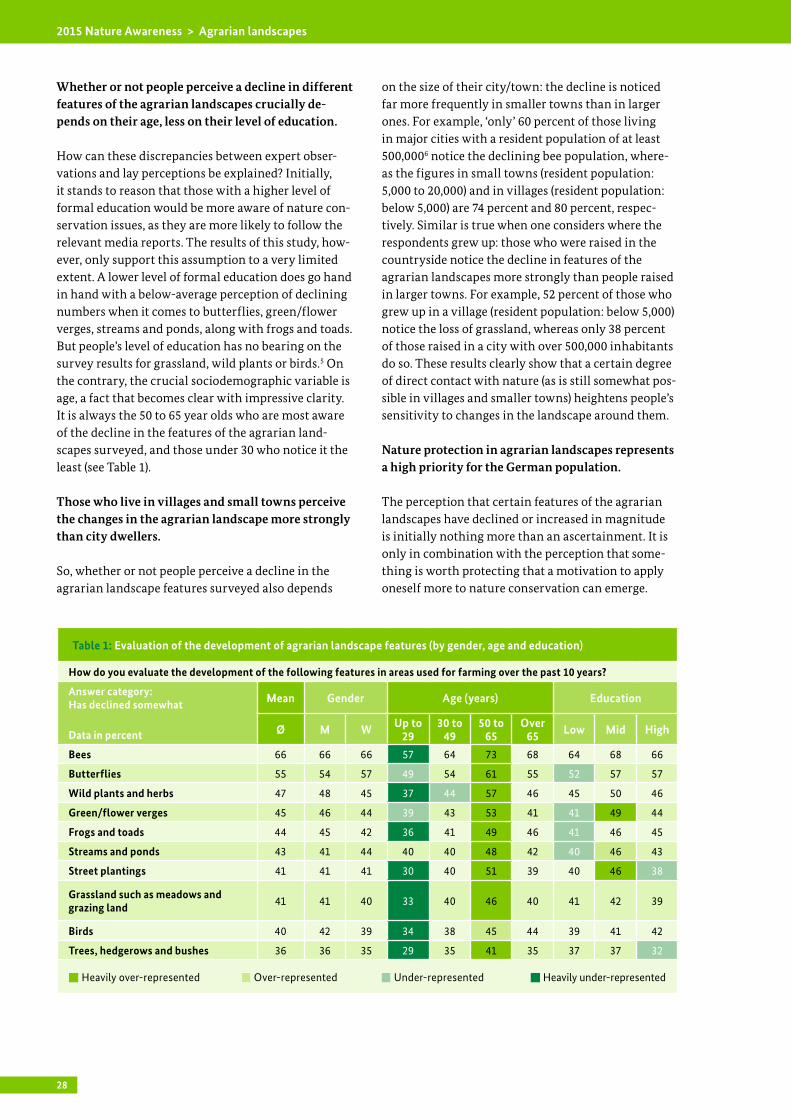
28
2015 Nature Awareness > Agrarian landscapes
Whether or not people perceive a decline in different features of the agrarian landscapes crucially depends on their age, less on their level of education.
How can these discrepancies between expert obser-vations and lay perceptions be explained? Initially, it stands to reason that those with a higher level of formal education would be more aware of nature con-servation issues, as they are more likely to follow the relevant media reports. The results of this study, how-ever, only support this assumption to a very limited extent. A lower level of formal education does go hand in hand with a below-average perception of declining numbers when it comes to butterflies, green/flower verges, streams and ponds, along with frogs and toads. But people’s level of education has no bearing on the survey results for grassland, wild plants or birds.5 On the contrary, the crucial sociodemographic variable is age, a fact that becomes clear with impressive clarity. It is always the 50 to 65 year olds who are most aware of the decline in the features of the agrarian land-scapes surveyed, and those under 30 who notice it the least (see Table 1).
Those who live in villages and small towns perceive the changes in the agrarian landscape more strongly than city dwellers.
So, whether or not people perceive a decline in the agrarian landscape features surveyed also depends
on the size of their city/town: the decline is noticed far more frequently in smaller towns than in larger ones. For example, ‘only’ 60 percent of those living in major cities with a resident population of at least 500,0006 notice the declining bee population, where-as the figures in small towns (resident population: 5,000 to 20,000) and in villages (resident population: below 5,000) are 74 percent and 80 percent, respec-tively. Simi lar is true when one considers where the respondents grew up: those who were raised in the countryside notice the decline in features of the agrarian landscapes more strongly than people raised in larger towns. For example, 52 percent of those who grew up in a village (resident population: below 5,000) notice the loss of grassland, whereas only 38 percent of those raised in a city with over 500,000 inhabitants do so. These results clearly show that a certain degree of direct contact with nature (as is still somewhat pos-sible in villages and smaller towns) heightens people’s sensitivity to changes in the landscape around them.
Nature protection in agrarian landscapes represents a high priority for the German population.
The perception that certain features of the agrarian landscapes have declined or increased in magnitude is initially nothing more than an ascertainment. It is only in combination with the perception that some-thing is worth protecting that a motivation to apply oneself more to nature conservation can emerge.
Table 1: Evaluation of the development of agrarian landscape features (by gender, age and education)
How do you evaluate the development of the following features in areas used for farming over the past 10 years?
Answer category: Has declined somewhat
Data in percent
Mean Gender Age (years) Education
Ø M W Up to 29
30 to 49
50 to 65
Over 65 Low Mid High
Bees 66 66 66 57 64 73 68 64 68 66
Butterflies 55 54 57 49 54 61 55 52 57 57
Wild plants and herbs 47 48 45 37 44 57 46 45 50 46
Green/flower verges 45 46 44 39 43 53 41 41 49 44
Frogs and toads 44 45 42 36 41 49 46 41 46 45
Streams and ponds 43 41 44 40 40 48 42 40 46 43
Street plantings 41 41 41 30 40 51 39 40 46 38
Grassland such as meadows and grazing land 41 41 40 33 40 46 40 41 42 39
Birds 40 42 39 34 38 45 44 39 41 42
Trees, hedgerows and bushes 36 36 35 29 35 41 35 37 37 32
Heavily over-represented Over-represented Under-represented Heavily under-represented
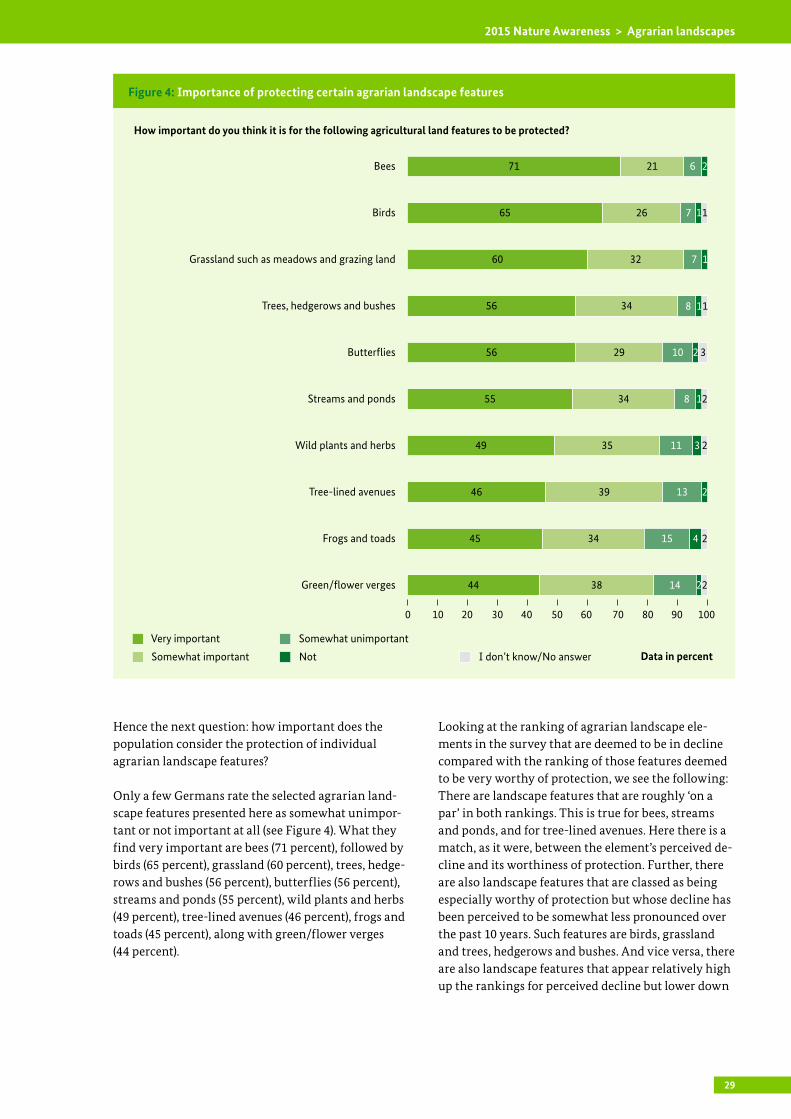
29
2015 Nature Awareness > Agrarian landscapes
Hence the next question: how important does the population consider the protection of individual agrarian landscape features?
Only a few Germans rate the selected agrarian land-scape features presented here as somewhat unimpor-tant or not important at all (see Figure 4). What they find very important are bees (71 percent), followed by birds (65 percent), grassland (60 percent), trees, hedge-rows and bushes (56 percent), butterflies (56 percent), streams and ponds (55 percent), wild plants and herbs (49 percent), tree-lined avenues (46 percent), frogs and toads (45 percent), along with green/flower verges (44 percent).
Looking at the ranking of agrarian landscape ele-ments in the survey that are deemed to be in decline compared with the ranking of those features deemed to be very worthy of protection, we see the following: There are landscape features that are roughly ‘on a par’ in both rankings. This is true for bees, streams and ponds, and for tree-lined avenues. Here there is a match, as it were, between the element’s perceived de-cline and its worthiness of protection. Further, there are also landscape features that are classed as being especially worthy of protection but whose decline has been perceived to be somewhat less pronounced over the past 10 years. Such features are birds, grassland and trees, hedgerows and bushes. And vice versa, there are also landscape features that appear relatively high up the rankings for perceived decline but lower down
Figure 4: Importance of protecting certain agrarian landscape features
How important do you think it is for the following agricultural land features to be protected?
0 10 20 30 40 50 60 70 80 90 100
Data in percent
Bees
Birds
Grassland such as meadows and grazing land
Trees, hedgerows and bushes
Butterflies
Streams and ponds
Wild plants and herbs
Tree-lined avenues
Frogs and toads
Green/flower verges
NotSomewhat important
Very important Somewhat unimportant
I don’t know/No answer
71 21 6 2
726
32
34
29
34
35
39
34
38
65
60
56
56
55
49
46
45
44
1
3
2
2
2
2
7
8
8
11
13
15
14
10
1
1
2
2
2
3
4
11
1

30
2015 Nature Awareness > Agrarian landscapes
the list as subjects of protection. Such features are wild plants and herbs, green/flower verges, frogs and toads, and also butterflies to some degree. Within the context of nature conservation, therefore, communi-cation must focus either more on the reality of species being lost, or on their worthiness of protection, as the case may be.
A glance at the respondent sociodemographics shows that women are consistently more likely than men to attribute a high level of importance to the protection of landscape features, and that this tendency increases with age – but only up to the 50 to 65 age group. Here again, a mid-level education goes hand in hand with a tendency to attribute above-average relevance to the issue. Respondents with a lower level of formal education rate many landscape features as being of below-average importance. Surprisingly, this also applies to the well-educated when it comes to bees, wild plants and herbs (see Table 2). This picture is however put into perspective when one adds the second level of agreement: The well-educated rate the protection of bees as very or somewhat important with exactly the same frequency as the population average (92 percent; population average: 92 percent); the same goes for wild plants and herbs (83 percent; population average: 84 percent).7
When differentiated by city/town size, the find-ings show that inhabitants from smaller towns and particularly from villages consistently rate the importance of agrarian landscape features more
highly than city-dwellers. For example, 56 percent of all respondents on average find trees, hedgerows and bushes especially worthy of protection. A far higher proportion of those living in villages (population: be-low 5,000) share this point of view, namely 79 percent, whereas fewer than half (47 percent) of those living in cities with over 500,000 inhabitants do so. It is thus fair to say that in cities with over 500,000 inhabit-ants, it is not just awareness but also appreciation of nature-friendly agrarian landscape features that is lacking. It is worth noting here that the 50 to 65 age group is clearly over-represented in the ‘smaller town’ sample (proportion of 50 to 65 year olds in German towns with a resident population below 100,000: 43 percent; proportion of the overall population in towns with under 100,000 inhabitants: 34 percent). In contrast, this age group is under-represented in cities with over 500,000 inhabitants (proportion of 50 to 65 year olds living in places with a resident population of over 500,000: 28 percent; proportion of the overall population in places with over 500,000: 36 percent).8 Similar is true for people with mid-level educational attainment: in smaller towns they are over-represent-ed (proportion of this group living in German towns with a resident population below 100,000: 43 percent; proportion of the overall population: 34 percent). On the other hand, they are under-represented in cities with a population greater than 500,000 (proportion of people educated to mid-level and living in cities with a population over 500,000: 30 percent; proportion of the overall population: 36 percent).9 This may go some way towards explaining why the 50 to 65 age group
Table 2: Importance of protecting certain agrarian landscape features (by age, gender and education)
How important do you think it is for the following agricultural land features to be protected?
Answer category: Very important
Data in percent
Mean Gender Age (years) Education
Ø M W Up to 29
30 to 49
50 to 65
Over 65 Low Mid High
Bees 71 67 75 59 71 78 70 68 77 67
Birds 65 63 68 54 63 73 68 61 73 63
Grassland such as meadows and grazing land 60 56 63 46 60 66 62 59 62 58
Butterflies 56 51 62 43 55 64 59 52 64 54
Trees, hedgerows and bushes 56 52 60 44 55 63 59 53 63 53
Streams and ponds 55 52 58 45 52 64 56 50 61 55
Wild plants and herbs 49 47 52 35 48 58 50 48 55 44
Street plantings 46 42 48 33 42 53 52 41 53 42
Frogs and toads 45 42 48 37 44 51 46 42 50 43
Green/flower verges 44 41 46 35 41 51 47 41 48 43
Heavily over-represented Over-represented Under-represented Heavily under-represented

31
2015 Nature Awareness > Agrarian landscapes
and people with mid-level educational attainment are particularly inclined to perceive a decline in the different agrarian landscape features, and why they rate their relevance particularly highly.
Overall, a look at the different social milieus shows the Social-ecological and Liberal Intellectual life-worlds to be most strongly in favour of protecting the landscape features. As shown in the predecessor Nature Awareness Studies, members of these milieus enjoy spending a lot of their time in the natural envi-ronment. This probably explains why they manifest the broadest awareness when it comes to the decline of various agrarian landscape features. The Adaptive Pragmatics stand out in that a disproportionately high number consider bees to be particularly worthy of protection (see Figure 5). In contrast, their worthiness of protection consistently receives the lowest ratings among the Precarious and Escapist milieus. This is down the relatively weak bond with nature of people within these groups.
2.3 Production methods, agricultural policy and genetic engineering
The following describes how the population thinks different cropping systems and practices affect nature and biodiversity. It then goes on to highlight how the population sees the deployment of genetic engineering in agriculture, and ends with how they evaluate select-ed areas of agricultural policy.
Chemical pest and weed control is classified most commonly by far as particularly damaging.
Most Germans view chemical pest and weed control in a particularly critical light (see Figure 6): 66 percent think it causes serious damage, 25 percent slight dam-age, and 7 percent no real damage, while 2 percent
Figure 5: Importance of protecting certain agrarian landscape features by milieus
Clinging on to PreservingTradition
Having & enjoying Being & changingModernisisation / Individualisation
Doing & experiencing Overcoming limitationsReorientation
Basic Values
How important do you think it is for the following agricultural land features to be protected? Very important
Heavily over represented Heavily under-representedUnder-represented Average
Soci
al s
tatu
s
Traditional milieu72 %
New middle class milieu71 %
Established Conservative
milieu74 %
Precarious milieu63 %
Socio-ecological milieu90 %
Liberal Intellectual milieu
82 %
High Achiever
milieu65 %
Movers and Shakers milieu
66 %
AdaptivePragmatist milieu
79 %
Escapist milieu57 %
average = 71 %
Bees
Low
erM
iddl
e H
ighe
r
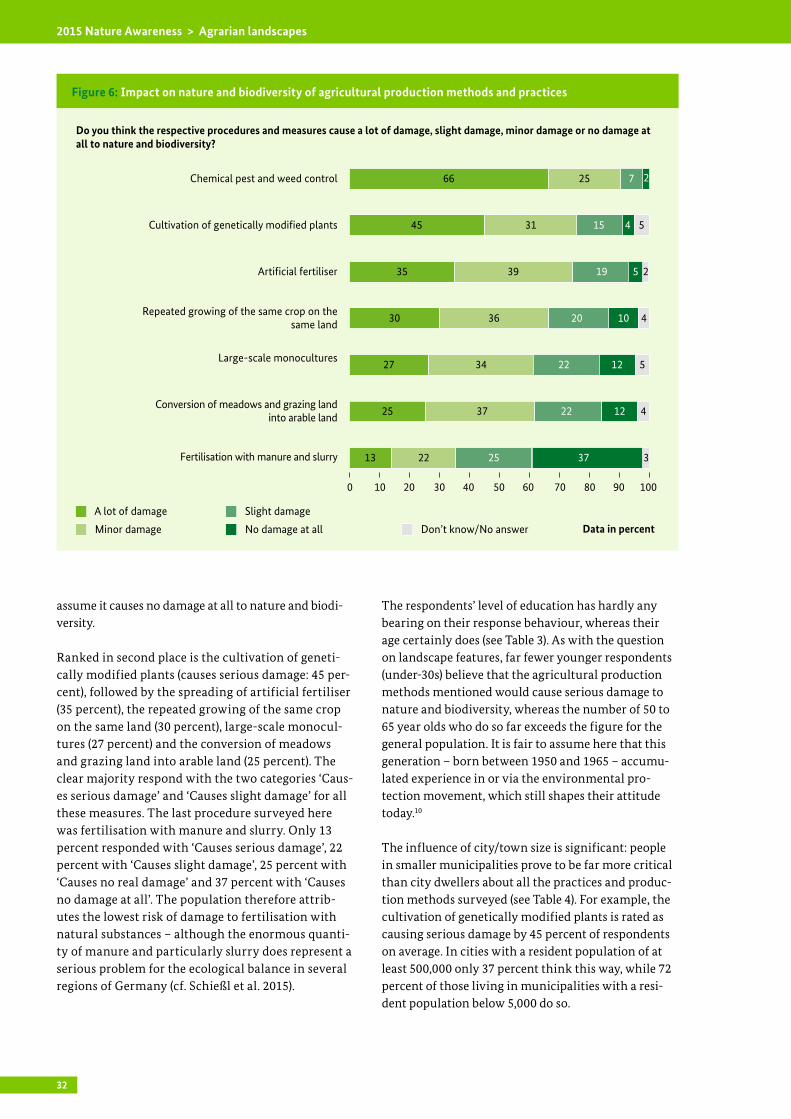
32
2015 Nature Awareness > Agrarian landscapes
assume it causes no damage at all to nature and biodi-versity.
Ranked in second place is the cultivation of geneti-cally modified plants (causes serious damage: 45 per-cent), followed by the spreading of artificial fertiliser (35 percent), the repeated growing of the same crop on the same land (30 percent), large-scale monocul-tures (27 percent) and the conversion of meadows and grazing land into arable land (25 percent). The clear majority respond with the two categories ‘Caus-es serious damage’ and ‘Causes slight damage’ for all these measures. The last procedure surveyed here was fertilisation with manure and slurry. Only 13 percent responded with ‘Causes serious damage’, 22 percent with ‘Causes slight damage’, 25 percent with ‘Causes no real damage’ and 37 percent with ‘Causes no damage at all’. The population therefore attrib-utes the lowest risk of damage to fertilisation with natural substances – although the enormous quanti-ty of manure and particularly slurry does represent a serious problem for the ecological balance in several regions of Germany (cf. Schießl et al. 2015).
The respondents’ level of education has hardly any bearing on their response behaviour, whereas their age certainly does (see Table 3). As with the question on landscape features, far fewer younger respondents (under-30s) believe that the agricultural production methods mentioned would cause serious damage to nature and biodiversity, whereas the number of 50 to 65 year olds who do so far exceeds the figure for the general population. It is fair to assume here that this generation – born between 1950 and 1965 – accumu-lated experience in or via the environmental pro-tection movement, which still shapes their attitude today.10
The influence of city/town size is significant: people in smaller municipalities prove to be far more critical than city dwellers about all the practices and produc-tion methods surveyed (see Table 4). For example, the cultivation of genetically modified plants is rated as causing serious damage by 45 percent of respondents on average. In cities with a resident population of at least 500,000 only 37 percent think this way, while 72 percent of those living in municipalities with a resi-dent population below 5,000 do so.
Figure 6: Impact on nature and biodiversity of agricultural production methods and practices
34
66
35
45
27
13
30
25
Do you think the respective procedures and measures cause a lot of damage, slight damage, minor damage or no damage at all to nature and biodiversity?
0 10 20 30 40 50 60 70 80 90 100
Data in percent
Chemical pest and weed control
Cultivation of genetically modified plants
Artificial fertiliser
Large-scale monocultures
Repeated growing of the same crop on thesame land
Fertilisation with manure and slurry
Conversion of meadows and grazing landinto arable land
No damage at allMinor damage
A lot of damage Slight damage
Don’t know/No answer
7
15
19
20
22
22
25
2
4
5
10
12
12
37
5
2
5
4
4
3
25
39
36
37
22
31
Table 3: Evaluation of impact of agricultural cropping systems and procedures on nature and biodiversity (by gender, age and education)
Do you think that the respective procedures and measures cause serious damage, some damage, little damage or no damage to nature and biodiversity?
Answer category: Causes serious damage
Data in percent
aver-age Gender Age (years) Education
Ø M W Up to 29
30 to 49
50 to 65
Over 65 Low mid High
Chemical pest and weed control 66 63 69 59 65 70 67 64 65 69
Cultivation of genetically modified plants 45 41 49 33 43 55 46 45 46 44
Artificial fertiliser 35 33 38 29 36 38 36 35 35 36
Repeated growing of the same crop on the same land 30 30 29 24 26 36 32 28 31 30
Large-scale monocultures 27 28 25 20 23 32 31 24 29 27
Conversion of meadows and grazing land into arable land 25 25 24 20 24 27 27 23 28 23
Fertilisation with manure and slurry 13 13 12 10 13 15 11 12 14 11
Heavily over-represented Over-represented Under-represented Heavily under-represented
Table 4: Evaluation of impact of agricultural cropping systems and procedures on nature and biodiversity (by city/town size)
Do you think that the respective procedures and measures cause serious damage, some damage, little damage or no damage to nature and biodiversity?
Answer category: Causes serious damage
Data in percent
City/town size (in 1,000)
Ø < 5 5-20 20-100 100-500 Over 500
Chemical pest and weed control 66 82 59 67 68 63
Cultivation of genetically modified plants 45 72 57 49 46 37
Artificial fertiliser 35 60 32 43 34 30
Repeated growing of the same crop on the same land 30 47 41 29 35 20
Large-scale monocultures 27 48 28 31 28 20
Conversion of meadows and grazing land into arable land 25 29 27 23 27 23
Fertilisation with manure and slurry 13 10 25 17 11 9
Heavily over-represented Over-represented Under-represented Heavily under-represented

33
2015 Nature Awareness > Agrarian landscapes
As to be expected, it is above all the members of the Social-ecological milieu who are sceptical in their ap-praisal of agricultural practices, although a dispropor-tionately high number within the Liberal Intellectual milieu also rate chemical pest and weed control and
genetic engineering as seriously damaging to nature. In contrast to this, the Escapists are less inclined to see agricultural practices as a problem. This may be due to the fact that they don’t worry about any potential consequences. They don’t see what the impact of
The respondents’ level of education has hardly any bearing on their response behaviour, whereas their age certainly does (see Table 3). As with the question on landscape features, far fewer younger respondents (under-30s) believe that the agricultural production methods mentioned would cause serious damage to nature and biodiversity, whereas the number of 50 to 65 year olds who do so far exceeds the figure for the general population. It is fair to assume here that this generation – born between 1950 and 1965 – accumu-lated experience in or via the environmental pro-tection movement, which still shapes their attitude today.10
The influence of city/town size is significant: people in smaller municipalities prove to be far more critical than city dwellers about all the practices and produc-tion methods surveyed (see Table 4). For example, the cultivation of genetically modified plants is rated as causing serious damage by 45 percent of respondents on average. In cities with a resident population of at least 500,000 only 37 percent think this way, while 72 percent of those living in municipalities with a resi-dent population below 5,000 do so.
Table 3: Evaluation of impact of agricultural cropping systems and procedures on nature and biodiversity (by gender, age and education)
Do you think that the respective procedures and measures cause serious damage, some damage, little damage or no damage to nature and biodiversity?
Answer category: Causes serious damage
Data in percent
aver-age Gender Age (years) Education
Ø M W Up to 29
30 to 49
50 to 65
Over 65 Low mid High
Chemical pest and weed control 66 63 69 59 65 70 67 64 65 69
Cultivation of genetically modified plants 45 41 49 33 43 55 46 45 46 44
Artificial fertiliser 35 33 38 29 36 38 36 35 35 36
Repeated growing of the same crop on the same land 30 30 29 24 26 36 32 28 31 30
Large-scale monocultures 27 28 25 20 23 32 31 24 29 27
Conversion of meadows and grazing land into arable land 25 25 24 20 24 27 27 23 28 23
Fertilisation with manure and slurry 13 13 12 10 13 15 11 12 14 11
Heavily over-represented Over-represented Under-represented Heavily under-represented
Table 4: Evaluation of impact of agricultural cropping systems and procedures on nature and biodiversity (by city/town size)
Do you think that the respective procedures and measures cause serious damage, some damage, little damage or no damage to nature and biodiversity?
Answer category: Causes serious damage
Data in percent
City/town size (in 1,000)
Ø < 5 5-20 20-100 100-500 Over 500
Chemical pest and weed control 66 82 59 67 68 63
Cultivation of genetically modified plants 45 72 57 49 46 37
Artificial fertiliser 35 60 32 43 34 30
Repeated growing of the same crop on the same land 30 47 41 29 35 20
Large-scale monocultures 27 48 28 31 28 20
Conversion of meadows and grazing land into arable land 25 29 27 23 27 23
Fertilisation with manure and slurry 13 10 25 17 11 9
Heavily over-represented Over-represented Under-represented Heavily under-represented

34
2015 Nature Awareness > Agrarian landscapes
agricultural cropping systems and practices has to do with their own life. This fun- and adventure-oriented milieu lives in the here and now, and doesn’t give much thought to the future.
Almost all Germans think it important that animal husbandry consider the wellbeing of the animals.
When asked about the importance of selected areas of agricultural policy, the German people express the strongest agreement with an ethical issue: 93 percent find it very or somewhat important to consider the well-being of animals, for example by providing an outdoor or exercise pen or access to a field or pad-dock. 65 percent even find it very important. This is a remarkably high rate of agreement with the criteri-on of animal welfare. Nonetheless, it should be seen against the backdrop of agribusiness reality that is factory farming: one wonders to what degree this concern for animal welfare extends to everyday life. Animals evidently have a right to well-being as far as most Germans are concerned. But how can this result
be reconciled with the demand for cheap meat? More exhaustive surveys are need to answer this question.
The call for agricultural decisions to take into account the impact of farming actions on nature takes second place (very important: 64 percent, somewhat impor-tant: 28 percent). This is followed some way behind by agreement with the statements that the cultural landscape should be taken into account (very impor-tant: 47 percent, somewhat important: 43 percent), that food production and consumption should be kept on a regional scale as far as possible (very important: 47 percent, somewhat important: 38 percent), and that organic farming should be developed further (very important: 46 percent, somewhat important: 38 percent). The idea that agriculture should take its cue where possible from the wants and needs of the con-sumer is strongly supported by 35 percent of respond-ents and somewhat supported by a further 51 percent. 30 percent think it is very important that agricultural land be used completely for food production, while a further 43 percent find this somewhat important. On
Figure 7: Agreement with statements on agricultural policies
0 10 20 30 40 50 60 70 80 90 100
Data in percent
Organic farming is being expanded
Agricultural production takes its cue from what the consumers want
All land suitable for agriculture is used exclusively for growing food as far as possible
Areas used for agriculture should also be suitable for recreation and leisure purposes
Not important at allSomewhat important
Very important Somewhat unimportant I don’t know/No answer
28
28
43
38
38
51
43
43
65
64
47
47
46
35
30
29
12
12
6
6
2
11
19
22
7 3
2
3
5
2
5
Agricultural activities also take into account the preservation of the cultural landscape
Animal husbandry takes into account the well-being of the animals
Agricultural decisions take into account the impact of subsequent actions on nature
Foodstuffs are grown, processed and consumed within one region where possible 21
1
1
1
1
1
Please evaluate the importance of the following statements for you personally.

35
2015 Nature Awareness > Agrarian landscapes
the other hand, 29 percent think it very important that agricultural land should also be open to use for leisure and recreation, while a further 43 percent find this somewhat important.
It is again the younger generation (above all people under 30) who attribute less importance to state-ments on agricultural policy. The same goes for men. Education does not appear to have any real effect here (see Table 5). When differentiated by city/town size, the findings show that people living in larger major cities (resident population: over 500,000) attribute less importance to the different statements than the population in general. However, the differences according to milieu turn out to be the most clear-cut of all: whereas a disproportionately high proportion of the Social-ecological and Liberal Intellectual milieus respond to all statements with “very important”, agreement in the Precarious and Escapist lifeworld is consistently lower than average. Furthermore, members of the Social-ecological milieus respond especially critically when it comes to the ‘right’ way to keep farm animals: 82 percent of them think it “very
important” to ensure the well-being of the animals, and for a further 17 percent this is “somewhat impor-tant”. This result can be explained by their view of the world, which is shaped by idealism and a sense of mission: many Social-ecologicals see themselves as the ‘conscience of society’, as critical observers and relentless spotters of wrong-doing.
Almost two thirds of the German people believe that a greater degree of nature conservation makes food products more expensive
But can we actually afford more nature conservation in farming? Is it not true that the agricultural meas-ures and the requirements dictated by agricultural policy ultimately increase the price of food? And could it be that artificial fertiliser and chemical pesti-cides are necessary for food security? These questions, too, were asked in the present study (see Figure 8). The results show: a clear majority (both agreement levels: 65 percent) assume that more nature conservation will make food more expensive; it is above
Table 5: Agreement with statements on agricultural policies (by gender, age and education)
Please evaluate the importance of the following statements for you personally.
Answer category: Very important
Data in percent
Mean Gender Age (years) Education
Ø M W Up to 29
30 to 49
50 to 65
over 65 Low Mid High
Animal husbandry takes into account the well-being of the animals 65 62 70 57 62 74 68 64 69 64
Agricultural decisions take into account the impact of subsequent actions on nature
64 63 66 56 63 70 66 62 64 66
Foodstuffs are grown, processed and consumed within one region where possible
47 43 51 33 47 51 54 46 54 41
Agricultural activities also take into account the preservation of the cul-tural landscape
47 45 50 39 43 53 51 44 48 50
Organic farming is being expanded 46 42 50 39 43 50 53 44 47 49
Agricultural production takes its cue from what the consumers want 35 36 36 31 35 37 39 36 37 33
All land suitable for agriculture is used exclusively for growing food as far as possible
30 29 32 23 28 31 38 33 31 25
Areas used for agriculture should also be suitable for recreation and leisure purposes
29 27 30 27 30 28 29 26 31 29
Heavily over-represented Over-represented Under-represented Heavily under-represented

36
2015 Nature Awareness > Agrarian landscapes
all those under 30 (71 percent) who take this view. The picture is more divided when it comes to the impact on food security of dispensing with artificial fertiliser and chemicals: The majority does not agree with the statement that artificial fertiliser and chemical pesti-cides are necessary for the population’s food security (both levels: 55 percent); 40 percent agree with this statement – men a little more frequently (43 percent) along with the group of households with the highest income (net household income at least 3,500 euros: 47 percent). Agreement with this statement proves lowest in municipalities with under 5,000 inhabitants (both agreement levels: 30 percent).
Instruments of agricultural policy that aim to introduce more nature conservation meet with strong support from the population.
Although it was pointed out to the respondents when asked the next question that both the financial funding of nature conservation and stricter laws and regulations could mean an additional burden for the consumer (cf. actual question, Figure 9), both types of measure meet with strong agreement. More respon-dents favour the passing of stricter laws and regula-tions (I agree strongly/somewhat: 83 percent) than financial funding in this respect (74 percent).
Figure 8: Attitude towards nature conservation in agriculture
To what extent do you agree with the following statements?
Data in percent
Artificial fertilizer and chemical pesticides are necessary in order to be able to feed the population
More nature conservation in farming would make our food products far more expensive
I disagree stronglyI agree somewhat
I agree strongly I disagree somewhat I don’t know/no answer
44
31
21
9
26
37
4
18 5
5
0 10 20 30 40 50 60 70 80 90 100
Figure 9: Attitude towards nature conservation measures of agricultural policy
If the State wants agriculture to do more for nature conservation, it can either provide financial support to promote expedient behaviour (i.e. subsidies) or pass stricter laws and regulations. Please remember here that financial funding comes out of taxpayers’ money, whereas stricter laws and regulations can increase food prices due to farmers passing on the additional cost to the consumer. To what extent do you approve of financial support or stricter laws and regulations to get farmers to do more for nature conservation: strongly, somewhat, not really, or not at all?
Data in percent
Financial support
Stricter laws and regulations
I disagree stronglyI agree somewhat
I agree strongly I disagree somewhat I don’t know/No answer
38
44
45
30
3
5
2
219
12
0 10 20 30 40 50 60 70 80 90 100
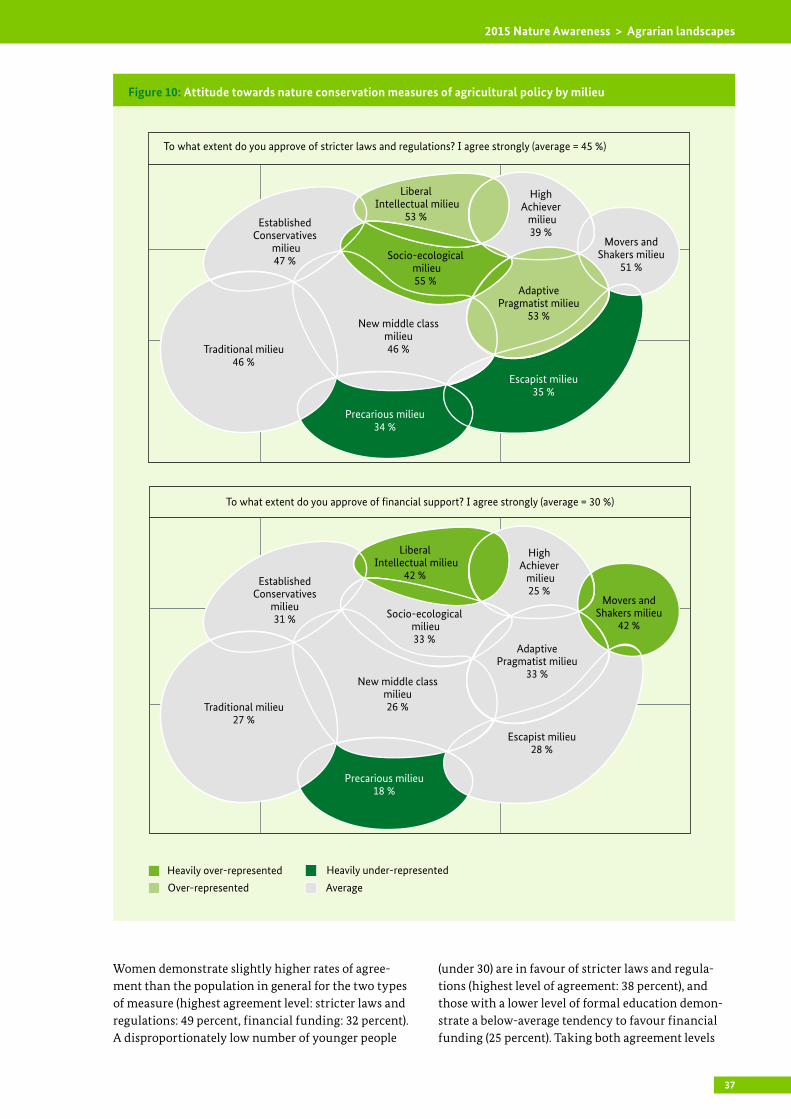
37
2015 Nature Awareness > Agrarian landscapes
Women demonstrate slightly higher rates of agree-ment than the population in general for the two types of measure (highest agreement level: stricter laws and regulations: 49 percent, financial funding: 32 percent). A disproportionately low number of younger people
(under 30) are in favour of stricter laws and regula-tions (highest level of agreement: 38 percent), and those with a lower level of formal education demon-strate a below-average tendency to favour financial funding (25 percent). Taking both agreement levels
Figure 10: Attitude towards nature conservation measures of agricultural policy by milieu
To what extent do you approve of financial support? I agree strongly (average = 30 %)
Traditional milieu27 %
New middle classmilieu26 %
Established Conservatives
milieu31 %
Precarious milieu18 %
Socio-ecological milieu33 %
Liberal Intellectual milieu
42 %
High Achiever milieu25 %
Movers and Shakers milieu
42 %
AdaptivePragmatist milieu
33 %
Escapist milieu28 %
Heavily under-representedHeavily over-represented
Over-represented Average
To what extent do you approve of stricter laws and regulations? I agree strongly (average = 45 %)
Traditional milieu46 %
New middle class milieu46 %
Established Conservatives
milieu47 %
Precarious milieu34 %
Socio-ecological milieu55 %
Liberal Intellectual milieu
53 %
High Achiever milieu39 %
Movers and Shakers milieu
51 %
AdaptivePragmatist milieu
53 %
Escapist milieu35 %

38
2015 Nature Awareness > Agrarian landscapes
together, we see that the main group to show less agreement with financial funding is the one with the highest net household income of 3,500 euros and more upwards (66 percent). Here again, there is no denying the impact of the city/town size: whereas a below-average number of inhabitants from major cities with a resident population of over 500,000 state their agreement with financial funding (highest level of agreement: 25 percent) and stricter laws and regulations (37 percent), the rates of approval in the small municipalities (resident population: below 5,000) are appreciably higher (highest level of agree-ment: financial funding: 36 percent, stricter laws and regulations: 71 percent).
There are also clear differences between the milieus: those most frequently in favour of stricter laws and regulations are the Social-ecologicals (highest level of agreement: 55 percent), the Liberal Intellectuals (53 percent) and the Adaptive Pragmatics (53 percent), while those most in favour of financial funding are the Liberal Intellectuals (highest level of agreement: 42 percent) and the Movers & Shakers (42 percent). The fact that only 35 percent within the Escapist milieu are in favour of stricter laws and regulations is in line with their general aversion towards convention and regulation. The low rates of approval among the Pre-carious (see Figure 10) would seem to indicate that a possible added burden for the consumer (as a result of agricultural policy decisions) is something that people in this lifeworld fear most of all.
The Germans have major health and ethical concerns about the genetic manipulation of nature.
79 percent of Germans by and large reject the idea of genetically modified farm animal feed, with 53 percent even rejecting it outright. This points to a German awareness of health and risks, as only 7 per-cent have absolutely no problem with eating geneti-cally modified foods (highest level of agreement). On the other hand, 45 percent have major and a further 28 percent some problems with it. People appear to be afraid that genetically modified foods could impact negatively on their own health – indirectly via the fodder given to farm animals.11 There are however also ethical reservations in addition to this somewhat self-interested motive. 75 percent agree with the statement that man has no right to subject plants and animals to genetic engineering.
The majority disagrees with the arguments ‘genetic engineering as a means of combatting world hunger’ and ‘genetic engineering as a means of reducing food costs’.
There are two lines of reasoning that play an im-portant role in the debate on genetic engineering in agriculture: ‘genetic engineering as a means of combatting world hunger’ and ‘genetic engineering as a means of reducing food costs’. It transpires that the majority of Germans do not agree with these two arguments (see Figure 11).
Figure 11: Attitudes towards the deployment of genetic engineering in agriculture
Please evaluate the following statements on genetic engineering in agriculture. Do you agree with each statement strongly, somewhat, not really, or not at all?
0 10 20 30 40 50 60 70 80 90 100
Data in percent
I think it’s a good thing if food prices drop thanks to genetic engineering procedures agriculture
I don’t have a problem with eating genetically modified food
I don’t think man has the right to genetically modify plants and animals
I’m against many of our farm animals being given genetically modified fodder
I think that genetic engineering in agriculture is an important building block in the struggle
against world hunger
I disagree stronglyI agree somewhat
I agree strongly I disagree somewhat I don’t know/No answer
26
27
20
24
25
53
48
10
9
7
15
35
33
16
18
1
7
32
29
28
5
3
45
2
5
2
Table 6: Attitudes towards the deployment of genetic engineering in agriculture (by gender and age)
Please evaluate the following statements on genetic engineering in agriculture.
Answer category: Agree strongly/somewhat
Data in percent
Mean Gender Age (years)
Ø M W Up to 29 30 to 49 50 to 65 Over 65
I’m against many of our farm animals being given genetically modified fodder
79 74 83 69 80 82 79
I don’t think man has the right to genetically modify plants and animals 75 73 78 67 76 77 79
I think that genetic engineering in agriculture is an important building block in the struggle against world hunger
33 36 30 41 35 30 29
I think it’s a good thing if food prices drop thanks to genetic engineering procedures in farming
30 32 27 41 30 25 25
I don’t have a problem with eating genetically modified foods 25 29 21 34 27 21 17
Heavily over-represented Over-represented Under-represented Heavily under-represented
Table 7: Attitudes towards the deployment of genetic engineering in agriculture (by city/town size)
Please evaluate the following statements on genetic engineering in agriculture.
Answer category: Agree strongly/somewhat
Data in percent
City/town size (in 1,000)
Ø < 5 5-20 20-100 100-500 Over 500
I’m against many of our farm animals being given genetically modified fodder
79 87 81 82 79 74
I don’t think man has the right to genetically modify plants and animals 75 82 79 77 77 72
I think that genetic engineering in agriculture is an important building block in the struggle against world hunger
33 16 30 33 32 37
I think it’s a good thing if food prices drop thanks to genetic engineering procedures in farming
30 5 22 27 31 34
I don’t have a problem with eating genetically modified foods 25 7 15 21 26 30
Heavily over-represented Over-represented Under-represented Heavily under-represented

39
2015 Nature Awareness > Agrarian landscapes
The Germans have major health and ethical concerns about the genetic manipulation of nature.
79 percent of Germans by and large reject the idea of genetically modified farm animal feed, with 53 percent even rejecting it outright. This points to a German awareness of health and risks, as only 7 per-cent have absolutely no problem with eating geneti-cally modified foods (highest level of agreement). On the other hand, 45 percent have major and a further 28 percent some problems with it. People appear to be afraid that genetically modified foods could impact negatively on their own health – indirectly via the fodder given to farm animals.11 There are however also ethical reservations in addition to this somewhat self-interested motive. 75 percent agree with the statement that man has no right to subject plants and animals to genetic engineering.
The majority disagrees with the arguments ‘genetic engineering as a means of combatting world hunger’ and‘genetic engineering as a means of reducing food costs’.
There are two lines of reasoning that play an im-portant role in the debate on genetic engineering in agriculture: ‘genetic engineering as a means of combatting world hunger’ and ‘genetic engineering as a means of reducing food costs’. It transpires that the majority of Germans do not agree with these two arguments (see Figure 11).
Figure 11: Attitudes towards the deployment of genetic engineering in agriculture
Please evaluate the following statements on genetic engineering in agriculture. Do you agree with each statement strongly,somewhat, not really, or not at all?
0 10 20 30 40 50 60 70 80 90 100
Data in percent
I think it’s a good thing if food prices drop thanks to genetic engineering procedures agriculture
I don’t have a problem with eating genetically modified food
I don’t think man has the right to genetically modify plants and animals
I’m against many of our farm animals being given genetically modified fodder
I think that genetic engineering in agriculture is an important building block in the struggle
against world hunger
I disagree stronglyI agree somewhat
I agree strongly I disagree somewhat I don’t know/No answer
26
27
20
24
25
53
48
10
9
7
15
35
33
16
18
1
7
32
29
28
5
3
45
2
5
2
Table 6: Attitudes towards the deployment of genetic engineering in agriculture (by gender and age)
Please evaluate the following statements on genetic engineering in agriculture.
Answer category: Agree strongly/somewhat
Data in percent
Mean Gender Age (years)
Ø M W Up to 29 30 to 49 50 to 65 Over 65
I’m against many of our farm animals being given genetically modified fodder
79 74 83 69 80 82 79
I don’t think man has the right to genetically modify plants and animals 75 73 78 67 76 77 79
I think that genetic engineering in agriculture is an important building block in the struggle against world hunger
33 36 30 41 35 30 29
I think it’s a good thing if food prices drop thanks to genetic engineering procedures in farming
30 32 27 41 30 25 25
I don’t have a problem with eating genetically modified foods 25 29 21 34 27 21 17
Heavily over-represented Over-represented Under-represented Heavily under-represented
Table 7: Attitudes towards the deployment of genetic engineering in agriculture (by city/town size)
Please evaluate the following statements on genetic engineering in agriculture.
Answer category: Agree strongly/somewhat
Data in percent
City/town size (in 1,000)
Ø < 5 5-20 20-100 100-500 Over 500
I’m against many of our farm animals being given genetically modified fodder
79 87 81 82 79 74
I don’t think man has the right to genetically modify plants and animals 75 82 79 77 77 72
I think that genetic engineering in agriculture is an important building block in the struggle against world hunger
33 16 30 33 32 37
I think it’s a good thing if food prices drop thanks to genetic engineering procedures in farming
30 5 22 27 31 34
I don’t have a problem with eating genetically modified foods 25 7 15 21 26 30
Heavily over-represented Over-represented Under-represented Heavily under-represented
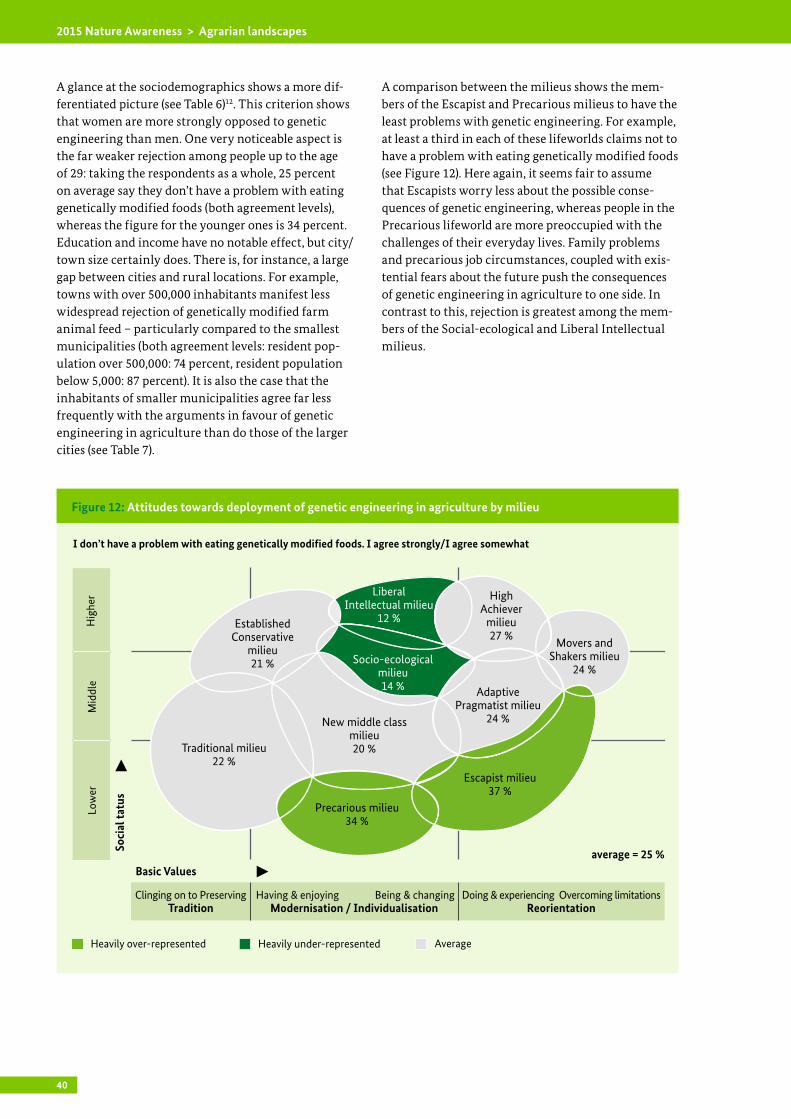
40
2015 Nature Awareness > Agrarian landscapes
A glance at the sociodemographics shows a more dif-ferentiated picture (see Table 6)12. This criterion shows that women are more strongly opposed to genetic engineering than men. One very noticeable aspect is the far weaker rejection among people up to the age of 29: taking the respondents as a whole, 25 percent on average say they don’t have a problem with eating genetically modified foods (both agreement levels), whereas the figure for the younger ones is 34 percent. Education and income have no notable effect, but city/town size certainly does. There is, for instance, a large gap between cities and rural locations. For example, towns with over 500,000 inhabitants manifest less widespread rejection of genetically modified farm animal feed – particularly compared to the smallest municipalities (both agreement levels: resident pop-ulation over 500,000: 74 percent, resident population below 5,000: 87 percent). It is also the case that the inhabitants of smaller municipalities agree far less frequently with the arguments in favour of genetic engineering in agriculture than do those of the larger cities (see Table 7).
A comparison between the milieus shows the mem-bers of the Escapist and Precarious milieus to have the least problems with genetic engineering. For example, at least a third in each of these lifeworlds claims not to have a problem with eating genetically modified foods (see Figure 12). Here again, it seems fair to assume that Escapists worry less about the possible conse-quences of genetic engineering, whereas people in the Precarious lifeworld are more preoccupied with the challenges of their everyday lives. Family problems and precarious job circumstances, coupled with exis-tential fears about the future push the consequences of genetic engineering in agriculture to one side. In contrast to this, rejection is greatest among the mem-bers of the Social-ecological and Liberal Intellectual milieus.
I don’t have a problem with eating genetically modified foods. I agree strongly/I agree somewhat
average = 25 %
Heavily under-representedHeavily over-represented Average
Clinging on to PreservingTradition
Having & enjoying Being & changingModernisation / Individualisation
Doing & experiencing Overcoming limitationsReorientation
Basic Values
Soci
al ta
tus
Low
erM
iddl
e H
ighe
r
Traditional milieu22 %
New middle class milieu20 %
Established Conservative
milieu21 %
Precarious milieu34 %
Socio-ecological milieu14 %
Liberal Intellectual milieu
12 %
High Achiever
milieu27 %
Movers and Shakers milieu
24 %
AdaptivePragmatist milieu
24 %
Escapist milieu37 %
Figure 12: Attitudes towards deployment of genetic engineering in agriculture by milieu

41
2015 Nature Awareness > Agrarian landscapes
Rejection of genetic engineering has lessened, but remains at a high level.
The question as to whether the German people find it important to ban genetically modified organisms in farming was posed both in 2009 and 2013. In 2009, 87 percent said they thought it was very or somewhat im-portant, and in 2013 almost as many, namely 84 per-cent, gave the same response. In the survey presented here, only 76 percent said they thought it was very or somewhat important to ban genetic engineering (see Figure 13). Basic agreement with a ban nonetheless remains at a high level, with the level increasing with age and among women. Critics of genetic engineering are under-represented in the group of people on an income of 3,500 euros and more (see Table 8). Fur-thermore, differentiation by city/town size reveals the strongest agreement with a ban in the smallest municipalities: 72 percent of those living in villages think it “very important” to ban genetically modified organisms in farming, whereas only 39 percent in the larger major cities say so (resident population: at least 500,000).
Figure 13: Agreement with the banning of genetically modified organisms in farming
To what extent do you agree with the following statement? „The use of genetically modified organisms in farming will be banned.“
44
32
15
5 4 Very important
Somewhat important
Somewhat unimportant
Not importantat allI don’t know/No answer
Data inpercent
Table 8: Agreement with a ban on genetically modified organisms in farming (by sociodemographic characteristics)
And to what extent do you agree with the following statement?
Answer category: Very im-portant
Data in percent
Gender Age (years) Education Net household income (€)
Ø M W to 29 30 to 49
50 to 65
over 65 Low Mid High Up to
999
1,000 to
1,999
2,000 to
3,499
3,500 and
more
The use of genet-ically modified organisms in farming will be banned.
44 40 48 36 43 47 50 45 45 44 52 44 43 38
Heavily over-represented Heavily under-represented
A comparison between the lifeworlds shows the members of the Social-ecological milieu to be most vehemently against genetic engineering with an overwhelming majority of 90 percent (for the highest level of agreement alone: 67 percent). The Precarious and Escapists manifest the least agreement with a ban
on genetic engineering in agriculture compared with the other milieus; the majority nonetheless also back a ban (both agreement levels: 69 percent each; highest level of agreement: Precarious 35 percent, Escapists 34 percent).

42
2015 Nature Awareness > Urban nature
3 Urban nature
At first glance, they seem like opposites: the city and nature. This impression arises from the history of society’s long-standing relationship to nature, in which the city has emerged as a functional, spatial-typo logical and spiritual anti-pole to nature and wilderness on the one hand, and to the countryside and agriculture on the other (Vicenzotti and Trepl 2009): hence, where there is city there is no or hardly any nature, and where there is nature, city can’t exist. The urban way of life is continuing to spread within Europe and on a global scale and inevitably, it would seem, at the expense of nature: forests are being cleared, wetlands drained and farmland must make way for urban settlement and infrastructure.
However, the historically evolved antithesis between city and nature is beginning to waver. Today, at least, we see the two poles changing and the boundaries between them beginning to blur. On the one hand, ‘the countryside’ is changing as a result of prolifera-ting urban forces (settlements, functions, ways of life). Besides ‘proper’ towns and cities, there are many cases of settlement structures springing up around them, which can be assigned neither to urban nor to rural space and for which the architect Thomas Sieverts (1997) coined the graphic term ‘Zwischenstadt’, mean-ing ‘urban sprawl’ (cf. also Vicenzotti 2011).
Further, the appearance of towns/cities is also chang-ing, along with our image of them. One of the most striking aspects of this ‘morphogenesis’ and change in meaning is the increasingly important role played by urban green open spaces and the reappraisal of urban nature. There are many examples to illustrate this:
› A feature of Frankfurt am Main since 1989 has been the so-called ‘green belt’. This green space en-circling the city centre and covering approx. 8,000 hectares fulfils important functions for the Main metropolis and is continuing to evolve.
› Berlin has manifold green open spaces, which together account for over 40 percent of the city area. Berlin’s Urban Landscape Strategy’ focuses on three topics: ‘Beautiful City’, ‘Productive Landscape’, and ‘Urban Nature’. All three are devoted to forming new syntheses between the supposed antipodes ‘city’ and ‘nature’ (cf. Kowarik 2012 and the Senate Depart-
ment for Urban Development and the Environment 2012).
› Andernach am Rhein is the pioneer of the ‘Edible City’ concept which has already found followers in many places around the country: food produc-tion in the city centre, new ways of utilising public spaces and the city as an ‘ark’ for the protection of biodiversity are just some of the goals that the city council is pursuing with this concept.
› Taking Bonn as an example, one can’t help but notice the growing importance of green urban spaces as a location factor. Businesses with a highly trained and larger than average workforce favour locations with attractive green structures (Schäffer and Erdmann 2013).
› Anyone interested in architectural and urbanistic plans for the future will ascertain that the idea of ‘green spaces in the city’ has long ceased to be limited to well-maintained city parks or roadside vegetation. Architects’ models of new high-rise constructions not only aspire to aesthetic quality and an economic use of resources, but treat build-ings as overarching systems that integrate roof and facade greening, energy-generating algae and the use of green strips to connect the outdoor area.
The city of tomorrow is green (von Borries 2011). At least it could be.13 However, the project to ‘green up’ our cities certainly can’t be taken for granted. The urban green spaces are under far too much pressure for that: many municipal parks and gardens departments have been hit by budget cuts; demographic change is confronting many city councils with the question of how they can still afford to fund their public goods and open spaces; building development is becoming increasingly dense, particularly in boom towns, thus increasing the pres-sure to build on green spaces. The future of urban green spaces is at the mercy of these conflicting priorities, and it is these potential conflicts that will ultimately decide whether the green vision for our cities, for which there are countless plans backed by plenty of commitment, can actually become sustainable reality.
This tense situation is what prompted the present Nature Awareness Study to ask the population spe-

43
2015 Nature Awareness > Urban nature
cifically about their perception of urban landscaping. The first point to clarify was what people in Germany understand by urban nature. Do respondents actually count different types of urban open spaces as ‘nature’? Do they assign garden plots or cemeteries to nature in the same way that they classify forests or parks? And what about access to and use of these types of urban nature? Do citizens actually use the urban nature they call for? And so – how and what for? What occurs to people on hearing ‘wilderness in the city’, i.e. what do they think of inner-city open spaces and undeveloped land which are left untended or under-used? Do these then become foreign bodies within the urban setting, or are they tolerated as one of its conceivable man-ifestations – or even seen as places offering creative scope?
3.1 Urban nature: understanding and relevance
City and nature: how do they relate to one another? Does nature lie outside the city so that one has to trav-el ‘out of the city’ to be ‘in nature’? Or rather, which elements and manifestations of the urban setting are
considered part of nature? The logical question here is what Germans understand by urban nature: “What is urban nature for you?” To help them answer this, respondents were requested to name all the concepts they associate with urban nature (see Figure 14 for what follows below)14.
Urban nature is predominantly associated with parks and public green spaces.
Urban nature spontaneously makes 82 percent of respondents think of the category ‘Parks and public green spaces’. Of these, 63 percent associate the cate-gory with green areas or public parks, whereas 6 per-cent also think of animal parks or the zoo. Subsumed under public green spaces are meadows (22 percent), woodland (19 percent), tree-lined avenues (11 percent), street plantings (8 percent) and cemeteries (6 percent).
Just under two thirds of respondents (65 percent) mention terms from the ‘Vegetation (in general)’ category, with no discernible connection to parks and public green spaces. Trees are mentioned most frequently by far (43 percent), but people also think of flowers (23 percent), plants (19 percent), bushes, shrubs
Figure 14: Associations with urban nature, responses arranged by categories
Data in percent
Parks a
nd public
green sp
aces
Vegeta
tion (in
genera
l)
Wate
r bodies
Garden
s
Places
for s
port an
d exerc
ise
Animals
Quality
of life
and re
creati
on
Greenery
on and ar
ound buildings
Leisure
facilit
ies
Agricultu
re
Protec
ted re
source
Citysca
pe
Wea
ther
seas
ons
Negati
ve co
mments
What is urban nature as far as you’re concerned? Please tell me as many terms and ideas as you can think of. (Open question)
82
65
4337
23 2217 15
7 7 63 3 1
90
80
70
60
50
40
30
20
10
0

44
2015 Nature Awareness > Urban nature
or hedgerows (15 percent) and flower beds (5 per-cent).
The third most common association that occurs to re-spondents is ‘Water bodies’ (43 percent) such as ponds, lakes or pools (25 percent), water meadows, rivers or streams (20 percent) and wells or water fountains (4 percent). These are followed by ‘gardens’ with 37 percent of responses and ‘animals’ with 22 percent. For the latter, the main focus is on birds (12 percent), followed by insects (3 percent) and wildlife (2 percent). At 3 percent, insects come before pets such as dogs (2 percent) and cats (1 percent).
A lower proportion of respondents associate urban nature in the broadest sense with the ‘greening up of buildings and areas around buildings’ (15 percent). Responses that fall into this category have mainly to do with terrace planting (6 percent), in which con-text respondents also name flower pots (3 percent). Greened roofs (4 percent), back gardens (3 percent), greened exterior walls (1 percent) and houses covered in greenery (1 percent) are likewise mentioned.
Urban nature often makes people think of places for sport and exercise.
Categories of urban nature that promote a ‘good human life’ are specified more frequently than in response to the open question on agrarian landscapes. What is more, it also becomes clear from these com-ments that urban nature often provides the ‘setting’ for human activities (cf. Tessin 2004). 23 percent of respondents connect urban nature with different ‘Places for sport and exercise (see here also BfN 2008 and Baumgarten et al. 2013). The diverse forms of sport and exercise come to bear here, with responses ranging from playgrounds (8 percent), hiking trails (4 percent), footpaths (4 percent) and cycle paths (3 percent) down to sports grounds (3 percent), open air swimming pools (3 percent) and lakes for swim-ming (1 percent). 17 percent of respondents associate urban nature with ‘quality of life and recreation’, and 7 percent see a connection with ‘leisure facilities’, in-cluding popular destinations (4 percent), beer gardens (2 percent) and BBQ areas (1 percent).
With 7 percent of responses, the term ‘urban nature’ also triggers associations with ‘agriculture’: fields within the city zone are mentioned (3 percent), as are
fruit growing, agricultural land, grazing land and fallow fields/arable land (1 percent each).
6 percent of respondents link urban nature with a ‘protected resource’ – for instance by mentioning inner-city nature conservation areas (3 percent), ‘cleaner’ nature (2 percent), or by referring to animal habitats (worthy of protection (2 percent).
The ‘cityscape’ issue is also addressed (3 percent), with people associating here a natural-looking appearance that manifests itself predominantly in comments calling for ‘few’ or ‘no’ cars. And finally, 3 percent of respondents describe ‘weather phenomena’ in the context of urban nature, particularly sun(shine). By comparison with the open question on agrarian landscapes (Chapter 2), negative comments relating to urban nature play a somewhat marginal role: even weeds are named in merely 1 percent of cases.
After naming their associations with urban nature, the respondents were asked to rate the different fea-tures of inner-city nature for relevance.
Public parks are particularly important to Germans.
Only for a fraction of the population (3 percent) are public parks “not very important”. 80 percent find them “very important” and just 17 percent “some-what important”. This is hardly surprising when one considers that parks are often very big, cohesive and largely undeveloped green spaces, generally charac-terised by a blend of trees, shrubs and grass, and most-ly big enough to offer the urban fauna – insects, birds, small mammals – an appreciable habitat. They are a place of recreation and, as such, a piece of accessible nature that can be experienced daily within the body of the city.
Germans see the second most important component of urban nature to be trees and plants at the side of the road, known by urban planners as ‘roadside vege-tation’ (very important: 70 percent). It is interesting that people rate this piece of urban nature as second most important, because – unlike the urban park – it appears in isolated or linear form rather than over a large area. This finding can be explained by the fact that roadside trees are frequently found outside peo-ple’s homes or in their neighbourhood and at the same time shape the cityscape. Tree sponsorships enjoy

45
2015 Nature Awareness > Urban nature
great popularity in towns and cities, and the felling of trees is often accompanied by loud protest.
Water bodies such as rivers, lakes and ponds represent the third most frequent responses (very important: 60 percent), almost on a par with urban woodland (58 percent). Rivers actually shape the cityscape and city image in some cases, often forming part of the city’s name. Despite their generally very ‘civilised’ appearance (i.e. straightened waterways, with build-ings lining their banks, equipped with traffic infra-structure and used commercially), they are still perceived as urban nature. Unlike urban parks, urban woodland tends to be situated on the periphery of cities and thus beyond inhabitants’ daily scope of perception.
Front gardens (very important: 52 percent) and allot-ments (very important: 47 percent) are likewise among the spaces that around half the population deem par-ticularly important features of urban nature, although the answer categories “Somewhat unimportant” and “Not important at all” are named slightly more often here compared with the previously named areas (see Figure 15). The literature makes frequent reference in this context to the diverse positive functions fulfilled by allotments. As “green oases and antipoles in the midst of dense development and land sealing” (Diet-rich 2014, p.31) they have a positive impact on human health and quality of life (cf. for example Balder 2009).
36 percent of respondents classify cemeteries as a very important component of urban nature; roof and facade greening follows at 33 percent. As many as 20 percent find unused abandoned land and farmland to
Figure 15: Relevance of individual urban nature features
0 10 20 30 40 50 60 70 80 90 100
Data in percent
Public Parks
Roadside trees and plants
Water bodies such as rivers, streams, lakes and ponds
Urban woodlands
Front gardens
Allotments
Cemeteries
Green roofs and other parts of buildings
Land that isn’t used and is left abandoned
Farmland
Not important at allSomewhat important
Very important Somewhat unimportant
80 17 3
524
33
34
37
37
37
40
32
28
70
60
58
52
47
36
33
20
19
6
7
13
20
22
30
36
10
1
1
1
3
1
5
17
7
18
How important do you find the following urban nature features? Do you consider the features very important, somewhat important, somewhat unimportant or not at all important?
I don’t know/No answer

46
2015 Nature Awareness > Urban nature
be very important (19 percent), although the fact that 18 percent and 17 percent, respectively, consider these “not important at all” would seem to express a degree of rejection. As much as many appreciate unused land in the inner city as a piece of urban ‘wilderness’ (see here DUH 2013 and 2014), other groups are inclined to see it as a sign of neglect or as a threat – for exam-ple as ‘dark’ corners or areas that don’t afford a clear view and are rarely frequented, which makes them appear unsafe. It should nonetheless be remembered here that previously utilised areas that have fallen into disuse are actually often ‘tended’ to a minimum degree, i.e. mown once a year for example. It is hardly surprising to note that agricultural land (considerable amounts of which many cities incorporate within their boundaries) are viewed less frequently as im-portant features of urban nature given the traditional polarity between town and countryside.
The sociodemographic characteristics reveal that more women than men find most of the sub-com-ponents of urban nature “very important”. Urban nature enjoys relatively little appreciation among the youngest respondents (under-30s), but is highly ap-preciated among the 50 to 65 year olds. Furthermore, it is apparent that mid-level education coincides with a higher than average rating (see Table 9). As already described in the section on agrarian landscapes, one can fairly assume here that the place where respond-
ents live plays an important role in clarifying their response behaviour: a comparison based on city/town size shows the least appreciation of inner-city nature features (with the exception of urban woodland and cemeteries) amongst people living in cities with a population of over 500,000. There, for example, 63 percent view roadside trees and plants as “very impor-tant”, while 82 percent do so in municipalities with under 5,000 inhabitants (see also Table 10). On the other hand, it is of note that in cities with over 500,000 inhabitants, the 50 to 65 year olds are under-rep-resented, as are people with mid-level educational attainment.
It is also worth mentioning that a disproportionate-ly high proportion of people with a net household income of 3,500 euros and more consider water bodies “very important” (68 percent, population average: 60 percent), In contrast, they rate cemeteries “very important” to a below-average degree (29 percent, population average: 36 percent).
On comparing the milieus, it becomes clear that the Escapists as fun-loving clubbers/night-lifers attribute the least importance to urban nature. For example, just half this milieu find water bodies such as rivers, streams, lakes and ponds “very important”. By com-parison: the figure for the Liberal Intellectual and Social-ecological milieus is 70 percent, respectively.
Table 9: Relevance of individual urban nature features (by gender, age and education)
How important do you find the following urban nature features?
Answer category: Very important
Data in percent
Mean Gender Age (years) Education
Ø M W Up to 29
30 to 49
50 to 65
over 65 Low Mid High
Public parks 80 77 84 68 80 87 82 79 85 76
Roadside trees and plants 70 66 75 58 72 76 73 68 78 67
Water bodies such as rivers, streams, lakes and ponds 60 57 64 55 60 68 59 58 67 58
Urban woodlands 58 55 62 53 59 61 59 55 63 59
Front gardens 52 46 59 38 51 59 56 53 58 45
Allotments 47 44 52 36 49 52 50 48 50 44
Cemeteries 36 33 38 16 31 41 50 36 38 31
Green roofs and other parts of buildings 33 32 34 29 31 37 32 31 34 34
Unused land 20 19 20 16 19 23 19 19 22 18
Farmland 19 19 19 19 21 18 20 20 20 18
Heavily over-represented Over-represented Under-represented Heavily under-represented
Table 10: Relevance of individual urban nature features (by city/town size)
How important do you find the following urban nature features?
Answer category: Very important
Data in percent
City/town size (in 1,000)
Ø < 5 5-20 20-100 100-500 over 500
Public parks 80 95 83 82 83 75
Roadside trees and plants 70 82 73 73 77 63
Water bodies such as rivers, streams, lakes and ponds 60 71 55 60 65 58
Urban woodlands 58 60 55 57 61 58
Front gardens 52 61 45 61 55 45
Allotments 47 57 48 51 51 42
Cemeteries 36 34 32 39 35 35
Green roofs and other parts of buildings 33 41 30 33 38 27
Unused land 20 20 20 23 21 17
Farmland 19 22 19 25 18 17
Heavily over-represented Over-represented Under-represented Heavily under-represented

47
2015 Nature Awareness > Urban nature
Two in three Germans argue for places in the town/city where nature is left to evolve spontaneously.
As shown by the question on the importance of in-ner-city natural features, the population appears am-bivalent about urban nature on land that is no longer in use. However, this ambivalence doesn’t mean that the Germans are against places in the town/city that allow for the spontaneous development of nature where it is left to evolve according to its own natural laws. Urban nature of this kind can also be a delibe-rate feature of public parks or private parks. On the contrary, the overwhelming majority are “pro” such places, with a third even voicing “complete” approval (see Figure 16).
Given the great importance of vacant/derelict land for biodiversity in towns/cities (Hansen et. al. 2012), this is a gratifying finding. On the other hand, as many as 30 percent of respondents are not really or not at all in favour of urban areas that allow nature to evolve spontaneously. This divided picture confirms the results of earlier studies which showed inner-city derelict land to be a subject for debate amongst the population (cf. Mathey and Rink 2010). In this context, it is also of note that ratings for derelict land are close-ly related to the appearance of the land along with its potential usability (see here Banse and Mathey 2013, Rink and Arndt 2011, Lafortezza et al. 2008).
A comparison of the proponents of inner-city derelict land by sociodemographic characteristics reveals no significant differences with regard to gender, age, in-come and city/town size. Slightly fewer people with a lower level of formal education are in favour of urban derelict land (agree strongly / agree somewhat: lower level of formal education: 63 percent, mid- and higher levels of formal education: 72 percent each, popula-tion average: 69 percent).
Figure 16: Attitude towards urban wasteland
Are you in favour of places in your town/city or those in the vicinity where nature is left to evolve spontaneously, i. e. remains abandoned?
44
24
6 1
25Completely in favour
Somewhat in favour
Somewhat against
Completely against
I don’t know/ No Answer
Data inpercent
ents live plays an important role in clarifying their response behaviour: a comparison based on city/town size shows the least appreciation of inner-city nature features (with the exception of urban woodland and cemeteries) amongst people living in cities with a population of over 500,000. There, for example, 63 percent view roadside trees and plants as “very impor-tant”, while 82 percent do so in municipalities with under 5,000 inhabitants (see also Table 10). On the other hand, it is of note that in cities with over 500,000 inhabitants, the 50 to 65 year olds are under-rep-resented, as are people with mid-level educational attainment.
It is also worth mentioning that a disproportionate-ly high proportion of people with a net household income of 3,500 euros and more consider water bodies “very important” (68 percent, population average: 60 percent), In contrast, they rate cemeteries “very important” to a below-average degree (29 percent, population average: 36 percent).
On comparing the milieus, it becomes clear that the Escapists as fun-loving clubbers/night-lifers attribute the least importance to urban nature. For example, just half this milieu find water bodies such as rivers, streams, lakes and ponds “very important”. By com-parison: the figure for the Liberal Intellectual and Social-ecological milieus is 70 percent, respectively.
Table 10: Relevance of individual urban nature features (by city/town size)
How important do you find the following urban nature features?
Answer category: Very important
Data in percent
City/town size (in 1,000)
Ø < 5 5-20 20-100 100-500 over 500
Public parks 80 95 83 82 83 75
Roadside trees and plants 70 82 73 73 77 63
Water bodies such as rivers, streams, lakes and ponds 60 71 55 60 65 58
Urban woodlands 58 60 55 57 61 58
Front gardens 52 61 45 61 55 45
Allotments 47 57 48 51 51 42
Cemeteries 36 34 32 39 35 35
Green roofs and other parts of buildings 33 41 30 33 38 27
Unused land 20 20 20 23 21 17
Farmland 19 22 19 25 18 17
Heavily over-represented Over-represented Under-represented Heavily under-represented

48
2015 Nature Awareness > Urban nature
The milieu perspective discloses that the proportion of those supporting the idea of urban wasteland is smallest within the Traditional milieu (agree strongly/agree somewhat: 59 percent). This backs up the famil-iar theory that derelict land can easily be perceived as scruffy or run down, which clashes with traditional notions of order and aesthetics. A higher than average number of Social Ecologicals and High Achievers take a positive view of urban wasteland (agree strongly/agree somewhat: 76 percent each).
3.2 Accessibility and frequency of using urban nature; satisfaction with inner-city nature
Having investigated what people understand by urban nature and how important they consider its individual features, the survey asked how accessible urban nature should be, how satisfied citizens are with the current ‘offering’ or availability of urban nature, and how often they make use of what’s on offer. In answering the questions on satisfaction and frequen-cy of use, people also had the option of responding by saying they rarely spent time in the town/city or that they didn’t live in a town/city. In contrast, all the other questions took into account the opinion of all respondents, i.e. also those who didn’t live in a town/city or only rarely spent time there – in these cases, the view of the rural population was also of interest. Those having trouble answering could again resort to the ‘Don’t know’ category.15
The accessibility of urban nature is an important concern for the Germans.
61 percent of the German people find it “very impor-tant” that as many parts of a town/city as possible provide access to nature, with a further 33 percent finding it “somewhat important”. It is thus fair to say that the accessibility of urban nature is an important
issue for the population. A lack of the same can take different forms: on the one hand, the non-existence of urban nature, but also inaccessibility of inner-city green spaces from people’s place of residence.
More women than men and more old than young find the accessibility of urban nature “very important”. A differentiation based on educational background shows that more people with mid-level educational attainment rate urban nature particularly important compared with the population average. Those with a higher level of formal education more rarely empha-sise that nature should be accessible in all parts of town as far as possible (see Table 11). City/town size also has a bearing on response behaviour: 56 per-cent of inhabitants from major cities with a resident population of at least 500,000 attribute very high importance to the accessibility of urban nature. In medium-sized towns (resident population: 20,000 to 100,000) and in smaller municipalities (resident popu-lation: below 5,000), the figures are far higher (67 percent or 70 percent).
Figure 17: Importance of accessibility to urban nature
How important do you think it is for nature to be accessible in all parts of a town/city as far as possible?
33
5 1
61
Very important
Somewhat important
Somewhat unimportant
I don’t know/No answer
Data inpercent
Table 11: Importance of having access to urban nature (by gender, age and education)
How important do you think it is for nature to be accessible in all parts of a town/city as far as possible?
Answer category: Very important
Data in percent
Mean Gender Age (years) Education
Ø M W Up to 29
30 to 49
50 to 65
over 65 Low Mid High
61 56 66 48 59 68 66 63 66 54
Heavily over-represented Over-represented Heavily under-represented

49
2015 Nature Awareness > Urban nature
A comparison between the milieus reveals that Escap-ists and the Precarious set less store by the accessibil-ity of inner-city nature, whereas a disproportionately high number of Liberal Intellectuals think it impor-tant (very important: Escapists: 53 percent, Precarious: 51 percent, Liberal Intellectuals: 75 percent). As estab-lished in other studies (cf. Anheier and Hurrelmann 2014), Liberal Intellectuals value a residential area that combines living quality with nature. The members of this milieu may aspire to (further) education and a career, but they also like to ensure a balance between body, mind and soul. The proximity to nature helps them find a work-life balance, i.e. what they see as the right mix between work, private life and relaxation.
Four in five Germans are satisfied with what their town/city has to offer in the way of nature.
A third of the population is “very satisfied” with the urban nature attractions in their town/city, and 46 percent are “somewhat satisfied”. A mere 12 percent overall are “not very satisfied” or “not at all satisfied”. Unreserved satisfaction increases with age (“very satisfied”: under-30s: 27 percent, over-65s: 39 percent). What is more, it is more pronounced amongst women (37 percent) than amongst men (31 percent). A look at city/town size shows that a disproportionately low number of those living in smaller towns (resident population: 5,000 to 20,000) are “very satisfied” with the nature attractions in their town/city (24 percent, population average: 34 percent).16 A comparison of the milieus shows no discernible statistically relevant differences in response behaviour.
Most Germans deliberately use innercity nature attractions.
Attitudes towards and basic satisfaction with urban nature attractions are one aspect, but are they actual-ly used by the population, and if so, how often? Hence the question of how often people frequent inner-city nature attractions.
A mere 5 percent of respondents say they never or only rarely consciously frequent inner-city nature attractions. 13 percent use them “several times a year”. In comparison, 73 percent visit the nature attrac-tions in the town/city several times a month or more often (34 percent “several times a month”, 30 percent “several times a week”, 9 percent “daily”). It can thus be seen that urban nature is used by the vast major-ity of urban dwellers and as such forms part of their everyday lifeworld.
The sociodemographic analysis reveals that slightly more women than men visit nature attractions in their town/city “daily” or “several times a week” (see Table 12). Compared with those who have basic and mid-level formal education, people with a higher level of educational attainment are also slightly more inclined to visit inner-city nature attractions (daily or several times a week: low and mid-level formal edu-cation 38 percent, respectively; high formal education 44 percent). The fact that those with a higher level of formal education are also less likely than the popu-lation average to claim that access to urban nature is very important to them (cf. here Table 11) may be due to their living in districts that offer plenty in the way of nature.
Figure 18: Satisfaction with the range of urban nature attractions
How satisfied are you with the nature attractions in your town/city?
46
11
1 7 1
34Data inpercent
Very satisfied
Somewhat satisfied
Not very satisfied
Not at all satisfied
I don’t live in a town/city/I only rarely spend time in a town/cityI don’t know/No answer
Figure 19: Frequency with which urban nature attractions are utilised
How often do you consciously frequent nature attractions in your town/city?
34
57 2 9
30Data inpercent
13
Several times a weekSeveral times a month
Several times a year
More rarely or never
Daily
I don’t live in a town/city/I only rarely spend time in a town/cityI don’t know/No answer

50
2015 Nature Awareness > Urban nature
However, the greatest factor to influence how often respondents frequent urban nature attractions is their age: more than half those over 65 use the offerings in question at least several times a week. The spare time available to pensioners probably plays a role here, as it allows the older generation more scope to enjoy nature on a day-to-day basis. By contrast, the 50 to 65 year olds manifest a far lower tendency to use in-ner-city nature attractions (daily/several times a week: 33 percent) – and this despite their attributing rela-tively high importance to the accessibility of urban nature (cf. here Table 11). As with the education factor, there appears to be a discrepancy here at first, but less frequent use of urban nature doesn’t necessarily mean that it is valued less: in fact, it may take on even more importance in cases where ‘time’ is in short supply.
Also of interest is the finding that the group of people with the highest net household income (of 3,500 euros and more) visit urban nature attractions less frequent-ly than households on a lower income (see Table 12). This is presumably due to the fact that households on a higher income have ‘market’ means, as it were, of procuring nature for themselves– for example via a garden of their own or via holiday trips and weekend breaks. These findings match the results from studies on environmental justice in towns/cities (cf. Klimec-zek 2014), which reveal that households on a lower income suffer from a shortfall in the provision of urban green open spaces, and at the same time clearly establish that such spaces constitute an important resource for these groups in terms of their leisure and recreation behaviour. The protection of urban nature is thus not only important in an ecological sense but also makes a vital contribution to maintaining the quality of life for all city dwellers (particularly the more disadvantaged), and consequently furthers so-
cial integration as well (cf. here also Claßen et al. 2011).
The fact that nature attractions in medium-sized and smaller towns are consciously frequented less often than those in cities (daily/several times a week; resi-dent population between 5,000 and 20,000: 31 percent, resident population between 20,000 and 100,000: 38 percent, resident population between 100,000 and 500,000: 38 percent, resident population over 500,000: 47 percent) may be because the inhabitants of smaller towns often live in an environment that is already enhanced by open green spaces
The milieu comparison shows that High Achievers most rarely visit the nature attractions in their town/city (at least several times a week: 33 percent), whereas the Social Ecologicals (47 percent) and Traditionals (46 percent) do so most frequently.
3.3 Social importance of urban nature
Besides the question of how often citizens frequent nature attractions in their town/city, the survey also determined the social importance of urban nature as seen by the German population. This is actually about the task that urban nature can potentially fulfil. To this end, respondents were given six response options relating to social, ecological and economic aspects.
The Germans see human wellbeing as the main task of urban nature.
Human well-being heads the list of main tasks for inner-city nature. 72 percent find this “very impor-
Table 12: Frequency of using urban nature attractions (by age, gender, education and income)
How often do you consciously frequent nature attractions in your town/city?
Answer category: Daily/ several times a week
Data in percent
Gender Age (years) Education Net household income (€)
Ø M W Up to 29
30 to 49
50 to 65
over 65 Low Mid High to 999
1,000 to
1.999
2,000 to
3.499
3,500 and
more
39 37 42 34 38 33 55 38 38 44 48 41 41 34
Heavily over-represented Over-represented Under-represented Heavily under-represented

51
2015 Nature Awareness > Urban nature
tant” and a further 23 percent “somewhat important”. Seen in combination with the findings reported above, namely that urban nature attractions are consciously frequented at least several times a month by 73 percent of the population, it is fair to say that urban nature is considered an essential contributor to people’s quality of life. This conclusion is supported if we look again at responses to the open question (in Section 3.1): 23 per-cent spontaneously associate urban nature with places for sport and exercise, 17 percent of responses relate explicitly to quality of life and recreation, and 7 percent make the connection with leisure facilities.
Many people are also very emphatic about the relevance of the habitat function of urban nature: 68 percent find inner-city nature “very important” as a habitat for animals and plants and 26 percent find it “somewhat important”. At 68 percent, the contribution of nature to the cityscape is rated “very important” to a similar extent as the habitat function. In addition, 58 percent think urban nature is “very important” with regard to the renown of a town/city (town/city image). Just recently, urban sociology has highlighted the importance of a town/city image for inward and outward communications and for con-solidating an urban identity (‘intrinsic logic of cities’) (cf. Löw 2010 and Schäfers 2010). Going by the results presented here, the look of a town/city seems to be slightly more important than its reputation.
As far as climate protection and climate change adaptation are concerned, urban nature plays a “very important” role for 62 percent of respondents, and for 29 percent it is “somewhat important”. Just 6 percent see it to be “somewhat unimportant”, and 1 percent “not important at all”. This finding is very remarkable in as far as it was only in the wake of national efforts (National Strategy for Adaptation to Climate Change since 2008) and countless local adaptation strategies (see for example the city of Karlsruhe’s Environmental Protection and Workplace Safety measures dating from 2013 and measures implemented by the city of Bocholt in 2014) in recent years that experts estab-lished that measures such as urban green open spaces or the greening up of roofs and facades mitigate the climate-driven warming of our towns/cities. They can also help with water retention during the ever likelier event of torrential rainfall (cf. Mathey et al. 2011 and the Berlin Senate Department of Urban Development and the Environment 2011). These findings from the ‘2015 Nature Awareness Study’ indicate that most of the population recognise the important and positive functions fulfilled by urban nature with regard to cli-mate change – perhaps also because one can directly experience the cooling and stress-reducing capacity of urban greenery in hot summers.
Figure 20: Social importance of urban nature
0 10 20 30 40 50 60 70 80 90 100
Data in percent
… for the well-being of the people who live there
… as a habitat for animals and plants
… for the look of the town/city (cityscape)
… for climate protection and climate change adaption
… for the reputation of the town/city
… for the market value of building plots and buildings
Not important at allSomewhat important
Very important Somewhat unimportant
23
26
27
29
35
42
72
68
68
62
58
41
5
4
2
6
12
4
2
And now for the tasks that urban nature is capable of fulfilling. How important is urban nature for the following aspects?
6
3
I don’t know/No answer
1
1
1
1
1

52
2015 Nature Awareness > Urban nature
education-based comparison shows that people with mid-level formal education are more inclined to rate all named aspects of inner-city nature as “very im-portant” than are people with a basic or higher level of formal education (see Table 13). The fact that fewer than average people with lower levels of educational attainment take the view that urban nature fulfils a very important function for climate protection and climate change adaptation implies that this section of the population is not yet sufficiently sensitised to the connection between city, nature and climate. It isn’t particularly surprising to see that people with a net household income of 3,500 euros and more show an above-average tendency to attribute a “very impor-tant” role to urban nature in relation to the market value of building plots and buildings (48 percent, population average: 41 percent).
The importance attributed to nature in the town/city with regard to the different aspects is not least a question of city/town size (see Table 14): people living in larger major cities assign urban nature across all the aspects listed with the lowest level of importance. For example, its importance for climate protection and climate change adaptation is rated “very im-portant” by 56 percent of people living in cities with over 500,000 inhabitants, whereas 65 percent of those
Table 14: Social importance of urban nature (by city/town size)
How important is urban nature for the following aspects?
Answer category: Very important
Data in percent
City/town size (in 1,000)
Ø < 5 5-20 20-100 100-500 over 500
… for the well-being of those who live in it 72 86 77 78 72 67
… as a habitat for animals and plants 68 74 71 71 73 62
… for the look of the town/city (cityscape) 68 84 71 73 69 63
… for climate protection and the climate change adaptation 62 81 63 63 65 56
… for the reputation of the town/city 58 72 64 65 56 53
… for the market value of plots and buildings 41 44 44 47 39 38
Heavily over-represented Over-represented Under-represented Heavily under-represented
A purely economic function brings up the tail end (by some margin) of the ranking of urban nature’s tasks: 41 percent find urban nature “very important” for the market value of building plots and buildings, while a further 42 percent find it “somewhat impor-tant”. Although the economic function ends up in last place, the level of fundamental agreement about its importance is notable (very important/somewhat important: 83 percent). This finding is supported by studies on the connection between urban green spaces
and the amount people are willing to pay for property (for example Gruehn 2012; cf. here also Schäffer and Erdmann 2013).
A look at the sociodemographic characteristics dis-closes that women rate almost all the functions of na-ture besides the economic role more importantly than do men. Also of note is that the age group up to 29 rates the importance of urban nature far lower than do the age groups of 30 and over. Furthermore, the
Table 13: Social importance of urban nature (by gender, age and education)
Moving on now to the functions that urban nature can fulfil: how important is urban nature for the following?
Answer category: Very important
Data in percent
Mean Gender Age (years) Education
Ø M W Up to 29
30 to 49
50 to 65
over 65 Low Mid High
… for the well-being of those who live in it 72 68 76 58 72 81 72 69 78 69
… as a habitat for animals and plants 68 65 71 59 68 74 68 65 75 65
… for the look of the town/city (cityscape) 68 64 72 53 70 74 70 66 74 64
… for climate protection and the climate change adaptation 62 59 64 52 62 71 59 56 68 63
… for the reputation of the town/city 58 55 61 48 56 66 60 56 64 55
… for the market value of plots and buildings 41 41 41 33 41 44 42 40 43 40
Heavily over-represented Over-represented Under-represented Heavily under-represented

53
2015 Nature Awareness > Urban nature
education-based comparison shows that people with mid-level formal education are more inclined to rate all named aspects of inner-city nature as “very im-portant” than are people with a basic or higher level of formal education (see Table 13). The fact that fewer than average people with lower levels of educational attainment take the view that urban nature fulfils a very important function for climate protection and climate change adaptation implies that this section of the population is not yet sufficiently sensitised to the connection between city, nature and climate. It isn’t particularly surprising to see that people with a net household income of 3,500 euros and more show an above-average tendency to attribute a “very impor-tant” role to urban nature in relation to the market value of building plots and buildings (48 percent, population average: 41 percent).
The importance attributed to nature in the town/city with regard to the different aspects is not least a question of city/town size (see Table 14): people living in larger major cities assign urban nature across all the aspects listed with the lowest level of importance. For example, its importance for climate protection and climate change adaptation is rated “very im-portant” by 56 percent of people living in cities with over 500,000 inhabitants, whereas 65 percent of those
li ving in towns with 100,000 to 500,000 inhabitants take this view and as many as 81 percent in the small-est municipalities (resident population below 5,000).
On comparing by lifeworld, we see that the members of the Social-ecological and Liberal Intellectual mi-lieus attribute the greatest importance to the different functions of urban nature – with one exception: when it comes to the market value of building plots and buildings, the proportion of those who find urban nature a particularly relevant dimension is greatest in the lifeworld of the High Achievers (“very impor-tant”: High Achievers: 51 percent; population average: 41 percent). This finding can be explained by the free-market mindset of this milieu. In the lifeworld of the Precarious and Escapists, “very important” ratings for urban nature are found to a disproportionately low degree across the board.
Table 14: Social importance of urban nature (by city/town size)
How important is urban nature for the following aspects?
Answer category: Very important
Data in percent
City/town size (in 1,000)
Ø < 5 5-20 20-100 100-500 over 500
… for the well-being of those who live in it 72 86 77 78 72 67
… as a habitat for animals and plants 68 74 71 71 73 62
… for the look of the town/city (cityscape) 68 84 71 73 69 63
… for climate protection and the climate change adaptation 62 81 63 63 65 56
… for the reputation of the town/city 58 72 64 65 56 53
… for the market value of plots and buildings 41 44 44 47 39 38
Heavily over-represented Over-represented Under-represented Heavily under-represented
Figure 21: Personal importance of urban nature
Data in percent
… as space for recreation and relaxation
… for your quality of life
… with regard to health
… as space for sport and exercise
… for experiencing nature
… as space for meeting other people
… for learning and understanding
Not important at allSomewhat important
Very important Somewhat unimportant
30
29
31
34
39
37
42
62
62
60
46
44
44
33
7
7
14
15
16
20
6 2
1
4
5
2
How important to you personally is urban nature with regard to the following aspects?
I don’t know/No answer
0 10 20 30 40 50 60 70 80 90 100
1
11
1
1
1
1
1

54
2015 Nature Awareness > Urban nature
20,000 to 100,000). For example, 56 percent of the inhabitants from towns with a resident population of at least 500,000 state that urban nature as space for recreation and relaxation is particularly important. In medium-sized towns, the proportion taking this view is far higher at 69 percent.
In the comparison by milieu, inner-city nature is attributed a high degree of personal importance not only amongst the members of the Social-ecological and Liberal Intellectual milieus but also by members of the Adaptive Pragmatic milieu. They value urban nature particularly in its role as a space for recreation and relaxation (very important: Adaptive Pragmatics: 74 percent, population average: 62 percent). Given
Table 15: Personal importance of urban nature (by gender, age and education)
How important to you personally is urban nature …
Answer category: Very important
Data in percent
Mean Gender Age (years) Education
Ø M W to 29 30 to 49
50 to 65
over 65 Low Mid High
… as space for recreation and relaxation 62 56 67 54 61 66 65 59 69 58
… for your quality of life 62 58 66 50 59 68 70 60 65 62
… with regard to health 60 55 65 47 58 66 66 58 66 57
… as space for sport and exercise 46 45 46 50 46 48 40 40 50 48
… for experiencing nature 44 40 48 36 42 50 46 41 48 43
… as space for meeting other people 44 40 47 38 41 46 50 42 49 40
… for understanding and learning 33 29 36 28 31 36 34 30 36 33
Heavily over-represented Over-represented Under-represented Heavily under-represented
3.4 Personal importance of urban nature
Urban nature takes on important functions not just for society as a whole but for the individual too. Hence the question as to the aspect of personal life for which inner-city nature is important.
In line with respondents’ belief in the great impor-tance of urban nature for the quality of life of urban dwellers, when asked about its personal relevance, they also place particular emphasis on its contribu-tion toward their own quality of life (very important: 62 percent). It is fair to assume that the term ‘quality of life’ in this context is seen as a kind of ‘cumulative indicator’, i.e. an aggregation of different facets of the personal importance of urban nature.
‘Recreation and relaxation’ receive the “very impor-tant” rating just as frequently as ‘quality of life’, while the aspect ‘health’ receives this rating with similar frequency (see here also Rittel et al. 2014). Just 7 to 8 percent of respondents, respectively, find urban nature “Somewhat unimportant” or “not important at all” with regard to quality of life, recreation/relaxa-tion and health. In fourth place among the aspects of urban nature enjoying greatest personal importance is ‘sport and exercise’ (very important: 46 percent), followed by ‘experiencing nature’ and ‘meeting other people’ (very important: 44 percent, respectively). As
many as one in three respondents claim that urban nature is of great personal importance to them with regard to ‘learning and understanding’ (very impor-tant: 33 percent).
Urban nature is more important to women than to men. Only when it comes to ‘sport and exercise’ is there no significant difference (very important: wom-en: 46 percent, men: 45 percent). The age compari-son shows that the younger age groups (under-30s) ascribe less importance to urban nature for almost all the personal needs listed than do older people, particularly the over-50 age group. However, exer-cise and sports activities are more important to the under-30s than to older people; as to be expected, this is particularly true compared to those over 65 (very important: under-30s: 50 percent, over 65s: 40 per-cent). The group of people with a lower level of formal education also find nature in combination with sport and exercise less important than the population in general (very important: a lower level of formal edu-cation 40 percent, population average 46 percent). It is striking that people educated to mid-level attribute greater personal importance to urban nature across the board than those with a higher level of formal education. City/town size again makes itself felt here: those living in cities with over 500,000 inhabitants value urban nature for all personal needs surveyed to a lesser degree than those living in medium-sized towns (resident population:

55
2015 Nature Awareness > Urban nature
20,000 to 100,000). For example, 56 percent of the inhabitants from towns with a resident population of at least 500,000 state that urban nature as space for recreation and relaxation is particularly important. In medium-sized towns, the proportion taking this view is far higher at 69 percent.
In the comparison by milieu, inner-city nature is attributed a high degree of personal importance not only amongst the members of the Social-ecological and Liberal Intellectual milieus but also by members of the Adaptive Pragmatic milieu. They value urban nature particularly in its role as a space for recreation and relaxation (very important: Adaptive Pragmatics: 74 percent, population average: 62 percent). Given
their fundamentally pragmatic attitude and their desire to make life as uncomplicated as possible, it is fair to assume that they favour inner-city nature over (what they see as somewhat time-consuming) excursions into the countryside. The Movers & Shakers attribute a noticeably high (above-average) level of importance to a space for sport and exercise (very important: Movers & Shakers 60 percent, population average 46 percent). In the Precarious and Escapist lifeworlds, urban nature plays a “not very important” role compared with all other milieus. This becomes particularly clear in connection with the question as to the importance of urban nature for their own quality of life (see Figure 22).
Table 15: Personal importance of urban nature (by gender, age and education)
How important to you personally is urban nature …
Answer category: Very important
Data in percent
Mean Gender Age (years) Education
Ø M W to 29 30 to 49
50 to 65
over 65 Low Mid High
… as space for recreation and relaxation 62 56 67 54 61 66 65 59 69 58
… for your quality of life 62 58 66 50 59 68 70 60 65 62
… with regard to health 60 55 65 47 58 66 66 58 66 57
… as space for sport and exercise 46 45 46 50 46 48 40 40 50 48
… for experiencing nature 44 40 48 36 42 50 46 41 48 43
… as space for meeting other people 44 40 47 38 41 46 50 42 49 40
… for understanding and learning 33 29 36 28 31 36 34 30 36 33
Heavily over-represented Over-represented Under-represented Heavily under-represented
Figure 22: Personal importance of urban nature by milieu affiliation
How important is urban nature to you personally with regard to the following aspects? Very important
Heavily under-representedHeavily over-represented Over-represented Average
average = 62 %
Clinging on to PreservingTradition
Having & enjoying Being & changingModernisation / Individualisation
Doing & experiencing Overcoming limitationsReorientation
Basic Values
Soci
al ta
tus
Low
erM
iddl
e H
ighe
r
Traditional milieu64 %
New middle class milieu64 %
Established Conservative
milieu67 %
Precarious milieu49 %
Socio-ecological milieu74 %
Liberal Intellectual milieu
82 %
High Achiever
milieu64 %
Movers and Shakers milieu
61 %
AdaptivePragmatist milieu
70 %
Escapist milieu44 %

56
2015 Nature Awareness > Renewable energies and the countryside
4 Renewable energies and the countryside
4.1 Energy transition
The energy transition introduced by the Federal Government in 2011 is a major political project. For the German Advisory Council on Global Change (WBGU 2011), this ‘major transformation’ involves the dramatic remodelling of our society with far-reach-ing implications. And yet there are mounting local protests against individual projects of the energy transition – such as the expansion of wind energy, the national grid or the cultivation of biomass. The main reasons behind such local protests are – besides anxiety about depreciation of property – impairment of the landscape coupled with the fear of losing one’s Heimat or homeland, worries about health hazards (for example from noise, electrosmog or infrasound), and concerns about natural resources and wildlife conservation (for example birds and bats in the case of wind farms; cf. Becker et al. 2014 and Devine-Wright 2011). In this context, experts recommend more or earlier citizen participation in planning procedures, financial stakes in yields and an altogether better co-ordination of regional and sectoral planning (cf. BfN and BBSR 2011, BHU 2014 and Demuth et al. 2014). This explains why the ‘2015 Nature Awareness Study’ looked at public acceptance of the energy transition in Germany. An interesting aspect here is how accept-ance has developed over time.
Approval of the energy transition has risen again.
In the ‘2013 Nature Awareness Study’, the decline in approval of the energy transition between 2011 and 2013 from 63 percent to 56 percent was put down to the public debate that arose in 2012/13 regarding its financing and in particular the cost of funding the EEG (Renewable Energy Act). The 2015 survey took place after the reform of the EEG in 2014, whose express objective was cost containment. The renewed increase in approval to 61 percent would seem to indicate that this reform has not quite recouped the original rating of 63 percent (2011) but that the drop in acceptance of 2013 has been largely redeemed. The decline in ‘no’ votes from 10 percent in 2013 to 7 percent today also points in this direction. However, other factors may also have contributed to this most recent increase in general acceptance (for example, partial awareness of citizen participation in planning and/or financial yields). Further research would be required to establish the exact reasons for acceptance or rejection here.
Women are more inclined than men to approve of the energy transition (men: 58 percent, women: 65 per-cent), and the same goes for the better educated as op-posed to the lesser educated (low: 55 percent, mid-lev-el: 66 percent, high: 65 percent). There are no notable effects relating to age and city/town size. However, the milieus produce some interesting focuses. One
Figure 23: Approval of the energy transition over time
Data in percent
2015
2013
2011
No Don’t know/No answerYes Undecided
29
30
26
61
56
63
3
4
56
10
Do you think the energy transition towards predominantly renewable energies is the right way to go?
7
0 10 20 30 40 50 60 70 80 90 100
Figure 24: Approval of the energy transition by milieu
2015
Traditional milieu50 %
New middle class milieu59 %
Established Conservatives
milieu69 %
Precarious milieu48 %
Socio-ecological milieu74%
LiberalIntellectual milieu
78 %
High Achiever
milieu61 % Movers and
Shakersmilieu75 %
AdaptivePragmatist milieu
70 %
Escapist milieu51 %
Do you think the energy transition towards predominantly renewable energies is the right way to go? Yes
average = 61 %
2013 (average = 56 %)
Traditional milieu45 %
New middle class milieu53 %
Established Conservatives
milieu66 %
Precarious milieu33 %
Socio-ecological milieu81 %
Liberal Intellectual milieu
72 %
High Achiever
milieu65 % Movers and
Shakersmilieu69 %
AdaptivePragmatist milieu
63 %
Escapist milieu45 %
stark unterrepräsentiertstark überrepräsentiert
überrepräsentiert durchschnittlich
2011 (average = 63 %)
Traditional milieu61 %
New middle class milieu62 %
Established Conservatives
milieu72 %
Precarious milieu47 %
Socio-ecological milieu84%
Liberal Intellectual milieu
83 %
High Achiever
milieu61 % Movers and
Shakers milieu72 %
AdaptivePragmatist milieu
70 %
Escapist milieu45 %
Heavily under-representedHeavily over-represented
Over-represented Average

57
2015 Nature Awareness > Renewable energies and the countryside
Approval of the energy transition has risen again.
In the ‘2013 Nature Awareness Study’, the decline in approval of the energy transition between 2011 and 2013 from 63 percent to 56 percent was put down to the public debate that arose in 2012/13 regarding its financing and in particular the cost of funding the EEG (Renewable Energy Act). The 2015 survey took place after the reform of the EEG in 2014, whose express objective was cost containment. The renewed increase in approval to 61 percent would seem to indicate that this reform has not quite recouped the original rating of 63 percent (2011) but that the drop in acceptance of 2013 has been largely redeemed. The decline in ‘no’ votes from 10 percent in 2013 to 7 percent today also points in this direction. However, other factors may also have contributed to this most recent increase in general acceptance (for example, partial awareness of citizen participation in planning and/or financial yields). Further research would be required to establish the exact reasons for acceptance or rejection here.
Women are more inclined than men to approve of the energy transition (men: 58 percent, women: 65 per-cent), and the same goes for the better educated as op-posed to the lesser educated (low: 55 percent, mid-lev-el: 66 percent, high: 65 percent). There are no notable effects relating to age and city/town size. However, the milieus produce some interesting focuses. One
Figure 23: Approval of the energy transition over time
Data in percent
2015
2013
2011
No Don’t know/No answerYes Undecided
29
30
26
61
56
63
3
4
56
10
Do you think the energy transition towards predominantly renewable energies is the right way to go?
7
0 10 20 30 40 50 60 70 80 90 100
Figure 24: Approval of the energy transition by milieu
2015
Traditional milieu50 %
New middle class milieu59 %
Established Conservatives
milieu69 %
Precarious milieu48 %
Socio-ecological milieu74%
LiberalIntellectual milieu
78 %
High Achiever
milieu61 % Movers and
Shakersmilieu75 %
AdaptivePragmatist milieu
70 %
Escapist milieu51 %
Do you think the energy transition towards predominantly renewable energies is the right way to go? Yes
average = 61 %
2013 (average = 56 %)
Traditional milieu45 %
New middle class milieu53 %
Established Conservatives
milieu66 %
Precarious milieu33 %
Socio-ecological milieu81 %
Liberal Intellectual milieu
72 %
High Achiever
milieu65 % Movers and
Shakersmilieu69 %
AdaptivePragmatist milieu
63 %
Escapist milieu45 %
stark unterrepräsentiertstark überrepräsentiert
überrepräsentiert durchschnittlich
2011 (average = 63 %)
Traditional milieu61 %
New middle class milieu62 %
Established Conservatives
milieu72 %
Precarious milieu47 %
Socio-ecological milieu84%
Liberal Intellectual milieu
83 %
High Achiever
milieu61 % Movers and
Shakers milieu72 %
AdaptivePragmatist milieu
70 %
Escapist milieu45 %
Heavily under-representedHeavily over-represented
Over-represented Average
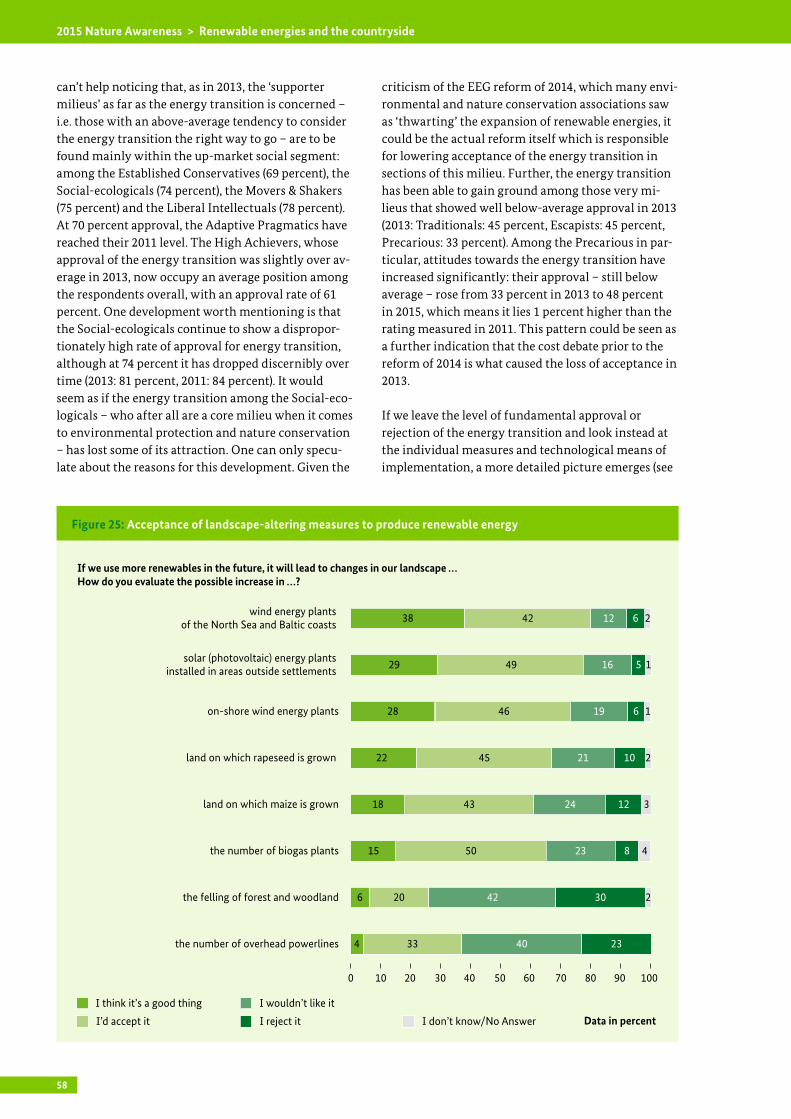
58
2015 Nature Awareness > Renewable energies and the countryside
can’t help noticing that, as in 2013, the ‘supporter milieus’ as far as the energy transition is concerned – i.e. those with an above-average tendency to consider the energy transition the right way to go – are to be found mainly within the up-market social segment: among the Established Conservatives (69 percent), the Social-ecologicals (74 percent), the Movers & Shakers (75 percent) and the Liberal Intellectuals (78 percent). At 70 percent approval, the Adaptive Pragmatics have reached their 2011 level. The High Achievers, whose approval of the energy transition was slightly over av-erage in 2013, now occupy an average position among the respondents overall, with an approval rate of 61 percent. One development worth mentioning is that the Social-ecologicals continue to show a dispropor-tionately high rate of approval for energy transition, although at 74 percent it has dropped discernibly over time (2013: 81 percent, 2011: 84 percent). It would seem as if the energy transition among the Social-eco-logicals – who after all are a core milieu when it comes to environmental protection and nature conservation – has lost some of its attraction. One can only specu-late about the reasons for this development. Given the
criticism of the EEG reform of 2014, which many envi-ronmental and nature conservation associations saw as ‘thwarting’ the expansion of renewable energies, it could be the actual reform itself which is responsible for lowering acceptance of the energy transition in sections of this milieu. Further, the energy transition has been able to gain ground among those very mi-lieus that showed well below-average approval in 2013 (2013: Traditionals: 45 percent, Escapists: 45 percent, Precarious: 33 percent). Among the Precarious in par-ticular, attitudes towards the energy transition have increased significantly: their approval – still below average – rose from 33 percent in 2013 to 48 percent in 2015, which means it lies 1 percent higher than the rating measured in 2011. This pattern could be seen as a further indication that the cost debate prior to the reform of 2014 is what caused the loss of acceptance in 2013.
If we leave the level of fundamental approval or rejection of the energy transition and look instead at the individual measures and technological means of implementation, a more detailed picture emerges (see
Acceptance of the cultivation of rapeseed (support: 22 percent, acceptance: 45 percent) and maize (sup-port: 18 percent, acceptance: 43 percent) for energy purposes is in the middle of the range. Compared to the 2013 study, one now sees slightly stronger support for growing rapeseed, which is offset by a slightly lower rate of acceptance (2013: support 18 percent, acceptance 46 percent). Approval of maize cultivation is comparable to the result of the last survey (2013: support 17 percent, acceptance 43 percent). A possible increase in biogas plants parallel to the expansion of renewable energies is supported by 15 percent of respondents in 2015; a further 50 percent express acceptance. Compared to 2013, approval of biogas plants has increased slightly (2013: support 16 percent, acceptance: 45 percent).
As in 2013, the felling of forest and woodland and the expansion of overhead powerlines are the least popular measures effecting the landscape as a result of develop-ing renewable energies. Just 6 percent support the felling of forest and woodland, and a further 20 percent would accept it, although acceptance has fallen noticeably compared with the previous survey (2013: support 5 percent, acceptance 26 percent). In 2015, only 4 percent of the respondents support continuing
Data in percent
wind energy plants of the North Sea and Baltic coasts
solar (photovoltaic) energy plants installed in areas outside settlements
on-shore wind energy plants
land on which rapeseed is grown
land on which maize is grown
the number of biogas plants
the felling of forest and woodland
the number of overhead powerlines
I reject itI’d accept it
I think it’s a good thing I wouldn’t like it
42
49
46
45
43
50
20
33
38
29
28
22
18
15
6
4
12
16
2
2
2
3
4
21
24
23
42
40
19
6
5
10
6
8
23
12
30
If we use more renewables in the future, it will lead to changes in our landscape … How do you evaluate the possible increase in …?
I don’t know/No Answer
0 10 20 30 40 50 60 70 80 90 100
1
1
Figure 25: Acceptance of landscape-altering measures to produce renewable energy
Table 16: Acceptance of landscape-altering measures to produce renewable energy (by gender, age and education)
Answer category: I think it’s a good thing
Data in percent
Mean Gender Age (years) Education
Ø M W Up to 29
30 to 49
50 to 65
Over 65 Low Mid High
wind energy plants off the North Sea and Baltic coasts 38 38 38 42 40 37 34 35 38 42
solar energy plants installed in areas outside settlements 29 28 29 31 30 26 28 26 27 34
wind energy plants in the countryside 28 27 29 33 29 25 28 28 24 33
land devoted to growing rapeseed 22 21 22 24 23 19 21 21 21 23
land devoted to growing maize 18 18 19 23 19 12 21 18 17 20
the number of biogas plants 15 16 14 16 15 13 16 14 14 17
the felling of forest and woodland 6 6 7 5 7 5 6 5 7 7
the number of overhead power lines 4 4 4 5 5 2 3 4 3 5
Heavily over-represented Over-represented Under-represented Heavily under-represented

59
2015 Nature Awareness > Renewable energies and the countryside
Figure 25). The background to each question is that the options surveyed lead to changes in the landscape.
4.2 Acceptance of landscape- altering measures
Wind energy plants and freestanding photovoltaic systems meet with widespread acceptance in the population.
The strongest support (” I think it’s a good thing”) and very high acceptance (“I’d accept it”) are enjoyed by offshore wind farms (support: 38 percent, acceptance: 42 percent), followed by free-standing photovoltaic systems (support: 29 percent, acceptance: 49 percent) and onshore wind farms (support: 28 percent, ac-ceptance: 46 percent). This means that acceptance of offshore wind farms has remained at the 2013 level (support: 38 percent, acceptance: 44 percent), while that of onshore wind farms is comparable (2013: support 26 percent, acceptance 48 percent). The same goes for support of free-standing photovoltaic systems (2013: support 27 percent, acceptance 50 percent).
Acceptance of the cultivation of rapeseed (support: 22 percent, acceptance: 45 percent) and maize (sup-port: 18 percent, acceptance: 43 percent) for energy purposes is in the middle of the range. Compared to the 2013 study, one now sees slightly stronger support for growing rapeseed, which is offset by a slightly lower rate of acceptance (2013: support 18 percent, acceptance 46 percent). Approval of maize cultivation is comparable to the result of the last survey (2013: support 17 percent, acceptance 43 percent). A possible increase in biogas plants parallel to the expansion of renewable energies is supported by 15 percent of respondents in 2015; a further 50 percent express acceptance. Compared to 2013, approval of biogas plants has increased slightly (2013: support 16 percent, acceptance: 45 percent).
As in 2013, the felling of forest and woodland and the expansion of overhead powerlines are the least popular measures effecting the landscape as a result of develop-ing renewable energies. Just 6 percent support the felling of forest and woodland, and a further 20 percent would accept it, although acceptance has fallen noticeably compared with the previous survey (2013: support 5 percent, acceptance 26 percent). In 2015, only 4 percent of the respondents support continuing
Data in percent
wind energy plants of the North Sea and Baltic coasts
solar (photovoltaic) energy plants installed in areas outside settlements
on-shore wind energy plants
land on which rapeseed is grown
land on which maize is grown
the number of biogas plants
the felling of forest and woodland
the number of overhead powerlines
I reject itI’d accept it
I think it’s a good thing I wouldn’t like it
42
49
46
45
43
50
20
33
38
29
28
22
18
15
6
4
12
16
2
2
2
3
4
21
24
23
42
40
19
6
5
10
6
8
23
12
30
If we use more renewables in the future, it will lead to changes in our landscape … How do you evaluate the possible increase in …?
I don’t know/No Answer
0 10 20 30 40 50 60 70 80 90 100
1
1
Figure 25: Acceptance of landscape-altering measures to produce renewable energy
Table 16: Acceptance of landscape-altering measures to produce renewable energy (by gender, age and education)
Answer category: I think it’s a good thing
Data in percent
Mean Gender Age (years) Education
Ø M W Up to 29
30 to 49
50 to 65
Over 65 Low Mid High
wind energy plants off the North Sea and Baltic coasts 38 38 38 42 40 37 34 35 38 42
solar energy plants installed in areas outside settlements 29 28 29 31 30 26 28 26 27 34
wind energy plants in the countryside 28 27 29 33 29 25 28 28 24 33
land devoted to growing rapeseed 22 21 22 24 23 19 21 21 21 23
land devoted to growing maize 18 18 19 23 19 12 21 18 17 20
the number of biogas plants 15 16 14 16 15 13 16 14 14 17
the felling of forest and woodland 6 6 7 5 7 5 6 5 7 7
the number of overhead power lines 4 4 4 5 5 2 3 4 3 5
Heavily over-represented Over-represented Under-represented Heavily under-represented

60
2015 Nature Awareness > Renewable energies and the countryside
expansion of overhead powerlines, and a further 33 percent would accept it. Here again, acceptance was far higher in 2013 at 39 percent, while support at this time totalled 5 percent.
There are no significant differences between women and men regarding their appraisal of the measures in question. Respondent age also plays a somewhat secondary role. It is worth noting the higher-than- average approval among the under-30s of maize cultivation along with onshore wind energy (see Table 16). The younger generation is perhaps already a little more accustomed than older people to the resultant changes to the landscape. However, education plays more of a role: people with a higher level of formal education are more likely than those with lower- and mid-level formal education to approve of most of the options in question, particularly offshore and onshore wind energy and free-standing photovoltaic systems. In municipalities with a maximum of 20,000 inhabitants, the proportion of those who approve of a
possible increase in onshore wind energy is relatively low (mean: 28 percent, resident population between 5,000 and 20,000: 20 percent, resident population below 5,000: 13 percent).
The extent to which landscape-changing measures for the production of renewable energies are approved of also depends on people’s milieu: the number of Tradi-tionals, Precarious and Escapists who support offshore and onshore wind energy is lower than the mean. Movers & Shakers, however, demonstrate significantly stronger approval of wind energy – whether onshore (40 percent “I think it’s a good thing”) or offshore (53 percent). One notices among the Social-ecologicals that their approval of rapeseed cultivation is just as reserved as that found within the Precarious milieu (14 percent “I think it’s a good thing”, respectively). Free-standing photovoltaic systems are particularly well received in the milieu of the Adaptive Pragmatics (39 percent “I think it’s a good thing”).

61
2015 Nature Awareness > General attitudes to nature and nature conservation
5 General attitudes to nature and nature conservation
This chapter deals with a core question of the Nature Awareness Study: how does the population relate to nature, and what’s the situation surrounding nature conservation? The first thing to clarify is the impor-tance of nature for people’s lives, for their health and their well-being. The focus here is less on the semantic meaning of ‘nature’ and what exactly people under-stand by this term. Instead the question seeks to establish how people relate to nature. Is it part of what they consider to be a good life? Does being in a natural environment make them happy? Do they feel at one with the nature and countryside of their own region? The aim is to get a closer idea of the population’s im-age of nature by examining their relation to it. People are explicitly asked whether nature remains an alien concept for them and whether they perhaps find it unpleasant to spend time in such surroundings.
Another important question in this chapter is wheth-er and how firmly the matter of nature conservation is embedded in the population. In order that nature conservation be seen as a political task that is at best even supported, there needs to be awareness of the human threat posed to nature, which in turn needs to be seen as something that requires action. For this reason, the question was also asked in 2015 whether people consider the destruction and reckless handling of nature as a threat – or whether they believe that society worries too much about the destruction of the natural world.
Once it becomes clear whether and to what degree nature is perceived as being under threat, one needs to ask to what extent society feels bound to engage in nature conservation. In this regard, it is quite con-ceivable that people would tolerate the destruction of nature as a negative but inevitable side-effect of its economic exploitation – a necessary evil, so to speak. Does man have the right to alter nature in his own in-terests and must we simply accept any impairment of nature or even destruction? Or do we have an obliga-tion – with or without such a right – to protect nature from the negative consequences of human exploita-tion? And if such an obligation does exist, is it incum-bent upon each and every citizen to act? Or must we assume that the individual is unable to make much of a contribution toward nature conservation anyway?
This chapter ends by looking at the ‘mandate’ of nature conservation: how strongly should nature con-servation intervene in the exploitation of nature? Is it perhaps the case that enough is already being done in Germany to protect nature? And in times of econom-ic crisis, should nature conservation concentrate on essentials, even making do with less money despite a basic need to do more to protect nature? Or ought we make more funds available – with a view to issues such as the endangered animal and plant species in Germany – and extend our nature conservation efforts still further?
5.1 Personal importance of nature
The population of German considers nature an integral part of a good life.
Nature continues to play an important and diverse role for people in Germany in 2015. For 94 percent of citizens, nature is part of a good life (both agreement levels). 92 percent value the diversity of nature and associate it with health and recreation, respectively. Furthermore, 90 percent say that spending time in natural surroundings makes them happy. They also attribute a lot importance to the role of nature in raising children. 92 percent think it important to in-troduce children to nature and what it has to offer. In contrast, very few Germans show no interest in nature (16 percent), don’t feel at home in natural surround-ings (12 percent) or regard nature as something alien (8 percent).
The Germans want to spend a lot of time in nature.
The overwhelming majority of the population tries to spend as much time as possible in nature (85 percent). Here, people manifest a strong orientation towards their own region: 85 percent feel close ties with nature and the countryside in their own region, 49 percent even agree strongly with this statement. In addi-tion, many Germans have a preference for unspoiled nature, with 54 percent liking nature all the more the wilder it is (highest level of agreement: 15 percent).

62
2015 Nature Awareness > General attitudes to nature and nature conservation
Women and older people attribute greater importance to nature than do men and younger people.
As already established in the previous studies, the findings of the current survey show that women feel a closer bond with nature than men. For example, 86 percent of men but 94 percent of women agree with the statement that nature makes them feel completely or at least somewhat happy. The difference between the age groups is even greater than that between the genders; this is particularly striking when it comes to the bond with nature within one’s own region. 71 percent of people under 30 indicate close ties with nature and countryside in their own region, whereas the figure for the over-65s is 91 percent – a difference of 20 percent.
The effect of education proves to be far weaker here. The greatest differences are again to be found con-cerning the bond with nature within one’s own re-gion. Interestingly, it is not the well-educated who are over-represented here but those educated to mid-level. The well-educated are often obliged to change their home for professional reasons and generally tend to be more mobile. This could be the cause of a less pro-nounced bond with the region and consequently also with the nature of the region. The findings also show that the preference for ‘wild’ nature increases with the level of education (cf. table 17).
Figure 26: Personal importance of nature
Data in percent
The wilder the nature, the better I like it
I’m not interested in nature
I don’t feel at home in nature
Nature is alien to me
Don’t agree at allAgree somewhat
Agree strongly Disagree somewhat Don’t know/No answer
33
35
36
40
39
11
6
5
59
55
49
45
15
5
6
3
13
3539
9
2
2
9
22115
6
3
6
5
13
14
12
62
78
2
75
It is or would be a priority for me to teachmy children to appreciate nature
It makes me happy to be out in nature
I try to get out into nature as often as possible
25
30
33
69
62
59
5
6
6
6
Nature is an integral part of a good life
What I love about nature is its diversity
For me, nature means health and recreation
I feel a close bond with nature and the countrysidein my region
0 10 20 30 40 50 60 70 80 90 100
11
1
11
1
1
1
1
Table 17: Personal importance of nature (by gender, age and education)
Answer category: Agree strongly / agree somewhat
Data in percent
Aver-age Gender Age (years) Education
Ø M W Up to 29
30 to 49
50 to 65
over65
Low Mid High
Nature is an integral part of a good life 94 92 96 86 95 96 97 94 96 93
What I love about nature is its diversity 92 91 94 84 93 96 94 92 95 91
For me, nature means health and recreation 92 90 95 81 95 95 95 92 93 92
It is or would be a priority for me to teach my children to appreciate nature
92 89 94 86 91 93 94 90 94 91
It makes me happy to be out in nature 90 86 94 79 91 93 93 88 92 89
I try to get out into nature as often as possible 85 81 89 73 85 89 91 83 89 84
I feel a close bond with nature and the countryside in my region 85 82 88 71 85 89 91 84 91 81
The wilder the nature, the better I like it 54 55 53 55 57 53 49 50 54 59
I’m not interested in nature 16 16 16 24 15 13 14 17 16 15
I don’t feel at home in nature 12 13 12 14 12 12 12 13 14 9
Nature is alien to me 8 7 7 11 6 8 6 7 8 7
Heavily over-represented Over-represented Under-represented Heavily under-represented

63
2015 Nature Awareness > General attitudes to nature and nature conservation
The effect of education proves to be far weaker here. The greatest differences are again to be found con-cerning the bond with nature within one’s own re-gion. Interestingly, it is not the well-educated who are over-represented here but those educated to mid-level. The well-educated are often obliged to change their home for professional reasons and generally tend to be more mobile. This could be the cause of a less pro-nounced bond with the region and consequently also with the nature of the region. The findings also show that the preference for ‘wild’ nature increases with the level of education (cf. table 17).
Table 17: Personal importance of nature (by gender, age and education)
Answer category: Agree strongly / agree somewhat
Data in percent
Aver-age Gender Age (years) Education
Ø M W Up to 29
30 to 49
50 to 65
over65
Low Mid High
Nature is an integral part of a good life 94 92 96 86 95 96 97 94 96 93
What I love about nature is its diversity 92 91 94 84 93 96 94 92 95 91
For me, nature means health and recreation 92 90 95 81 95 95 95 92 93 92
It is or would be a priority for me to teach my children to appreciate nature
92 89 94 86 91 93 94 90 94 91
It makes me happy to be out in nature 90 86 94 79 91 93 93 88 92 89
I try to get out into nature as often as possible 85 81 89 73 85 89 91 83 89 84
I feel a close bond with nature and the countryside in my region 85 82 88 71 85 89 91 84 91 81
The wilder the nature, the better I like it 54 55 53 55 57 53 49 50 54 59
I’m not interested in nature 16 16 16 24 15 13 14 17 16 15
I don’t feel at home in nature 12 13 12 14 12 12 12 13 14 9
Nature is alien to me 8 7 7 11 6 8 6 7 8 7
Heavily over-represented Over-represented Under-represented Heavily under-represented
There are some considerable differences between the social milieus in Germany when it comes to their personal appreciation of nature.
Among the milieus with pronounced post-material basic values, namely the Liberal Intellectuals and the Social-ecologicals, the findings point to a close prox-imity with nature. Nature also plays an important role within the Established Conservative milieu. It bears far less weight in the modern lower class, namely the Escapist and Precarious milieus. For example, only half the members of these milieus agree strongly with the statement that nature is part of a good life. In all other lifeworlds, well over half the respondents claim that this is so (between 62 and 86 percent).
Seasons have an influence on the personal importance of nature.
With the ‘2015 Nature Awareness Study’, there are now four surveys on this subject for Germany. Two of the surveys were conducted in the summer months (2009 and 2015) and the other two in the winter
months (2011 and 2013). Interestingly, a compari-son reveals the time of year in which the survey was conducted to have an unmistakable effect on response behaviour for questions to do with people’s person-al relationship to nature (see Table 18): The rate of agreement is far higher in the summer months than in the winter months. In Chapter 6 on the ‘Personal importance of biodiversity’, one sees a similar effect, albeit less clear-cut (q.v.). There doesn’t appear to be any summer-winter effect for the other topic areas.
5.2 Perception of risks to nature
The overwhelming majority of Germans are afraid that there will be hardly any nature left intact for the coming generations.
Half the population don’t feel directly threatened by the destruction of nature (both agreement levels: 49 percent). However, far more fear that there will be

64
2015 Nature Awareness > General attitudes to nature and nature conservation
hardly any nature left intact for the coming genera-tions (65 percent). Among the well-educated, as many as 70 percent believe this to be the case. Many Ger-mans evidently believe that while they themselves will not experience the full extent of the consequenc-es of such destruction, their children and grandchil-dren will indeed do so. This explains the high number of people who feel angry that many individuals treat nature so recklessly (83 percent). Women in particular (87 percent) and older people (50 to 65-year-olds and the over 65s: 87 percent, respectively) are filled with indignation at this reckless handling of nature.
A mere minority of Germans play down the risks to nature.
Given the considerable anger about the risks to nature, it is little wonder that a mere minority prefer to trivi-alise such risks: 22 percent are convinced that people worry too much about the destruction of nature (both agreement levels), 77 percent do not share this view. Men are more likely than women to play down the destruction of nature, those with a lower level of for-mal education more likely than the better educated, and younger respondents (under-30s) more likely than
Table 18: Personal importance of nature with the changing seasons (winter surveys: 2011 and 2013, Summer surveys: 2009 and 2015)
Answer category: agree strongly
Data in percent
2009 2011 2013 2015
Nature is an integral part of a good life 61 58 56 69
What I love about nature is its diversity 60 50 52 62
For me, nature means health and recreation 60 58 53 59
It is or would be a priority for me to teach my children to appreciate nature
53 50 52 59
It makes me happy to be out in nature 52 41 41 55
I try to get out into nature as often as possible 43 38 36 49
I feel a close bond with nature and the countryside in my region 41 33 31 45
Figure 27: Perception of the risks to nature
Please tell me for each of these statements whether you agree with it strongly, somewhat, not really or not at all.
Data in percent
It angers me that so many peopletreat nature so recklessly
I’m afraid there will hardly be any intact nature left forour children and grandchildren to enjoy
People worry too much aboutthe destruction of nature
I feel threatened by the destruction ofnature in our country
Don’t agree at allAgree somewhat
Agree strongly Disagree somewhat Don’t know/No answer
5
43
15
133647
22
7
28
3712 38
37
5
40
12
2
3
0 10 20 30 40 50 60 70 80 90 100
1
1
1

65
2015 Nature Awareness > General attitudes to nature and nature conservation
older people (see Table 19). Since it is precisely the younger generation that is most inclined to play down the issue, greater efforts should be made to cre-ate a stronger awareness of the problem among those under 30.
The Socialecological milieu is particularly aware of the destruction of nature.
As shown in the section dealing with the personal importance of nature, the Socio-ecological and Lib-eral Intellectual milieus have the strongest bond with nature. It therefore follows that anger about the reck-less handling of nature is strongest in these lifeworlds (Social-ecologicals: 96 percent, Liberal Intellectuals: 92 percent, population average: 83 percent). The mem-bers of the Precarious and Escapist milieus appear less angry (Precarious: 75 percent, Escapists: 71 percent). People in these lifeworlds are also less concerned about the risks to nature: 35 percent of Escapists and 36 percent of Precarious believe that people worry too much the destruction of nature (population average: 22 percent). Bearing in mind their own experiences with disadvantage and discrimination, it is fair to assume that both the Precarious and the Escapists consider other problems to be far more urgent than that of conserving nature.
5.3 Sustainable use and conservation of nature
A clear majority of the population sees it as their personal duty to conserve nature – but many shirk their responsibility.
Hardly anyone disputes the fact that man is part of nature (both rates of approval: 93 percent) and that it is his duty to protect nature (93 percent). Both atti-tudes intensify with age (see Table 20). However, when people are confronted with the question of personal responsibility, the rate of agreement drops consider-ably: 47 percent see themselves personally as “some-what” obliged, while a further 24 percent explicitly emphasise their personal responsibility. It is above all the older respondents who make nature conserva-tion their business (highest level of agreement, 50 to 65-year-olds: 29 percent, under-30s: 19 percent).
The question as to whether individuals can contribute towards nature conservation polarises German opinion.
44 percent of Germans agree strongly or somewhat that individuals are unable to contribute towards nature conservation, 55 percent are convinced that the opposite is true. If one looks at the highest level of agreement, it becomes apparent that it is above all those with a lower level of formal education (18 per-cent) and the people under 30 (19 percent) who believe their support wouldn’t make any difference (see Table 20). When asked whether man has the right to alter
Table 19: Perception of the risks to nature (by gender, age and education)
Answer category: Agree strongly / agree somewhat
Data in percent
Mean Gender Age (years) Education
Ø M W Up to 29
30 to 49
50 to 65
over 65 Low Mid High
It angers me that so many people treat nature so recklessly 83 79 87 70 84 87 87 81 87 81
I’m afraid there will hardly be any intact nature left for our children and grandchildren to enjoy
65 66 64 63 65 67 65 65 63 70
I feel threatened by the destruction of nature in our country 49 47 50 46 49 51 48 45 49 53
People worry too much about the destruction of nature 22 25 19 29 21 20 20 26 19 21
Heavily over-represented Over-represented Under-represented Heavily under-represented

66
2015 Nature Awareness > General attitudes to nature and nature conservation
nature, it is mainly people with a high net household income who agree “strongly” or “somewhat” (both agreement levels, net household income over 3,500 euros: 50 percent, population average: 42 percent).
Half the population take the view that enough is being done for nature conservation in Germany.
86 percent of Germans see nature conservation as an important political task. 51 percent of these believe that enough is being done in this regard– an interest-
ing finding, because in 2013 far fewer took this view, namely 40 percent. There has also been a notable rise in the proportion of those who attribute greater importance to economic development than to nature: 37 percent of Germans find that nature must not be allowed to stand in the way of economic development (2013: 32 percent). 65 percent of the population believe that in times of crisis, particularly, nature conserva-tion must make do with less money (2013: 62 percent). The recent European and global financial and eco-nomic crises with the resulting social consequences
Figure 28: Attitudes towards nature conservation
Please tell me for each statement whether you agree with it strongly, somewhat, not really or not at all.
Data in percent
It’s up to man to protect nature
I feel personally responsible for conserving nature
I, as an individual, can’t do much inthe way of nature conservation
Man has the right to modify nature for his own benefit
Don’t agree at allAgree somewhat
Agree strongly Disagree somewhat Don’t know/No answer
30
21
6
5
63
60
30
33
6
33 6
47 2124
14
9
36
39
7
17
19
Man is part of nature
2
0 10 20 30 40 50 60 70 80 90 100
1
1
1
1
Table 20: Attitudes towards nature conservation (by gender, age and education)
Answer category: Agree strongly
Data in percent
Mean Gender Age (years) Education
Ø M W Up to 29
30 to 49
50 to 65
over 65 Low Mid High
Man is part of nature 63 60 65 56 59 70 65 61 65 62
It’s up to man to protect nature 60 56 63 48 58 68 62 56 66 57
I feel personally responsible for conserving nature 24 23 24 19 20 29 27 24 24 22
I, as an individual, can’t do much in the way of nature conservation 14 15 14 19 14 12 15 18 12 12
Man has the right to modify nature for his own benefit 9 9 9 12 9 9 8 10 8 9
Heavily over-represented Over-represented Under-represented Heavily under-represented

67
2015 Nature Awareness > General attitudes to nature and nature conservation
for the population could explain why economic devel-opment is currently attracting such strong attention from large sections of the population in this country.
Respondent’s sociodemographics have no major in-fluence on response behaviour at this point. In detail, one notices that the perception of nature conservation as an important political task is slightly less common among the youngest respondents (under-30s) and those with a lower level of formal education (both agreement levels: under-30s: 79 percent, lower level of formal education: 82 percent). Of these, it is above all those with a lower level of formal education who think Germany is making sufficient effort to conserve nature (54 percent) and that nature conservation
ought to take a backseat in times of economic crisis (68 percent).
Agreement with the principles of a sustainable use of nature has become consolidated in the minds of many Germans.
As was the case back in 2013, there is a strong German consensus when it comes to fundamental approval of the principles underlying a sustainable use of nature: a mere fraction of the population challenges the importance of treating nature with care and diligence (see Figure 30). However, the degree to which people agree strongly with the principles of sustainable use has changed significantly over time: far more people
Figure 29: Nature conservation amidst conflicting political and economic priorities
Data in percent
Nature conservation in Germany is a major political task
In times of economic crisis, nature conservation also has to make do with less money
Nature must not be allowed to stand in the wayof economic development
Germany is doing enough to protect nature
Don’t agree at allAgree somewhat
Agree strongly Disagree somewhat Don’t know/No answer
5
44
26
114145
21
11
24
3813 36
43
7
17
9
1
3
4
4
2
0 10 20 30 40 50 60 70 80 90 100
Table 21: Nature conservation amidst conflicting political and economic priorities (by gender, age and education)
Answer category: Agree strongly / agree somewhat
Data in percent
Mean Gender Age (years) Education
Ø M W Up to 29
30 to 49
50 to 65
over 65 Low Mid High
Nature conservation in Germany is a major political task 86 86 86 79 89 86 87 82 88 88
In times of economic crisis, nature conservation also has to make do with less money
65 65 64 61 65 65 67 68 63 63
Germany is doing enough to protect nature 51 53 49 55 51 49 50 54 50 48
Nature mustn’t be allowed to stand in the way of economic development 37 40 34 41 35 33 41 40 36 34
Heavily over-represented Over-represented Under-represented Heavily under-represented

68
2015 Nature Awareness > General attitudes to nature and nature conservation
now than 2 years ago are completely convinced that nature must only be used in such a way that will afford future generations the same opportunity (2013: 57 percent, 2015: 62 percent), safeguard the diversity of plants and animals along with their habitats in the long term (2013: 55 percent, 2015: 62 percent) and preserve the uniqueness and beauty of nature and countryside (2013: 52 percent, 2015: 58 percent). The opinion that nature mustn’t be exploited at the expense of people in poorer states has also become firmly established among many citizens within the space of two years (2013: 49 percent, 2015: 56 percent).
By comparison with the average respondent, the younger generation (under-30s) shows less awareness of the need for a sustainable use of nature. The same applies (to a lesser extent) to people with a lower level of formal schooling. Surprisingly, unconditional agreement with the principles of a sustainable use of nature is most common among people educated up to mid-level. In addition, a comparison of the genders reveals that more women than men agree with these principles (see Table 22).
Figure 30: Approval of the principles behind the sustainable use of nature
Nature may only be utilized in such a wayas to safeguard the diversity of plants and animals along
with their habitats in the long term
We may only use nature in such a waythat affords coming generations
the same opportunity
We may not exploit nature at the expenseof people in poorer countries
Nature may only be utilized in such a way as to preserveits unique character and the beauty of the countryside
31
33
53162
62
56
6
3558
8 2
6
0 10 20 30 40 50 60 70 80 90 100
11
1
1
1
Data in percentDon’t agree at allAgree somewhat
Agree strongly Disagree somewhat Don’t know/No answer
two thirds of respondents claim the same - far fewer people. From a detailed analysis, one is struck by the fact that, besides the Precarious and Escapists, the High Achievers also express less concern about people in poorer parts of the world (highest level of agree-ment, population average: 56 percent, Precarious: 49 percent, Escapists: 44 percent, High Achievers: 44 percent).
Table 22: Agreement with the principles of a sustainable use of nature (by gender, age and education)
Answer category: Agree strongly
Data in percent
Mean Gender Age (years) Education
Ø M W Up to 29
30 to 49
50 to 65
over 65 Low Mid High
Nature may only be utilised in such a way as to safeguard the diversity of plants and animals along with their habitats in the long term
62 59 66 53 60 68 66 61 67 59
We may only use nature in such a way that will afford coming generations the same opportunity
62 58 66 48 61 69 66 59 66 60
Nature may only be utilised in such a way as to preserve its unique charac-ter and the beauty of the countryside
58 57 59 52 56 65 57 55 61 57
We may not exploit nature at the expense of people in poorer countries
56 52 60 49 55 63 57 56 58 54
Heavily over-represented Over-represented Under-represented Heavily under-represented

69
2015 Nature Awareness > General attitudes to nature and nature conservation
The comparison by milieu shows the Social-ecolog-icals and the Liberal Intellectuals to speak out most strongly in favour of the principles of a sustainable use of nature. For example, more than three quarters of respondents in each milieu firmly believe that na-ture should only be used in such a way as to safeguard the diversity of plants and animals along with their habitats in the long term. On average, approximately
two thirds of respondents claim the same - far fewer people. From a detailed analysis, one is struck by the fact that, besides the Precarious and Escapists, the High Achievers also express less concern about people in poorer parts of the world (highest level of agree-ment, population average: 56 percent, Precarious: 49 percent, Escapists: 44 percent, High Achievers: 44 percent).
Table 22: Agreement with the principles of a sustainable use of nature (by gender, age and education)
Answer category: Agree strongly
Data in percent
Mean Gender Age (years) Education
Ø M W Up to 29
30 to 49
50 to 65
over 65 Low Mid High
Nature may only be utilised in such a way as to safeguard the diversity of plants and animals along with their habitats in the long term
62 59 66 53 60 68 66 61 67 59
We may only use nature in such a way that will afford coming generations the same opportunity
62 58 66 48 61 69 66 59 66 60
Nature may only be utilised in such a way as to preserve its unique charac-ter and the beauty of the countryside
58 57 59 52 56 65 57 55 61 57
We may not exploit nature at the expense of people in poorer countries
56 52 60 49 55 63 57 56 58 54
Heavily over-represented Over-represented Under-represented Heavily under-represented

70
2015 Nature Awareness > Biodiversity
6 Biodiversity
The term ‘biodiversity’ was coined by scientists in the 1980s and quickly became common parlance in matters of nature conservation and in general usage. Since then, biodiversity is essentially defined on three levels: the diversity of species, the diversity of habi-tats and eco-systems and genetic diversity within a species. The key political document regulating the protection of life’s diversity at international level is the UN Convention on Biodiversity (CBD; United Nations 1992), which was also signed and ratified by the Federal Republic of Germany. Other international agreements for the protection of biodiversity include the Convention on Wetlands (or Ramsar Convention) and the Convention on International Trade in Endan-gered Species of Wild Fauna and Flora (or Washington Convention).
The diversity of life on the planet is being endangered and/or reduced by a whole series of processes, includ-ing: changes to the way land is used (for example de-forestation or the conversion of wetlands into agrarian land), the expansion of housing areas and infrastruc-ture, intensive farming involving high nitrogen input and the deployment of pesticides, the introduction of new species (neophytes) into sensitive eco-systems and climate change. All these processes are ‘man-made’, meaning that they are rooted in individual preferences, economic interests and political decisions. Conversely, however, this also means that by changing individual preferences and modes of behaviour, by tweaking eco-nomic activity and by developing different government policies it is possible to halt the loss of biodiversity.
This calls for the backing of society. We can all do our bit to change the social processes that are cumula-tively responsible for the ‘risks to biodiversity’ posed by ‘man’: for example, in the way we view and value nature, via our consumer behaviour, via our means of exerting influence in the workplace, and as deci-sion-makers in business and politics via our vision of and involvement in good policy-making and by helping to shape public opinion.
This insight also underlies nature conservation policy. This chapter therefore presents empirical findings on the population’s attitudes to ‘biodiversity’. First of all: are people familiar with the concept of biodiversity? And – if they have heard of it – do they know what it means? Is there an awareness of the global risks to biodiversity, or does the population take this for an exaggeration? And finally: If they think the preserva-tion of biodiversity is an important issue, are they also prepared to contribute personally to the issue?
The National Strategy on Biodiversity was agreed on 7 November 2007 to implement the Convention on Biological Diversity in Germany. It lays out the following goal: “In the year 2015, at least 75 percent of the population will rate the conservation of biological diversity as one of the top priorities for society. The significance of biological diversity is firmly anchored in the social consciousness. Human activity is increasingly tailored to this realisation, leading to a significant decline in the pressures on biological diversity. (BMU 2007, p. 60f.).”
This chapter presents the ‘Awareness of biodiversity’ indicator, which enables this goal to be measured, thus showing the degree to which the National Strate-gy has been fulfilled (see Kuckartz and Rädiker 2009). The Indicator is one of a set of indicators in the
Figure 31: Sub-indicators and overall indicator awareness of biodiversity
knowledge
total
attitude behaviour

71
2015 Nature Awareness > Biodiversity
National Strategy on Biodiversity (Ackermann et al. 2013). The input data is generated at regular intervals by the Nature Awareness Study.
6.1 Awareness of biodiversity: overall indicator
The awareness of biodiversity indicator comprises the subdomains knowledge, attitude, and willingness to act. Requirements expressing the targets set in the Na-tional Strategy on Biodiversity were defined for each of these subdomains. A sub-indicator was then formed for each area based on these requirements:
› The knowledge indicator shows what percentage of Germans are familiar with the term ‘biodiversity’, including being able to name at least one sub-com-ponent (diversity of species, eco-systems, gene).
› The attitude indicator shows what percentage of Germans express a positive attitude towards bio-
diversity and its preservation while assuming that the biodiversity on earth is in decline.
› The willingness to act indicator shows what per-centage of Germans express sufficient willingness to make a personal contribution towards preserv-ing biodiversity.
The level of the overall indicator ultimately corre-sponds to the percentage of people who fulfil the requirements in all three subdomains (knowledge, attitude, willingness to act) (see Kuckartz and Rädiker 2009). This construct implies that the overall indicator can’t be higher than the lowest sub-indicator – it gen-erally lies well below it (cf. here also Figure 31).17
A quarter of the population fulfils requirements with regard to a high level of awareness regarding the importance of biodiversity.
41 percent of Germans know the term ‘biodiversity’ and are able to explain it (knowledge indicator), 53 percent meet the attitude criterion, meaning they are
Figure 32: Overall indicator ’Awareness of biodiversity‘ by milieu
Overall indicator by milieu
Low
erM
iddl
eH
ighe
r
Basic Values
Soci
al s
tatu
s
Traditional milieu14 %
New middle class milieu16 %
EstablishedConservative milieu
32 %
Precarious milieu14 %
Socio-ecological milieu37 %
LiberalIntellectual milieu
45 %
High Achiever
milieu28 % Movers and
Shakers35 %
average = 24 %
AdaptivePragmatist milieu
24 %
Escapist milieu15 %
Heavily under-representedHeavily over-represented Average
Clinging on to PreservingTradition
Having & enjoying Being & changingModernisation / Individualisation
Doing & experiencing Overcoming limitationsReorientation
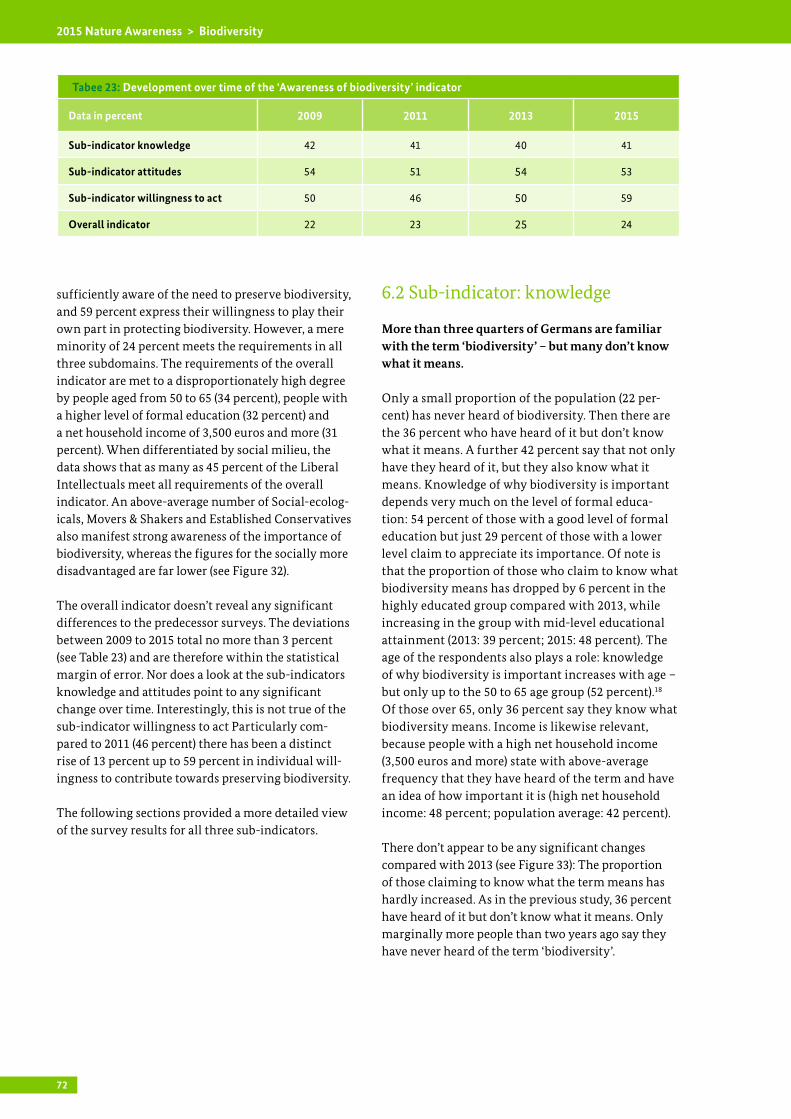
72
2015 Nature Awareness > Biodiversity
sufficiently aware of the need to preserve biodiversity, and 59 percent express their willingness to play their own part in protecting biodiversity. However, a mere minority of 24 percent meets the requirements in all three subdomains. The requirements of the overall indicator are met to a disproportionately high degree by people aged from 50 to 65 (34 percent), people with a higher level of formal education (32 percent) and a net household income of 3,500 euros and more (31 percent). When differentiated by social milieu, the data shows that as many as 45 percent of the Liberal Intellectuals meet all requirements of the overall indicator. An above-average number of Social-ecolog-icals, Movers & Shakers and Established Conservatives also manifest strong awareness of the importance of biodiversity, whereas the figures for the socially more disadvantaged are far lower (see Figure 32).
The overall indicator doesn’t reveal any significant differences to the predecessor surveys. The deviations between 2009 to 2015 total no more than 3 percent (see Table 23) and are therefore within the statistical margin of error. Nor does a look at the sub-indicators knowledge and attitudes point to any significant change over time. Interestingly, this is not true of the sub-indicator willingness to act Particularly com-pared to 2011 (46 percent) there has been a distinct rise of 13 percent up to 59 percent in individual will-ingness to contribute towards preserving biodiversity.
The following sections provided a more detailed view of the survey results for all three sub-indicators.
6.2 Sub-indicator: knowledge
More than three quarters of Germans are familiar with the term ‘biodiversity’ – but many don’t know what it means.
Only a small proportion of the population (22 per-cent) has never heard of biodiversity. Then there are the 36 percent who have heard of it but don’t know what it means. A further 42 percent say that not only have they heard of it, but they also know what it means. Knowledge of why biodiversity is important depends very much on the level of formal educa-tion: 54 percent of those with a good level of formal education but just 29 percent of those with a lower level claim to appreciate its importance. Of note is that the proportion of those who claim to know what biodiversity means has dropped by 6 percent in the highly educated group compared with 2013, while increasing in the group with mid-level educational attainment (2013: 39 percent; 2015: 48 percent). The age of the respondents also plays a role: knowledge of why biodiversity is important increases with age – but only up to the 50 to 65 age group (52 percent).18 Of those over 65, only 36 percent say they know what biodiversity means. Income is likewise relevant, because people with a high net household income (3,500 euros and more) state with above-average frequency that they have heard of the term and have an idea of how important it is (high net household income: 48 percent; population average: 42 percent).
There don’t appear to be any significant changes compared with 2013 (see Figure 33): The proportion of those claiming to know what the term means has hardly increased. As in the previous study, 36 percent have heard of it but don’t know what it means. Only marginally more people than two years ago say they have never heard of the term ‘biodiversity’.
Tabee 23: Development over time of the ‘Awareness of biodiversity’ indicator
Data in percent 2009 2011 2013 2015
Sub-indicator knowledge 42 41 40 41
Sub-indicator attitudes 54 51 54 53
Sub-indicator willingness to act 50 46 50 59
Overall indicator 22 23 25 24

73
2015 Nature Awareness > Biodiversity
Upmarket milieus show an above-average inclina-tion to know both the term and what it means. This is particularly true of the Liberal Intellectuals (64 percent), the Social-ecologicals (58 percent), the Established Conservatives (53 percent) and the Movers & Shakers (51 percent). The Traditionals (29 percent) and the Escapists (31 percent) are the least likely to know what the term means. Fortunate-ly, awareness of the terms has increased substantially
in the Precarious lifeworld compared with 2013 (2013: 24 percent, 2015: 36 percent).
Those familiar with the term of biodiversity interpret it mainly as the diversity of animal and plant species.
Regardless of gender, age, education and income, approximately nine in ten respondents among those
Figure 33: Knowledge of the term ‘biodiversity’ over time
2526
20
4244
4042
Are you familiar with the term ‘biodiversity’?
Data in percent
22
30 29
36 36
2009 2011 2013 2015
„I’ve never heard of it .“
„ I’ve heard of it, but I don’t know what the term means.“
„ I’ve heard of it, and I know what the term means.“
Figure 34: Understanding of the term ‘biodiversity’
Can you please tell me what the term ‘biodiversity’ means for you?(Open question, multiple responses possible)
0 10 20 30 40 50 60 70 80 90 100
Data in percent
Diversity of species (animals and/or plants)
Diversity of eco-systems, habitats
Diversity of genes, genetic information, genetic make-up
Miscellaneous
Don’t know/No comment
88
54
30
4
0
Base: 868 cases (only those respondents who have at least heard of ‘biological diversity’ before)
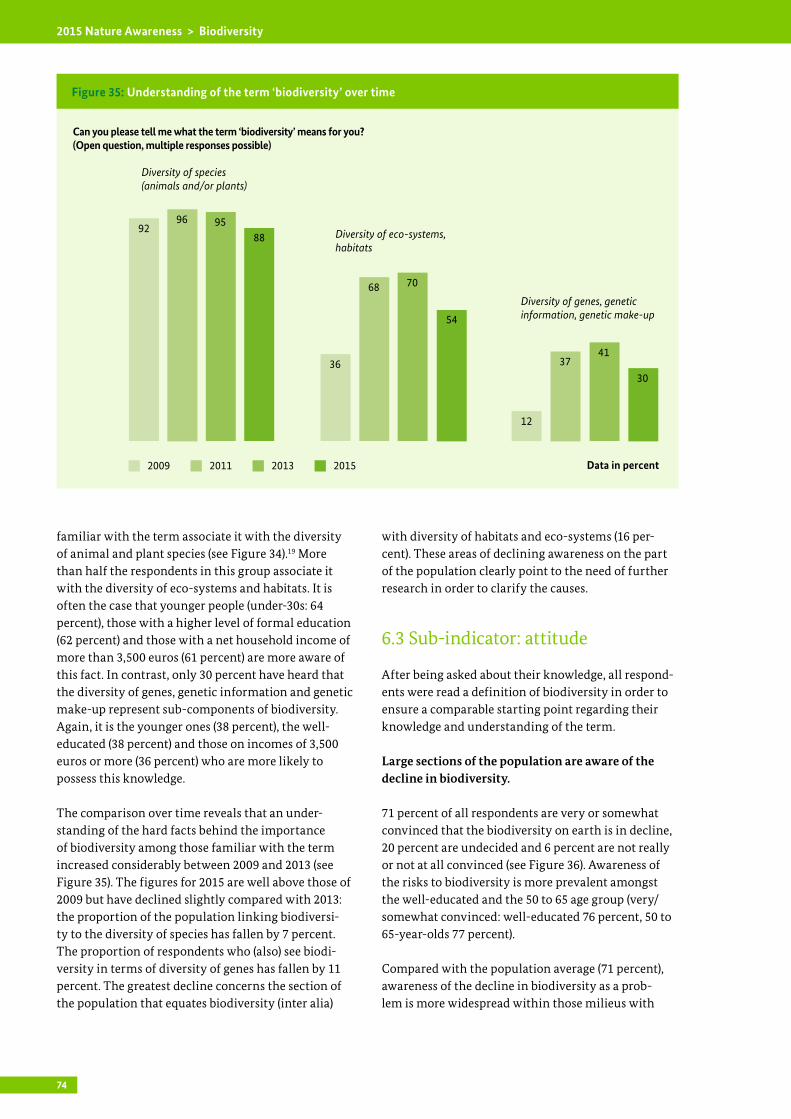
74
2015 Nature Awareness > Biodiversity
familiar with the term associate it with the diversity of animal and plant species (see Figure 34).19 More than half the respondents in this group associate it with the diversity of eco-systems and habitats. It is often the case that younger people (under-30s: 64 percent), those with a higher level of formal education (62 percent) and those with a net household income of more than 3,500 euros (61 percent) are more aware of this fact. In contrast, only 30 percent have heard that the diversity of genes, genetic information and genetic make-up represent sub-components of biodiversity. Again, it is the younger ones (38 percent), the well- educated (38 percent) and those on incomes of 3,500 euros or more (36 percent) who are more likely to possess this knowledge.
The comparison over time reveals that an under-standing of the hard facts behind the importance of biodiversity among those familiar with the term increased considerably between 2009 and 2013 (see Figure 35). The figures for 2015 are well above those of 2009 but have declined slightly compared with 2013: the proportion of the population linking biodiversi-ty to the diversity of species has fallen by 7 percent. The proportion of respondents who (also) see biodi-versity in terms of diversity of genes has fallen by 11 percent. The greatest decline concerns the section of the population that equates biodiversity (inter alia)
with diversity of habitats and eco-systems (16 per-cent). These areas of declining awareness on the part of the population clearly point to the need of further research in order to clarify the causes.
6.3 Sub-indicator: attitude
After being asked about their knowledge, all respond-ents were read a definition of biodiversity in order to ensure a comparable starting point regarding their knowledge and understanding of the term.
Large sections of the population are aware of the decline in biodiversity.
71 percent of all respondents are very or somewhat convinced that the biodiversity on earth is in decline, 20 percent are undecided and 6 percent are not really or not at all convinced (see Figure 36). Awareness of the risks to biodiversity is more prevalent amongst the well-educated and the 50 to 65 age group (very/somewhat convinced: well-educated 76 percent, 50 to 65-year-olds 77 percent).
Compared with the population average (71 percent), awareness of the decline in biodiversity as a prob-lem is more widespread within those milieus with
Figure 35: Understanding of the term ‘biodiversity’ over time
70
Can you please tell me what the term ‘biodiversity’ means for you?(Open question, multiple responses possible)
Data in percent
3037
12
41
9692 95
88
36
68
54
2009 2011 2013 2015
Diversity of species (animals and/or plants)
Diversity of eco-systems, habitats
Diversity of genes, genetic information, genetic make-up

75
2015 Nature Awareness > Biodiversity
an affinity for education and nature, namely the Social-ecologicals (very/somewhat convinced: 89 per-cent) and Liberal Intellectuals (84 percent). One can safely assume that due to their general interest in the subject, they are familiar with documentation or arti-cles highlighting the urgency of declining biodiversi-ty. The young Movers & Shakers milieu also manifests above-average awareness (78 percent) for the risks to biodiversity. The Escapists, who are less preoccupied with education and information, are the least aware of the decline in biodiversity (58 percent).
Three quarters of Germans regard the preservation of biodiversity as a social priority
Asked whether the preservation of biodiversity counts among the overriding social tasks, 34 percent respond unconditionally with “yes” and a further 40 percent with “somewhat” (see Figure 37). This represents a slight increase over 2013 (2013: both agreement levels: 71 percent). Agreement is stronger still amongst people of 50 and over (50 to 65-year-olds: 78 percent, over 65s: 77 percent) and amongst the well-educated (79 percent).
The social milieus also differ on this question: the greatest awareness is shown by the Socio-ecological and Liberal Intellectual milieus with an 85 percent rate of agreement, respectively. More than half the Social-ecologicals even express their uncondition-al agreement with the statement that preserving biodiversity represents a social priority (the figure for the Liberal Intellectuals is 44 percent). The Estab-lished Conservatives also manifest an above-average inclination to rate the preservation of biodiversity as a key matter of social concern (both agreement levels: 82 percent). This may be due to the fact that ‘preserv-ing’ plays such a major role in their concept for life. By comparison, the Escapist and Precarious milieus with less affinity to nature show the lowest appreciation of the problem. Despite this, more than 60 percent of re-spondents in each milieu acknowledge completely or at least somewhat that the preservation of biodiversity is a social priority (both agreement levels: Escapists: 62 percent, Precarious: 61 percent).
It is particularly with regard to the coming generations and people’s own quality of life that they consider the preservation of biodiversity an important social goal.
A key argument for the preservation of biodiversity is generational justice: the overwhelming majority of 93 percent believe that biodiversity ought to be preserved as a legacy for future generations (both agreement lev-els, see Figure 38). Over the past 2 years this attitude has become further consolidated: in 2013 the figure for unconditional agreement was 58 percent while the current figure lies at 65 percent. Furthermore, the potential impact of a decline in biodiversity on one’s own life plays a focal role: 85 percent of respondents
Figure 36: Perceived decline of biodiversity
How convinced are you that biodiversity on Earth is in decline? Are you…
Very convinced
Somewhat convinced
Undecided
Not very convinced
Not at all convinced
Don’t know/no answer
26
45
20
5 3
Datain percent
1
Figure 37: Perceived social importance of con-serving biodiversity
To what extent do you personally consider the preservation of biodiversity to be a social priority?Would you say …
34
40
21
3 1 1 Yes, it’s a social priority
Something of a priority
In some ways yes, in others no
Not really
No, it’s not a social priority
Don’t know/no answer
Datain percent

76
2015 Nature Awareness > Biodiversity
agree strongly or somewhat that biodiversity in na-ture promotes their well-being and quality of life and 69 percent say that their own life would be personally compromised if biodiversity were to dwindle. Those with a good level of formal education are more likely to claim the latter than those with a lower level of for-mal education (both agreement levels, a lower level of formal education: 64 percent, high formal education: 74 percent). Compared to 2013, the view that biodiver-sity in nature promotes one’s own well-being has be-come more common (both agreement levels, 2013: 75 percent, 2015: 85 percent; highest level of agreement, 2013: 28 percent, 2015: 44 percent). It is also the case that more people in 2015 than in 2013 believe the loss of biodiversity would compromise their own life (both agreement levels, 2013: 58 percent, 2015: 69 percent; highest level of agreement, 2013: 16 percent, 2015: 24 percent).20
However, is the preservation of biodiversity ‘merely’ up to society at large? As many as 56 percent do not take this view, but acknowledge instead that they bear personal responsibility in this regard. Women (both
agreement levels: 58 percent), the 50 to 65-year-olds (61 percent) and those with a higher level of formal education (mid-level: 61 percent, higher level: 60 per-cent) show a higher than average inclination to think this way. In a comparison over time, one can discern a slight increase in this sense of responsibility (both agreement levels, 2013: 51 percent, 2015: 56 percent; highest level of agreement, 2013: 12 percent, 2015: 17 percent).
Approximately three quarters of respondents, respec-tively, agree with support for poorer states in protect-ing their biodiversity and with the call to reduce the amount of land devoted to settlement, industry and infrastructure in the interests of preserving biodi-versity. In both cases, the highest rates of agreement are to be found among those with a good level of formal education (both agreement levels: 80 percent and 78 percent). By comparison with the predecessor survey, the proportion of those in favour of limiting the infrastructure to preserve biodiversity has risen significantly: in 2013, 18 percent claimed “strong” and 45 percent “some” agreement with the measure,
Figure 38: Personal importance of biodiversity
I’m now going to read out to you several statements concerning biodiversity. Please tell me in each case to what extent you agree with the statement.
0 10 20 30 40 50 60 70 80 90 100
Data in percentI disagree stronglyI agree somewhat
I agree strongly I disagree somewhat
I don’t know/No comment
2865 6
4144 11 3
4524 4621
4726 5319
45148 27 6
38197 29 7
3917 32 10 2
Biodiversity is a legacy that should be preserved forour children and future generations
Biodiversity in nature promotes my well-beingand my quality of live
Poorer states should receive financial support from richerstates in order to protect their biodiversity
It will affect me personally if biodiversity disappears
I feel personally responsible forthe preservation of biodiversity
Research expenditure on biodiversity should be reduced
Many reports on the decline of biodiversityin the world are exaggerated
The amount of land used for settlement, trade & industryand transportation routes should be reduced
to preserve biodiversity
4433 5 315
1
1

77
2015 Nature Awareness > Biodiversity
whereas in the current survey 26 percent expressed their unconditional agreement and a further 47 per-cent some agreement. The situation is similar when it comes to agreement with support for poorer countries in protecting their local biodiversity (both agreement levels: 2013: 71 percent, 2015: 77 percent; highest level of agreement: 2013: 23 percent, 2015: 33 percent).
The importance for the Germans of preserving bio-diversity also becomes clear when one considers that just 22 percent believe that expenditure on research into biodiversity should be reduced (only 8 percent are “strongly” in agreement here). And relatively few people agree “strongly” (7 percent) or “somewhat” (19
percent) with the statement that reports of a declin-ing biodiversity are exaggerated. The overwhelming majority is convinced of the contrary. Nonethe less, it is important to take these points of view serious-ly – especially since they are expressed slightly more frequently than in the predecessor survey (when 17 percent of respondents strongly or somewhat agreed that expenditure on research into biodiversity should be reduced, whereas the figure for 2015 is 22 percent) and are most common among the younger generation of people under 30 (in 2015 31 percent of the under-30s strongly or somewhat believed that expenditure on research into biodiversity should be reduced).
Figure 39: Willingness to play an active part in conserving biodiversity
0 10 20 30 40 50 60 70 80 90 100
Data in percentNot at all willingSomewhat willing
Very willing Not very willing
Don’t know/No answer
4040 13 5 2
… to steer clear of designated protected areaswhen out in nature?
… to give precedence to regional fruit & vegwhen doing your shopping?
… to sign a petition for the conservation of biodiversity?
… to draw the attention of your friends andacquaintances to biodiversity conservation?
… to use a practical guide when doing your shopping, for example one advising about endangered fish species?
… to keep informed about current developmentsin the field of biodiversity ?
… to write a letter to the government or authorityresponsible in order to point out the need
for biodiversity conservation?
… to donate money to the care and maintenanceof a protected area?
… to donate money to a nature conservation associationdedicated to the conservation of biodiversity?
… to participate actively in a nature conservation association in order to help conserve biodiversity?
… to switch your brand of cosmetics or health & beautyitems when you discover that their manufacturer
jeopardises biodiversity?
23258 7
4632 16 5
4127 21 29
50 51826
2917 31 21 2
4314 26 16
3647 12 4
2864 6 2
3313 34 19
2640 18 214
1
1
1
1
1
1
I’m now going to read out to you several ways in which you personally can help to protect biodiversity.How willing are you personally …

78
2015 Nature Awareness > Biodiversity
On examining the milieu findings, the Socio-ecologi-cal and Liberal Intellectual milieus are again revealed as showing the strongest appreciation of biodiversity by comparison with the other milieus. This is espe-cially apparent from their attitude in terms of feeling personally responsible for protecting biodiversity, a standpoint which is far more common in these mi-lieus than in the population at large (both agreement levels, Social-ecologicals: 72 percent, Liberal Intellec-tuals: 66 percent, population average: 56 percent). The Established Conservatives also have an above-average sense of responsibility for the preservation of biodi-versity (both agreement levels: 68 percent). The latter is a conclusive finding, since this milieu sees itself as a responsible social elite, the credo behind their actions being one of achievement coupled with a belief in personal responsibility. Less than half the members of the Precarious, Escapist and Traditional milieus consider themselves responsible (both agreement levels, Precarious: 44 percent, Escapists: 44 percent, Traditional: 49 percent).
6.4 Sub-indicator: willingness to act
The majority of Germans say they are willing to actively support the preservation of biodiversity.
A willingness to make a personal contribution towards preserving biodiversity runs through broad sections of the population. This applies above all to modes of behaviour involving relatively little effort: steering clear of protected areas, purchasing regional products, signing a petition to support the preser-vation of biodiversity and switching to eco-friendly cosmetics. Up to 92 percent but at least 80 percent of respondents declare their general willingness to commit to these measures (see Figure 39). An uncon-ditional awareness to do so is more common among women than men and among older people (of 50 and older) than younger people. Educational background plays no real role by comparisons (see Table 24).
A good three quarters of respondents, respectively, would consider pointing out to friends and acqua in-tances the need to protect biodiversity and would seek information on current developments in the field (both agreement levels). There are also clear majorities who would be prepared to use a practical guide when out
shopping, for example to check on endangered fish spe-cies (68 percent). This willingness to seek information and inform others increases in tandem with the level of education and is more evident amongst women than men (see Table 24).
As many as 57 percent are very or somewhat willing to donate money to the care and maintenance of a protected area. A similar number can imagine lending financial support to a nature conservation association (54 percent). There is no indication of gender-specific differences here, but the willingness to donate is stronger among older people (particularly with regard to the care and maintenance of a protected area), and those with a higher level of formal education (particu-larly with regard to supporting a nature conservation association, see Table 24).
The activities presumed to require the most time and effort and hence calling for the greatest self-initiative appeal to under half the respondents: 46 percent, re-spectively, can imagine writing a letter to the govern-ment to point out the need to protect biodiversity, or actively helping out at a nature conservation asso-ciation. Again, it is those with a good level of formal education who manifest the strongest willingness to act in this way (see Table 24).
There has been a significant increase in people’s willingness to point out to their friends the need to preserve biodiversity and to actively help out at a nature conservation association.
In 2013, two in three Germans stated that they could imagine drawing the attention of their friends and acquaintances to the preservation of biodiversity. In the study presented here, far more people stated to do so, namely 78 percent. The earnestness of this declara-tion of willingness is apparent from the highest level of agreement: 32 percent currently say they are “very willing” to pass on relevant information to their circle of friends. Just 2 years ago, the figure was merely 21 percent. There has also been a significant increase in willingness to engage with a nature conservation association. In 2013 this was a conceivable option for 36 percent, with 9 percent selecting the highest level of agreement (“very willing”). In 2015, 46 percent can envisage becoming actively involved in a nature con-servation association, with 13 percent selecting the highest response level to express their willingness.
Table 24: Willingness to play an active part in conserving biodiversity (by gender, age and education)
How willing are you personally …
Answer category: Very willing
Data in percent
Mean Gender Age (years) Education
Ø M W Up to 29
30 to 49
50 to 65
over 65 Low Mid High
… to steer clear of designated protected areas when out in nature? 64 59 68 55 60 70 67 63 64 64
… to give precedence to regional fruit & veg when doing your shopping? 58 51 64 47 54 64 64 55 62 57
… to sign a petition for the conserva-tion of biodiversity? 47 44 51 44 44 53 48 46 47 48
… to switch your brand of cosmetics or health & beauty items when you discover that their manufacturer jeopardises biodiversity?
40 37 44 38 36 45 46 39 39 45
… to draw the attention of your friends and acquaintances to biodi-versity conservation?
32 29 35 30 29 35 35 29 34 35
… to use a practical guide when doing your shopping, for example one advis-ing about endangered fish species?
27 26 28 24 26 28 30 23 27 33
… to keep informed about current developments in the field of biodi-versity?
26 24 29 26 24 30 26 21 26 33
… to write a letter to the government or authority responsible in order to point out the need for biodiversity conservation?
17 18 16 14 17 18 19 13 17 22
… to donate money to the care and maintenance of a protected area? 14 14 14 9 13 17 18 13 13 16
… to donate money to a nature con-servation association dedicated to the conservation of biodiversity?
14 14 14 11 13 16 16 11 14 19
… to participate actively in a nature conservation association in order to help conserve biodiversity?
13 13 12 14 11 14 13 12 12 15
Heavily over-represented Over-represented Under-represented Heavily under-represented

79
2015 Nature Awareness > Biodiversity
shopping, for example to check on endangered fish spe-cies (68 percent). This willingness to seek information and inform others increases in tandem with the level of education and is more evident amongst women than men (see Table 24).
As many as 57 percent are very or somewhat willing to donate money to the care and maintenance of a protected area. A similar number can imagine lending financial support to a nature conservation association (54 percent). There is no indication of gender-specific differences here, but the willingness to donate is stronger among older people (particularly with regard to the care and maintenance of a protected area), and those with a higher level of formal education (particu-larly with regard to supporting a nature conservation association, see Table 24).
The activities presumed to require the most time and effort and hence calling for the greatest self-initiative appeal to under half the respondents: 46 percent, re-spectively, can imagine writing a letter to the govern-ment to point out the need to protect biodiversity, or actively helping out at a nature conservation asso-ciation. Again, it is those with a good level of formal education who manifest the strongest willingness to act in this way (see Table 24).
There has been a significant increase in people’s willingness to point out to their friends the need to preserve biodiversity and to actively help out at a nature conservation association.
In 2013, two in three Germans stated that they could imagine drawing the attention of their friends and acquaintances to the preservation of biodiversity. In the study presented here, far more people stated to do so, namely 78 percent. The earnestness of this declara-tion of willingness is apparent from the highest level of agreement: 32 percent currently say they are “very willing” to pass on relevant information to their circle of friends. Just 2 years ago, the figure was merely 21 percent. There has also been a significant increase in willingness to engage with a nature conservation association. In 2013 this was a conceivable option for 36 percent, with 9 percent selecting the highest level of agreement (“very willing”). In 2015, 46 percent can envisage becoming actively involved in a nature con-servation association, with 13 percent selecting the highest response level to express their willingness.
Table 24: Willingness to play an active part in conserving biodiversity (by gender, age and education)
How willing are you personally …
Answer category: Very willing
Data in percent
Mean Gender Age (years) Education
Ø M W Up to 29
30 to 49
50 to 65
over 65 Low Mid High
… to steer clear of designated protected areas when out in nature? 64 59 68 55 60 70 67 63 64 64
… to give precedence to regional fruit & veg when doing your shopping? 58 51 64 47 54 64 64 55 62 57
… to sign a petition for the conserva-tion of biodiversity? 47 44 51 44 44 53 48 46 47 48
… to switch your brand of cosmetics or health & beauty items when you discover that their manufacturer jeopardises biodiversity?
40 37 44 38 36 45 46 39 39 45
… to draw the attention of your friends and acquaintances to biodi-versity conservation?
32 29 35 30 29 35 35 29 34 35
… to use a practical guide when doing your shopping, for example one advis-ing about endangered fish species?
27 26 28 24 26 28 30 23 27 33
… to keep informed about current developments in the field of biodi-versity?
26 24 29 26 24 30 26 21 26 33
… to write a letter to the government or authority responsible in order to point out the need for biodiversity conservation?
17 18 16 14 17 18 19 13 17 22
… to donate money to the care and maintenance of a protected area? 14 14 14 9 13 17 18 13 13 16
… to donate money to a nature con-servation association dedicated to the conservation of biodiversity?
14 14 14 11 13 16 16 11 14 19
… to participate actively in a nature conservation association in order to help conserve biodiversity?
13 13 12 14 11 14 13 12 12 15
Heavily over-represented Over-represented Under-represented Heavily under-represented
The young trendsetting milieu manifests the most widespread willingness to seek information on biodiversity and spread the word among their circle of friends.
A differentiation by milieu allows the findings to be summed up as follows: a willingness to gear one’s own actions to the aim of safeguarding biodiversity is disproportionately strong among members of the Social-ecological milieu and all the up-market milieus – with the exception of the High Achievers. For exam-ple, 57 percent of the Liberal Intellectuals, 54 percent of the Social-ecologicals, 48 percent of the Established
Conservatives and 45 percent of the Movers & Shak-ers are unreservedly willing to avoid cosmetics and health & beauty items whose manufacture represents a risk to biodiversity. The population average here is 40 percent and the figure for the High Achievers is 39 percent. Furthermore, it is striking to note that a readiness to seek information about biodiversity and how to preserve it (highest level of agreement, mean: 26 percent) and to spread the word among one’s circle of friends is nowhere greater than in the young trend-setting milieu – the Movers & Shakers (highest level of agreement, Movers & Shakers: 42 percent).

80
2015 Nature Awareness > References
References
Ackermann W. et al. 2013: Indikatoren zur biologischen Vielfalt. Entwicklung und Bilanzierung. Bundesamt für Naturschutz. Bonn: 229. (Naturschutz und Biolo-gische Vielfalt 132).
Anheier, H.K. und Hurrelmann, K. 2014: Die Haupt-städter – Berlin 25 Jahre nach dem Mauerfall: Die Hertie Berlin Studie 2014, Berlin.
Balder H. 2009: Kleingärten – ein Instrument zur Verbesserung des Stadtklimas. In: Der Fachberater: Verbandszeitschrift des Bundesverbandes Deutscher Gartenfreunde: 59. Issue 1, pp. 6-7.
Banse J. und Mathey J. 2013: Wahrnehmung, Akzeptanz und Nutzung von Stadtbrachen. Ergeb-nisse einer Befragung in ausgewählten Stadtgebieten von Dresden. In: Breuste J. et al. (eds.): Stadtland-schaft - Vielfältige Natur und ungleiche Entwicklung, Darmstadt (CONTUREC; 5), pp. 39-56.
Baumgarten H. et al. 2013: ParkSport – besser draußen! Neue Wege für Sport und Bewegung im öffentlichen Raum. In: igs internationale gartenschau hamburg (eds.). [www.dosb.de/fileadmin/fm-dosb/arbeitsfelder/wiss-ges/Bilder/ParkSportBroschuere.pdf, 06.01.2016].
Becker, S. et al. 2014: Die Analyse lokaler energiepoli-tischer Konflikte und das Entstehen neuer Organi-sationsformen. Theoretische Zugänge und aktuelle Herausforderungen. EnerLOG Working Paper No. 1., Erkner, Freiburg und Potsdam.
BfN (Bundesamt für Naturschutz) 2008: Menschen bewegen - Grünflächen entwickeln. Ein Handlungs-konzept für das Management von Bewegungsräumen in der Stadt. Bonn. [www.bfn.de/fileadmin/MDB/doc-uments/themen/sportundtourismus/Menschen_be-wegen.pdf, 06.01.2016].
BfN (Bundesamt für Naturschutz) 2014: Grünland-Re-port: Alles im grünen Bereich? Bonn. [www.bfn.de/fileadmin/MDB/documents/presse/2014/PK_Gruen-landpapier_30.06.2014_final_layout_barrierefrei.pdf, 06.01.2016].
BfN (Bundesamt für Naturschutz) 2015: Ar-tenschutz-Report 2015: Tiere und Pflanzen in Deutschland. Bonn. [www.bfn.de/fileadmin/BfN/presse/2015/Dokumente/Artenschutzreport_ Download.pdf, 06.01.2016].
BfN und BBSR (Bundesamt für Naturschutz und Bun-desinstitut für Bau-, Stadt-und Raumforschung) 2011: Kulturlandschaften gestalten! Zum zukünftigen Um-gang mit Transformationsprozessen in der Raum- und Landschaftsplanung. Bonn. [www.bfn.de/fileadmin/MDB/documents/themen/landschaftsplanung/ kulturlandschaften_gestalten.pdf, 06.01.2016].
BHU (Bund Heimat und Umwelt in Deutschland) 2014: Energielandschaft gestalten. Leitlinien und Beispiele für Bürgerpartizipation. Bonn.
BMU 2007 (Federal Ministry for the Environment, Nature Conservation and Nuclear Safety): National Strategy on Biological Diversity. Berlin. [http://bio-logischevielfalt.bfn.de/fileadmin/NBS/documents/Veroeffentlichungen/BMU_Natio_Strategie_en_bf.pdf, 09.09.2016].
BMUB (Bundesministerium für Umwelt, Naturschutz, Bau und Reaktorsicherheit) 2014: Indikatorenbericht 2014 zur Nationalen Strategie zur biologischen Viel-falt. Berlin [www.bmub.bund.de/fileadmin/ Daten_BMU/Pools/Broschueren/indikatorenbericht_biologische_vielfalt_2014_bf.pdf, 06.01.2016].
BMUB (Bundesministerium für Umwelt, Naturschutz, Bau und Reaktorsicherheit) 2015 a: Naturschutz- Offensive 2020. Für biologische Vielfalt! Berlin [www.bmub.bund.de/fileadmin/Daten_BMU/Pools/Broschueren/naturschutz-offensive_2020_ broschuere_bf.pdf, 06.01.2016].
BMUB (Bundesministerium für Umwelt, Naturschutz, Bau und Reaktorsicherheit) 2015 b: Grün in der Stadt − Für eine lebenswerte Zukunft. Grünbuch Stadtgrün. Berlin. [www.bmub.bund.de/fileadmin/Daten_BMU/Pools/Broschueren/gruenbuch_stadtgruen_ broschuere_bf.pdf, 06.01.2016.]
United Nations 1992: Convention on Biological Diver-sity. Rio de Janeiro. [https://www.cbd.int/doc/legal/cbd-en.pdf, 09.09.2016].
Claßen T. et al. 2011: Stadtgrün und Gesundheit – ein Beitrag zur Debatte um soziale und räumliche Un-gleichheit. In: UMID 2 (2011), pp. 100-104.
Demuth B. et al. 2014: Energielandschaften – Kultur-landschaften der Zukunft? BfN-Skripten 364. Bonn.
81
2015 Nature Awareness > References
Devine-Wright, P. 2011: Renewable Energy and the Public. From NIMBY to Participation. London and Washington.
Dietrich K. 2014: Urbane Gärten für Mensch und Natur. Eine Übersicht und Bibliographie. Bonn: BfN-Skripten: 386.
DUH (Deutsche Umwelthilfe e. V.) 2013: Wildnis in Städten. Ergebnisse des Projekts: Wild Cities 2012/2013. Berlin. [www.duh.de/uploads/media/Ergebnispapier_WildCities_DE_03.pdf, 06.01.2016].
DUH (Deutsche Umwelthilfe e. V.) 2014: Städte und wilde Natur in neuer Beziehung – ein Plädoyer für eine wildere Stadtnatur. [www.duh.de/uploads/me-dia/PlPercentC3PercentA4doyer-fPercentC3Percent BCr-wildere-Stadtnatur_01.pdf, 06.01.2016].
Eid M. et al. 2013: Statistik und Forschungsmethoden. Basel.
Forsa 2015: Kulturelle Wünsche der Verbraucher bei der Auswahl ihrer Lebensmittel. Ergebnisse einer internationalen Umfrage. Erstellt im Auftrag der Ver-braucherzentrale Bundesverband e. V. (vzbv), Berlin.
GfK Compact 2014: Gen-Food: Gefahr oder Segen? [www.gfk-verein.org/compact/fokusthemen/gen-food-gefahr-segen, 06.01.2016].
Gruehn D. 2012: Wirkungen von Grünflächen auf den Wert von Immobilien. In: Forum Bauland Manage-ment. Grünflächenmanagement - Dokumentation zum Werkstattgespräch, pp. 5-10.
Hansen R. et al. 2012: Brachflächen im Spannungsfeld zwischen Naturschutz und (baulicher) Wiedernut-zung. Bonn: BfN-Skripten 324.
Janssen J. und Laatz W. 2010: Statistische Datenana-lyse mit SPSS. Eine anwendungsorientierte Ein-führung in das Basissystem und das Modul Exakte Tests. Berlin.
Klimeczek H.-J. 2014: Umweltgerechtigkeit im Land Berlin – Zur methodischen Entwicklung des zwei-stufigen Berliner Umweltgerechtigkeitsmonitorings. UMID 2 (2014), pp. 16-22.
Kowarik I. 2012: Stadtnatur in der Dynamik der Großstadt Berlin. In: Denkanstöße. Stadtlandschaft – die Kulturlandschaft von Morgen? Stiftung Natur und Umwelt Rheinland-Pfalz, Issue 9, pp. 18-24.
Kuckartz U. und Rädiker S. 2009: Abschlussbericht „Bedeutsamkeit umweltpolitischer Ziele und Auf-gaben“ („Gesellschaftsindikator“). Indikatoren für die nationale Strategie zur biologischen Vielfalt. Forschungs- und Entwicklungsvorhaben im Auftrag des BfN / Bundesamt für Naturschutz (FKZ 3507 81 070). Marburg: 85.
Lafortezza R.C. et al. 2008. Visual preference and ecological assessments for designed alternative brownfield rehabilitations. Journal of Environmental Management 89 (3), pp. 257-269.
Löw M. 2010: Soziologie der Städte. Frankfurt am Main.
Mathey J. und Rink D. 2010: Urban Wastelands – a Chance for Biodiversity in Cities? Ecological Aspects, Social Perceptions and Acceptance of Wilderness by Residents. In: Müller N. et al. (eds.): Urban Biodiversity and Design, Oxford, pp. 406-424.
Mathey J. et al. 2011: Noch wärmer, noch trockener? Stadtnatur und Freiraumstrukturen im Klimawandel. Bonn: Bundesamt für Naturschutz.
Rink D. und Arndt T. (2011): Urbane Wälder: Ökolo-gische Stadterneuerung durch Anlage urbaner Wald-flächen auf innerstädtischen Flächen im Nutzungs-wandel. Ein Beitrag zur Stadtentwicklung in Leipzig, UFZ-Bericht 3/2011, Helmholtz-Zentrum für Umwelt-forschung GmbH - UFZ, Leipzig.
Rittel K. et al. 2014: Grün, natürlich, gesund. Die Po-tenziale multifunktionaler städtischer Räume. Bonn: BfN-Skripten: 371.
Schäfers B. 2010: Stadtsoziologie. Stadtentwicklung und Theorien – Grundlagen und Praxisfelder. Wies-baden.
Schäffer I. und Erdmann K.-H. 2013: Grüne Infra-struktur in der Bundesstadt Bonn – Standortfaktor und Potential für das Standortmarketing. In: Stan-dort. Zeitschrift für Angewandte Geographie 37, pp. 211–216.
Schießl P. et al. 2015: Aufbereitung und Transport von Wirtschaftsdüngern. Texte 80 (2015). Umweltbundes-amt. Dessau-Roßlau.
Sedlmeier P. 2013: Forschungsmethoden und Statistik für Psychologen und Sozialwissenschaftler. München.

82
2015 Nature Awareness > References
Senatsverwaltung für Stadtentwicklung und Umwelt 2011: Stadtentwicklungsplan Klima. Urbane Lebensqualität im Klimawandel sichern, Berlin. [www.stadtentwicklung.berlin.de/planen/stad-tentwicklungsplanung/download/klima/step_ klima_broschuere.pdf, 06.01.2016].
Senatsverwaltung für Stadtentwicklung und Um-welt 2012: Strategie Stadtlandschaft Berlin: natürlich urban produktiv. Berlin. [http://digital.zlb.de/viewer/content?action=application&sourcepath=15453107/Startegie_Stadtlandschaft_Berlin.pdf&format=pdf, 06.01.2016].
Sieverts T. 1997: Zwischenstadt. Zwischen Ort und Welt, Raum und Zeit, Stadt und Land. Braunschweig.
Stadt Bocholt 2014: Aktiv mit Perspektive. Unsere Klimaprojekte. [www.bocholt.de/fileadmin/DAM/Fachbereich_35/Dokumente/Bocholt_Broschuere_mit_Foerderlogo_140924.pdf, 06.01.2016].
Stadt Karlsruhe Umwelt- und Arbeitsschutz 2013: An-passung an den Klimawandel. Bestandsaufnahme und Strategie für die Stadt Karlsruhe. Karlsruhe. [www.karlsruhe.de/b3/natur_und_umwelt/klimaschutz/klimafolgen/HF_sections/content/ZZl33ZxibxWJEn/ZZl342BXSjoXv9/Bericht_Klimawandel_web.pdf, 06.01.2016].
Sudfeldt C. et al. 2013: Vögel in Deutschland – 2013.
Tessin W. 2004: Freiraum und Verhalten. Soziolo-gische Aspekte der Nutzung und Planung städtischer Freiräume. Eine Einführung, Wiesbaden.
Vicenzotti V. 2011: Der „Zwischenstadt“-Diskurs. Eine Analyse zwischen Wildnis, Kulturlandschaft und Stadt. Bielefeld.
Vicenzotti V. und Trepl L. 2009: City as Wilderness. The Wilderness Metaphor from Wilhelm Heinrich Riehl to Contemporary Urban Designers. Landscape Research 34(4), pp. 379–396.
Von Borries F. 2011: Zehn Thesen für die Stadt von morgen. In: H. Welzer und K. Wiegandt (Hrsg.): Pers-pektiven einer nachhaltigen Entwicklung. Wie sieht die Welt im Jahr 2050 aus? Frankfurt am Main, pp. 40-63.
WBGU (Wissenschaftlicher Beirat der Bundesregi-erung Globale Umweltveränderungen) 2011: Welt im Wandel. Gesellschaftsvertrag für eine große Transfor-mation. Hauptgutachten. Berlin.
Westrich, P. et al. (2011): Rote Liste und Gesamtarten-liste der Bienen (Hymenoptera, Apidae) Deutschlands. In: Binot-Hafke, M. et al. (eds.) (2011): Rote Liste ge fährdeter Tiere, Pflanzen und Pilze Deutschlands. Band 3: Wirbellose Tiere (Teil 1). Münster (Land-wirtschaftsverlag). Naturschutz und Biologische Vielfalt 70 (3): 373-416.
Winkler N. et al. 2006: Entwicklung einer deutschen Kurzskala zur zweidimensionalen Messung von sozialer Erwünschtheit. Diskussionspapier. Deutsches Institut für Wirtschaftsforschung. Berlin.

83
2015 Nature Awareness > List of figures
List of figures
Figure Page
1 The Sinus-Milieus in Germany 2015 19
2 Associations with agrarian landscapes, indications sorted by category 25
3 Evaluation of the development of agrarian landscape features 27
4 Importance of protecting certain agrarian landscape features 29
5 Importance of protecting certain agrarian landscape features by milieu 31
6 Impact on nature and biodiversity of agricultural production methods and practices 32
7 Agreement with statements on agricultural policies 34
8 Attitude towards nature conservation in agriculture 36
9 Attitude towards nature conservation measures of agricultural policy 36
10 Attitude towards nature conservation measures of agricultural policy by milieu 37
11 Attitudes towards the deployment of genetic engineering in agriculture 38
12 Attitudes towards the deployment of genetic engineering in agriculture by milieu 40
13 Agreement with the banning of genetically modified organisms in farming 41
14 Associations with urban nature, responses arranged by categories 43
15 Relevance of individual urban nature features 45
16 Attitude towards urban wasteland 47
17 Importance of accessibility to urban nature 48
18 Satisfaction with the range of urban nature attractions 49
19 Frequency with which urban nature attractions are utilised 49
20 Social importance of urban nature 51
21 Personal importance of urban nature 53
22 Personal importance of urban nature by milieu affiliation 55
23 Approval of the energy transition over time 56
24 Approval of the energy transition by milieu 57

84
2015 Nature Awareness > List of figures
25 Acceptance of landscape-altering measures to produce renewable energy 58
26 Personal importance of nature 62
27 Perception of the risks to nature 64
28 Attitudes towards nature conservation 66
29 Nature conservation amidst conflicting political and economic priorities 67
30 Approval of the principles behind the sustainable use of nature 68
31 Sub-indicators and overall indicator ‘Awareness of biodiversity’ 70
32 Overall indicator ‘Awareness of biodiversity’ by Sinus-Milieus 71
33 Knowledge of the term ‘biodiversity’ over time 73
34 Understanding of the term ‘biodiversity’ 73
35 Understanding of the term ‘biodiversity’ over time 74
36 Perceived decline of biodiversity 75
37 Perceived social importance of conserving biodiversity 75
38 Personal importance of biodiversity 76
39 Willingness to play an active part in conserving biodiversity 77

85
2015 Nature Awareness > List of tables
List of tables
Table Seite
1 Evaluation of the development of agrarian landscape features (by gender, age and education) 28
2 Importance of protection certain agrarian landscape features (by age, gender and education) 30
3 Evaluation of impact of agricultural cropping systems and procedures on nature and biodiversity (by gender, age and education) 33
4 Evaluation of impact of agricultural cropping systems and procedures on nature and biodiversity (by city/town size) 33
5 Agreement with statements on agricultural policy (by gender, age and education) 35
6 Attitudes towards the deployment of genetic engineering in agriculture (by gender and age) 39
7 Attitudes towards the deployment of genetic engineering in agriculture (by city/town size) 39
8 Agreement with a ban on genetically modified organisms in farming (by sociodemographic characteristics) 41
9 Relevance of individual urban nature features (by gender, age and education) 46
10 Relevance of individual urban nature features (by city/town size) 47
11 Importance of having access to urban nature (by gender, age and education) 48
12 Frequency of using urban nature attractions (by age, gender, education and income) 50
13 Social importance of urban nature (by gender, age and education) 52
14 Social importance of urban nature (by city/town size) 52
15 Personal importance of urban nature (by gender, age and education) 54
16 Acceptance of landscape-altering measures to produce renewable energy (by gender, age and education) 59
17 Personal importance of nature (by gender, age and education) 63
18 Personal importance of nature with the changing seasons 64
19 Perception of the risks to nature (by gender, age and education) 65
20 Attitudes towards nature conservation (by gender, age and education) 66

86
2015 Nature Awareness > List of tables
21 Nature conservation amidst conflicting political and economic priorities (by gender, age and education) 67
22 Agreement with the principles of a sustainable use of nature (by gender, age and education) 68
23 Development over time of the ‘Awareness of biodiversity’ indicator 72
24 Willingness to play an active part in conserving biodiversity (by gender, age and education) 79

87
2015 Nature Awareness > Basic count
Basic count
Chapter 2: Agrarian landscapes
A2.1 I’d like you to tell me your spontaneous thoughts on the land in Germany that is used for agriculture, i.e. our agrarian landscapes. Please name as many terms and ideas as you can think of. (Open question, multiple responses possible) (Figure 2)
Data in percent Data in percent
Farmland 62 Politics/economic situation 10
Crop plants 51 Protected resource 9
Agro-businesses/plants/machines 34 Water bodies 8
Farm animals 32 Alternative energies 8
Fertiliser/pest control 22 Wild animals 6
Other vegetation and green spaces 20 Genetic engineering/genetic manipulation 6
Foodstuffs 15 Beautiful landscapes/regions 3
Negative comments 12 Quality of life 3
Farmland – sub-categories
Data in percent Data in percent
Fields/arable land 32 Loss of areas under cultivation/decline/building density 4
Meadows/grazing land 26 Variations/crop rotation 3
Monocultures/one-sided cultivation 14 Uncultivated land/derelict land/strips of wild land 3
Large areas under cultivation/as far as the eye can see 4 Network of hiking trails 1
Crop plants – sub-categories
Data in percent Data in percent
Cereals/grainfields 29 Fruit/fruit growing 14
Maize/cornfields 20 Potatoes/potato fields 7
Vegetable/salad vegetable (growing) 17 Wine/wine growing 4
Rapeseed/rapeseed fields 15
Agro-businesses/plants/machines – sub-categories
Data in percent Data in percent
Farmers/farms 15 Irrigation systems/irrigation 1
Utility vehicles/agricultural machines 8 Large-scale landed property /big farms/ estates 1
(Ecological) agriculture 8 Greenhouses 1
Stables/barns/silos 2 Direct marketing/farm shops 1
Dairy/dairy farming 2 Abattoirs 1
Forestry/hunting 1
Farm animals – sub-categories
Data in percent
Cattle breeding/farm animals 13 Horses 3
Large livestock (cows/cattle) 11 Bees 2
Mid-sized livestock (pigs/sheep/goats) 5 Species-appropriate animal husbandry/ free-range husbandry 1
Small livestock (rabbits/poultry) 4 Fish/fish farming/fishery 1
Factory farming/caging 4
Naturbewusstsein 2015 > Basic count

88
2015 Nature Awareness > Basic count
Fertiliser/pest control – sub-categories
Data in percent Data in percent
Pesticides/spray chemicals/pest control 9 Over-fertilisation 4
Fertiliser/fertilisation (in gen.) 6 Artificial fertiliser 3
Slurry/(liquid) manure 6
Other vegetation and green spaces – sub-categories
Data in percent Data in percent
Woodland/forests 7 Plants 4
Trees 5 Hedgerows/shrubs/bushes 3
Flower fields/wild flowers 4 Greenery 1
Foodstuffs – sub-categories
Data in percent Data in percent
Foodstuffs/nutrition 6 Meat 1
Milk/milk products 4 Regional foods 1
Healthy foods/organic quality 3 Bread/pastries/flour 1
Eggs 1 Fresh/high-quality products 1
Negative comments– sub-categories
Data in percent Data in percent
Destruction/disfigurement of nature 6 Over-exploitation of land 1
Risk to/pollution of groundwater 1 Consumption/making money 1
Lack of ecological cultivation 1 Food scandals/antibiotics/BSE 1
Smell/stench 1 Dirt/muck/soiled roads 1
Decline in species 1
Politics/economic situation – sub-categories
Data in percent Data in percent
Subsidies (agricultural policy) 4 Risks/harvest failures 1
Land consolidation/land reform 2 Efficiency/progress 1
Heavy labour/long work hours 1 Economics/economic landscape 1
Protected resource – sub-categories
Data in percent Data in percent
Nature conservation 5 Nature 2
Animal protection 2 Biotopes 1
Water bodies – sub-categories
Data in percent Data in percent
Streams/rivers 5 Water/water bodies 1
Sea/lakes/ponds/pools 4

89
2015 Nature Awareness > Basic count
Alternative energies – sub-categories
Data in percent Data in percent
Biogas plants/biofuel 4 Solar energy plants 1
Wind energy plants/wind farms 3 Energy systems/energy recovery (in gen.) 1
Wild animals – sub-categories
Data in percent Data in percent
Wild animals/native animals 3 Insects/butterflies 1
Birds 2 Deer/stags 1
Beautiful landscapes/regions – sub-categories
Data in percent Data in percent
Beauty/beautiful landscapes/regions 1 Rural regions/small places/villages 1
Cultural landscape/natural heritage/tradition 1
Quality of life – sub-categories
Data in percent Data in percent
Holidays/leisure/recreation 2 Health/well-being 1
A2.2 How do you rate the development of the following agricultural land features over the past 10 years? Please tell me in each case whether you think the numbers have increased, remained stable, or decreased. (Figure 3, Table 1)
Data in percent Decreased Remained stable Increased Don’t know/
no answer
Bees 66 22 8 4
Butterflies 55 32 8 5
Wild plants and herbs 47 36 11 6
Green/flower verges, i.e. unmanaged areas between fields or between fields and path/roads 45 40 11 4
Frogs and toads 44 38 11 7
Streams and ponds 43 44 9 4
Grassland such as meadows and grazing land 41 46 10 3
Street plantings 41 45 11 3
Birds 40 43 12 5
Trees, hedgerows and bushes 36 49 14 1

90
2015 Nature Awareness > Basic count
A2.3 How important do you think it is that the following agricultural land features be protected? Do you find this very important, somewhat important, somewhat unimportant or not at all important? (Figure 4, Figure 5, Table 2)
Data in percent Very important
Somewhat important
Somewhat unimportant
Not at all important
Don’t know/no answer
Bees 71 21 6 2 0
Birds 65 26 7 1 1
Butterflies 60 32 7 1 0
Grassland such as meadows and grazing land 56 29 10 2 3
Trees, hedgerows and bushes 56 34 8 1 1
Streams and ponds 55 34 8 1 2
Wild plants and herbs 49 35 11 3 2
Street plantings 46 39 13 2 0
Frogs and toads 45 34 15 4 2
Green/flower verges, i.e. unmanaged areas between fields or between fields and path/roads
44 38 14 2 2
A2.4 I’m now going to list different procedures and measures used in farming. I’m interested to hear how you think each of them impacts on nature and biodiversity. Do you think the respective procedures and measures cause a lot of damage, slight damage, minor damage or no damage at all to nature and biodiversity? (Figure 6, Table 3, Table 4)
Data in percent A lot of damage
Slight damage
Minor damage
No damage at all
Don’t know/no answer
Chemical pest and weed control 66 25 7 2 0
Cultivation of genetically modified plants 45 31 15 4 5
Artificial fertiliser 35 39 19 5 2
Repeated growing of the same crop on the same land 30 36 20 10 4
Large-scale monocultures 27 34 22 12 5
The conversion of meadows and grazing land into arable land 25 37 22 12 4
Fertilisation with manure and slurry 13 22 25 37 3

91
2015 Nature Awareness > Basic count
A2.5 Please evaluate the importance of the following statements for you personally. Do you find the respective state-ments very important, somewhat important, somewhat unimportant or not at all important? (Figure 7, Table 5)
Data in percent Very important
Somewhat important
Somewhat unimportant
Not at all important
Don’t know/no answer
Animal husbandry takes into account the well-being of the animals 65 28 6 1 0
Agricultural decisions take into account the impact of subsequent actions on nature 64 28 6 1 1
Foodstuffs are grown, processed and con-sumed within one region where possible 47 38 12 2 1
Agricultural activities also take into account the preservation of the cultural landscape 47 43 7 0 3
Organic farming is being expanded 46 38 12 2 2
Agricultural production takes its cue from what the consumers want 35 51 11 2 1
All land suitable for agriculture is used exclu-sively for growing food as far as possible 30 43 19 5 3
Areas used for agriculture should also be suit-able for recreation and leisure purposes 29 43 22 5 1
A2.6 To what extent do you agree with the following statements? Do you agree with each statement strongly or somewhat, or do you disagree somewhat or strongly? (Figure 8)
Data in percent Agree strongly
Agree somewhat
Disagree somewhat
Disagree strongly
Don’t know/no answer
More nature conservation in farming would make our food products far more expensive 21 44 26 4 5
Artificial fertiliser and chemical pesticides are necessary in order to be able to feed the population
9 31 37 18 5
A2.7 Please evaluate the following statements on genetic engineering in agriculture. Do you agree with each state-ment strongly, somewhat, or do you disagree somewhat or strongly? (Figure 11, Figure 12, Table 6, Table 7)
Data in percent Agree strongly
Agree somewhat
Disagree somewhat
Disagree strongly
Don’t know/no answer
I’m against many of our farm animals being given genetically modified fodder 53 26 15 5 1
I don’t think man has the right to genetically modify plants and animals 48 27 16 7 2
I think it’s a good thing if food prices drop thanks to genetic engineering procedures in farming
10 20 35 32 3
I think that genetic engineering in agriculture is an important building block in the struggle against world hunger
9 24 33 29 5
I don’t have a problem with eating genetically modified foods 7 18 28 45 2

92
2015 Nature Awareness > Basic count
A2.8 Please tell me whether you think the following measure is very important, somewhat important, somewhat unimportant or not at all important. (Figure 13, Table 8)
Data in percent Very important
Somewhat important
Somewhat unimportant
Not at all important
Don’t know/no answer
The use of genetically modified organisms in farming will be banned 44 32 15 5 4
A2.9 If the state wants agriculture to do more for nature conservation, it can either provide financial support to promote expedient behaviour (i.e. subsidies) or pass stricter laws and regulations. Please remember here that financial funding comes out of taxpayers’ money, whereas stricter laws and regulations can increase food prices due to farmers passing on the additional cost to the consumer. To what extent do you approve of financial support or stricter laws and regulations to get farmers to do more for nature conservation: strong-ly, somewhat, or do you disagree somewhat or strongly? (Figure 9, Figure 10)
Data in percent I agree strongly
I agree somewhat
I disagree somewhat
I disagree strongly
Don’t know/no answer
Stricter laws and regulations 45 38 12 3 2
Financial support 30 44 19 5 2

93
2015 Nature Awareness > Basic count
Chapter 3: Urban nature
A3.1 What is urban nature as far as you’re concerned? Please tell me as many terms and ideas as you can think of. (Open question, multiple responses possible) (Figure 14)
Data in percent Data in percent
1. Parks and public green spaces 82 8. Greenery on and around buildings 15
2. Vegetation (in general) 65 9. Leisure facilities 7
3. Water bodies 43 10. Agriculture 7
4. Gardens 37 11. Protected resource 6
5. Places for sport and exercise 23 12. Cityscape 3
6. Animals 22 13. Weather/seasons 3
7. Quality of life and recreation 17 14. Negative comments 1
Parks and public green spaces – sub-categories
Data in percent Data in percent
Green areas/public parks 63 Animal parks/zoo 6
Meadows 22 Cemeteries 6
Woodland 19 Green oases 1
Street plantings (trees) 11 (Flower) beds in public areas 1
Street plantings (others) 8
Vegetation (in general) – sub-categories
Data in percent Data in percent
Trees 43 (Flower) beds 5
Flowers 23 Greenery in general 4
Plants/greening 19 Dandelions/poppies/foliage 1
Bushes/shrubs/hedgerows 15 Nature 1
Water bodies – sub-categories
Data in percent Data in percent
Ponds/lakes/pools 25 Wells/water fountains 4
Water meadows/rivers/streams 20 Beaches/dams 1
Water 6
Gardens – sub-categories
Data in percent Data in percent
Gardens 22 Garden plots 6
Front gardens 11 Allotments 3
Places for sport and exercise – sub-categories
Data in percent Data in percent
Playgrounds 8 Outdoor swimming pools 3
Hiking trails/jogging trails 4 Lakes for swimming/bathing beach 1
Footpaths/promenades 4 Going bathing/swimming/water sports 1
Cycle paths 3 Sport 1
Sports grounds 3 Fishing 1

94
2015 Nature Awareness > Basic count
Animals – sub-categories
Data in percent Data in percent
Birds 12 Pigeons 1
Animals 6 Ducks/geese 1
Insects 3 Fish 1
Wild animals 2 Cats 1
Dogs 2 Butterflies 1
Bees 2 Squirrels 1
Quality of life and recreation – sub-categories
Data in percent Data in percent
Recreation/relaxation/quality of life 9 Good/fresh air 4
Benches/seating/rest areas 4 Peace and quiet 1
Greenery on and around buildings – sub-categories
Data in percent Data in percent
Terrace planting 6 Back gardens 3
Greened up roof areas/planted roofs 4 Greened up exterior walls 1
Flow tubs/pots 3 Houses covered in greenery 1
Leisure facilities – sub-categories
Data in percent Data in percent
Popular destinations 4 Picnic 1
Beer gardens/restaurants with outdoor seating 2 Markets 1
BBQ areas 1
Agriculture – sub-categories
Data in percent Data in percent
Fields (in the city zone) 3 Grazing land 1
Fruit growing 1 Fallow fields/meadows 1
Areas used for agriculture 1
Protected resource – sub-categories
Data in percent Data in percent
Nature conservation areas/biotopes 3 Habitat/sanctuaries for animals 2
Clean natural environment/environmental protection 2
Cityscape – sub-categories
Data in percent Data in percent
Few/no cars 1 Miscellaneous (nature-friendly construction methods, little industry) 1
Weather/seasons – sub-categories
Data in percent Data in percent
Sun/sunshine 1 Rain 1

95
2015 Nature Awareness > Basic count
Negative comments – sub-categories
Data in percent Data in percent
Weeds 1 Miscellaneous 1
A3.2 How important do you find the following urban nature features? Do you consider the features very impor-tant, somewhat important, somewhat unimportant or not at all important? (Figure 15, Table 9, Table 10)
Data in percent Very important
Somewhat important
Somewhat unimportant
Not at all important
Don’t know/no answer
Public parks 80 17 3 0 0
Roadside trees and plants 70 24 5 1 0
Water bodies such as rivers, streams, lakes and ponds 60 33 6 1 0
Urban woodlands 58 34 7 1 0
Front gardens 52 37 10 1 0
Allotments 47 37 13 3 0
Cemeteries 36 37 20 7 0
Green roofs and other parts of buildings 33 40 22 5 0
Land that isn’t used and is left abandoned 20 32 30 18 0
Farmland 19 28 36 17 0
A3.3 How important do you think it is for nature to be accessible in all parts of a town/city as far as possible? Do you consider it very important, somewhat important, somewhat unimportant or not at all important? (Figure 17, Table 11)
Data in percent
Very important 61
Somewhat important 33
Somewhat unimportant 5
Not at all important 0
Don’t know/no comment 1
A3.4 How satisfied are you with the nature attractions in your town/city? Are you very satisfied, somewhat satisfied, not very satisfied, not at all satisfied, or don’t you live in a town/city? (Figure 18)
Data in percent
Very satisfied 34
Somewhat satisfied 46
Not very satisfied 11
Not at all satisfied 1
I don’t live in a town/city / I only rarely spend time in a town/city 7
Don’t know/no answer 1

96
2015 Nature Awareness > Basic count
A3.5 How often do you consciously frequent nature attractions in your town/city? Do you do so daily, several times a week, several times a month, several times a year, more rarely/never, or don’t you live in a town/city? (Figure 19, Table 12)
Data in percent
Daily 9
Several times a week 30
Several times a month 34
Several times a year 13
More rarely or never 5
I don’t live in a town/city/I only rarely spend time in a town/city 7
Don’t know/no comment 2
A3.6 Are you in favour of places in your town/city or those in the vicinity where nature is left to evolve sponta-neously, i.e. remains abandoned? Are you completely in favour, somewhat in favour, somewhat against or completely against? (Figure 16)
Data in percent
Completely in favour 25
Somewhat in favour 44
Somewhat against 24
Completely against 6
Don’t know/no comment 1
A3.7 And now for the tasks that urban nature is capable of fulfilling. How important is urban nature for the following aspects? Is it very important, somewhat important, somewhat unimportant or not at all impor-tant? How important is urban nature … (Figure 20, Table 13, Table 14)
Data in percent Very important
Somewhat important
Somewhat unimportant
Not at all important
Don’t know/no answer
… for the well-being of the people who live there 72 23 4 0 1
… as a habitat for animals and plants 68 26 5 1 0
… for the look of the town/city (cityscape) 68 27 4 0 1
… for climate protection and climate change adaptation 62 29 6 1 2
… for the reputation of the town/city 58 35 6 0 1
… for the market value of building plots and buildings 41 42 12 2 3
A3.8 How important to you personally is urban nature with regard to the following aspects? Is it very important, somewhat important, somewhat unimportant or not at all important? How important to you personally is urban nature … (Figure 21, Figure 22, Table 15)
Data in percent Very important
Somewhat important
Somewhat unimportant
Not at all important
Don’t know/no answer
… as space for recreation and relaxation 62 30 7 1 0
… for your quality of life 62 29 6 1 2
… with regard to health 60 31 7 1 1
… as space for sport and exercise 46 34 14 5 1
… for experiencing nature 44 39 15 1 1
… as space for meeting other people 44 37 16 2 1
… for learning and understanding 33 42 20 4 1
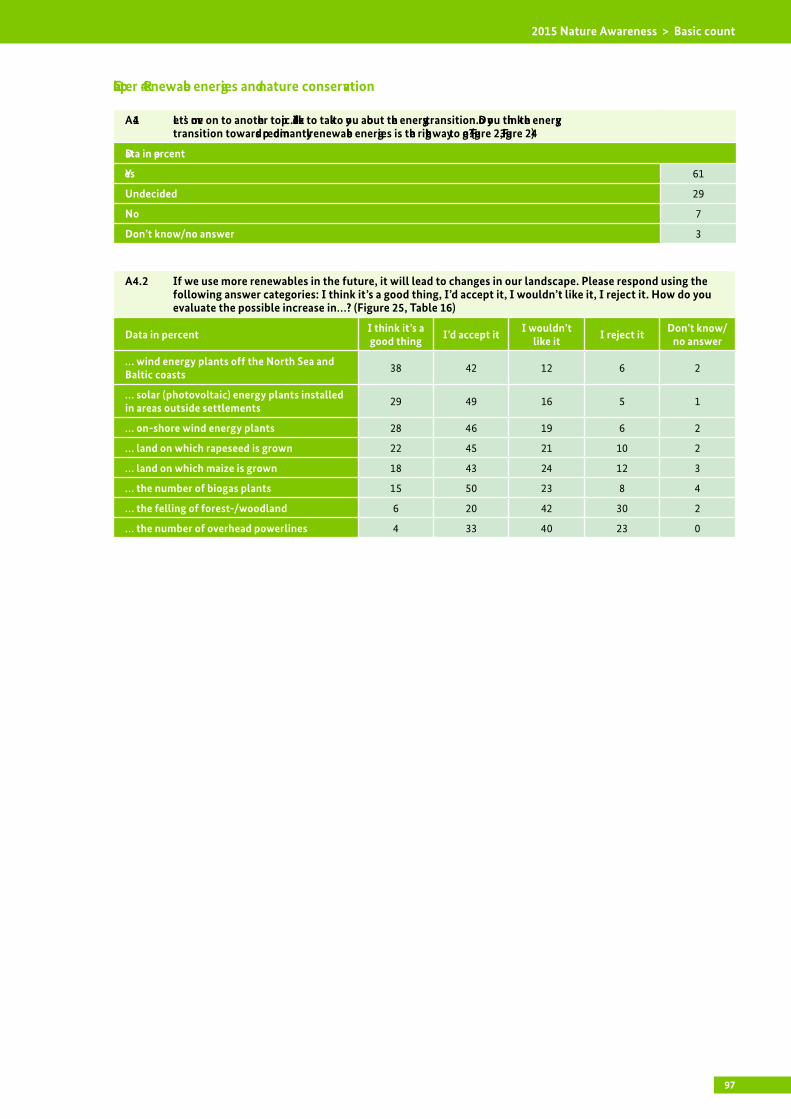
97
2015 Nature Awareness > Basic count
Chapter 4: Renewable energies and nature conservation
A4.1 Let’s move on to another topic. I’d like to talk to you about the energy transition. Do you think the energy transition towards predominantly renewable energies is the right way to go? (Figure 23, Figure 24)
Data in percent
Yes 61
Undecided 29
No 7
Don’t know/no answer 3
A4.2 If we use more renewables in the future, it will lead to changes in our landscape. Please respond using the following answer categories: I think it’s a good thing, I’d accept it, I wouldn’t like it, I reject it. How do you evaluate the possible increase in…? (Figure 25, Table 16)
Data in percent I think it’s a good thing I’d accept it I wouldn’t
like it I reject it Don’t know/no answer
… wind energy plants off the North Sea and Baltic coasts 38 42 12 6 2
… solar (photovoltaic) energy plants installed in areas outside settlements 29 49 16 5 1
… on-shore wind energy plants 28 46 19 6 2
… land on which rapeseed is grown 22 45 21 10 2
… land on which maize is grown 18 43 24 12 3
… the number of biogas plants 15 50 23 8 4
… the felling of forest-/woodland 6 20 42 30 2
… the number of overhead powerlines 4 33 40 23 0

98
2015 Nature Awareness > Basic count
Chapter 5: Man and nature – threat to nature, use of nature, and nature conservation
A5.1 Now let’s turn to nature and the role it plays in your life. I have here several relevant statements. Please tell me for each statement whether you agree with it strongly, somewhat, or do you disagree somewhat or strongly? (Figure 26, Table 17, Table 18)
Data in percent Agree strongly
Agree somewhat
Disagree somewhat
Disagree strongly
Don’t know/no comment
Nature is an integral part of a good life 69 25 5 1 0
What I love about nature is its diversity 62 30 6 1 1
For me, nature means health and recreation 59 33 6 1 1
It is or would be a priority for me to teach my children to appreciate nature 59 33 6 1 1
It makes me happy to be out in nature 55 35 9 1 0
I try to get out into nature as often as possible 49 36 12 2 1
I feel a close bond with nature and the coun-tryside in my region 45 40 13 2 0
The wilder the nature, the better I like it 15 39 35 9 2
I’m not interested in nature 5 11 22 62 0
I don’t feel at home in nature 6 6 13 75 0
Nature is alien to me 3 5 14 78 0
A5.2 Please tell me for each of these statements whether you agree with it strongly, somewhat, or do you disagree somewhat or strongly? (Figure 27, Table 19)
Data in percent Agree strongly
Agree somewhat
Disagree somewhat
Disagree strongly
Don’t know/no comment
It angers me that so many people treat nature so recklessly 47 36 13 3 1
I’m afraid there will hardly be any intact nature left for our children and grandchildren to enjoy 22 43 28 5 2
I feel threatened by the destruction of nature in our country 12 37 38 12 1
People worry too much about the destruction of nature 7 15 37 40 1
A5.3 We’ve put together below several statements on the protection and use of nature. Please tell me for each statement whether you agree with it strongly, somewhat, or do you disagree somewhat or strongly? (Figure 28, Figure 29, Table 20, Table 21)
Data in percent Agree strongly
Agree somewhat
Disagree somewhat
Disagree strongly
Don’t know/no comment
Man is part of nature 63 30 6 1 0
It’s up to man to protect nature 60 33 6 1 0
I feel personally responsible for conserving nature 24 47 21 7 1
I, as an individual, can’t do much in the way of nature conservation 14 30 36 19 1
Nature must not be allowed to stand in the way of economic development 11 26 43 17 3
Man has the right to modify nature for hisown benefit 9 33 39 17 2

99
2015 Nature Awareness > Basic count
A5.4 And what do you think of the following statements? Please tell me for each statement whether you agree with it strongly, somewhat, or do you disagree somewhat or strongly? (Figure 29, Figure 30, Table 21, Table 22)
Data in percent Agree strongly
Agree somewhat
Disagree somewhat
Disagree strongly
Don’t know/no comment
Nature may only be utilised in such a way as to safeguard the diversity of plants and animals along with their habits
62 31 5 1 1
We may only use nature in such a way that affords coming generations the same oppor-tunity
62 31 6 1 0
Nature may only be utilised in such a way as to preserve its unique character and the beauty of the countryside
58 35 6 1 0
We may not exploit nature at the expense of people in poorer countries 56 33 8 1 2
Nature conservation in Germany is a major political task 45 41 11 2 1
In times of economic crisis, nature conserva-tion also has to make do with less money 21 44 24 7 4
Germany is doing enough to protect nature 13 38 36 9 4

100
2015 Nature Awareness > Basic count
Chapter 6: Biodiversity
A6.1 Are you familiar with the term ‘biodiversity’? (Figure 33)
Data in percent
I’ve heard of it, and I know what the term means 42
I’ve heard of it, but I don’t know what the term means 36
I’ve never heard of it 22
A6.2 Can you please tell me what the term ‘biodiversity’ means for you? (Open question, multiple responses possible) (Figure 34, Figure 35)
Data in percent
Diversity of species (animals and/or plants) 88
Diversity of eco-systems, habitats 54
Diversity of genes, genetic information, genetic make-up 30
Miscellaneous 4
Don’t know/no comment 0
Basis: 868 cases; only respondents who claim to know what ‘biodiversity’ means
A6.3 How convinced are you that biodiversity on Earth is in decline? Are you … (Figure 36)
Data in percent
very convinced 26
somewhat convinced 45
undecided 20
not very convinced 5
not at all convinced 1
Don’t know/no comment 3
A6.4 The Federal Republic of Germany has pledged its support for the preservation of biodiversity in a number of international agreements. To what extent do you personally consider the preservation of biodiversity to be a social priority? Would you say, … (Figure 37)
Data in percent
… yes, it’s a social priority 34
… something of a priority 40
… in some ways yes, in others no 21
… not really 3
… no, it’s not a social priority 1
Don’t know/no comment 1

101
2015 Nature Awareness > Basic count
A6.5 I’m now going to read out to you several ways in which you personally can help to protect biodiversity. To what degree are you personally willing … (Figure 39, Table 24)
Data in percent very willing somewhat willing
not very willing
Not at all willing
Don’t know/no answer
… to steer clear of designated protected areas when out in nature? 64 28 6 2 0
… to give precedence to regional fruit & veg when doing your shopping? 58 32 7 2 1
… to sign a petition for the conservation of biodiversity? 47 36 12 4 1
… to switch your brand of cosmetics or health & beauty items when you discover that their manufacturer jeopardises biodiversity?
40 40 13 5 2
… to draw the attention of your friends and acquaintances to biodiversity conservation? 32 46 16 5 1
… to use a practical guide when doing your shopping, for example one advising about endangered fish species?
27 41 21 9 2
… to keep informed about current develop-ments in the field of biodiversity? 26 50 18 5 1
… to write a letter to the Government or author-ity responsible in order to point out the need for biodiversity conservation?
17 29 31 21 2
… to donate money to the care and maintenance of a protected area? 14 43 26 16 1
… to donate money to a nature conservation association dedicated to the conservation of biodiversity?
14 40 26 18 2
… to participate actively in a nature conser-vation association in order to help conserve biodiversity
13 33 34 19 1
A6.6 I’m now going to read out to you several statements concerning biodiversity. Please tell me in each case to what extent you agree with the statement. (Figure 38)
Data in percent Agree strongly
Agree somewhat
Disagree somewhat
Disagree strongly
Don’t know/no comment
Biodiversity is a legacy that should be pre-served for our children and future generations 65 28 6 1 0
Biodiversity in nature promotes my well-be-ing and my quality of life 44 41 11 3 1
Poorer states should receive financial support from richer states in order to protect their biodiversity
33 44 15 5 3
The amount of land used for settlement, trade & industry, and transportation routes should be reduced to preserve biodiversity
26 47 19 3 5
It will affect me personally if biodiversity disappears 24 45 21 6 4
I feel personally responsible for the preserva-tion of biodiversity 17 39 32 10 2
Research expenditure on biodiversity should be reduced 8 14 45 27 6
Many reports on the decline of biodiversity in the world are exaggerated 7 19 38 29 7

102
2015 Nature Awareness > List of footnotes
List of footnotes
Footnote Page
1 A person’s social class describes their status within society. This goes hand in hand with their education, income and occupational prestige, and is tied to the existence of economic, cultural, social and symbolic capital. 19
2 Basic/lower level: no school qualifications or lower secondary school/German polytechnic school certificate (Grade 8 or 9); intermediate/mid-level: secondary school/German polytechnic school certificate (Grade 10), or technical college certificate; advanced/ higher level: general or subject-specific university entrance qualification and/or university degree. 22
3 The percentage values for the categories (for example ‘farmland’) aren’t obtained by adding up the sub-categories (for example ‘fields and arable land’, ‘meadows & grazing land’ and ‘monocultures’ for the ‘farmland’ category), because the free response format allowed the individual respondents to enter multiple answers. Sub-categories are referred to as examples in the text and listed in detail in the basic count. 25
4 The National Strategy on Biodiversity uses the population dynamics of 10 selected bird species as a sub-indicator with which to assess the ‘farmland’ habit (Ackermann et al. 2013). This sub-indicator manifested a significantly negative trend from 2001 to 2011, achieving just 56 percent of the target value in 2011 (cf. BMUB 2014). 27
5 People with mid-level educational attainment have a more definitive perception of the decline in green/flower verges, streams and ponds, and tree-lined avenues. 28
6 Cities were defined at the International Statistical Congress of 1887 as towns with at least 100,000 inhabitants (cf. here www.destatis.de/DE/ZahlenFakten/LaenderRegions/Regionales/ Gemeindeverzeichnis/Administrativ/GrosstaedteEinwohner.html). 28
7 Unlike with ‘education’, consideration of the second agreement level for the sociodemographic characteristics ‘gender’ and ‘age’ doesn’t tone down the findings described. 30
8 Of the people living in a city with over 500,000 inhabitants, 43 percent are under 30, 37 percent are 30- to 49 year olds, and 38 percent are over the age of 65. 30
9 33 percent of Germany’s resident population with a lower level of formal education live in a city with over 500,000 inhabitants. The figure for the highly educated is 47 percent. 30
10 In order to test this, however, one would have to examine more closely the development of Germany’s agricultural sector over the past 65 years as well as people’s experience of agriculture within this period (ascertained both directly and using mass media). 32
11 It is important here not to view ‘own health’ strictly in terms of the respondent’s personal state of health. As known from other studies, it also includes the health of family members, particularly children (cf. Forsa 2015 and GfK Compact 2014). 38

103
2015 Nature Awareness > List of footnotes
12 Regarding Tables 6 and 7, and Figure 11 (each referring to attitudes towards the deployment of genetic engineering in agriculture): there is very little unqualified agreement (agree strongly) for Items 3 to 5. For example, only 7 percent agree strongly with the statement “I don’t have a problem with eating genetically modified foods”. This means that the case number is very small for the purposes of comparison (based on sociodemographic characteristics). To differentiate responses from a very limited number of people by age (four categories), for example, would require extremely cautious interpretation. For this reason, the usual procedure of breaking down the highest agreement level wasn’t applied in this case. 40
13 Cf. also the ‘Grün in der Stadt (‘Urban Green Space’) initiative of the Federal Environment Ministry (BMUB 2015 and www.gruen-in-the-stadt.de) 42
14 As with the open-ended question about associations with agrarian landscapes (Chapter 2), here again the percentage values for the categories (for example ‘parks and public green spaces”) aren’t obtained by adding up the sub-categories (such as ‘wildlife parks’, ‘meadows’), because the free response format allowed the individual respondents to enter multiple answers. Sub-categories are referred to as examples in the text and are listed in detail in the basic count. 43
15 What is more: the answer category “I don’t live in a town/city/I only rarely spend time in a town/city” doesn’t reflect the actual ratio of urban to rural population, as respondents living in the country but spending a lot of time in the town/city (for instance due to work) didn’t select this answer category. 48
16 The inhabitants of the smallest municipalities (resident population: below 5,000) also claim to a disproportionately low degree to be “very satisfied” (23 percent). However, the proportion stating that they don’t live in the town/city or spend very little time in a town/ city is inevitably very high here (53 percent). The actual case number (n = 42) therefore makes any interpretation of the finding unconstructive. 49
17 A detailed explanation of the procedure and a full discussion of the data can be found in the in-depth report on the ‘Awareness of biodiversity’ indicator. 71
18 As shown previously in Chapter 2, one can only surmise here that the age cohort of today’s 50 to 65 year olds acquired their knowledge from actual events (such as the environmental protection movement), which weren’t experienced in the other age groups, or at least not as intensively. 72
19 People with a net household income of less than 1,000 euros only associate ‘biodiversity’ with diversity of species to a disproportionately low degree (78 percent). This finding, however, is to be interpreted with caution, as only 54 people in this group knw what biodiversity means. 74
20 It’s safe to assume that biodiversity in the natural environment nature has a greater impact on human well-being in summer than in winter. It also stands to reason that the higher rates of agreement (for statements relating to well-being or personal detriment) are at least partly due to the fact that the 2013 study was conducted in winter and the 2015 study in summer. Comparable effects can be found for the 2009 study (summer survey) and that conducted in 2011 (winter survey), cf. also Chapter 5. 76
