2015 major accident investigation · pdf file2015 major accident investigation report ......
TRANSCRIPT

2015MAJOR ACCIDENT INVESTIGATION REPORTCovering major accidents in 2013.
National Truck Accident Research Centre


32015 MAJOR ACCIDENT INVESTIGATION REPORT
The National Truck Accident Research Centre (NTARC) first reported findings into truck crash incidents in 2002. This independent research facility was established by National Transport Insurance (NTI), which continues to be the predominant heavy vehicle and equipment insurer in Australia.
This research institution provides the opportunity to undertake specific research that provides insights into the cause of serious heavy vehicle crashes.
It is noted that the transport industry has recently recognised 25 years of change following some horrific road crashes in the 1980’s.
In 2015, we have safer vehicles, safer speeds, safer roads, and generally more responsible and safer behaviour. Nonetheless, heavy vehicle crash incidents continue to occur, albeit with the number of people killed in Australia from crashes involving heavy vehicles over the past decade falling significantly.
The report focus is limited to NTI losses and, given NTI’s market penetration, this is a real indicator of industry performance. The interrogation of the NTI claims database focuses upon major crashes from the 7,500 or so registered claims annually. In real terms it is an examination of the relational databases that are used to manage new heavy vehicle claims every hour of every day, 7 days a week and 52 weeks a year.
From the earliest of studies, NTARC has reviewed all supporting information describing crash incidents. The compilation of information gathered by the insurer in such cases is extensive. We will report on such criteria as, vehicle configuration, freight carried, driver age and experience, the duration and characteristic of the journey in question. To ensure consistency for the sake of comparison, this report will again focus on losses with a severity of $50,000 and greater.
FOREWORD
“In 2015, we have safer vehicles, safer speeds, safer roads, and generally more responsible and safer behaviour. Nonetheless, heavy vehicle crash incidents continue to occur…”

2015 MAJOR ACCIDENT INVESTIGATION REPORT4
Page
2.0 Introduction and Overview of Findings 05
3.0 Summary of Findings 07
4.0 Crash Scene Information: GPS Mapping 08
5.0 Accident Cause: Investigation Finding 09
6.1 Accident Specifics: Month & Season 11
6.2 Accident Specifics: Day of Week 13
6.3 Accident Specifics: Time of Day 14
6.4 Accident Specifics: Accident Location; 15 State / Freight Task
6.5 Accident Specifics: Incident Scene on the Road Network 16
6.6 Accident Specifics: Road Category 18
6.7 Accident Specifics: Freight Category 19
6.8 Accident Specifics: Vehicle Configuration 20
6.9 Accident Specifics: Direction of Travel 21
6.10 Accident Specifics: Distance from Point of Departure 22
6.11 Accident Specifics: Driver’s Age 23
6.12 Accident Specifics: Driver’s Average Age 24
6.13 Accident Specifics: Fatigue Location 25
6.14 Accident Specifics: Fatigue Time of Day 26
6.15 Accident Specifics: Fatigue Day of Loss 27
6.16 Accident Specifics: Inappropriate Speed Day of Week 28
6.17 Accident Specifics: Inappropriate Speed Month of Year 29
6.18 Accident Specifics: Losses by Fire 30
6.19 Accident Specifics: Rigid Trucks 31
7.0 About the Author 33
Editorial Advisor & Reference Information 34
CONTENTS

52015 MAJOR ACCIDENT INVESTIGATION REPORT
2.0 INTRODUCTION AND OVERVIEW OF FINDINGS
During 2013 there were 549 serious losses that satisfied the criteria of a major crash incident in this study. Such losses over $50,000 do not include off road machinery, farming and earthmoving equipment, that under normal circumstances would not operate on the road network or be registered. These serious crash incidents accounted for $71.7m in claims payments, some of which were fully recovered from the other parties where they held liability.
Total Fleet Growth vs Major Crashes
Since the previous report the number of large losses recorded had increased by 16% whilst the NTI portfolio of units insured has remained relatively static. The incidence rate deteriorated to 3.1 major accidents per ‘000 units insured. However, it is worth noting that since the first of this series of studies was conducted in 2002, the nominal $50,000 threshold for major losses has not been increased to today’s equivalent present value. Consequently, there is a sound basis for argument that the current rate of 3.1 crashes /
‘000 units would improve if we were to inflate the nominal $50,000 threshold of 2002 by the gazetted annual inflation rate to a 2013 level. This would then realise a revised crash rate per ‘000 units to 2.4 and lead to an improvement of 35% on the incidence of serious crashes since 2002. This would reflect one third less major crash incidents across this decade, and demonstrates a strong result for on road safety where progress is usually only reported on the basis in the rise and fall of road fatalities and serious injuries.
0
50K
100K
150K
200K
NTI Fleet201320112009200720052003
100
200
300
400
500
600
Major Crashes
Incident Cost
MA
JOR
TR
UC
K C
RA
SH
ES
TOTA
L FL
EE
T N
O’S

2015 MAJOR ACCIDENT INVESTIGATION REPORT6
To emphasize the impact of this latest result, it should be noted that across the period of the research studies, the Australian road freight task has maintained significant growth from 150 to 209 billion tonne kilometres. Since 2002 from a NTI perspective, we can report a 30% growth in the freight task but a 35% decline in the incidence of serious crashes.
Business Size v Large LossesWhen considering the size of transport businesses and the comparable share of large losses our research has found that owner operators and small to medium size businesses are over-represented in such incidents. Fleets (defined as operations with 15 or more powered units) make up 62% of the data and returned only 50.8% of claims.
Fleet
SME
OwnerDrivers
% NTI PORTFOLIO
Fleet
SME
OwnerDrivers
% LARGE LOSSES
Fleet
SME
OwnerDrivers
% NTI PORTFOLIO
Fleet
SME
OwnerDrivers
% LARGE LOSSES
0.0
0.5
1.0
1.5
2.0
2.5
3.0
3.5
4.0
4.5
5.0
Incident rate201320112009200720052003
0
50
100
150
200
250
Billion Tonne Kms
BIL
LIO
N T
ON
NE
KM
S
INC
IDE
NT
RA
TE
Major Crash Incidents (per ‘000) vs Growth in Freight Task

72015 MAJOR ACCIDENT INVESTIGATION REPORT
3.0 SUMMARY OF FINDINGS
This report is the sixth in the current series that began in 2002 with the issue of the Australian Transport Safety Bureau Annual Review.
The report details research undertaken into major truck crash incidents in Australia where National Transport Insurance (NTI) was the insurance underwriter. It concentrates on heavy vehicle accidents in the ‘hire & reward’ freight sector where the commercial vehicle’s payload exceeds five (5) tonnes.
The report examines serious truck crash incidents where the quantum of the loss exceeds $50,000.
• This study has reviewed 549 truck crash incidents reported to NTI during 2013. The aggregate cost of losses in this study was $71.7m which includes own, third party vehicle and property damage.
• When the nominal $50,000 threshold of 2002 is factored up by the gazetted annual domestic inflation rate to 2013, the major crash incidence rate has improved by 35% since 2002.
• Inappropriate speed for the prevailing conditions continued to be the predominant cause with major truck crashes, accounting for 27% of claims registered. 73.6% of speed losses resulted in rollover.
• Fatigue at 12.8% was the worst result since 2007.
• Western Australia was noteworthy with the highest proportion (30%) of major crash incidents attributed to fatigue.
• Early in the week, Monday through to Wednesdays continue to reflect the greater proportion of crash events. October, March & July were the worst months with the Spring & Autumn seasons the marginally worst periods.
• Outward journeys ex home port, contributed to 67% of reported large losses.
• Most incidents occurred between the hours of 1000 and 1600 when the on-road population of commercial vehicles is at its highest.
• Single vehicle accidents (SVA’s) attributed to 71.8% of losses with the balance of 28.2% involving collisions with third party vehicles. In losses with third parties, not involving fatal injury, the NTI insured heavy vehicle was liable in 59.4% of the cases. In collisions involving fatalities however, the truck was not at fault on 84% of occasions.
• The report found that Victoria was the best performing State when comparing major truck crash incidents to that State’s share of the freight task. While the Pacific & Hume Highways in NSW were the worst performing highways, they were closely followed by the West’s, Great Northern. In this report there were fewer major incidents occurring on Queensland’s Bruce Highway.
• As highlighted in the 2013 crash report, the worst performing State was Queensland followed by Western Australia.
• Truck fires continue to account for 10.7% of large loss incidents with electrical failure accounting for 68.5% of cabin / engine compartment fires.
• Mechanical failures remained at a 5% crash incident level. (Tyre failure accounted for 72% of losses attributed to mechanical fault.)

2015 MAJOR ACCIDENT INVESTIGATION REPORT8
4.0 CRASH SCENE INFO: GPS MAPPING
NSW
VIC
SA
TAS
ACT
QLD
NT
8
147
124
2
8
VIC
74
50
WA
WA
110
Not Liable
Inappropiate Speed
FIRE Non Impact
Fatigue
Contrib. Negligence
At Fault Driver Error
RWT
Mechanical
Others
Animal Strike

92015 MAJOR ACCIDENT INVESTIGATION REPORT
0%
5%
10%
15%
20%
25%
30%
35%
2013
2011
2009
2007
FLOOD / High Water
Contibutory Negligence
Not at Fault
At Fault - Driver Error
TheftMechanicalFireFatigueInappropriateSpeed
When closely scrutinizing incidents, where in some cases it has been established that driver’s recollections of events are improbable or sketchy, a degree of surrogacy is used when deciding causal factors. Conclusive findings are established through comprehensive analysis of vehicle tracking, engine management systems, in cab cameras, accident scene investigation, police reports and witness statements.
In this study inappropriate speed remains the major cause of severe accidents for NTI. In such cases, inappropriate speed is that speed that is not safe for the operating conditions.
Whether negotiating a roundabout, cornering or just changing lanes, inappropriate speed accounted for 27% of losses during 2013 whereas in the previous study it was 25.4%.
Fatigue is still an issue. The previous report had noted that since the September 2008 introduction of legislation for Heavy Vehicle Driver Fatigue reform, we had seen considerable improvement in losses accountable to fatigue. This statistic is changing with results deteriorating to 12.8% of total losses.
During 2013/14 NTARC devoted substantial resources into the further investigation of truck fires, due to the
Accident Cause: Investigation Finding
5.0 ACCIDENT CAUSE: INVESTIGATION FINDING

2015 MAJOR ACCIDENT INVESTIGATION REPORT10
findings detailed in the 2013 Major Accident Investigation Report where truck fires represented 12.1% of large losses. In a subsequent independent study, 435 fire incidents were reviewed identifying that in 54.5% of losses the ignition cause was due to electrical failure. In this report there was a marginal improvement with fires accounting for one in ten large losses. Electrical failure accounted for 68.5% of cabin / engine compartment fires in this research.
Mechanical failure, in the NTARC studies, which also includes tyre failure, accounted for less than 5% of losses.
Single vehicle losses (SVA’s) dominate large incidents although, in 28% of losses where another vehicle was involved the study found the NTI insured vehicle to be liable in 59.4% of the cases. In collisions involving fatalities however, the truck was not at fault in 84% of the crashes.
27%of major accidents were due to inappropriate speed

112015 MAJOR ACCIDENT INVESTIGATION REPORT
6.1 ACCIDENT SPECIFICS: MONTH & SEASON
0%
2%
4%
6%
8%
10%
12%
2013
2011
2009
2007
DecemberNovemberOctoberSeptemberAugustJulyJuneMayAprilMarchFebruaryJanuary
With 10% of serious incidents, October 2013 was noted as the worst month in this study. The results March and July were also prominent. Apart from a marginal increase in losses for autumn and spring, there was no particular season identified to any great extent as a concern during this period.
Accident: Month

2015 MAJOR ACCIDENT INVESTIGATION REPORT12
0%
5%
10%
15%
20%
25%
30%
Spring
Winter
Autumn
Summer
2013201120092007
Accident Season
6.1 ACCIDENT SPECIFICS: MONTH & SEASON

132015 MAJOR ACCIDENT INVESTIGATION REPORT
6.2 ACCIDENT SPECIFICS: DAY OF WEEK
0%
5%
10%
15%
20%
25%
2013
2011
2009
2007
SundaySaturdayFridayThursdayWednesdayTuesdayMonday
When examining the day of week information, as has been the finding in past reports, Monday to Wednesdays continue to account for the majority of losses with 55.7% of incidents. 35.7% of fatigue associated losses occurred on Monday or Tuesday.
Accident: Day

2015 MAJOR ACCIDENT INVESTIGATION REPORT14
6.3 ACCIDENT SPECIFICS: TIME OF DAY
0%
2%
4%
6%
8%
10%
2013
2011
2009
2007
2005
24:0023:0022:0021:0020:0019:0018:0017:0016:0015:0014:0013:0012:0011:0010:0009:0008:0007:0006:0005:0003:00< 01:00
Information provided from registered claims with regard to the accident time indicated an increase in losses between 1am and 5am. As expected, fatigue is well represented with 25% of major incidents occurring during this time.
Otherwise, investigations consistently find that the middle of the day also experiences higher incident rates. The largest proportion of these losses occurs between the hours of 1000 and 1600 when transport traffic is at its heaviest.
Accident: Time
152015 MAJOR ACCIDENT INVESTIGATION REPORT
6.4 ACCIDENT SPECIFICS: ACCIDENT LOCATION; STATE / FREIGHT TASK
0%
5%
10%
15%
20%
25%
30%
35%
40%
Freight Task Tonnes
2013
2011
2009
2007
ACTNTWATASSAVICNSWQLD
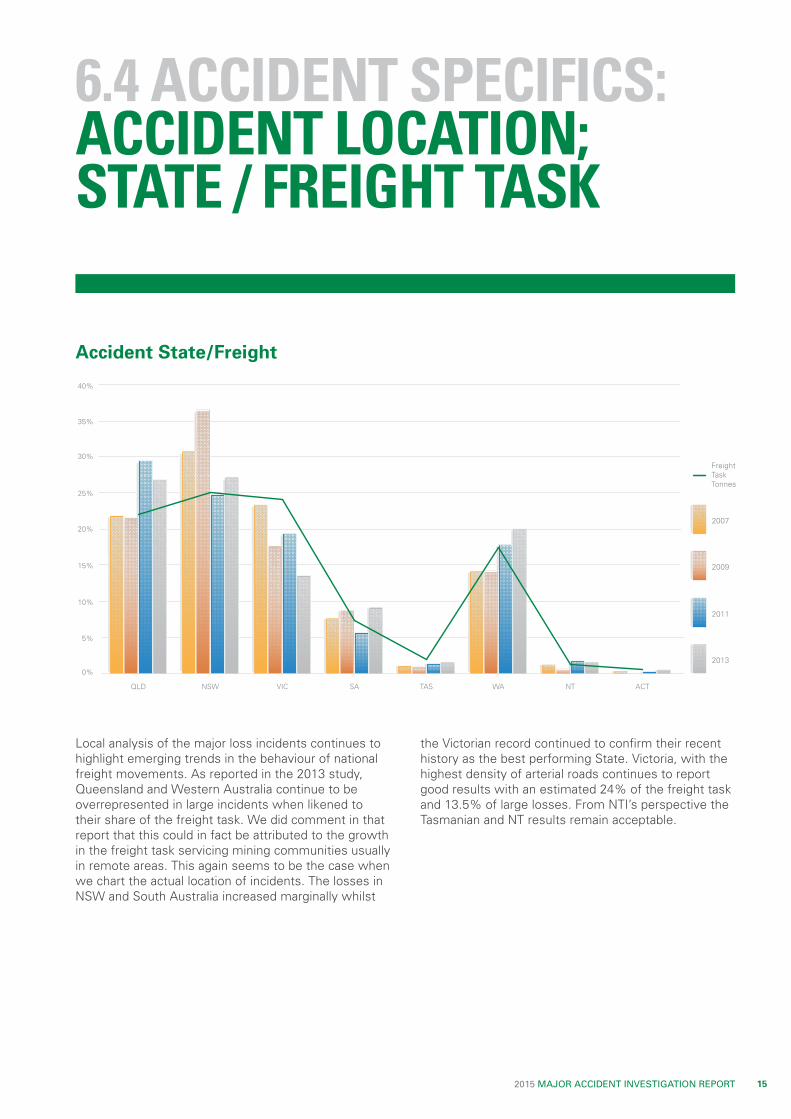
Local analysis of the major loss incidents continues to highlight emerging trends in the behaviour of national freight movements. As reported in the 2013 study, Queensland and Western Australia continue to be overrepresented in large incidents when likened to their share of the freight task. We did comment in that report that this could in fact be attributed to the growth in the freight task servicing mining communities usually in remote areas. This again seems to be the case when we chart the actual location of incidents. The losses in NSW and South Australia increased marginally whilst
the Victorian record continued to confirm their recent history as the best performing State. Victoria, with the highest density of arterial roads continues to report good results with an estimated 24% of the freight task and 13.5% of large losses. From NTI’s perspective the Tasmanian and NT results remain acceptable.
Accident State/Freight

2015 MAJOR ACCIDENT INVESTIGATION REPORT16
6.5 ACCIDENT SPECIFICS: INCIDENT SCENE ON THE ROAD NETWORK
0%
5%
10%
15%
20%
25%
2013
2011
2009
2007
North West Coastal
Great Northern
Warrego Qld
New England
Newell NSW
PrincesEyre Nullabor
Hume VIC
Hume NSW
Bruce Qld
Pacific NSW
HIGHWAY 1
Most heavy vehicle major losses occur on this country’s highways: - regional, remote and coastal. Australia’s major coastal highways combine to make Highway 1 which links the capital cities of each state and other major cities and towns. At a total length of approximately 14,500 km (9,000 mi) it is the longest national highway in the world with the heavily utilised Pacific, Bruce, Nullabor and Great Northern making up major sections of Highway 1.
It is worth noting that there is a national route numbering system for highways which was adopted in Australia 60 years ago. Highway 1 is the major linked highway network with many other highways becoming offshoots of this system. Federal or National government road funding is directed in the main to the coastal highway network.
In this study major accidents in the context of highways are those that tend to be the most heavily used by freight operators. Arguably, the busiest on the network is the Hume.
The Hume Highway is one of Australia’s major inter capital highways, running for 850 kilometres (530 mi) between West Sydney and just North of Melbourne. The Hume upgrade, the construction of a dual carriageway, was completed in the year that we focus upon in this report, 2013. In most recent years, there has been a substantial improvement in the incidence of serious truck crashes. When reviewing this highway both the Victorian and the New South Wales (NSW) sections are examined separately.
Location Road Reference

172015 MAJOR ACCIDENT INVESTIGATION REPORT
The Victorian result, given traffic volumes is excellent and whilst we experienced better results previously on the NSW section of the network, the results have deteriorated. Large losses on the Hume in NSW accounted for 7.7% of all highway losses and over 80% of all losses in 2013 on that highway across both jurisdictions. 60% of those reported NSW incidents involved operator fatigue or non-impact truck fires.
The next highway reviewed was Western Australia’s Great Northern. The Great Northern links the capital city of Perth with its northernmost port, Wyndham. With a length of almost 3,200 kilometres (2,000 mi), it is the longest individual highway in Australia. This highway is part of Highway 1 and travels though remote areas of the State and is the road link to Darwin at Australia’s northern tip. With 7.3% of major accidents the Great Northern accounted for a similar number of losses recorded on the Hume. Obviously traffic and freight movements are substantially less than the Hume by comparison. One of the most concerning issues with the Great Northern apart from single lanes bridges is the fact that much of it is unfenced. This creates the potential issue of livestock being allowed to roam free on the network with obvious consequences. Otherwise most incidents recorded involved operator fatigue or non-impact truck fires.
The Eyre / Nullabor Highway is the road that links Western and South Australia. It constitutes part of Highway 1 and is 1600 kilometres (1000mi) in length.
Whilst past investigations have found relatively few large losses, the most recent 2013 data has highlighted an increase in incidents, now 5.4% of major highway incidents. 75% of these losses was found to be driver fatigue related.
In Queensland poor results on the Bruce Highway continue. The Bruce Highway now a vital link between the capital and northern regional cities, will be subject to a ten-year upgrade which from a road safety perspective is most welcome. Losses also continue increase on the Warrego Highway which is the link from south east Queensland to the mine fields in Central Australia. This highway is also the link to Darwin in Australia’s Northern Territory and is 2850 (1710 mi) kilometres in length.
60%of reported NSW (Hume Highway) incidents involved operator fatigue or non-impact truck fires.

2015 MAJOR ACCIDENT INVESTIGATION REPORT18
6.6 ACCIDENT SPECIFICS: ROAD CATEGORY
Highways in Australia generally cope with the highest proportion of road freight; and as a consequence, this is where the majority of large heavy vehicle losses occur and where driver behaviour is heavily monitored. In some States, road regulators operate an on-road surveillance system known as Safe-T-Cam. The system combines infra-red technology and high-resolution cameras to capture images of passing vehicles and has been used to detect speeding vehicles, unusual driving behavior, driving hours and vehicle registration. In this study 50% of the incidents investigated occurred on highways whether coastal, regional or in remote areas.
When reviewing the Australian road network, the system covers more than 817,000 kilometres with 80% or 657,000 kilometres managed and maintained by local governments. State governments control the remainder which account for 75% of all kilometres travelled.
This study has also noted that there has been a reduction in losses occurring on the regionally categorized ‘C’ grade roads on the network with the 2013 finding of 22.5% of major crash incidents reduced to 15%. Otherwise losses reported on urban/metropolitan roads accounted for 10.6% of incidents which was only a marginal increase. The majority of such losses involved rigid or rigid/dog combinations.
Losses involving off-road vehicle applications remained constant accounting for almost 20% of those investigated. Rollover whilst tipping and vehicle theft were the highest contributors with over 50% of reported losses.
0%
10%
20%
30%
40%
50%
2013
2011
2009
2007
RemoteOff RoadMetro/UrbanRegionalHighways
Road Category

192015 MAJOR ACCIDENT INVESTIGATION REPORT
6.7 ACCIDENT SPECIFICS: FREIGHT CATEGORY
The review of freight category in the context of this report is a general assessment given that current information available through government and industry sources has its limitations. Nonetheless, from the information that is available, our researchers are satisfied that commercial goods vehicles are unladen approximately 20 to 25% whilst in use on road. With 12% of severe losses involving empty vehicles we may well suggest that that the incident of accidents is lessened whilst the vehicle is unladen.
This result whilst an improvement on the 2013 study is consistent with findings prior to that report.
When analysing freight on board information, we compare crash incident rates with that freight’s share of the task. In the case of livestock shipments the result once again indicated that losses were over-represented when compared to the share of all freight
movements. With an estimate of 4% of the task, livestock incidents increased to 7.5% of reported incidents with over 60% of losses occurring in NSW or Queensland. The study also notes that 22% of the livestock associated incidents involved equipment operated by graziers and not by - ‘hire & reward’ transport operators. In every incident involving such ancillary operations, inappropriate speed for the conditions was the cause of accident finding.
Further, it was found that there have been fewer major incidents in operations involving mining & resources, refrigerated goods and grain handling. One in four losses involved general freight consignments, with tippers and earthworks again over-represented in the large loss category.
0%
5%
10%
15%
20%
25%
Freight Task
2013
2011
2009
2007
Mining /Resources
RefrigeratedEmptyGeneralContainersDangerous Goods
Tippers Earthworks
Grain / Fert.Building Materials
Vehicle Transport
Livestock
Freight Category

2015 MAJOR ACCIDENT INVESTIGATION REPORT20
6.8 ACCIDENT SPECIFICS: VEHICLE CONFIGURATION
There is a variation of vehicle configurations and combinations which are considered in this report in the context of major accidents. They continue to be an important point of reference as this obviously influences vehicle control and stability. With the B double share of the freight task now representing 40% of cargo carried and with 24.4% of large losses, the B double continues to be the best performer from a loss/safety perspective.
Semi trailer, articulated combinations, albeit with a reducing share of the task continue to be the poorest performer with over 30% of the losses reviewed in this study. Whilst rigid body vehicles and in some cases with trailing dog trailers take an increasing share, large losses still remain within acceptable limits in the context of this research.
Of note is the changing dynamics of multi-trailer combinations with 21% of major loss incidents against 14.3% of the task.
A larger share of the task will also flow to PBS (Performance Based Standards) vehicles such as A Doubles, B Triples and other multi combinations.
Thus far, PBS vehicles have performed exceptionally well as cited in other NTARC studies for Austroads.
0%
10%
20%
30%
40%
50%
60%
Freight Task Rigid
Freight Task Multi
Freight Task A
Freight Task B
RIGID
ROADTRAIN
SEMI
B DOUBLE
'2013''2011''2009''2007'
Accident Vehicle Configuration

212015 MAJOR ACCIDENT INVESTIGATION REPORT
6.9 ACCIDENT SPECIFICS: DIRECTION OF TRAVEL
The direction of travel analysis is an indicator of driver’s preparation for work, fitness for duty and loading efficiencies managed by the employer. Since these research studies commenced there has been a consistent finding with the majority of serious losses occur on the outbound journey from the home base. With 67.6% of incidents on the outbound leg, inappropriate speed and fatigue are major causal accident factors. 40% of these losses occur on either a Monday or Tuesday.
Further, in the case of reported losses over $50,000 involving another vehicle, not involving fatal injury, the NTI insured heavy vehicle was liable in 59.4% of the cases. In collisions involving fatalities however, the truck was not at fault on 84% of occasions. In 60% of incidents where the third party was fatally injured and responsible for damages, those drivers held no insurance.
0%
10%
20%
30%
40%
50%
60%
70%
80%
Multi Vehicle Accident
Single Vehicle Accident
Inbound
Outbound
2013201120092007'2005
Direction of Travel

2015 MAJOR ACCIDENT INVESTIGATION REPORT22
6.10 ACCIDENT SPECIFICS: DISTANCE FROM POINT OF DEPARTURE
In the majority of cases (61%) major crash incidents occur within 250 kilometres from the point of departure. Obviously these figures are skewed as a proportion of losses researched involve short haul operations. However, irrespective of freight task, this
data includes local, regional, remote and interstate operations with the consistent finding that the incident occurs within the initial 5 hours of any given journey whether it is the outgoing or return leg.
0%
10%
20%
30%
40%
50%
60%
70%
80%
2013
2011
2009
2007
Within 250 k'lmsOver 1000 k'lms751 - 1000 k'lms501 - 750 k'lms251 - 500 k'lms101 - 250 k'lms0- 100 k'lms
Accident Distance From Point Of Departure

232015 MAJOR ACCIDENT INVESTIGATION REPORT
6.11 ACCIDENT SPECIFICS: DRIVER’S AGE
Ageing male truck drivers dominate the road transport industry and as a consequence they are overrepresented in major crash incidents. In this study 70% of drivers were aged over 40 years of age, of which one in three are over 55 years.
In this report, there has been an increase in major incidents involving drivers over 51 years of age.
0%
5%
10%
15%
20%
25%
2013
2011
2009
2007
> 6051 - 6046 - 5041 - 4536 - 4031 - 3526 - 30< 25
Driver’s Age

2015 MAJOR ACCIDENT INVESTIGATION REPORT24
6.12 ACCIDENT SPECIFICS: DRIVER’S AVERAGE AGE
The average age of truck drivers whilst higher than the average worker, is increasing more quickly than in other sectors. Road transport continues to experience difficulties attracting young workers whereas for those more mature with fewer career opportunities, ease of access is an enticement to entry.
In this research the average age of drivers involved in major truck crash incidents increased to 46 years, in the 2013 report the average age was 44 years 9 months. With fewer inductees to the industry this research continues to reflect on this same group as they age.
Ironically, as the average age of drivers examined in this research increases, the level of experience does not. In losses involving drivers aged 46 – 60, 21.4% had less than 10 years’ experience. This would indicate that entries to the ranks of transport drivers are coming later in the working careers of older employees.
0
10
20
30
40
50
20132011200920072005
Driver’s Average Age

252015 MAJOR ACCIDENT INVESTIGATION REPORT
6.13 ACCIDENT SPECIFICS: FATIGUE LOCATION
In this report losses attributed to fatigue have increased. Whilst the rate of fatigue incidents in Queensland and Victoria has seen a substantial improvement, the WA and NSW result has deteriorated. WA, which in the previous study contributed to 16% of national (fatigue) losses, was responsible for 30% of losses. NSW accounted for 27% of fatigue influenced major truck crash incidents.
Overall fatigue was responsible for is 12.8% of all major losses. Of those events, 38.4% of crash incidents involved a freight movement where the route was outbound from the home port. In 70% of accidents attributed to fatigue, drivers were participants in government accredited fatigue management programs that allowed for extended driving hours.
0%
5%
10%
15%
20%
25%
30%
35%
2013
2011
2009
2007
NTTASNSWSAWAVicQld
Fatigue Location

2015 MAJOR ACCIDENT INVESTIGATION REPORT26
6.14 ACCIDENT SPECIFICS: FATIGUE TIME OF DAY
Fatigue Time of Day
Given the regulatory focus that has been placed on driving hour’s compliance and generally fatigue management since the introduction of driver fatigue reform in 2008, fewer drivers operate today between the hours of midnight and dawn. This would account for fewer fatigue related incidents during this time
period. It may well also reflect the investment in heavy vehicle rest areas. The 2013 research also established that vehicles involved in fleet operations were over-represented in fatigue losses and 88% of all fatigue influenced truck crashes occurred on highways.
0%
10%
20%
30%
40%
50%
60%
70%
80%
18:01 - 24:00 hrs
12:01 - 18:00 hrs
06:01 - 12:00 hrs
00 - 0:600 hrs
2013201120092007

272015 MAJOR ACCIDENT INVESTIGATION REPORT
6.15 ACCIDENT SPECIFICS: FATIGUE DAY OF LOSS
From a fatigue perspective, this report found Tuesdays to be by far the worst performing day. Most incidents recorded on this day involved vehicles operating in fleets in highway operations.
0%
5%
10%
15%
20%
25%
2013
2011
2009
2007
SundaySaturdayFridayThursdayWednesdayTuesdayMonday
Fatigue - Day of Loss

2015 MAJOR ACCIDENT INVESTIGATION REPORT28
6.16 ACCIDENT SPECIFICS: INAPPROPRIATE SPEED DAY OF WEEK
Inappropriate speed continues to be the predominant cause of all major truck crash incidents. This is both a training and management issue with Monday consistently being the worst day across all the centre’s studies. Drivers employed by small to medium sized
operations are over-represented in this accident type with 34% of speed related losses. Such losses involve drivers who have held their licence for an average duration of 12.8 years for the class of commercial vehicle involved.
0%
5%
10%
15%
20%
25%
30%
2013
2011
2009
2007
SundaySaturdayFridayThursdayWednesdayTuesdayMonday
Inappropriate Speed - Day of Week

292015 MAJOR ACCIDENT INVESTIGATION REPORT
6.17 ACCIDENT SPECIFICS: INAPPROPRIATE SPEED MONTH OF YEAR
March 2013 with over 11% of losses was the worst performing month regarding speed related claims with the period September through to December also being prominent.
0%
2%
4%
6%
8%
10%
12%
14%
16%
18%
2013
2011
2009
2007
DecemberNovemberOctoberSeptemberAugustJulyJuneMayAprilMarchFebruaryJanuary
Inappropriate Speed - Month of Year

2015 MAJOR ACCIDENT INVESTIGATION REPORT30
6.18 ACCIDENT SPECIFICS: LOSSES BY FIRE
Non-impact truck and trailer fires accounted for 1 in 10 major claim incidents; reflecting a steady proportion of claims across the past three research studies. In over 60% of losses the fire ignited in the cabin / engine bay region with the most common cause being attributed to electrical failure. As reported previously whether this is a case of less integrity of the electrical wiring, trucks operating in extreme conditions or simply poor maintenance, non-impact fires are over-represented in major loss claims.
0%
10%
20%
30%
40%
50%
60%
70%
Fire Loss Nos.
Trailer Freezer Fire
Brake Fire
Truck Wheel Bearing
Trailer Wheel Bearing
Engine / Cabin Fire
2013201120092007
Fire Loss Information

312015 MAJOR ACCIDENT INVESTIGATION REPORT
6.19 ACCIDENT SPECIFICS: RIGID TRUCKS
Rigid trucks (and trailing equipment) continue to grow in prominence in this market with their share of the task now in the vicinity of 25% of freight carried across all sectors. In this class inappropriate speed is responsible for the majority of large losses with most accidents occurring in regional or remote areas. Rolled-over whilst tipping (RWT) is a relatively common cause of equipment damage in this vehicle class.
Driver error, particularly without trailing equipment, accounts for a large proportion of losses. Often this class of vehicle is the driving career commencement point for inexperienced drivers, not necessarily younger drivers. These drivers with 5 years or less experience, account for over 30% of the incidents.
0%
5%
10%
15%
20%
25%
30%
35%
40%
2013
2011
2009
2007
OtherRWTContibutory Negligence
Not at Fault At Fault - Driver Error
TheftMechanicalFatigueInappropriate Speed
Rigid Trucks Accident Finding

2015 MAJOR ACCIDENT INVESTIGATION REPORT32
0%
5%
10%
15%
20%
25%
30%
35%
40%
2013
2011
2009
2007
OtherRWTContibutoryNegligence
Not at Fault At FaultDriver Error
TheftMechanicalFatigueInappropriateSpeed
Rigid / with Trailer Accident Finding
“In this class inappropriate speed is responsible for the majority of large losses…”
6.19 ACCIDENT SPECIFICS: RIGID TRUCKS

332015 MAJOR ACCIDENT INVESTIGATION REPORT
Owen Driscoll AAII MTLR FCILTA
National Manager, Industry Relations for National Transport Insurance, Australia (NTI)
National Director of Research, National Truck Accident Research Centre, Australia (NTARC)
Deputy Chairperson, ATA TruckSafe Safety Accreditation, Australia.
Owen instigated the creation of the NTARC in 2002 with the inaugural study into major truck crash incidents. Subsequently the centre has produced biennial research reports on the topic of major crashes and on several other related investigations. Owen has over 40 years’ experience in the motor and heavy vehicle insurance sector and is a founding member of NTI. He conducts safety and risk management assessments and facilitates accident research and ongoing accreditation system assessments. He specialises in accident investigation, workplace law and logistics management.
Since 2000, he has held the position of Deputy Chairperson, Director and Company Secretary of the Australian Trucking Association’s industry accreditation program, TruckSafe. Owen holds a Masters in Logistic Research awarded in 2010 for the production of the centre’s Major Crash Reports.
The catalogue of client specific NTARC research papers:
20031. ATSB Annual Review 2002
Researching Heavy Vehicle NTI Crash Incidents 1998 – 2002.
20052. Fire Losses Involving Heavy Vehicles 2001 - 2005
In association with ARTSA
20073. Analysis of Serious Australian Truck Accidents
during 2005
4. Investigation into Truck – Train Crashes 1986 - 2006
20085. Investigation into Truck Roll-Over Crashes in the
State of Victoria 2003 – 2007
Under Agreement ARRB – (for VicRoads Melbourne).
20096. Major Accident Investigation Report HV Crashes
2007
a. Approved Course register National Insurance Brokers Association Ref.1854
7. Audit & Research Report HV Accidents Involving Kenworth Manufactured Vehicles 2001 – 2009
8. Audit & Research Report HV Accidents Involving Volvo Manufactured Vehicles 2004 – 2009
20109. Heavy Vehicle Accidents Involving Hand Brake
Failure 2007 – 2010
10. Central Queensland Heavy Vehicle Losses 2007 -2010
Under Agreement QTMR – Rockhampton Q
201111. Major Accident Investigation Report HV Crashes 2009
a. Approved Course register National Insurance Brokers Association Ref.2313
201212. Heavy Vehicle Accidents Involving NSW & Qld.
Livestock Transporters 2007 – 2011
201313. Fire losses involving heavy vehicles 2007 – 2013
201414. Tipping Trailers – Damaged whilst the hoist is
operational 2004 – 2014.
15. Great Northern Highway WA – Unfenced highway – Cattle Strikes 2007 – 2014.
16. Safety benefits of Heavy Performance Vehicles (HPV’s) – Industrial Logistics Institute / Austroads.
7.0 ABOUT THE AUTHOR

2015 MAJOR ACCIDENT INVESTIGATION REPORT34
Editorial Advisor Kim Hassall (Associate Professor)Chairperson - AllRoads Safety Advisory Board (NTARC) PhD MBus BA DipCS Cert Log Mngt, FCILTA
Kim was appointed Chair of the NTARC’s Safety Advisory Board, AllRoads in May 2011. He has previously held positions as Transport Economist, Manager of Transport Operations and Strategy for Australia’s largest network Transport Operator before becoming a principal consultant and researcher in the field of freight productivity.
He has published over 90 research papers for major domestic and international clients and worked with some of Australia’s and Europe’s leading transport regulatory agencies in the areas of freight productivity, infrastructure, freight and logistics policy and pricing.
He is a Director of the Industrial Logistics Institute in Melbourne and is the National Chair of Professional Development and Education for the Chartered Institute of Logistics and Transport Australia, Kim was also appointed as a fractional Principal Fellow with the Department of Infrastructure Engineering at the University of Melbourne in 2005.
REFERENCE INFORMATION
National Transport Insurance (Major Incidents) Crash Data 1998 – 2013
National Transport Insurance Risk Services – Accident Investigation
National Transport Commission;
National Model Legislation for HV Driver Reform September 2008
http://www.ntc.gov.au National Transport Policy
Bureau of Infrastructure, Transport & Regional Economics 2011;
Truck Productivity: Sources, Trends and Future Prospects, Report 123, Canberra ACT.
National Transport Insurance – National Truck Accident Research Centre – published reports 2003, 2005, 2007, 2009, 2011 & 2013.
Australian Transport Safety Bureau; http://atsb.gov.au/publications/2004nti_working _ paper.aspx


While NTI has attempted to ensure that the information within this document is as accurate as possible, the content is for general information purposes only and is provided in good faith without any express or implied warranty. If this information is to be used as a reference, the user should seek specific industry advice. This document is available on www.nti.com.au. Please refer to this website for any amendments.
Insurance products are provided by National Transport Insurance, a joint venture of the insurers Insurance Australia Limited trading as CGU Insurance ABN 11 000 016 722 AFSL 227681 and AAI Limited Trading as Vero Insurance ABN 48 005 297 807 AFSL 230859 each holding a 50% share. National Transport Insurance is administered on behalf of the insurers by its manager NTI Limited ABN 84 000 746 109 AFSL 237246.
NTI Limited Head Office – Level 29, 400 George Street, Brisbane QLD 4000