2015 integrated resource plan joint public session
TRANSCRIPT

2015 Integrated Resource PlanJoint Public Session
TVA Regional Energy Resource Council and TVA Board April 20, 2015


Safety First

| 4
TVA and the Valley’s Energy Future is Evolving
Image Source: EPRI
Supply Side Demand Side

Integrated Resource Plan
The IRP is a study of how TVA might meet energy and capacity needs in a variety of future environments.
| 5

TVA’s Mission Remains the Cornerstone
| 6
Energy
Environment
Economic
Development
IRP

Today’s Session
| 7
• Panel sessions with Q&A from the Board and the RERC • Renewables• Energy Efficiency• Utility Landscape
• Public listening session• Conclude by 4:45pm

IRP Preliminary Results
Scott SelfVice President, Enterprise Planning
TVA

TVA’s Mission is the Cornerstone
| 9
Energy
Environment
Economic
Development
IRP

Our Current Portfolio
| 10
Hydro Nuclear Renewables EEDR Gas Coal4,200 MW conventional
1,600 MW pumped storage
6,700 MW 1,500 MW wind
120 MW solar/biomass
1,300 MW avoided capacity
5,500 MW CT and diesels
4,500 MW CC
12,400 MW
Approximately 37 percent of TVA’s capacity is emission-free
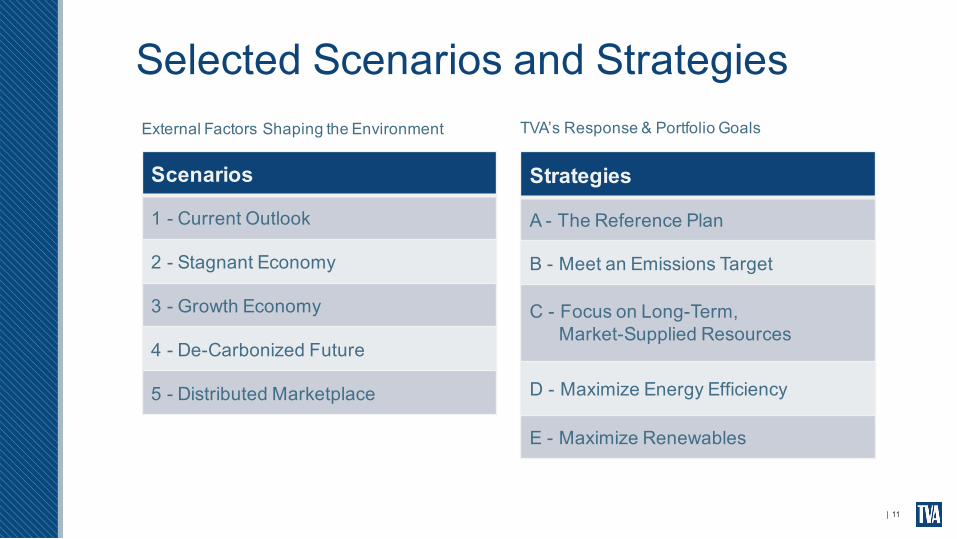
Selected Scenarios and Strategies
Scenarios
1 - Current Outlook
2 - Stagnant Economy
3 - Growth Economy
4 - De-Carbonized Future
5 - Distributed Marketplace
| 11
Strategies
A - The Reference Plan
B - Meet an Emissions Target
C - Focus on Long-Term,Market-Supplied Resources
D - Maximize Energy Efficiency
E - Maximize Renewables
External Factors Shaping the Environment TVA’s Response & Portfolio Goals

Key Criteria Used to EvaluateStrategy Performance
| 12
Cost
Financial Risk
Environmental Stewardship
ValleyEconomics
Flexibility
Identifies long-range and shorter term system costs
Measures the uncertainty around the cost of various plans
Captures multiple measures related to the environmental “footprint”
Measures per capita income & employment changes
Determines how easily the generation fleet can follow load swings

How Do the Strategies Compare?• COST: Long-term total costs are similar, but
emphasizing renewables or energy efficiency may lead to higher rates later
• FINANCIAL RISK: Scores are higher for strategies that emphasize particular resource choices
• ENVIRONMENTAL STEWARDSHIP: All strategies show improvement
• FLEXIBILITY: Generally good;; most limited if renewables are emphasized.
• VALLEY ECONOMICS: All strategies have a similar, but small, impact on overall economic health
| 13
Strategies
A - The Reference Plan
B - Meet an EmissionsTarget
C - Focus onLong-TermMarket Supplied Resources
D - Maximize Energy Efficiency
E - Maximize Renewables

The Generation Fleet
| 14
Potential Capacity Mix Under Current Planning Scenario2014
2033 – The Reference Plan
2033 – Maximize Energy Efficiency
2033 – Maximize Renewables
43 GW
35 GW Nuclear
Coal
Hydro
Natural Gas
Renewables
Energy Efficiency &Demand Response
Resource Types
2033 – Focus on Market Supplied Resources
2033 – Meet an Emissions Target

The Generation Fleet
| 15
Potential Capacity Mix Under Current Planning Scenario2014
2033 – The Reference Plan
2033 – Maximize Energy Efficiency
2033 – Maximize Renewables
43 GW
35 GW Nuclear
Coal
Hydro
Natural Gas
Renewables
Energy Efficiency &Demand Response
Resource Types
2033 – Focus on Market Supplied Resources
2033 – Meet an Emissions Target

The Generation Fleet Will Be Cleaner
| 16
Potential Capacity Mix Under Current Planning Scenario2014
2033 – The Reference Plan
2033 – Maximize Energy Efficiency
2033 – Maximize Renewables
43 GW
35 GW Nuclear
Coal
Hydro
Natural Gas
Renewables
Energy Efficiency &Demand Response
Resource Types
2033 – Focus on Market Supplied Resources
2033 – Meet an Emissions TargetNon-emitting sources account for 60% to 75% of the energy supply

The Future of Our Energy Supply• TVA power will still be reliable, affordable and sustainable
• We will rely more on cost-effective energy efficiency
• There will be more solar and wind power and less coal
• Natural gas plays an important role• TVA will continue to provide for economic growth in the Tennessee Valley
• Partnering for a better tomorrow| 17

Running The Business
| 18
• Plan Using Least Cost
• Watch Signposts
• Optimize Portfolio
• Adapt to Market Conditions
• Partner with Stakeholders
• Deliver Reliability
• Communicate


Panel Presentations

Panel 1: Looking Ahead in Renewables
| 21
• Neil Placer, TVA, Moderator• Mary Shaffer-Gill, TenneSEIA and Aries Energy
• Len Peters, Commonwealth of Kentucky
• Greg Williams, Appalachian Electric Cooperative
• Jack Simmons, Tennessee Valley Public Power Association

Break

Panel 2: Looking Ahead in Energy Efficiency
| 23
• Cindy Herron, TVA, Moderator• Clifford Stockton, Greater Memphis Chamber
• Curt Puckett, DNV GL • Michelle Walker, State of Tennessee• Becky Williamson, Memphis Light Gas and Water

Panel 3: The Changing Utility Landscape
| 24
• Joe Hoagland, TVA, Moderator• Van Wardlaw, TVA • Jay Stowe, Huntsville Utilities and Seven States Power Corporation
• Pete Mattheis, Tennessee Valley Industrial Committee
• Wayne Henson, East Mississippi Electric Power Association and Tennessee Valley Public Power Association

Break

Public Comment Session• Public participation is appreciated
• This is a listening session;; responses are typically not provided
• Comments are time limited

Closing Comments

Thank You
Please Travel Safely