2015 energy & sustainability priorities and predictions
TRANSCRIPT

2015 ENERGY & SUSTAINABILITY PRIORITIES AND PREDICTIONS
Presenters:Indigo Teiwes, Business Solutions Director, and Erik Makinson, Product Director, Waste both with Ecova
January 29, 2015
Survey Summary
Who: 500 Energy, Sustainability, Facilities and Finance Professionals
What: The Ecova 2015 Energy & Sustainability Predictions Report conducted by Ecova
When: November & December 2014
http://more.ecova.com/2015-Energy-Sustainability-Predictions

Agenda
Big Themes & Findings
Energy & Sustainability Program Drivers
2015 Top Priorities
Inside Water and Waste
Wrap Up
Q & A

Big Themes and Findings

Program Drivers

Broader national trend of growth in demand for electric
Shale boom (largely offset by traditional gas declines)
Storage
Volatility
Ecova’s 2014 Energy Market Highlights

Energy Price Expectations
2010 2011 2012 2013 2014 2015
Retail Price of Electricity in Commercial Sector
10.19 10.23 10.09 10.29 10.69 10.88
Natural Gas Price Commercial Sector 9.45 8.90 8.11 8.08 8.99 9.05
EIA Retail Commercial Price Data (U.S. Average)
Survey Results Ecova Projections
Relatively flat in 2015
− Higher NG reserves and production
− Lower natural gas supply costs
− Increasing distribution costs
− Electric prices more closely tied to NG (coal plant capacity being replaced with gas-fired generation)

Energy Price Implications
Communication is essential
– Communicate with all company stakeholders early and often in order to mitigate budget risk
– Expectations for energy prices vary greatly across energy manager’s and accounting/finance
• Impacts on budgeting and forecasting
Be prepared with a long-term energy strategy
– Nationally, energy prices may flatten in 2015, this won’t last for long
– Wholesale electricity prices will become even more strongly correlated to gas
• Higher potential for energy price volatility in the coming years

Resource Trends
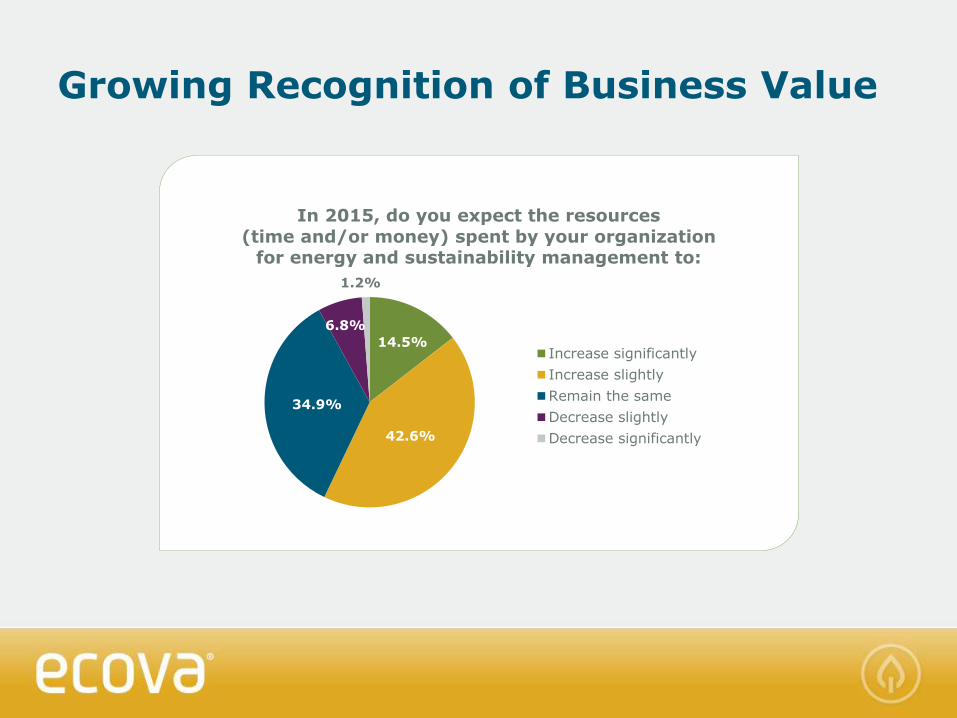
Growing Recognition of Business Value
14.5%
42.6%
34.9%
6.8%
1.2%
In 2015, do you expect the resources
(time and/or money) spent by your organization for energy and sustainability management to:
Increase significantly
Increase slightly
Remain the same
Decrease slightly
Decrease significantly

It Takes a Village
Growing stakeholder diversity in energy & sustainability programming
12.9%
13.4%
14.4%
16.4%
21.1%
3.7%
17.9%
What is your primary role/job function?
Finance / Accounting
Corporate
Sustainability
Energy management
Facility management
Energy procurement
Other (please specify)

Your Peers Rate Top Priorities for 2015
48.2%
52.3%
55.3%
Implement no cost, low cost efficiency efforts was
the top priority for leveraging energy data in 2015.
Implement no cost, low cost efficiency efforts
Support strategic energy and sustainability management plans/programs
Identify and implement capital expenditures to support energy efficiency projects

Lighting Leads (or LEDs?)

Energy Management Systems
Real-time data
Increased insights
Remote control
Industry Highlights
– Retail leading the way: reduced consumption and high utilization of EMS
– Restaurants have opportunity: energy intensive, 40% have made no investment to date
Nearly
50 percentof respondents
have energy and
building management
systems installed.

Energy’s Not the Only Game in Town …

Why Worry about Water?
Rising water rates and rate variability
Significance of water spend
Increased pressure on water rates
Savings opportunities in bill management and consumption reduction

New York is seeing some of the largest price increases since 2008.
Washington DC and Delaware are seeing steep price increases.
Water on the R ise

Rising Water Costs
Small Box = 8% CAGRC Stores = 8% CAGRCasual Dining = 8% CAGRQuick Serve = 7% CAGRBig Box = 7% CAGR
Since 2008, water rates have increased by approximately 30% across all industries.
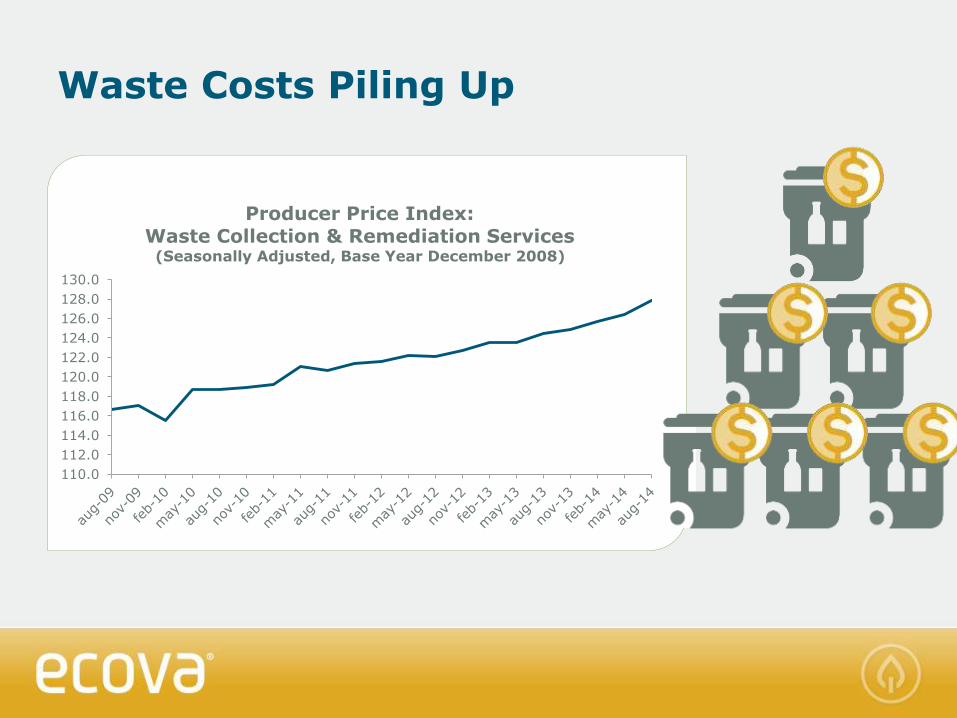
Waste Costs Piling Up
110.0
112.0
114.0
116.0
118.0
120.0
122.0
124.0
126.0
128.0
130.0
Producer Price Index:Waste Collection & Remediation Services
(Seasonally Adjusted, Base Year December 2008)

Regulation On the Increase
Classic waste regulation
New trend: focus on waste focus
Regional and/or state
– City level (i.e. Seattle, WA)
– State level (i.e. AB341, CA’sMandatory Commercial Recycling Law)
Extended Producer Responsibility (EPR)
– ~25 states have e-waste laws

Most Effective Waste Strategies

2015 Waste Priorities
0.0%
10.0%
20.0%
30.0%
40.0%
50.0%
Support Zero
Waste strategy
(i.e. reporting
landfill diversion)
Auditing waste
hauler contracts
Optimizing service
levels (right-sizing)
Improve pricing
and terms in
procurement
events
In your current role, what are your top priorities
for leveraging your waste data in 2015? (Check all that apply)
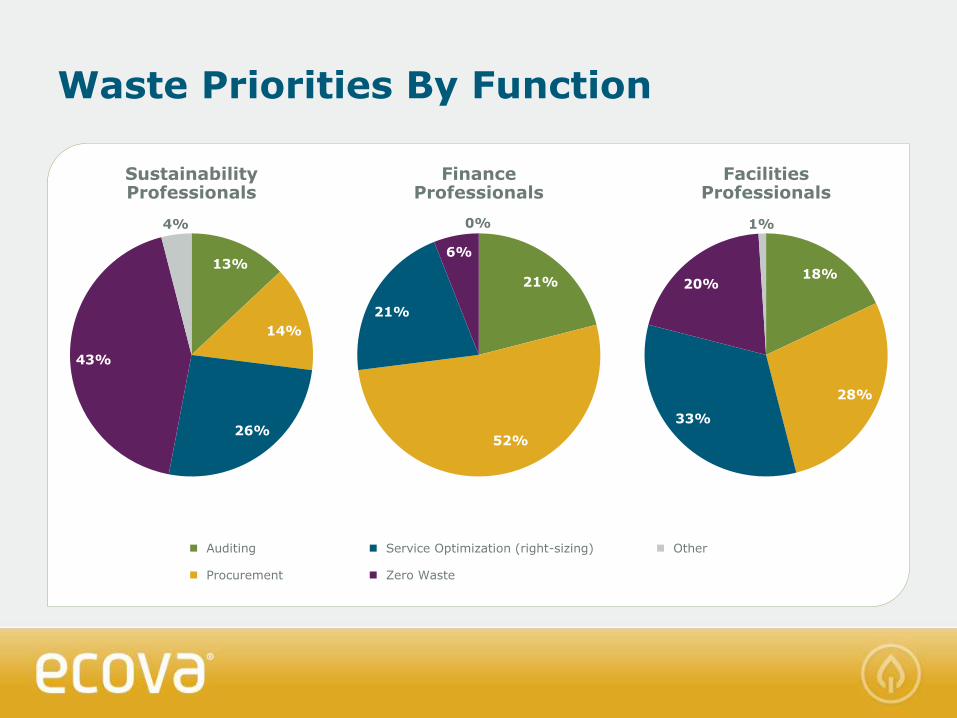
Waste Priorities By Function
Sustainability Professionals
Finance Professionals
Facilities Professionals
13%
14%
26%
43%
4%
21%
52%
21%
6%
0%
18%
28%
33%
20%
1%
Auditing Service Optimization (right-sizing) Other
Procurement Zero Waste

Benefits of Strategy Coordination
http://www.ecova.com/media/486976/24_hour_fitness_case_study.pdf
THE COMBINATION OF
PROCUREMENT AND RIGHT SIZING
WILL CONTRIBUTE TO AN ESTIMATED
SAVINGS BETWEEN 40% AND 50%
BY 2014.

Key Takeaways
Continued growth in drivers and investments
Integrated strategic plans
Diversity of stakeholders and perspectives and priorities
Communicate and plan appropriately for market price changes
Make the most out of managing waste

Upcoming Ecova Webinars
INSIDE ENERGY & SUSTAINABILITY SERIES
Watching your Waste: Deriving Value from a Foundation of Data – Thursday, February 19th at 11am PST
Quarterly Energy Market Watch – Thursday February 26th
at 11am PST
How to Make Your Utility Bill Data Work for You –Thursday, March 12th at 11am PST
Questions, comments, suggestions? [email protected]

Q&A

Thank you!