2015 child restraint and booster seat report - … · 3.5 data analysis ... seat use rate,...
TRANSCRIPT

FINAL REPORT
2015 Direct Observation Survey of Child Restraint and Booster Seat Use
and Misuse
Prepared for: Office of Highway Safety Planning
333 South Grand Avenue P.O. Box 30634
Lansing, MI 48909
Prepared by: Wayne State University
Transportation Research Group Detroit, MI 48202
September 8, 2015
ii
2015 Direct Observation Survey of
Child Restraint and Booster Seat Use and Misuse
FINAL REPORT
Prepared for: Office of Highway Safety Planning
333 South Grand Avenue P.O. Box 30634
Lansing, MI 48909
Prepared by: Wayne State University
Transportation Research Group Detroit, MI 48202
September 8, 2015
The opinions, findings, and conclusions expressed in this publication are those of the author(s) and not necessarily those of the Michigan Office of Highway Safety and Planning, the U.S. Department of Transportation, or the National Highway Transportation Safety Administration. This report was prepared in cooperation with the
Michigan Office of Highway Safety Planning and the U.S. Department of Transportation, and the National Highway Traffic Safety Administration.
i
1. Report No.
2. Government Accession No. 3. Recipient’s Catalog No.
4. Title and Subtitle 2015 Direct Observation Survey of Child Restraint and Booster Seat Use and Misuse
5. Report Date September 2, 2015
6. Performing Organization Code
7. Author(s) Timothy Gates, Peter Savolainen, Trevor Kirsch, Jonathan Kay, and Deepika Kandasamy
8. Performing Organization Report No.
9. Performing Organization Name and Address Wayne State University - Transportation Research Group Department of Civil and Environmental Engineering 5050 Anthony Wayne Drive, Room 0504 Detroit, MI 48202
10. Work Unit No. (TRAIS)
11. Contract or Grant No.
12. Sponsoring Agency Name and Address Office of Highway Safety Planning 333 South Grand Avenue P.O. Box 30634 Lansing, MI 48909-0634
13. Type of Report and Period Covered Final Report; January 2015 - August 2015
14. Sponsoring Agency Code
15. Supplementary Notes
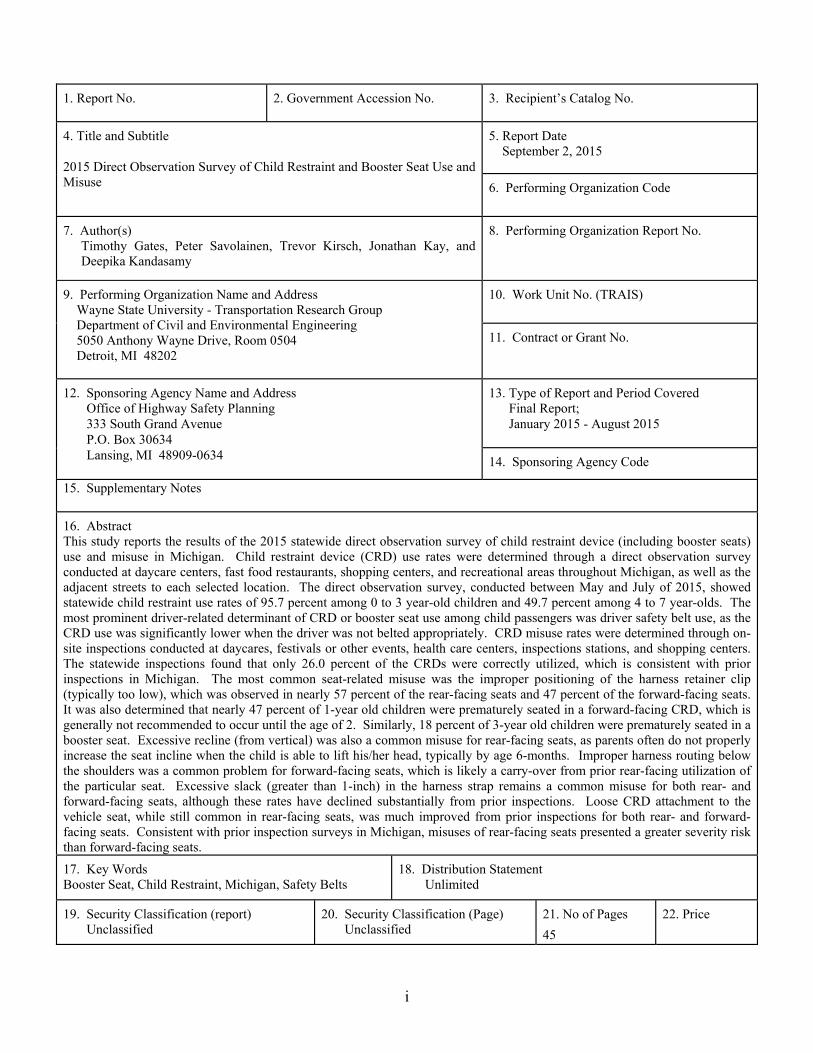
16. Abstract This study reports the results of the 2015 statewide direct observation survey of child restraint device (including booster seats) use and misuse in Michigan. Child restraint device (CRD) use rates were determined through a direct observation survey conducted at daycare centers, fast food restaurants, shopping centers, and recreational areas throughout Michigan, as well as the adjacent streets to each selected location. The direct observation survey, conducted between May and July of 2015, showed statewide child restraint use rates of 95.7 percent among 0 to 3 year-old children and 49.7 percent among 4 to 7 year-olds. The most prominent driver-related determinant of CRD or booster seat use among child passengers was driver safety belt use, as the CRD use was significantly lower when the driver was not belted appropriately. CRD misuse rates were determined through on-site inspections conducted at daycares, festivals or other events, health care centers, inspections stations, and shopping centers. The statewide inspections found that only 26.0 percent of the CRDs were correctly utilized, which is consistent with prior inspections in Michigan. The most common seat-related misuse was the improper positioning of the harness retainer clip (typically too low), which was observed in nearly 57 percent of the rear-facing seats and 47 percent of the forward-facing seats. It was also determined that nearly 47 percent of 1-year old children were prematurely seated in a forward-facing CRD, which is generally not recommended to occur until the age of 2. Similarly, 18 percent of 3-year old children were prematurely seated in a booster seat. Excessive recline (from vertical) was also a common misuse for rear-facing seats, as parents often do not properly increase the seat incline when the child is able to lift his/her head, typically by age 6-months. Improper harness routing below the shoulders was a common problem for forward-facing seats, which is likely a carry-over from prior rear-facing utilization of the particular seat. Excessive slack (greater than 1-inch) in the harness strap remains a common misuse for both rear- and forward-facing seats, although these rates have declined substantially from prior inspections. Loose CRD attachment to the vehicle seat, while still common in rear-facing seats, was much improved from prior inspections for both rear- and forward-facing seats. Consistent with prior inspection surveys in Michigan, misuses of rear-facing seats presented a greater severity risk than forward-facing seats.
17. Key Words Booster Seat, Child Restraint, Michigan, Safety Belts
18. Distribution Statement Unlimited
19. Security Classification (report) Unclassified
20. Security Classification (Page) Unclassified
21. No of Pages
45
22. Price
ii
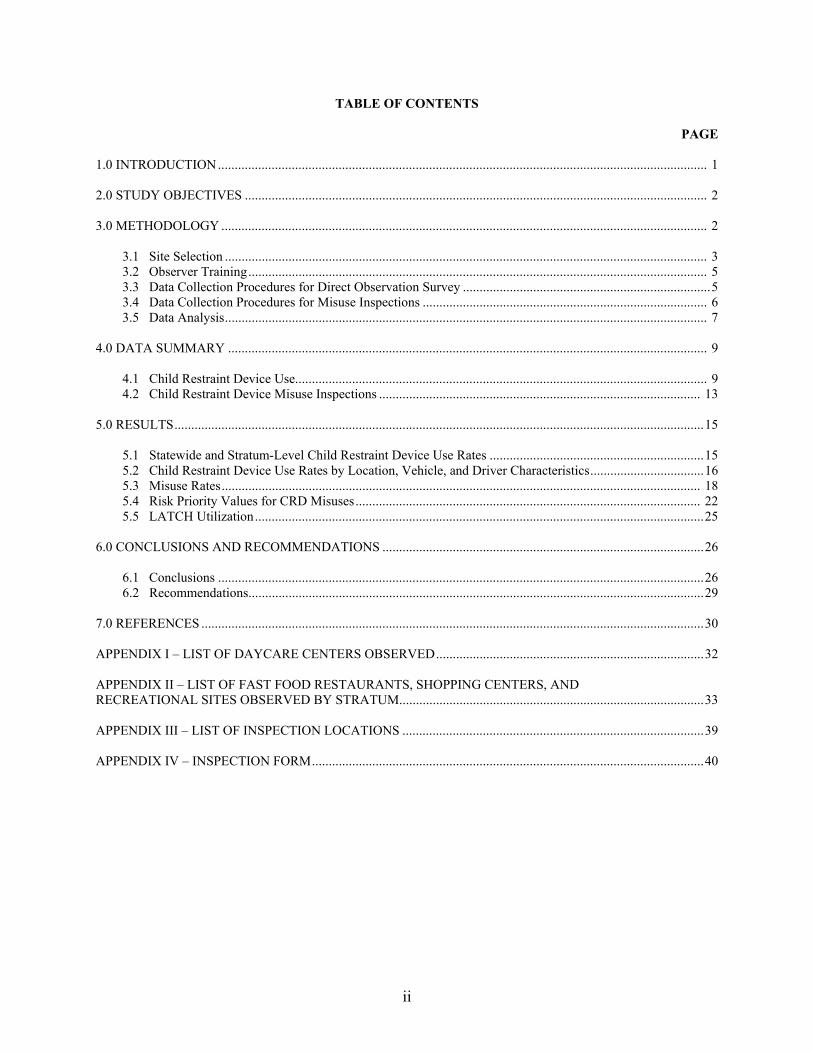
TABLE OF CONTENTS
PAGE 1.0 INTRODUCTION .................................................................................................................................................. 1 2.0 STUDY OBJECTIVES .......................................................................................................................................... 2 3.0 METHODOLOGY ................................................................................................................................................. 2 3.1 Site Selection ................................................................................................................................................ 3 3.2 Observer Training ......................................................................................................................................... 5 3.3 Data Collection Procedures for Direct Observation Survey .......................................................................... 5 3.4 Data Collection Procedures for Misuse Inspections ..................................................................................... 6 3.5 Data Analysis ................................................................................................................................................ 7 4.0 DATA SUMMARY ............................................................................................................................................... 9 4.1 Child Restraint Device Use ........................................................................................................................... 9 4.2 Child Restraint Device Misuse Inspections ................................................................................................ 13 5.0 RESULTS .............................................................................................................................................................. 15 5.1 Statewide and Stratum-Level Child Restraint Device Use Rates ................................................................ 15 5.2 Child Restraint Device Use Rates by Location, Vehicle, and Driver Characteristics .................................. 16 5.3 Misuse Rates ............................................................................................................................................... 18 5.4 Risk Priority Values for CRD Misuses ....................................................................................................... 22 5.5 LATCH Utilization ...................................................................................................................................... 25 6.0 CONCLUSIONS AND RECOMMENDATIONS ................................................................................................ 26 6.1 Conclusions ................................................................................................................................................. 26 6.2 Recommendations ........................................................................................................................................ 29 7.0 REFERENCES ...................................................................................................................................................... 30 APPENDIX I – LIST OF DAYCARE CENTERS OBSERVED ................................................................................ 32 APPENDIX II – LIST OF FAST FOOD RESTAURANTS, SHOPPING CENTERS, AND RECREATIONAL SITES OBSERVED BY STRATUM ........................................................................................... 33 APPENDIX III – LIST OF INSPECTION LOCATIONS .......................................................................................... 39 APPENDIX IV – INSPECTION FORM ..................................................................................................................... 40
iii
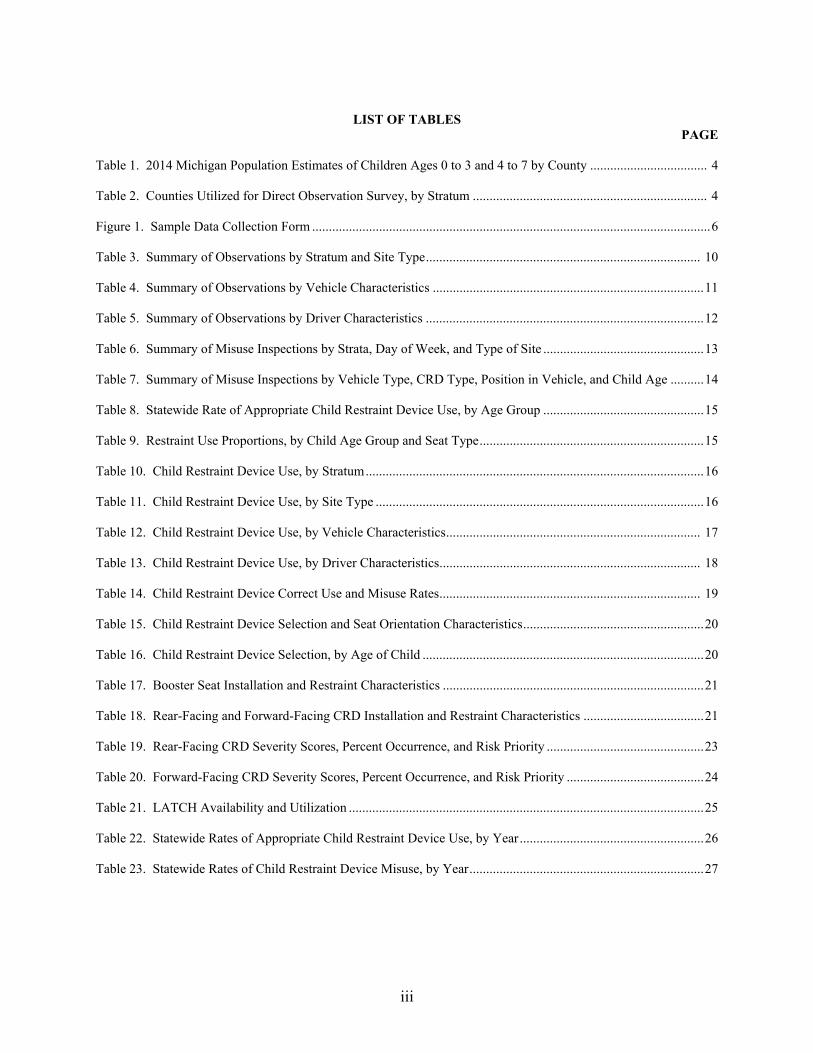
LIST OF TABLES PAGE
Table 1. 2014 Michigan Population Estimates of Children Ages 0 to 3 and 4 to 7 by County ................................... 4 Table 2. Counties Utilized for Direct Observation Survey, by Stratum ...................................................................... 4 Figure 1. Sample Data Collection Form ....................................................................................................................... 6 Table 3. Summary of Observations by Stratum and Site Type .................................................................................. 10 Table 4. Summary of Observations by Vehicle Characteristics ................................................................................. 11 Table 5. Summary of Observations by Driver Characteristics ................................................................................... 12 Table 6. Summary of Misuse Inspections by Strata, Day of Week, and Type of Site ................................................ 13 Table 7. Summary of Misuse Inspections by Vehicle Type, CRD Type, Position in Vehicle, and Child Age .......... 14 Table 8. Statewide Rate of Appropriate Child Restraint Device Use, by Age Group ................................................ 15 Table 9. Restraint Use Proportions, by Child Age Group and Seat Type ................................................................... 15 Table 10. Child Restraint Device Use, by Stratum ..................................................................................................... 16 Table 11. Child Restraint Device Use, by Site Type .................................................................................................. 16 Table 12. Child Restraint Device Use, by Vehicle Characteristics ............................................................................ 17 Table 13. Child Restraint Device Use, by Driver Characteristics .............................................................................. 18 Table 14. Child Restraint Device Correct Use and Misuse Rates .............................................................................. 19 Table 15. Child Restraint Device Selection and Seat Orientation Characteristics ...................................................... 20 Table 16. Child Restraint Device Selection, by Age of Child .................................................................................... 20 Table 17. Booster Seat Installation and Restraint Characteristics .............................................................................. 21 Table 18. Rear-Facing and Forward-Facing CRD Installation and Restraint Characteristics .................................... 21 Table 19. Rear-Facing CRD Severity Scores, Percent Occurrence, and Risk Priority ............................................... 23 Table 20. Forward-Facing CRD Severity Scores, Percent Occurrence, and Risk Priority ......................................... 24 Table 21. LATCH Availability and Utilization .......................................................................................................... 25 Table 22. Statewide Rates of Appropriate Child Restraint Device Use, by Year ....................................................... 26 Table 23. Statewide Rates of Child Restraint Device Misuse, by Year ...................................................................... 27
1
1.0 INTRODUCTION
Motor vehicle crashes are one of the leading causes of death and injury for children under 8 years of age. From 2010
to 2014, a total of 52,774 child passengers under the age of 8 were involved in 39,344 traffic crashes in Michigan
[1]. Among those child-aged vehicle occupants for whom restraint use information was recorded, only 35,695 (67.6
percent) were restrained in some type of child specific restraint, either a child restraint device or a belt-positioning
booster seat. Amongst these children restrained in some type of child safety seat, 191 (0.4 percent) suffered fatal (K)
or incapacitating (A) injuries [1]. Prior research confirms the appropriate use of child restraint devices (CRDs) and
booster seats can greatly reduce the risk of serious injury to children involved in traffic crashes. The risk of serious
injury for children between 12 and 47 months of age is 78 percent lower for children seated in forward-facing CRDs
than for children restrained in safety belts alone [2]. Similarly, the risk of injury for children between ages 4 and 7
is reduced by 59 percent when the proper CRD is used and the risk of head or brain injuries is reduced by 75 percent
[3].
Over the prior two decades, Michigan has experienced increases in the use of CRDs among children under 4 years
of age from 74.5 percent in 1997 to 93.6 percent in 2013 [4-7]. In spite of these gains, about half (45 percent) of the
children under the age of 4 who were killed in traffic crashes in Michigan from 2010 to 2014 were improperly or
completely unrestrained [1]. Although non-restraint of a child passenger presents obvious safety implications, many
of the children killed in these crashes may also have been improperly restrained within a functional CRD.
The improper use of CRDs may expose a child to a heightened risk of injury when involved in a crash. CRDs are
most effective when: (1) the devices are appropriate for the age, height, and weight of the child being restrained, (2)
the devices are properly and securely installed in the vehicle using seatbelts or a Lower Anchors and Tethers for
Children (LATCH) restraint system, and (3) the child is properly and securely restrained in the device. Recent
studies by the Wayne State University Transportation Research Group (WSU-TRG) have shown roughly 70 to 80
percent of CRDs in Michigan are improperly used to some degree [4-7]. The most recent CRD study performed by
the WSU-TRG in 2013 found that the most common CRD misuses were (1) improper seat recline (rear-facing seats
only), (2) too muck slack in the harness straps and (3) improper positioning of the harness retainer clip [7]. This is
concerning as improper seat recline and loose harnesses have been identified in previous research as one of the most
severe forms of misuse [8,9]. Other severe CRD misuses include: internal harness not buckled, not buckling the
seatbelt or attaching the LATCH anchor, improper routing of the seatbelt when restraining the CRD to the vehicle
seat, shoulder harness straps too high (rear-facing only), and excessive space between the CRD and the vehicle seat
[8,9]. Fortunately, the other severe misuses were found to occur relatively infrequently during the most recent CRD
inspections performed for OHSP
While child restraint use has increased dramatically among children under the age of 4, restraint use among 4 to 7
year-olds has been shown to be substantially lower [10]. There are several potential explanations for the low booster
seat use rate, including a lack of knowledge of the state law and best practice regarding the benefits of booster seats
2
compared to seat belts alone, in addition to differences in risk perception among parents [11-17]. Following the
enactment of statewide legislation in July 2008, booster seat use was found to increase substantially in Michigan
[18,19]. However, the most recent survey (2013) found greater than half (57.6 percent) of 4 to 7 year-old child
passengers continue to travel while inappropriately restrained [7].
2.0 STUDY OBJECTIVES
The purpose of this study was to determine the rates of child restraint device use and misuse among children
passengers under the age of 8 in Michigan. The survey results provide valuable information regarding changes in
child restraint use patterns throughout the state of Michigan as well as help to identify areas of opportunity for
increasing the use of appropriate child restraint devices by Michigan drivers. Understanding the degree of nonuse
and misuse will also assist in developing educational efforts, public awareness campaigns, and enforcement
initiatives.
The proposed study built off of the methodologies from previous surveys, such as the 2009, 2010, 2011 and 2013
studies conducted by the WSU-TRG [5,6,7,18,19], in order to accurately and efficiently estimate the rates of use and
misuse of CRDs and booster seats in the state of Michigan. Use rates were determined through a series of
destination surveys conducted at locations subject to high volumes of target-age children. Misuse rates were based
on visual and hands-on inspection of children under the age of 8 who were seated in a CRD. Each device was
inspected for type of seat, location in the vehicle, direction of placement, attachment to the vehicle, and the
placement and restraint of the child in the device. Such data may assist the Office of Highway Safety Planning in
the development of public awareness messages specifically targeted to common or critical CRD/booster misuses.
3.0 METHODOLOGY
The study methodology essentially consists of two separate, but related, components. The first component involves
direct observational surveys of CRD and booster seat use. This allows for a longitudinal comparison of use rates
over time and provides data for use by the state of Michigan to develop targeted educational and public awareness
programs to positively impact child safety. This portion of the study resulted in the determination of overall rates of
CRD and booster seat use in Michigan.
The second component focuses on CRD and booster seat misuse and was based upon visual and hands-on
inspections. The main objectives of this analysis were to determine both the rate and degree/severity of misuse, as
well as to identify patterns of common and severe misuse of CRDs and booster seats.
The study methodology is similar to prior surveys, utilizing a destination-based sampling strategy for both the
surveys and inspections. This sampling scheme is based upon the methodology utilized during the 2009, 2011, and
2013 surveys and involves collecting data from a random sample of target age children at daycare centers, fast food
restaurants, recreational sites, and shopping centers, as well as the street adjacent to each selected location.
3
3.1 Site Selection
In order to accurately determine rates of CRD and booster seat use and misuse, a representative sample of target-
aged groups of children were required as a part of this study: (a) children from ages 0 to 4 and (b) children from ages
4 to 7. In order to ensure the representativeness of the sample, these observations were to be diverse in terms of
geographic coverage, vehicle mix, and the socioeconomic characteristics of the drivers. To ensure such
representativeness while maintaining data collection efficiency, sites were sampled from 23 counties representing
nearly 82 percent of the target population (children ages 0 to 7). The counties were similar to those included in the
2009, 2010, 2011 and 2013 surveys [5,6,7,18,19]. The 2014 county census estimates for children ages 0 to 3, and
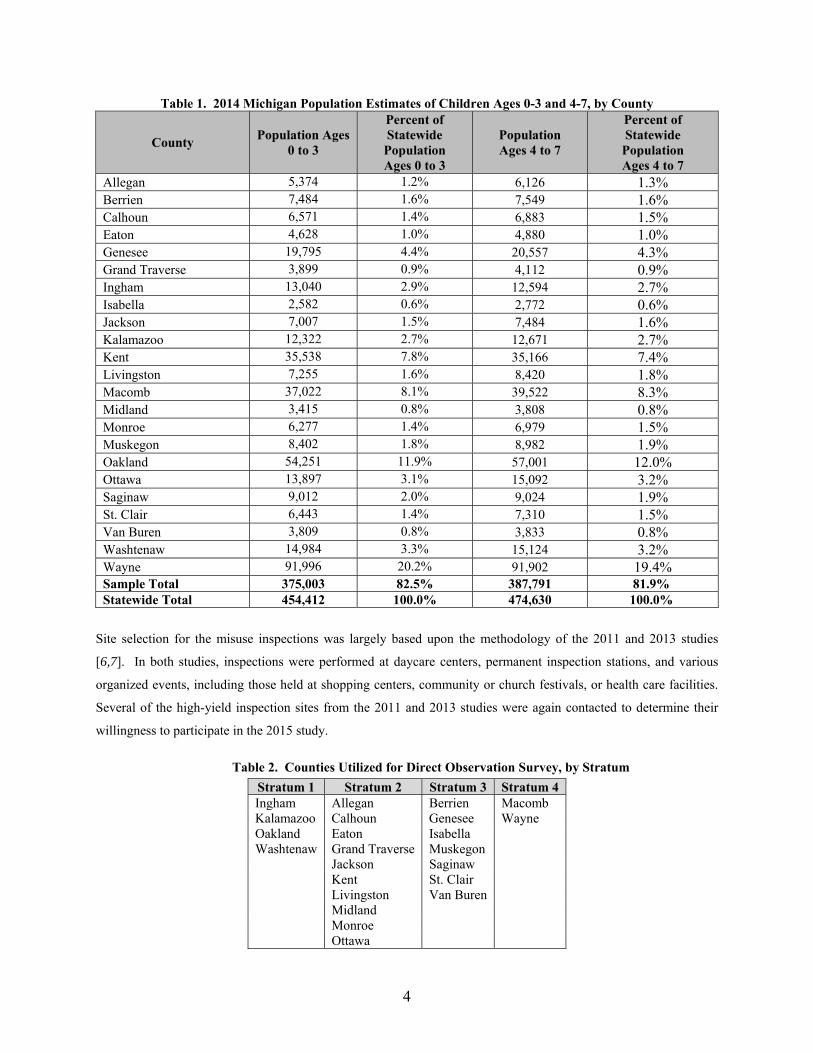
children ages 4 to 7 are provided in Table 1 [20].
To provide similar levels of precision in comparison to previous studies, a target sample size of at least 3,000
children within each age group was established for the child restraint use survey while a target sample size of 300
children was established for the inspections of misuse.
The candidate counties were previously partitioned into four strata based upon historical safety belt use rates and
vehicle miles traveled (VMT) as per the direct observation surveys of safety belt use. This stratification was based
upon the fact that CRD and booster seat use have been shown to be related to the driver’s safety belt use by previous
studies [5,6,7,18,19]. Combining counties with similar use and/or misuse rates into strata reduces the within-stratum
variability and allows for a reasonable number of observations within each stratum while ensuring desired levels of
precision. Stratum 1 includes those counties with the highest historical restraint use rates while Stratum 4 has
exhibited the lowest use rate. These counties were partitioned as shown in Table 2.
The specific observation sites were selected from a statewide sample of locations expected to yield high volumes of
target-aged child passengers, including daycare centers, fast food restaurants, recreational sites (e.g., zoos, museums,
parks, etc.), and shopping centers. To allow for a direct comparison between the results of these surveys and those
conducted as a part of previous surveys, the same sites were utilized where feasible. Some of the observation sites
from previous surveys had subsequently closed or were found to yield very low volumes of target-aged children.
Such locations were replaced by alternate sites within the same county and these alternate sites were of the same
type as the initial sites they replaced. Complete lists of locations used for the child restraint device use surveys are
included by site type in Appendix I (Daycare Centers), and Appendix II (Fast Food Restaurants, Shopping Centers,
and Recreational Sites).
4
Table 1. 2014 Michigan Population Estimates of Children Ages 0-3 and 4-7, by County
County Population Ages
0 to 3
Percent of Statewide
Population Ages 0 to 3
Population Ages 4 to 7
Percent of Statewide
Population Ages 4 to 7
Allegan 5,374 1.2% 6,126 1.3% Berrien 7,484 1.6% 7,549 1.6% Calhoun 6,571 1.4% 6,883 1.5% Eaton 4,628 1.0% 4,880 1.0% Genesee 19,795 4.4% 20,557 4.3% Grand Traverse 3,899 0.9% 4,112 0.9% Ingham 13,040 2.9% 12,594 2.7% Isabella 2,582 0.6% 2,772 0.6% Jackson 7,007 1.5% 7,484 1.6% Kalamazoo 12,322 2.7% 12,671 2.7% Kent 35,538 7.8% 35,166 7.4% Livingston 7,255 1.6% 8,420 1.8% Macomb 37,022 8.1% 39,522 8.3% Midland 3,415 0.8% 3,808 0.8% Monroe 6,277 1.4% 6,979 1.5% Muskegon 8,402 1.8% 8,982 1.9% Oakland 54,251 11.9% 57,001 12.0% Ottawa 13,897 3.1% 15,092 3.2% Saginaw 9,012 2.0% 9,024 1.9% St. Clair 6,443 1.4% 7,310 1.5% Van Buren 3,809 0.8% 3,833 0.8% Washtenaw 14,984 3.3% 15,124 3.2% Wayne 91,996 20.2% 91,902 19.4% Sample Total 375,003 82.5% 387,791 81.9% Statewide Total 454,412 100.0% 474,630 100.0%
Site selection for the misuse inspections was largely based upon the methodology of the 2011 and 2013 studies
[6,7]. In both studies, inspections were performed at daycare centers, permanent inspection stations, and various
organized events, including those held at shopping centers, community or church festivals, or health care facilities.
Several of the high-yield inspection sites from the 2011 and 2013 studies were again contacted to determine their
willingness to participate in the 2015 study.
Table 2. Counties Utilized for Direct Observation Survey, by Stratum
Stratum 1 Stratum 2 Stratum 3 Stratum 4 Ingham Allegan Berrien Macomb Kalamazoo Calhoun Genesee Wayne Oakland Eaton Isabella Washtenaw Grand Traverse Muskegon Jackson Saginaw Kent St. Clair Livingston Van Buren Midland Monroe Ottawa
5
The county strata assignments for the inspections were identical to those used in the CRD direct observation
surveys, although the minimum necessary sample size for the inspection of the restraint use characteristics of
passengers under the age of 8 was much smaller due to the time and human resources necessary to perform the
inspections. A list of all CRD inspection locations is provided in Appendix III.
3.2 Observer Training
Two targeted training programs specific to this project were conducted during the spring of 2015: (1) training for
inspection of CRD/booster seat misuse; and (2) training for direct observation of CRD/booster seat use. All training
occurred during early May of 2015. Classroom training for the inspections was conducted on May 6, 2015 by a
NHTSA-certified Child Passenger Safety Technician Instructor. This training session included both classroom
instruction and hands-on in-vehicle instruction on child safety restraint use and misuse. Each data collector received
a training manual summarizing the information received during the training session. At the end of the training
session, each data collector was required to successfully demonstrate inspections of actual CRD/booster seat
installations prepared by the instructor. After the initial training, each new technician “shadowed” an experienced
technician during his/her initial inspection event.
Classroom training for the direct observation survey of child restraint use was also conducted on May 6, 2015.
During the classroom training, data collectors were provided with information to aid in assessing the age of child
passengers, including height/weight information and sample photographs. At the conclusion of the training session,
field personnel were tested on their ability to assess the age of child passengers based upon a series of photographs.
The classroom training session was followed by practice field data collection at a local recreational location. The
purpose of the field data collection was to provide observers with an opportunity to gain field experience in
assessing child passenger age and determining the type of child restraint use. Observers worked as a group at the
start of the field training, quickly followed by a mock session where they were instructed to record the information
needed to the best of their ability. Following the field training, their performance was monitored to ensure
consistency among observers. This included comparing the number of target-aged children identified by each
observer, as well as the type of restraint used by each observed child. In addition to these training exercises, each
data collector received a training manual, as well as all necessary field supplies.
3.3 Data Collection Procedures for Direct Observation Survey
During weekday surveys, the data collection schedule was arranged such that observations could be conducted at a
fast food restaurant at the start of the day, followed by shopping center locations in route to a daycare center
scheduled to be visited later the same day. Each daycare center was researched to determine start and release times,
and other locations (e.g., shopping centers, fast food restaurants, recreation centers) were also researched to ensure
they were still in operation. In order to minimize the travel time and distance required to conduct this study, the
observation sites were clustered into geographic regions. Weekend data collection was performed at all types of
locations, excluding daycare centers.
6
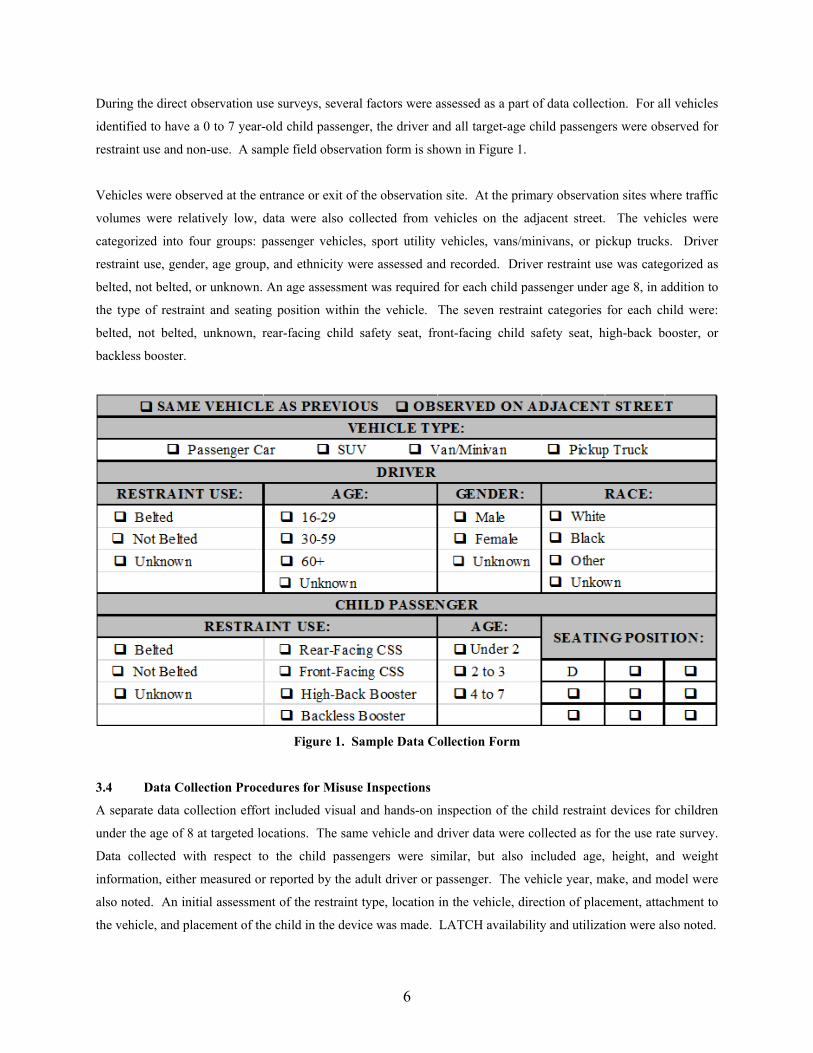
During the direct observation use surveys, several factors were assessed as a part of data collection. For all vehicles
identified to have a 0 to 7 year-old child passenger, the driver and all target-age child passengers were observed for
restraint use and non-use. A sample field observation form is shown in Figure 1.
Vehicles were observed at the entrance or exit of the observation site. At the primary observation sites where traffic
volumes were relatively low, data were also collected from vehicles on the adjacent street. The vehicles were
categorized into four groups: passenger vehicles, sport utility vehicles, vans/minivans, or pickup trucks. Driver
restraint use, gender, age group, and ethnicity were assessed and recorded. Driver restraint use was categorized as
belted, not belted, or unknown. An age assessment was required for each child passenger under age 8, in addition to
the type of restraint and seating position within the vehicle. The seven restraint categories for each child were:
belted, not belted, unknown, rear-facing child safety seat, front-facing child safety seat, high-back booster, or
backless booster.
Figure 1. Sample Data Collection Form
3.4 Data Collection Procedures for Misuse Inspections
A separate data collection effort included visual and hands-on inspection of the child restraint devices for children
under the age of 8 at targeted locations. The same vehicle and driver data were collected as for the use rate survey.
Data collected with respect to the child passengers were similar, but also included age, height, and weight
information, either measured or reported by the adult driver or passenger. The vehicle year, make, and model were
also noted. An initial assessment of the restraint type, location in the vehicle, direction of placement, attachment to
the vehicle, and placement of the child in the device was made. LATCH availability and utilization were also noted.

7
Each child seated in a child restraint device or booster seat was inspected for several common misuses, as well as the
degree or extent of each misuse. Particular attention was paid to the prevalence of severe misuse categories,
including loose internal harness, internal harness not buckled, not buckling or adequately securing the seatbelt or
attaching the LATCH anchor, improper routing of the seatbelt when restraining the CRD to the vehicle seat,
shoulder harness straps routed incorrectly, and excessive space between the CRD and the vehicle seat. All observed
restraint misuses were carefully recorded onto the data collection form along with descriptive notes. The complete
inspection checklist is included in the inspection form, which is displayed in Appendix IV.
3.5 Data Analysis
Rates of appropriate child restraint use were determined at the statewide- and stratum-level, as well as with respect
to each of the characteristics previously described. For the purposes of the direct observation survey, “appropriate”
child restraint use was defined based on current Michigan law. Thus, children under the age of 4 that were seated in
a rear-facing or forward-facing child safety seat were considered to be using the appropriate restraint. Premature
graduation to a booster seat or safety belt was classified as inappropriate restraint use for this age group.
Appropriate restraint use for children ages 4 through 7 included rear-facing restraint, forward-facing restraint, or
booster seat (high back or backless). Premature graduation to safety belts (without a booster) was classified as
inappropriate. The procedures used to calculate the appropriate use rates and their associated variances are outlined
below.
3.5.1 Statewide Child Restraint Device Use Rate Calculations
In order to determine the statewide child restraint use (or misuse) rate, a procedure was utilized similar to previous
studies [4-7,18,19]. This procedure is illustrated here with respect to the appropriate use rate calculation. First, the
child restraint device use rate at each study location was calculated as shown here:
where:
gij = use rate at location i in stratum j
bij = number of target age children restrained appropriately at location i in stratum j
oij = total number of target age children observed at location i in stratum j
Then, the child restraint device use rate within each stratum (rj) was determined as follows:
∑∑

8
Once the child restraint use rates were determined within each stratum, the statewide use rate was calculated using
the following equation:
∑
∑
where:
rTOTAL = statewide child restraint device use rate
pj = population of target age children in stratum j
The ‘p’ values in the preceding equation are weighting factors that are necessary because strata with higher
populations of target age children will have a greater impact on the statewide use rate. Separate estimates were
obtained for the 0 to 3, and 4 to 7 year-old age groups.
3.5.2 Statewide Child Restraint Device Use Variance Calculation
Upon obtaining estimates of the child restraint device use and misuse rates for each of the four strata, the variance
for each stratum was determined using the following equation [21]:
1 ∑ ∑
where:
Varj = variance for stratum j
nj = number of sampled observation locations in stratum j
Nj = number of available observation locations in stratum j
The second term in the above equation can be dropped from the equation with no significant impact on the resulting
estimate, providing the following formula where all variables are as previously defined:
1 ∑
Given the variance of child restraint device use within each stratum, the statewide variance in use can then be
calculated using the following formula:
∑
∑

9
where:
VarTOTAL = statewide variance in child restraint device use
The calculated variances were used to construct 95-percent confidence intervals for the strata and statewide use rates
using the following equation:
Strata-level 95% 1.96
Statewide 95% 1.96
3.5.3 Misuse Rate Determination
The CRD/booster misuse rates for each stratum and statewide were determined based on the data obtained from the
inspections. Separate misuse rates were also computed for rear-facing CRDs, forward-facing CRDs, and booster
seats. A CRD/booster was considered to be “misused” if one or more of the itemized misuse characteristics was
observed during the inspection or if no CRD was utilized to restrain the child. The misuse rate was computed based
on the number of inspected CRDs with one or more misuses divided by the total number of inspected CRDs. The
overall statewide misuse rate was calculated by weighting the misuse rates for each of the three seat-type categories
(rear-facing, forward-facing, and booster seat) based on seat use proportions obtained from the direct observation
survey. The misuse rates were also compared with those obtained during prior inspections.
A severity score was also determined for both the forward-facing CRDs and rear-facing CRDs. The severity scores
were similar to those used in a study conducted in Canada in 2002 [8], which were developed by CRD safety experts
[9]. A severity score of ‘10’ indicates a misuse of the highest severity and a severity score of ‘0’ indicates the
misuse has no safety impact. A severity score of ‘4’ or higher will compromise the effect of the CRD on the child’s
safety during a crash [8]. The severity scores for each type of misuse were multiplied by the percent of occurrence.
This resulted in a risk priority number for each type of misuse. The risk priority numbers were summed for all
misuse types to determine the total risk priority number for both the forward-facing CRD and rear-facing CRD. The
weighted average severity score per rear-facing and forward-facing CRD was also determined. The average risk
priority numbers were compared with those observed in previous studies performed by the WSU-TRG. LATCH
availability and utilization was also computed and compared to prior surveys.
4.0 DATA SUMMARY
4.1 Child Restraint Device Use
The statewide child restraint device use survey was performed between Saturday, May 9, 2015 and Wednesday, July
29, 2015. During this observation period, a total of 9,699 observations of 0 to 7 year-old child passengers were
conducted at daycare centers, fast food restaurants, shopping centers, and recreation centers, as well as on streets
adjacent to these locations throughout the 23-county sample. Summary statistics detailing the results of the child
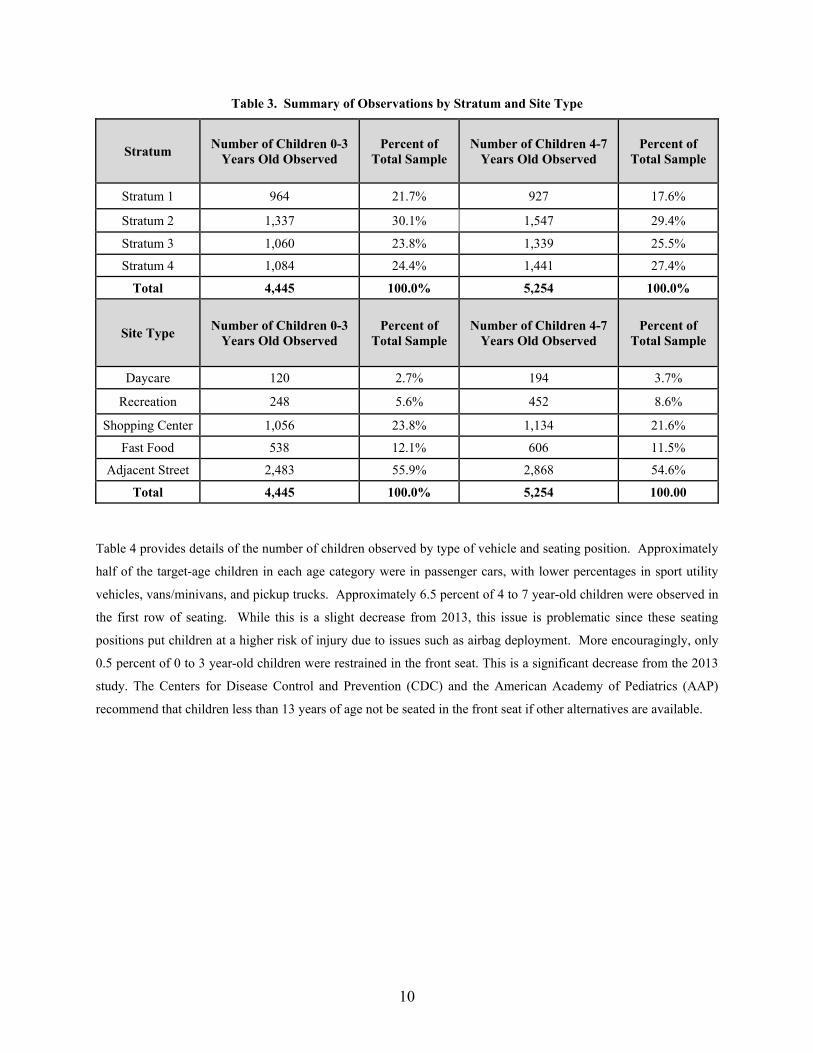
restraint use survey by stratum and site type are provided in Table 3.
10
Table 3. Summary of Observations by Stratum and Site Type
Stratum Number of Children 0-3
Years Old Observed Percent of
Total Sample Number of Children 4-7
Years Old Observed Percent of
Total Sample
Stratum 1 964 21.7% 927 17.6%
Stratum 2 1,337 30.1% 1,547 29.4%
Stratum 3 1,060 23.8% 1,339 25.5%
Stratum 4 1,084 24.4% 1,441 27.4%
Total 4,445 100.0% 5,254 100.0%
Site Type Number of Children 0-3
Years Old Observed Percent of
Total Sample Number of Children 4-7
Years Old Observed Percent of
Total Sample
Daycare 120 2.7% 194 3.7%
Recreation 248 5.6% 452 8.6%
Shopping Center 1,056 23.8% 1,134 21.6%
Fast Food 538 12.1% 606 11.5%
Adjacent Street 2,483 55.9% 2,868 54.6%
Total 4,445 100.0% 5,254 100.00
Table 4 provides details of the number of children observed by type of vehicle and seating position. Approximately
half of the target-age children in each age category were in passenger cars, with lower percentages in sport utility
vehicles, vans/minivans, and pickup trucks. Approximately 6.5 percent of 4 to 7 year-old children were observed in
the first row of seating. While this is a slight decrease from 2013, this issue is problematic since these seating
positions put children at a higher risk of injury due to issues such as airbag deployment. More encouragingly, only
0.5 percent of 0 to 3 year-old children were restrained in the front seat. This is a significant decrease from the 2013
study. The Centers for Disease Control and Prevention (CDC) and the American Academy of Pediatrics (AAP)
recommend that children less than 13 years of age not be seated in the front seat if other alternatives are available.

11
Table 4. Summary of Observations by Vehicle Characteristics
Vehicle Type
Number of Children 0-3
Years Old Observed
Percent of Total Sample
Number of Children 4-7 Years Old
Observed
Percent of Total Sample
Passenger Car 2,379 53.5% 2,677 51.0%
Sport Utility Vehicle 1,283 28.9% 1,432 27.3%
Van/Minivan 656 14.8% 843 16.0%
Pickup Truck 127 2.9% 302 5.7%
Total 4,445 100.0% 5,254 100.0%
Child Passenger Seating Position
Number of Children 0-3
Years Old Observed
Percent of Total Sample
Number of Children 4-7 Years Old
Observed
Percent of Total Sample
First Row - Left 1 0.0% 1 0.0%
First Row - Center 4 0.1% 13 0.2%
First Row - Right 27 0.6% 327 6.2%
Second Row - Left 1,537 34.6% 1,813 34.5%
Second Row - Center 1,000 22.5% 635 12.1%
Second Row - Right 1,859 41.8% 2,399 45.7%
Third Row - Left 6 0.1% 23 0.4%
Third Row - Center 6 0.1% 10 0.2%
Third Row - Right 5 0.1% 33 0.6%
Total 4,445 100.0% 5,254 100.0%
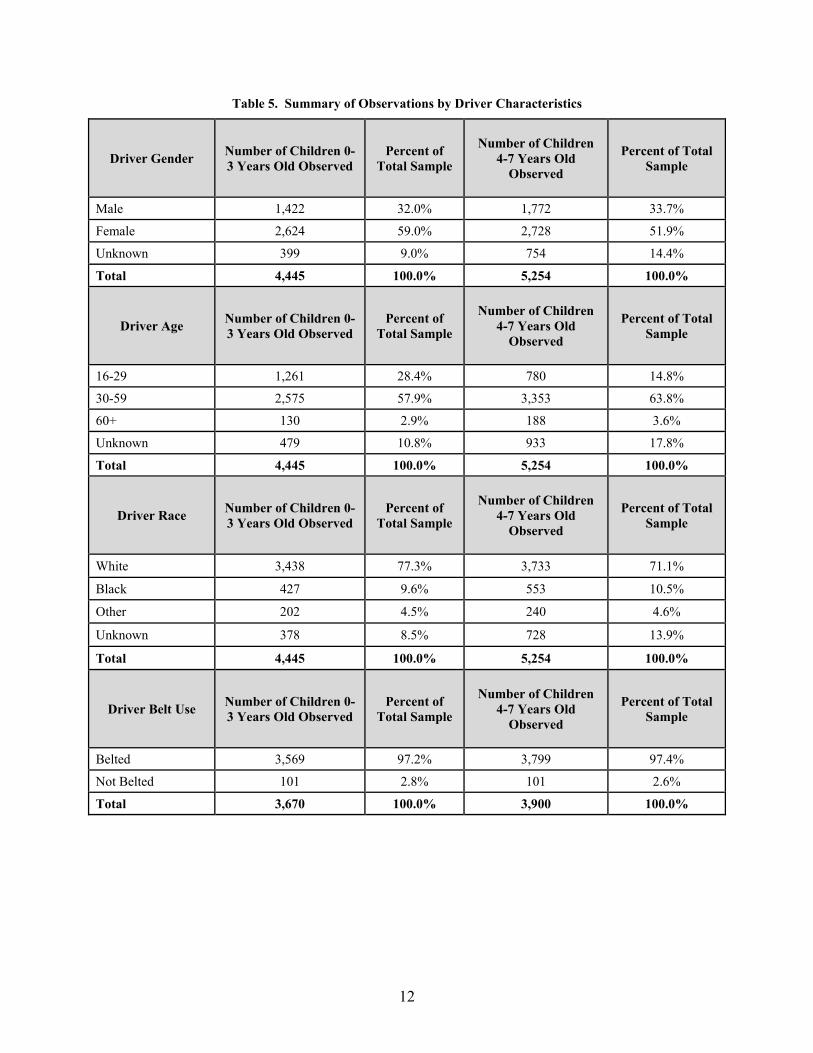
Table 5 presents data on the number of children observed by various driver characteristics, including gender, age,
race, and belt use. Overall, approximately 59.0 percent of children aged 0 to 3 years-old and 51.9 percent of
children aged 4 to 7 years-old were riding with a female driver. The majority of children (61.1 percent) were
traveling with a driver in the 30-to-59 year old age group and approximately 73.9 percent of the children observed
were traveling with a Caucasian driver. Among 4 to 7 year-old children, 97.4 percent were traveling with a driver
who was appropriately belted while 97.2 percent of 0 to 3 year-old children were traveling with an appropriately
restrained driver. Comparison of these rates with recent statewide safety belt use rates (approximately 93 percent),
suggests that drivers are more likely to be properly belted when traveling with child passengers
12
Table 5. Summary of Observations by Driver Characteristics
Driver Gender Number of Children 0-3 Years Old Observed
Percent of Total Sample
Number of Children 4-7 Years Old
Observed
Percent of Total Sample
Male 1,422 32.0% 1,772 33.7%
Female 2,624 59.0% 2,728 51.9%
Unknown 399 9.0% 754 14.4%
Total 4,445 100.0% 5,254 100.0%
Driver Age Number of Children 0-3 Years Old Observed
Percent of Total Sample
Number of Children 4-7 Years Old
Observed
Percent of Total Sample
16-29 1,261 28.4% 780 14.8%
30-59 2,575 57.9% 3,353 63.8%
60+ 130 2.9% 188 3.6%
Unknown 479 10.8% 933 17.8%
Total 4,445 100.0% 5,254 100.0%
Driver Race Number of Children 0-3 Years Old Observed
Percent of Total Sample
Number of Children 4-7 Years Old
Observed
Percent of Total Sample
White 3,438 77.3% 3,733 71.1%
Black 427 9.6% 553 10.5%
Other 202 4.5% 240 4.6%
Unknown 378 8.5% 728 13.9%
Total 4,445 100.0% 5,254 100.0%
Driver Belt Use Number of Children 0-3 Years Old Observed
Percent of Total Sample
Number of Children 4-7 Years Old
Observed
Percent of Total Sample
Belted 3,569 97.2% 3,799 97.4%
Not Belted 101 2.8% 101 2.6%
Total 3,670 100.0% 3,900 100.0%
13
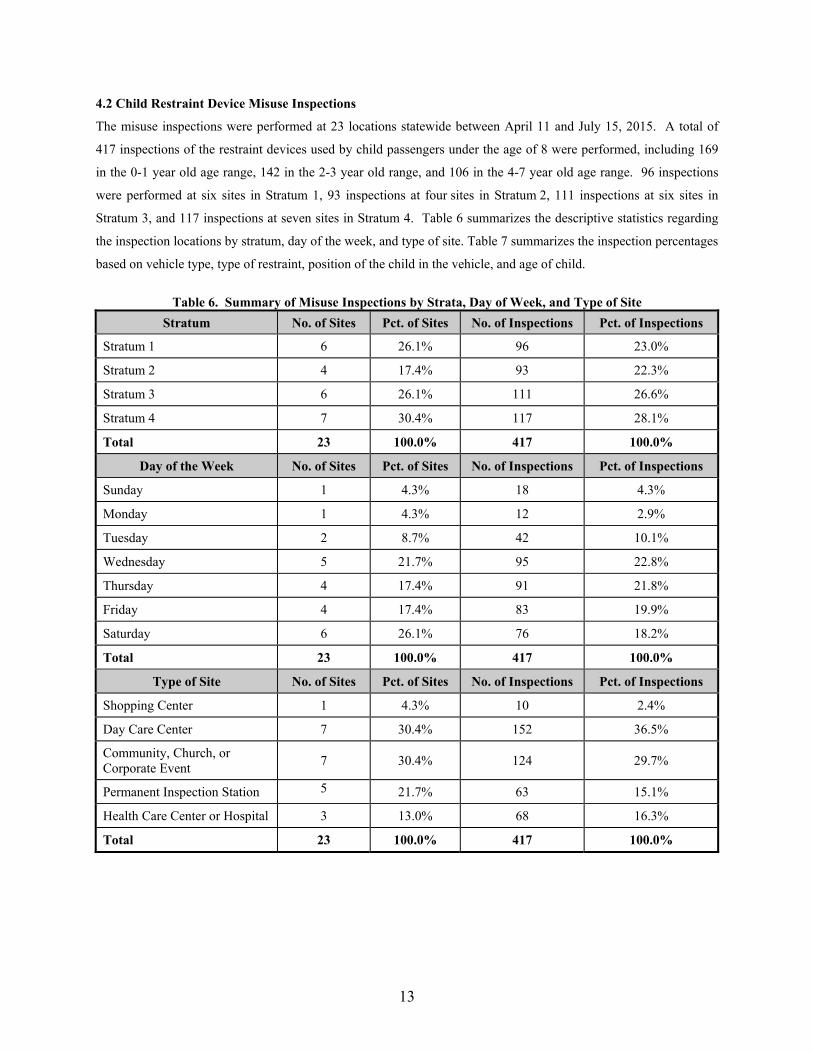
4.2 Child Restraint Device Misuse Inspections
The misuse inspections were performed at 23 locations statewide between April 11 and July 15, 2015. A total of
417 inspections of the restraint devices used by child passengers under the age of 8 were performed, including 169
in the 0-1 year old age range, 142 in the 2-3 year old range, and 106 in the 4-7 year old age range. 96 inspections
were performed at six sites in Stratum 1, 93 inspections at four sites in Stratum 2, 111 inspections at six sites in
Stratum 3, and 117 inspections at seven sites in Stratum 4. Table 6 summarizes the descriptive statistics regarding
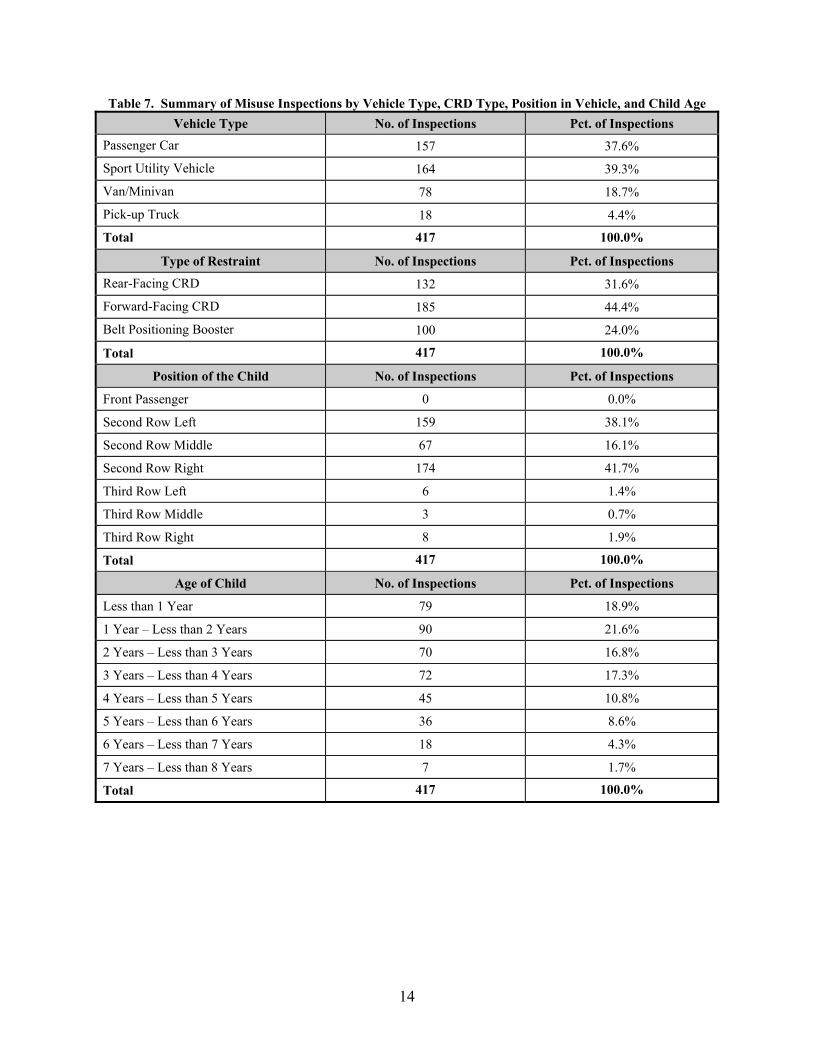
the inspection locations by stratum, day of the week, and type of site. Table 7 summarizes the inspection percentages
based on vehicle type, type of restraint, position of the child in the vehicle, and age of child.
Table 6. Summary of Misuse Inspections by Strata, Day of Week, and Type of Site
Stratum No. of Sites Pct. of Sites No. of Inspections Pct. of Inspections
Stratum 1 6 26.1% 96 23.0%
Stratum 2 4 17.4% 93 22.3%
Stratum 3 6 26.1% 111 26.6%
Stratum 4 7 30.4% 117 28.1%
Total 23 100.0% 417 100.0%
Day of the Week No. of Sites Pct. of Sites No. of Inspections Pct. of Inspections
Sunday 1 4.3% 18 4.3%
Monday 1 4.3% 12 2.9%
Tuesday 2 8.7% 42 10.1%
Wednesday 5 21.7% 95 22.8%
Thursday 4 17.4% 91 21.8%
Friday 4 17.4% 83 19.9%
Saturday 6 26.1% 76 18.2%
Total 23 100.0% 417 100.0%
Type of Site No. of Sites Pct. of Sites No. of Inspections Pct. of Inspections
Shopping Center 1 4.3% 10 2.4%
Day Care Center 7 30.4% 152 36.5%
Community, Church, or Corporate Event
7 30.4% 124 29.7%
Permanent Inspection Station 5 21.7% 63 15.1%
Health Care Center or Hospital 3 13.0% 68 16.3%
Total 23 100.0% 417 100.0%
14
Table 7. Summary of Misuse Inspections by Vehicle Type, CRD Type, Position in Vehicle, and Child Age
Vehicle Type No. of Inspections Pct. of Inspections
Passenger Car 157 37.6%
Sport Utility Vehicle 164 39.3%
Van/Minivan 78 18.7%
Pick-up Truck 18 4.4%
Total 417 100.0%
Type of Restraint No. of Inspections Pct. of Inspections
Rear-Facing CRD 132 31.6%
Forward-Facing CRD 185 44.4%
Belt Positioning Booster 100 24.0%
Total 417 100.0%
Position of the Child No. of Inspections Pct. of Inspections
Front Passenger 0 0.0%
Second Row Left 159 38.1%
Second Row Middle 67 16.1%
Second Row Right 174 41.7%
Third Row Left 6 1.4%
Third Row Middle 3 0.7%
Third Row Right 8 1.9%
Total 417 100.0%
Age of Child No. of Inspections Pct. of Inspections
Less than 1 Year 79 18.9%
1 Year – Less than 2 Years 90 21.6%
2 Years – Less than 3 Years 70 16.8%
3 Years – Less than 4 Years 72 17.3%
4 Years – Less than 5 Years 45 10.8%
5 Years – Less than 6 Years 36 8.6%
6 Years – Less than 7 Years 18 4.3%
7 Years – Less than 8 Years 7 1.7%
Total 417 100.0%
15
5.0 RESULTS
5.1 Statewide and Stratum-Level Child Restraint Device Use Rates
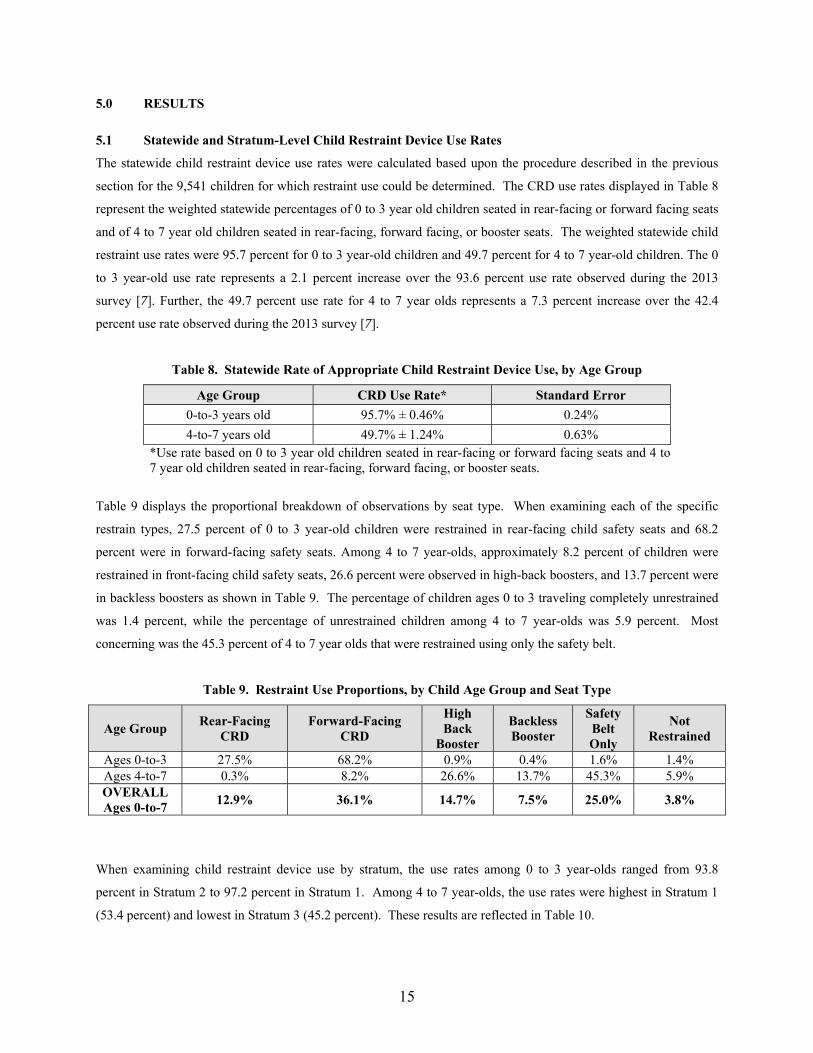
The statewide child restraint device use rates were calculated based upon the procedure described in the previous
section for the 9,541 children for which restraint use could be determined. The CRD use rates displayed in Table 8
represent the weighted statewide percentages of 0 to 3 year old children seated in rear-facing or forward facing seats
and of 4 to 7 year old children seated in rear-facing, forward facing, or booster seats. The weighted statewide child
restraint use rates were 95.7 percent for 0 to 3 year-old children and 49.7 percent for 4 to 7 year-old children. The 0
to 3 year-old use rate represents a 2.1 percent increase over the 93.6 percent use rate observed during the 2013
survey [7]. Further, the 49.7 percent use rate for 4 to 7 year olds represents a 7.3 percent increase over the 42.4
percent use rate observed during the 2013 survey [7].
Table 8. Statewide Rate of Appropriate Child Restraint Device Use, by Age Group
Age Group CRD Use Rate* Standard Error
0-to-3 years old 95.7% ± 0.46% 0.24%
4-to-7 years old 49.7% ± 1.24% 0.63% *Use rate based on 0 to 3 year old children seated in rear-facing or forward facing seats and 4 to 7 year old children seated in rear-facing, forward facing, or booster seats.
Table 9 displays the proportional breakdown of observations by seat type. When examining each of the specific
restrain types, 27.5 percent of 0 to 3 year-old children were restrained in rear-facing child safety seats and 68.2
percent were in forward-facing safety seats. Among 4 to 7 year-olds, approximately 8.2 percent of children were
restrained in front-facing child safety seats, 26.6 percent were observed in high-back boosters, and 13.7 percent were
in backless boosters as shown in Table 9. The percentage of children ages 0 to 3 traveling completely unrestrained
was 1.4 percent, while the percentage of unrestrained children among 4 to 7 year-olds was 5.9 percent. Most
concerning was the 45.3 percent of 4 to 7 year olds that were restrained using only the safety belt.
Table 9. Restraint Use Proportions, by Child Age Group and Seat Type
Age Group Rear-Facing
CRD Forward-Facing
CRD
High Back
Booster
Backless Booster
Safety Belt Only
Not Restrained
Ages 0-to-3 27.5% 68.2% 0.9% 0.4% 1.6% 1.4% Ages 4-to-7 0.3% 8.2% 26.6% 13.7% 45.3% 5.9% OVERALL Ages 0-to-7
12.9% 36.1% 14.7% 7.5% 25.0% 3.8%
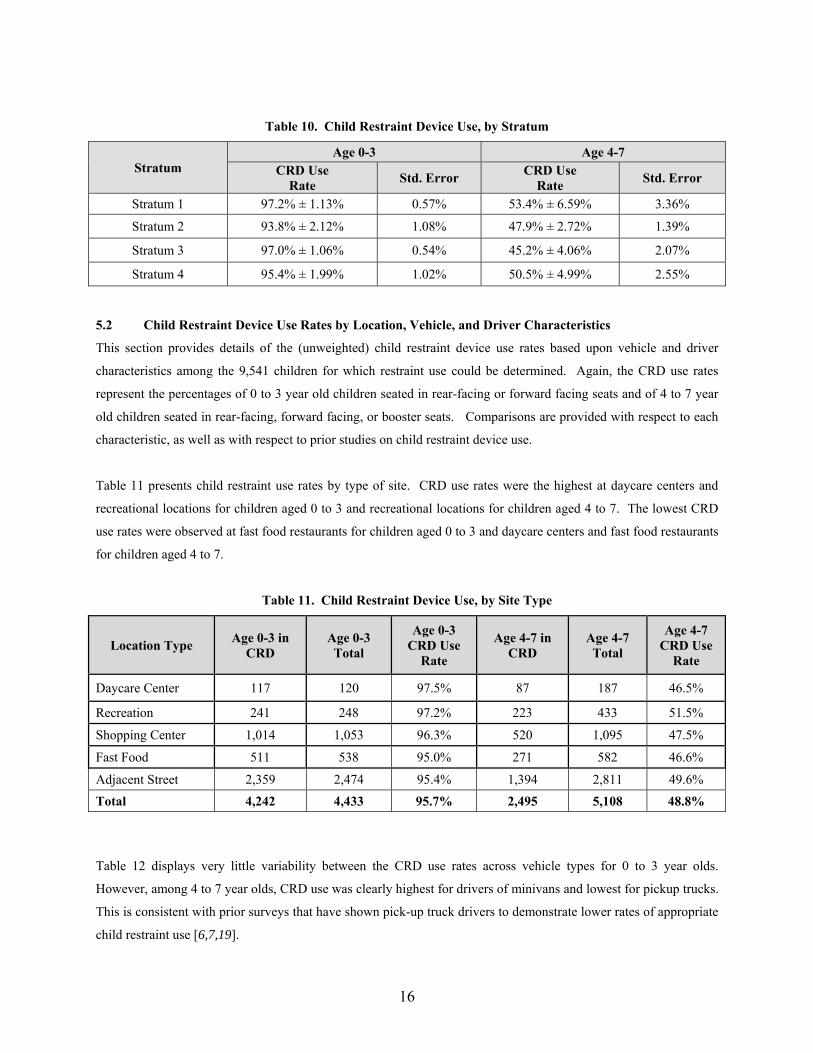
When examining child restraint device use by stratum, the use rates among 0 to 3 year-olds ranged from 93.8
percent in Stratum 2 to 97.2 percent in Stratum 1. Among 4 to 7 year-olds, the use rates were highest in Stratum 1
(53.4 percent) and lowest in Stratum 3 (45.2 percent). These results are reflected in Table 10.
16
Table 10. Child Restraint Device Use, by Stratum
Stratum Age 0-3 Age 4-7
CRD Use Rate
Std. Error CRD Use
Rate Std. Error
Stratum 1 97.2% ± 1.13% 0.57% 53.4% ± 6.59% 3.36%
Stratum 2 93.8% ± 2.12% 1.08% 47.9% ± 2.72% 1.39%
Stratum 3 97.0% ± 1.06% 0.54% 45.2% ± 4.06% 2.07%
Stratum 4 95.4% ± 1.99% 1.02% 50.5% ± 4.99% 2.55%
5.2 Child Restraint Device Use Rates by Location, Vehicle, and Driver Characteristics
This section provides details of the (unweighted) child restraint device use rates based upon vehicle and driver
characteristics among the 9,541 children for which restraint use could be determined. Again, the CRD use rates
represent the percentages of 0 to 3 year old children seated in rear-facing or forward facing seats and of 4 to 7 year
old children seated in rear-facing, forward facing, or booster seats. Comparisons are provided with respect to each
characteristic, as well as with respect to prior studies on child restraint device use.
Table 11 presents child restraint use rates by type of site. CRD use rates were the highest at daycare centers and
recreational locations for children aged 0 to 3 and recreational locations for children aged 4 to 7. The lowest CRD
use rates were observed at fast food restaurants for children aged 0 to 3 and daycare centers and fast food restaurants
for children aged 4 to 7.
Table 11. Child Restraint Device Use, by Site Type
Location Type Age 0-3 in
CRD Age 0-3 Total
Age 0-3 CRD Use
Rate
Age 4-7 in CRD
Age 4-7 Total
Age 4-7 CRD Use
Rate
Daycare Center 117 120 97.5% 87 187 46.5%
Recreation 241 248 97.2% 223 433 51.5%
Shopping Center 1,014 1,053 96.3% 520 1,095 47.5%
Fast Food 511 538 95.0% 271 582 46.6%
Adjacent Street 2,359 2,474 95.4% 1,394 2,811 49.6%
Total 4,242 4,433 95.7% 2,495 5,108 48.8%
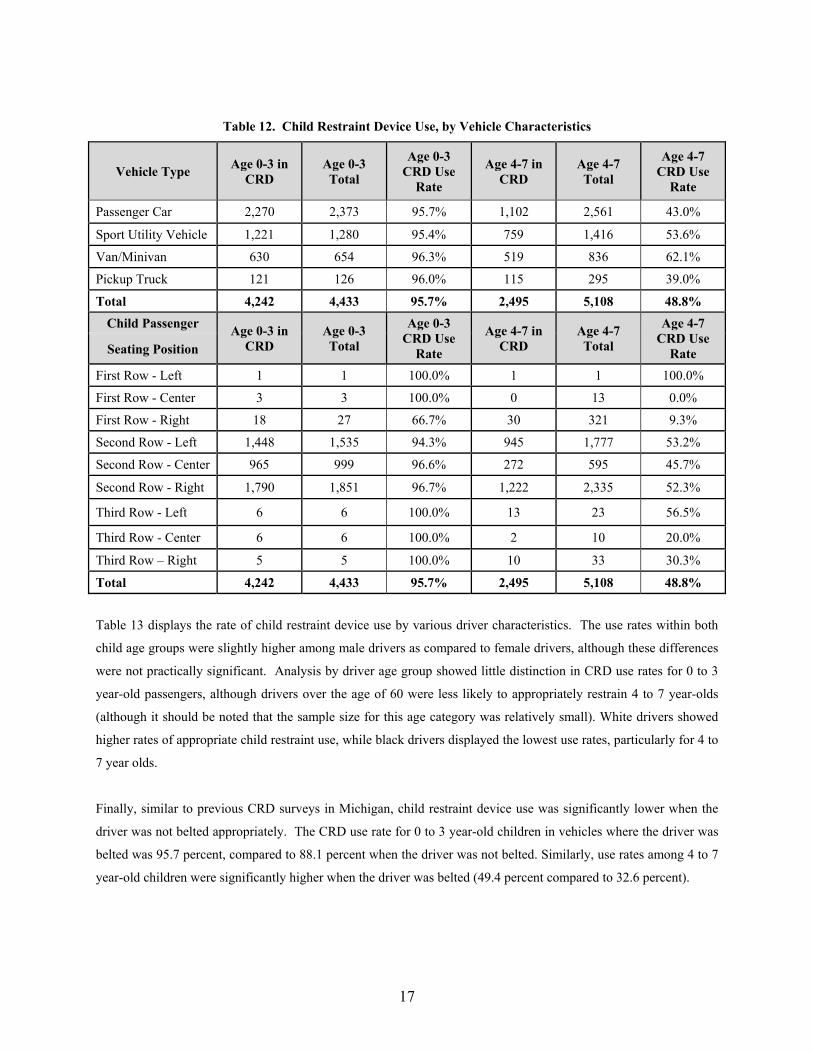
Table 12 displays very little variability between the CRD use rates across vehicle types for 0 to 3 year olds.
However, among 4 to 7 year olds, CRD use was clearly highest for drivers of minivans and lowest for pickup trucks.
This is consistent with prior surveys that have shown pick-up truck drivers to demonstrate lower rates of appropriate
child restraint use [6,7,19].
17
Table 12. Child Restraint Device Use, by Vehicle Characteristics
Vehicle Type Age 0-3 in
CRD Age 0-3 Total
Age 0-3 CRD Use
Rate
Age 4-7 in CRD
Age 4-7 Total
Age 4-7 CRD Use
Rate
Passenger Car 2,270 2,373 95.7% 1,102 2,561 43.0%
Sport Utility Vehicle 1,221 1,280 95.4% 759 1,416 53.6%
Van/Minivan 630 654 96.3% 519 836 62.1%
Pickup Truck 121 126 96.0% 115 295 39.0%
Total 4,242 4,433 95.7% 2,495 5,108 48.8%
Child Passenger Age 0-3 in
CRD Age 0-3 Total
Age 0-3 CRD Use
Rate
Age 4-7 in CRD
Age 4-7 Total
Age 4-7 CRD Use
Rate Seating Position
First Row - Left 1 1 100.0% 1 1 100.0%
First Row - Center 3 3 100.0% 0 13 0.0%
First Row - Right 18 27 66.7% 30 321 9.3%
Second Row - Left 1,448 1,535 94.3% 945 1,777 53.2%
Second Row - Center 965 999 96.6% 272 595 45.7%
Second Row - Right 1,790 1,851 96.7% 1,222 2,335 52.3%
Third Row - Left 6 6 100.0% 13 23 56.5%
Third Row - Center 6 6 100.0% 2 10 20.0%
Third Row – Right 5 5 100.0% 10 33 30.3%
Total 4,242 4,433 95.7% 2,495 5,108 48.8%
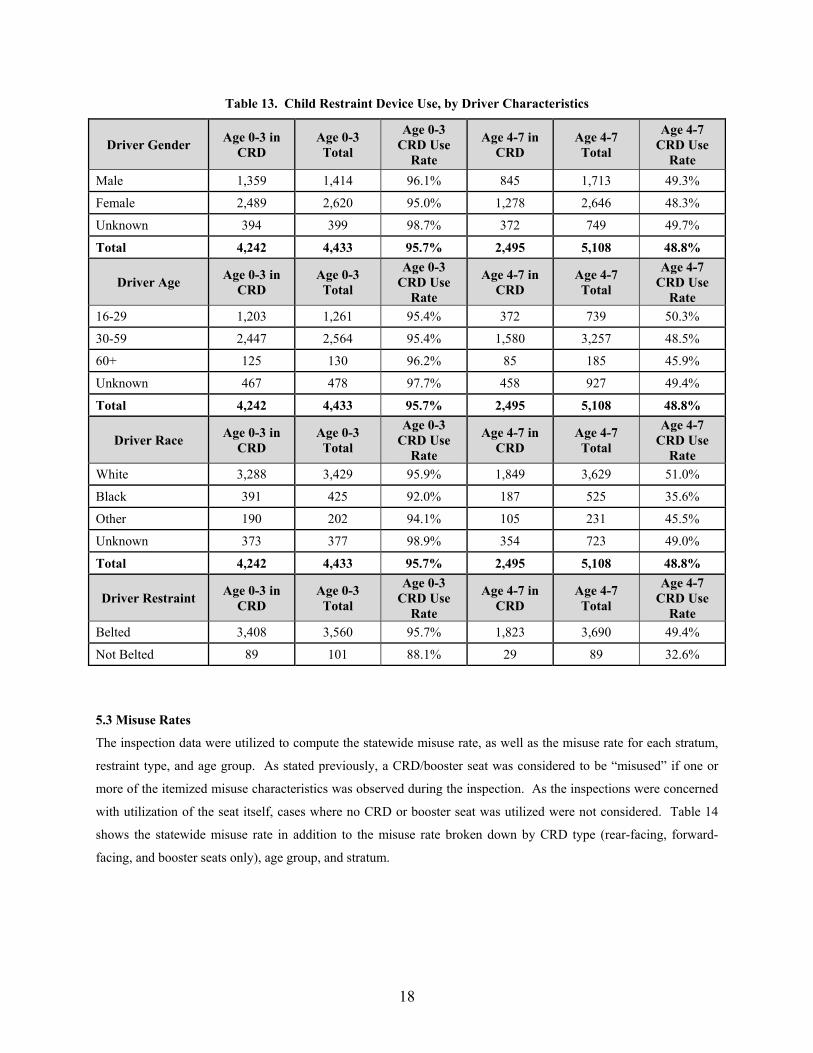
Table 13 displays the rate of child restraint device use by various driver characteristics. The use rates within both
child age groups were slightly higher among male drivers as compared to female drivers, although these differences
were not practically significant. Analysis by driver age group showed little distinction in CRD use rates for 0 to 3
year-old passengers, although drivers over the age of 60 were less likely to appropriately restrain 4 to 7 year-olds
(although it should be noted that the sample size for this age category was relatively small). White drivers showed
higher rates of appropriate child restraint use, while black drivers displayed the lowest use rates, particularly for 4 to
7 year olds.
Finally, similar to previous CRD surveys in Michigan, child restraint device use was significantly lower when the
driver was not belted appropriately. The CRD use rate for 0 to 3 year-old children in vehicles where the driver was
belted was 95.7 percent, compared to 88.1 percent when the driver was not belted. Similarly, use rates among 4 to 7
year-old children were significantly higher when the driver was belted (49.4 percent compared to 32.6 percent).
18
Table 13. Child Restraint Device Use, by Driver Characteristics
Driver Gender Age 0-3 in
CRD Age 0-3 Total
Age 0-3 CRD Use
Rate
Age 4-7 in CRD
Age 4-7 Total
Age 4-7 CRD Use
Rate
Male 1,359 1,414 96.1% 845 1,713 49.3%
Female 2,489 2,620 95.0% 1,278 2,646 48.3%
Unknown 394 399 98.7% 372 749 49.7%
Total 4,242 4,433 95.7% 2,495 5,108 48.8%
Driver Age Age 0-3 in
CRD Age 0-3 Total
Age 0-3 CRD Use
Rate
Age 4-7 in CRD
Age 4-7 Total
Age 4-7 CRD Use
Rate
16-29 1,203 1,261 95.4% 372 739 50.3%
30-59 2,447 2,564 95.4% 1,580 3,257 48.5%
60+ 125 130 96.2% 85 185 45.9%
Unknown 467 478 97.7% 458 927 49.4%
Total 4,242 4,433 95.7% 2,495 5,108 48.8%
Driver Race Age 0-3 in
CRD Age 0-3 Total
Age 0-3 CRD Use
Rate
Age 4-7 in CRD
Age 4-7 Total
Age 4-7 CRD Use
Rate
White 3,288 3,429 95.9% 1,849 3,629 51.0%
Black 391 425 92.0% 187 525 35.6%
Other 190 202 94.1% 105 231 45.5%
Unknown 373 377 98.9% 354 723 49.0%
Total 4,242 4,433 95.7% 2,495 5,108 48.8%
Driver Restraint Age 0-3 in
CRD Age 0-3 Total
Age 0-3 CRD Use
Rate
Age 4-7 in CRD
Age 4-7 Total
Age 4-7 CRD Use
Rate
Belted 3,408 3,560 95.7% 1,823 3,690 49.4%
Not Belted 89 101 88.1% 29 89 32.6%
5.3 Misuse Rates
The inspection data were utilized to compute the statewide misuse rate, as well as the misuse rate for each stratum,
restraint type, and age group. As stated previously, a CRD/booster seat was considered to be “misused” if one or
more of the itemized misuse characteristics was observed during the inspection. As the inspections were concerned
with utilization of the seat itself, cases where no CRD or booster seat was utilized were not considered. Table 14
shows the statewide misuse rate in addition to the misuse rate broken down by CRD type (rear-facing, forward-
facing, and booster seats only), age group, and stratum.

19
Table 14. Child Restraint Device Misuse Rates
Type of CRD No. of Inspections Correct Use Rate Misuse Rate
Rear-Facing 132 18.9% 81.1%
Forward Facing 185 20.0% 80.0%
Belt Positioning Booster Seat 100 40.0% 60.0%
Age Group No. of Inspections Correct Use Rate Misuse Rate
0 - 3 311 19.9% 80.1%
4 - 7 106 29.7% 70.3%
Stratum No. of Inspections Correct Use Rate Misuse Rate
Stratum 1 96 26.0% 74.0%
Stratum 2 93 24.7% 75.3%
Stratum 3 111 26.1% 73.9%
Stratum 4 117 21.4% 78.6%
Statewide (Weighted)* 417 26.0% 74.0%
*Weighted based on seat use proportions from direct observation survey of 18.1%, 50.7%, and 31.2% for rear-facing, forward-facing, and booster seats, respectively.
Statewide, only 26.0 percent of the inspections of the restraint characteristics of children under age 8 showed
utilization of the appropriate CRD, correct CRD installation, and correct restraint of the child within the CRD. The
remaining 74.0 percent of the inspections showed one or more improper restraint characteristics (i.e., misuses),
which represents the overall weighted statewide misuse rate for children under the age of 8. The overall misuse rate
is similar to the 74.9 percent observed during the 2013 inspections. The overall misuse rate for children under 4 was
80.1 percent, which decreased to 70.3 percent for children ages 4 to 7. Only marginal differences were observed
between misuse rates for the four strata. Rear-facing CRDs had an overall misuse rate of 81.1 percent, which was
considerably lower than the 87.8 percent observed during 2013. However, forward facing CRDs showed slight
increases in misuse, increasing from 77.2 in 2013 to 80.0 percent in 2015. As expected, the lowest observed misuse
rates were for children seated in booster seats, with a misuse rate was 60.0 percent, which was similar to that
observed in the 2013 inspections. Booster seats have historically had lower rates of misuse compared to rear and
forward facing CRDs, which is likely due to the relative simplicity of booster seat utilization compared to the other
CRDs. Itemized misuse rates were also computed based on several different characteristics of the CRD use and
installation and restraint of the child within the CRD. Table 15 provides a summary of the correct and incorrect
CRD selection and position percentages based on the child’s age, height, weight, and orientation of the CRD within
the vehicle.

20
Table 15. Child Restraint Device Selection and Seat Orientation Characteristics CRD Characteristic Percent Correct Percent Incorrect
Restraint appropriate for child’s age* 84.9% 15.1%
Restraint appropriate for child’s height 91.4% 8.6%
Restraint appropriate for child’s weight** 95.0% 5.0%
CRD facing proper direction for child’s age/weight*,** 86.4% 13.6%
Seat intended to be used in direction installed** 97.8% 2.2%
CRD installed on a forward-facing vehicle seat 100.0% 0.0%
*Forward facing seat utilization is considered misuse for children under the age of 2. Booster seat utilization is considered misuse for children under the age of 4. **Includes rear and forward facing CRDs only. Booster seats are not included.
Table 15 shows the CRD selection and orientation were typically appropriate for the child’s age, height, and weight.
These values are similar to those observed in the 2013 inspections. The most common CRD selection misuse was
inappropriate seat selection based on age, due in large part to the premature transition of children between the ages
of 1 and 2 into forward facing CRDs. This issue is further delineated in Table 16, which displays the types of seats
utilized by each age group.
Table 16. Child Restraint Device Selection, by Age of Child
Age Rear-Facing CRD Forward-Facing CRD Booster Seat
No. Pct. No. Pct. No. Pct.
0 77 58.3% 2 1.1% 0 0.0%
1 48 36.4% 41 22.2% 1 1.0%
2 5 3.8% 59 31.9% 6 6.0%
3 2 1.5% 57 30.8% 13 13.0%
4 0 0.0% 17 9.2% 28 28.0%
5 0 0.0% 6 3.2% 30 30.0%
6 0 0.0% 3 1.6% 15 15.0%
7 0 0.0% 0 0.0% 7 7.0%
Note: Cases of premature transitioning into the next restraint level based on age are shown in bold
It can be observed from Table 16 that 26 percent children were prematurely transitioned into a forward-facing CRD
prior to the age of 2, which is the minimum age recommended by the American Association of Pediatrics (AAP)
[22]. This is especially problematic for 1-year old children, of which 46.7 percent were seated (prematurely) in a
forward-facing CRD. Similarly, 18.1 percent of 3-year old children had been prematurely transitioned into a
booster seat, which should not occur until the child has reached at least 4 years of age. Itemized booster seat misuse
rates are summarized in Table 17. The remaining itemized misuse rates were separated into rear-facing CRD
misuses and forward-facing CRD misuses, which are summarized in Table 18.
21
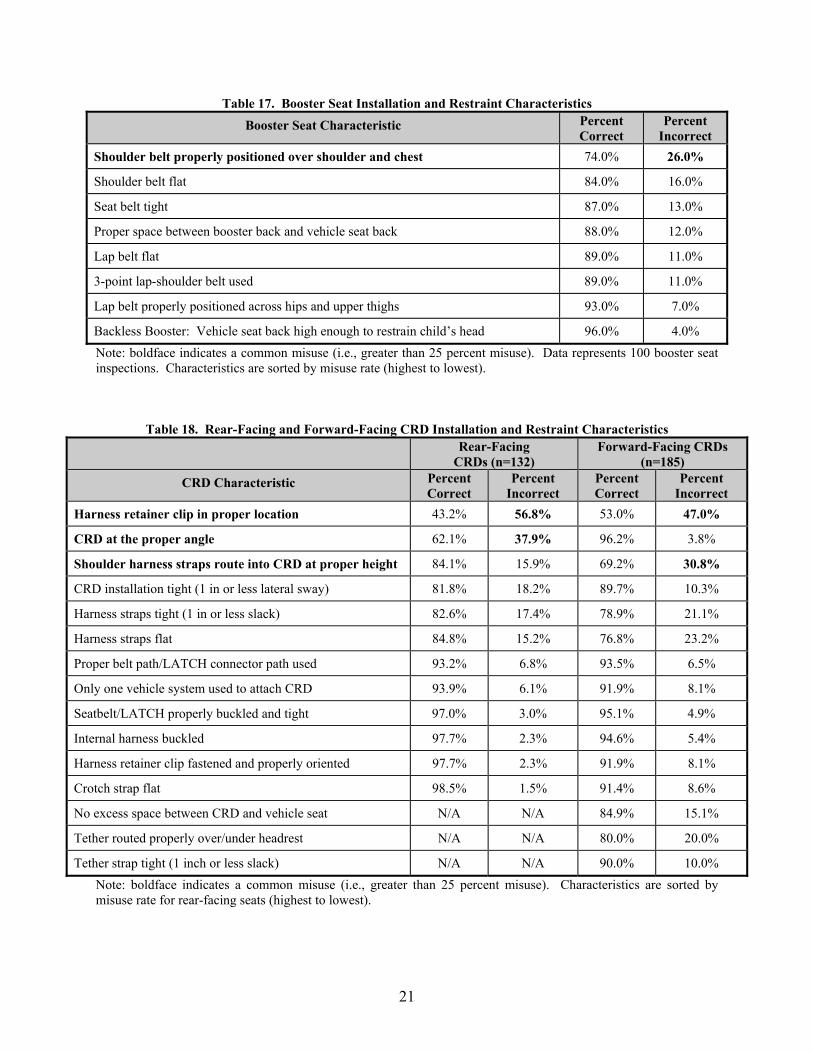
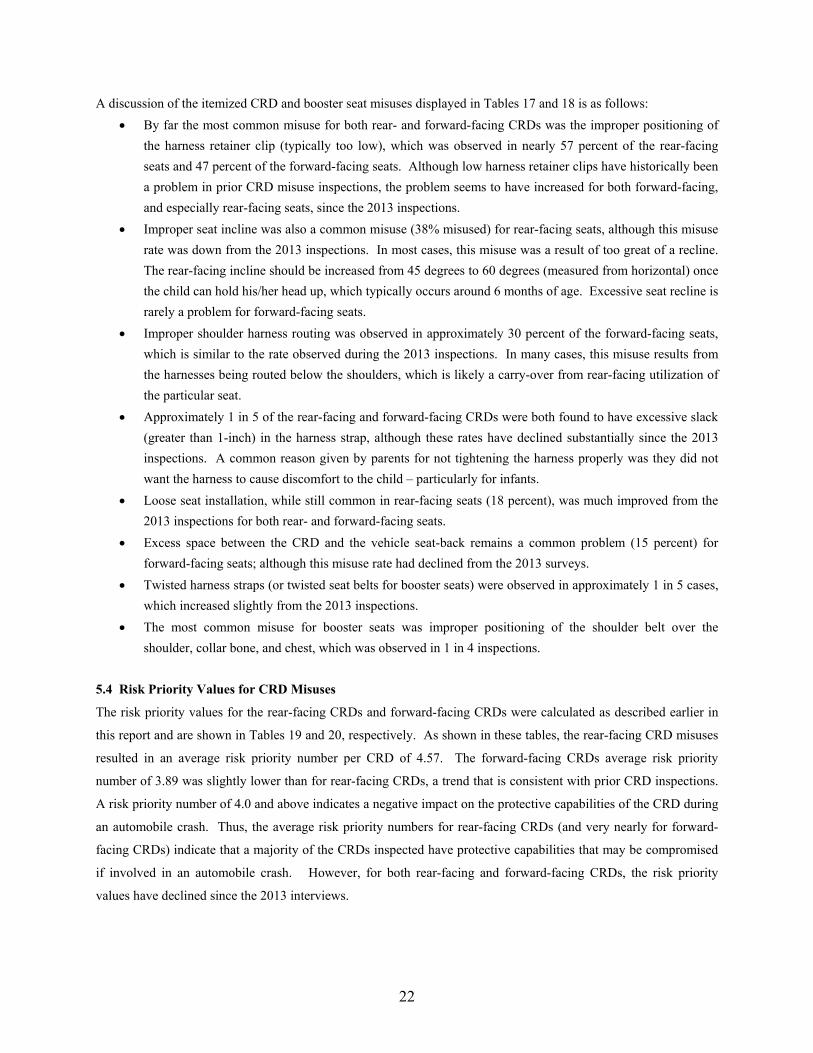
Table 17. Booster Seat Installation and Restraint Characteristics
Booster Seat Characteristic Percent Correct
Percent Incorrect
Shoulder belt properly positioned over shoulder and chest 74.0% 26.0%
Shoulder belt flat 84.0% 16.0%
Seat belt tight 87.0% 13.0%
Proper space between booster back and vehicle seat back 88.0% 12.0%
Lap belt flat 89.0% 11.0%
3-point lap-shoulder belt used 89.0% 11.0%
Lap belt properly positioned across hips and upper thighs 93.0% 7.0%
Backless Booster: Vehicle seat back high enough to restrain child’s head 96.0% 4.0%
Note: boldface indicates a common misuse (i.e., greater than 25 percent misuse). Data represents 100 booster seat inspections. Characteristics are sorted by misuse rate (highest to lowest).
Table 18. Rear-Facing and Forward-Facing CRD Installation and Restraint Characteristics
Rear-Facing CRDs (n=132)
Forward-Facing CRDs (n=185)
CRD Characteristic Percent Correct
Percent Incorrect
Percent Correct
Percent Incorrect
Harness retainer clip in proper location 43.2% 56.8% 53.0% 47.0%
CRD at the proper angle 62.1% 37.9% 96.2% 3.8%
Shoulder harness straps route into CRD at proper height 84.1% 15.9% 69.2% 30.8%
CRD installation tight (1 in or less lateral sway) 81.8% 18.2% 89.7% 10.3%
Harness straps tight (1 in or less slack) 82.6% 17.4% 78.9% 21.1%
Harness straps flat 84.8% 15.2% 76.8% 23.2%
Proper belt path/LATCH connector path used 93.2% 6.8% 93.5% 6.5%
Only one vehicle system used to attach CRD 93.9% 6.1% 91.9% 8.1%
Seatbelt/LATCH properly buckled and tight 97.0% 3.0% 95.1% 4.9%
Internal harness buckled 97.7% 2.3% 94.6% 5.4%
Harness retainer clip fastened and properly oriented 97.7% 2.3% 91.9% 8.1%
Crotch strap flat 98.5% 1.5% 91.4% 8.6%
No excess space between CRD and vehicle seat N/A N/A 84.9% 15.1%
Tether routed properly over/under headrest N/A N/A 80.0% 20.0%
Tether strap tight (1 inch or less slack) N/A N/A 90.0% 10.0%
Note: boldface indicates a common misuse (i.e., greater than 25 percent misuse). Characteristics are sorted by misuse rate for rear-facing seats (highest to lowest).
22
A discussion of the itemized CRD and booster seat misuses displayed in Tables 17 and 18 is as follows:
By far the most common misuse for both rear- and forward-facing CRDs was the improper positioning of
the harness retainer clip (typically too low), which was observed in nearly 57 percent of the rear-facing
seats and 47 percent of the forward-facing seats. Although low harness retainer clips have historically been
a problem in prior CRD misuse inspections, the problem seems to have increased for both forward-facing,
and especially rear-facing seats, since the 2013 inspections.
Improper seat incline was also a common misuse (38% misused) for rear-facing seats, although this misuse
rate was down from the 2013 inspections. In most cases, this misuse was a result of too great of a recline.
The rear-facing incline should be increased from 45 degrees to 60 degrees (measured from horizontal) once
the child can hold his/her head up, which typically occurs around 6 months of age. Excessive seat recline is
rarely a problem for forward-facing seats.
Improper shoulder harness routing was observed in approximately 30 percent of the forward-facing seats,
which is similar to the rate observed during the 2013 inspections. In many cases, this misuse results from
the harnesses being routed below the shoulders, which is likely a carry-over from rear-facing utilization of
the particular seat.
Approximately 1 in 5 of the rear-facing and forward-facing CRDs were both found to have excessive slack
(greater than 1-inch) in the harness strap, although these rates have declined substantially since the 2013
inspections. A common reason given by parents for not tightening the harness properly was they did not
want the harness to cause discomfort to the child – particularly for infants.
Loose seat installation, while still common in rear-facing seats (18 percent), was much improved from the
2013 inspections for both rear- and forward-facing seats.
Excess space between the CRD and the vehicle seat-back remains a common problem (15 percent) for
forward-facing seats; although this misuse rate had declined from the 2013 surveys.
Twisted harness straps (or twisted seat belts for booster seats) were observed in approximately 1 in 5 cases,
which increased slightly from the 2013 inspections.
The most common misuse for booster seats was improper positioning of the shoulder belt over the
shoulder, collar bone, and chest, which was observed in 1 in 4 inspections.
5.4 Risk Priority Values for CRD Misuses
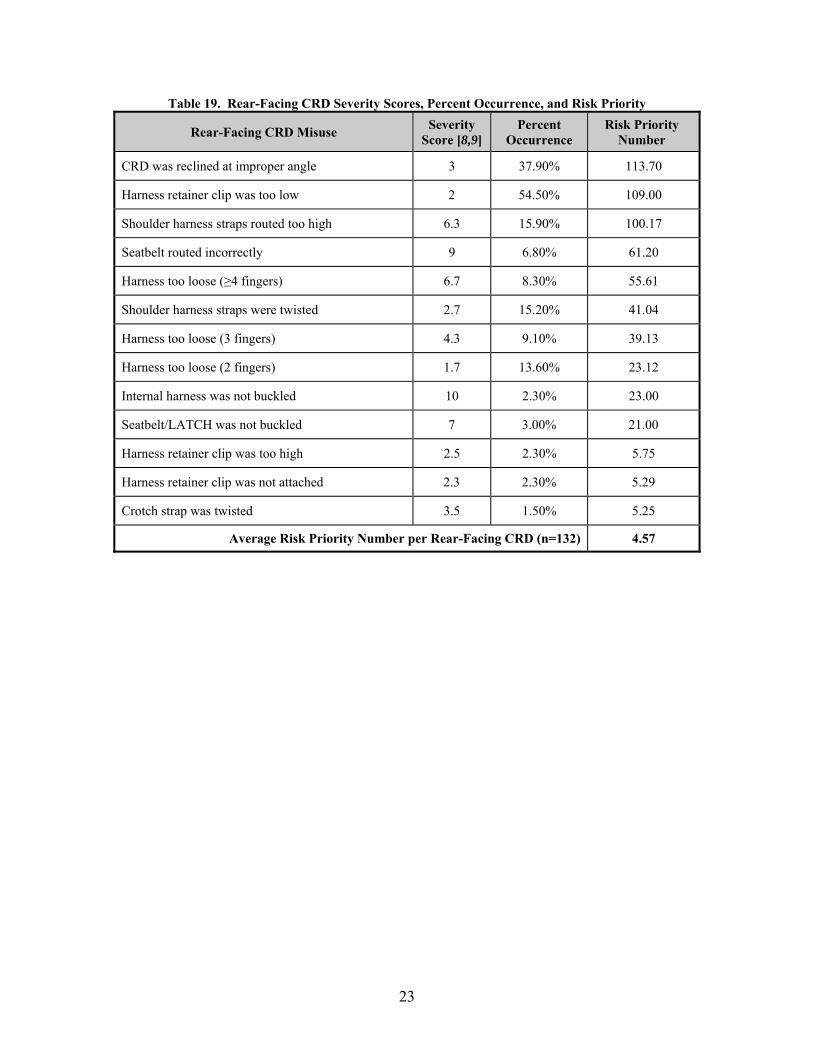
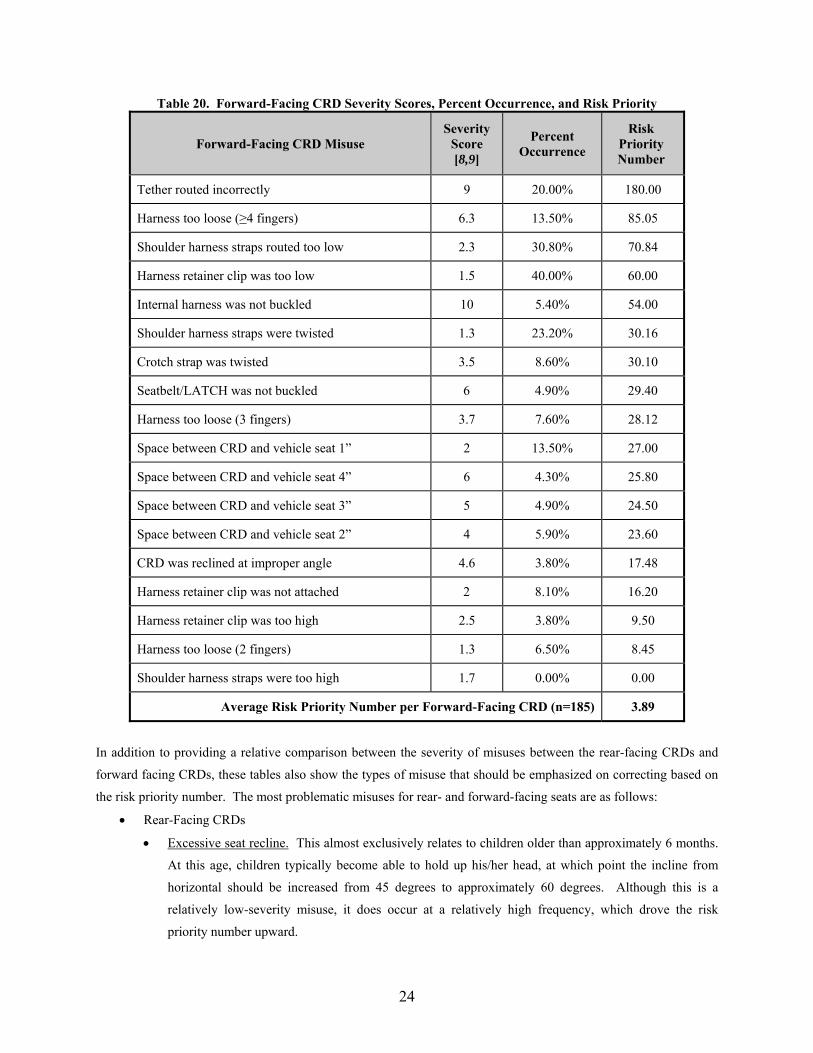
The risk priority values for the rear-facing CRDs and forward-facing CRDs were calculated as described earlier in
this report and are shown in Tables 19 and 20, respectively. As shown in these tables, the rear-facing CRD misuses
resulted in an average risk priority number per CRD of 4.57. The forward-facing CRDs average risk priority
number of 3.89 was slightly lower than for rear-facing CRDs, a trend that is consistent with prior CRD inspections.
A risk priority number of 4.0 and above indicates a negative impact on the protective capabilities of the CRD during
an automobile crash. Thus, the average risk priority numbers for rear-facing CRDs (and very nearly for forward-
facing CRDs) indicate that a majority of the CRDs inspected have protective capabilities that may be compromised
if involved in an automobile crash. However, for both rear-facing and forward-facing CRDs, the risk priority
values have declined since the 2013 interviews.
23
Table 19. Rear-Facing CRD Severity Scores, Percent Occurrence, and Risk Priority
Rear-Facing CRD Misuse Severity
Score [8,9] Percent
Occurrence Risk Priority
Number
CRD was reclined at improper angle 3 37.90% 113.70
Harness retainer clip was too low 2 54.50% 109.00
Shoulder harness straps routed too high 6.3 15.90% 100.17
Seatbelt routed incorrectly 9 6.80% 61.20
Harness too loose (≥4 fingers) 6.7 8.30% 55.61
Shoulder harness straps were twisted 2.7 15.20% 41.04
Harness too loose (3 fingers) 4.3 9.10% 39.13
Harness too loose (2 fingers) 1.7 13.60% 23.12
Internal harness was not buckled 10 2.30% 23.00
Seatbelt/LATCH was not buckled 7 3.00% 21.00
Harness retainer clip was too high 2.5 2.30% 5.75
Harness retainer clip was not attached 2.3 2.30% 5.29
Crotch strap was twisted 3.5 1.50% 5.25
Average Risk Priority Number per Rear-Facing CRD (n=132) 4.57
24
Table 20. Forward-Facing CRD Severity Scores, Percent Occurrence, and Risk Priority
Forward-Facing CRD Misuse Severity
Score [8,9]
Percent Occurrence
Risk Priority Number
Tether routed incorrectly 9 20.00% 180.00
Harness too loose (≥4 fingers) 6.3 13.50% 85.05
Shoulder harness straps routed too low 2.3 30.80% 70.84
Harness retainer clip was too low 1.5 40.00% 60.00
Internal harness was not buckled 10 5.40% 54.00
Shoulder harness straps were twisted 1.3 23.20% 30.16
Crotch strap was twisted 3.5 8.60% 30.10
Seatbelt/LATCH was not buckled 6 4.90% 29.40
Harness too loose (3 fingers) 3.7 7.60% 28.12
Space between CRD and vehicle seat 1” 2 13.50% 27.00
Space between CRD and vehicle seat 4” 6 4.30% 25.80
Space between CRD and vehicle seat 3” 5 4.90% 24.50
Space between CRD and vehicle seat 2” 4 5.90% 23.60
CRD was reclined at improper angle 4.6 3.80% 17.48
Harness retainer clip was not attached 2 8.10% 16.20
Harness retainer clip was too high 2.5 3.80% 9.50
Harness too loose (2 fingers) 1.3 6.50% 8.45
Shoulder harness straps were too high 1.7 0.00% 0.00
Average Risk Priority Number per Forward-Facing CRD (n=185) 3.89
In addition to providing a relative comparison between the severity of misuses between the rear-facing CRDs and
forward facing CRDs, these tables also show the types of misuse that should be emphasized on correcting based on
the risk priority number. The most problematic misuses for rear- and forward-facing seats are as follows:
Rear-Facing CRDs
Excessive seat recline. This almost exclusively relates to children older than approximately 6 months.
At this age, children typically become able to hold up his/her head, at which point the incline from
horizontal should be increased from 45 degrees to approximately 60 degrees. Although this is a
relatively low-severity misuse, it does occur at a relatively high frequency, which drove the risk
priority number upward.

25
Harness retainer clip too low. Although the severity score is relatively low, this was by far the most
frequent misuse for both rear-facing and forward-facing CRDs.
Shoulder harness straps routed too high. This is the most severe of the higher risk rear-facing misuses,
although the rate of occurrence is relatively low. Shoulder harness straps in rear-facing seats should be
routed at or below the child’s shoulders to help prevent ejection from the seat.
Seatbelt routed incorrectly. Incorrect routing of the seat belt through the seat is a very high severity
misuse, which was observed in nearly 7 percent of rear-facing CRDs.
Forward-Facing CRDs
Improper routing of top tether. The most problematic misuse for forward-facing CRDs was the
improper routing of the top tether with respect to the vehicle headrest. This is both a severe and
common misuse. The top tether should be routed over a fixed headrest and under a movable headrest.
Excessive harness slack. Another problematic forward-facing CRD misuse was excessive harness
slack. The severity of this misuse obviously becomes greater as the harness loosens. An improperly
tightened harness may potentially allow for the child to eject from the CRD in the event of a crash.
Shoulder harness straps routed too low. Shoulder harness straps should be at or above the shoulders
for forward-facing CRDs. Although this was a relatively low severity misuse, it was common.
Harness retainer clip positioned too low. A low harness retainer clip may allow for the child to be
ejected from the CRD in the event of a crash. This was also a relatively low severity misuse, but was
the most common forward-facing CRD misuse.
Internal harness was not buckled. Alarmingly, the internal harnesses were not buckled in
approximately 1 in 20 forward-facing CRDs. Not buckling of the internal harness creates a high
likelihood of ejection in the event of a crash.
5.5 LATCH Utilization
The observers also noted whether or not the LATCH system was available within the vehicle and, if so, whether or
not the LATCH anchors were being utilized to restrain the CRD. Table 21 presents data on utilization of the
LATCH system obtained from the inspections.
Table 21. LATCH Availability and Utilization
CRD Type Pct. of Vehicles
Equipped with LATCH Pct. of Equipped
Vehicles Using LATCH Pct. of All Vehicles
Using LATCH
Rear-Facing 93.7% 41.5% 38.9%
Forward-Facing 88.7% 31.2% 27.7%
Total 90.8% 35.6% 32.3%
The LATCH system was utilized to secure the CRD in 32.3 of the inspected vehicles, even though 90.8 percent of
all inspected vehicles were LATCH equipped. Although they greatly simplify the CRD attachment process,
26
LATCH was utilized in only 35.6 percent of equipped vehicles. The percent of vehicles equipped with LATCH has
increased greatly from the 75.4 percent observed during the 2013 inspections, while the percent of LATCH
utilization among equipped vehicles has declined.
6.0 CONCLUSIONS AND RECOMMENDATIONS
The purpose of this study was to determine the statewide rates of appropriate child restraint device use and misuse
among child passengers from ages 0 through 7. The child restraint use rates were determined through a direct
observation survey conducted at daycare centers, fast food restaurants, shopping centers, recreational areas, and
general roadside locations throughout the state of Michigan. Misuse rates were determined through in-vehicle
inspections conducted at daycare centers, inspection stations, and various organized events, including those held at
shopping centers, community or church festivals, or health care facilities.
6.1 Conclusions
6.1.1 CRD/Booster Utilization
The statewide child restraint device roadside direct observation survey was performed between Saturday, May 9,
2015 and Wednesday, July 29, 2015. During this observation period, a total of 9,699 observations of 0 to 7 year-old
child passengers were conducted at daycare centers, fast food restaurants, shopping centers, and recreation centers,
as well as on streets adjacent to these locations throughout the 23-county sample.
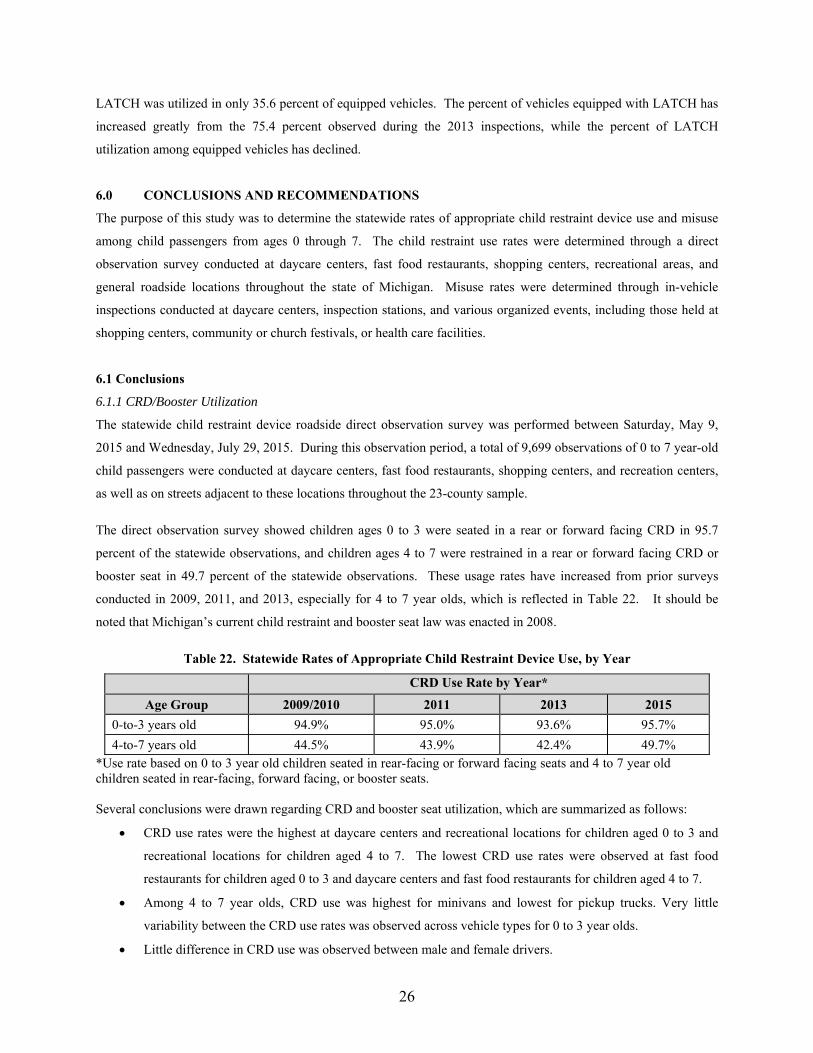
The direct observation survey showed children ages 0 to 3 were seated in a rear or forward facing CRD in 95.7
percent of the statewide observations, and children ages 4 to 7 were restrained in a rear or forward facing CRD or
booster seat in 49.7 percent of the statewide observations. These usage rates have increased from prior surveys
conducted in 2009, 2011, and 2013, especially for 4 to 7 year olds, which is reflected in Table 22. It should be
noted that Michigan’s current child restraint and booster seat law was enacted in 2008.
Table 22. Statewide Rates of Appropriate Child Restraint Device Use, by Year
CRD Use Rate by Year*
Age Group 2009/2010 2011 2013 2015
0-to-3 years old 94.9% 95.0% 93.6% 95.7%
4-to-7 years old 44.5% 43.9% 42.4% 49.7% *Use rate based on 0 to 3 year old children seated in rear-facing or forward facing seats and 4 to 7 year old children seated in rear-facing, forward facing, or booster seats. Several conclusions were drawn regarding CRD and booster seat utilization, which are summarized as follows:
CRD use rates were the highest at daycare centers and recreational locations for children aged 0 to 3 and
recreational locations for children aged 4 to 7. The lowest CRD use rates were observed at fast food
restaurants for children aged 0 to 3 and daycare centers and fast food restaurants for children aged 4 to 7.
Among 4 to 7 year olds, CRD use was highest for minivans and lowest for pickup trucks. Very little
variability between the CRD use rates was observed across vehicle types for 0 to 3 year olds.
Little difference in CRD use was observed between male and female drivers.
27
Little difference in CRD use was observed across the various driver age groups for 0 to 3 year olds,
although drivers over the age of 60 were less likely to use an appropriate restraint for 4 to 7 year-olds.
White drivers showed the highest CRD use rates for both 0 to 3 and 4 to 7 year olds, while black drivers
showed the lowest rates, particularly for 4 to 7 year olds.
Similar to previous CRD surveys in Michigan, the most significant driver-related determinant of CRD or
booster seat use among child passengers was driver belt use. CRD/booster use was significantly lower
when the driver was not belted appropriately. The CRD use rate for 0 to 3 year-old children in vehicles
where the driver was belted was 95.7 percent, compared to 88.1 percent among cases where the driver was
not belted. Similarly, use rates among 4 to 7 year-old children were significantly higher when drivers were
belted (49.4 percent vs. 32.6 percent). These findings are consistent with those from Doyle and Levitt [23],
which show unrestrained children are generally found with riskier drivers, including those who are less
likely to be properly restrained and more likely to be crash-involved.
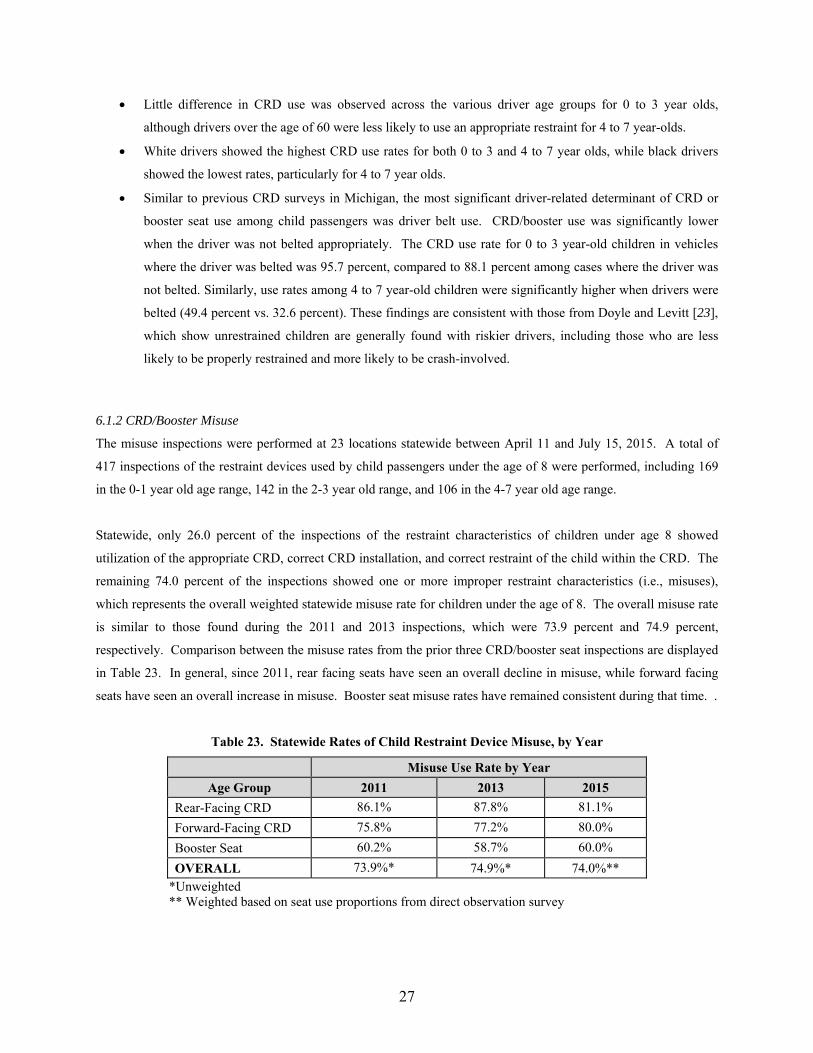
6.1.2 CRD/Booster Misuse
The misuse inspections were performed at 23 locations statewide between April 11 and July 15, 2015. A total of
417 inspections of the restraint devices used by child passengers under the age of 8 were performed, including 169
in the 0-1 year old age range, 142 in the 2-3 year old range, and 106 in the 4-7 year old age range.
Statewide, only 26.0 percent of the inspections of the restraint characteristics of children under age 8 showed
utilization of the appropriate CRD, correct CRD installation, and correct restraint of the child within the CRD. The
remaining 74.0 percent of the inspections showed one or more improper restraint characteristics (i.e., misuses),
which represents the overall weighted statewide misuse rate for children under the age of 8. The overall misuse rate
is similar to those found during the 2011 and 2013 inspections, which were 73.9 percent and 74.9 percent,
respectively. Comparison between the misuse rates from the prior three CRD/booster seat inspections are displayed
in Table 23. In general, since 2011, rear facing seats have seen an overall decline in misuse, while forward facing
seats have seen an overall increase in misuse. Booster seat misuse rates have remained consistent during that time. .
Table 23. Statewide Rates of Child Restraint Device Misuse, by Year
Misuse Use Rate by Year
Age Group 2011 2013 2015
Rear-Facing CRD 86.1% 87.8% 81.1%
Forward-Facing CRD 75.8% 77.2% 80.0%
Booster Seat 60.2% 58.7% 60.0%
OVERALL 73.9%* 74.9%* 74.0%** *Unweighted ** Weighted based on seat use proportions from direct observation survey
28
Several conclusions were also drawn regarding common CRD/booster misuses, which are summarized as follows:
Nearly 47 percent of 1-year old children were (prematurely) seated in a forward-facing CRD, which the
AAP recommends should not occur until the age of 2.
Similarly, 18 percent of 3-year old children were prematurely transitioned into a booster seat, which should
not occur until the child has reached at least 4 years of age.
The most common seat-related misuse for both rear- and forward-facing CRDs was the improper
positioning of the harness retainer clip (typically too low), which was observed in nearly 57 percent of the
rear-facing seats and 47 percent of the forward-facing seats.
Excessive recline (from vertical) was also a common misuse for rear-facing seats. The seat incline should
be increased from 45 degrees to 60 degrees (from horizontal) when an infant is able to lift his/her head.
Improper harness routing below the shoulders was a common problem for forward-facing seats, which is
likely a carry-over from rear-facing utilization of the particular seat.
Excessive slack (greater than 1-inch) in the harness strap remains a common misuse for both rear- and
forward-facing seats, although these rates have declined substantially from prior inspections. A common
reason given by parents for not tightening the harness properly was they did not want the harness to cause
discomfort to the child – particularly for infants.
Loose seat installation, while still common in rear-facing seats, was much improved from prior inspections
for both rear- and forward-facing seats.
Excess space between the CRD and the vehicle seat-back remains a common problem for forward-facing
seats; although this misuse rate had declined from the prior inspections.
Twisted harness straps (twisted seat belts for booster seats) had increased slightly from prior surveys.
The most common misuse for booster seats was improper positioning of the shoulder belt over the
shoulder, collar bone, and chest.
The LATCH system continues to be underutilized. Despite the presence of LATCH in more than 90 percent
of the inspected vehicles, the system was found to be utilized in only 35.6 percent of equipped vehicles.
In terms of risk-priority number [8,9], the following conclusions were drawn from the misuse inspections:
For both rear-facing and forward-facing CRDs, the risk priority values have declined since the 2013
interviews. However, the average risk priority numbers for rear-facing CRDs (and very nearly for forward-
facing CRDs) indicate that a majority of the CRDs inspected have protective capabilities that may be
compromised if involved in an automobile crash.
Consistent with prior inspections, rear-facing seats had a greater risk priority number than forward-facing.
From a risk priority standpoint, the most problematic rear-facing seat misuses are as follows:
o Excessive seat recline
o Harness retainer clip too low
o Shoulder harness straps routed too high
o Seatbelt routed incorrectly
From a risk priority standpoint, the most problematic forward-facing seat misuses are as follows:
o Improper routing of top tether
29
o Excessive harness slack
o Shoulder harness straps routed too low
o Harness retainer clop positioned too low
o Internal harness not buckles
6.2 Recommendations
To ensure proper CRD and booster seat use, parents must be provided with child restraint education and training
periodically throughout their child’s growth and development, particularly when a new CRD is utilized or
modification to the current CRD becomes necessary. For example, the installation of a CRD for a newborn is
drastically different than for a 3 year-old child. The following age/development stages often necessitate a new CRD
or modification to the current CRD:
Birth (first use of CRD, which must be rear facing with a 45 degree incline)
Between 6 and 12 months of age (switch from infant carrier to larger rear-facing CRD and increase in the
incline from 45 to 60 degrees from horizontal when the child is able to lift his/her head)
Age 24 months (switch from rear-facing CRD to forward-facing CRD, which requires re-routing of the
harness straps and seat belt path, among other changes)
Age 4 and 40 pounds (switch to booster seat)
Age 8 or 4’9” tall (switch to safety belt in rear vehicle seat until age 13)
Parents should also be encouraged to follow the current NHTSA CRD transitioning guidelines, which advise
keeping children in each restraint type, including rear-facing, forward-facing and booster seats, for as long as
possible before moving them up to the next type of restraint [24]. Particular emphasis should be placed on
educating parents as to the appropriate timing for 1.) transitioning from a 45 to 60 degree incline, 2.) transitioning
from rear-facing to forward-facing, and 3.) transitioning from forward-facing CRD to booster seat. The rear-facing
position reduces stresses to the neck and spine to infants and reduces the likelihood of severe injury during a crash.
With the AAP’s March 2011 increase in the recommended minimum age for transitioning from rear to forward
facing from one year to two years of age [22], it is likely many parents are not yet aware of this increase. Similarly,
forward-facing seat utilization should be emphasized until the child outgrows the seat (or the seat expires), due to
the inherent safety benefits compared to booster seats.
The most significant driver-related determinant of CRD or booster seat use among child passengers was driver belt
use. CRD/booster use was significantly lower when the driver was not belted appropriately. Unbelted drivers
present the greatest area of opportunity and should be the focus of future education and outreach programs aimed at
informing the public of the importance of appropriate child restraint device use. Similar programs have proven
particularly effective at increasing safety belt use among Michigan drivers.

30
Several educational/training opportunities are available to parents. Hospitals typically provide basic hands-on
training of CRD and booster seat installation and use for parents of newborns upon discharge from the hospital. Day
care facilities often provide basic child restraint education, but do not have the staff to provide full inspection or
training. There are many locations throughout the State of Michigan where parents can have their CRD or booster
seat inspected by certified individuals. NHTSA-certified inspectors are often available at most fire stations and
police stations, although appointments may be required. The non-profit organization SafeKids USA sponsors
several CRD/booster seat inspection/training events statewide. These events have one or more NHTSA certified
inspectors on-site to inspect the CRD installation and inform the parents if they are using an incorrect restraint for
their child or if the device has been recalled. The inspectors will also show the parents how to properly install the
CRD/booster seat in the vehicle and how to properly restrain the child in the seat. Parents should be encouraged to
have their CRD/booster seat inspected by a NHTSA-certified inspector anytime a new CRD/booster is utilized, a
change to the existing installation or internal restraint is needed, or after the child has experienced substantial growth
or development. Parents should also be informed of the benefits of the LATCH system, which simplifies correct
attachment of the CRD to the vehicle. The current LATCH utilization survey suggests great underutilization of the
LATCH system, despite its presence in greater than 90 percent of the inspected vehicles.
7.0 REFERENCES 1. Michigan State Police, Office of Highway Safety Planning, Michigan Traffic Crash Facts Data Query Tool,
http://www.michigantrafficcrashfacts.org/, Accessed on August 2015. 2. Arbogast, K.B., D.R. Durbin, R.A. Cornejo, M.J. Kallan, and F.K. Winston. “An Evaluation of the
Effectiveness of Forward Facing Child Restraint Systems”. In Accident Analysis and Prevention, Vol. 36, Elsevier, pp. 585-589, 2004.
3. Durbin, D.R., Elliott, M.R., and F.K. Winston, “Belt-Positioning Booster Seats and Reduction of Injury Among Children in Vehicle Crashes”, Journal of American Medical Association, Vol. 289, pp. 2835-2840, 2003.
4. Datta, T.K. and L.F. Grillo. Child Restraint Device Use and Misuse Survey. Wayne State University – Transportation Research Group, Michigan Office of Highway Safety Planning, October 2007.
5. Gates, T.J., Savolainen, P.T., and T.K. Datta. Child Restraint Device Use and Misuse Survey. Wayne State University – Transportation Research Group, Michigan Office of Highway Safety Planning, September 2009.
6. Gates, T.J., Savolainen, P.T., and T.K. Datta. Child Restraint/Booster Seat Use and Misuse Survey. Wayne State University – Transportation Research Group, Michigan Office of Highway Safety Planning, September 2011.
7. Savolainen, P.T., Gates, T.J., Rista, Emira, Hacker, Elizabeth, and Amelia Davis. Child Restraint/Booster Seat Use and Misuse Survey. Wayne State University – Transportation Research Group, Michigan Office of Highway Safety Planning, September 2013
8. Rudin-Brown, C.M., et al. “Behavioral Evaluation of Child Restraint Systems (CRS) Label/ Warning Effectiveness”, Road Safety and Motor Vehicle Regulation Directorate, Transport Canada, 2002.
9. Czernakowski, W. and Műller, M., “Misuse Mode and Effects Analysis: An Approach to Predict and Quantify Misuse of Child Restraint Systems”, in Accident Analysis and Prevention, 1993, Vol. 25, No. 3, pp. 323-333.
10. Eby, D.W., Bingham, C.R., Vivoda, J.M., and T. Ragunathan, “Use of Booster Seats by Michigan Children 4–8 Years of Age”, Accident Analysis & Prevention, Vol. 37, No. 6, pp. 1153-1161, 2005.
11. Ramsey, A., Simpson, E., and F.P. Rivara, “Booster Seat Use and Reasons for Nonuse”,Pediatrics, Vol. 106, 2000.
12. Simpson, E.M., Moll, E.K., Kassam-Adams, N., Miller, G.J., and F.K. Winston, “Barriers to Booster Seat Use and Strategies to Increase Their Use”, Pediatrics, Vol. 110, pp. 729-736, 2002.
13. Ebel, B.E., Koepsell, T.D., Bennett, E.E., and F.P. Rivara, “Too Small for a Seatbelt: Predictors of Booster Seat Use by Child Passengers”, Pediatrics, Vol. 111, pp. 323-327, 2003.

31
14. Bingham, C.R., Eby, D.W., Hockanson, H.M., and A.I. Greenspan, Factors Influencing the Use of Booster Seats: A Statewide Survey of Parents, Report No. UMTRI-2005-14, 2005.
15. Vesentini, L. and B. Willems, “Premature Graduation of Children in Child Restraint Systems: An Observational Study”, Accident Analysis and Prevention, Vol. 39, pp. 867-872, 2007.
16. Charlton, J., Koppel, S., Fitzharris, M., Congiu, M., and B. Fildes, Factors That Influence Children’s Booster Seat Use, Report to Motor Accidents Authority of New South Wales, 2006.
17. Koppel, S., Charlton, J.L., Fitzharris, M., Congiu, M., and B. Fildes, “Factors Associated with the Premature Graduation of Children into Seatbelts”, Accident Analysis and Prevention, Vol. 40, pp. 657-666, 2008.
18. Savolainen, P.T., Gates, T.J., and T.K. Datta, 2009 Direct Observation Surveys of Booster Seat Use, Final Report to Michigan Office of Highway Safety Planning, 2009.
19. Savolainen, P.T., Gates, T.J., and T.K. Datta, 2010 Direct Observation Survey of Booster Seat Use, Final Report to Michigan Office of Highway Safety Planning, 2010.
20. Missouri Census Data Center, Population Estimates by Age, http://mcdc.missouri.edu/websas/estimates_by_age.shtml, Accessed August 2015.
21. Cochran, W.M., Sampling Techniques, 3rd Edition, John Wiley & Sons, 1977. 22. “AAP Updates Recommendation on Car Seats”, American Academy of Pediatrics, March 2011. Accessed
online: http://www.aap.org/en-us/about-the-aap/aap-press-room/pages/AAP-Updates-Recommendation-on-Car-Seats.aspx, Accessed August 2015.
23. Doyle, J.J. and S.D. Levitt, Evaluating the Effectiveness of Child Safety Seats and Seat Belts in Protecting Children from Injury, NBER Working Paper 12519, National Bureau of Economic Research, Inc., August 2006.
24. “NHTSA Releases New Child Seat Guidelines - New Age-Focused Guidelines Help Parents Make More Informed Choices”, National Highway Traffic Safety Administration, March 2011. Accessed online: http://www.nhtsa.gov/PR/NHTSA-02-11, Accessed August 2015.
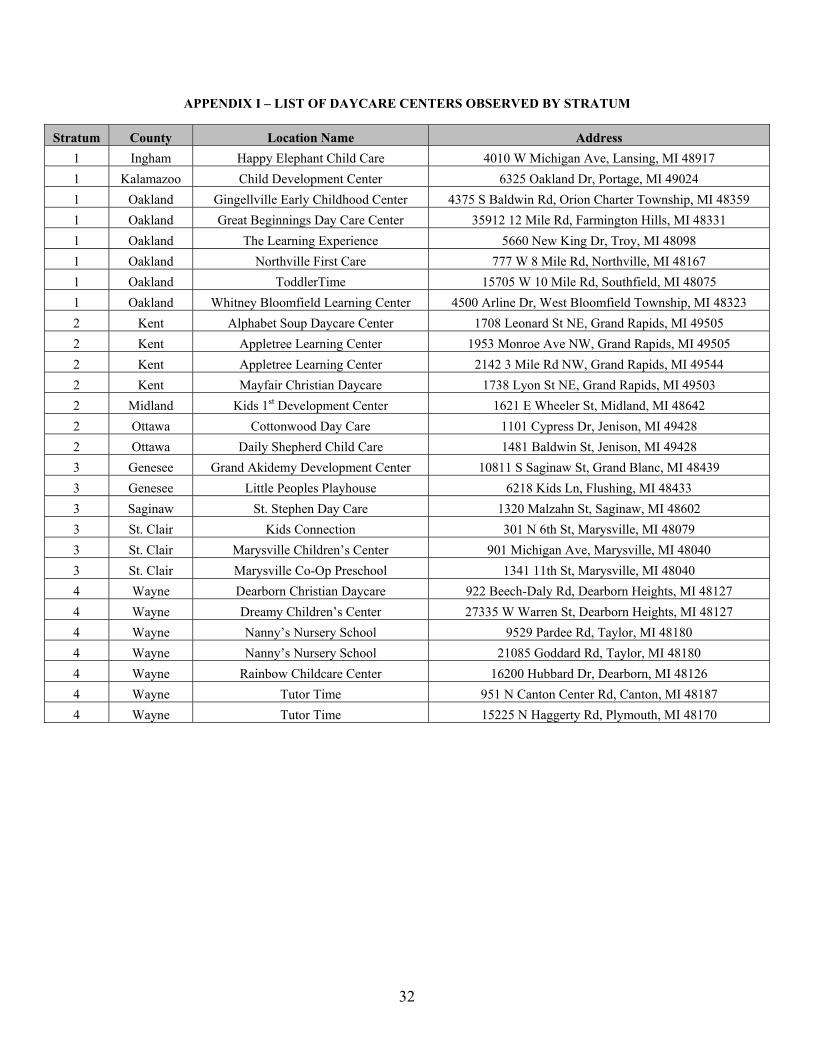
32
APPENDIX I – LIST OF DAYCARE CENTERS OBSERVED BY STRATUM
Stratum County Location Name Address
1 Ingham Happy Elephant Child Care 4010 W Michigan Ave, Lansing, MI 48917
1 Kalamazoo Child Development Center 6325 Oakland Dr, Portage, MI 49024
1 Oakland Gingellville Early Childhood Center 4375 S Baldwin Rd, Orion Charter Township, MI 48359
1 Oakland Great Beginnings Day Care Center 35912 12 Mile Rd, Farmington Hills, MI 48331
1 Oakland The Learning Experience 5660 New King Dr, Troy, MI 48098
1 Oakland Northville First Care 777 W 8 Mile Rd, Northville, MI 48167
1 Oakland ToddlerTime 15705 W 10 Mile Rd, Southfield, MI 48075
1 Oakland Whitney Bloomfield Learning Center 4500 Arline Dr, West Bloomfield Township, MI 48323
2 Kent Alphabet Soup Daycare Center 1708 Leonard St NE, Grand Rapids, MI 49505
2 Kent Appletree Learning Center 1953 Monroe Ave NW, Grand Rapids, MI 49505
2 Kent Appletree Learning Center 2142 3 Mile Rd NW, Grand Rapids, MI 49544
2 Kent Mayfair Christian Daycare 1738 Lyon St NE, Grand Rapids, MI 49503
2 Midland Kids 1st Development Center 1621 E Wheeler St, Midland, MI 48642
2 Ottawa Cottonwood Day Care 1101 Cypress Dr, Jenison, MI 49428
2 Ottawa Daily Shepherd Child Care 1481 Baldwin St, Jenison, MI 49428
3 Genesee Grand Akidemy Development Center 10811 S Saginaw St, Grand Blanc, MI 48439
3 Genesee Little Peoples Playhouse 6218 Kids Ln, Flushing, MI 48433
3 Saginaw St. Stephen Day Care 1320 Malzahn St, Saginaw, MI 48602
3 St. Clair Kids Connection 301 N 6th St, Marysville, MI 48079
3 St. Clair Marysville Children’s Center 901 Michigan Ave, Marysville, MI 48040
3 St. Clair Marysville Co-Op Preschool 1341 11th St, Marysville, MI 48040
4 Wayne Dearborn Christian Daycare 922 Beech-Daly Rd, Dearborn Heights, MI 48127
4 Wayne Dreamy Children’s Center 27335 W Warren St, Dearborn Heights, MI 48127
4 Wayne Nanny’s Nursery School 9529 Pardee Rd, Taylor, MI 48180
4 Wayne Nanny’s Nursery School 21085 Goddard Rd, Taylor, MI 48180
4 Wayne Rainbow Childcare Center 16200 Hubbard Dr, Dearborn, MI 48126
4 Wayne Tutor Time 951 N Canton Center Rd, Canton, MI 48187
4 Wayne Tutor Time 15225 N Haggerty Rd, Plymouth, MI 48170
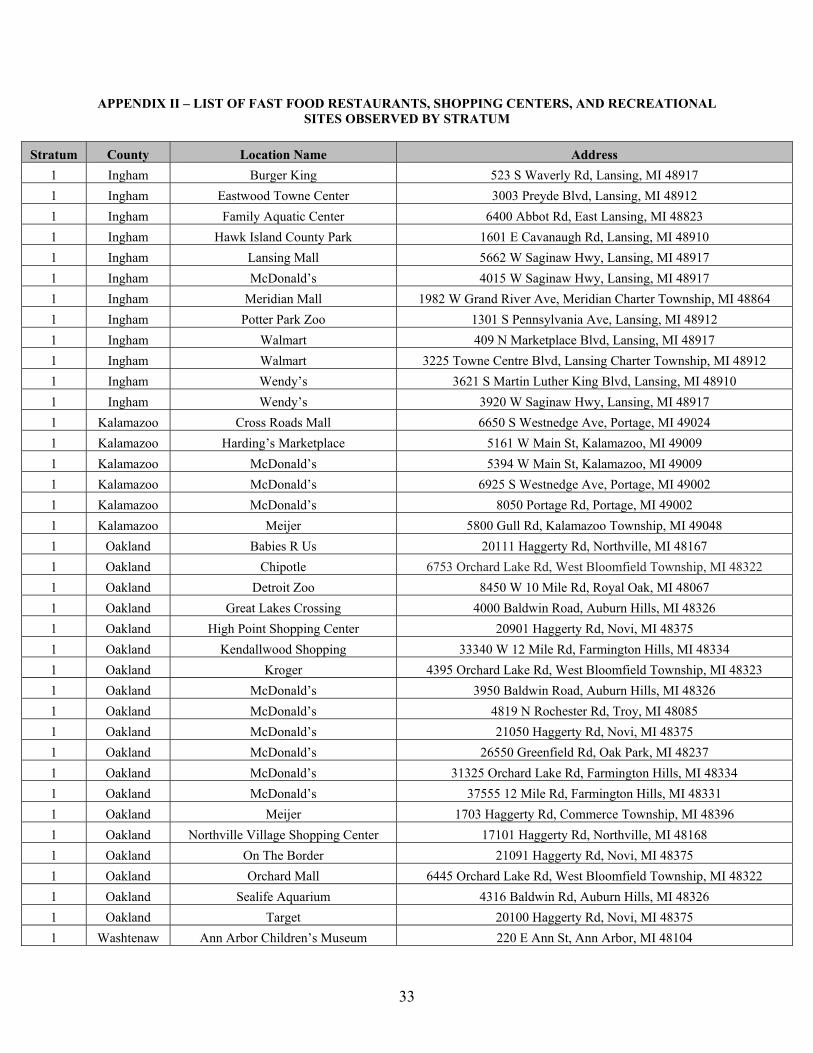
33
APPENDIX II – LIST OF FAST FOOD RESTAURANTS, SHOPPING CENTERS, AND RECREATIONAL SITES OBSERVED BY STRATUM
Stratum County Location Name Address
1 Ingham Burger King 523 S Waverly Rd, Lansing, MI 48917
1 Ingham Eastwood Towne Center 3003 Preyde Blvd, Lansing, MI 48912
1 Ingham Family Aquatic Center 6400 Abbot Rd, East Lansing, MI 48823
1 Ingham Hawk Island County Park 1601 E Cavanaugh Rd, Lansing, MI 48910
1 Ingham Lansing Mall 5662 W Saginaw Hwy, Lansing, MI 48917
1 Ingham McDonald’s 4015 W Saginaw Hwy, Lansing, MI 48917
1 Ingham Meridian Mall 1982 W Grand River Ave, Meridian Charter Township, MI 48864
1 Ingham Potter Park Zoo 1301 S Pennsylvania Ave, Lansing, MI 48912
1 Ingham Walmart 409 N Marketplace Blvd, Lansing, MI 48917
1 Ingham Walmart 3225 Towne Centre Blvd, Lansing Charter Township, MI 48912
1 Ingham Wendy’s 3621 S Martin Luther King Blvd, Lansing, MI 48910
1 Ingham Wendy’s 3920 W Saginaw Hwy, Lansing, MI 48917
1 Kalamazoo Cross Roads Mall 6650 S Westnedge Ave, Portage, MI 49024
1 Kalamazoo Harding’s Marketplace 5161 W Main St, Kalamazoo, MI 49009
1 Kalamazoo McDonald’s 5394 W Main St, Kalamazoo, MI 49009
1 Kalamazoo McDonald’s 6925 S Westnedge Ave, Portage, MI 49002
1 Kalamazoo McDonald’s 8050 Portage Rd, Portage, MI 49002
1 Kalamazoo Meijer 5800 Gull Rd, Kalamazoo Township, MI 49048
1 Oakland Babies R Us 20111 Haggerty Rd, Northville, MI 48167
1 Oakland Chipotle 6753 Orchard Lake Rd, West Bloomfield Township, MI 48322
1 Oakland Detroit Zoo 8450 W 10 Mile Rd, Royal Oak, MI 48067
1 Oakland Great Lakes Crossing 4000 Baldwin Road, Auburn Hills, MI 48326
1 Oakland High Point Shopping Center 20901 Haggerty Rd, Novi, MI 48375
1 Oakland Kendallwood Shopping 33340 W 12 Mile Rd, Farmington Hills, MI 48334
1 Oakland Kroger 4395 Orchard Lake Rd, West Bloomfield Township, MI 48323
1 Oakland McDonald’s 3950 Baldwin Road, Auburn Hills, MI 48326
1 Oakland McDonald’s 4819 N Rochester Rd, Troy, MI 48085
1 Oakland McDonald’s 21050 Haggerty Rd, Novi, MI 48375
1 Oakland McDonald’s 26550 Greenfield Rd, Oak Park, MI 48237
1 Oakland McDonald’s 31325 Orchard Lake Rd, Farmington Hills, MI 48334
1 Oakland McDonald’s 37555 12 Mile Rd, Farmington Hills, MI 48331
1 Oakland Meijer 1703 Haggerty Rd, Commerce Township, MI 48396
1 Oakland Northville Village Shopping Center 17101 Haggerty Rd, Northville, MI 48168
1 Oakland On The Border 21091 Haggerty Rd, Novi, MI 48375
1 Oakland Orchard Mall 6445 Orchard Lake Rd, West Bloomfield Township, MI 48322
1 Oakland Sealife Aquarium 4316 Baldwin Rd, Auburn Hills, MI 48326
1 Oakland Target 20100 Haggerty Rd, Novi, MI 48375
1 Washtenaw Ann Arbor Children’s Museum 220 E Ann St, Ann Arbor, MI 48104

34
1 Washtenaw Arborland Shopping Center 3600 Washtenaw Ave, Ann Arbor, MI 48104
1 Washtenaw Briarwood Mall 100 Briarwood Cir, Ann Arbor, MI 48108
1 Washtenaw Burger King 725 Victors Way, Ann Arbor, MI 48108
1 Washtenaw Denny’s 3310 Washtenaw Ave, Ann Arbor, MI 48104
1 Washtenaw McDonald’s 3325 Washtenaw Ave, Ann Arbor, MI
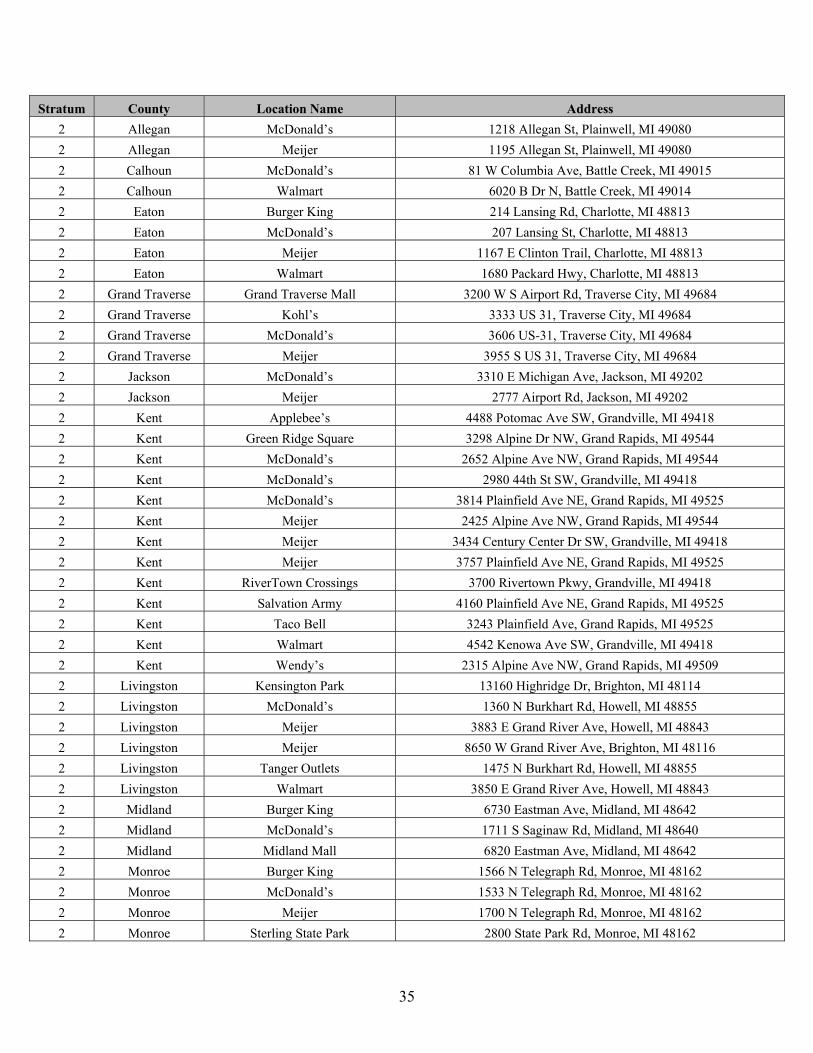
35
Stratum County Location Name Address
2 Allegan McDonald’s 1218 Allegan St, Plainwell, MI 49080
2 Allegan Meijer 1195 Allegan St, Plainwell, MI 49080
2 Calhoun McDonald’s 81 W Columbia Ave, Battle Creek, MI 49015
2 Calhoun Walmart 6020 B Dr N, Battle Creek, MI 49014
2 Eaton Burger King 214 Lansing Rd, Charlotte, MI 48813
2 Eaton McDonald’s 207 Lansing St, Charlotte, MI 48813
2 Eaton Meijer 1167 E Clinton Trail, Charlotte, MI 48813
2 Eaton Walmart 1680 Packard Hwy, Charlotte, MI 48813
2 Grand Traverse Grand Traverse Mall 3200 W S Airport Rd, Traverse City, MI 49684
2 Grand Traverse Kohl’s 3333 US 31, Traverse City, MI 49684
2 Grand Traverse McDonald’s 3606 US-31, Traverse City, MI 49684
2 Grand Traverse Meijer 3955 S US 31, Traverse City, MI 49684
2 Jackson McDonald’s 3310 E Michigan Ave, Jackson, MI 49202
2 Jackson Meijer 2777 Airport Rd, Jackson, MI 49202
2 Kent Applebee’s 4488 Potomac Ave SW, Grandville, MI 49418
2 Kent Green Ridge Square 3298 Alpine Dr NW, Grand Rapids, MI 49544
2 Kent McDonald’s 2652 Alpine Ave NW, Grand Rapids, MI 49544
2 Kent McDonald’s 2980 44th St SW, Grandville, MI 49418
2 Kent McDonald’s 3814 Plainfield Ave NE, Grand Rapids, MI 49525
2 Kent Meijer 2425 Alpine Ave NW, Grand Rapids, MI 49544
2 Kent Meijer 3434 Century Center Dr SW, Grandville, MI 49418
2 Kent Meijer 3757 Plainfield Ave NE, Grand Rapids, MI 49525
2 Kent RiverTown Crossings 3700 Rivertown Pkwy, Grandville, MI 49418
2 Kent Salvation Army 4160 Plainfield Ave NE, Grand Rapids, MI 49525
2 Kent Taco Bell 3243 Plainfield Ave, Grand Rapids, MI 49525
2 Kent Walmart 4542 Kenowa Ave SW, Grandville, MI 49418
2 Kent Wendy’s 2315 Alpine Ave NW, Grand Rapids, MI 49509
2 Livingston Kensington Park 13160 Highridge Dr, Brighton, MI 48114
2 Livingston McDonald’s 1360 N Burkhart Rd, Howell, MI 48855
2 Livingston Meijer 3883 E Grand River Ave, Howell, MI 48843
2 Livingston Meijer 8650 W Grand River Ave, Brighton, MI 48116
2 Livingston Tanger Outlets 1475 N Burkhart Rd, Howell, MI 48855
2 Livingston Walmart 3850 E Grand River Ave, Howell, MI 48843
2 Midland Burger King 6730 Eastman Ave, Midland, MI 48642
2 Midland McDonald’s 1711 S Saginaw Rd, Midland, MI 48640
2 Midland Midland Mall 6820 Eastman Ave, Midland, MI 48642
2 Monroe Burger King 1566 N Telegraph Rd, Monroe, MI 48162
2 Monroe McDonald’s 1533 N Telegraph Rd, Monroe, MI 48162
2 Monroe Meijer 1700 N Telegraph Rd, Monroe, MI 48162
2 Monroe Sterling State Park 2800 State Park Rd, Monroe, MI 48162

36
2 Monroe T.J.Maxx 2339 N Telegraph Rd, Monroe, MI 48162
2 Ottawa Culver’s 7393 Cottonwood Dr, Jenison, MI 49428
2 Ottawa Family Fare Supermarket 1965 Baldwin St, Jenison, MI 49428
2 Ottawa McDonald’s 160 Chicago Dr, Jenison, MI 49428
2 Ottawa Meijer 550 Baldwin St, Georgetown Township, MI 49428
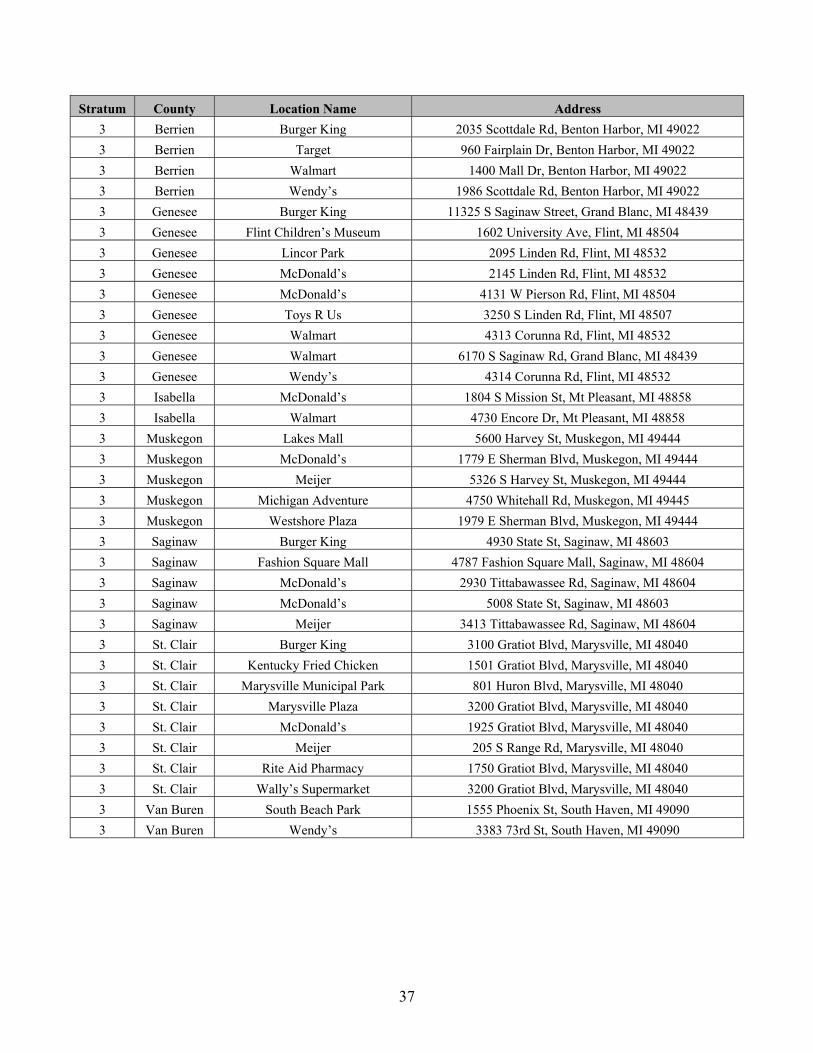
37
Stratum County Location Name Address
3 Berrien Burger King 2035 Scottdale Rd, Benton Harbor, MI 49022
3 Berrien Target 960 Fairplain Dr, Benton Harbor, MI 49022
3 Berrien Walmart 1400 Mall Dr, Benton Harbor, MI 49022
3 Berrien Wendy’s 1986 Scottdale Rd, Benton Harbor, MI 49022
3 Genesee Burger King 11325 S Saginaw Street, Grand Blanc, MI 48439
3 Genesee Flint Children’s Museum 1602 University Ave, Flint, MI 48504
3 Genesee Lincor Park 2095 Linden Rd, Flint, MI 48532
3 Genesee McDonald’s 2145 Linden Rd, Flint, MI 48532
3 Genesee McDonald’s 4131 W Pierson Rd, Flint, MI 48504
3 Genesee Toys R Us 3250 S Linden Rd, Flint, MI 48507
3 Genesee Walmart 4313 Corunna Rd, Flint, MI 48532
3 Genesee Walmart 6170 S Saginaw Rd, Grand Blanc, MI 48439
3 Genesee Wendy’s 4314 Corunna Rd, Flint, MI 48532
3 Isabella McDonald’s 1804 S Mission St, Mt Pleasant, MI 48858
3 Isabella Walmart 4730 Encore Dr, Mt Pleasant, MI 48858
3 Muskegon Lakes Mall 5600 Harvey St, Muskegon, MI 49444
3 Muskegon McDonald’s 1779 E Sherman Blvd, Muskegon, MI 49444
3 Muskegon Meijer 5326 S Harvey St, Muskegon, MI 49444
3 Muskegon Michigan Adventure 4750 Whitehall Rd, Muskegon, MI 49445
3 Muskegon Westshore Plaza 1979 E Sherman Blvd, Muskegon, MI 49444
3 Saginaw Burger King 4930 State St, Saginaw, MI 48603
3 Saginaw Fashion Square Mall 4787 Fashion Square Mall, Saginaw, MI 48604
3 Saginaw McDonald’s 2930 Tittabawassee Rd, Saginaw, MI 48604
3 Saginaw McDonald’s 5008 State St, Saginaw, MI 48603
3 Saginaw Meijer 3413 Tittabawassee Rd, Saginaw, MI 48604
3 St. Clair Burger King 3100 Gratiot Blvd, Marysville, MI 48040
3 St. Clair Kentucky Fried Chicken 1501 Gratiot Blvd, Marysville, MI 48040
3 St. Clair Marysville Municipal Park 801 Huron Blvd, Marysville, MI 48040
3 St. Clair Marysville Plaza 3200 Gratiot Blvd, Marysville, MI 48040
3 St. Clair McDonald’s 1925 Gratiot Blvd, Marysville, MI 48040
3 St. Clair Meijer 205 S Range Rd, Marysville, MI 48040
3 St. Clair Rite Aid Pharmacy 1750 Gratiot Blvd, Marysville, MI 48040
3 St. Clair Wally’s Supermarket 3200 Gratiot Blvd, Marysville, MI 48040
3 Van Buren South Beach Park 1555 Phoenix St, South Haven, MI 49090
3 Van Buren Wendy’s 3383 73rd St, South Haven, MI 49090
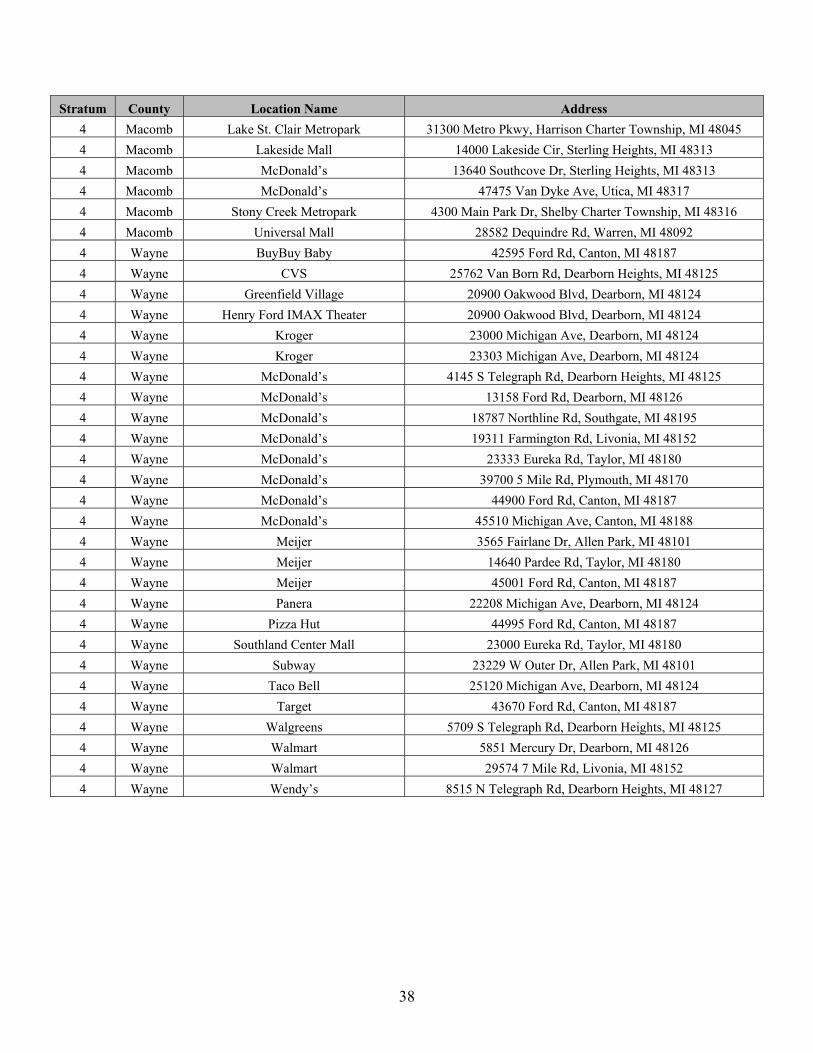
38
Stratum County Location Name Address
4 Macomb Lake St. Clair Metropark 31300 Metro Pkwy, Harrison Charter Township, MI 48045
4 Macomb Lakeside Mall 14000 Lakeside Cir, Sterling Heights, MI 48313
4 Macomb McDonald’s 13640 Southcove Dr, Sterling Heights, MI 48313
4 Macomb McDonald’s 47475 Van Dyke Ave, Utica, MI 48317
4 Macomb Stony Creek Metropark 4300 Main Park Dr, Shelby Charter Township, MI 48316
4 Macomb Universal Mall 28582 Dequindre Rd, Warren, MI 48092
4 Wayne BuyBuy Baby 42595 Ford Rd, Canton, MI 48187
4 Wayne CVS 25762 Van Born Rd, Dearborn Heights, MI 48125
4 Wayne Greenfield Village 20900 Oakwood Blvd, Dearborn, MI 48124
4 Wayne Henry Ford IMAX Theater 20900 Oakwood Blvd, Dearborn, MI 48124
4 Wayne Kroger 23000 Michigan Ave, Dearborn, MI 48124
4 Wayne Kroger 23303 Michigan Ave, Dearborn, MI 48124
4 Wayne McDonald’s 4145 S Telegraph Rd, Dearborn Heights, MI 48125
4 Wayne McDonald’s 13158 Ford Rd, Dearborn, MI 48126
4 Wayne McDonald’s 18787 Northline Rd, Southgate, MI 48195
4 Wayne McDonald’s 19311 Farmington Rd, Livonia, MI 48152
4 Wayne McDonald’s 23333 Eureka Rd, Taylor, MI 48180
4 Wayne McDonald’s 39700 5 Mile Rd, Plymouth, MI 48170
4 Wayne McDonald’s 44900 Ford Rd, Canton, MI 48187
4 Wayne McDonald’s 45510 Michigan Ave, Canton, MI 48188
4 Wayne Meijer 3565 Fairlane Dr, Allen Park, MI 48101
4 Wayne Meijer 14640 Pardee Rd, Taylor, MI 48180
4 Wayne Meijer 45001 Ford Rd, Canton, MI 48187
4 Wayne Panera 22208 Michigan Ave, Dearborn, MI 48124
4 Wayne Pizza Hut 44995 Ford Rd, Canton, MI 48187
4 Wayne Southland Center Mall 23000 Eureka Rd, Taylor, MI 48180
4 Wayne Subway 23229 W Outer Dr, Allen Park, MI 48101
4 Wayne Taco Bell 25120 Michigan Ave, Dearborn, MI 48124
4 Wayne Target 43670 Ford Rd, Canton, MI 48187
4 Wayne Walgreens 5709 S Telegraph Rd, Dearborn Heights, MI 48125
4 Wayne Walmart 5851 Mercury Dr, Dearborn, MI 48126
4 Wayne Walmart 29574 7 Mile Rd, Livonia, MI 48152
4 Wayne Wendy’s 8515 N Telegraph Rd, Dearborn Heights, MI 48127
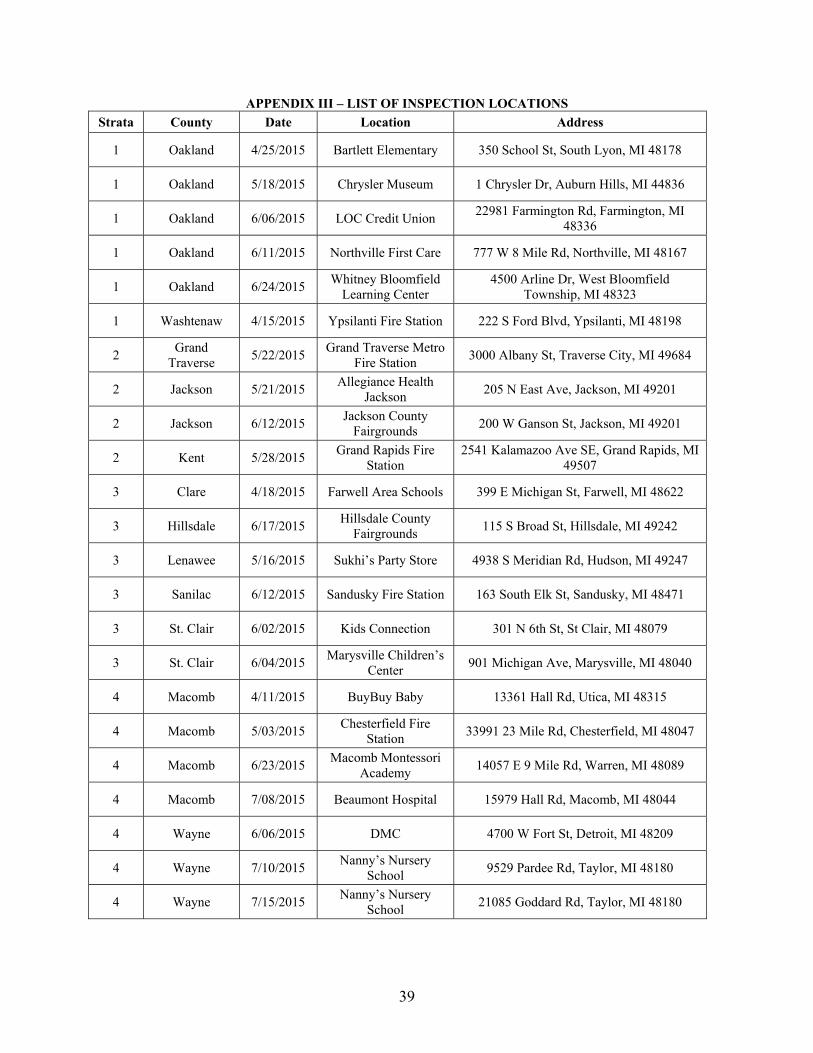
39
APPENDIX III – LIST OF INSPECTION LOCATIONS
Strata County Date Location Address
1 Oakland 4/25/2015 Bartlett Elementary 350 School St, South Lyon, MI 48178
1 Oakland 5/18/2015 Chrysler Museum 1 Chrysler Dr, Auburn Hills, MI 44836
1 Oakland 6/06/2015 LOC Credit Union 22981 Farmington Rd, Farmington, MI
48336
1 Oakland 6/11/2015 Northville First Care 777 W 8 Mile Rd, Northville, MI 48167
1 Oakland 6/24/2015 Whitney Bloomfield
Learning Center 4500 Arline Dr, West Bloomfield
Township, MI 48323
1 Washtenaw 4/15/2015 Ypsilanti Fire Station 222 S Ford Blvd, Ypsilanti, MI 48198
2 Grand
Traverse 5/22/2015
Grand Traverse Metro Fire Station
3000 Albany St, Traverse City, MI 49684
2 Jackson 5/21/2015 Allegiance Health
Jackson 205 N East Ave, Jackson, MI 49201
2 Jackson 6/12/2015 Jackson County
Fairgrounds 200 W Ganson St, Jackson, MI 49201
2 Kent 5/28/2015 Grand Rapids Fire
Station 2541 Kalamazoo Ave SE, Grand Rapids, MI
49507
3 Clare 4/18/2015 Farwell Area Schools 399 E Michigan St, Farwell, MI 48622
3 Hillsdale 6/17/2015 Hillsdale County
Fairgrounds 115 S Broad St, Hillsdale, MI 49242
3 Lenawee 5/16/2015 Sukhi’s Party Store 4938 S Meridian Rd, Hudson, MI 49247
3 Sanilac 6/12/2015 Sandusky Fire Station 163 South Elk St, Sandusky, MI 48471
3 St. Clair 6/02/2015 Kids Connection 301 N 6th St, St Clair, MI 48079
3 St. Clair 6/04/2015 Marysville Children’s
Center 901 Michigan Ave, Marysville, MI 48040
4 Macomb 4/11/2015 BuyBuy Baby 13361 Hall Rd, Utica, MI 48315
4 Macomb 5/03/2015 Chesterfield Fire
Station 33991 23 Mile Rd, Chesterfield, MI 48047
4 Macomb 6/23/2015 Macomb Montessori
Academy 14057 E 9 Mile Rd, Warren, MI 48089
4 Macomb 7/08/2015 Beaumont Hospital 15979 Hall Rd, Macomb, MI 48044
4 Wayne 6/06/2015 DMC 4700 W Fort St, Detroit, MI 48209
4 Wayne 7/10/2015 Nanny’s Nursery
School 9529 Pardee Rd, Taylor, MI 48180
4 Wayne 7/15/2015 Nanny’s Nursery
School 21085 Goddard Rd, Taylor, MI 48180
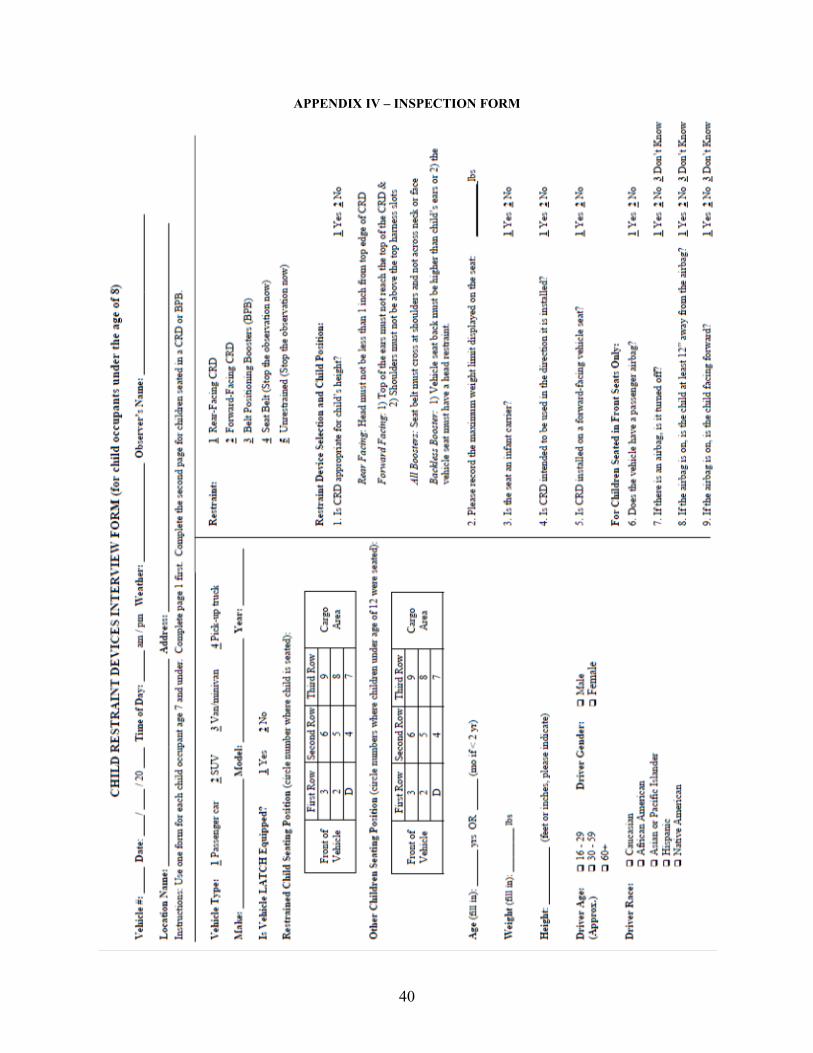
40
APPENDIX IV – INSPECTION FORM

41