2015 - central bank of the bahamas central banking career that spanned more ... 8 central bank of...
TRANSCRIPT

The Central Bank of The Bahamas
ANNUAL REPORT& Statement of Accounts for the year ended 31 December, 2015
Frederick StreetP.O. Box N-4868, Nassau, NP, The BahamasTel: 242-302-2600Fax: 242-322-4321cbob@centralbankbahamas.comwww.centralbankbahamas.com
2015Balcony House, a two storey residence on Market Street, was built around 1790. It has a detached kitchen and a mahogany staircase—said to have come from a ship. The Central Bank purchased the House on August 8, 1985 and converted it into the Balcony House Museum. It is currently operated by the Antiquities, Monuments and Museums Corporation.
Verandah House, just north of Balcony House, was built of wood in the 1790s and has a stone cellar, dormer windows and a small porch.
Great House, which was built in the 1840s, serves as the Bank’s staff cafeteria, a recreational centre for staff and houses the “after school care” programme.
17x11 cover.indd 1 3/24/16 1:10 PM

MISSIONTo foster an environment of monetary stability conducive to economic development, and to ensure a stable and sound financial system through the highest standards of integrity and leadership.
VALUESOur commitment to fulfilling our Mission is embodied in our Core Values of:• Objectivity• Confidentiality• Integrity• Excellence• Teamwork• Empowerment• Initiative
VISIONTo promote a leading financial services industry within the framework of dynamic monetary policy developments, modernized payment systems, sound management strategies and capacity building.
17x11 cover.indd 2 3/24/16 1:10 PM

May 2, 2016
Dear Prime Minister:
In accordance with Section 32(1) of the Central Bank of The Bahamas Act, 2000, I have the honour of forwarding to you, on behalf of the Board of Directors, the Annual Report of the Bank for the year 2015. Included with this Report is the Annual Statement of Accounts of the Bank for the year.
Respectfully yours,
John A. RolleGovernor
The Rt. Hon. Perry G. ChristiePrime Minister and Minister of FinanceOffice of the Prime MinisterCecil Wallace-Whitfield CentreWest Bay StreetNassau, N.P., Bahamas

2 Central Bank of The Bahamas
2 0 1 5 A N N U A L R E P O R T 3
ABOUT THE BANK
Under the Central Bank of The Bahamas Act, 2000 (the Act), the Bank is mandated to promote and maintain monetary stability and balance of payments conditions, conducive to the orderly development of the economy; in collaboration with other financial institutions, to promote and maintain adequate banking services and high standards of conduct and management therein; and to advise the Minister of Finance on any matter of a financial or monetary nature referred by him to the Bank for its advice.
MONETARY POLICYIn its monetary role, a central objective of the Bank is to ensure support for the fixed parity of the Bahamian dollar against the United States curren-cy. To do so, the Bank has to maintain adequate foreign reserves against the stock of its demand lia-bilities to banks and the public, and ensure that the demand for foreign exchange, stimulated principal-ly by domestic credit expansion, does not exceed the pace at which the economy earns foreign exchange from real sector activities. In alignment to this goal, the Bank has statutory responsibility for the prudent management of the country’s foreign currency reserves.
The Bank’s administration of exchange controls is also closely linked to the fixed exchange rate poli-cy objective. Capital controls, which have under-gone gradual relaxation in recent years, restrain the movement of capital by residents; however, there are no restrictions on current payments.
FINANCIAL STABILITYThe Bank’s supervision regime, through its pruden-tial oversight of regulated entities, is a critical part of the infrastructure to maintain high standards of service, conduct and management in the banking sector. A combination of off-site examinations, on-site inspection and market intelligence informs the risk-based assessments that are used to monitor the soundness of licensees, and stress testing is
undertaken to gauge resilience to key economic and financial shocks.
PAYMENTSThe Bank’s involvement in the payments system is yet another integral component of its overall mandate to promote stability of and confidence in the financial system. In performing its oversight function, the Bank seeks to ensure, inter alia, that the payments infrastructure functions smoothly, efficiently and fairly in the interest of all participants and users, that it minimizes and controls risks and that the level of technological, product and service development is adequate and satisfies the needs of the economy.
CURRENCYThe Bank meets the currency needs of the public by arranging for the procurement, storage and issuance of Bahamian banknotes and coins, as well as maintaining the quality of currency in circu-lation. Banknotes deemed as unfit are withdrawn from circulation and replaced.
PUBLIC DEBT & FUND MANAGEMENTThe Bank provides front, middle and back office services to the Government and its agencies, in activities involving debt issuance and administra-tion, and the management of several sinking fund arrangements.

4 Central Bank of The Bahamas

2 0 1 5 A N N U A L R E P O R T 5
CONTENTS
6 FOREWORD 7 DIRECTORS AND SENIOR OFFICIALS8 2015 AT A GLANCE9 STRATEGIC FOCUS FOR 2016
10 OUR OPERATIONS 10 Governance and Accountability
11 Risk Management
12 Banking Operations
13 Box 1: Monetary Policy 2015
14 Foreign Reserves Management
15 Exchange Control Arrangements
15 Payments & Settlement Systems
17 Economic Analysis, Statistics & Research
17 Prudential Supervision & Regulation
22 Box 2: Regulated Entities
23 Information Technology
23 Property Management and Health & Safety in the Workplace
23 Staff Complement & Relations
24 Staff Development
25 Community Relations and Outreach
25 2015 Financial Performance
27 ECONOMIC AND FINANCIAL ENVIRONMENT
27 International Economic Developments
28 Domestic Economic Developments
29 Real Sector
29 Tourism
29 Construction
30 Employment
30 Prices
30 Fiscal Operations
30 FY2014/15 Performance
32 First Six Months of FY2015/16
32 National Debt
33 Foreign Currency Debt
33 Money Credit and Interest Rates
33 Liquidity
34 Money Supply
34 Domestic Credit
34 Interest Rates
35 Net Foreign Assets
36 Other Banking Sector Trends
36 Credit Quality
36 Capital Adequacy and Provisions
37 Bank Profitability
37 Capital Market Developments
37 International Trade and Payments
38 Domestic Economic Outlook for 2016
THE CENTRAL BANK OF THE BAHAMAS FINANCIAL STATEMENTS 43 Independent Auditor’s Report to the
Directors
44 Statement of Financial Position
46 Statement of Comprehensive Income
47 Statement of Changes in Equity and Reserves
48 Statement of Cash Flows
50 Notes to the Financial Statements

6 Central Bank of The Bahamas
The year 2015 marked an important milestone, as the Bank said farewell to its first female Governor, Mrs. Wendy Craigg. She provided exemplary
service during her tenure of over a decade, ending a distinguished central banking career that spanned more than thirty years.
The economic environment in which the Bank operated was one of subdued growth supported mainly by an improvement in stopover tourism. The construction sector benefitted from several important foreign investment funded projects with high domestic input. However, the measured activity retracted, as the development phase of the multi-billion dollar Baha Mar resort drew to a close. Moreover, the bankruptcy proceedings, which subsequently disrupted the resort’s opening, stalled anticipated tourism gains and reversed a significant employment buildup that occurred to support the resort’s operations.
On a positive note, The Bahamas benefitted from a further decline in global oil prices. This eased outflow pressures on foreign exchange reserves and countered the inflationary impact of the Value Added Tax (VAT), which was introduced on 1st January.
With the significant reduction in the oil import bill, foreign reserves, a key target of monetary policy, increased again during 2015. This time, inflows from tourism outweighed the retrenchment in net receipts from public sector foreign currency borrowing. In this context, the Bank’s Monetary Policy Committee (MPC) determined that no policy adjustment was necessary, since neither significant upward or downward pressures were exerted on the reserves. In particular, potential downward pressures from the credit-induced demand for imports, were constrained by the commercial banks’ conservative lending posture, given the overhang of loan delinquencies within the banking system.
The VAT, as the centrepiece of the Government’s medium-term fiscal consolidation strategy, underpinned a sizeable reduction in the deficit on a calendar year basis. In the context of broader revenue administration reforms and expenditure restraint, this sets the stage for a gradual decrease in the public debt burden over the medium-term.
Our capacity to collect and process data for supervisory and economic surveillance purposes was enhanced
during the year. In April, a new Online Reporting and Information Management System (ORIMS) was launched to simplify reporting and to improve the accuracy of data submitted by our licenses. The ORIMS infrastructure will also allow the Bank to reduce the timelines to compile, analyse and disseminate information.
Progress was also made on legal and regulatory initiatives. Notably, the Bank assumed full oversight of credit unions. In addition, efforts continued towards the establishment of a domestic credit bureau, as the draft legislation neared completion and public consultation on the proposals intensified. Improvements to the dormant accounts regulations were also advanced nearer to implementation, while intense focus was also placed on proposals to develop a more robust financial sector crisis resolution framework. In the area of exchange control administration, recommendations were also prepared for the Government to effect another round of liberalisation of the regime in 2016.
With regard to our licensees, the Bank, through its supervisory department, continued to conduct risk assessments, onsite examinations, prudential meetings and off-site monitoring. Risks assessments revealed that domestic licensees remained well capitalized and therefore able to withstand adverse credit shocks. That said, the supervisory emphasis remained on strengthening capital adequacy and risk management systems, to the standards prescribed under Basel II & III.
In all areas of our operations, we are building organizational capacity through succession planning for high-value positions. To this end, both Bank and staff initiated training accordingly, enjoy the support of Management.
The Bank’s strategic objectives could not have been successfully achieved without the continued hard work and dedication of its staff. I therefore wish to thank them for their cooperation and support, and look forward for their ongoing commitment in the future.
John A. Rolle Governor
FOREWORD

2 0 1 5 A N N U A L R E P O R T 7
DIRECTORS AND SENIOR OFFICIALS
1 Mr Demeritte joined the Board of Directors on 19th January, 2016.
The Central Bank’s Board Members from left: Archdeacon James Palacious, Mr. Donald Demeritte1, Governor Mr. John Rolle, Mr. L. Edgar Moxey and Ms. Paula Adderley. Inset: Immediate Past Governor, Mrs. Wendy M. Craigg, who demitted office on December 31, 2015.
The Central Bank’s Executive Management Team seated from left: Mrs. Cleopatra Davis, Internal Audit Manager; Ms. Deborah Ferguson, Human Resources Manager; Mr. John Rolle, Governor; Mrs. Tamieka Watson, Exchange Control Manager; Ms. Rochelle Delevaux, Legal Counsel. Back row from left: Mr. John Ferguson, Chief Security Officer; Mr. Abhilash Bhachech, Inspector of Banks and Trust Companies; Mr. Michael Lightbourne, Deputy Governor; Ms. Karen Rolle, Banking Supervision Manager; Mr. Ian Fernander, Administration Manager; Mr. Derek Rolle, Banking Manager; Mr. Alwyn Jordan, Senior Economist, Research Department; Mr. Keith Jones, Accounts Manager.

8 Central Bank of The Bahamas
2015 AT A GLANCE
• The domestic economy expanded at a very mild pace in 2015, following a gain of 1.0% a year earlier, supported by modest growth in stopover tourism, but against a backdrop of subdued foreign investment-led construction activity.
• Domestic inflation remained relatively low, despite the introduction of the VAT, reflecting the falloff in international oil prices.
• Employment conditions improved modestly, with the jobless rate moderating to 14.8% by November 2015, from15.7% a year earlier, although the gains recorded during the first half of the year were partially reversed.
• The fiscal deficit to GDP ratio narrowed by an estimated 1.4 percentage points to 4.4% in FY2014/2015, buoyed by the VAT-led growth in revenue, which outstripped the increase in expenditure.
• At end-December, the National Debt to GDP ratio stood at 76.3%, higher than the prior year’s 73.7% rate, while the central government’s liabilities approximated 67.8% of GDP, compared to 65.5% in 2014.
• External reserves firmed by $24.3 million to $811.9 million over the year, and in the context of reduced global oil prices, helped boost the import reserve cover by 2.2 weeks to 13.7 weeks by end-December—in excess of the 12 weeks benchmark.
• The Bank assumed regulatory oversight for credit unions on 1st June, inclusive of The Bahamas Cooperative League Limited.
• The second phase of the implementation of the Basel II & III supervisory framework for banks and trust companies was executed, with specific emphasis on the licensees’ Internal Capital Adequacy Assessment Process (ICAAP).
• Drafts of the Credit Reporting Bill and accompanying regulations approached completion.
• The Bank launched the Online Information Reporting and Management System (ORIMS) in April, which, inter alia, enhances the efficiency of the reporting and processing of data submitted by licensees.
• A new set of proposals for further liberalization of Exchange Controls were presented to the Government for consideration.
2 0 1 5 A N N U A L R E P O R T 9
Strengthen the Monetary Policy Framework
• Strengthen the economic forecasting framework• Enhance financial stability framework to include monitoring of “shadow banking” sector and improve the
analysis in semi-annual financial stability reports.• Implement the latest Balance of Payments compilation reporting methodology (BPM6) and commence
publication of the Bahamas’ International Investment Position (IIP) Accounts.• Enhance the external communications mechanisms for monetary and financial sector policies.
Strengthen Regulatory and Supervisory Framework
• Develop oversight mechanisms to cover licensing and supervision of non-bank retail payment services providers.
• Promote development of a comprehensive legal framework for consumer financial protection and financial literacy.
• Further align supervisory practices with international standard prescribed under the Basel III framework, and progress the Risk Based Supervisory Framework (RBSF) to include the ever-greening of risk assessments, alignment with the Ladder of Supervisory Intervention guidelines and full integration with onsite examinations.
• Strengthen onsite examination capacity and extend supervisory coverage, through specialist resources.• Sustain monitoring of credit risks, by conducting regular meetings with commercial banks and undertaking
stress testing exercises.• Sustain the modernization of the oversight mechanisms for credit unions, including the integration of risk
based supervisory processes. • Promote further development of the legal and regulatory framework for financial sector crisis management,
dormant accounts, and non-bank lending.• Accelerate the introduction of the credit bureau mechanisms, on enactment of the Credit Reporting Bill.
Enhance Operational Efficiency
• Advance additional reviews to improve the administration of Exchange Controls on current and capital account transactions.
• Strengthen the staff performance management and compensation system, through sustained emphasis on capacity building and succession planning.
• Continue to modernize the information technology infrastructure and the delivery platform for services provided to staff and the general public.
• Introduce a multi-year budget formulation and planning horizon process• Update the business continuity/recovery plans and further improve the adequacy and security of the physical
work environment.
STRATEGIC FOCUS FOR 2016

10 Central Bank of The Bahamas
OUR OPERATIONS
GOVERNANCE & ACCOUNTABILITYThe Bank’s corporate governance framework, as outlined in the Central Bank of The Bahamas Act, 2000 (the Act), prescribes, inter alia, the roles and responsibili-ties of the Board of Directors, the Governor and the Deputy Governor.
Board of DirectorsThe Board of Directors has overall responsibility for the policy and oversight of the Bank’s management and operations, including strategic planning, finan-cial and accounting practices and procedures, risk management and succession planning.
Appointed by the Governor General, on the advice of the Minister of Finance, the Board is comprised of the Governor (Chair) and four independent direc-tors. At end-2015, the members of the Board were Archdeacon James Palacious, Mr. L. Edgar Moxey and Ms. Paula Adderley, who were each reappoint-ed for one year from 1st July, 2015. Mr. Maxwell Gibson—who was initially appointed to the Board on 1st June, 2012—concluded his term in office on 30th June, 2015. The Bank expresses its thanks to Mr. Gibson for his contribution to the work of the Board.
As required under the Act, each Director must sign a declaration of secrecy in relation to the affairs of the Bank, and is indemnified by the Bank against personal, civil or criminal liability in respect of their actions done in good faith, while carrying out their statutory duties. Board members must also subscribe to a Code of Conduct, which provides guidance on the ethical standards expected of them in the execution of their duties.
The Board, which is statutorily required to hold monthly meetings, met on 12 occasions in 2015. There is statutory provision for the appointment of two Deputy Governors, who may attend Board meetings but are only eligible to vote in cases where, in the absence of the Governor, they chair the Board meeting. Currently, only one Deputy Governor has been appointed.
During 2015, the Board’s agenda included discus-sions on the progress made by the Bank in reaching the goals outlined in its Strategic Plan, as well as de-velopments in the domestic and international econom-ic and financial environments and their implications for external reserves. The status of proposed legislative amendments, which could potentially impact the Bank’s operations, was also monitored.
Audit CommitteeThe Board is supported by the Audit Committee in carrying-out its oversight functions. Membership comprised Mr. L. Edgar Moxey (Chair), Archdeacon James Palacious and Ms. Paula Adderley. The Heads of Internal Audit and the Accounts Department also attend the meetings of the Committee.
The Committee convened on 12 occasions and addressed various issues, including internal audit methodologies, plans and operations, risk exposures and other policy matters. In addition, one meeting was held with the external auditors. In this regard, recommendations were made on the adequacy of financial reporting, the effectiveness of internal audit and controls and risk management.
Accountability & TransparencyThe Bank is mandated, by statute and best business practices, to ensure a high degree of transparency, which facilitates accountability. In compliance with these obligations, the Bank furnished the Minister of Finance with a report of its activities for 2014, which was subsequently laid before Parliament. Monthly balance sheet information was also provided to the Minister and published in the Gazette.
The Governor maintained the scheduled monthly brief-ings with the Minister of State for Finance, and provid-ed special periodic communications, both written and verbal, on industry-related matters as they emerged. These meetings help to facilitate coordination of mon-etary and fiscal policy, and provide an opportunity to keep the Government informed of the Bank’s perfor-mance in meeting its statutory obligations.
Information on the domestic economy was published in the Bank’s Monthly Economic and Financial Development (MEFD) reports, Quarterly Economic Reviews (QER) and Quarterly Statistical Digests (QSD). These publications, along with other announcements, notices and press releases, were made available to the public on the Bank’s website.
In other activities aimed at promoting accountability and transparency, the Governor and senior officers

2 0 1 5 A N N U A L R E P O R T 11
of the Bank gave official speeches on various topics, including the performance of the domestic economy, the impact of external sovereign credit ratings on the country and developments in the regulatory and super-visory space.
Management CommitteeThe Governor, Deputy Governor and Senior Officers oversee the daily operations of the Bank. In weekly meetings, the Executive Committee discussed progress with strategic activities and the work programme for the year. Emphasis was placed on addressing recruitment and skills development needs and on the prudent execution of the Bank’s operating policies and procedures. Decision making on matters pertaining to the Bank’s critical functions, continued to be supported by several other key internal committees, including the Monetary Policy Committee (MPC), the Regulatory Policy Advisory Committee (PAC), the Investment Committee, Staff Recruitment, Selection & Appointment Committee and the Pension Administrative Committee.
Legislative IssuesIn 2015, the Bank sustained its efforts to either pro-pose or make amendments to the legal and regulatory framework governing its statutory mandates. Key initiatives included proposed strengthening of the Dormant Account regime, revisions to the Bank and Trust Companies Regulations Act (BTCRA) to allow for administrative penalties, the development of legislation to address crisis management, and further stakeholder engagement on establishing a credit bureau.
The Bank commenced public consultations on the proposed amendments to the Dormant Account frame-work. Currently, licensees are required to transfer to the Bank’s custody all deposit accounts on which no customer directed activity has taken place for a period of at least 7 years. These transfers release licensees from liability for such accounts and protect the future claims of depositors. These amendments would extend protection to securities, precious metals and precious gems (excluding jewelry); recognize liabilities at their Bahamian dollar equivalent on the date of transfer and reduce the period for the expiry of eligible claims against dormant accounts from 25 to 10 years. More transparency will also be institutionalized on the invest-ment and management of dormant funds, rules on the payment of interest on transferred balances and rules for payment of surplus earnings to the Treasurer.
In the area of the Administrative Monetary Penalties Regime, the Banks and Trust Companies Regulation (Amendment) Act, 2015 came into effect on 1st June. The accompanying Banks and Trust Companies (Administrative Monetary Penalties) Regulations,
2015, have been finalized and will be brought into effect in mid-2016. These regulations empower the Bank to impose administrative penalties for, inter alia, any breaches of the Banks and Trust Companies Regulation Act (BTCRA) and regulations, as well as any failure to comply with a directive or order of the Bank.
With technical assistance (TA) from the IMF, the Bank also made progress on the roadmap to establish a legal and regulatory framework for bank resolution, which would align with international best practices. The IMF provided TA on the required legal and policy infrastructure on which broader public stakeholder consultations began in the first quarter of 2015. The expert presentations to public and private sector inter-ests, stressed the rationale for the proposals, and high-lighted benchmarking against key attributes of effective resolution regimes in other jurisdictions. On the basis of a discussion paper issued during May, 2015, the Bank will now propose conforming amendments to the BTCRA, the Central Bank of The Bahamas Act and the Protection of Depositors Act, to enhance the crisis management and bank resolution framework.
As at end-2015, the draft Credit Reporting Bill and the draft Credit Reporting Regulations were in the process of being finalized for eventual adoption by the Government and presentation to Parliament. The public awareness campaign for this initiative contin-ued in 2015, highlighting the impact that the bureau is expected to have on consumers. The Bank also finalized a brochure on the credit bureau project for dissemination by credit providers, including the com-mercial banks and credit unions.
RISK MANAGEMENT The assessment, control and minimisation of risks are always key goals of the Bank. Both the Internal Audit and Information Security Units play integral roles in these processes.
Internal AuditThe Audit Committee of the Board of Directors directs the oversight of the Bank’s system of internal controls, the audit process and risk management. Risk manage-ment processes are embedded within the operations of the Bank and the framework assists in identifying, assessing and monitoring both the material risks to the Bank’s mission, and the actions taken to mitigate them.
Internal Audit (IA) supports both the Audit Committee and the Management, discharging its responsibilities through the independent evaluation of the adequacy and effectiveness of internal controls and risk man-agement and governance processes. To maintain independence, the Head of IA reports functionally

12 Central Bank of The Bahamas
to the Audit Committee and administratively to the Governor.
The processes evaluated by IA during 2015 included the IT systems development life cycle, information security, financial accounting & reporting, account reconciliations, fixed assets, contract & project man-agement, foreign investments, currency & payments, payment systems, the business continuity/disaster re-covery plan, capital transactions, foreign currency ac-counts, dormant accounts management and banking supervision. The Unit also supported various working committees of the Bank, geared towards promoting a robust control and compliance environment; and the external reviews of the Bank.
Information SecurityIn 2015, the Bank made significant progress in the development of its information security (IS) pro-gramme, including strengthening data protection and integrity, while safeguarding information assets and resources. The Bank established terms of reference for an Information Security Steering and Advisory Committee, to address Bank-wide issues involving IS and to establish priorities for information security. A more focused framework was also implemented to manage the performance of information security by measuring, monitoring and reporting on vulnerabili-ties, incidents and other governance issues.
To improve systems log management, systems monitoring and visibility, the Bank installed the IBM QRadar Security Intelligence and Event Management (SIEM) Solution. The SIEM assists in reducing the level of IT security blind spots, improves the correlation of systems’ logs and provides comprehensive systems audit reporting across the network. The SIEM also provides zero day threat alerts, catalogues and anal-yses vulnerabilities for automatic threat detection and can assist management in prioritizing remediation processes.
In the area of public awareness, the Bank hosted its second annual information security month and fair in June, which featured both local and international exhibitors and speakers.
BANKING OPERATIONSCurrency
The Bank manages the supply of all Bahamian currency in circulation, and sponsors public educa-tion campaigns on the security and design features of currency, to assist in the detection and prevention of counterfeiting and other fraudulent activities. The Bank routinely monitors the quality and durability of currency in circulation and periodically adjusts design aesthetics, security and material composition
to take advantage of evolving industry trends and enhancements.
The Bank began work to further update the family of Bahamian banknotes in 2013. It now expects to introduce the Counterfeit Resistant Integrated Security Product (CRISP) Evolution or CE, a suite of modern, durable banknotes in 2016. These will incorporate sleeker designs, stronger materials and substantially upgraded security features. The first release will be the CE $10 note, featuring a range of national images and previewing the template on which the remaining denominations will be fashioned.
In February 2015, the Bank released a redesigned 5¢ coin, the fourth remodelled issue, following updates to the 1¢, 10¢, and 25¢ coins. There are no plans to redesign the 15¢ coin, a low circulation novelty denomination that saw a 33.0% reduction in demand in 2015.
The Bank maintains a complement of thirteen currency denominations in active circulation, with five coins ranging from the 1¢ to 25¢ pieces and notes ranging from the $½ to the $100 bills. Currently, the 1¢ coin and $1 bill account for the largest respective quanti-ties of coins and banknotes in circulation. Conversely, the 15¢ coin and $3 bill represent the smallest respective quantities in circulation.
In 2015, the total value of currency in active circula-tion grew by 6.7% to $1,126.8 million. Banknotes accounted for the bulk ($737.7 million) of the total, with values concentrated in the $100 and the $50 bills at $147.5 million and $108.7 million, respectively.
In keeping with its goal to reinvigorate the numismatic coin programme, the Bank released the 2014 $10 Aerial View of the Islands of The Bahamas coin in March. This is the first instalment in a five-year series, minted in fine silver with colour on the obverse and capturing a view of the islands of The Bahamas as seen from space. It is the culmination of a 3-year project involving a number of stakeholders including, the Ministry of Tourism, members of the numismatic industry and the Royal Canadian Mint. The second coin in the series, Exuma Reefs, is expected to be released in 2016.
The Banking Department, in collaboration with its stakeholders, continued in its fight against counterfeit-ing by providing scheduled and ad hoc counterfeit detection courses to members of the public. The Bank forecasts an increase in demand for these sessions in the coming year, with the impending release of the CE $10 note. Awareness of banknote security will be further enhanced with the introduction of an interac-tive web page, which will detail the key features of the new note. Data suggests that the incidence of

2 0 1 5 A N N U A L R E P O R T 13
The Central Bank’s Monetary Policy Committee (MPC), is chaired by the Governor and comprises several Heads of Departments and technicians. The MPC is charged with ensuring that the Bank’s monetary policy stance is appro-priately tuned to promote financial stability and maintain orderly balance of payments conditions that support the fixed ex-change rate regime and economic growth. In this regard, the Committee analyses economic and financial trends in both the domestic and external environment during its de-liberations. The monthly assessments of the MPC are summarized in reports, which are published electronically within five days of each meeting.
During 2015, the Committee’s discussions were conducted against the backdrop of several domestic economic and financial trends, a number of which have persisted over an extended period. Specifically:
• the mild pace of growth and elevated unemployment, amid a subdued recovery in tourism
• the delayed completion of the multi-billion dollar Baha Mar re-sort, which weighed negatively on growth and employment prospects
• implementation of the VAT in January 2015, as the cornerstone of the Government’s fiscal reform agenda
• sustained weakness in private sector credit, given the high level of both consumer arrears and non-performing loans (NPLs)
• modest gains in external reserves, supported primarily by net inflows from real sector activities.
In assessing the external risks to the domestic economy, the Committee noted three key themes. The first
two, on an upside basis, were the sustained growth in the United States’ economy—the major visitor market—which supported a reduction in the US’ unemployment rate; and the sharp decrease in global oil prices and consequently domestic fuel costs. The third, a slowdown in China posed down-side concerns; however, given the potential for a spill-over into weaker consumer spending in other major markets.
The Committee maintained its strict monitoring of its key external re-serve adequacy indicators, relative to base money and imports. On a seasonal basis, the ratio of reserves
to base money rose over the first quarter of the year, although it remained below the 90% to 100% range. By the end of April, the indicator had risen to 90.7% and averaged 91.4% over the next five months, before the seasonal
drawdown in balances lowered the coverage to 82.8% at end-2015. This was an improvement from the 80.1% closing estimate for end-2014.
Similarly, the more broadly tracked reserve cover-age in weeks of annual merchandise imports, rose steadily from 11.5 weeks at end-2014, to 12.1 weeks in the first quarter,
and peaked at 13.9 weeks in the following three months—well in excess of the 12.0 weeks bench-mark. The seasonal reduction in external assets, resulted in the indicator falling to 12.7 weeks in the third quarter, but by end-Decem-ber, the estimate improved to 13.7 weeks of imports.
The Committee also monitored key financial soundness indica-tors during the year. In particular, bank liquidity remained buoyant, while capital levels stayed well in excess of the Central Bank’s 17% target and 14% trigger ratios. Commercial banks remained adequately provisioned against
the high levels of arrears and non-performing loans in their private credit portfolios.
Given the mild domestic recovery, subdued credit demand and adequate levels of external reserves, the MPC determined that the Bank would keep its policy stance unchanged throughout the year, in order to maintain prudent levels of external reserves.
BOX 1: MONETARY POLICY 2015

14 Central Bank of The Bahamas
counterfeiting of the local currency has been extremely low, as the detection rate has been at less than 3.5 parts per million (ppm) of counterfeit banknotes, com-pared to the global average target of 50 ppm.
Public Debt Administration Historically, the Bank served in the capacity of Registrar and Transfer Agent for the issuance and administration of the stock of Government paper. However, the Government has committed to migrating the issuance of new debt to the broker/dealer market and vesting the Registrar and Transfer Agent respon-sibilities for new debt with the Bahamas Central Securities Depository (BCSD). This regime was initi-ated in the fourth quarter of 2014. To-date, 8 bond issues have taken this route, raising $497.45 million. The Bank will; however, continue to act as Registrar and Transfer Agent for all existing issues.
During 2015, the Government’s short-term domes-tic liabilities increased by $20 million to $599.3 million, due to net Treasury bill taps of the same amount. The average tender rate (on rollover maturities) decreased by 4 basis points to 99.83% for 91-day issues, but with 75% of the auction amounts being undersubscribed. Outstanding Bahamas Government Registered Stock (BGRS) fell by $155.0 million (5.3%) to $2,795.5 million at December 31, 2015, as maturities and repayments totalling $165.0 million, eclipsed a $10.0 million issuance.
The Bank also acts as Registrar and Transfer Agent for several public corporations. During 2015, $5.3 mil-lion in Bridge Authority Bonds were issued, increasing the outstanding amount to $28.3 million. The corre-sponding liabilities were unchanged for the Clifton Heritage Authority ($24.0 million), the Education Loan Authority ($67.0 million), the Bahamas Development Bank ($50.0 million) and the Bahamas Mortgage Corporation ($165.1 million).
Dormant Accounts AdministrationThe Central Bank is the custodian and manager of dormant deposit accounts. Financial institutions are required to transfer over such balances once the corre-sponding accounts have been inactive for at least 7 years.
During 2015, the number of dormant facilities handed over to the Bank increased by 13.0% to 1,132, bringing the total accounts held to approx-imately 39,000. The corresponding dormant bal-ances totalled $86 million—inclusive of investment returns—and were denominated in 7 currencies. Most liabilities were in United States Dollars (54.9%) and in Bahamian Dollars (31.8%). Other denominations included the Canadian Dollar, British Pound, Swiss Franc, Euro, Australian Dollar and Hong Kong Dollar.
FOREIGN RESERVES MANAGEMENTThe Bank manages the country’s foreign currency assets to meet liquidity needs occasioned by The Bahamas’ net external payments and to generate earnings to support operating expenses. The asset allocation strategy for reserves promotes an external portfolio comprised of cash and cash equivalents, overnight repos, fixed deposits, sovereign securities, as well as Special Drawing Rights (SDRs) and the reserve position (reserve tranche) in the IMF.
The Bank’s Investment Committee (IC) implements and monitors the strategic asset allocation mandated under the Central Bank Act and the Board-approved Investment Policy and Guidelines. The IC regularly monitors economic conditions and formulates strate-gies to assist the Government with the management of domestic debt instruments and operational risks. The Committee also monitors adverse market trends that could potentially dilute reserves.
The Bank maintains a conservative investment strat-egy, that emphasizes the preservation of capital. Investments are in high quality investment grade instruments that generate moderate returns. Throughout the course of the year, the Bank was able to maintain sufficient liquidity to settle both routine and one-off external payments.
Although yields on US government securities remained low, the average return on US Treasuries increased by 29 basis points to 2.71%, vis-à-vis 2.42% in 2014. Also, the average US dollar deposit rate rose by 4 basis points to 0.23% in 2015.
Modestly improved receipts from the tourism sector and foreign direct investment proceeds remained the major sources of foreign exchange inflows. Meanwhile, the significant falloff in global oil prices reduced outflow pressures from fuel-related imports, which supported

2 0 1 5 A N N U A L R E P O R T 15
an improvement in foreign reserve balances by $24.3 million to $811.9 million, at end-December.
EXCHANGE CONTROL ARRANGEMENTSThe Bank continued to discharge its legislative mandate to administer Exchange Controls, through diligent monitoring of the demand for foreign currency and servicing of the public’s approval needs.
A key component of these efforts was ongoing steps to create efficiencies in the administration of the re-gime. In September 2015, the Bank issued revamped guidelines to commercial banks covering an expand-ed signatory pool for both Bahamian dollar and foreign currency account holders who are resident/non-resident for Exchange Control purposes. The Bank also outlined a new set of proposals for further liberal-ization of Exchange Controls. These were discussed with key stakeholders before being forwarded for the Government’s consideration at the end of the year. The proposals include an increase in the limits on a number of current payment categories that can be ap-proved by authorized dealers and adjustments in the limits on key capital account items. These adjustments will take effect in 2016.
As part of the Bank’s ongoing efforts to strengthen the commercial banks’ information reporting regime, members of the Exchange Control Management Team conducted extensive training sessions with senior management of a key licensee, covering Exchange Control approvals, residential status and account classification issues, to ensure the integrity of the information being compiled and reported. Training was also provided to staff from the commercial banks and money transmission businesses (MTBs) on foreign exchange sales under delegated authority.
Pursuant to the 2006 Exchange Control liberalization initiatives, two of the licensed Bahamas International Securities Exchange (BISX) broker dealers participat-ed in the Bank’s administered Bahamas Depository Receipt (BDR) programme in 2015. An estimated 48.0% ($12.0 million) of the $25.0 million allocated for the scheme was utilized by the broker dealers, a reduction from the 87.2% ($21.8 million) draw-down in 2014. No disbursements were made to the National Insurance Board, compared to $6.25 million in 2014.
Residents continued to make outward capital invest-ments through the Investment Currency Market (ICM) at premium bid and offer rates of 12.5% and 10.0%, respectively. Such foreign currency sales totalled $8.0 million, down from $14.5 million in the prior year, while purchases fell by $0.2 million to $0.5 million.
Commercial banks and trust companies facilitate current or capital account transactions in accordance
with their status as Authorised Dealers and Authorised Agents and continued to play a key role in the admin-istration of the Exchange Control regime. At end-2015, the number of Authorised Dealers remained unchanged at 8, while the number of Agents declined by 1 to 9.
PAYMENTS & SETTLEMENT SYSTEMS
Oversight The Bank, through its Payments Unit, continued to focus on enhancing the oversight of the Bahamas’ payment and settlement systems. Quarterly meetings were held with members of the Bahamas Automated Clearing House (BACH), which processes small-value payments of less than $150,000. These meetings considered the collateral and settlement issues of the commercial banks, internal audits and other signifi-cant developments that emerged. There were similar engagements with key stakeholders of the Central Bank-owned Bahamas Inter-bank Settlement System (BISS), which provides real-time gross settlement (RTGS) functions for large-value payments greater than $150,000. Such discussions elicited feedback on ways to improve operational efficiency, as well as the ongoing development of the BISS.
Market DevelopmentsIn 2015, the Bank deployed scheduled enhance-ments to the BISS, including new connectivity moni-toring tools—with automated alerts—and improved transaction recovery protocols, which enhanced the robustness and resilience of the automated settlement framework. This measure builds upon significant improvements incorporated into the launch of a new RTGS in 2014, which makes the BISS one of the most sophisticated settlement systems in the region.
During 2016, the Bank plans to further enhance the BISS user experience with additional operational func-tionality. One such upgrade is the deployment of the Global Collateral Service (GCS) that will allow RTGS participants to collateralize once per day for all auto-mated clearing house settlement sessions, rather than presently seven times per day. This, combined with the planned roll-out of the Trusted Payments and Settlements Initiative (TPSI), will allow transactions from other core internal systems to settle automatically and will com-plete the suite of planned enhancements to the BISS.
Real Time Gross Settlement (RTGS)In 2015, RTGS transactions continued to increase. In addition to direct interbank transactions, the 7 participating clearing banks processed X9 (cheques) and NACHA (direct credits) payments over the BISS/RTGS, in 7 daily settlement windows, starting at 8:15

16 Central Bank of The Bahamas
a.m. and ending at 4:45 p.m. The volume of transac-tions processed through the RTGS system advanced by 15.9% to 75.7 million, after an increase of 16.5% in 2014. The value of these transactions grew by 23.4% to $22.2 billion, extending an expansion of 38.2% to $18.0 billion in 2014.
ChequesThe most notable payment trend observed over the past decade has been a decline in the use of cheques—with the exception of large value trans-actions. Processed instruments fell again, by 2.3% to 2,743,182, following a reduction of 2.9% to 2,808,412 in 2014. However, the associated value of these payments rose by 8.9% to $7.7 billion, compared to the increase of 9.7% to $6.9 billion in the previous year.
NACHA PaymentsPayment instructions through the BACH conform with the globally accepted National Automated Clearing House Association (NACHA) format. The volume of these transactions rose by 10.5% to 2.1 million, after a 12.7% gain in 2014 and the associated value, by 11.7% to $1,490.3 million.
Retail Payment ServicesThe increasing use of technology has been a key driver behind the development of the payments landscape in The Bahamas over the past decade. This trend was sustained in 2015, with an expansion in the volume of electronic payments (e-payments), although the use of cash remains dominant.
Automated Teller Machines (ATMs)
Automated Teller Machines (ATMs) are installed throughout the country and are generally located inside commercial bank branches, while stand-alone machines can also be found in areas such as supermarkets and gas stations. Several of the machines—particularly those placed in high tourist traffic areas—are configured to dispense both Bahamian and US currency. During 2015, the
number of ATMs in operation increased by 3.0% to 344, facilitating 10.7 million transactions, valued at $14.4 billion. In contrast, the previous year saw a larger volume of transactions at 12.9 million items, although the associated value was signifi-cantly lower at $6.7 billion.
Debit Cards
Debit cards are issued locally by all of the commer-cial banks. International branding such as Visa and MasterCard, that permit both domestic and foreign transactions, have substantially replaced “non-brand-ed” cards. Given this impetus, the number of debit card transactions rose by 8.3% in 2015 to 7.8 mil-lion, while the corresponding value firmed by 50.8% to $9.5 billion.
Credit Cards
Credit cards issued by the local commercial banks are also generally branded by international logos such as Visa and MasterCard. Most personal cards have limits which range from $500 -$5,000, $5,000 -$10,000 and over $10,000. For select high net worth individu-als, the specific limits are negotiable.
An analysis of credit card data for the year showed that the number of cards issued rose by 19.8% to 190,712, extending the 27.7% gain noted in 2014, spurred on in part by banks’ incentive pro-grammes, such as the issue of pre-approved cards to existing customers. This however was not synony-mous with steeply accumulating debt, as unpaid bal-ances rose by only 1.2% to $249.2 million at end-2015. Overall growth was concentrated in cards issued with limits in excess of $10,000 to higher creditworthy borrowers, advancing by 64.8%, while the value of credit outstanding for this category rose by 17.4% to $61.7 million. The number of cards with limits of $5,000 - $10,000 and under $5,000 increased by 27.2% and 16.4%, respectively; however the value of credit outstanding by these two categories contracted by a respective 3.4% and 2.3% to $71.1 million and $116.4 million.
Internet Banking
All of the commercial banks offer some form of internet banking services to their customers, to allow them to, inter alia, check their account balances, make transfers between personal and third party bank accounts, pay utility bills and purchase foreign currency. The range of internet services differ between institutions and some banks charge a fee for providing these facilities. The Central Bank’s 2015 payments survey revealed that the number of residential and business accounts enrolled in these services expand-ed by 11.2% and 8.6% to 27,438 and 38,437, respectively.

2 0 1 5 A N N U A L R E P O R T 17
ECONOMIC ANALYSIS, STATISTICS & RESEARCHDuring the year, the Bank, through its Research Department, sustained its mandates for economic surveillance, internal policy formulation and exter-nal policy advice to key public sector stakeholders. Activities focused on the compilation and analysis of key economic indicators disseminated in various publications, including the Monthly Economic and Financial Developments (MEFD) report, the Quarterly Economic Review (QER) and the Quarterly Statistical Digest (QSD).
In December, the Bank’s suite of surveys was ex-panded to include the inaugural edition of the Bank Lending Conditions Survey. This publication contained an analysis of loan applications received by commer-cial banks during the second quarter of 2015. The Department also completed its annual survey on the Gross Economic Contribution of the Financial Sector to the Economy, for 2014, which was published in the March, 2015 edition of the QER.
Staff of the Department prepared a number of internal policy briefs based on requests, inter alia, from the Bank’s Monetary Policy Committee (MPC). In addition, staff’s independent research projects covered a variety of topics and were presented at the Department’s Roundtable Forums. These includ-ed, an assessment of the new minimum wage for The Bahamas, measuring the impact of Government spending on economic growth in The Bahamas, an in-vestigation of the factors which drive tourism demand in several Caribbean countries and a review of the changes in The Bahamas’ credit ratings over time. In addition, the study entitled “An Empirical Analysis of the Nexus between Private Sector Credit, Economic Growth, Government Expenditure, Interest Rates and Inflation: The Case of the Bahamas (1989-2014)”, was presented at the 47th Annual Caribbean Centre for Money and Finance (CCMF) Conference, in Guyana, in November 2015.
A key aspect of the Department’s operations is its outreach programme. In this regard, the staff made regular presentations to high school and college students on the role and functions of the Central Bank. The Bank, through the Department, also supplies eco-nomic analysis on The Bahamas to a wide variety of multilateral organizations, including the International Monetary Fund (IMF), the Bank for International Settlements (BIS), the Caribbean Centre for Money and Finance (CCMF), the Caribbean Development Bank (CDB) and the Inter-American Development Bank (IDB).
In an effort to ensure that the quality of the data com-piled continues to comply with evolving international
requirements, the Department benefited from an IMF sponsored Balance of Payments (BOP) technical assistance mission in July. This guided the additional steps taken to convert the existing BOP statistical compilation methodology to the latest BPM6 format. Plans were also initiated to prepare an International Investment Position (IIP) Report for The Bahamas.
PRUDENTIAL SUPERVISION AND REGULATION During 2015, the banking sector and regulatory regime continued to adjust in response to trends in the global regulatory and political environment. Amid the evolving business model of banks and trust compa-nies, the sector experienced further consolidation in the number of licensees operating from or within The Bahamas, although private trust vehicles continued to show gains. The domestic developments were also appropriately influenced by the local economic and financial environment. Licensees in both sectors, meanwhile, remained well capitalized relative to the conservative targets established by the Bank. Of noteworthy importance, was the placement of credit unions under the direct supervision of the Bank. In step with changes in the regulatory environment, the Bank maintained its practice of active consultation with the public and the industry on new and proposed chang-es to the supervisory infrastructure.
Basel II & III Implementation ProgrammeIn 2015, the Bank entered the second phase of its Basel II and III Implementation Programme. Among other things, this phase focused on the requirements for the Pillar 2 aspects of Basel II, with specific emphasis on licensees’ Internal Capital Adequacy Assessment Process (ICAAP). Early in the year, the Central Bank met with licensees to receive input on the development of the supervisory ICAAP Guidance. As part of the wider Basel II & III Implementation initiatives, the Bank also partnered with the IMF’s Caribbean Regional Technical Assistance Centre (CARTAC ) to host an industry session on the ICAAP, to sensitize licensees on the purpose of setting optimal internal targets for capital. The discussions also shed light on the importance of developing strategies that are consistent with licensees’ business plans, operat-ing environment and risk profile.
In March, the Bank conducted its first Quantitative Impact Study (QIS), gathering data to assess the impact of the Basel II and III implementation on licensees’ capital adequacy requirements. The study targeted 16 licensees on the application of the Basel III capital structure and the Pillar I capital measure-ments for credit, operational and market risk, tied to the licensees’ Q4 2014 capital adequacy reporting.

18 Central Bank of The Bahamas
Results revealed robust capital levels against the enhanced standards.
As the Bank approached the final phase of the programme, much of the work during the fourth quarter of 2015 was focused on preparations for live implementation in 2016. In October, two addition-al consultative papers were released for industry comments. These documents covered the calculation for the Capital Charge for Credit Risk: Standardized Approach and the Guidelines for the Internal Capital Adequacy Assessment Process (ICAAP). The Bank also released the finalized Financial Return Template (formerly the ERS Forms), in readiness for parallel reporting, scheduled to begin in the first quarter of 2016.
Risk-Based Supervisory Framework Some 86 public licensees have undergone some lev-el of assessment since the risk-based programme was launched in 2010. During the year, the Bank contin-ued to refine the framework, with particular focus on the concept of “evergreening” the risk assessments. A total of 36 assessments were scheduled, divided between 27 full and 9 simplified reviews. As at year-end, 18 had been completed, 16 were at various stages of progress, 1 was deferred to 2016 (due to the licensee’s restructuring) and 1 was dropped as a result of the liquidation of the licensee. All remaining “in-progress” reviews are expected to be completed in early 2016.
International FirmsThe international operations of banks and trust companies totaled 233 or 94% of all licensees; of this total, 121 or 52% originated from G-10 countries. Collectively, entities had an asset base of $180.5 billion, a reduction of $12.3 billion (6.4%) year-on-year.
During 2015, the Bank continued to focus on effec-tive prudential supervision of international firms via its main supervisory tools of risk assessments, on-site examinations, meetings with senior management of licensees and the relevant internal auditors, robust off-site surveillance and monitoring, and collaboration with home regulators.
Strategic shifts within the sector continued to impact the industry, as a result of global regulations and compliance with Basel-led requirements, such as capi-tal conservation and owing to global initiatives to pro-mote tax transparency and combat money laundering and terrorist financing activities. Adjustments were notable among Swiss owned banks, with bi-lateral tax arrangements between Switzerland and Italy to a certain extent, prompting a re-domiciling of some op-erations or assets out of The Bahamas. Still there has
been some growth in other sub-sectors, with restruc-turing, acquisitions, and further development of the core wealth management business. In the meantime, the sector continued to focus on effective compliance and risk management, and remained liquid and well capitalized.
Domestic Financial Institutions During 2015, the Bank Supervision Department main-tained enhanced monitoring of the domestic com-mercial banking sector. The Risk-Based Supervisory Framework was supplemented through structured periodic prudential meetings to discuss, inter alia, credit, liquidity and operational risks. The prudential discussions also included confidential sessions with the licensees’ chief internal auditors, and provided opportunities for licensees to discuss their internal risk models. Through regular assessments of regulatory data submissions, the Department also ensured that licensees adhered to all prudential limits set through-out the year.
The Department supported home supervisory author-ities with consolidated supervision of subsidiaries operating in The Bahamas, by participating in periodic teleconferences, regional and international supervisory colleges and the exchange of home/host supervisory letters.
The domestic asset base of commercial banks and trust companies increased by 1.8% to $9.8 billion during 2015. This continued to reflect an expan-sion in claims on the public sector, in contrast to the cautious posture adopted on private sector lending. Commercial banks maintained a reduced network of 79 branches in 2015, compared to 93 in the prior year, as a number of consolidations of branch operations and closures occurred during the year in an effort to manage costs.
On 1st June, 2015, the Bank assumed regulatory and supervisory responsibility for 9 credit unions, inclusive of The Bahamas Cooperative League Ltd., under The Bahamas Co-operative Credit Unions Act, 2015. The rollout of the supervisory activities; however, started in May encompassing onsite and offsite monitoring, poli-cy development and ongoing engagement with senior officials of the various credit unions. Subsequent to June, the Bank also held an industry briefing session with management and board members of all credit unions, to unveil the supervisory programme, and to outline its broad expectations as regulator.
As at end-December, credit unions registered total assets of $370.6 million, representing an average annual growth of 6.7% over the past 5 years. The membership totalled 40,604 persons, equivalent to an estimated 19.4% of the labour force.

2 0 1 5 A N N U A L R E P O R T 19
Credit Risk Reviews
As part of the Bank Supervision Department’s over-sight of credit risks and the mitigating controls in place in local banks, a two-tier approach was applied, in-clusive of an analysis of monthly financial returns and scheduled semi-annual credit risk meetings with senior management of the various licensees. The meetings are focused primarily on credit risk management, inclusive of developing trends within credit portfolios, delinquency management strategies, provisioning levels, total arrears; and specific aspects of oper-ational risk management, including but not limited to fraudulent activity and stress testing. It is during these discussions that the Bank is able to assess the qualitative and strategic measures taken by licensees to mitigate risks, otherwise not evident through the monthly financial returns.
Monthly information obtained from the banks include B$ loans, arrears and non-performing loans (NPLs), sectoral large exposures, provisioning levels and restructured loans. In this regard, outstanding personal credit remained stable, while the stock of commercial credit decreased. However, commercial banks pur-sued aggressive marketing campaigns targeting the narrow pool of creditworthy borrowers. Support for customers through debt consolidation and restructur-ing also continued, although banks have raised their lending standards. As a result, some banks reported that the performance of these loans had improved in terms of their stability. In line with prior communica-tions from the Bank Supervision Department, licensees allowed for exceptions to the required debt service ratio (DSR) for customers who were restructuring credit provided that no new funding was given. Such data was reported on a monthly basis to the Department.
Also evident from discussions with licensees and the information provided in the monthly returns, was the fact that the remediation of residential mortgages and commercial real estate/properties provided the greatest challenges for some banks. The value of dis-tressed properties continued to decrease, with those in the Family Islands sustaining greater reductions in value than those located in Nassau. Notably, some banks indicated that sales of distressed properties in 2015 were generally better than in the prior year. Nonetheless, banks were encouraged to strengthen their loan underwriting policies and collateral assess-ments, to ensure that they had sufficient allocation of specific provisions to adequately reflect the level of impairment in their portfolio. This is in addition to the close supervisory monitoring of the 1% minimum regulatory general provision requirement imposed on all licensees, as a mitigant for losses not yet identified or materialized in the aggregate credit exposures. Despite these challenges, banks remained above their
17% regulatory minimum capital risk-adjusted ratio, thereby mitigating any financial stability concerns.
Stress Testing
Stress tests examine the resilience of licensees to various extreme but plausible shocks to risk factors, such as credit quality, domestic interest rates and liquidity. The framework, employs both top-down and bottom up approaches to assess the effect of provi-sioning levels and net earnings on licensees’ capital adequacy ratios. During 2015, some licensees began the process of integrating these models into the overall Internal Capital Adequacy Assessment Process (ICAAP), as required under Pillar 2 of the Basel II framework. In the relatively stable domestic setting, in-terest risks were assessed as having little to no impact on the capital exposure of licensees. Buoyant liquidity levels also mitigated the potential risks.
With the mildly positive economic outlook, bench-mark NPL levels are expected to remain within the $850.0 million to $900.0 million range in the near-term. Stress testing indicated that capital buffers remain comfortable at a doubling in NPLs; however, additional capital would be required if delinquencies rose by 150% or 200%, as the assumed earnings reduction would escalate owing to increased loss provisions and depressed interest income (from non-accruals).
In 2015, commercial banks moved further towards the Basel III target of phasing out non-qualifying Tier II capital, with approximately $3.4 million in such funding retired. Although Canadian subsidiaries continued to repatriate surplus retained earnings, the domestic system ended 2015 with a total risk-weighted capital ratio of 33%, well above the established regulatory target and trigger ratios of 17% and 14%, respectively.
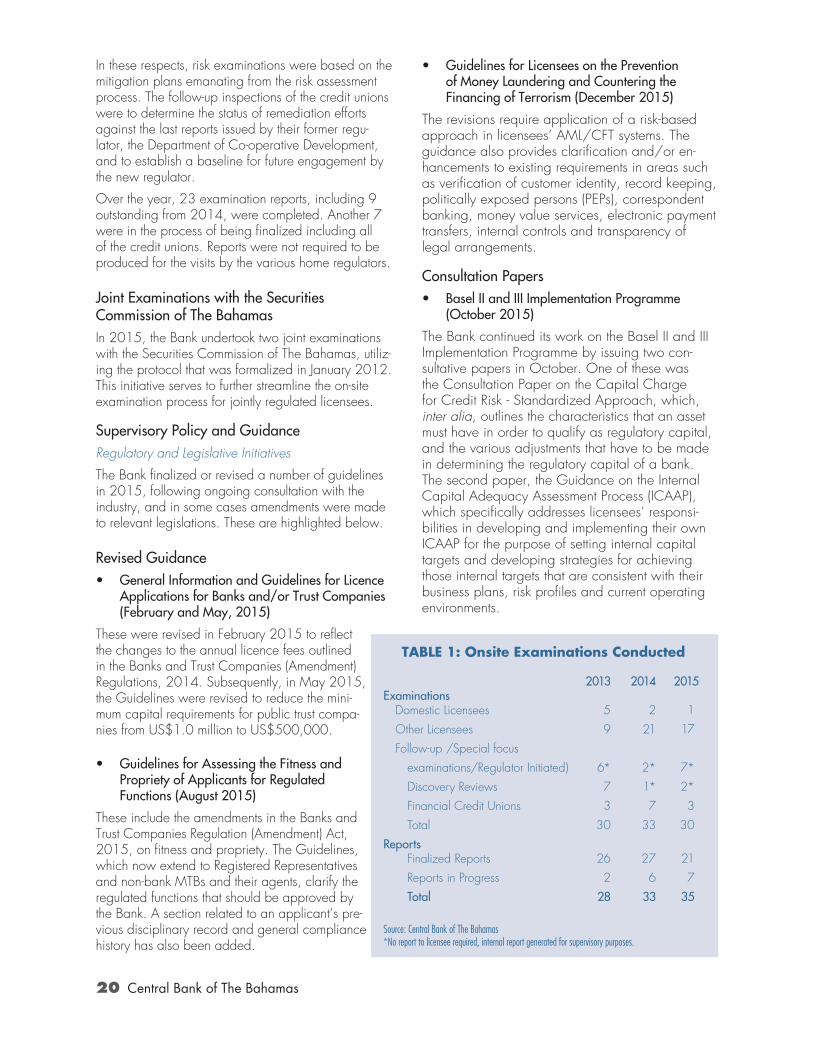
On-site Examination ProgrammeDuring the year, 28 on-site examinations and 2 discovery review meetings were completed (see Table 1). These included:
• 2 special focused examinations of commercial banks with reputation and credit risk respec-tively, with the credit risk examination being initiated by the home regulator
• 2 examinations of MTBs focused on reputation risk
• 3 follow-up inspections of credit unions
• 6 visits to international firms from various home regulatory authorities, focusing on reputation risk; and
• 15 international firms with a focus on corporate governance, reputation and fiduciary risk, and determination as to whether the previous exami-nations’ recommendations were implemented.
20 Central Bank of The Bahamas
In these respects, risk examinations were based on the mitigation plans emanating from the risk assessment process. The follow-up inspections of the credit unions were to determine the status of remediation efforts against the last reports issued by their former regu-lator, the Department of Co-operative Development, and to establish a baseline for future engagement by the new regulator.
Over the year, 23 examination reports, including 9 outstanding from 2014, were completed. Another 7 were in the process of being finalized including all of the credit unions. Reports were not required to be produced for the visits by the various home regulators.
Joint Examinations with the Securities Commission of The BahamasIn 2015, the Bank undertook two joint examinations with the Securities Commission of The Bahamas, utiliz-ing the protocol that was formalized in January 2012. This initiative serves to further streamline the on-site examination process for jointly regulated licensees.
Supervisory Policy and Guidance Regulatory and Legislative Initiatives
The Bank finalized or revised a number of guidelines in 2015, following ongoing consultation with the industry, and in some cases amendments were made to relevant legislations. These are highlighted below.
Revised Guidance• General Information and Guidelines for Licence
Applications for Banks and/or Trust Companies (February and May, 2015)
These were revised in February 2015 to reflect the changes to the annual licence fees outlined in the Banks and Trust Companies (Amendment) Regulations, 2014. Subsequently, in May 2015, the Guidelines were revised to reduce the mini-mum capital requirements for public trust compa-nies from US$1.0 million to US$500,000.
• Guidelines for Assessing the Fitness and Propriety of Applicants for Regulated Functions (August 2015)
These include the amendments in the Banks and Trust Companies Regulation (Amendment) Act, 2015, on fitness and propriety. The Guidelines, which now extend to Registered Representatives and non-bank MTBs and their agents, clarify the regulated functions that should be approved by the Bank. A section related to an applicant’s pre-vious disciplinary record and general compliance history has also been added.
• Guidelines for Licensees on the Prevention of Money Laundering and Countering the Financing of Terrorism (December 2015)
The revisions require application of a risk-based approach in licensees’ AML/CFT systems. The guidance also provides clarification and/or en-hancements to existing requirements in areas such as verification of customer identity, record keeping, politically exposed persons (PEPs), correspondent banking, money value services, electronic payment transfers, internal controls and transparency of legal arrangements.
Consultation Papers• Basel II and III Implementation Programme
(October 2015)
The Bank continued its work on the Basel II and III Implementation Programme by issuing two con-sultative papers in October. One of these was the Consultation Paper on the Capital Charge for Credit Risk - Standardized Approach, which, inter alia, outlines the characteristics that an asset must have in order to qualify as regulatory capital, and the various adjustments that have to be made in determining the regulatory capital of a bank. The second paper, the Guidance on the Internal Capital Adequacy Assessment Process (ICAAP), which specifically addresses licensees’ responsi-bilities in developing and implementing their own ICAAP for the purpose of setting internal capital targets and developing strategies for achieving those internal targets that are consistent with their business plans, risk profiles and current operating environments.
TABLE 1: Onsite Examinations Conducted 2013 2014 2015 Examinations Domestic Licensees 5 2 1
Other Licensees 9 21 17
Follow-up /Special focus
examinations/Regulator Initiated) 6* 2* 7*
Discovery Reviews 7 1* 2*
Financial Credit Unions 3 7 3
Total 30 33 30
Reports Finalized Reports 26 27 21
Reports in Progress 2 6 7
Total 28 33 35
Source: Central Bank of The Bahamas*No report to licensee required, internal report generated for supervisory purposes.

2 0 1 5 A N N U A L R E P O R T 21
• Bahamas Co-Operative Credit Unions Act, 2015 (June 2015)
The Act transferred regulatory and supervisory re-sponsibility for the credit unions to the Central Bank. Subsequently, the Bahamas Co-operative Credit Unions Regulations, 2015, were brought into force on 4th December, 2015. The Uniform Bye-Laws for Co-operative Credit Unions Operating in The Bahamas were also issued for consultation, to signal the intended strengthening of the governance and operational framework for credit unions.
Domestic, Regional and International CooperationThroughout 2015, preparation for the 4th Round Mutual Evaluation by the Caribbean Financial Action Taskforce (CFATF) dominated the focus of the Group of Financial Service Regulators (GFSR), which com-prised the 6 domestic regulators for the banks and trust companies, the securities industry, insurance companies, credit unions and financial and corporate service providers. Active engagement by the Legal Sub-Working Group continued throughout the year, in the lead up to the on-site mission in December 2015.
Supervisory co-operation plays a pivotal role in main-taining effective oversight of the financial institutions with domestic, regional and other international link-ages. Regarding regional and international cooper-ation, senior staff members of the Bank Supervision Department participated in regulatory colleges for the systemic commercial banks in 2015.
The Department also sustained its engagement with home consolidated regulators via the annual regu-latory letters, to ascertain risk areas identified within global groups and to determine whether there would
New Guidelines • Technology Risk Management Guidelines
(January 2016)
The draft Guidelines were issued for consultation on 30th October 2015 and subsequently finalized in January, 2016. These Guidelines aim to high-light risks inherent to deployment and management of technology, as well as to provide broad guid-ance for licensees on risk management principles and security practices. The framework also lays out supervisory expectations for establishing a sound and robust technology risk management frame-work; strengthening system security, reliability, availability and recoverability; and using appropri-ate technologies and control mechanisms to protect customer data and transactions.
• Credit Union Guidelines (December 2015)
The Bank issued four risk management and one corporate governance guideline for credit unions on 22nd December, 2015. These lay out regulato-ry expectations for credit unions against standards that converge to those applied for other supervised entities. The risk management guidelines cover liquidity, operations and interest rates.
Guidance Notices • Money Laundering Reporting Officers (MLROs)
in Nominee Trust Licensees (September 2015)
The Bank announced that it would not require nomi-nee trust licensees to appoint a separate individual to serve as the MLRO for licensed companies. Instead, individuals appointed to serve as the MLRO of the parent of the nominee trust licensee may also serve as the MLRO for its nominee trust companies. The Board of Directors’ resolution submitted to the Bank and the notification submitted to the Financial Intelligence Unit for the appointment of the MLRO of the parent should state that the same individual will also serve in that capacity for the nominee trust licenses.
Legislative Initiatives• Wire Transfer Regulations (December 2015)
After a period of consultation from October to December, the Bank replaced the Financial Transactions Reporting (Wire Transfers) Regulations, 2009 with the 2015 Regulations. These require financial institutions to ensure, inter alia, that infor-mation on the payee remains with electronic funds transfers throughout the payment chain, in compliance with Recommendation 16 of the Financial Action Task Force’s (FATF) 2012 revised AML/CFT recommenda-tions (formerly FATF Special Recommendation VII).
TABLE 2: Requests for Cooperation
Country Requests Received From Foreign Regulators
Barbados 3
Bermuda 1
Curacao/St. Maarten 2
Hong Kong 1
Peru 1
Philippines 1
Portugal 2
Singapore 1
Total Requests 12
Source: Central Bank of The Bahamas

22 Central Bank of The Bahamas
be any impact on the operations within The Bahamas. Through various established memoranda of under-standing (MOUs), information with respect to specific regulatory issues or financial, operational and environ-ment risk factors were exchanged.
Supervisory Cooperation
In 2015, the Bank received and responded to 21 information requests from 11 foreign regulatory au-thorities (see Table 2).
Membership in International and Regional Bodies
The Bank, represented by senior banking supervisory
During 2015, the number of bank and trust company licensees decreased by 5 to 249 (see Table 3). Five licenses were issued (2 unrestricted banks and three 3 restricted nominee trusts) and 10 entities ceased to carry on business, including 2 public banks and trusts companies, 1 public bank, 1 public trust, 1 restricted trust, 2 restricted nominee trusts and 3 non-active licensees.
Of the 249 licensed entities, 232 maintained a full physical pres-ence in The Bahamas, while the remaining 17 operated via ap-proved management agreements. Approximately 53% of licensees originate from G-10 countries.
The Bank approved the registration of 11 Private Trust Companies (PTCs), while removing 4 PTCs from its register, bringing the total num-ber of registrants to 112 at end-De-cember. The number of Financial and Corporate Service Providers (FCSP) that act as Registered Representatives (RR) decreased by 1 to 4, while 2 additional licensees advised the Bank of their intention to act as RR of PTCs, increasing the number to 18. Licensed non-bank money transmission businesses (MTBs) were unchanged at 2, while related agents remained at 11.
Effective 1st June, 2015, the Bank assumed regulatory oversight of
Financial Co-operative Credit Unions. The number of credit unions totalled 9, inclusive of the Bahamas Cooperative League Ltd. (the self-regulating body for the sector).
Regulatory applications processed and approved by the Bank totalled 432—the majority of which were linked to new appointments of officials. In keeping with prescribed “fit and proper” requirements, the Bank reviewed and approved the appointment of 152 directors, 147
money laundering reporting officers (MLROs) and executive officers and 107 senior officials/officers. In other administrative activities, some 36 outsourcing applications were approved, as licensees took further decisions to streamline operational overhead and benefit from econo-mies of scale.
For 2015, 221 meetings were held with licensees to discuss prudential issues, on-site examinations and courtesy visits to the Bank.
BOX 2: REGULATED ENTITIES
TABLE 3: Regulated Entities
2013 2014 2015
Banks and Trusts 267 254 249
Banks & Trusts 66 64 64
Banks 36 33 31
Trusts 165 157 154
Non-Licensee Reg. Representative 5 5 4
PTCs (Registered) 98 105 112
Non-Bank MTBs 2 2 2
Non-Bank MTAs 8 11 11
Memo Items:
Assets of Domestic Banks (B$Bill) 9.80 9.60 9.80
% change 2.1% -2.0% 2.1%
Assets of Offshore Banks (B$Bill) 247.40 192.80 180.50
% change -15.5% -22.1% -6.4%
Source: Central Bank of The Bahamas
staff and the Legal Unit, participated in discussions relating to regional and cross-border bank supervision in the following groups:
• Association of Banks of the Americas (ASBA)
• Group of International Financial Centres Supervisors (GIFCS)
• Caribbean Group of Banking Supervisors (CGBS)
• Caribbean Financial Action Task Force (CFATF)
A number of staff also served on various technical work-ing groups and committees within these organisations.

2 0 1 5 A N N U A L R E P O R T 23
Deposit Insurance Corporation (DIC)The Bank has statutory responsibility for the Deposit Insurance Fund for Bahamian dollar deposits in the banking system. The Fund insures Bahamian dollar deposits up to a maximum of $50,000 for any single depositor in each of its 12 member institutions. These entities do not hold equity positions in the Corporation.
The DIC assesses the depository institutions an annual premium equal to one-twentieth of one percent (0.05%) of deposits, averaged over liabilities at March 31 and September 30 of the preceding year. Based on average total insurable Bahamian dollar de-posits in banks of $5.7 billion during 2015, relative to $5.5 billion in 2014, premiums levied and col-lected in 2015 amounted to $2.9 million, compared to $2.8 million in 2014. Factoring net earnings, the accumulated assets of the Fund increased by $4.6 million to $41.0 million, with $40.4 million invested in Government bonds.
INFORMATION TECHNOLOGYThe Information Technology Department played a leading role in the development of the Online Reporting and Information Management (ORIMS) solu-tion, which was successfully launched in April 2015. The new system provides secure access for the sub-mission of all required documents by entities regulated by the Bank and feeds into automated processes for economic surveillance and supervisory reports. The Department also initiated support to help the Insurance Commission and the Securities Commission tailor the ORIMS platform to their respective needs.
The Department, working along with external vendors, successfully installed a new state-of-the-art Internet Protocol (IP) based telephony solution throughout the Bank, integrating voice and data infrastructures––sig-nificant operational efficiencies are anticipated as a result of this new system. The Bank also performed further upgrades to its email servers and improved the performance of the SWIFT connections and servers that support the country’s payments systems. In the area of disaster recovery (DR), the Department under-took additional upgrades and tests of DR systems and processes, while ensuring that procedure documenta-tion remained up-to-date.
PROPERTY MANAGEMENT AND HEALTH & SAFETY IN THE WORKPLACEThe Bank conducts its business from the main build-ing––situated between Market Street on the west and Frederick Street on the east––and the leased Trimark Building, on the north of the main building. A leased office is used to conduct Exchange Control
related business in Freeport, Grand Bahama. The Bank also owns three protected historical buildings: the Great House, a limestone structure which serves as the employee cafeteria; Balcony House, a two-sto-ried clapboard building presently managed by the Antiquities, Monuments and Museums Corporation as a museum; and Verandah House, another clapboard structure, used through 2015 as a training facility by the Bahamas Institute of Financial Services (BIFS).
Workplace safety initiatives include ongoing structural repairs and upgrades to the Bank’s premises. One focus in the main building was the structural remedi-ation of surfaces experiencing concrete spalling or flaking. Additional improvements were also made to the fire suppression system and the Bank commenced the enterprise-wide LED lighting fixtures upgrade. The lighting project will extend into 2016, and is expected to achieve significant energy conservation, similar to the expectations vis-à-vis the upgrade of the telephony services.
Business ContinuityThe Bank engaged the services of a Business Continuity Plan (BCP) consultant in early 2015, to guide enhancements to the continuity processes throughout the organization. To better serve the re-quirements of the Bank, there was a thorough updat-ing and expanding of the Business Impact Analyses of the enterprise BCP, as the last major update occurred in 2010. The BCP enhancements and related training will intensify in 2016.
STAFF COMPLEMENT AND RELATIONSThe Bank’s staff complement grew by 2 to 238 at end-December (see Table 4). Some 13 persons joined the operations, in offset to separations from 5 retirements, 4 resignations and 2 completions of contracts. The estimated turnover rate for the year was consequently 4.7%. There were also 27 internal staff movements resulting from 23 promotions and 4 lateral transfers. At end-December, 175 employees were classified as non-management, with middle and executive management accounting for the remaining 51 and 12, respectively. The female to male ratio stood at 2:1.
The Annual Long Service Award Ceremony, held on 20th January, 2016, recognized 9 staff members for their continuous service. At this occasion, 2 employ-ees were honoured for 30 years of service, 4 for 20 years, and 3 for 10 years. By end-December, an estimated 60% of staff had served for more than 10 years—28% of whom have been employed for more than 20 years.
Two unions represent staff. Middle managers fall under the umbrella of the Bahamas Communications

24 Central Bank of The Bahamas
and Public Managers Union (BCPMU), while non-management is represented by the Union of Central Bankers (UCB). The Bank actively engaged both unions in various negotiations in 2015, as it strived to maintain a productive work environment. Senior members of the management team participat-ed in the negotiation of a new Industrial Agreement with the BCPMU, to replace the previous agreement that expired in January 2015. This process was almost concluded at year-end. In the meantime, legal action taken by both unions to have amendments to the Defined Benefit Pension Plan rescinded, remained unsettled.
STAFF DEVELOPMENTDuring the year, the Bank continued to provide pro-fessional development opportunities to staff. The focus of training in 2015 was to offer more comprehensive programmes and courses to individuals at all levels of the organization and to continue staff development beyond the talent pool of the Succession Plan. All de-partments utilized the various courses and workshops as a means of staff development.
In-house programs comprised Leadership Essentials I & II Seminars, Coaching Workshops for Managers and Supervisors. Think on Your Feet, Presentation Skills, and Writing Dynamics. Courses also included Security Training for all security personnel, CPR & Basic First Aid, a Team Building Workshop, and Managing Performance Appraisals for new managers.
Officers of the Accounts Department participated in the BIFS’ Regional Conference, as well as the 2015 Bahamas Business Outlook, hosted by the Counsellors Limited. Two employees also had cross-training expo-sure to other areas of the Bank’s operations.
Staff from the Administration Department attended sessions for the Bahama Host Programme and the Bahamas Economic Outlook Seminar. In addition, one employee attended the American Society of Heating, Refrigerating and Air-Conditioning Engineers (ASHRAE) 2015 Annual Conference and another participated in an online course on Computer Graphic Design.
In Bank Supervision, focused exposure included over-seas courses and seminars on risk management and internal controls. Various training programmes were facilitated by the IMF’s CARTAC, the Federal Reserve Bank, the Office of Superintendent of Financial Institutions (OSFI) Supervisory College in Canada, the Caribbean Group of Banking Supervisors (CGBS), Financial Stability Institute (FSI), BIFS, the Bahamas Association of Compliance Officers and the Association of International Banks & Trust (AIBT) Regulators.
The skills in the Banking Department were enhanced through participation in various workshops, familiar-ization visits and a conference on Robotic Vaults, hosted by the Federal Reserve Bank of Atlanta, the Currency Conference in Vancouver, Canada and the 2015 Caribbean Banking Seminar, hosted by Wells Fargo in Fort Lauderdale.
In the area of technology, IT staff received notable offsite training in Core Solutions and Enterprise Voice and Online Services with Microsoft Lync Server 2013, Interconnecting Cisco Networking Devices, SQL Server Integration Services for Business Intelligence, the Association of Records Managers and Administrators (ARMA) Conference and the IBM Lotus Domino 8.5 System Administration Bootcamp. Also, in-house training was offered on Vizor Certified Systems Administration.
Given the Bank’s important role in the collection and analysis of economic statistics, Research Department staff participated in several workshops and seminars, which covered macro-prudential policies, payment and settlement systems, post-crisis monetary policy, financial stability and interconnectedness and risk assessment in the Caribbean. Additionally, one member of the Department’s staff presented a re-search paper at the CCMF’s conference in Guyana. In June, the Balance of Payments (BOP) unit benefitted
TABLE 4: Workforce Metrics
2013 2014 2015 Staff Complement 234 236 238
Gender Distribution (%)
Male 32.0 33.5 33.0
Female 68.0 66.5 67.0
Turnover Rate (%) 6.8 5.9 4.7
Source: Central Bank of The Bahamas

2 0 1 5 A N N U A L R E P O R T 25
from technical assistance provided by the IMF, to implement the latest edition of the BOP Manual and to compile the International Investment Position (IIP) statistics for the country.
The Bank was also represented at the XIII CEMLA (Center for Latin American Monetary Studies) Meeting of Central Bank Internal Auditors; the Administrative Professional Conference, whose main theme was “Analyzing & Improving Business Processes”; the Society for Human Resource Managers (SHRM) Annual Conference and the Association of Certified Fraud Examiners’ (Bahamas Chapter) Seminar. Staff also attended the industry briefing on the United States’ Foreign Account Tax Compliance Act (FATCA), the ACFE Fraud Seminar and the Bahamas Human Resources Association (BHRA) Annual Conference.
Employees receive tuition reimbursement and support for academic and professional development studies pursued at local and overseas institutions. Various staff were enrolled in courses offered through the BIFS, including the Certificate in Banking, the Diploma in Anti-Money Laundering and the Certified Risk Manager Programme. Further, there was a marked increase in the number of staff pursuing Bachelors and Masters degree programmes, offered both locally and through distance education in areas such as Banking & Finance, Business Management, Law and Economics.
The Bank sustained its efforts to develop its employees through a series of succession planning activities. Prior to the training, an assessment of employees recom-mended for the Talent Pool was conducted in the ten areas determined to be essential competency skills for the Bank’s management tier. The assessment process revealed skill gaps for each candidate, and the report was then used in the formulation of individual devel-opment plans (IDPs) for the approved participants of the Talent Pool. Seven employees were selected for the Talent Pool in 2015. The Plan’s training covered areas of team leadership, interpersonal skills and communication. There was also the opportunity for cross-training within the Bank, secondments at international central banks and/or selected financial institutions, enhanced and or new responsibilities within their technical knowledge and skill, as well as professional memberships.
COMMUNITY RELATIONS AND OUTREACHThe Bank’s educational outreach includes the Summer Employment Programme, which is traditionally con-ducted in two sessions from June to August of each year. The programme employs students from high schools, colleges and universities in four-week inter-vals. Students are placed in departments across the
Bank to learn about the business of the Bank and are mentored to develop effective work habits and skills. In 2015, 22 students participated in the Programme.
Students are also exposed to the central banking environment through regularly sponsored workshops and lectures; and at various career fairs at which the Bank is represented.
The Bank had a very active Art Programme in 2015, which was led by its Curator, Mr. Antonius Roberts. As part of the 40th anniversary celebrations, which began in 2014, the National Art Gallery of The Bahamas (NAGB) held an exhibition, from June to September, entitled “Celebrating 40 Years of The Central Bank–A Pillar of Arts Commitment.” The exhi-bition highlighted the role the Bank has played since its inception, in promoting the development of The Bahamas’ visual arts community and showcased 90 works by 72 artists from the Bank’s wider collection. The Gallery year concluded with the awards night for the Annual Art Competition, which recognized artists in the open and high school categories, respectively.
The Bank continued to sponsor activities, which foster employee engagement and well-being. Such initiatives included the Family Fun Day, Health and Wellness Week, employee participation in nation-al sporting club events, monthly social gatherings organized by departments on a rotational basis, the Annual Children’s Christmas Party and the Annual Staff Christmas Party.
2015 FINANCIAL PERFORMANCEThe Bank’s financial outcome is mainly determined by developments relating to the external reserves, which are influenced by a number of factors, including the performance of the real sector, interest rates, and one-time flows, such as Government borrowings. On the domestic side, changes in the interest rates, as well as demand by the public sector for securities, affect the income generated from the Bank’s debt portfolio.
The Bank’s financial statements for the year ended 31st December 2015, along with comparable figures for 2014, are presented on pages 41 to 102 of this report.
During 2015, total assets contracted by $22.7 million (1.6%) to $1,382.2 million, as exposure to Government debt declined. However, the external assets portion—which accounted for a slightly larger 58.7% of the total—rose by $24.3 million (3.1%) to $811.9 million, occasioned by gains in tourism-relat-ed net foreign currency purchases, combined with a reduction in demand for foreign currency to facilitate fuel payments. A breakdown of the various compo-nents showed that cash and deposits grew by $51.4 million (33.1%) to $206.6 million, while exposure

26 Central Bank of The Bahamas
to the IMF—inclusive of Special Drawing Rights (SDRs) and the Reserve Tranche—fell by $3.5 million (4.4%) and $0.4 million (4.4%), to $$75.0 million and $8.7 million, respectively. Similarly, scheduled maturities reduced the Bank’s holdings of marketable securities by $23.3 million (4.3%) to $521.7 million.
Components represented by the Bank’s domestic assets fell by $47.0 million (7.6%) to $570.2 million, largely attributed to decreased holdings of Government debt. Specifically, the portfolio of BGRS contracted by $55.4 million (17.5%) to $261.1 mil-lion, due mainly to maturities of securities and sales to the public, with receivables and other assets also fall-ing by $5.4 million (32.5%) to $11.3 million, which outpaced the $7.0 million (5.8%) rise in Treasury bills to $126.6 million. In addition, advances to the Government stabilized at $135.4 million. The remain-ing domestic assets—which include holdings of public corporations’ debt—rose by a combined $6.8 million (23.4%) to $35.9 million.
With regard to liabilities, the demand balances at the Bank declined by $26.2 million (2.5%) to $1,046.1 million, amid a falloff in Government and related agencies’ deposits by $27.7 million (37.2%) to $46.7 million, which outstripped the $13.7 million (3.7%) increase in currency in circulation to $389.2 million. Further, the unremunerated deposits of com-mercial banks contracted by $16.7 million (2.7%) to $591.1 million.
The Bank’s earnings fell by $4.2 million (10.0%) to $37.4 million, reflecting broad-based declines in the various components. The outturn was due primarily to a contraction in other “miscellaneous” income by $1.9 million (35.3%) to $3.5 million, while unreal-ized exchange rate gains narrowed by $1.8 million (31.3%) to $3.9 million, while net trading gains were flat compared to an inflow of $0.15 million in the prior year. The majority (80.5%) of the Bank’s income was derived from its investments, which dipped by a combined $0.4 million (1.3%) to $30.1 million, as the $0.7 million (4.2%) falloff in interest on foreign investments, surpassed the growth on the domestic
side by $0.2 million (1.1%). Income from loans also increased marginally by $0.1 million.
Total expenses firmed by $1.6 million (6.1%) to total $28.3 million, as general and administrative costs rose by $1.0 million (14.0%), with staff and depreci-ation expenses increasing by $0.6 million (3.2%) and $0.1 million (4.3%), respectively.
As a result of these developments, the Bank record-ed total comprehensive income of $11.4 million, a decrease of $0.9 million (7.3%) over 2014’s level.

2 0 1 5 A N N U A L R E P O R T 27
ECONOMIC AND FINANCIAL ENVIRONMENT
INTERNATIONAL ECONOMIC DEVELOPMENTSThe global economy maintained its modest—although uneven—pace of growth in 2015. The key United States market continued to expand and euro area economies sustained their recovery. However, the slowdown in China negatively affected several large-scale commodity exporting countries and contributed to the sharp falloff in oil prices. In this environment, labour market conditions improved gradually, while inflationary pressures remained contained. Given the softness in economic conditions and low levels of inflation, most of the major central banks either maintained or enhanced their highly accommodative monetary policy measures.
According to the International Monetary Fund’s (IMF) most recent forecasts, global growth slowed by 30 basis points to an estimated 3.1% in 2015, as the expansion in a number of emerging market and developing economies tapered. Among the devel-oped markets, real GDP growth in the United States stabilized at 2.4%, as gains in both personal and Government spending were offset by slowed increas-es in non-residential fixed investments and exports. The United Kingdom’s expansion waned to 2.2% in 2015 from 2.9%, as construction growth narrowed over the prior year, offsetting gains in the services sec-tor. Real output’s increase in the euro area strength-ened to 1.5% from 0.9%, supported by sustained growth in France—one of the region’s largest econo-mies—and tepid recoveries in several southern states, previously in recession. In Asia, China’s growth moderated to 6.9% from 7.2%, as gains in fixed asset investments and exports narrowed. Meanwhile, Japan’s economy improved to 0.4% in 2015, after a
flat outturn in 2014, buoyed by Government expend-iture, which outstripped the contraction in consumer demand.
Labour market conditions improved among the major economies in 2015. In the United States, the unem-ployment rate fell by 90 basis points to 5.3%, led by healthy hiring, largely in the professional & business services and health care sectors. The jobless rate in the United Kingdom also fell, by 60 basis points to 5.6%—the lowest level in almost 10 years and the euro area’s unemployment rate decreased by 70 basis points to 10.9%. Despite the softness in Asian economies, employment conditions remained positive, as Japan’s unemployment rate contracted by 20 basis points to 3.4% and China’s rate steadied at 4.1%.
Global inflationary pressures remained well contained in 2015, reflecting mainly the plunge in commodity prices. Notably, the United States’ annual inflation rate edged down to 0.7% from 0.8% in 2014 and the United Kingdom’s, to 0.2% from 0.5%––amid declines in the food, beverages and tobacco indi-ces. Japan’s inflation was also subdued at 0.8% from 2.7%, due to sharp reductions in energy related charges. However, average euro area prices recov-ered by 0.2%, while China’s inflation rate firmed marginally to 1.6%, amid gains in tobacco, liquor, health and housing costs.
Softness in global demand—particularly in China—and excess supplies from several emerging markets, pushed commodity prices sharply lower in 2015. Average oil prices dropped by 46.6% to US$52.61 per barrel. At end-December, prices stood at $36.53 per barrel, a decline of 36.3% over 2014’s level. Similarly, amid the slowdown in China, the aver-age cost of silver fell by 16.7% to $15.55 per troy ounce, while gold prices were reduced by 7.9% to $1,153.50 per troy ounce.
Given the relatively modest growth rates, most major central banks either maintained or enhanced their highly accommodative monetary policy stances during the year. In the United Kingdom, the Bank of England kept its official Bank Rate at 0.5% and maintained the size of its Asset Purchase Programme at £375.0 billion. Further, in an effort to provide sup-port to the fledging euro zone recovery, the European Central Bank reduced its main deposit rate to an historic low of 0.30% and initiated a monthly €60.0 billion asset purchase programme in March—which is expected to end in September, 2016. Also, the
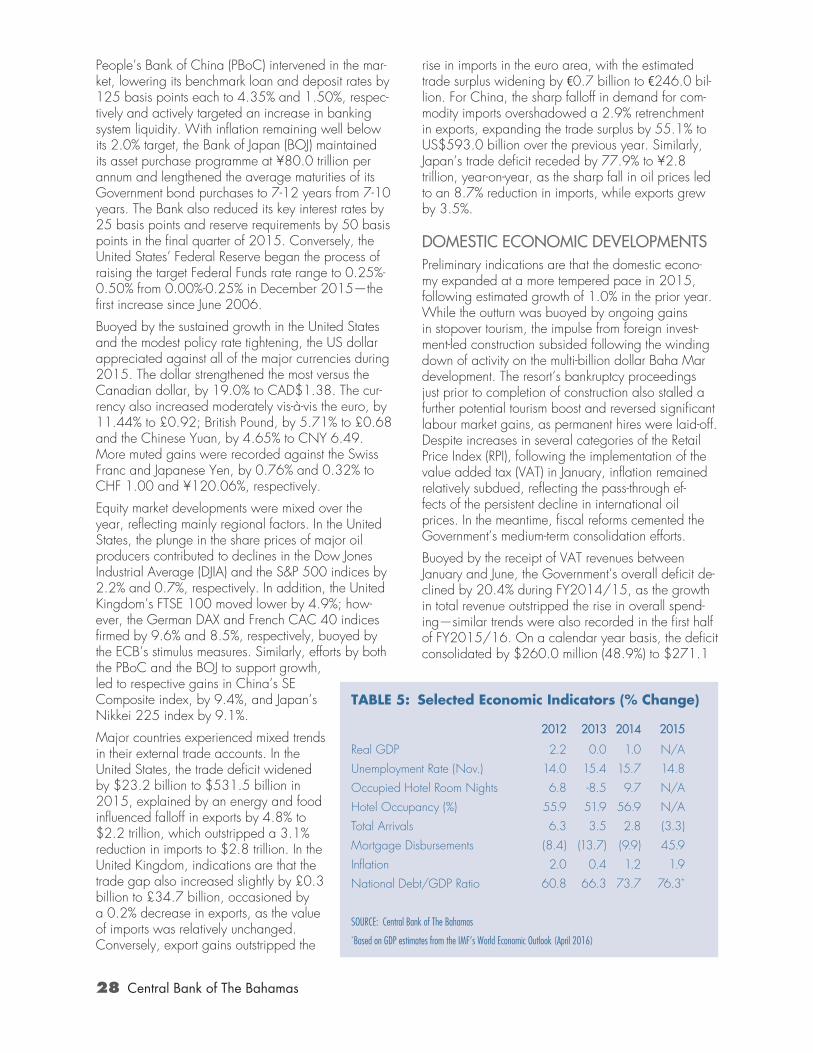
28 Central Bank of The Bahamas
People’s Bank of China (PBoC) intervened in the mar-ket, lowering its benchmark loan and deposit rates by 125 basis points each to 4.35% and 1.50%, respec-tively and actively targeted an increase in banking system liquidity. With inflation remaining well below its 2.0% target, the Bank of Japan (BOJ) maintained its asset purchase programme at ¥80.0 trillion per annum and lengthened the average maturities of its Government bond purchases to 7-12 years from 7-10 years. The Bank also reduced its key interest rates by 25 basis points and reserve requirements by 50 basis points in the final quarter of 2015. Conversely, the United States’ Federal Reserve began the process of raising the target Federal Funds rate range to 0.25%-0.50% from 0.00%-0.25% in December 2015—the first increase since June 2006.
Buoyed by the sustained growth in the United States and the modest policy rate tightening, the US dollar appreciated against all of the major currencies during 2015. The dollar strengthened the most versus the Canadian dollar, by 19.0% to CAD$1.38. The cur-rency also increased moderately vis-à-vis the euro, by 11.44% to £0.92; British Pound, by 5.71% to £0.68 and the Chinese Yuan, by 4.65% to CNY 6.49. More muted gains were recorded against the Swiss Franc and Japanese Yen, by 0.76% and 0.32% to CHF 1.00 and ¥120.06%, respectively.
Equity market developments were mixed over the year, reflecting mainly regional factors. In the United States, the plunge in the share prices of major oil producers contributed to declines in the Dow Jones Industrial Average (DJIA) and the S&P 500 indices by 2.2% and 0.7%, respectively. In addition, the United Kingdom’s FTSE 100 moved lower by 4.9%; how-ever, the German DAX and French CAC 40 indices firmed by 9.6% and 8.5%, respectively, buoyed by the ECB’s stimulus measures. Similarly, efforts by both the PBoC and the BOJ to support growth, led to respective gains in China’s SE Composite index, by 9.4%, and Japan’s Nikkei 225 index by 9.1%.
Major countries experienced mixed trends in their external trade accounts. In the United States, the trade deficit widened by $23.2 billion to $531.5 billion in 2015, explained by an energy and food influenced falloff in exports by 4.8% to $2.2 trillion, which outstripped a 3.1% reduction in imports to $2.8 trillion. In the United Kingdom, indications are that the trade gap also increased slightly by £0.3 billion to £34.7 billion, occasioned by a 0.2% decrease in exports, as the value of imports was relatively unchanged. Conversely, export gains outstripped the
rise in imports in the euro area, with the estimated trade surplus widening by €0.7 billion to €246.0 bil-lion. For China, the sharp falloff in demand for com-modity imports overshadowed a 2.9% retrenchment in exports, expanding the trade surplus by 55.1% to US$593.0 billion over the previous year. Similarly, Japan’s trade deficit receded by 77.9% to ¥2.8 trillion, year-on-year, as the sharp fall in oil prices led to an 8.7% reduction in imports, while exports grew by 3.5%.
DOMESTIC ECONOMIC DEVELOPMENTSPreliminary indications are that the domestic econo-my expanded at a more tempered pace in 2015, following estimated growth of 1.0% in the prior year. While the outturn was buoyed by ongoing gains in stopover tourism, the impulse from foreign invest-ment-led construction subsided following the winding down of activity on the multi-billion dollar Baha Mar development. The resort’s bankruptcy proceedings just prior to completion of construction also stalled a further potential tourism boost and reversed significant labour market gains, as permanent hires were laid-off. Despite increases in several categories of the Retail Price Index (RPI), following the implementation of the value added tax (VAT) in January, inflation remained relatively subdued, reflecting the pass-through ef-fects of the persistent decline in international oil prices. In the meantime, fiscal reforms cemented the Government’s medium-term consolidation efforts.
Buoyed by the receipt of VAT revenues between January and June, the Government’s overall deficit de-clined by 20.4% during FY2014/15, as the growth in total revenue outstripped the rise in overall spend-ing—similar trends were also recorded in the first half of FY2015/16. On a calendar year basis, the deficit consolidated by $260.0 million (48.9%) to $271.1
TABLE 5: Selected Economic Indicators (% Change)
2012 2013 2014 2015
Real GDP 2.2 0.0 1.0 N/A
Unemployment Rate (Nov.) 14.0 15.4 15.7 14.8
Occupied Hotel Room Nights 6.8 -8.5 9.7 N/A
Hotel Occupancy (%) 55.9 51.9 56.9 N/A
Total Arrivals 6.3 3.5 2.8 (3.3)
Mortgage Disbursements (8.4) (13.7) (9.9) 45.9
Inflation 2.0 0.4 1.2 1.9
National Debt/GDP Ratio 60.8 66.3 73.7 76.3*
SOURCE: Central Bank of The Bahamas*Based on GDP estimates from the IMF’s World Economic Outlook (April 2016)

2 0 1 5 A N N U A L R E P O R T 29
million at end-December. Budgetary financing for the calendar year comprised net Bahamian dollar debt issues of $214.5 million and net foreign borrowing of $110.2 million. At end-December, after exchange rate adjustments, the Direct Charge on Government rose by $312.7 million (5.6%) to $5,889.3 million, and the corresponding ratio to GDP, to 67.7% from 65.5% in 2014. Factoring the guaranteed liabilities of public enterprises, the National Debt firmed by 5.8% to $6,637.6 million––an estimated 76.3% of GDP, from 73.7% at end-December 2014.
Monetary sector outcomes were marked by persistent-ly buoyant bank liquidity, mainly attributed to ongoing weakness in private sector credit, as households continued to deleverage, while net foreign currency inflows from real sector activities upheld the growth in external reserves. Reflecting sustained loan write-offs and the mild growth in the economy, banks’ credit quality indicators improved during the year. Further, banks operations reversed to a net income position over the twelve-months to September, vis-a-vis a net loss in the corresponding 2014 period, as bad debt provisioning returned to trend levels, after one-off charges a year earlier. In response to the robust bank liquidity levels, average deposit rates moved margin-ally lower, although a corresponding rise in lending rates led to a widening in the average interest rate spread.
In the external sector, the estimated current account deficit narrowed significantly over the year, primarily reflecting a fuel-related reduction in the merchan-dise trade deficit and a rise in the services account surplus, explained mainly by a sharp decline in construction-related outlays and higher tourist receipts. Correspondingly, the surplus on the capital and financial account narrowed, as investment inflows related to the Baha Mar project slowed considerably during the final phase of construction; inflows from public sector net external borrowing also tapered. At end-2015, external reserves were equivalent to an estimated 13.7 weeks of total merchandise imports, compared to 11.5 weeks a year earlier.
Real SectorTourism
Buttressed by sustained gains in the high value-added stopover segment, indications are that the tourism sec-tor’s performance continued to improve in 2015. The total number of air visitors increased by 3.6% to 1.4 million, albeit lower than the 4.9% growth achieved in 2014, buoyed by gains in several key visitor source markets. In contrast, the larger sea component, at 77.2% of overall visitors, experienced a 5.1% downturn to 4.7 million, after the prior year’s 2.2% expansion. In tandem, total visitor arrivals declined by
3.3% to approximately 6.1 million, compared to a year-earlier increase of 2.8%.
Based on first port of entry, overall arrivals to New Providence decreased by 7.1% to 3.3 million, vis-à-vis 2014’s 0.6% expansion, as the 10.0% reduc-tion in sea traffic outpaced the 0.2% uptick in the air segment. Similarly, visitors to the Family Islands contracted by 6.7% to 1.9 million, partly reversing a 7.5% gain in 2014, due to an 8.3% falloff in sea passengers, in contrast to the 6.9% expansion in the air component. Conversely, with aggressive pub-lic-private marketing initiatives, a robust 24.9% rise in airlifts and higher room occupancy, drove an upturn in Grand Bahama traffic by 22.9% to 0.9 million. The island’s sea component also grew by 22.5%.
Amid the increase in stopover arrivals, hotel perfor-mance indicators in New Providence and Paradise Island, showed that total room revenue firmed by 3.0% in 2015, extending the prior year’s gain of 1.0%. Underlying this outturn was a 2.5 percentage point advance in the average occupancy rate to 69.2%, while the average daily room rate climbed by 6.0% to $253.88.
Construction
Although the domestic housing market experienced stronger financing support, construction output was tempered in 2015, as the impulse from varied-scale foreign investment projects dampened. In the mean-time, the average interest rates on domestically financed commercial and residential mortgages stabilized at 8.6% and 8.0%, respectively.
The latest data available over the twelve months to September, showed that for New Providence and Grand Bahama, the number of construction starts fell by 26.1% to 394, while the corresponding value declined by 16.2% to $113.9 million. Underlying this outturn, the number of residential projects, which comprised the bulk of the total (86.3%), fell by 21.8% to 340 and the associated value decreased by 8.9% to $94.0 million. Additionally, the number of

30 Central Bank of The Bahamas
commercial projects contracted by 48.9% to 48, and value by 41.0% to $18.7 million. In a slight offset, the smaller public sector component grew in number by 2 to 6 and in value, by $0.2 million to $1.3 million.
Under completions for New Providence and Grand Bahama, registered projects declined by 8.9% to 594 units, against the total value which firmed by 71.6% ($125.7 million) to $301.4 million, owing to several high-end properties in the mix. In terms of a breakdown, the dominant residential component—at 73.9% of the aggregate—decreased by 11.1% to 439 units, but gained in value by 42.1% to $175.1 million. In addition, the number of commercial com-pletions fell by 3.2% to 149, although the associated value firmed by 45.8% to $72.7 million, attributed in part to the completion of two boutique resorts in the capital. Further, the public sector recorded 6 comple-tions valued substantially higher at $53.7 million.
The forward looking indicator building permits, rose by 7.2% to 1,327 units, but with valuations only incrementally higher by 1.0% to $541.7 million over the comparable period in 2014. For commercial and public projects, approvals rose by 5.1% and 0.1%, to 356 and 24 units, although the corresponding value declined by 4.8% and 7.2%, to $197.4 million and $25.8 million, respectively. Conversely, residential permits contracted by 10.0% to 947 units, but the associated value appreciated by 5.3% to $318.5 million.
On the local financing side, calendar year mortgage disbursements for new construction and repairs—as reported by commercial banks, insurance companies and the Bahamas Mortgage Corporation—increased by 23.8% to $120.8 million, capturing extended support for housing, but retrenched flows for commer-cial projects. Forward looking financing in mortgage commitments fell overall by 16.2% to $60.6 million.
Employment
Labour market conditions remained challenging in 2015, as the modest pace of economic growth limited job prospects. According to the Department of Statistics’ survey, the average unemployment rate decreased to 14.8% at end-November from 15.7% a year earlier. However, significant interim gains were erased following the suspension of the Baha Mar opening, which had contributed to a stronger ebb in unemployment to 12.0% in May 2015. The shut-down led to the termination of approximately 2,000 workers. In the meantime, a forward looking gauge of expectations, the number of discouraged workers, fell by 30.4% to 2,750 in the six months ending November.
In terms of the major job centres, New Providence ac-counted for an estimated 74.7% of the surveyed total
labour force, with the average jobless rate narrowing initially by 4.0 percentage points to 12.0% in May, vis-à-vis the prior six months, but with a 3.9 percent-age point reversal in the second half of 2015. In Grand Bahama, given the new stimulus to the tourism product, the unemployment rate fell by 5.7 percent-age points to 12.9% in May and sustained most of this improvement, ending the year near 14.2% com-pared to 18.6% at November 2014. Also, Abaco’s jobless rate decreased by 8.1 percentage points to 12.2% at end-May and further to 9.7% at end-No-vember 2015, as tourism sector growth steadied.
Prices
While still moderate, domestic inflation—as measured by changes in the average Retail Price Index—firmed to 1.9% during 2015 from 1.2% in the prior year, as most items experienced accelerated price gains. Notably, average health care cost rose by 15.4% compared to 1.8% in 2014, and clothing and foot-wear prices rose by 5.4%, after increasing by 0.1% in the prior year; although the overall effect on prices was mitigated by the minor weight of the compo-nents in the index at a combined 8.9%. Further, other notable increases in inflation rates were recorded for recreation & culture, by 7.1 percentage points to 10.8%; furnishing, household equipment & mainte-nance, by 5.0 percentage points to 6.6%; alcohol beverages, tobacco & narcotics, by 1.8 percentage points to 8.8%; communication, by 4.6 percentage points to 5.0%; restaurant & hotels, by 4.0 percent-age points to 5.9%; food & non-alcoholic beverages, by 4.2 percentage points to 5.9% and education, by 2.4 percentage points to 5.0%. Conversely, the sustained slide in global oil prices reduced average costs in the heavily weighted transportation index by 5.4%, reversing a 3.7% uptrend in 2014; and housing related costs—which comprise a dominant 32.1% of the index—fell by a further 1.4%, after a 0.3% decline a year earlier.
The year-long decline in international oil prices caused added reductions in domestic fuel costs. On both gasoline and diesel, estimates fell by 17.2% and 22.0% to $4.34 and $3.89 per gallon, respectively, following declines of 2.0% and 2.8% in the prior year. Similarly, the Bahamas Electricity Corporation’s fuel charge, which is included in the housing compo-nent of the RPI, plunged by 34.2% to 16.23 cents per kilowatt hour (kWh), accelerating the 4.8% decrease a year earlier.
Fiscal Operations FY2014/15 Performance
Buoyed by the implementation of the new VAT regime on January 1, 2015, as well as other measures
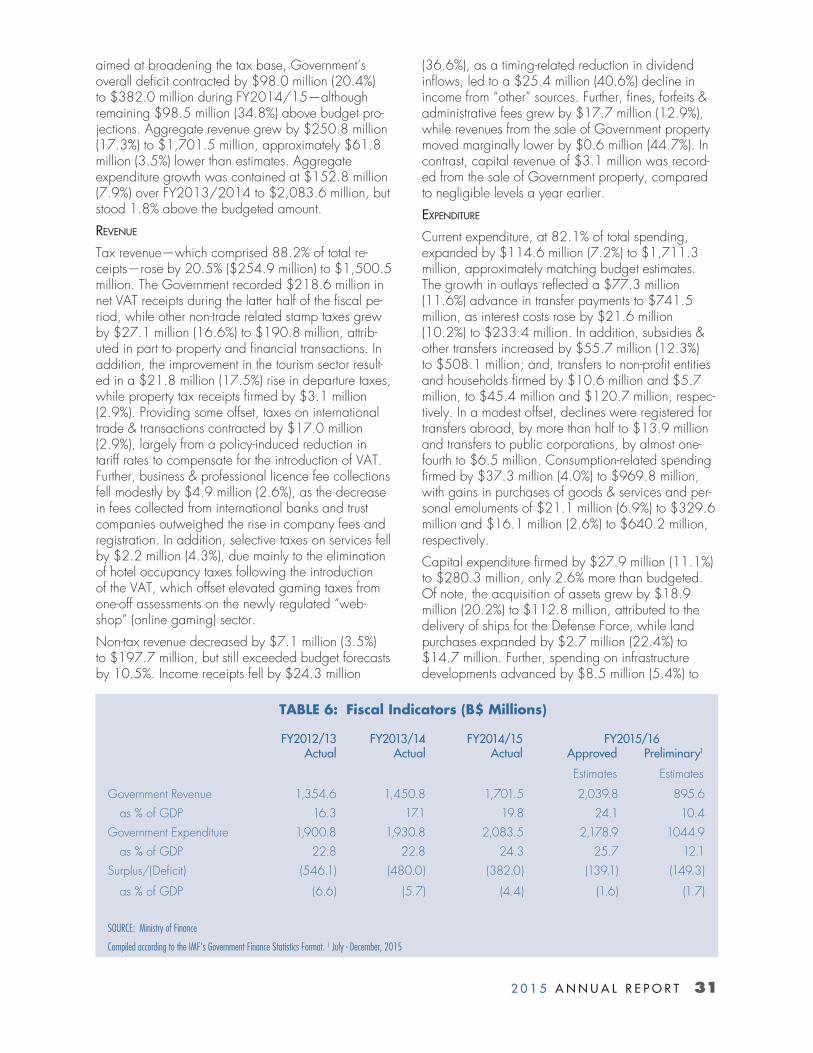
2 0 1 5 A N N U A L R E P O R T 31
aimed at broadening the tax base, Government’s overall deficit contracted by $98.0 million (20.4%) to $382.0 million during FY2014/15—although remaining $98.5 million (34.8%) above budget pro-jections. Aggregate revenue grew by $250.8 million (17.3%) to $1,701.5 million, approximately $61.8 million (3.5%) lower than estimates. Aggregate expenditure growth was contained at $152.8 million (7.9%) over FY2013/2014 to $2,083.6 million, but stood 1.8% above the budgeted amount.
REVENUE
Tax revenue—which comprised 88.2% of total re-ceipts—rose by 20.5% ($254.9 million) to $1,500.5 million. The Government recorded $218.6 million in net VAT receipts during the latter half of the fiscal pe-riod, while other non-trade related stamp taxes grew by $27.1 million (16.6%) to $190.8 million, attrib-uted in part to property and financial transactions. In addition, the improvement in the tourism sector result-ed in a $21.8 million (17.5%) rise in departure taxes, while property tax receipts firmed by $3.1 million (2.9%). Providing some offset, taxes on international trade & transactions contracted by $17.0 million (2.9%), largely from a policy-induced reduction in tariff rates to compensate for the introduction of VAT. Further, business & professional licence fee collections fell modestly by $4.9 million (2.6%), as the decrease in fees collected from international banks and trust companies outweighed the rise in company fees and registration. In addition, selective taxes on services fell by $2.2 million (4.3%), due mainly to the elimination of hotel occupancy taxes following the introduction of the VAT, which offset elevated gaming taxes from one-off assessments on the newly regulated “web-shop” (online gaming) sector.
Non-tax revenue decreased by $7.1 million (3.5%) to $197.7 million, but still exceeded budget forecasts by 10.5%. Income receipts fell by $24.3 million
(36.6%), as a timing-related reduction in dividend inflows, led to a $25.4 million (40.6%) decline in income from “other” sources. Further, fines, forfeits & administrative fees grew by $17.7 million (12.9%), while revenues from the sale of Government property moved marginally lower by $0.6 million (44.7%). In contrast, capital revenue of $3.1 million was record-ed from the sale of Government property, compared to negligible levels a year earlier.
EXPENDITURE
Current expenditure, at 82.1% of total spending, expanded by $114.6 million (7.2%) to $1,711.3 million, approximately matching budget estimates. The growth in outlays reflected a $77.3 million (11.6%) advance in transfer payments to $741.5 million, as interest costs rose by $21.6 million (10.2%) to $233.4 million. In addition, subsidies & other transfers increased by $55.7 million (12.3%) to $508.1 million; and, transfers to non-profit entities and households firmed by $10.6 million and $5.7 million, to $45.4 million and $120.7 million, respec-tively. In a modest offset, declines were registered for transfers abroad, by more than half to $13.9 million and transfers to public corporations, by almost one-fourth to $6.5 million. Consumption-related spending firmed by $37.3 million (4.0%) to $969.8 million, with gains in purchases of goods & services and per-sonal emoluments of $21.1 million (6.9%) to $329.6 million and $16.1 million (2.6%) to $640.2 million, respectively.
Capital expenditure firmed by $27.9 million (11.1%) to $280.3 million, only 2.6% more than budgeted. Of note, the acquisition of assets grew by $18.9 million (20.2%) to $112.8 million, attributed to the delivery of ships for the Defense Force, while land purchases expanded by $2.7 million (22.4%) to $14.7 million. Further, spending on infrastructure developments advanced by $8.5 million (5.4%) to
TABLE 6: Fiscal Indicators (B$ Millions)
FY2012/13 FY2013/14 FY2014/15 FY2015/16 Actual Actual Actual Approved Preliminary1
Estimates Estimates
Government Revenue 1,354.6 1,450.8 1,701.5 2,039.8 895.6
as % of GDP 16.3 17.1 19.8 24.1 10.4
Government Expenditure 1,900.8 1,930.8 2,083.5 2,178.9 1044.9
as % of GDP 22.8 22.8 24.3 25.7 12.1
Surplus/(Deficit) (546.1) (480.0) (382.0) (139.1) (149.3)
as % of GDP (6.6) (5.7) (4.4) (1.6) (1.7)
SOURCE: Ministry of Finance
Compiled according to the IMF’s Government Finance Statistics Format. 1 July - December, 2015

32 Central Bank of The Bahamas
$164.4 million, while transfers to non-financial public enterprises rose by $1.6 million to $3.1 million.
FINANCING
Financing for the deficit during FY2014/15 was obtained mainly from domestic sources in the form of short-term advances and long-term bonds of $275.0 million each, while Treasury bills accounted for the remaining $30.0 million. On the external side, loan drawdowns amounted to $139.1 million. Debt repayments during the period totalled $201.4 million, the majority of which ($140.0 million) retired internal obligations.
First Six Months of FY2015/16
The VAT reforms continued to outweigh expenditure trends into the first half of FY2015/16. The com-parative deficit narrowed sharply by $110.9 million (42.6%) to $149.3 million.
REVENUE
Total receipts strengthened by $209.6 million (30.6%) to $895.6 million, outstripping the $98.8 million (10.4%) rise in aggregate spending to $1,044.9 million. In particular, tax collections expanded by $213.2 million (36.3%) to $800.9 mil-lion, led by net VAT receipts and modest flows from the new gaming levies. These also funded significant rebalancing of collections away from trade, and the replacement of both the hotel occupancy tax and most of the stamp taxes on real estate transactions, with VAT. Meanwhile, non-tax revenue was nearly stable at $94.5 million.
EXPENDITURE
Current outlays grew by $141.2 million (17.4%) to $953.2 million during the six-month period, but this mainly reflected the reclassification of support to public corporations from net lending (nearly $40 million) to transfer payments. In the meantime, other subsidies also expanded to reflect increased incentive support for the tourism sector, while the rise in the level of Government debt elevated interest payments moderately. Spending impulses also stemmed from higher outlays on goods & services and negotiated
industrial agreements that boosted personal emol-uments. However, capital spending contracted modestly by $4.5 million (4.7%) to $89.3 million, as asset acquisitions decreased, but outlays on infrastruc-ture development––most of the amount––were almost unchanged.
FINANCING
Budgetary financing for the six-month period was mainly from domestic sources in the form of Treasury notes ($220.2 million), bonds ($87.3 million), Treasury bills ($40.0 million) and short-term domestic foreign currency bridge financing ($36.6 million). In addition, external project-based financing amounted to $69.8 million. An estimated $181.4 million in debt service payments were made over the period, the bulk of which ($167.9 million) repaid Bahamian dollar obligations.
National Debt
On a calendar year basis, the deficit fell by $260.0 million to $271.1 million, and as a result the Government’s Direct Charge grew by $312.7 million (5.6%) to $5,889.3 million, a slowdown from the $590.8 million (11.9%) growth recorded in the prior period. This tracked similar trends in the calendar year fiscal deficit. At end-December, the ratio of the Direct Charge to GDP stood at approximately 67.7% relative to 65.5% a year earlier. Bahamian dollar denominated debt, which accounted for 71.7% of the total, advanced by $214.5 million (5.4%) to $4,224.2 million, while foreign currency obliga-tions firmed by $98.2 million (28.3%) to $1,665.1 million. Commercial banks accounted for the majority of the holdings of Bahamian dollar debt (40.4%), followed by the private sector (31.3%) and public corporations (15.4%), while smaller shares were held by the Central Bank (12.3%) and other local financial institutions (0.6%).
Government’s contingent liabilities expanded by $48.9 million (7.0%) to $748.3 million, with the majority of the growth attributed to increases in the loan guarantees for the Public Hospitals Authority, the Bahamas Water & Sewerage Corporation and

2 0 1 5 A N N U A L R E P O R T 33
Bahamasair. As a result of these developments, the National Debt—which sums contingent liabilities to the Direct Charge—rose by $361.6 million (5.8%) to $6,637.6 million at end-2015, albeit lower than the $689.0 million (12.3%) gain registered in 2014. Similarly, the National Debt to GDP ratio firmed by 2.6 percentage points to 76.3%, a notable tapering from the 7.4 percentage point widening to 73.7% in 2014.
Foreign Currency Debt
During 2015, the public sector’s foreign currency debt obligations expanded by $114.6 million (4.7%) to $2,562.0 million, as new drawings of $177.6 million, outweighed amortization payments of $45.8 million. The Government’s debt obligations—which constituted 65.0% of the total—rose by $98.2 million (6.3%) to $1,665.1 million, while the public corporations’ portion firmed by $16.4 million (1.9%) to $896.9 million.
Foreign currency debt servicing payments fell by $391.1 million (68.6%) to $178.7 million relative to the previous year, when both the Government and the public corporations undertook significant refinancing. The Government’s component fell by $184.1 million (65.7%) to $96.3 million and public corporations’, by $207.0 million (71.5%) to $82.4 million. Net of refinancing activities, at end-2015 the public debt service to exports ratio rose by 0.8 percentage points to 5.6%, while the ratio of Government’s debt service to total revenue narrowed by 1.1 percentage points to 5.0%.
By creditor profile, the largest portion of foreign currency debt was held by non-residents, including international financial institutions and insurance firms (38.8%), followed by private capital market investors
(35.1%), commercial banks (12.5%), multilateral institutions (11.0%) and bilateral agencies (2.6%). The average maturity of the debt was fairly stable at 12.9 years. A breakdown by currency showed that the majority (89.3%), was denominated in US dollars, followed by euros (8.1%) and Chinese Yuans (2.6%).
Money, Credit and Interest RatesDuring 2015, monetary conditions featured robust growth in bank liquidity, reflecting the softness in private sector credit trends. External reserves ex-panded at a slower pace than in 2014, albeit due more to inflows from real sector activities. Banks’ returned to overall net profitability in 2015, following extraordinary bad debt write-offs in 2014 and amid lower operating costs. Also, the modest growth in the economy and further portfolio adjustments supported incremental improvement in asset quality indicators.
Liquidity
Reflecting a shift in funds from cash to Government debt securities, banks’ average net free cash balanc-es—a narrow measure of liquidity—contracted by 9.3% to $453.9 million. Average free cash balances rose steadily during the first half of the year, reaching a peak of $497.1 million in May, before trending downwards over the remaining months to close the year at $404.9 million. This was a lower 6.5% of Bahamian dollar deposits, compared to 8.0% in the prior year.
The broader surplus liquid assets—which include hold-ings of Government securities—averaged $1,302.9 million per month, a 5.8% gain over 2014. These
TABLE 7: Debt Indicators (B$ Millions)
2012p 2013p 2014p 2015p
A EXTERNAL DEBT 1,464.5 1,616.0 2,094.9 2,162.9
as % of GDP 17.8 19.2 24.6 24.8
B. INTERNAL F/C DEBT 429.6 523.6 352.5 399.0
C. TOTAL F/C DEBT 1,894.0 2,139.5 2,447.4 2,562.0
as % of GDP 23.0 25.4 28.8 29.4
D. DEBT SERVICE RATIO2 5.5 4.9 4.7 5.6
E. DIRECT CHARGE 4,400.1 4,985.8 5,576.6 5,889.3
as % of GDP 53.4 59.1 65.5 67.7
F. NATIONAL DEBT 5,003.4 5,587.0 6,276.0 6,637.6
as % of GDP 60.8 66.3 73.7 76.3
SOURCE: Treasury Accounts, Treasury Statistical Printouts and Public Corporations’ Quarterly Report

34 Central Bank of The Bahamas
peaked at $1,427.8 million in August, settling by year-end at $1,316.9 million––a more robust increase of 13.9% compared to the previous year’s 1.7% gain. Closing balances exceeded the statutory requirement by 126.1% vis-à-vis 112.8% in 2014.
Money Supply
Overall money supply (M3) contracted by 0.2% for an aggregate stock of $6,373.8 million at end-De-cember. This partly reversed a 1.1% build-up a year earlier. By components, the expansion in narrow mon-ey (M1) slowed sharply to 3.8% from 21.6%, as the growth in demand deposits slackened to 3.5% and in currency in active circulation, to 5.9%.
Broad money (M2) growth slowed to 0.4% from 2.0% in 2014. In particular, savings deposits re-covered by 7.6% from a 4.2% contraction last year, while the falloff in fixed balances narrowed to 4.3% from 5.7% in 2014. Further, the reduction in domestic foreign currency deposits moderated to 16.5% from 17.9%, attributed to decreases in both private and public sector placements.
In terms of composition, Bahamian dollar fixed deposits represent the largest share of M3 (46.5%), followed by demand (28.6%), savings (18.0%), currency in circulation (3.9%) and foreign currency deposits (3.0%).
Domestic Credit
The robust growth in bank lending was attributed exclusively to the public sector, as credit to the private sector sustained its downward trajectory, due to weak fundamentals for private borrowers, including still elevated loan delinquencies in the banking system.
With the majority of the funding (93.5%) dominated in Bahamian dollars, total domestic credit advanced by $102.0 million (1.2%), a reversal from an $85.7 million (1.0%) reduction in 2014. Buoyed mainly by a build-up in holdings of debt instruments, growth in the banking system’s net claims on the Government more than doubled to $176.6 million (8.7%) from $78.1 million (4.0%) in the previous year. However,
credit to the rest of the public sector registered a $6.6 million (1.4%) downturn from the prior year’s $20.3 million (4.5%) gain, when a health-related facility increased outstanding liabilities.
The contraction in private sector credit narrowed to $68.0 million (1.1%) from $184.1 million (2.8%) in 2014, when $100 million in non-performing loans were transferred from Bank of The Bahamas (BOB) to the Resolve Corporation—a Government owned spe-cial purpose vehicle (SPV). The outcome correspond-ed to further reductions in claims on sectors related to manufacturing ($5.2 million), distribution ($9.6 million), agriculture ($1.8 million) and mining and quarrying ($0.2 million). Also, a net repayment on personal loans of $25.0 million reversed the $20.5 million increase in the prior year. However, net gains were recorded for “miscellaneous” purposes ($22.5
million), construction ($11.5 million) and entertain-ment & catering ($3.9 million).
A further disaggregation of the personal category revealed that the falloff was largely associated with a decrease of $32.4 million (1.1%) in housing loans. Also, growth in the consumer segment slowed sharply to $8.8 million (0.4%), although overdraft utilization was partially recovered by $3.7 million (6.6%).
A breakdown of consumer credit showed increased lending for purposes related to debt consolidation ($24.2 million), miscellaneous ($15.1 million), travel ($6.8 million), education ($4.5 million) and credit cards ($3.9 million); with more modest gains of less than $1.0 million for medical, furnishings & domes-tic appliances and taxi & rented cars. Meanwhile, lending for land purchases fell by $23.6 million, while loans extended for home improvement, private cars and commercial vehicles decreased by $17.5 million, $5.3 million and $0.5 million, respectively.
Interest Rates
The weighted average interest rate spread on domestic banks’ loans and deposits widened by 49 basis points to 10.88% during 2015. A one basis

2 0 1 5 A N N U A L R E P O R T 35
point decline in the weighted average deposit rate to 1.41% coincided with the 48 basis point rise in the corresponding loan rate to 12.29%.
On the lending side, both residential and commercial mortgage rates narrowed by 68 and 7 basis points, to 6.48% and 7.95%, respectively. In contrast, rates on both overdrafts and consumer loans firmed by 60 basis points to 10.36%, and by 36 basis points to 14.26%, respectively.
Reflecting the robust liquidity conditions, interest rates paid on almost all deposit categories declined. The average rate for savings deposits fell by 6 basis points to 0.83%, while the average range on fixed balances moved lower to 1.09%-1.71% from 1.16%-1.76% in 2014. Conversely, the rate for demand deposits rose marginally by 1 basis point to 0.30%.
The benchmark commercial banks’ Prime Rate and the Central Bank’s Discount rate remained unchanged,
at 4.75% and 4.50%, respectively, while the average 90-day Treasury bill rate increased by 15 basis points to 0.68%.
Net Foreign Assets
The banking system’s net foreign assets declined by 2.2% to $280.2 million in 2015. This reversed a $239.7 million rise in the prior year, when short-term foreign currency borrowings were repaid. In this regard, banks’ net foreign liabilities grew by $30.5 million (6.1%) to $531.7 million, vis-à-vis a $193.7 million (27.9%) contraction in 2014. The remainder, the Central Bank’s external reserves, strengthened further by $24.3 million (3.1%) to $811.9 million––a little more than half the year-earlier improvement.
External reserve trends featured significantly re-duced contributions from net public sector foreign currency borrowings, with net private sector support strengthened. Reserves rose steadily over the first 7 months of the year, sup-ported by tourism receipts
during the key winter season and peaked at $966.5 million in July. In line with seasonally elevated do-mestic demand, balances contracted by $154.5 million over the remaining months. On average, the monthly reserves were compressed by $31.0 million to $866.6 million vis-à-vis 2014.
A breakdown of the underlying foreign currency transactions showed that the Bank’s net purchase was nearly stable at $10.0 million, reflecting a $241.5 million contraction in sales against an almost equally paced narrowing in purchases. The net purchase from commercial banks advanced by $36.7 million to $275.8 million, while the net sale largely to public corporations (‘other customers’)—mainly for fuel pur-chases—declined by $102.6 million to $335.3 mil-lion, benefitting from the reduction in global oil prices. Offsetting these developments, the net purchase from Government declined significantly to $69.5 million
TABLE 8: Flow of Bank Credit (B$ Millions)
Outstanding Absolute Outstandingas at Changes as at2013 2014 2015 2015
Destination
Government (net) 1,942.5 78.0 176.6 2,198.0
Central Bank 489.0 31.0 (27.2) 493.7
Domestic Banks 1,453.5 47.0 203.8 1,704.3
Rest of Public Sector 454.6 20.3 (6.6) 468.3
Central Bank 5.5 (0.9) 4.3 8.9
Domestic Banks 449.1 21.2 (10.9) 459.4
Private Sector 6,551.9 (184.1) (68.0) 6,299.8
Domestic Banks 6,551.9 (184.1) (68.0) 6,299.8
Consumer 2,221.9 50.5 9.8 2,282.2
Mortgages 2,926.9 (27.2) (32.4) 2,867.3
Other Loans 1,403.1 (207.4) (45.4) 1,150.3
Financing
Liabilities (Net of Government) 6,317.1 73.4 (16.7) 6,373.8
Currency 214.4 18.4 13.8 246.6
Total Deposit liabilities 6,102.7 55.0 (30.5) 6,127.2
Demand deposits 1,663.8 280.8 32.9 1,977.5
Savings deposits 1,119.9 (45.7) 88.0 1,162.2
Fixed Deposits 3,319.0 (180.1) (151.4) 2,987.5
International reserves 741.6 46.1 24.2 811.9
Other net external liabilities (695.1) 193.0 (29.6) (531.7)
Capital and surplus 2,591.8 (81.7) 141.1 2,651.2
Other (net) 87.4 161.7 (27.8) 221.3
SOURCE: Central Bank of The Bahamas

36 Central Bank of The Bahamas
from $208.2 million in 2014, when a US$300 million bond was issued in the international market.
At end-December, the stock of external reserves stood at an estimated 13.7 weeks of total merchandise im-ports, vis-à-vis 11.5 weeks a year earlier, and above the international benchmark of 12.0 weeks. After accounting for the statutory requirement to maintain reserves equivalent to 50% of the Bank’s demand liabilities, “useable” reserves grew by $39.6 million to $298.3 million.
Other Banking Sector TrendsCredit Quality
Reflecting the mild growth in the domestic economy and sustained loan write-offs, domestic banks’ credit quality indicators improved during the review year. Total private sector arrears decreased by 5.7% to $1,219.6 million, extending the prior year’s 4.3% con-traction. The corresponding ratio of arrears to total pri-vate sector loans fell further by 1.1 percentage points to 20.3%.
The reduction in delinquen-cies was concentrated in the non-performing loans (NPL) component—arrears in excess of 90 days, on which banks must stop accruing interest—which declined by 7.3% to $906.6 million, vis-à-vis a 1.3% firming in the preceding year. Similarly, the ratio of NPLs to total pri-vate sector loans fell by 1.1 percentage points to 15.1%.
Shorter-term arrears in the 31-90 day segment de-creased again, by 0.7% to $313.0 million, following an 18.4% falloff in 2014. As a result, the associated loan ratio fell further by 1 basis point to 5.2% of total private sector loans.
A breakdown by loan type showed that the value of consumer credit arrears fell by 10.5% to $297.5 mil-lion, a reversal from an increase of 4.7% a year ear-lier, for a reduction in the ratio to the corresponding portfolio claims by 1.6 percentage points to 12.7%. Similarly, the mortgage component, at 57.2% of the arrears, decreased by 0.2% to $697.2 million, vis-à-vis 2014’s 1.1% uptick. This lowered the attendant portfolio arrears rate by 54 basis points to 24.8%. Commercial loans delinquencies also moved lower by 14.4% to $224.9 million and the corresponding portfolio delinquency rate by 3.6 percentage points to 26.7%.
Capital Adequacy And Provisions
Given their traditional conservative stance, commer-cial banks, capital ratios and provisions for loan loss-es remained at robust levels over the review period. At end-2015, the ratio of capital to total risk-weight-ed assets stood at 33.0%, an increase of 30 basis points over the prior year’s level; still well above the regulatory prescribed target and trigger ratios of 17.0% and 14.0%, respectively. In addition, banks increased their provisions for bad debts by 5.8% to $530.4 million, which was significantly tempered from 2014’s net increase of 32.4%, when a few institutions recorded significant one-off adjustments.
TABLE 9: Commercial Banks Financial Soundness Indicators
2013 2014 2015
Capital Adequacy (%)
Regulatory capital/risk weighted assets 31.7 32.7 33.0
Regulatory Tier 1 capital/risk weighted assets 29.7 31.1 31.0
Asset Quality
NPLs/private sector loans 15.7 16.1 15.2
NPLs to capital 43.8 49.4 43.5
Earnings & Profitability
Return on assets 1.4 -1.2 1.4*
Return on equity 6.6 -4.7 5.4*
Liquidity
Liquid assets to total assets 21.8 22.6% 24.1
SOURCE: Central Bank of The Bahamas *Y-T-D September 2015

2 0 1 5 A N N U A L R E P O R T 37
As a result, the ratio of provisions to total loans rose by 45 basis points to 8.3% and the corresponding weight relative to both arrears and non-performing loans, firmed by 5.3 and 8.4 percentage points, to 44.0% and 59.7%, respectively. Banks also wrote-off a total of $122.2 million in delinquent loans and recovered approximately $25.9 million.
Bank Profitability
The banking sector returned to profitability during the twelve months to September—the latest available data. Firms collectively recorded $135.4 million in net income, after the $109.5 million net loss in the corresponding 2014 period vis-à-vis the one-off provi-sioning adjustments. The net interest margin firmed by 1.7% to $532.7 million, as the 13.9% reduction in interest expense to $88.1 million, outstripped a 0.8% falloff in interest income to $620.8 million. Earnings from commission & foreign exchange also increased by a third to $29.1 million, contributing to a 3.0% recovery in the gross earnings margin to $561.8 million.
In light of banks’ restructuring activities, total operating expenses fell by 25.8% to $355.7 million, mainly explained by decreases in other “miscellaneous” operating costs—inclusive of professional services, Government fees and maintenance—by 43.0% ($116.2 million) and staff outlays by 4.8% ($8.6 million). As a consequence, the net earnings margin rose more than three-fold to $206.1 million. Similarly, the loss from “non-core” operations was more than halved to $70.7 million, capturing the $100.9 million normalization in provisions for bad debt to $162.2 million. Further, depreciation costs fell marginally by $0.3 million to $16.0 million and fee-based income firmed by $3.9 million to $107.6 million.
Corresponding to these trends, banks’ profitability ra-tios—as measured relative to average assets—improved. Gains were recorded for the interest margin, by 3 basis points, to 5.38%; commis-sion & forex income, by 7 basis points, to 0.29%, and the gross earning margin by 10 basis points, to 5.67%.
Similarly, the narrowing in the operational cost ratio by 1.3 percentage points to 3.59%, resulted in a 1.4 percentage point rise in the net earnings margin ratio to 2.08%. After accounting for “non-core” operations, banks posted a positive net income (return on assets) ratio of 1.36%, in contrast to the loss-equivalent 1.12% in 2014.
Capital Market DevelopmentsActivity on the local equity market remained relatively subdued, despite further share price appreciation. The volume of shares traded on The Bahamas International Stock Exchange (BISX) fell by 21.0% to 3.1 million; however, the corresponding value rose by 36.8% to $20.5 million. As underlying share prices firmed, the BISX All Share Index—a market capitalization weight-ed index—advanced further by 9.9% to 1,824.0 points, extending the 13.1% rise last year. Market capitalization of listed firms therefore appreciated by an estimated 4.1% to $3.7 billion, following 2014’s 12.9% expansion.
At end-December, the number of publicly traded se-curities listed on BISX had increased by 3 to 32. This represented 20 common share listings, 8 preference shares and 4 debt tranches.
TABLE 10: Balance of Payments Summary (B$ Millions) 2013p 2014p 2015p I. CURRENT ACCOUNT (1,493.9) (1,928.0) (1,339.9)
i) Merchandise Trade (net) (2,211.0) (2,481.7) (2,366.4)
Exports 954.9 833.9 506.0
Imports 3,165.9 3,315.6 2,872.4
of which: Oil 866.0 798.1 480.4
ii) Services (net) 1,043.0 991.7 1,475.3
Travel 2,022.2 2,096.7 2140.5
Other (979.2) (1,105.0) (665.2)
iii) Income (net) (329.1) 438.1 402.4
iv) Current Transfers (net) 3.2 0.0 (46.4)
II. CAPITAL AND FINANCIAL ACCOUNT 990.0 1,500.5 301.5
i) Capital Account (Transfers) (9.6) (8.9) (18.9)
ii) Financial Account 1,005.6 1,590.4 320.3
of which: Direct Investment 382.3 251.3 76.1
III. NET ERRORS AND OMISSIONS 429.4 473.6 1,062.7 IV. CHANGES IN EXTERNAL RESERVES1 68.5 (46.0) (24.3) SOURCE: Central Bank of The Bahamas 1( ) = increase.

38 Central Bank of The Bahamas
grew by 25.9% to $112.3 million. In contrast, the Government’s net receipts—which are derived mainly from departure taxes—advanced by 9.9% to $130.0 million.
The curtailment in the capital and financial account surplus was primarily attributed to a $1,028.4 million (80.0%) reduction in net private loan and short-term banking inflows to $180.3 million. In particular net private loan proceeds narrowed by 84.1% to $150.7 million, due to the winding down of a major foreign investment project in the prior year. Similarly, scaled-down borrowings constrained net public sector debt inflows to $76.3 million from $499.8 million in 2014. However, domestic banks’ net short-term trans-actions reversed from a net outflow of $161.9 million in the prior period, when Government repaid a bridg-ing facility, to a net inflow of $29.6 million in 2015. Net private direct investment receipts also declined, with a 52.3% falloff in net equity inflows to $118.3 million, and a reversal in real estate transactions to a net sale of $42.2 million from a $3.0 million net pur-chase in the previous year. In the meantime, residents’ net portfolio purchases abroad, under the Bahamian Depository Receipt (BDRs) programme, narrowed by $14.5 million to $12.4 million.
After making adjustments for net errors and omissions, the overall balance—which tracks the change in the Central Bank’s external reserves—recorded a lower surplus of $24.3 million, compared to $46.0 million in 2014.
DOMESTIC ECONOMIC OUTLOOK FOR 2016The domestic economy is expected to maintain its mildly positive growth trajectory in 2016, support-ed by sustained gains in stopover tourism. Positive impulses from a variety of new and ongoing foreign investment projects in both the capital and the various Family Islands, should also provide additional impetus for the construction sector. Inflationary pressures are
International Trade and PaymentsButtressed by a marked reduction in net construction services outflows and the fuel import bill, the external current account deficit contracted by an estimated $588.1 million (30.9%) to a preliminary $1,339.9 million. Similarly, the capital and financial account surplus narrowed by $1,199.0 million (79.9%) to $301.5 million, due to declines in the public sector’s net external borrowings and lower foreign investment inflows in the tourism sector.
The estimated trade gap narrowed by 4.6% to $2,366.4 million, as the pass-through from lower international oil prices reduced the fuel import bill by more than a third to $480.4 million. In terms of the various categories, broad-based declines were recorded for the average per barrel cost of jet fuel, by 53.3% to $69.00; propane, by 45.6% to $35.21; gas oil, by 44.2% to $69.29; motor gas, by 36.9% to $79.97 and aviation fuel, by 3.3% to $182.24. In addition, net non-oil imports declined by 2.3% to $2,016.6 million.
The services account surplus widened by an estimat-ed 48.8% to $1,475.3 million, mainly attributed to a 78.7% contraction in net outflows for construction services to $137.4 million—as substantive work on Baha Mar drew to a close. Similarly, the net payment for transportation services fell by 14.2% to $244.7 million, while net outflows for insurance services and royalty & license fees decreased by 2.1% and 9.5%, to $140.6 million and $17.7 million, respec-tively. Demand strengthening boosted net tourism receipts by 2.1% to $2,140.5 million. However net receipts on offshore companies’ local expenses contracted by 17.5% to $165.7 million, while the net outflows for other foreign services rose by almost a third to $322.0 million. Further, the net inflow for Government services fell by 4.8% to $31.5 million.
The estimated deficit on the income account narrowed by 8.2% to $402.4 million, owing primarily to a 10.1% decline in investment-related outflows to $335.9 million. In the underlying developments, net private sector interest and dividend payments fell by 13.6% to $271.9 million, as the 18.5% reduction in non-banks’ net outflows eclipsed the 37.1% rise in commercial banks’ net repatriations. In contrast, the public sector’s net interest costs grew modestly by $4.8 million (8.1%), with the rise in net external debt expenses surpassing the earnings inflows on the Central Bank’s foreign reserves. Meanwhile, the net repatriation of employee earnings rose by 3.3% to $66.5 million.
Net current transfer outflows expanded to $46.4 million from a flat outturn in 2014. This captured a more than two-fold increase in “miscellaneous” trans-fers to $64.1 million, while workers’ net remittances

2 0 1 5 A N N U A L R E P O R T 39
expected to remain contained, as global fuel prices, although rising from recent low levels, are anticipat-ed to remain well below pre-recession levels for an extended period.
In the fiscal sector, expectations are that the deficit will maintain its downward trajectory, buoyed by the structural gains from the VAT, along with the implementation of additional measures targeted at enhancing revenue administration. These initiatives, combined with the Government’s efforts to contain expenditure growth, should lead to an improvement in the corresponding deficit and debt indicators over the near-term.
Monetary conditions over the coming year are likely to reflect the persistence of elevated liquidity levels, as banks sustain their conservative lending practices in the presence of high levels of arrears and consum-ers continue to deleverage. In addition, banks’ are expected to maintain robust levels of capital, thereby mitigating any financial stability concerns.
Foreign currency receipts from the tourism sector, along with foreign investment inflows for various construction projects, are expected to be the main drivers for the external account in 2016, while the reduction in global oil prices should reduce the de-mand pressures for fuel purchases—which account for one quarter of the total import bill. As a consequence, the opportunities for external reserve rebuilding are expected to be enhanced.
Despite the modestly positive outlook for 2016, risks to the growth projections remain tilted to the down-side, given the potential for global shocks—such as below trend growth in the US market—to spill-over into the local economy. Another near-term risk posed to the outlook could occur from an unexpected sustained rise in global oil prices. Meanwhile, any resumption of work on the Baha Mar project, would provide upside potential to growth and employment.


The Central Bank of The Bahamas
FINANCIAL STATEMENTSFor the year ended DECEMBER 31, 2015and Independent Auditors’ Report


2 0 1 5 F I N A N C I A L S T A T E M E N T S 43
INDEPENDENT AUDITORS’ REPORT
To the Board of Directors of The Central Bank of The Bahamas
We have audited the accompanying financial statements of The Central Bank of The Bahamas, which comprise the statement of financial position as of December 31, 2015, and the statements of comprehensive income, changes in equity and reserves and cash flows for the year then ended, and notes, comprising a summary of significant accounting policies and other explanatory information.
Management’s Responsibility for the Financial StatementsManagement is responsible for the preparation and fair presentation of these financial statements in accordance with International Financial Reporting Standards and the Central Bank of The Bahamas Act, 2000, as amended, and for such internal control as management determines is necessary to enable the preparation of financial statements that are free from material misstatement, whether due to fraud or error.
Auditors’ ResponsibilityOur responsibility is to express an opinion on these financial statements based on our audit. We conducted our audit in accordance with International Standards on Auditing. Those standards require that we comply with ethical requirements and plan and perform the audit to obtain reasonable assurance about whether the financial statements are free from material misstatement.
An audit involves performing procedures to obtain audit evidence about the amounts and disclosures in the financial statements. The procedures selected depend on the auditors’ judgment, including the assessment of the risks of material misstatement of the financial statements, whether due to fraud or error. In making those risk assessments, the auditors consider internal control relevant to the entity’s preparation and fair presentation of the financial statements in order to design audit procedures that are appropriate in the circumstances, but not for the purpose of expressing an opinion on the effectiveness of the entity’s internal control. An audit also includes evaluating the appropriateness of accounting policies used and the reasonableness of accounting estimates made by management, as well as evaluating the overall presentation of the financial statements.
We believe that the audit evidence we have obtained is sufficient and appropriate to provide a basis for our audit opinion.
OpinionIn our opinion, the financial statements present fairly, in all material respects, the financial position of The Central Bank of The Bahamas as of December 31, 2015, and its financial performance and its cash flows for the year then ended in accordance with International Financial Reporting Standards and the Central Bank of The Bahamas Act, 2000, as amended.
Other MatterThe financial statements of the Central Bank of The Bahamas for the year ended December 31, 2014 were audited by another firm of auditors whose report, dated March 24, 2015, expressed an unmodified opinion on those statements. Our opinion is not qualified in respect of this matter.
Chartered AccountantsNassau, Bahamas
May 2, 2016

44 Central Bank of The Bahamas
The accompanying notes are an integral part of these financial statements.
THE CENTRAL BANK OF THE BAHAMAS
STATEMENT OF FINANCIAL POSITIONAS OF DECEMBER 31, 2015 (Expressed in Bahamian dollars)
Note 2015 2014$ $
ASSETS
EXTERNAL ASSETS 5 Cash and deposits with banks 3 206,593,351 155,210,814Marketable securities issued or guaranteed
by foreign governments 6 521,657,183 544,913,338International Monetary Fund: 7
Bahamas Reserve Tranche 8,675,061 9,069,925Special drawing rights – holdings 75,006,457 78,473,884
811,932,052 787,667,961
DOMESTIC ASSETS Cash on hand 3 1,927,734 55,450Bahamas Government Treasury bills 14 126,611,122 119,657,414Advances to Bahamas Government 9 135,360,599 135,235,783Bahamas Government Registered Stocks 10 261,122,528 316,537,255Loans to Bahamas Development Bank 11 3,723,110 4,207,035Bahamas Development Bank bonds 8 4,103,587 4,055,697Bridge Authority bonds 12 473,505 472,385Clifton Heritage Authority bonds 13 638,434 638,434Currency inventory 7,173,950 7,097,251Retirement benefit asset 29 3,519,122 1,556,553Receivables and other assets 11,274,292 16,700,560Property, plant and equipment 4 14,318,878 10,991,951
570,246,861 617,205,768
TOTAL ASSETS 1,382,178,913 1,404,873,729

2 0 1 5 F I N A N C I A L S T A T E M E N T S 45
THE CENTRAL BANK OF THE BAHAMAS
STATEMENT OF FINANCIAL POSITION (Continued)AS OF DECEMBER 31, 2015 (Expressed in Bahamian dollars)
The accompanying notes are an integral part of these financial statements.
Note 2015 2014$ $
LIABILITIES
DEMAND LIABILITIES Notes in circulation 15 365,921,592 354,148,708Coins in circulation 23,259,871 21,301,243Deposits by commercial banks 16 591,087,668 607,745,338Deposits by Bahamas Government and Bahamas
Government agencies 46,730,659 74,421,172Deposits by international agencies 17 255,261 255,443Accounts payable and other liabilities 9,295,592 5,661,623Investment Currency Market payable 6,660,600 5,914,733Health insurance subsidy benefit for retirees 30 2,850,014 2,841,282
1,046,061,257 1,072,289,542
OTHER LIABILITIES
International Monetary Fund: 7 Special drawing rights allocation 172,417,722 180,265,829
TOTAL LIABILITIES 1,218,478,979 1,252,555,371
EQUITY AND RESERVES
Authorised and fully paid capital 18 3,000,000 3,000,000Exchange equalisation account 18 12,222,982 7,975,948Contingency reserve 750,000 750,000Other reserves 10,389,415 10,389,415Building fund 18 10,680,403 10,680,403General reserve 18 126,657,134 119,522,592
TOTAL EQUITY AND RESERVES 163,699,934 152,318,358
TOTAL LIABILITIES, EQUITY AND RESERVES 1,382,178,913 1,404,873,729
APPROVED BY THE BOARD OF DIRECTORS AND SIGNED ON ITS BEHALF BY:
Director Director
Date: April 29, 2016

46 Central Bank of The Bahamas
THE CENTRAL BANK OF THE BAHAMAS
STATEMENT OF COMPREHENSIVE INCOMEFOR THE YEAR ENDED DECEMBER 31, 2015(Expressed in Bahamian dollars)
The accompanying notes are an integral part of these financial statements.
Note 2015 2014$ $
INCOME 19 Interest income:
Foreign investments 15,229,784 15,896,095Domestic investments 13,771,449 13,619,985Loans 1,104,339 993,322
30,105,572 30,509,402Interest expense (89,592) (158,337)
Net interest income 30,015,980 30,351,065
Net foreign exchange gain 3,888,076 5,663,106Net trading gains - 152,320Other income 3,490,232 5,393,155
Total income 37,394,288 41,559,646EXPENSES
Staff costs 20 18,860,703 18,268,988General and administrative 20 7,768,745 6,813,451Depreciation 4 1,703,687 1,633,294
Total expenses 28,333,135 26,715,733
NET INCOME 9,061,153 14,843,913
OTHER COMPREHENSIVE INCOME
Items that will not be reclassified to net income Actuarial gain/(loss) on defined pension plan benefit 2,196,771 (2,296,711)Actuarial gain/(loss) on group insurance subsidy 123,652 (270,016)
Total other comprehensive income/(loss) 2,320,423 (2,566,727)
TOTAL COMPREHENSIVE INCOME 11,381,576 12,277,186

2 0 1 5 F I N A N C I A L S T A T E M E N T S 47
The accompanying notes are an integral part of these financial statements.
THE CENTRAL BANK OF THE BAHAMAS
STATEMENT OF CHANGES IN EQUITY AND RESERVESFOR THE YEAR ENDED DECEMBER 31, 2015(Expressed in Bahamian dollars)
Authorised Exchange & Fully Paid Equalisation Contingency Other Building General
Capital Account Reserve Reserves Fund Reserve Total $ $ $ $ $ $ $
Balance at January 1, 2014 3,000,000 2,167,901 750,000 10,389,415 6,980,403 116,753,453 140,041,172
Comprehensive income
Net income - - - - - 14,843,913 14,843,913Other comprehensive income
Appropriation of foreign exchange gain (Note 2 (b) ii) - 5,808,047 - - - (5,808,047) -
Appropriation for building fund - - - - 3,700,000 (3,700,000) -
Actuarial gain/(loss) on defined benefit pension plan - - - - - (2,296,711) (2,296,711)
Actuarial gain/(loss) ongroup insurance subsidy - - - - - (270,016) (270,016)
Total comprehensive income - 5,808,047 - - 3,700,000 2,769,139 12,277,186
Balance at December 31, 2014 3,000,000 7,975,948 750,000 10,389,415 10,680,403 119,522,592 152,318,358
Balance at January 1, 2015 3,000,000 7,975,948 750,000 10,389,415 10,680,403 119,522,592 152,318,358
Comprehensive income
Net income - - - - - 9,061,153 9,061,153Other comprehensive income Appropriation of
foreign exchange gain - 4,247,034 - - - (4,247,034) - (Note 2 (b) ii)
Actuarial gain/(loss) on defined benefit pension plan - - - - - 2,196,771 2,196,771
Actuarial gain/(loss) on group insurance subsidy - - - - - 123,652 123,652
Total comprehensive income - 4,247,034 - - - 7,134,542 11,381,576
Balance at December 31, 2015 3,000,000 12,222,982 750,000 10,389,415 10,680,403 126,657,134 163,699,934

48 Central Bank of The Bahamas
THE CENTRAL BANK OF THE BAHAMAS
STATEMENT OF CASH FLOWSFOR THE YEAR ENDED DECEMBER 31, 2015 (Expressed in Bahamian dollars)
The accompanying notes are an integral part of these financial statements.
Note 2015 2014$ $
CASH FLOWS FROM OPERATING ACTIVITIES:
Net income 9,061,153 14,843,913Adjustments for non-cash items:
Discount earned on marketable securities - net (1,007,238) (1,103,598)Realised gain on sale of trading securities - (152,320)Depreciation 1,703,687 1,633,294(Gain)/Loss on disposal of property, plant and equipment - net (24,912) 29,559Interest income (29,098,334) (29,405,804)Interest expense 89,592 158,337
(Increase)/Decrease in operating assets Currency inventory (76,699) 194,646International Monetary Fund 7 3,861,928 5,673,052Retirement benefit asset 29 234,202 70,838
Receivables and other assets 5,426,268 (6,054,874)
Increase/(Decrease) in operating liabilities Notes in circulation 15 11,772,884 21,453,587Coins in circulation 1,958,628 1,312,751Deposits by commercial banks 16 (16,657,670) 35,536,238Deposits by Bahamas Government and
Bahamas Government agencies (27,690,513) 10,658,134Deposits by international agencies 17 (182) (179,018) Investment Currency Market payable 745,867 1,377,017Health insurance subsidy benefit for retirees 30 132,384 101,165Accounts payable and other liabilities 3,633,969 1,118,997International Monetary Fund (7,847,303) (11,367,481)
Net cash (used in)/provided by operating activities (43,782,289) 45,898,433

2 0 1 5 F I N A N C I A L S T A T E M E N T S 49
THE CENTRAL BANK OF THE BAHAMAS
STATEMENT OF CASH FLOWS (Continued)FOR THE YEAR ENDED DECEMBER 31, 2015 (Expressed in Bahamian dollars)
The accompanying notes are an integral part of these financial statements.
Note 2015 2014$ $
CASH FLOWS FROM INVESTING ACTIVITIES:
Purchase of held-to-maturity marketable securities 6 (76,518,945) (85,386,719)Proceeds from maturities/redemptions of held-to-maturity
marketable securities 6 100,373,000 88,000,000Proceeds from sale of trading securities 6 - 4,658,960Purchase of property, plant and equipment 4 (5,030,614) (547,276)Proceeds from sale of property, plant and equipment 24,912 6,600Advances made to Bahamas Government 9 - 90,000,000Advances repaid by Bahamas Government 9 - (90,000,000)Purchase of Bridge Authority bonds 12 (1,100) (2,500)Proceeds from maturities of Bridge Authority bonds - 506,000Purchase of Bahamas Government Registered Stock 10 (13,332,400) (114,285,800)Proceeds from sales and maturities of Bahamas Government
Stock 10 68,298,300 22,205,500Repayments of loans by Bahamas Development Bank 11 450,000 400,000Purchase of Bahamas Government Treasury bills 14 (372,596,255) (450,446,229)Proceeds from the sale and maturities of Bahamas Government
Treasury bills 14 365,601,483 517,341,258Interest received 29,859,125 28,471,351
Net cash provided by investing activities 97,127,506 10,921,145
CASH FLOWS FROM FINANCING ACTIVITIES:
Purchase of SDRs 7 - (24,980,000)Interest paid (90,396) (180,049)
Net cash (used in) financing activities (90,396) (25,160,049)
NET INCREASE IN CASH AND CASH EQUIVALENTS 53,254,821 31,659,529
CASH AND CASH EQUIVALENTS AT BEGINNING OF YEAR 155,266,264 123,606,735
CASH AND CASH EQUIVALENTS AT END OF YEAR 208,521,085 155,266,264
CASH AND CASH EQUIVALENTS ARE COMPRISED OF THE FOLLOWING: Cash and deposits with banks 204,715,578 154,152,417Cash on hand 3,805,507 1,113,847
208,521,085 155,266,264

50 Central Bank of The Bahamas
THE CENTRAL BANK OF THE BAHAMAS
NOTES TO THE FINANCIAL STATEMENTSDECEMBER 31, 2015
1. General Information
The Central Bank of The Bahamas (the “Bank”) is established as a body corporate under the Central Bank of The Ba-hamas Act, and was continued under the Central Bank of The Bahamas Act, 2000 (the Act). The Act establishes the structure, governance and the funding of the Bank. The Bank’s principal business is the provision of Central Banking facilities for the Commonwealth of The Bahamas. In accordance with the Act, it is the duty of the Bank to promote and maintain monetary stability and credit and balance of payments conditions conducive to the orderly development of the Bahamian economy; in collaboration with the financial institutions, to promote and maintain adequate banking services and high standards of conduct and management therein; and to advise the Minister on any matter of finan-cial or monetary nature referred by him to the Bank for its advice. Its main place of business is located at Frederick Street, Nassau, Bahamas.
2. Summary of Significant Accounting Policies
The principal accounting policies adopted in the preparation of the financial statements are set out below. These policies have been consistently applied to all the years presented, unless otherwise stated.
(a) Basis of preparation
i) Compliance with IFRS
The financial statements are prepared in accordance with International Financial Reporting Standards (IFRS).
ii) Historical cost convention
The financial statements have been prepared under the historical cost convention except for financial instruments that are measured at fair values, as disclosed in the accounting policies below. Historical cost is generally based on the fair value of consideration given in exchange for assets.
The preparation of financial statements in conformity with IFRS requires the use of certain critical accounting estimates. It also requires management to exercise judgment in the process of applying the Bank’s account-ing policies. Estimates and judgments are continually evaluated and are based on historical experience and other factors, including expectations of future events that are believed to be reasonable under the circum-stances. Actual results could differ from those estimates. The areas involving a higher degree of judgment or complexity, or areas where assumptions and estimates are significant to the financial statements, are disclosed in Notes 2 (d), (m), 29 and 30.
iii) New standards, amendments and interpretations adopted by the Bank
Standards and amendments and interpretations to published standards that became effective for the Bank’s financial year beginning on January 1, 2015, were either not relevant or not significant to the Bank’s operations and accordingly did not have a material impact on the Bank’s accounting policies or financial statements.

2 0 1 5 F I N A N C I A L S T A T E M E N T S 51
THE CENTRAL BANK OF THE BAHAMAS
NOTES TO THE FINANCIAL STATEMENTSDECEMBER 31, 2015
2. Summary of Significant Accounting Policies (Continued)
(a) Basis of preparation (continued)
iv) New standards, amendments and interpretations not yet adopted by the Bank
With the exception of IFRS 9 Financial Instruments (IFRS 9), IFRS 15 Revenue from Contracts with Customers (IFRS 15) and IFRS 16 Leases (IFRS 16), the application of new standards and amendments and interpre-tations to existing standards that have been published but are not yet effective are not expected to have a material impact on the Bank’s accounting policies or financial statements in the financial period of initial application.
IFRS 9 addresses the classification, measurement and recognition of financial assets and financial liabilities, and replaces the guidance in IAS 39 Financial Instruments: Recognition and Measurement (IAS 39) that relates to the classification and measurement of financial instruments. IFRS 9 retains but simplifies the mixed measurement model and establishes three primary measurement categories for financial assets: amortised cost, fair value through profit or loss and fair value through other comprehensive income. The determination is made at initial recognition, and the basis of classification depends on the Bank’s business model for man-aging its financial assets and the contractual cash flow characteristics of the financial asset. In addition, IFRS 9 will require the impairment of financial assets to be calculated using an expected credit loss model that replaces the incurred loss impairment model required by IAS 39.
For financial liabilities, there were no changes to classification and measurement, except for the recognition of changes in own credit risk in other comprehensive income for financial liabilities designated at fair value through profit or loss. The Bank has not yet assessed the full impact of adopting IFRS 9, which is effective for financial periods beginning on or after January 1, 2018.
IFRS 15 deals with revenue recognition and establishes principles for reporting useful information to users of financial statements about the nature, amount, timing and uncertainty of revenue and cash flows arising from an entity’s contracts with its customers. Revenue is recognised when a customer obtains control of a good or service and thus has the ability to direct the use and obtain the benefits from the good or service. The standard is effective for annual periods beginning on or after January 1, 2018, and replaces IAS 18 Revenue and IAS 11 Construction Contracts and related interpretations. The Bank has not yet assessed the full impact of adopting IFRS 15.
IFRS 16 results in lessees accounting for most leases within the scope of the standard in a manner similar to the way in which finance leases are currently accounted for under IAS 17 Leases. Lessees will recognise a ‘right of use’ asset and a corresponding financial liability on the balance sheet. The asset will be amortised over the length of the lease and the financial liability measured at amortised cost. Lessor accounting remains substantially the same as in IAS 17. The Bank has not yet assessed the full impact of adopting IFRS 16, which is effective for financial periods beginning on or after January 1, 2019.

52 Central Bank of The Bahamas
THE CENTRAL BANK OF THE BAHAMAS
NOTES TO THE FINANCIAL STATEMENTSDECEMBER 31, 2015
2. Summary of Significant Accounting Policies (Continued)
(b) Foreign currency translation
i) Functional and presentation currency
Items included in the financial statements are measured using the currency of the primary economic environ-ment in which the Bank operates. The financial statements are presented in Bahamian dollars (B$), which is the Bank’s functional and presentation currency.
ii) Transactions and balances
Foreign currency transactions are translated into the functional currency using the exchange rates prevailing at the date of the transactions. Foreign exchange gains and losses resulting from the settlement of such trans-actions and from the translation at year-end exchange rates of monetary assets and liabilities denominated in foreign currencies are recognised as a part of net income in the statement of comprehensive income. Translation differences on monetary financial assets and liabilities carried at fair value are part of the fair value gain and losses.
The net foreign exchange gain/loss in the Bank’s assets and liabilities arising from movements in foreign exchange rates is included in the statement of comprehensive income and, in accordance with Sections 32(2)(a) and 32(2)(b) of the Act, the gain/loss is appropriated from the general reserve to an exchange equalisation account within equity and reserves.
(c) Financial assets
Financial assets represent a contractual right to receive cash or another financial asset or to exchange financial assets or financial liabilities with another entity under conditions favorable to the Bank.
The Bank classifies its financial assets in the following categories: financial assets at fair value through profit or loss (FVTPL), available-for-sale (AFS), held-to-maturity (HTM) investments and loans and receivables. The clas-sification depends on the purpose for which the financial assets were acquired. Management determines the classification of its investments at initial recognition and re-evaluates this designation at every reporting date.
i) Financial assets at fair value through profit or loss
This category has two sub-categories: financial assets held for trading, and those designated at fair value through profit or loss at inception. A financial asset is classified into the financial assets at fair value through profit or loss category at inception if acquired principally for the purpose of selling in the short term, if it forms part of a portfolio of financial assets in which there is evidence of short-term profit-taking, or if so designated by management. Financial assets designated as at fair value through profit or loss at inception are those that are managed and whose performance is evaluated on a fair value basis, and are intended to be held for an indefinite period of time but may be sold in response to needs for liquidity or changes in interest rates, exchange rates or equity prices. Information about these financial assets is provided internally on a fair value basis to the Investment Management Committee. Financial assets classified as at fair value through profit or loss consist of the International Monetary Fund asset balances and have been so designated by management.

2 0 1 5 F I N A N C I A L S T A T E M E N T S 53
THE CENTRAL BANK OF THE BAHAMAS
NOTES TO THE FINANCIAL STATEMENTSDECEMBER 31, 2015
2. Summary of Significant Accounting Policies (Continued)
(c) Financial assets (continued)
ii) Available-for-sale financial assets
Available-for-sale (AFS) financial assets are non-derivatives that are either designated as AFS or are not classified as loans and receivables, held-to-maturity investments or financial assets at fair value through profit or loss. Changes in the carrying amount of AFS monetary financial assets relating to foreign currency rates, interest income calculated using the effective interest method and dividends on AFS equity investments are recognised in the statement of comprehensive income. Other changes in the carrying amount of availa-ble-for-sale financial assets are recognised through other comprehensive income.
Bahamas Government Treasury bills are classified as available-for-sale financial assets.
iii) Held-to-maturity financial assets
Held-to-maturity investments are non-derivative financial assets with fixed or determinable payments and fixed maturities that the Bank’s management has the positive intention and ability to hold to maturity. If the Bank were to sell other than an insignificant amount of held-to-maturity assets, the entire category would be reclassified as available-for-sale.
Marketable securities issued or guaranteed by foreign governments and Clifton Heritage Authority bonds are classified as held-to-maturity investments. Subsequent to initial recognition, held-to-maturity investments are measured at amortised cost using the effective interest rate method less any impairment.
The effective interest method is a method of calculating the amortised cost of a debt instrument and of allo-cating interest income over the relevant period. The effective interest rate is the rate that exactly discounts the estimated future cash receipts (including all fees paid or received that form an integral part of the effective interest rate, transaction costs and other premiums or discounts) through the expected life of the debt instru-ment, or (where appropriate) a shorter period, to the net carrying amount on initial recognition.
iv) Loans and receivables
Loans and receivables are non-derivative financial assets with fixed or determinable payments that are not quoted in an active market, other than, (a) those that the Bank intends to sell immediately or in the short term, (b) those that the Bank, upon initial recognition, designates as available-for-sale, or (c) those for which the Bank may not recover substantially all of its initial investment, other than because of credit deterioration, which are classified as available-for-sale. Loans and receivables are measured at amortised cost.
Accounts set out below are classified as loans and receivables originated by the Bank and not held-for-trading: • Advances to Bahamas Government• Loans to Bahamas Development Bank• Bahamas Government Registered Stocks• Bahamas Development Bank bonds• Bridge Authority bonds• Employee loans and other receivables

54 Central Bank of The Bahamas
THE CENTRAL BANK OF THE BAHAMAS
NOTES TO THE FINANCIAL STATEMENTSDECEMBER 31, 2015
2. Summary of Significant Accounting Policies (Continued)
(c) Financial assets (continued)
iv) Loans and receivables (continued)
Regular-way purchases and sales of financial assets are recognised on the trade date – the date on which the Bank commits to originate, purchase or sell the asset. Financial assets are initially recognised at fair value plus transaction costs, except financial assets carried at fair value through profit or loss where such costs are expensed as incurred. Financial assets are derecognised when the rights to receive cash flows from the finan-cial assets have expired or when the Bank has transferred substantially all risks and rewards of ownership.
When securities classified as available-for-sale are sold, the accumulated fair value adjustments recognised in other comprehensive income are reclassified to profit or loss as gains and losses from investment securities.
Financial assets at fair value through profit or loss are subsequently carried at fair value. Fair value is based on quoted prices for securities traded in active markets (e.g. international securities exchange) or valuation techniques, including recent arm’s length transactions, discounted cash flow analyses and other valuation techniques commonly used by market participants, for securities not traded in active markets. Loans and receivables and HTM investments are subsequently carried at amortised cost using the effective interest method, less provisions for impairment.
Gains or losses arising from sales and changes in fair value of financial assets are recognised as a part of net income in the statement of comprehensive income in the financial period in which they arise.
(d) Impairment of financial assets at amortised cost
The Bank assesses at each balance sheet date whether there is objective evidence that a financial asset or group of financial assets is impaired. A financial asset or a group of financial assets is impaired and impair-ment losses are incurred if, and only if, there is objective evidence of impairment as a result of one or more events that occurred after the initial recognition of the asset (a loss event) and that loss event (or events) has an impact on the estimated future cash flows of the financial asset or group of financial assets that can be reliably estimated. In the case of equity investments classified as available-for-sale, a significant or prolonged decline in the fair value of the security below its cost is considered an indicator that the assets are impaired.
The Bank first assesses whether objective evidence of impairment exists individually for financial assets that are individually significant, and individually or collectively for financial assets that are not individually significant. If the Bank determines that no objective evidence of impairment exists for an individually assessed financial asset, whether significant or not, it includes the asset in a group of financial assets with similar credit risk character-istics and collectively assesses them for impairment. Assets that are individually assessed for impairment and for which an impairment loss is or continues to be recognised are not included in a collective assessment of impairment.
The amount of the loss is measured as the difference between the asset’s carrying amount and the present value of estimated future cash flows (excluding future credit losses that have not been incurred) discounted at the financial asset’s original effective interest rate. If a financial asset has a variable interest rate, the discount rate for measuring any impairment loss is the current effective interest rate determined under the contract. As a practical expedient, the Bank may measure impairment on the basis of an instrument’s fair value using an observable market price.
2 0 1 5 F I N A N C I A L S T A T E M E N T S 55
THE CENTRAL BANK OF THE BAHAMAS
NOTES TO THE FINANCIAL STATEMENTSDECEMBER 31, 2015
2. Summary of Significant Accounting Policies (Continued)
(d) Impairment of financial assets at amortised cost (continued)
The carrying amount of the asset is reduced through the use of an allowance account and the amount of the loss is recognised as a part of net income in the statement of comprehensive income. If, in a subsequent period, the amount of the impairment loss decreases and the decrease can be related objectively to an event occurring after the impairment was recognised, the previously recognised impairment loss is reversed by adjust-ing the allowance account. The amount of the reversal is recognised as a part of net income in the statement of comprehensive income. When a financial asset is uncollectible, it is written off against the related allowance account. Such financial assets are written off after all the necessary procedures have been completed and the amount of the loss has been determined. Recoveries of accounts previously written off are recognised directly in the statement of comprehensive income as a part of net income.
(e) Property, plant and equipment
Property, plant and equipment, other than land, are recorded at historical cost less accumulated depreciation. Historical cost includes expenditure that is directly attributable to the acquisition of the items.
Subsequent costs are included in the asset’s carrying amount or are recognised as a separate asset, as appro-priate, only when it is probable that future economic benefit associated with the item will flow to the Bank and the cost of the item can be measured reliably. All other repairs and maintenance are charged to the statement of comprehensive income as part of net income during the financial period in which they are incurred.
Land is not depreciated. Depreciation on other assets are calculated using the straight-line method to allocate cost (net of residual values) over the rate of estimated useful lives as follows:
Rate
Buildings and renovations 2% - 20%
Office equipment 20% - 33%
Computer software 33% - 50%
Office furniture and fittings 20%
Other fixed assets 20% - 33%
The assets’ residual values and useful lives are reviewed, and adjusted if appropriate, at each balance sheet date. Assets that are subject to depreciation are reviewed for impairment whenever events or changes in circumstances indicate that the carrying amount may not be recoverable. An asset’s carrying amount is written down immediately to its recoverable amount if the asset’s carrying amount is greater than its estimated recov-erable amount. The recoverable amount is the higher of the asset’s fair value less costs to sell and its value in use.
Gains and losses on disposals are determined by comparing proceeds with the carrying amount and are recognised in the statement of comprehensive income as a part of net income.

56 Central Bank of The Bahamas
THE CENTRAL BANK OF THE BAHAMAS
NOTES TO THE FINANCIAL STATEMENTSDECEMBER 31, 2015
2. Summary of Significant Accounting Policies (Continued)
(f) Financial liabilities
Financial liabilities are any liabilities that are contractual obligations to deliver cash or another financial asset to another entity or to exchange financial assets or financial liabilities with another entity under conditions that are potentially unfavourable to the Bank; or a contract that will or may be settled in the Bank’s own equity instrument. Financial liabilities are classified as either financial liabilities at fair value through profit or loss (including finan-cial liabilities held for trading and those designated at fair value through profit or loss) and financial liabilities at amortised cost.
i) Financial liabilities at fair value through profit or loss
A financial liability is classified as held for trading if it is acquired or incurred principally for the purpose of selling or repurchasing it in the near term or if it is part of a portfolio of identified financial instruments that are managed together and for which there is evidence of a recent actual pattern of short-term profit-taking or if so designated by management. Financial liabilities designated as at fair value through profit or loss at inception are those that are managed and whose performance if evaluated on a fair value basis, and are intended to be held for indefinite period of time but may be extinguished in response to needs for liquidity or changes in interest rates or exchange rates. Information about these financial liabilities is provided internally on a fair value basis to the Investment Management Committee. Financial liabilities classified as at fair value through profit or loss consists of the International Monetary Fund liability balance and has been so designated by management.
Financial liabilities at fair value through profit or loss are initially recognised and subsequently measured at fair value with any gains or losses recognised in the statement of comprehensive income. Fair value is computed using quoted market prices.
ii) Other financial liabilities at amortised cost
Other financial liabilities are initially recognised at fair value and subsequently measured at amortised cost using the effective interest rate method, where applicable.
The Bank derecognises financial liabilities when, and only when, the Bank’s obligations are discharged, cancelled or they expire.
(g) Provisions
Provisions are recognised when the Bank has a present legal or constructive obligation as a result of past events, it is more likely than not that an outflow of resources will be required to settle the obligation, and the amount has been reliably estimated.
The amount recognised as a provision is the best estimate of the consideration required to settle the present obligation at the end of the reporting period, taking into account the risks and uncertainties surrounding the obli-gation. Where a provision is measured using the cash flows estimated to settle the present obligation, its carrying amount is the present value of those cash flows.
When some or all of the economic benefits required to settle a provision are expected to be recovered from a third party, a receivable is recognised as an asset if it is virtually certain that reimbursement will be received and the amount of the receivable can be measured reliably.
2 0 1 5 F I N A N C I A L S T A T E M E N T S 57
THE CENTRAL BANK OF THE BAHAMAS
NOTES TO THE FINANCIAL STATEMENTSDECEMBER 31, 2015
2. Summary of Significant Accounting Policies (Continued)
(h) Currency inventories
Bank notes and coins are recorded at cost upon receipt of stock and are placed into inventory. They are subse-quently expensed when issued into circulation.
(i) Numismatic coins
Numismatic coins, which are specially minted or packaged as collectors’ items and are not issued for monetary purposes, are not included in coins in circulation. Any profit or loss arising from the sale of these coins is included in the statement of comprehensive income.
(j) Investment currency market payable
The Bank maintains a market in investment currency, prescribed for facilitating direct investment and foreign currency securities acquisitions outside The Bahamas. The investment currency attracts a deposit of 10.0%. Such deposits are treated as financial liabilities, recognised initially at fair value and subsequently measured at amortised cost. The financial liabilities are derecognised when repaid to investors and funds are repatriated to the country.
The purchase of investment currency attracts a 2.5% surcharge to facilitate the transaction. This fee is recognised upon completion of the investment currency purchase and is recognised in ‘Other income’ in the statement of comprehensive income.
(k) Income and expense recognition
The Bank recognises income when it is probable that future economic benefits will flow to the Bank and the amount of income can be reliably measured. Income is measured at the fair value of the consideration received or receivable. Interest income is accounted for on an accrual basis using the effective interest method.
The effective interest method is a method of calculating the amortised cost of a financial asset or liability and of allocating interest expense over the relevant period. The effective interest rate is the rate that exactly discounts estimated future cash payments through the expected life of the financial asset or liability, or (where appropriate) a shorter period, to the net carrying amount on initial recognition of the financial asset or liability.
Other income and expenses are recognised on the accrual basis.
(l) Leases
The Bank is the lessee
The leases entered into by the Bank are operating leases. The total payments made under operating leases are charged to the statement of comprehensive income as a part of net income on a straight-line basis over the period of the lease. When an operating lease is terminated before the lease period has expired, any payment required to be made to the lessor by way of penalty is recognised as an expense in the financial period in which termination takes place.

58 Central Bank of The Bahamas
THE CENTRAL BANK OF THE BAHAMAS
NOTES TO THE FINANCIAL STATEMENTSDECEMBER 31, 2015
2. Summary of Significant Accounting Policies (Continued)
(m) Employee benefits
The Bank’s employees participate in a defined benefit and a defined contribution pension plan.
Defined Benefit Plan
The Bank’s retirement plan has a contributory defined benefit plan with participants being permanent employees who have been employed on or before December 31, 2013 and have not attained age 55. The cost of provid-ing such benefits is determined using the projected unit credit method, with actuarial valuations being carried out at each statement of financial position date. The defined benefit obligation is calculated annually by independent actuaries. Remeasurements are recognised in other comprehensive income when they occur. Past service cost is recognised immediately in the period of a plan amendment or curtailment. Contributions are made by employees at 5% of basic salary and the difference by the Bank, which amounted to 14.80% (2014: 14.40%).
The asset or liability amount recognised in the statement of financial position represents the present value of the defined benefit obligation and the current service cost at the end of the reporting period less, the fair value of plan assets. Any asset arising as a result of this calculation is measured at the lower of the surplus in the defined benefit plan.
Employees who join the Bank on or after January 1, 2014 participate in the defined contribution plan. The Bank pays fixed contributions, equivalent to 10% of each member employee’s salary, into the Plan which is admin-istered by a third party. These contributions are expensed in the period in which the employees rendered the services entitling them to the benefits. In addition, each member also contributes 5% of their salary. The Bank has no legal or constructive obligations to pay for the contributions if the Plan does not hold sufficient assets to pay all the employees the benefits related to employee service in the current and prior periods.
The contributions are recognised as employee benefit expense in the statement of comprehensive income in the period when they are due. The Bank has no further payment obligations once the recognised contributions have been paid.
Health insurance subsidy for retirees
The Bank pays a portion of the group life and health insurance (GLHI) premium for retirees who elect to remain covered by the Bank’s GLHI policy after retirement. The expected costs of these benefits are accrued over the period of employment using the same accounting methodology as used for defined benefit pension plan. Remeasurement gains and losses arising from experience adjustments and changes in actuarial assumptions are charged or credited to equity in other comprehensive income in the period in which they arise. These obligations are valued annually by independent qualified actuaries. The amount recognised in the statement of financial position represents the present value of the retirement benefit obligation.

2 0 1 5 F I N A N C I A L S T A T E M E N T S 59
THE CENTRAL BANK OF THE BAHAMAS
NOTES TO THE FINANCIAL STATEMENTSDECEMBER 31, 2015
2. Summary of Significant Accounting Policies (Continued)
(n) Cash and cash equivalents
For the purpose of the statement of cash flows, cash and cash equivalents comprise cash on hand and at bank and deposits that have original contractual maturities of three months or less.
(o) Taxation
Under the current laws of The Bahamas, the country of domicile of the Bank, there are no income, capital gains or other corporate taxes imposed. The Bank’s operations do not subject it to taxation in any other jurisdiction.
(p) Fiduciary items
No account is taken in these financial statements of assets held or liabilities incurred by the Bank in a fiduciary capacity.
(q) Corresponding figures
Where necessary, corresponding figures are adjusted to conform with changes in presentation in the current year.
3. Cash and Deposits with Banks
2015 2014 $ $
Cash on hand 3,805,507 1,113,847Cash at banks 29,691,556 59,148,324 Deposits at banks with maturities three months or less 175,024,022 95,004,093
Total 208,521,085 155,266,264

60 Central Bank of The Bahamas
THE CENTRAL BANK OF THE BAHAMAS
NOTES TO THE FINANCIAL STATEMENTSDECEMBER 31, 2015
4. Property, Plant and Equipment
Office Land Buildings Office Computer Furniture & Other Fixed
& Renovations Equipment Software Fittings Assets Total$ $ $ $ $ $ $
COST As of January 1, 2015 2,452,938 14,770,687 10,324,812 9,051,319 6,571,831 254,920 43,426,507Additions - 103,248 999,804 3,743,647 41,880 142,035 5,030,614Disposals/Retirement - (254,368) (5,125,990) (134,584) (5,965,835) (121,553) (11,602,330)As of December 31, 2015 2,452,938 14,619,567 6,198,626 12,660,382 647,876 275,402 36,854,791
ACCUMULATED
DEPRECIATION As of January 1, 2015 - 7,795,954 9,316,245 8,737,183 6,367,647 217,527 32,434,556Charge for the year - 410,107 594,252 579,651 82,843 36,834 1,703,687Disposals/Retirement - (254,368) (5,125,990) (134,584) (5,965,835) (121,553) (11,602,330)As of December 31, 2015 - 7,951,693 4,784,507 9,182,250 484,655 132,808 22,535,913
NET BOOK VALUE As of December 31, 2015 2,452,938 6,667,874 1,414,119 3,478,132 163,221 142,594 14,318,878
COST As of January 1, 2014 2,452,938 14,679,776 10,275,081 8,831,123 6,565,859 297,985 43,102,762Additions - 90,911 166,166 273,441 16,758 - 547,276Disposals - - (116,435) (53,245) (10,786) (43,065) (223,531)As of December 31, 2014 2,452,938 14,770,687 10,324,812 9,051,319 6,571,831 254,920 43,426,507
ACCUMULATED
DEPRECIATION As of January 1, 2014 - 7,361,384 8,671,365 8,457,466 6,258,824 239,595 30,988,634Charge for the year - 434,570 728,505 332,962 116,260 20,997 1,633,294Disposals - - (83,625) (53,245) (7,437) (43,065) (187,372)As of December 31, 2014 - 7,795,954 9,316,245 8,737,183 6,367,647 217,527 32,434,556
NET BOOK VALUE As of December 31, 2014 2,452,938 6,974,733 1,008,567 314,136 204,184 37,393 10,991,951

2 0 1 5 F I N A N C I A L S T A T E M E N T S 61
THE CENTRAL BANK OF THE BAHAMAS
NOTES TO THE FINANCIAL STATEMENTSDECEMBER 31, 2015
5. External Assets
External assets comprise those assets defined by Section 18(1) of the Act. The Act also requires that the value of ex-ternal assets shall not at any time be less than 50% of the value of the aggregate of the notes and coins in circulation and other demand liabilities of the Bank. At year end, external assets represented 77.6% (2014: 73.45%) of such liabilities.
6. Marketable Securities Issued or Guaranteed by Foreign Governments
Section 18(1) of the Act requires that marketable securities issued or guaranteed by foreign governments, which ma-ture beyond 5 years, shall at no time constitute more than 30% in value of the Bank’s external assets. At December 31 2015, marketable securities held by the Bank, which mature after 5 years, constituted 23.27% (2014: 36.58%) of the Bank’s external assets.
The movements in marketable securities classified as held-to-maturity are as follows:
2015 2014 $ $
Beginning balance 541,248,682 542,758,365 Purchases at nominal value 77,000,000 86,000,000 Discount on purchases (481,055) (613,281)Redemptions/maturities (100,373,000) (88,000,000)Discount earned 1,055,524 1,150,478 Amortised premium (48,286) (46,880)
Total 518,401,865 541,248,682 Add: Accrued interest 3,255,318 3,664,656
Ending balance 521,657,183 544,913,338
These securities bear interest at rates varying between 1.375% and 4.75% (2014: 1.25% and 4.75%).
The movements in trading marketable securities are as follows:
2015 2014 $ $
Beginning balance - 4,506,640 Purchases - -Sales - (4,506,640)Realised fair value loss - -
Total - -Add: Accrued interest - -
Ending balance - -

62 Central Bank of The Bahamas
THE CENTRAL BANK OF THE BAHAMAS
NOTES TO THE FINANCIAL STATEMENTSDECEMBER 31, 2015
7. International Monetary Fund
Background
The International Monetary Fund (IMF) is an organisation of 188 countries, working to foster global monetary coop-eration, secure financial stability, facilitate international trade, promote high employment and sustainable economic growth, and reduce poverty around the world. The Bahamas was admitted as a member of the IMF on August 21, 1973.
Quota, Subscriptions and Reserve Tranche
Each IMF member country is assigned a quota, or contribution, that reflects the country’s relative size in the global economy. Quotas are denominated in Special Drawing Rights (SDRs), the IMF’s unit of account, which is essentially a specified basket of four (4) major international currencies (i.e., the U.S. Dollar, Japanese Yen, Euro, and Pound Sterling).
As of December 31, 2015, The Bahamas was assigned a quota of SDR130,300,000 (2014: SDR 130,300,000) which represents 0.05% (2014: 0.05%) of the total quota allocated by the IMF.
A member’s quota determines that country’s financial and organizational relationship with the IMF which includes:
• Determining the maximum amount of financial resources the member is obliged to provide to the IMF via its subscription;
• Determining a member’s voting power in IMF decisions; and
• Establishing the maximum amount of financing a member can obtain from the IMF.
The Reserve Tranche Position (RTP) represents that proportion of the required quota of currency that each IMF member country must provide to the IMF, but can designate for its own use. The RTP was purchased from the Government of The Bahamas in 1976 and can be encashed on demand in order to meet a balance of payments financing need. This reserve asset is established when a member pays its initial subscription into the IMF at the predetermined amount of SDR or freely usable currency. The IMF designates freely usable currencies as those widely used to make payments for international transactions and are traded in the principal exchange markets.
The Bahamian dollar is designated as an unusable currency which permits the Bank to pay the non-reserve portion of the quota in the form of promissory notes. Subsequent to its initial subscription into the IMF, the Bank has increased the IMF subscriptions of The Bahamas by issuing, non-negotiable, interest-free promissory notes which are payable if the IMF requires an emergency loan. Payment of the promissory notes will give rise to an equal and opposite receivable from the IMF. These promissory notes were issued by the Bank and the Government of The Bahamas on behalf of the Bank, in the Bahamian dollar equivalents of SDR33,519,522 and SDR85,526,142 (2014: SDR33,649,528 and SDR85,857,855) respectively. The promissory notes form, a substance, part of a loan commitment to the IMF and as such are not recognised on the statement of financial position.
The IMF reserve tranche represents the difference between the members quota and the sum of promissory notes and subscription payments in local currency paid to the IMF as noted below:

2 0 1 5 F I N A N C I A L S T A T E M E N T S 63
THE CENTRAL BANK OF THE BAHAMAS
NOTES TO THE FINANCIAL STATEMENTSDECEMBER 31, 2015
7. International Monetary Fund (Continued)
2015 2014SDR $ SDR $
Quota 130,300,000 180,455,668 130,300,000 188,779,295 Subscription payments in Promissory notes (119,045,664) (164,965,217) (119,507,383) (173,143,042)Subscription payments in local currency (4,994,056) (6,815,390) (4,532,337) (6,566,328)
Reserve tranche 6,260,280 8,675,061 6,260,280 9,069,925
SDR Holdings and SDR Allocation
The IMF may allocate SDRs to member countries in proportion to their IMF quotas. SDRs allocated is treated as a lia-bility in the financial statements of a member, with an equal asset initially being recorded in the form of SDR Holdings.
Members can hold their SDRs as part of their international reserves or sell part or all of their SDR holdings. Members can exchange SDRs for freely usable currencies (and vice versa) among themselves and with prescribed holders; such exchange can take place under a voluntary arrangement or under designation by the IMF. Revaluation differences of SDR assets and liabilities are reported in net foreign exchange gains/losses account in the statement of comprehen-sive income.
IMF members can also use SDRs in operations and transactions involving the IMF, such as the payment of interest on and repayment of loans, or payment for future quota increases.
Consequently, a member’s SDR Holdings (asset) and SDR Allocation (liability) can be different at a point in time.
The IMF pays interest at the SDR interest rate on the amount that a member’s net holdings exceed their cumulative allocations. Conversely, if a member’s SDR holdings are below its allocation, it incurs a net interest obligation.
Interest on SDR holdings and allocations are received/paid quarterly. The SDR interest rate is determined weekly on each Friday and is based on a weighted average of representative interest rates on three month debt in the money markets of the basket of four (4) SDR international currencies.
SDR Holdings
2015 2014 SDR $ SDR $
Beginning balance 54,159,903 78,467,140 38,030,916 58,567,579 Purchase of SDRs - - 16,205,900 24,980,000 Remuneration & other charges (36,774) (50,959) (76,913) (111,432)Currency movement - (3,416,105) - (4,969,007)
Total 54,123,129 75,000,076 54,159,903 78,467,140
Add: Accrued interest 6,381 6,744
Ending balance 75,006,457 78,473,884

64 Central Bank of The Bahamas
THE CENTRAL BANK OF THE BAHAMAS
NOTES TO THE FINANCIAL STATEMENTSDECEMBER 31, 2015
7. International Monetary Fund (Continued)
SDR Holdings and SDR Allocation (continued)
SDR Allocation
2015 2014 SDR $ SDR $
Beginning balance 124,413,351 180,250,688 124,413,351 191,596,457Currency movement - (7,847,303) - (11,345,769)
Total 124,413,351 172,403,385 124,413,351 180,250,688
Add: Accrued interest 14,337 15,141
Ending balance 172,417,722 180,265,829
In accordance with a resolution of the Board of Governors of the IMF, effective December 11, 1978, The Baha-mas became a participant in the Special Drawing Rights Department of the IMF, receiving a total allocation of SDR 10,230,000 between 1979 and 1981. A general allocation took effect on August 28, 2009 and a special allo-cation on September 9, 2009 and increased the Bank’s allocations to SDR 124,413,351.
The interest rate, which is the same on both SDR Holdings and allocation, varied between 0.06% and 0.13% (2014: 0.04% and 0.13%) during the period.
8. Bahamas Development Bank Bonds
The movement in the Bahamas Development Bank bonds is as follows:
2015 2014 $ $
Balance 4,000,000 4,000,000 Add: Accrued interest 103,587 55,697
Total 4,103,587 4,055,697
These bonds bear interest at the Bahamian dollar prime rate of 4.75% (2014: 4.75%) with $2,000,000 maturing on August 1, 2025 and November 1, 2025, respectively.
9. Advances to Bahamas GovernmentSections 28(3) and 28(4) of the Act require that advances to the Government, which may be outstanding at any one time, shall not exceed the lesser of either (a) 10% of the annual average ordinary revenue of the Government over the three preceding years, for which the accounts have been laid before Parliament, or (b) the estimated ordinary revenue of the Government for the year.At the year end date, advances to the Government were 9.67% (2014: 10%) of the lesser of such revenues.

2 0 1 5 F I N A N C I A L S T A T E M E N T S 65
THE CENTRAL BANK OF THE BAHAMAS
NOTES TO THE FINANCIAL STATEMENTSDECEMBER 31, 2015
9. Advances to Bahamas Government (Continued)The movements in advances for the year are as follows:
2015 2014 $ $
Beginning balance 134,657,052 134,657,052Additions - 90,000,000 Repayments - (90,000,000)
Total 134,657,052 134,657,052 Add: Accrued interest 703,547 578,731
Ending balance 135,360,599 135,235,783
The advances, which are repayable on demand, are as follows:Rate 2015 2014
$ $0.356% 19,069,444 19,069,444 0.395% 20,000,000 20,000,000 0.483% 5,000,000 5,000,000 0.512% 5,000,000 5,000,000 0.540% 60,000,000 60,000,000 0.638% 20,000,000 20,000,000 0.840% 5,587,608 5,587,608
134,657,052 134,657,052
10. Bahamas Government Registered Stocks
The movement in Bahamas Government Registered Stocks are as follows:
2015 2014 $ $
Beginning balance 312,959,800 220,879,500 Purchases 13,332,400 114,285,800 Redemptions/maturities (68,298,300) (22,205,500)
Total 257,993,900 312,959,800 Add: Accrued interest 3,128,628 3,577,455
Ending balance 261,122,528 316,537,255
Bahamas Government Registered Stocks bear interest at rates ranging between 3.50% and 6.00% (2014: 3.50% and 6.00%).

66 Central Bank of The Bahamas
THE CENTRAL BANK OF THE BAHAMAS
NOTES TO THE FINANCIAL STATEMENTSDECEMBER 31, 2015
11. Loans to Bahamas Development Bank
This balance is comprised of two Government Guaranteed loan facilities made available in accordance with Section 29(1)(f) of the Act.
The movement in loans to Bahamas Development Bank are as follows:
2015 2014$ $
Beginning balance 4,150,000 4,550,000Repayments (450,000) (400,000)
Total 3,700,000 4,150,000Add: Accrued interest 23,110 57,035
Ending balance 3,723,110 4,207,035
The loans bear interest at 2.00% (2014: 2.00%), with $450,000 and $3,250,000 maturing on October 21, 2018 and October 28, 2024, respectively.
12. Bridge Authority Bonds
The movements in the Bridge Authority bonds are as follows:
2015 2014$ $
Beginning balance 464,800 968,300Purchases 1,100 2,500Maturities - (506,000)
Total 465,900 464,800Add: Accrued interest 7,605 7,585
Ending balance 473,505 472,385
These bonds bear interest at rates ranging from 1.00% to 1.63% (2014: 1.25% to 1.63%) per annum over the Bahamian dollar prime rate with $443,400, $4,000 and $18,500 maturing on March 24, 2019, 2024 and 2029, respectively.
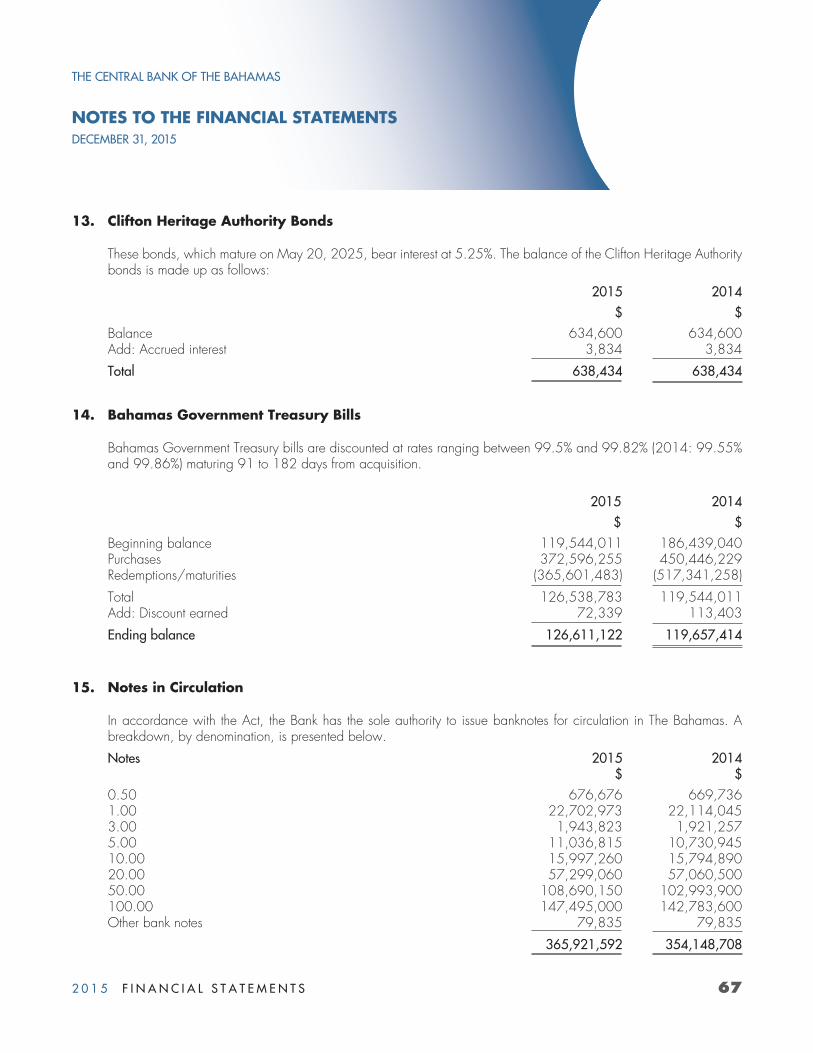
2 0 1 5 F I N A N C I A L S T A T E M E N T S 67
THE CENTRAL BANK OF THE BAHAMAS
NOTES TO THE FINANCIAL STATEMENTSDECEMBER 31, 2015
13. Clifton Heritage Authority Bonds
These bonds, which mature on May 20, 2025, bear interest at 5.25%. The balance of the Clifton Heritage Authority bonds is made up as follows:
2015 2014$ $
Balance 634,600 634,600Add: Accrued interest 3,834 3,834
Total 638,434 638,434
14. Bahamas Government Treasury Bills
Bahamas Government Treasury bills are discounted at rates ranging between 99.5% and 99.82% (2014: 99.55% and 99.86%) maturing 91 to 182 days from acquisition.
2015 2014$ $
Beginning balance 119,544,011 186,439,040Purchases 372,596,255 450,446,229Redemptions/maturities (365,601,483) (517,341,258)
Total 126,538,783 119,544,011Add: Discount earned 72,339 113,403
Ending balance 126,611,122 119,657,414
15. Notes in Circulation
In accordance with the Act, the Bank has the sole authority to issue banknotes for circulation in The Bahamas. A breakdown, by denomination, is presented below.
Notes 2015 2014$ $
0.50 676,676 669,7361.00 22,702,973 22,114,0453.00 1,943,823 1,921,2575.00 11,036,815 10,730,94510.00 15,997,260 15,794,89020.00 57,299,060 57,060,50050.00 108,690,150 102,993,900100.00 147,495,000 142,783,600Other bank notes 79,835 79,835
365,921,592 354,148,708

68 Central Bank of The Bahamas
THE CENTRAL BANK OF THE BAHAMAS
NOTES TO THE FINANCIAL STATEMENTSDECEMBER 31, 2015
16. Deposits by Commercial Banks
Deposits by commercial banks include current account balances deposited as statutory reserves in accordance with Section 19 of the Act. The remaining funds deposited in the current account are used to facilitate settlement and to effect foreign currency transactions.
The present level of the statutory reserves applicable to commercial banks is 5% of total Bahamian dollar deposit liabilities, of which at least 4% must be placed on deposit with the Bank. These deposits are interest free and are repayable on demand, subject to maintenance of minimum balances required by the Act.
17. Deposits by International Agencies
The Bank is designated as the fiscal agency for the Commonwealth of The Bahamas. Deposits by international agen-cies include deposits in Bahamian currency by the World Bank, the International Monetary Fund and the Inter-Amer-ican Development Bank. These deposits are interest free and are repayable on demand.
18. Equity and Reserves
Capital management - The Bank’s objectives when managing capital, which consists of total equity and reserves on the statement of financial position, are:
• To comply with the capital requirements outlined in Sections 6 and 7 of the Act;
• To safeguard the Bank’s ability to continue as a going concern in its provision of Central Banking facilities for The Bahamas; and
• To maintain a strong capital base to support the development of the Bahamian economy.
Capital adequacy and the use of regulatory capital are monitored by the Bank’s management, and in accordance with the guidelines established by the Act.
At December 31, 2015, and 2014, the Bank’s paid up capital was equal to the authorised capital of $3,000,000.
To comply with section 32(2)(a) of the Act, the table below presents the performance of the Bank excluding from the calculation any profit or loss arising from any revaluation of any assets or liabilities of the Bank occasioned by any change in the value of the currency of The Bahamas or any foreign currency.

2 0 1 5 F I N A N C I A L S T A T E M E N T S 69
THE CENTRAL BANK OF THE BAHAMAS
NOTES TO THE FINANCIAL STATEMENTSDECEMBER 31, 2015
18. Equity and Reserves (Continued)
2015 2014$ $
Net income 9,061,153 14,843,913Foreign exchange (4,247,034) (5,808,047)
Net income per the Act 4,814,119 9,035,866
Other comprehensive income 2,320,423 (2,566,727)
Total comprehensive income stated in accordance with the Act 7,134,542 6,469,139
Exchange equalisation account - Under the terms of Sections 32(2)(a) and 32(2)(b) of the Act, this account represents the net foreign exchange gain or loss arising from the revaluation of foreign currency monetary assets and liabilities of the Bank at the date of the statement of financial position.
Building fund - This account represents a reserve for construction of a new premises.
General reserve - Section 7(2) of the Act requires that, at the end of any year where the amount in the general reserve exceeds twice the authorised capital of the Bank or 15% of its demand liabilities, whichever is greater, the excess shall be paid to the Consolidated Fund, unless the Minister of Finance determines otherwise.
The balance of the general reserve at the year end amounted to $126,657,134 (2014: $119,522,592) equiva-lent to 12.11% (2014: 11.15%) of demand liabilities.
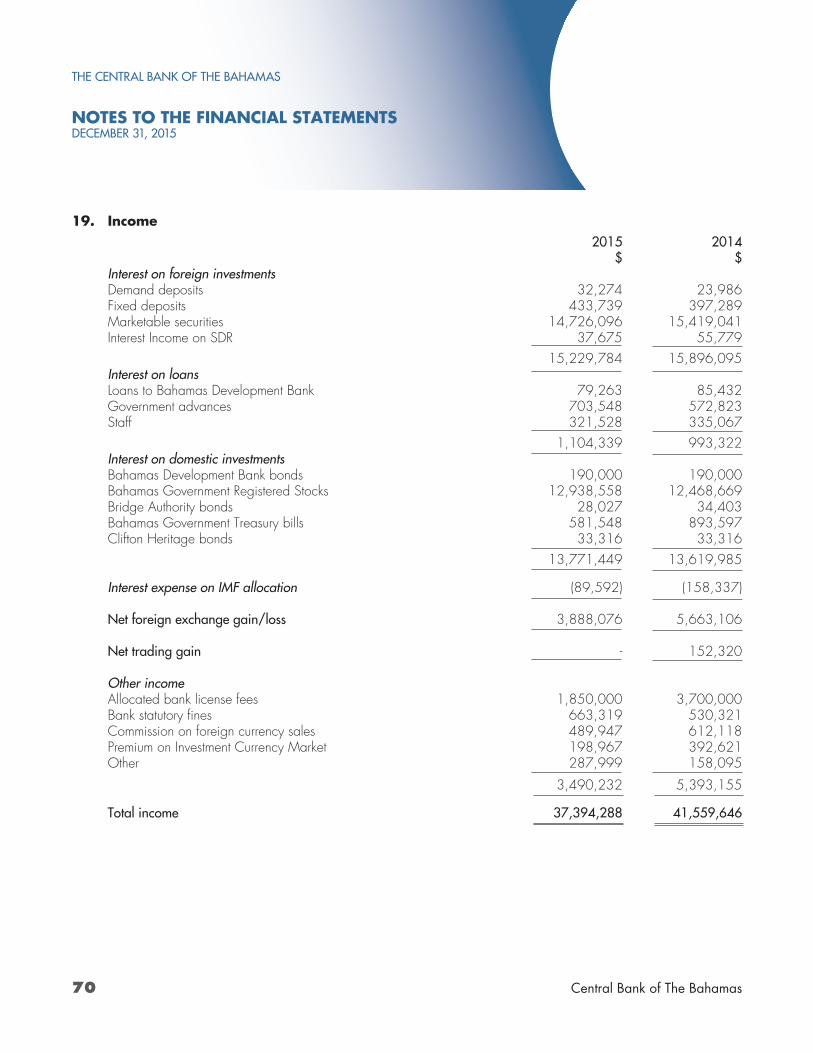
70 Central Bank of The Bahamas
THE CENTRAL BANK OF THE BAHAMAS
NOTES TO THE FINANCIAL STATEMENTSDECEMBER 31, 2015
19. Income2015 2014
$ $Interest on foreign investments Demand deposits 32,274 23,986Fixed deposits 433,739 397,289Marketable securities 14,726,096 15,419,041Interest Income on SDR 37,675 55,779
15,229,784 15,896,095Interest on loans Loans to Bahamas Development Bank 79,263 85,432Government advances 703,548 572,823Staff 321,528 335,067
1,104,339 993,322Interest on domestic investments Bahamas Development Bank bonds 190,000 190,000Bahamas Government Registered Stocks 12,938,558 12,468,669Bridge Authority bonds 28,027 34,403Bahamas Government Treasury bills 581,548 893,597Clifton Heritage bonds 33,316 33,316
13,771,449 13,619,985
Interest expense on IMF allocation (89,592) (158,337)
Net foreign exchange gain/loss 3,888,076 5,663,106
Net trading gain - 152,320
Other income Allocated bank license fees 1,850,000 3,700,000Bank statutory fines 663,319 530,321Commission on foreign currency sales 489,947 612,118Premium on Investment Currency Market 198,967 392,621Other 287,999 158,095
3,490,232 5,393,155
Total income 37,394,288 41,559,646

2 0 1 5 F I N A N C I A L S T A T E M E N T S 71
THE CENTRAL BANK OF THE BAHAMAS
NOTES TO THE FINANCIAL STATEMENTSDECEMBER 31, 2015
20. Expenses2015 2014
$ $Staff costs Salaries, wages and gratuity 13,985,923 13,778,772Defined benefit plan 1,582,721 1,449,555Group insurance plan 1,347,433 1,341,163Staff training 441,954 430,438National insurance 428,015 423,475Health insurance subsidy 248,167 208,888Responsibility allowance 215,591 190,625Former governors’ retirement benefit 213,008 117,614Defined contribution plan 148,460 51,789Other 249,431 276,669
18,860,703 18,268,988
General and administrative Currency 2,147,373 1,468,550Professional fees 1,299,680 1,050,444Utilities 976,106 1,148,844Repairs and maintenance 940,900 880,954Rent 499,927 534,290Insurance 253,749 263,607Cash shipment 243,959 233,095Subscription and membership fees 171,115 225,755Stationery and office supplies 103,265 74,848Directors’ remuneration 57,000 51,825Other 1,075,671 881,239
7,768,745 6,813,451
21. The Deposit Insurance Corporation
During 1999, in accordance with Section 5(1) of the Protection of Depositors Act,1999, the Bank has made an initial capital contribution of $500,000 in the Deposit Insurance Corporation (DIC). This represents 100% of the paid-up portion of the capital of DIC, which was established to manage the Deposit Insurance Fund set up to protect deposits placed with member institutions.
In the opinion of the Directors, the Bank is not exposed, or has rights, to variable returns from its involvement with the DIC and does not have the ability to affect its returns. Consequently, the Deposit Insurance Corporation is not treated as a subsidiary in these financial statements.
Considering the substance of this transaction, this contribution does not meet the recognition criteria as an investment and was subsequently derecognised.

72 Central Bank of The Bahamas
THE CENTRAL BANK OF THE BAHAMAS
NOTES TO THE FINANCIAL STATEMENTSDECEMBER 31, 2015
22. Commitments & Contingencies
(a) Contingencies
The Bank is party to claims in the normal course of business, which are at various stages of the judicial process. The Bank is defending all such claims and is of the opinion that the outcomes, which cannot presently be deter-mined, will not adversely affect its operations or financial position.
(b) Commitments
i) Leases
The Bank leases office space with lease terms of between three to five years. At year-end, the Bank was committed to the following payments:
2015 2014$ $
Not later than one year 527,616 182,671Later than one year but not later than five years - 16,500
527,616 199,171
ii) Printing of Currency
The Bank also commits to order currency from several minters and printers. At year-end, the Bank was com-mitted to the following payments for currency:
2015 2014$ $
Not later than one year 5,050,812 2,407,982Later than one year but not later than five years 3,459,736 506,686
8,510,548 2,914,668
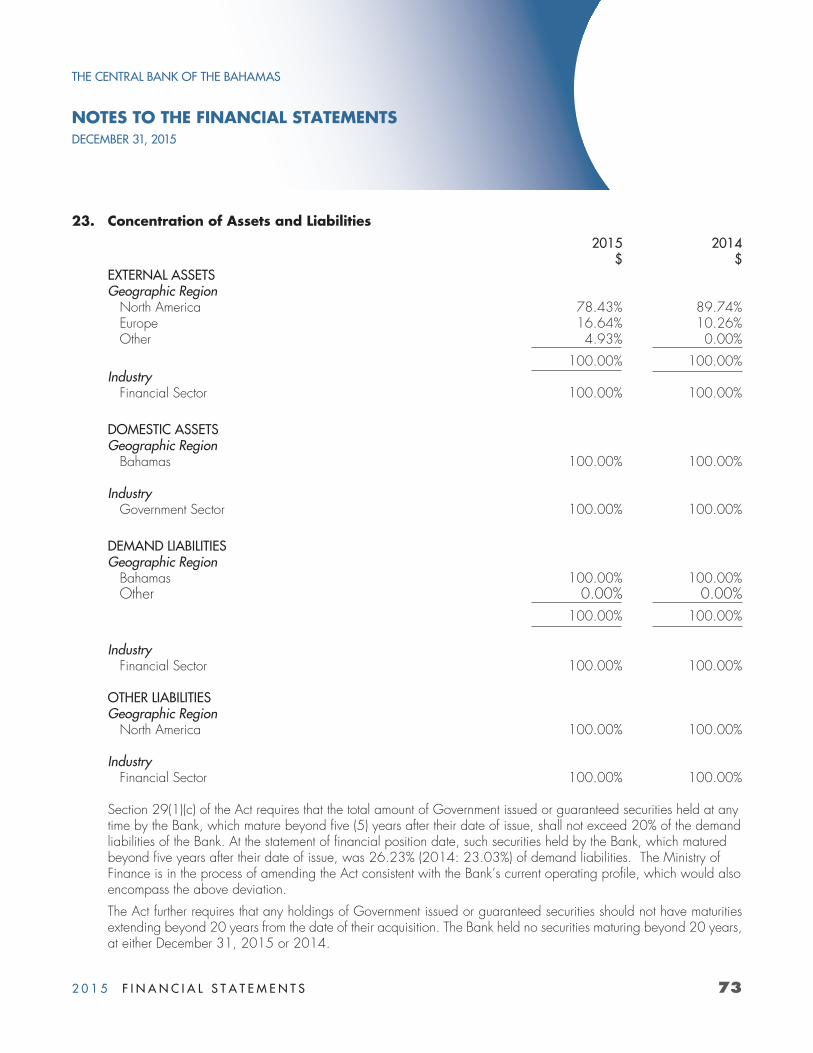
2 0 1 5 F I N A N C I A L S T A T E M E N T S 73
THE CENTRAL BANK OF THE BAHAMAS
NOTES TO THE FINANCIAL STATEMENTSDECEMBER 31, 2015
23. Concentration of Assets and Liabilities
2015 2014 $ $
EXTERNAL ASSETS Geographic Region
North America 78.43% 89.74% Europe 16.64% 10.26%Other 4.93% 0.00%
100.00% 100.00% Industry
Financial Sector 100.00% 100.00%
DOMESTIC ASSETS Geographic Region
Bahamas 100.00% 100.00%
Industry Government Sector 100.00% 100.00%
DEMAND LIABILITIES Geographic Region
Bahamas 100.00% 100.00% Other 0.00% 0.00%
100.00% 100.00%
Industry Financial Sector 100.00% 100.00%
OTHER LIABILITIES Geographic Region
North America 100.00% 100.00%
Industry Financial Sector 100.00% 100.00%
Section 29(1)(c) of the Act requires that the total amount of Government issued or guaranteed securities held at any time by the Bank, which mature beyond five (5) years after their date of issue, shall not exceed 20% of the demand liabilities of the Bank. At the statement of financial position date, such securities held by the Bank, which matured beyond five years after their date of issue, was 26.23% (2014: 23.03%) of demand liabilities. The Ministry of Finance is in the process of amending the Act consistent with the Bank’s current operating profile, which would also encompass the above deviation.
The Act further requires that any holdings of Government issued or guaranteed securities should not have maturities extending beyond 20 years from the date of their acquisition. The Bank held no securities maturing beyond 20 years, at either December 31, 2015 or 2014.

74 Central Bank of The Bahamas
THE CENTRAL BANK OF THE BAHAMAS
NOTES TO THE FINANCIAL STATEMENTSDECEMBER 31, 2015
24. Related Party Transactions
Related parties comprise (i) Government ministries and departments; (ii) Government corporations and agencies; (iii) entities controlled by the Government; (iv) entities in which the Government has a significant ownership interest; and (v) key management personnel. Transactions that the Bank has with such related entities are disclosed on the state-ment of financial position and accompanying notes. The amounts and terms of these transactions are discussed and agreed upon by the parties.
The Bank provides certain services to the Government of The Bahamas, in accordance with its mandate under Sec-tions 26 to 29 of the Act. These services include but are not limited to:
• Act as banker to the Government or any public corporation;
• Act as the agent of the Government in the management of the public debt• Make temporary advances to the Government;• Open accounts for, accept deposits from, and collect money for or on account of, the Government or any public
corporation; and• Buy, hold and sell securities issued or guaranteed by the Government
The Bank’s senior officials and directors are regarded to be its key management personnel.
The following balances and transactions relate to key management personnel:
(a) Compensation:
2015 2014$ $
Senior officials’ salaries and short-term benefits 1,648,248 1,616,564Directors’ remuneration 57,000 51,825Post-employment benefits 161,856 169,095
1,867,104 1,837,484
(b) Other assets include secured loans to employees totalling $10,222,628 (2014: $9,781,677), of which the following relates to key management personnel:

2 0 1 5 F I N A N C I A L S T A T E M E N T S 75
THE CENTRAL BANK OF THE BAHAMAS
NOTES TO THE FINANCIAL STATEMENTSDECEMBER 31, 2015
24. Related Party Transactions (Continued)2015 2014
$ $Beginning of the year 1,118,461 1,046,565Advances during the year 36,227 482,526Repayments during the year (139,500) (410,630)
End of the year 1,015,188 1,118,461
(c) Accrued post-employment pension and medical benefits:2015 2014
$ $Pension payments 591,234 685,613Gratuity 466,090 421,697
End of the year 1,057,324 1,107,310
25. Fiduciary Assets and Liabilities
Section 24 of the Act authorises the Bank to accept unclaimed customer deposits that are required to be transferred to it by a bank in The Bahamas in accordance with the Banks and Trust Companies Regulation Act, pay interest on money deposited and pay out money to any person entitled thereto. At December 31, 2015 the Bank held assets consisting of bank accounts in respect of the unclaimed customer deposits of $93,412,574 (2014: $86,023,241). These amounts are excluded from the statement of financial position.

76 Central Bank of The Bahamas
THE CENTRAL BANK OF THE BAHAMAS
NOTES TO THE FINANCIAL STATEMENTSDECEMBER 31, 2015
26. Fair Value of Financial Instruments
Categories of Financial Instruments
Loans & Fair Value Held-to Total Receivables Through Maturity Available- Carrying
(amortised cost) Profit or Loss (amortised cost) for-Sale Amount $ $ $ $ $
December 31, 2015 EXTERNAL ASSETS Cash and deposits with banks 206,593,351 - - - 206,593,351 Marketable securities issued or
guaranteed by foreign governments - - 521,657,183 - 521,657,183 International Monetary Fund:
Bahamas reserve tranche - 8,675,061 - - 8,675,061 Special drawing rights - holdings - 75,006,457 - - 75,006,457
DOMESTIC ASSETS Cash on hand 1,927,734 - - - 1,927,734Bahamas Development Bank bonds 4,103,587 - - - 4,103,587Advances to Bahamas Government 135,360,599 - - - 135,360,599Bahamas Government Registered Stock 261,122,528 - - - 261,122,528Loans to Bahamas Development Bank 3,723,110 - - - 3,723,110Bridge Authority Bonds 473,505 - - - 473,505Clifton Heritage Authority Bonds - - 638,434 - 638,434Bahamas Government Treasury Bills - - - 126,611,122 126,611,122Employee loans and other receivables 10,222,628 - - - 10,222,628
Total 623,527,042 83,681,518 522,295,617 126,611,122 1,356,115,299

2 0 1 5 F I N A N C I A L S T A T E M E N T S 77
THE CENTRAL BANK OF THE BAHAMAS
NOTES TO THE FINANCIAL STATEMENTSDECEMBER 31, 2015
26. Fair Value of Financial Instruments (Continued)
Categories of Financial Instruments (continued)
Fair Value Other Total Through Profit Financial Carrying
or Loss Liabilities Amount $ $ $
December 31, 2015 DEMAND LIABILITIES
Deposits by commercial banks - 591,087,668 591,087,668Deposits by Bahamas Government
and Bahamas Government agencies - 46,730,659 46,730,659Deposits by International agencies - 255,261 255,261 Accounts payable and other liabilities - 9,295,592 9,295,592Investment Currency Market payable - 6,660,600 6,660,600
OTHER LIABILITIESInternational Monetary Fund:
Special drawing rights allocation 172,417,722 - 172,417,722
Total 172,417,722 654,029,780 826,447,502

78 Central Bank of The Bahamas
THE CENTRAL BANK OF THE BAHAMAS
NOTES TO THE FINANCIAL STATEMENTSDECEMBER 31, 2015
26. Fair Value of Financial Instruments (Continued)
Categories of Financial Instruments (continued)
Loans & Fair Value Held-to Total Receivables Through Maturity Available- Carrying
(amortised cost) Profit or Loss (amortised cost) for-Sale Amount $ $ $ $ $
December 31, 2014 EXTERNAL ASSETS
Cash and deposits with banks 155,210,814 - - - 155,210,814Marketable securities issued or
guaranteed by foreign governments - - 544,913,338 - 544,913,338International Monetary Fund:
Bahamas reserve tranche - 9,069,925 - - 9,069,925Special drawing rights - holdings - 78,473,884 - - 78,473,884
DOMESTIC ASSETS Cash on hand 55,450 - - - 55,450Bahamas Development Bank bonds 4,055,697 - - - 4,055,697Advances to Bahamas Government 135,235,783 - - - 135,235,783Bahamas Government Registered Stock 316,537,255 - - - 316,537,255Loans to Bahamas Development Bank 4,207,035 - - - 4,207,035Bridge Authority Bonds 472,385 - - - 472,385Clifton Heritage Authority Bonds - - 638,434 - 638,434Bahamas Government Treasury Bills - - - 119,657,414 119,657,414Employee loans and other receivables 13,481,677 - - - 13,481,677
Total 629,256,096 87,543,809 545,551,772 119,657,414 1,382,009,091

2 0 1 5 F I N A N C I A L S T A T E M E N T S 79
THE CENTRAL BANK OF THE BAHAMAS
NOTES TO THE FINANCIAL STATEMENTSDECEMBER 31, 2015
26. Fair Value of Financial Instruments (Continued)
Categories of Financial Instruments (continued)
Fair Value Other TotalThrough Profit Financial Carrying
or Loss Liabilities Amount$ $ $
December 31, 2014 DEMAND LIABILITIESDeposits by commercial banks - 607,745,338 607,745,338Deposits by Bahamas Government
and Bahamas Government agencies - 74,421,172 74,421,172Deposits by International agencies - 255,443 255,443Accounts payable and other liabilities - 5,661,623 5,661,623Investment Currency Market payable - 5,914,733 5,914,733
OTHER LIABILITIES
International Monetary Fund: Special drawing rights allocation 180,265,829 - 180,265,829
Total 180,265,829 693,998,309 874,264,138

80 Central Bank of The Bahamas
THE CENTRAL BANK OF THE BAHAMAS
NOTES TO THE FINANCIAL STATEMENTSDECEMBER 31, 2015
27. Fair Value Measurements
Fair value of financial instruments
Below is a comparison of the carrying value and the fair value of the Bank’s financial instruments, other than those with carrying value that approximates its fair value.
2015 2014Carrying Value Fair Value Carrying Value Fair Value
$ $ $ $FINANCIAL INSTRUMENTS Marketable securities issued or
guaranteed by foreign governments 521,657,183 538,534,325 544,913,338 565,330,890Bahamas Government Registered Stocks 261,122,528 267,107,601 316,537,255 319,034,785Loans to Bahamas Development Bank 3,723,110 3,154,075 4,207,035 3,376,349Bridge Authority bonds 473,505 500,705 472,385 504,379Clifton Heritage Authority bonds 638,434 665,910 638,434 668,059
TOTAL 787,614,760 809,962,616 866,768,447 888,914,462
i) It is the Directors’ opinion that the carrying value of other assets and liabilities approximate their fair value due to the short-term maturities of these investments.
ii) Investments in Bahamas Development Bank bonds yield market-based interest rates resulting in its carrying value approximating its fair value.
iii) Advances to Bahamas Government and deposits by commercial banks, international agencies, Bahamas Gov- ernment and government agencies are considered due on demand. Thus, in the absence of any impairment on the financial assets, the carrying amount approximates the fair value.
Fair value hierarchy and measurementsThe Bank ranks its investment securities based on the hierarchy of valuation techniques required by IFRS, which is determined based on whether the inputs to those valuation techniques are observable or unobservable. Observable inputs reflect market data obtained from independent sources; unobservable inputs reflect the Bank’s market assump-tions. These two types of inputs lead to the following fair value hierarchy:
Level 1 – Quoted prices (unadjusted) in active markets for identical assets or liabilities.
Level 2 – Inputs other than quoted prices included within Level 1 that are observable for the asset or liability, either directly (that is, as prices) or indirectly (that is, derived from prices).
Level 3 – Inputs for the asset or liability that are not based on observable market data (unobservable inputs).

2 0 1 5 F I N A N C I A L S T A T E M E N T S 81
THE CENTRAL BANK OF THE BAHAMAS
NOTES TO THE FINANCIAL STATEMENTSDECEMBER 31, 2015
27. Fair Value Measurements (Continued)
Fair value hierarchy and measurements (continued)
This hierarchy requires the use of observable market data when available. The Bank considers relevant and observa-ble market prices in its valuations where possible.
The level in the fair value hierarchy within which the fair value measurement is categorised in its entirety is determined on the basis of the lowest level input that is significant to the fair value measurement in its entirety. For this purpose, the significance of an input is assessed against the fair value measurement in its entirety. If a fair value measurement uses observable inputs that require significant adjustment based on unobservable inputs, that measurement is a Level 3 measurement. Assessing the significance of a particular input to the fair value measurement in its entirety requires judgment, considering factors specific to the asset.
The determination of what constitutes ‘observable’ requires significant judgment by the Bank. The Bank considers ob-servable data to be that market data that is readily available, regularly distributed or updated, reliable and verifiable, not proprietary, and provided by independent sources that are actively involved in the relevant market.
The fair value of financial instruments traded in active markets is based on quoted market prices at the balance sheet date. A market is regarded as active if quoted prices are readily and regularly available from the exchange, dealer, broker, industry group, pricing service or regulatory agency, and those prices represent actual and regularly occur-ring market transactions on an arm’s length basis. These instruments are included in Level 1.
Financial instruments that trade in markets that are not considered to be active but are valued based on quoted market prices, dealer quotations or alternative pricing sources supported by observable inputs are classified within Level 2. These include government debt securities and other securities with observable inputs.
Financial instruments classified within Level 3 have significant unobservable inputs, as they trade infrequently. Level 3 instruments include unlisted securities that have significant unobservable components, including equity securities.

82 Central Bank of The Bahamas
THE CENTRAL BANK OF THE BAHAMAS
NOTES TO THE FINANCIAL STATEMENTSDECEMBER 31, 2015
27. Fair Value Measurements (Continued)
Fair value hierarchy and measurements (continued)
The following table categorises into three levels the inputs measure fair value of financial instruments:
Financial assets and liabilities that are measured at fair value on a recurring basis
Fair value measurements as at December 31, 2015 Level 1 Level 2 Level 3 Total
$ $ $ $
FINANCIAL ASSETS
Financial assets at fair value through profit or loss
International Monetary Fund: Bahamas reserve tranche 8,675,061 - - 8,675,061Special Drawing rights - holdings 75,006,457 - - 75,006,457
Available-for-sale financial assets Bahamas Government Treasury bills - 126,611,122 - 126,611,122
FINANCIAL LIABILITIES
Financial liabilities at fair value through profit or loss
International Monetary Fund:Special drawing rights allocation 172,417,722 - - 172,417,722

2 0 1 5 F I N A N C I A L S T A T E M E N T S 83
THE CENTRAL BANK OF THE BAHAMAS
NOTES TO THE FINANCIAL STATEMENTSDECEMBER 31, 2015
27. Fair Value Measurements (Continued)
Fair value hierarchy and measurements (continued)
Financial assets and liabilities that are measured at fair value on a recurring basis (continued)
Fair value measurements as at December 31, 2014
Level 1 Level 2 Level 3 Total$ $ $ $
FINANCIAL ASSETS Financial assets at fair value
through profit or loss
International Monetary Fund: Bahamas Reserve Tranche 9,069,925 - - 9,069,925Special Drawing rights - holdings 78,473,884 - - 78,473,884
Available-for-sale financial assets Bahamas Government Treasury bills - 119,657,414 - 119,657,414
FINANCIAL LIABILITIES
Financial liabilities at fair valuethrough profit or loss
International Monetary Fund: Special drawing rights allocation 180,265,829 - - 180,265,829

84 Central Bank of The Bahamas
THE CENTRAL BANK OF THE BAHAMAS
NOTES TO THE FINANCIAL STATEMENTSDECEMBER 31, 2015
27. Fair Value Measurements (Continued)
Fair value hierarchy and measurements (continued)
Financial assets and liabilities that are measured at fair value on a recurring basis (continued)
Level 3
The Bank does not have a level three classification at December 31, 2015 and 2014.
There were no transfers between levels in the year.
Financial assets and liabilities that are not measured at fair value on a recurring basis.Fair value measurements as at December 31, 2015
Level 1 Level 2 Level 3 Total$ $ $ $
FINANCIAL ASSETS Cash and deposits with banks 208,521,085 - - 208,521,085
Loans and receivables Bahamas Development Bank bonds - 4,103,587 - 4,103,587
Advances to Bahamas Government - 135,360,599 - 135,360,599
Bahamas Government Registered Stocks - 267,107,601 - 267,107,601
Loans to Bahamas Development Bank - 3,154,075 - 3,154,075
Bridge Authority bonds - 500,705 - 500,705
Employee loans and other receivables - 10,222,628 - 10,222,628
Held-to-maturity investmentsMarketable securities issued or
guaranteed by foreign governments 538,534,325 - - 538,534,325Clifton Heritage Authority bonds - 665,910 - 665,910

2 0 1 5 F I N A N C I A L S T A T E M E N T S 85
THE CENTRAL BANK OF THE BAHAMAS
NOTES TO THE FINANCIAL STATEMENTSDECEMBER 31, 2015
27. Fair Value Measurements (Continued)
Fair value hierarchy and measurements (continued)
Financial assets and liabilities that are not measured at fair value on a recurring basis (continued)
Fair value measurements as at December 31, 2015
Level 1 Level 2 Level 3 Total$ $ $ $
FINANCIAL LIABILITIES Financial liabilities at fair value
through profit or loss
Other financial liabilities
Deposits by commercial banks - 591,087,668 - 591,087,668Deposits by Bahamas Government
and Bahamas Government agencies - 46,730,659 - 46,730,659Deposits by international agencies - 255,261 - 255,261Accounts payable and other liabilities - 9,295,592 - 9,295,592Investment Currency Market payable - 6,660,600 - 6,660,600

86 Central Bank of The Bahamas
THE CENTRAL BANK OF THE BAHAMAS
NOTES TO THE FINANCIAL STATEMENTSDECEMBER 31, 2015
27. Fair Value Measurements (Continued)
Fair value hierarchy and measurements (continued)
Financial assets and liabilities that are not measured at fair value on a recurring basis (continued) Fair value measurements as at December 31, 2014
Level 1 Level 2 Level 3 Total$ $ $ $
FINANCIAL ASSETSCash and deposits with banks 155,210,814 - - 155,210,814
Loans and receivables Bahamas Development Bank bonds - 4,055,697 - 4,055,697Advances to Bahamas Government - 135,235,783 - 135,235,783Bahamas Government Registered Stocks - 319,034,785 - 319,034,785Loans to Bahamas Development Bank - 3,376,349 - 3,376,349Bridge Authority bonds - 504,379 - 504,379Employee loans and other receivables - 13,481,677 - 13,481,677
Held-to-maturity investments Marketable securities issued or guaranteed
by foreign governments 565,330,890 - - 565,330,890Clifton Heritage Authority bonds - 688,059 - 688,059
FINANCIAL LIABILITIES
Financial liabilities at fair value through profit or loss
Other financial liabilities
Deposits by commercial banks - 607,745,338 - 607,745,338Deposits by Bahamas Government
and Bahamas Government agencies - 72,421,172 - 72,421,172Deposits by international agencies - 255,443 255,443Accounts payable and other liabilities - 5,661,623 - 5,661,623Investment Currency Market payable - 5,914,733 - 5,914,733
The fair value of the financial assets and liabilities disclosed under level 2 and 3 above have been determined consid-ering, amongst other factors, discounted cash flows, with the most significant input being the Bahamian prime rate as the discount rate. The Bahamian dollar Prime rate has not experienced any changes since the year ended December 31, 2011.

2 0 1 5 F I N A N C I A L S T A T E M E N T S 87
THE CENTRAL BANK OF THE BAHAMAS
NOTES TO THE FINANCIAL STATEMENTSDECEMBER 31, 2015
28. Risk Management
The Bank’s activities expose it to a variety of financial risks and those activities involve the analysis, evaluation, accep-tance and management of some degree of risk or combination of risks. Taking risk is core to the financial business, and the operational risks are an inevitable consequence of being in business. The Bank’s aim is therefore to achieve an appropriate balance between risk and return and minimise potential adverse effects on the Bank’s financial per-formance.
The most important types of risks are credit risk, liquidity risk, market risk and operational risk. Market risk includes currency risk and interest rate risk.
The Bank’s risk management policies are designed to identify and analyse these risks, to set appropriate risk limits and controls, and to monitor the risks and adherence to limits by means of reliable and up-to-date information systems. The Bank regularly reviews its risk management policies and systems to reflect changes in markets, products and emerging best practices.
Risk management is carried out by the investment and monetary policy committees under policies approved by the Board of Directors. The committees identify, evaluate and hedge financial risks in close co-operation with the Bank’s operating units. The Board provides written principles for overall risk management, as well as written policies cover-ing specific areas, such as foreign exchange risk, interest rate risk, credit risk and financial instruments.
Credit riskThe Bank takes on exposure to credit risk, which is the risk that a counterparty will cause a financial loss for the Bank by failing to discharge an obligation. Significant changes in the economy, or in the health of a particular segment that represents a concentration in the Bank’s portfolio, could result in losses that are different from those provided for at the statement of financial position date. Credit exposures arise principally in loans and advances, debt securities and other bills in the Bank’s asset portfolio. The Investment Committee monitors credit risk management and control, and regular reports are provided to the Board of Directors. The Directors do not consider that the Bank is exposed to any significant credit risk because its financial assets consist primarily of cash and securities issued or guaranteed by the United States Governments or The Bahamas Government. Accordingly the Bank has not established a provision for its financial assets. Maximum credit exposure at the year end approximates the carrying value of all assets.
Exposure to credit risk
The credit quality of financial assets that are neither past due nor impaired can be assessed by reference to external credit ratings or to historical information about counterparty default rates.

88 Central Bank of The Bahamas
THE CENTRAL BANK OF THE BAHAMAS
NOTES TO THE FINANCIAL STATEMENTSDECEMBER 31, 2015
28. Risk Management (Continued)
Credit risk (continued)Exposure to credit risk (continued)
2015 2014$ $
Cash on hand 3,805,507 1,113,847Cash at bank and deposits with maturities three months or less
Aaa 63,879,348 58,248,882Aa1 35,000,000 15,000,000A1 50,000,000 35,000,000A2 55,093,176 45,779,885Baaa1 743,054 123,650
204,715,578 154,152,417
Bahamas Development Bank Bonds Baa2 4,103,587 4,055,697
Advances to Bahamas Government Baa2 135,360,599 135,235,783
Bahamas Government Registered Stock Baa2 261,122,528 316,537,255
Loans to Bahamas Development Bank Baa2 3,723,110 4,207,035
Bridge Authority Bonds Baa2 473,505 472,385

2 0 1 5 F I N A N C I A L S T A T E M E N T S 89
THE CENTRAL BANK OF THE BAHAMAS
NOTES TO THE FINANCIAL STATEMENTSDECEMBER 31, 2015
28. Risk Management (Continued)
Credit risk (continued)
Exposure to credit risk (continued)
2015 2014$ $
Receivables and Other Assets 11,274,292 16,700,560
Available-for-sale Securities Baa2 126,611,122 119,657,414
Held-to-maturity Investments Aaa 521,657,183 544,913,338Baa2 638,434 638,434
522,295,617 545,551,772
International Monetary Fund Bahamas Reserve Tranche 8,675,061 9,069,925 Special drawing rights - holdings 75,006,457 78,473,884
1,357,166,963 1,385,227,974
Market risk
The Bank takes on exposure to market risk, which is the risk that the fair value or future cash flows of a financial instrument will fluctuate because of changes in market prices. Market risks arise from open positions in interest rate, currency and equity products, all of which are exposed to general and specific market movements and changes in the level of volatility of market rates or prices such as interest rates, credit spreads, foreign exchange rates and equity prices. The Bank’s exposure to market risk is from its financial investment portfolios.
The market risks arising from the Bank’s activities are monitored by the Investment Committee and the Monetary Policy Committee. Regular reports are submitted to the Board of Directors and operating units.
Currency riskApart from the Bank’s assets and liabilities with the IMF, which are denominated in SDRs, its exposure to foreign currency risk is limited. The only other significant foreign currency is US dollar, on which there is no exposure because the Bahamian dollar and the US dollar are pegged 1:1. The Bank manages any other foreign currency exposure using internal hedging techniques, by matching assets and liabilities wherever possible.
The following table presents the carrying amounts of the Bank’s financial assets and liabilities by currency.

90 Central Bank of The Bahamas
THE CENTRAL BANK OF THE BAHAMAS
NOTES TO THE FINANCIAL STATEMENTSDECEMBER 31, 2015
28. Risk Management (Continued)
Currency risk (continued)
*(BSD equivalent)
BSD USD* GBP* EUR* Other* SDR*
As of December 31, 2015 Financial Assets
Cash and deposits with banks 1,927,734 206,588,485 3,498 727 641 - Marketable securities - 521,657,183 - - - -International Monetary Fund:
Bahamas reserve tranche - - - - - 8,675,061 Special drawing rights - - - - - - holdings - - - - 75,006,457
Domestic assets 552,925,475 - - - - -
Total financial assets 554,853,209 728,245,668 3,498 727 641 83,681,518
Financial Liabilities Notes in circulation 365,921,592 - - - - -Coins in circulation 23,259,871 - - - - -Deposits by
commercial banks 591,087,668 - - - - -Deposits by Bahamas
Government and Bahamas Government agencies 46,730,659 - - - - -
Deposits by international agencies - 255,261 - - - -
Accounts payable and other liabilities 9,295,592 - - - - -
Investment Currency Market payable 6,660,600 - - - - -
Health insurance subsidy benefit 2,850,014 - - - - -
International Monetary Fund:Special drawing rightsallocation - - - - - 172,417,722
Total financial liabilities 1,045,805,996 255,261 - - - 172,417,722

2 0 1 5 F I N A N C I A L S T A T E M E N T S 91
THE CENTRAL BANK OF THE BAHAMAS
NOTES TO THE FINANCIAL STATEMENTSDECEMBER 31, 2015
28. Risk Management (Continued)
Currency risk (continued)
*(BSD equivalent)
BSD USD* GBP* EUR* SDR*As of December 31, 2014 Financial Assets Cash and deposits with
banks 55,450 155,164,447 2,291 44,076 - Marketable securities - 544,913,338 - - -International Monetary Fund:
Bahamas reserve tranche - - - - 9,069,925 Special drawing rights - holdings - - - - 78,473,884
Domestic assets 602,939,484 - - - -
Total financial assets 602,994,934 700,077,785 2,291 44,076 87,543,809
Financial Liabilities Notes in circulation 354,148,708 - - - -Coins in circulation 21,301,243 - - - -Deposits by commercial banks 607,745,338 - - - -Deposits by Bahamas
Government and Bahamas Government agencies 74,421,172 - - - -
Deposits by international agencies - 255,443 - - -
Accounts payable and other liabilities 5,661,623 - - - -
Investment Currency Market payable 5,914,733 - - - -
Health insurance subsidy benefit 2,841,282 - - - -International Monetary Fund:
Special drawing rightsallocation - - - - 180,265,829
Total financial liabilities 1,072,034,099 255,443 - - 180,265,829

92 Central Bank of The Bahamas
THE CENTRAL BANK OF THE BAHAMAS
NOTES TO THE FINANCIAL STATEMENTSDECEMBER 31, 2015
28. Risk Management (Continued)
Sensitivity of B$ compared to foreign currencies reflected in these financial statements is as follows:
Average Rate Year-end Spot Rate2015 2014 2015 2014
US$1 1.0000 1.0000 1.0000 1.0000GPB 1 1.4752 1.6444 1.5285 1.5584EUR 1 1.0869 1.3214 1.1097 1.2139SDR 1 1.3989 1.5195 1.3857 1.4488
Special Drawing Rights (SDRs), the IMF’s unit of account, is essentially a specified basket of four (4) major internation-al currencies (i.e., the U.S. Dollar, Euro, Japanese Yen, and Pound Sterling). The weightage of each currency is as follows:Currency WeightUS$ 41.9%EURO 37.4%Japanese Yen 9.4%GBP 11.3%
100%
At December 31, 2015, if BSD had weakened/strengthened by 10% against SDR with all other variables held constant, comprehensive income for the year would have been BSD 5,840,000 (2014: BSD 6,400,000) higher/lower, mainly as a result of foreign exchange gains/losses on translation of SDR-denominated financial assets and liabilities.
Interest rate risk
Cash flow interest rate risk is the risk that the future cash flows of a financial instrument will fluctuate because of chang-es in market interest rates. Fair value interest rate risk is the risk that the value of a financial instrument will fluctuate because of changes in market interest rates. The Bank takes on exposure to the effects of fluctuations in the prevailing levels of market interest rates on both its fair value and cash flow risks. Interest margins may increase as a result of such changes but may decrease or create losses in the event that unexpected movements arise. The level of mismatch of interest rate repricing that may be undertaken by the Bank is monitored frequently by the Investment Committee and the Monetary Policy Committee.
Certain of the Bank’s financial assets and liabilities are exposed to interest rate risk. Marketable securities carry an average yield of 2.55% (2014: 2.95%); however, if these securities had a reduced average yield of 2.33% (2014: 2.73%), derived from their varying yields at the lower end of the spectrum, income for the year and equity at year end would have been reduced by $1,150,600 (2014: $1,149,895). Had the yield been tilted towards the higher end of the spectrum, to 2.77% (2014: 3.17%), income for the year and equity at year end would have increased by $1,150,600 (2014: $1,149,895).

2 0 1 5 F I N A N C I A L S T A T E M E N T S 93
THE CENTRAL BANK OF THE BAHAMAS
NOTES TO THE FINANCIAL STATEMENTSDECEMBER 31, 2015
28. Risk Management (Continued)
Interest rate risk (continued)
In respect of all variable interest bearing instruments, if interest rates had been 50 basis points higher, with all other variables remaining constant, the increase in equity and net operating results for the year would amount to approx-imately $1,106,979 (2014: $1,029,418), arising from variable rate instruments. If interest rates had decreased by 50 basis points, the decrease in equity and net operating results for the year would amount to approximately $1,106,979 (2014: $1,029,418).
December 31, 2015 December 31, 2014$ $
Fixed Rate Instruments Financial assets 998,048,953 977,425,212Financial liabilities - -
Variable Rate InstrumentsFinancial assets 345,915,985 386,149,340 Financial liabilities 172,417,722 180,265,829
Liquidity risk
Liquidity risk is the risk that the Bank is unable to meet its payment obligations associated with its financial liabilities when they fall due, and to replace funds when they are withdrawn. The consequence may be the failure to meet obligations to repay depositors and fulfil commitments to lend.
The Bank manages its foreign liquidity risks through appropriate structuring of its foreign investment portfolios to en-sure that the maturity profiles of foreign assets sufficiently match those of foreign commitments. This is monitored and managed on a regular basis. In addition, the Bank’s foreign investment portfolio comprises mainly short-term, highly liquid investment instruments.The Bank’s liquidity risk management process, as carried out within the Bank, includes:• Day-to-day funding, managed by monitoring future cash flows to ensure that requirements can be met, inclusive
of replenishment of funds as they mature. The Bank maintains an active presence in global money markets to enable this to happen;
• Maintaining a portfolio of highly marketable assets that can easily be liquidated as protection against any un-foreseen interruption to cash flow;
• Monitoring statement of financial position liquidity ratios against internal and statutory requirements; and• Managing the concentration and profile of debt and financial instrument maturities.
The table below analyses financial assets and liabilities into relevant maturity groupings, based on the remaining period to the contractual maturity date as of the balance sheet date and represents undiscounted cash flows.

94 Central Bank of The Bahamas
THE CENTRAL BANK OF THE BAHAMAS
NOTES TO THE FINANCIAL STATEMENTSDECEMBER 31, 2015
28. Risk Management (Continued)
Liquidity risk (continued)Up to 1 to 3 3 months 1 to Over
1 month months to 1 year 5 years 5 years Total$ $ $ $ $ $
Period of maturity
As of December 31, 2015 Financial Assets
Cash and deposits with banks 208,521,085 - - - - 208,521,085
Marketable securities issued or guaranteed by foreign governments - 36,561,250 75,068,780 277,410,625 200,132,500 589,173,155
International Monetary Fund: Bahamas reserve tranche 8,675,061 - - - - 8,675,061Special drawing rights - holdings 75,006,457 - - - - 75,006,457
Bahamas Development Bank bonds - - - - 4,103,587 4,103,587
Advances to BahamasGovernment 135,360,599 - - - - 135,360,599
Bahamas Government Registered stock - - 25,450,687 103,291,872 261,372,938 390,115,497
Bahamas Government Treasury Bills 209,000 111,324,000 15,348,900 - - 126,881,900
Loans to Bahamas Development Bank - - - 450,000 3,250,000 3,700,000
Bridge Authority bonds - - - 450,616 22,889 473,505Clifton Heritage Authority
bonds - - - - 638,434 638,434Currency inventory 7,173,950 - - - - 7,173,950Retirement benefit asset - - - - 3,519,122 3,519,122Employee and other
receivables 10,222,628 - - - - 10,222,628
Total financial assets 445,168,780 147,885,250 115,868,367 381,603,113 473,039,470 1,563, 564,980

2 0 1 5 F I N A N C I A L S T A T E M E N T S 95
THE CENTRAL BANK OF THE BAHAMAS
NOTES TO THE FINANCIAL STATEMENTSDECEMBER 31, 2015
28. Risk Management (Continued)
Liquidity risk (continued)Up to 1 to 3 3 months 1 to Over
1 month months to 1 year 5 years 5 years Total$ $ $ $ $ $
Period of maturity
As of December 31, 2015 Financial Liabilities
Notes in circulation 365,921,592 - - - - 365,921,592Coins in circulation 23,259,871 - - - - 23,259,871Deposits by commercial
banks 591,087,668 - - -- 591,087,668Deposits by Bahamas
Government and Bahamas Government agencies 46,730,659 - - - - 46,730,659
Deposits by International agencies 255,261 - - - - 255,261
Accounts payable and other liabilities 9,295,592 - - - - 9,295,592
Investment Currency MarketPayable 6,660,600 - - - - 6,660,600
Health insurance subsidy benefit - - - - 2,850,014 2,850,014
International Monetary Fund:Special drawing rightsallocation 172,417,722 - - - - 172,417,722
Total financial liabilities 1,215,628,965 - - - 2,850,014 1,218,478,979
Net liquidity gap,
December 31, 2015 (770,460,185) 147,885,250 115,868,367 381,603,113 470,189,456 345,086,001
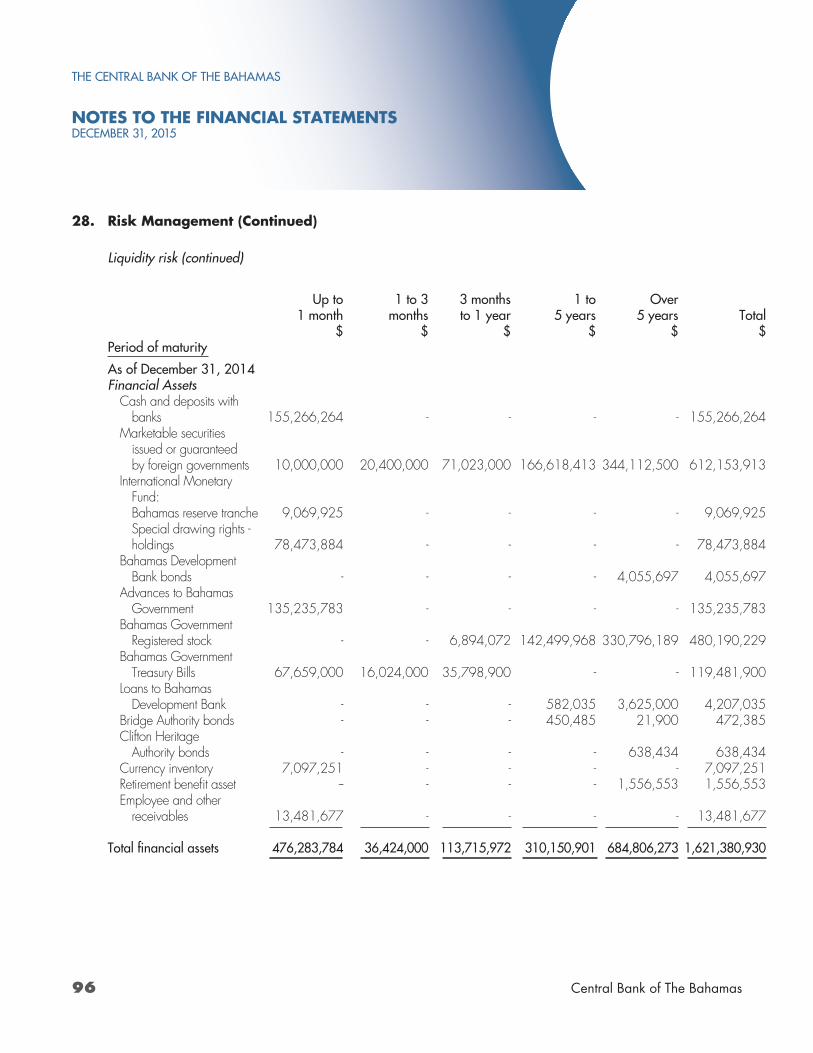
96 Central Bank of The Bahamas
THE CENTRAL BANK OF THE BAHAMAS
NOTES TO THE FINANCIAL STATEMENTSDECEMBER 31, 2015
28. Risk Management (Continued)
Liquidity risk (continued)
Up to 1 to 3 3 months 1 to Over1 month months to 1 year 5 years 5 years Total
$ $ $ $ $ $Period of maturity
As of December 31, 2014 Financial Assets
Cash and deposits with banks 155,266,264 - - - - 155,266,264
Marketable securities issued or guaranteed by foreign governments 10,000,000 20,400,000 71,023,000 166,618,413 344,112,500 612,153,913
International Monetary Fund: Bahamas reserve tranche 9,069,925 - - - - 9,069,925Special drawing rights -holdings 78,473,884 - - - - 78,473,884
Bahamas Development Bank bonds - - - - 4,055,697 4,055,697
Advances to Bahamas Government 135,235,783 - - - - 135,235,783
Bahamas Government Registered stock - - 6,894,072 142,499,968 330,796,189 480,190,229
Bahamas Government Treasury Bills 67,659,000 16,024,000 35,798,900 - - 119,481,900
Loans to Bahamas Development Bank - - - 582,035 3,625,000 4,207,035
Bridge Authority bonds - - - 450,485 21,900 472,385Clifton Heritage
Authority bonds - - - - 638,434 638,434Currency inventory 7,097,251 - - - - 7,097,251Retirement benefit asset -- - - - 1,556,553 1,556,553Employee and other
receivables 13,481,677 - - - - 13,481,677
Total financial assets 476,283,784 36,424,000 113,715,972 310,150,901 684,806,273 1,621,380,930

2 0 1 5 F I N A N C I A L S T A T E M E N T S 97
THE CENTRAL BANK OF THE BAHAMAS
NOTES TO THE FINANCIAL STATEMENTSDECEMBER 31, 2015
28. Risk Management (Continued)
Liquidity risk (continued)
Up to 1 to 3 3 months 1 to Over1 month months to 1 year 5 years 5 years Total
$ $ $ $ $ $Period of maturity
As of December 31, 2014 Financial Liabilities
Notes in circulation 354,148,708 - - - - 354,148,708Coins in circulation 21,301,243 - - - - 21,301,243Deposits by commercial
banks 607,745,338 - - - - 607,745,338Deposits by Bahamas
Government and Bahamas Government agencies 74,421,172 - - - - 74,421,172
Deposits by International agencies 255,443 - - - - 255,443
Accounts payable and other liabilities 5,661,623 - - - - 5,661,623
Investment Currency Market payable 5,914,733 - - - - 5,914,733
Retirement benefit liability - - - - - -Health insurance subsidy
benefit - - - - 2,841,282 2,841,282International Monetary Fund:
Special drawing rightsallocation 180,265,829 - - - - 180,265,829
Total financial liabilities 1,249,714,089 - - - 2,841,282 1,252,555,371
Net liquidity gap,
December 31, 2014 (773,430,305) 36,424,000 113,715,972 310,150,901 681,964,991 368,825,559
Operational risk
Operational risk is the risk of loss arising from systems failure, human error, fraud or external events. When controls fail to perform, operational risks can cause damage to reputation, have legal or regulatory implications, or lead to finan-cial loss. The Bank cannot expect to eliminate all operational risks, but it endeavours to manage these risks through a control framework and by monitoring and responding to potential risks. Controls include effective segregation of duties, access, authorisation and reconciliation procedures, staff education and assessment processes, such as the use of internal audit.

98 Central Bank of The Bahamas
THE CENTRAL BANK OF THE BAHAMAS
NOTES TO THE FINANCIAL STATEMENTSDECEMBER 31, 2015
29. Retirement Benefit Plans
Defined Contribution Plan2015 2014
$ $Amount recognised as an expense (Note 20) 148,460 51,789
Defined Benefit Plan
The movements in the contributory defined benefit obligation over the year are as follows:
2015 2014$ $
Present value of obligation at start of year 51,968,296 47,597,873Interest cost 2,536,623 2,316,473Current service cost 2,177,962 2,158,615Benefits paid (2,471,657) (2,536,832)Actuarial (gain)/loss on obligation due to experience (1,216,536) 763,000Actuarial (gain) on obligation due to demographic assumption changes (894,299) --Actuarial loss on obligation due to financial assumption changes - 1,669,166
Present value of obligation at end of year 52,100,389 51,968,295
Fair value of plan assets at start of year 53,524,848 51,521,975Interest income 2,659,962 2,558,814Contributions paid – both employees’ and employer’s 1,826,322 1,851,836Benefits paid (2,471,657) (2,536,832)Administrative costs (5,900) (6,400)Return on plan assets, excluding interest income 85,936 135,455
Fair value of plan assets at end of year 55,619,511 53,524,848
The amount recognised as an asset in the statement of financial position in respect of the Bank’s contributory defined retirement benefit plan is as follows:
2015 2014$ $
Present value of funded obligations 52,100,389 51,968,295Fair value plan assets (55,619,511) (53,524,848)
(3,519,122) (1,556,553)

2 0 1 5 F I N A N C I A L S T A T E M E N T S 99
THE CENTRAL BANK OF THE BAHAMAS
NOTES TO THE FINANCIAL STATEMENTSDECEMBER 31, 2015
29. Retirement Benefit Plans (Continued)
Summary of plan investments, in accordance with IAS 19 is as follows:2015 2014
$ $Cash 440,761 16,850Interest receivable 636,040 604,348Bahamas Government Registered Stocks 53,773,900 52,284,900Other bonds 380,100 330,100 Equity securities 400,000 300,000 Accounts payable (11,290) (11,350)
Total 55,619,511 53,524,848
The expense recognised in the statement of comprehensive income in respect of the Bank’s contributory defined re-tirement benefit plan is as follows:
2015 2014$ $
Current service cost 1,722,899 1,685,496Administrative cost 5,900 6,400Net interest expense/(income) (123,338) (242,341)Past service cost – vested benefits - -
1,605,461 1,449,555
Remeasurements recognised in OCI (2,196,771) 2,296,711
Represented by:Actuarial (gain)/loss for year – obligation (2,110,835) 2,432,166Actuarial (gain)/loss for year – plan assets (85,936) (135,455)
Actuarial (gain)/loss recognised (2,196,771) 2,296,711
Movements in the net assets recorded in the statement of financial position are as follows:2015 2014
$ $Net assets at beginning of year (1,556,553) (3,924,102)Net expense recognised in net income 1,605,461 1,449,555Employer contributions (1,371,259) (1,378,717) Remeasurements recognised in OCI (2,196,771) 2,296,711
(3,519,122) (1,556,553)

100 Central Bank of The Bahamas
THE CENTRAL BANK OF THE BAHAMAS
NOTES TO THE FINANCIAL STATEMENTSDECEMBER 31, 2015
29. Retirement Benefit Plans (Continued)
The Bank intends to contribute approximately 14.4% of gross payroll to the plan during 2016 (2015: actual 14.4%).
Principal actuarial assumptions used at the statement of financial position date are as follows:
2015 2014$ $
Discount rate 5.00% 5.00%Expected rate of salary increase at age 18 4.00% 4.00% Expected rate of salary increase at age 59 4.00% 4.00% Cost of living adjustment for active employees 1.25% 1.25%
The actual return on plan assets during the year was $2,745,898 (2014: $2,694,269).
Sensitivity and other results
The benefit obligation as at year-end is distributed as follows:2015 2014
$ $Pensioners 13,437,255 12,845,577Vesting actives 36,161,657 36,871,007Deferred actives 27,770 - Unvested actives 2,473,707 2,251,711
52,100,389 51,968,295
The pensioner liability of $13,437,255 (2014: $12,845,577), consists of $2,611,596 (2014: $1,246,584) relating to assumed cost of living adjustments.
The liability for actives of $38,635,364 (2014: $39,122,718), consists of $1,298,634 (2014: $1,342,689) relating to assumed cost of living adjustments and $7,748,658 (2014: $8,533,991) relating to assumed future salary increases.
The following table illustrates the changes or sensitivity of the benefit obligation as at December 31, 2015 for 1% changes in discount rate and salary increases.
2015 20141% Increase 1% Decrease 1% Increase 1% Decrease
$ $ $ $Discount (7,496,237) 9,546,726 (7,670,397) 9,817,303 Future salary increases 2,507,891 (2,250,153) 2,825,241 (2,510,747)
If all members lived one year longer than projected, the liability at year-end would be $53,192,385 (2014: $52,654,232).The weighted average duration of the defined benefit obligation at December 31, 2015 is 16.1 years (2014: 16.6 years).

2 0 1 5 F I N A N C I A L S T A T E M E N T S 101
THE CENTRAL BANK OF THE BAHAMAS
NOTES TO THE FINANCIAL STATEMENTSDECEMBER 31, 2015
30. Health Insurance Subsidy Benefit for Retirees
The movement in the health insurance subsidy for retirees over the year is as follows:
2015 2014$ $
Present value of obligation at start of year 2,841,282 2,470,101Interest cost 139,161 120,812Current service cost 109,329 88,076Benefits paid (116,106) (107,723)Actuarial (gain)/loss on obligation due to experience (68,281) 270,016 Actuarial (gain) on obligation due to demographic assumption change (55,371) -
Present value of obligation at end of year 2,850,014 2,841,282
Contribution paid – employees’ and employers’ contributions 116,106 107,723
Benefits paid (116,106) (107,723)
- -
The expense recognised in the statement of comprehensive income in respect of the health insurance subsidy benefit for retirees is as follows:
2015 2014$ $
Current service cost 109,329 88,076 Net interest cost 139,161 120,812
248,490 208,888
Remeasurements recognised in OCI (123,652) 270,016
Movements in the net liability recorded in the statement of financial position are as follows:2015 2014
$ $Net liability at beginning of year 2,841,282 2,470,101Net expense recognised in net comprehensive (loss)/income 248,490 208,888Employer contributions (116,106) (107,723)Remeasurements recognised in OCI (123,652) 270,016
2,850,014 2,841,282

102 Central Bank of The Bahamas
THE CENTRAL BANK OF THE BAHAMAS
NOTES TO THE FINANCIAL STATEMENTSDECEMBER 31, 2015
30. Health Insurance Subsidy Benefit for Retirees (Continued)
Principal actuarial assumptions used at the statement of financial position date are as follows:
2015 2014$ $
Discount rate 5.00% 5.00%Rate of Medical Subsidy Increases 0.00% 0.00%
Sensitivity and Other Results
The benefit obligation as at year-end comprises:2015 2014
$ $Pensioners 1,320,621 1,297,536 Actives 1,529,393 1,543,746
Total 2,850,014 2,841,282
The following table illustrates the changes or sensitivity of the benefit obligation as at December 31, 2015 for 1% changes in discount rate.
2015 2014 1% Increase 1% Decrease 1% Increase 1% Decrease
$ $ $ $Discount rate (335,081) 414,582 (340,931) 423,951
If all members lived one year longer than projected, the liability would be $2,918,680 (2014: $2,915,663).
The weighted average duration of the defined benefit obligation at December 31, 2015 is 14.1 years (2014: 13.3 years).
31. Subsequent events
On February 10, 2016, the Bank made a payment of US$18,160,422 equivalent to SDR13,025,000 repre-senting the required 25% reserve asset portion of an agreed SDR 52,100,000 quota increase obtained from the IMF under the Fourteenth General Review of Quotas. This represents a shift in the composition of the Bank’s foreign reserves. Promissory notes of B$13,738,930 and B$41,216,789 were issued by the Bank and the Government of The Bahamas on behalf of the Bank, respectively, equivalent to SDR 39,075,000.

The Central Bank of The Bahamas
ANNUAL REPORT& Statement of Accounts for the year ended 31 December, 2015
Frederick StreetP.O. Box N-4868, Nassau, NP, The BahamasTel: 242-302-2600Fax: 242-322-4321cbob@centralbankbahamas.comwww.centralbankbahamas.com
2015Balcony House, a two storey residence on Market Street, was built around 1790. It has a detached kitchen and a mahogany staircase—said to have come from a ship. The Central Bank purchased the House on August 8, 1985 and converted it into the Balcony House Museum. It is currently operated by the Antiquities, Monuments and Museums Corporation.
Verandah House, just north of Balcony House, was built of wood in the 1790s and has a stone cellar, dormer windows and a small porch.
Great House, which was built in the 1840s, serves as the Bank’s staff cafeteria, a recreational centre for staff and houses the “after school care” programme.
17x11 cover.indd 1 3/24/16 1:10 PM