2015-16 draft greater sage-grouse annual report … draft greater sage-grouse annual report pinedale...
TRANSCRIPT

2015-16 Draft Greater Sage-Grouse Annual Report
Pinedale Anticline Project Area
December 2016
Prepared by The Pinedale Anticline Project Office
P.O. Box 768 Pinedale, WY 82941

2
Contents OVERVIEW ..................................................................................................................................................... 3
MATRIX THRESHOLD CRITERIA ..................................................................................................................... 3
Active Leks Threshold ............................................................................................................................... 3
Number of Peak Males Threshold ............................................................................................................ 3
Winter Habitat Use Threshold .................................................................................................................. 4
Noise Threshold ........................................................................................................................................ 4
SURVEY METHODS ........................................................................................................................................ 4
RESULTS ........................................................................................................................................................ 4
Total Number of Active Leks in Development Complexes Combined ...................................................... 4
Total Number of Active Leks in a Single Development Complex .............................................................. 4
Peak Number of Males Attending Lek Complexes ........................................................................................ 5
Comparison of Entire Development Area with Combined Reference Area ............................................. 5
Comparison of Individual Development Area Complexes with Combined Reference Area ..................... 5
Mesa Complex ....................................................................................................................................... 5
Duke’s Triangle ...................................................................................................................................... 5
Yellowpoint ........................................................................................................................................... 5
LEK SEARCHES ............................................................................................................................................... 6
WINTER CONCENTRATION AREAS ................................................................................................................ 6
NOISE MONITORING ..................................................................................................................................... 6
LITERATURE CITED ........................................................................................................................................ 7
Appendix A .................................................................................................................................................... 8
Appendix B .................................................................................................................................................. 15
Appendix C .................................................................................................................................................. 22

3
OVERVIEW The 2008 Final Supplemental Environmental Impact Statement Record of Decision (ROD) for the Pinedale Anticline Oil and Gas Exploration and Development Project (BLM 2008) includes a Wildlife Monitoring and Mitigation Matrix (WMMM) that identifies key wildlife species to be monitored and specific changes that require mitigation (Appendix A, Table 1). For Greater Sage-Grouse, the WMMM is designed to quantitatively identify changes in sage-grouse populations within the Pinedale Anticline Project Area (PAPA). Six lek complexes are monitored annually for changes specified in the WMMM (Appendix A, Figure 1). Lek attendance by male sage-grouse, number of active leks, winter concentration area use, and noise are all monitored. In 2016, monitoring results for attendance by male sage-grouse and number of active leks indicated matrix thresholds for sage-grouse were not surpassed.
MATRIX THRESHOLD CRITERIA There are several measurements used to evaluate the matrix thresholds (or triggers) for Greater Sage-Grouse.
Active Leks Threshold The matrix threshold of a 30% decline in total number of active leks within the development area has two comparisons that can be made with this component:
1. The total number of active leks in the three combined development area complexes is compared to the 2007 baseline for the combined development area complexes.
2. The number of active leks in a single development area complex is compared to the 2007 baseline data for that lek complex.
According to footnote 1 on page B-3 of the ROD (BLM 2008), for both of these comparisons, if the number of leks decline but the bird numbers on lek complexes do not, the mitigation threshold would not be surpassed. Therefore, the matrix threshold for a decline in the number of active leks can only be surpassed if there is a concurrent decrease in the peak number of males as explained below.
Number of Peak Males Threshold The matrix threshold of a 30% decline in peak male numbers has two comparisons for this component:
1. A 30% decline in peak male numbers within the entire development area is compared to the entire combined reference area total. The change is derived by comparing the current year total to the prior 2-year average in annual peak male numbers within the entire combined development area. The percent change from the development area is then compared to the percent change within the entire combined reference area.
2. A 30% decline in peak male numbers within an individual development area complex compared to the entire combined reference area. The change is derived by comparing the current year total to the prior 2-year average in annual peak male numbers within each

4
single development area complex. The percent change from a single development area complex is then compared to the percent change within the entire combined reference area.
Winter Habitat Use Threshold The matrix threshold for a decline in habitat area use may be met when measurements detect an average 15% per year decline in the amount of winter concentration habitat area used over 2-years as compared to the entire combined reference areas and when combined with a concurrent average of 30% decline in peak number of males over 2-years compared to the entire combined reference areas.
Noise Threshold Noise is measured by evaluating decibel levels at development area leks. A trigger is met when noise exceeding 10 dBA above background (39 dBA, BLM 2000) when measured from the edge of the lek, is combined with a concurrent average of 30% decline in peak number of male birds over 2-years compared to the entire combined reference area numbers.
SURVEY METHODS All monitoring follows the Wyoming Game and Fish Department (WGFD) protocols from the Handbook of Biological Techniques (Emmerich et al. 2007). Guidelines for conducting noise monitoring (Blickley and Patricelli, 2012) were prepared for the PAPO as recommended by the Wyoming Cooperative Fish and Wildlife Research Unit (Connelly et al. 2010). Noise monitoring results are available in a separate noise monitoring report available on the PAPO website.
RESULTS Sage-grouse monitoring included identifying the number of active leks and peak numbers of males attending leks (Appendix A, Table 2).
Total Number of Active Leks in Development Complexes Combined In 2007, development area leks in 3 lek complexes (Mesa, Duke’s Triangle and Yellowpoint) totaled 16 active leks. There were 13 total active leks within the development area in 2016 which equates to a 19% decline compared to the baseline year 2007 (Appendix B, Table 1). One new lek was found within the Mesa complex in 2016 (Luman Allotment Reservoir Lek).
Total Number of Active Leks in a Single Development Complex For the number of active leks within a single complex, in 2007 the Mesa complex began with 6 active leks. In 2016, 6 active leks were reported for the Mesa complex resulting in no change in the number of leks compared to 2007. There were 2 active leks in the 2007 baseline year for the

5
Duke’s Triangle complex with 1 active lek in 2016, representing a 50% decline. The Yellowpoint complex had 8 active leks in the 2007 baseline year with 6 active leks in 2016 representing a 25% decline (Appendix B, Table 2).
Peak Number of Males Attending Lek Complexes The WMMM outlines monitoring a 2-year change in the number of males attending 3 development complexes and 3 adjacent reference area lek complexes (Appendix A, Figure 1). A decline of 30% in one of the development area complexes, when compared to the entire combined reference area, triggers mitigation. Data and calculations for these analyses can be found in Appendix B (Tables 3 thru 8).
Comparison of Entire Development Area with Combined Reference Area In 2016, there was a 47% increase in peak males attending leks within the entire development area (Appendix B, Table 5) and a 39% increase in peak males attending leks within the combined reference area (Appendix B, Table 8). The results indicate both areas increased, with the entire development area having an 8% greater increase than the combined reference area.
Comparison of Individual Development Area Complexes with Combined Reference Area Individual complexes within the development area were compared to the combined reference area. A decline of 30% in an individual development area complex when compared to the combined reference areas triggers mitigation. Data and calculations for these analyses can be found in Appendix B (Tables 3 thru 8).
Mesa Complex In 2016, the Mesa complex increased 29% (Appendix B, Table 5) while the combined reference area increased 39% (Appendix B, Table 8) indicating the Mesa complex increased 10% less than the combined reference area.
Duke’s Triangle In 2016, the Duke’s Triangle complex increased 131% (Appendix B, Table 5) while the combined reference area experienced a 39% increase (Appendix B, Table 8) indicating the Duke’s Triangle complex had a 92% greater increase than the combined reference area.
Yellowpoint In 2016, the Yellowpoint complex had a 67% increase (Appendix B, Table 5) while the combined reference area experienced a 39% increase (Appendix B, Table 8) indicating the Yellowpoint complex had a 28% greater increase than the combined reference area.

6
LEK SEARCHES In 2016, ground searches were conducted in all complexes in the development area (Mesa, Duke’s Triangle, and Yellowpoint) and all reference area complexes (Speedway, Ryegrass and East Fork). One new lek was located within the Mesa complex (Luman Allotment Reservoir) and one new lek (Chalk Butte) was found within the East Fork complex. In addition, the Sands Spring Well 2 lek located in the East Fork complex was re-occupied in 2016 after being unoccupied for several years.
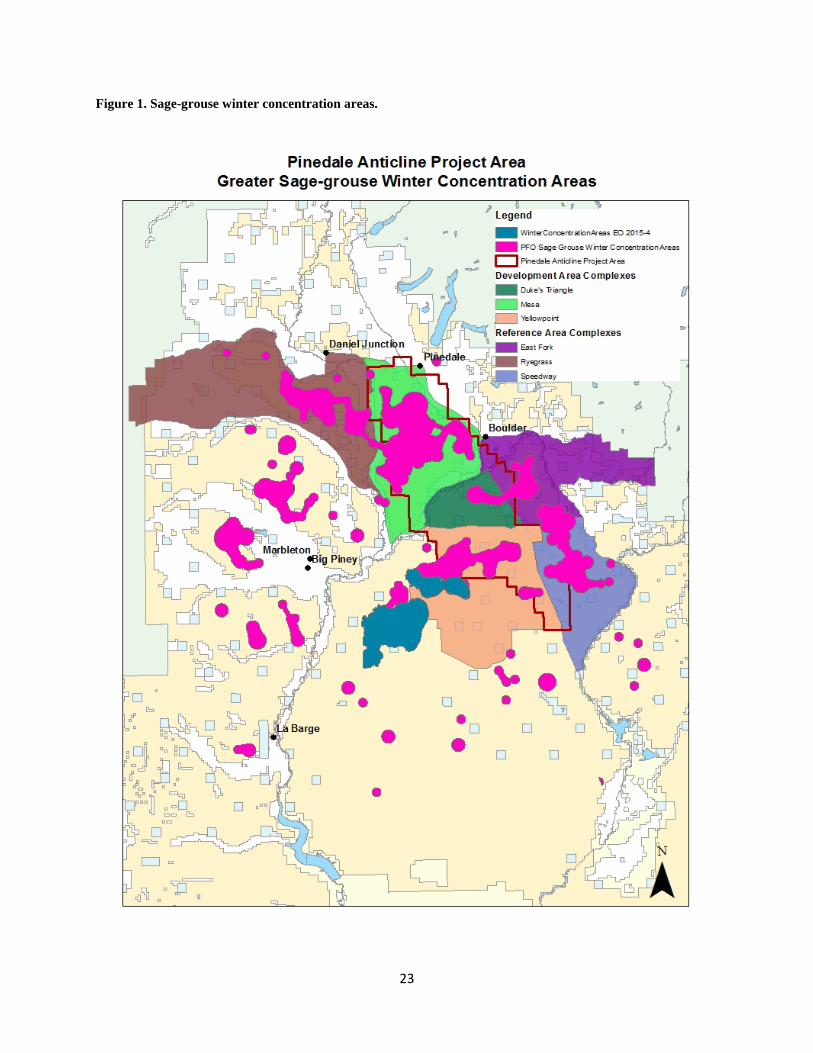
WINTER CONCENTRATION AREAS Wyoming Executive Order 2015-04 requires that identification of winter concentration areas be based on habitat features and repeated observations of winter use by a biologically significant number of Greater Sage-Grouse using a validated resource selection function (RSF) modeling approach. The Sage Grouse Implementation Team (SGIT) is currently working on standardizing the methodology and a RSF model for delineating winter concentration areas in the state of Wyoming. This RSF model could be used to better refine winter concentration areas located within the development and reference area complexes (Appendix C, Figure 1). The PAPO will continue to work on winter concentration delineation and developing monitoring protocols to assess wintering sage-grouse use.
NOISE MONITORING The results of the 2016 noise monitoring can be found in a separate report.

7
LITERATURE CITED Blickley, J. L, and G. L. Patricelli. 2013. Noise monitoring recommendations for Greater Sage Grouse habitat in Wyoming. Prepared for the PAPO, Pinedale, WY. Bureau of Land Management [BLM]. 2000. Record of Decision: Final Environmental Impact Statement for the Pinedale Anticline Oil and Gas Exploration and Development Project. Pinedale Field Office, Wyoming. Bureau of Land Management [BLM]. 2008. Record of Decision: Final Supplemental Environmental Impact Statement for the Pinedale Anticline Oil and Gas Exploration and Development Project. Pinedale Field Office, Wyoming. Connelly, J.W., T.A. Messmer, E.O. Garton. 2010. Review of sage-grouse monitoring for the Pinedale Anticline Project Area. Wyoming Cooperative Fish and Wildlife Research Unit. Laramie, WY. Emmerich. J., R. Guenzel, L. Jahnke, B. Kroger, J. Nemick, B. Rudd, and T. Woolley. 2007. Handbook of Biological Techniques: third edition. Wyoming Game and Fish Department.

8
Appendix A

9
Table 1. Wildlife Matrix (sage-grouse) from Appendix B PAPA ROD (BLM 2008), as modified in 2011.
Criteria Method Changes that will be monitored
Specific Changes Requiring Mitigation Mitigation Responses
Number of active leks in identified lek complexes
Lek counts according to protocol
Active use on 70% of total current leks; Active use on 70% of leks in each complex (the development area complexes include the Mesa, Duke’s Triangle, and Yellow Point complexes) compared to 2007 data.
30% decline in total number of active leks, or 30% decline in the number of leks in a single complex.
Select mitigation response sequentially as listed below, implement most useful and feasible and monitor results over sufficiently adequate time for the level of impact described by current monitoring.
Peak numbers of males attending lek complexes
Lek counts according to protocol
Total average 2-year change in numbers of males attending development area lek complexes (the Mesa, Duke’s Triangle, or Yellow Point lek complex), compared to the East Fork, Speedway, or Ryegrass reference lek complexes.
Average of 30% decline in numbers over 2 years compared to reference area.
Select mitigation response sequentially as listed below, implement most useful and feasible and monitor results over sufficiently adequate time for the level of impact described by current monitoring.
Winter concentration area use
Monitoring according to protocol
Change in winter concentration area use compared to reference area (once initial data is available), and a concurrent change in the total average 2 year numbers of males attending development area lek complexes (the Mesa, Duke’s Triangle or Yellow Point lek complex), compared to the East Fork, Speedway, or Ryegrass reference lek complexes.
Average of 15% per year decline in amount of winter habitat used over 2 years compared to reference areas, and a concurrent average of 30% decline in numbers over 2 years compared to reference area.
Select mitigation response sequentially as listed below, implement most useful and feasible and monitor results over sufficiently adequate time for the level of impact described by current monitoring.
Noise levels
Decibel monitoring from March 1-May 15 at lek sites
Noise levels demonstrated to impact peak lek use by male sage-grouse and a concurrent change in the total average 2- year numbers of males attending development area lek complexes (the Mesa, Duke’s Triangle, or Yellow Point lek complex), compared to the East Fork, Speedway, or Ryegrass reference lek complexes.
Decibel levels at the lek more than 10 dBA above background measured from the edge of the lek (2000 ROD, p.27), and a concurrent average of 30% decline in peak numbers of male birds over 2 years vs. reference area.
Select mitigation response sequentially as listed below, implement most useful and feasible and monitor results over sufficiently adequate time for the level of impact described by current monitoring.
Footnote 1. If the number of leks decline but the bird numbers on lek complexes do not, the mitigation threshold would not be surpassed. If the number of leks does not decline but the bird numbers on lek complexes does decline, the mitigation threshold would be surpassed. If both numbers of leks and birds decline, the mitigation threshold would obviously be surpassed

10
Figure 1. Greater Sage-grouse Monitoring Project Area

11
Wyoming Sage-Grouse Lek Definitions:
(Revised November 2012)
The following definitions have been adopted for the purposes of collecting and reporting sage-grouse lek data. See the sage-grouse chapter of the Wyoming Game and Fish Department’s Handbook of Biological Techniques for additional technical details and methods. Lek - A traditional courtship display area attended by male sage-grouse in or adjacent to sagebrush dominated habitat. A lek is designated based on observations of two or more male sage-grouse engaged in courtship displays. Before a suspected lek is added to the database, it must be confirmed by a survey conducted during the appropriate time of day, during the strutting season. Sign of strutting activity (tracks, droppings, feathers) can also be used to confirm a suspected lek. Sub-dominant males may display on itinerant (temporary) strutting areas during years when populations peak. Such areas usually fail to become established leks. Therefore, a site with small numbers of strutting males (<5) should be confirmed active for two years before the site is added to the lek database. Satellite Lek – A relatively small lek (usually less than 15 males) within about 500 meters of a large lek often documented during years of relatively high grouse numbers. Locations of satellite leks should be encompassed within lek perimeter boundaries. Birds counted on satellite leks should be added to those counted on the primary lek for reporting purposes. Lek Perimeter – The outer perimeter of a lek and associated satellite leks (if present). Perimeters of all leks should be mapped by experienced observers using accepted protocols (Section 1.b.v below); larger leks should receive higher priority. Perimeters may vary over time as population levels or habitat and weather conditions fluctuate. However, mapped perimeters should not be adjusted unless grouse use consistently (2+ years) demonstrates the existing perimeter is inaccurate. The lek location must be identified and recorded as a specific point within the lek perimeter. This point may be the geographic center of the perimeter polygon calculated though a GIS exercise, or a GPS waypoint recorded in the field, which represents the center of breeding activity typically observed on the lek. Lek Complex - A cluster of leks within 2.5 km (1.5 mi) of each other, between which male sage-grouse may interchange from day to day. Lek Count - A census technique that documents the number of male sage-grouse observed attending a particular lek, lek complex, or leks along a lek route based on repeated observation.
• Conduct lek counts at 7-10 day intervals over a 3-4 week period after the peak of mating activity. Although mating typically peaks in early April in Wyoming, the number of males counted on a lek is usually greatest in late April or early May when attendance by yearling males increases.
• Conduct lek counts only from the ground. Aerial counts are not accurate and are not comparable to ground counts.
• Conduct counts from ½ hour before sunrise to 1 hour after. • Count attendance at each lek a minimum of three times annually during the breeding season. • Conduct counts only when wind speeds are less than 15 kph (~10 mph) and no precipitation is
falling. • All leks within a complex should be counted on the same morning.

12
Lek Count Route – A lek route is a group of leks in relatively close proximity that represent part or all of a discrete breeding population/sub-population. Leks should be counted on routes to facilitate replication by other observers, increase the likelihood of recording satellite leks, and account for shifts in distribution of breeding birds. Lek routes should be set up so an observer following criteria described under “Lek Count” can count all leks within 1.5 hours. Lek Survey - A monitoring technique designed primarily to determine whether leks are active or inactive. Obtaining accurate counts of males attending is secondary. Ideally, all sage-grouse leks would be counted annually. However, some breeding habitat is inaccessible during spring because of mud and snow, or the location of a lek is so remote it cannot be routinely counted. In other situations, topography or vegetation may prevent an accurate count from any vantage point. In addition, time and budget constraints often limit the number of leks that can be visited. Where lek counts are not feasible for any of these reasons, surveys are the only reliable means to monitor population trends. Lek surveys are designed principally to determine whether leks are active or inactive, requiring as few as one visit to a lek. Obtaining accurate counts of the numbers of males attending is not essential. Lek surveys involve substantially less effort and time than lek counts. They can also be done from a fixed-wing aircraft or helicopter. Lek surveys can be conducted from the initiation of strutting in early March until early-mid May, depending on the site and spring weather. When large numbers of leks are surveyed (50+) the resulting trends of lek attendance over time mirror that of lek counts. Annual status – Lek status is assessed annually based on the following definitions: active – Any lek that has been attended by male sage-grouse during the strutting season. Acceptable documentation of grouse presence includes observation of birds using the site or signs of strutting activity. inactive – Any lek where sufficient data indicates no strutting activity took place throughout a strutting season. Absence of strutting grouse during a single visit is not sufficient documentation to establish a lek is inactive. This designation requires documentation no birds were present on the lek during at least 2 ground surveys separated by at least 7 days. The surveys must be conducted under ideal conditions (site visits between April 1 and May 7, no precipitation, light or no wind, ½ hour before to 1 hour after sunrise) or a ground check of the exact lek location late in the strutting season (after 4/15) during which sign (droppings/feathers) of strutting activity is not found. Data collected by aerial surveys cannot be used to designate inactive status. unknown – Leks for which active/inactive status has not been documented during the course of a strutting season. Excepting leks not scheduled to be checked in a particular year, the “unknown” status designation should be applied only in rare instances. Each lek should be checked enough times to determine whether it is active or not. It is preferable to conduct two good field checks every other year and confirm the lek is "inactive" rather than check it once every year and have it remain in “unknown” status. Management status - Based on its annual status, a lek is assigned to one of the following categories for management purposes: occupied lek – A lek that has been active during at least one strutting season within the prior ten years. Occupied leks are protected through prescribed management actions during surface disturbing activities. unoccupied lek – Two classifications of unoccupied leks are “destroyed” and “abandoned” (defined below). Unoccupied leks are not protected during surface disturbing activities.
13
destroyed lek – A formerly active lek site and surrounding sagebrush habitat that has been destroyed and is no longer suitable for sage grouse breeding. A lek site that has been strip-mined, paved, converted to cropland or undergone other long-term habitat type conversion is considered destroyed. Destroyed leks are not monitored unless the site has been reclaimed to suitable sage-grouse habitat. abandoned lek – A lek in otherwise suitable habitat that has not been active during a period of 10 consecutive years. To be designated abandoned, a lek must be “inactive” (see above criteria) in at least four non-consecutive strutting seasons spanning the ten years. The site of an “abandoned” lek should be surveyed at least once every ten years to determine whether it has been re-occupied by sage-grouse. undetermined lek – Any lek that has not been documented as active in the last ten years, but survey information is insufficient to designate the lek as unoccupied. Undetermined lek sites are not protected through prescribed management actions during surface disturbing activities until sufficient documentation is obtained to confirm the lek is occupied. This status should be applied only in rare instances (also see “unknown” above).

Table 2. Development and Reference Area Occupied Leks.
2007 2008 2009 2010 2011 2012 2013 2014 2015 2016 Development Area
Complexes Lek Name
MESA Bloom Reservoir 123 107 97 68 81 75 67 61 68 75 Cat 24 19 2 9 3 2 3 0 0 0 Lovatt West 9 25 0 0 2 0 0 0 0 0 Luman Allotment Reservoir 46 Mesa Road 3 100 97 76 40 38 32 42 38 66 79 Oil Road Fork 184 154 156 105 93 72 53 43 53 67 Mesa/Pole Creek 0 0 0 0 0 0 0 0 0 0 Two Buttes 99 88 86 82 87 79 64 77 88 94 Tyler Draw North 21 25 35 36 40 33 46 55
DUKE’S TRIANGLE Big Fred 0 2 0 0 0 0 0 0 0 0 Little Fred 24 22 0 30 9 0 0 0 0 0 Lower Sand Springs Draw 10 14 13 18 18 20 20 21 37 67
YELLOW POINT Alkali Draw 67 37 23 29 29 19 26 23 40 51 Prairie Dog 39 41 38 23 13 29 23 18 33 53 Sand Draw 3 5 0 0 0 0 0 0 0 0 0 Sand Draw Reservoir 38 24 19 19 12 13 12 6 3 3 Shelter Cabin Reservoir 74 51 44 27 22 40 41 34 28 36 South Rocks 33 41 40 25 22 28 26 11 21 26 Stud Horse Butte E. 4 2 0 0 0 0 0 0 0 0 The Rocks 26 24 9 11 0 0 0 0 0 0 Little Saddle 33 21 21 23 22 45 68
Reference Area Complexes Lek Name
RYEGRASS Brodie Burn 2 0 0 6 0 1 0 0 0 1 Brodie Draw 1 30 18 19 8 14 10 20 17 21 18 Brodie Draw 2 18 32 18 12 7 20 43 22 19 43 Brodie Draw 3 0 2 1 4 0 0 0 0 0 0 Cut Across 0 19 7 0 12 0 0 0 0 0 Fear Ditch 41 42 21 18 37 23 43 30 38 47 Fear Ditch Reservoir 30 4 20 19 24 11 10 11 18 25 Grindstone Butte North 9 6 9 10 24 30 Grindstone Draw 33 32 38 33 35 26 22 24 59 50 Jewett Red Flat Reservoir 82 33 50 31 28 NC 24 49 55 43 Lloyd 24 27 19 35 37 North Luman Ridge 28 27 7 2 4 0 0 0 0 0 North Soapholes Creek 16 15 26 15 31 1 12 12 0 11 Old Reservoir 8 19 60 2 6 0 0 21 0 0 Onion Spring 11 2 0 0 2 7 0 0 0 1 Onion Spring 2 38 38 21 54 50 124 86 26 Rooster’s Delight 23 16 11 23 Ryegrass Draw 81 88 147 106 125 59 78 75 96 103 Ryegrass Draw South NC 69 49 35 38 41 49 62 51 87 Ryegrass Reservoir 7 14 10 2 15 NC 0 4 0 2 Ryegrass Road Fork 42 30 33 25 14 40 29 29 45 35 Sommers 37 27 15 0 19 16 24 10 10 27 South Luman Ridge 44 42 40 25 15 20 21 14 50 32 South Soapholes Creek 13 21 6 0 1 0 0 0 0 0 Upper Onion Creek 164 62 121 164 98 71 68 84 130 111
SPEEDWAY Big John 117 96 80 73 63 56 65 53 185 187 Darby 104 94 75 56 32 41 31 20 34 64 Desert Reservoir 226 234 150 153 61 72 84 92 111 130 Hole 2 0 0 0 18 17 25 18 12 21 43 Mud Hole State 235 200 142 82 64 62 41 42 119 211 Speedway 132 103 94 54 84 52 41 24 37 80 Waterhole Draw 120 92 70 31 29 41 18 6 8 16
EAST FORK Blown Out Reservoir 216 208 171 109 NC 87 84 89 138 119 Chalk Butte 25 Fremont Butte Well 2A 31 14 16 12 NC 34 24 46 26 18 Fremont Butte Well 2B 27 29 26 21 NC 21 26 30 49 54 Sand Springs Well 2 54

15
Appendix B

16
Data and Calculations (data is rounded to nearest whole number)
DEVELOPMENT AREA
Table 1. Number of active leks in combined development area.
Year Combined Development Area Complexes Number of Active Leks*
Matrix Threshold: Percent change in active Leks compared to 2007
2007 16
2008 16 0%
2009 13 -19%
2010 15 -6%
2011 15 -6%
2012 13 -19%
2013 13 -19%
2014 12 -25%
2015 12 -25%
2016 13 -19% *Lek data provided by WGFD.
The percent change in active leks compared to the 2007 baseline year is calculated by taking the current year’s number of active leks minus the number of active leks in 2007; divide this number by the number of active leks in 2007 and multiply by 100.
Example: to calculate the percent change in active leks in 2016 compared to 2007
(13 – 16) / 16 X 100 = -19%

17
Table 2. Number of active leks per single complex in development area.
Year Mesa Complex Number of active Leks
Matrix Threshold: Percent change in active Leks compared to 2007
2007 6 2008 6 0% 2009 6 0% 2010 6 0% 2011 7 17% 2012 6 0% 2013 6 0% 2014 5 -17% 2015 5 -17% 2016 6 0%
Year Duke’s Triangle Complex Number of active Leks
Matrix Threshold: Percent change in active Leks compared to 2007 (bold
indicates threshold has been met) 2007 2 2008 3 50% 2009 1 -50% 2010 2 0% 2011 2 0% 2012 1 -50% 2013 1 -50% 2014 1 -50% 2015 1 -50% 2016 1 -50%
Year Yellowpoint Complex Number of active Leks
Matrix Threshold: Percent change in active Leks compared to 2007
2007 8 2008 7 -13% 2009 6 -25% 2010 7 -13% 2011 6 -25% 2012 6 -25% 2013 6 -25% 2014 6 -25% 2015 6 -25% 2016 6 -25%
The percent change in active leks compared to the 2007 baseline year is calculated by taking the current year’s number of active leks minus the number of active leks in 2007; divide this number by the number of active leks in 2007 and multiply by 100.
Example: to calculate the percent change in active leks in the Duke’s Triangle Complex in 2016 compared to 2007
(1 – 2) / 2 X 100 = -50%

18
Table 3. Peak Number of Males Attending Development Area Lek Complexes.
Year Mesa Complex Duke’s Triangle Complex Yellowpoint Complex Combined Development Area
2007 539 34 286 859
2008 490 38 220 748
2009 438 13 173 624
2010 329 48 167 544
2011 339 27 119 485
2012 296 20 150 466
2013 269 20 151 440
2014 252 21 114 387
2015 321 37 170 528
2016 370 67 237 674 *Lek data provided by WGFD.
Table 4. Two-year Average Number of Males Attending Development Area Lek Complexes.
Years Mesa Complex
Duke’s Triangle Complex Yellowpoint Complex Combined Development Area
2006-2007 558 31 261 850
2007-2008 515 36 253 804
2008-2009 464 26 197 686
2009-2010 384 31 170 584
2010-2011 334 38 143 515
2011-2012 318 24 135 476
2012-2013 283 20 151 453
2013-2014 261 21 133 414
2014-2015 287 29 142 458
2015-2016 346 52 204 601
The two-year average is calculated by adding two consecutive years of the peak number of males attending the lek complex (Table 3) and dividing by 2.
Example: 2015-2016 average for Mesa Complex
(321 + 370) / 2 = 346

19
Table 5. Percent Change in Number of Males Attending Development Area Lek Complexes.
Year Mesa Complex Duke’s Triangle Complex
Yellowpoint Complex Combined Development Area
2007 11% 0% 50% 21%
2008 -12% 23% -16% -12%
2009 -15% -64% -32% -22%
2010 -29% 85% -15% -21%
2011 -12% -13% -30% -17%
2012 -11% -47% 5% -10%
2013 -15% -17% 12% -8%
2014 -11% 5% -25% -15%
2015 23% 76% 28% 28%
2016 29% 131% 67% 47%
The percent change in number of males attending development area lek complexes is calculated using the following calculation:
The current year annual peak male attendance for a complex (Table 3) minus the previous two-year running average for that complex (Table 4); divide this number by the previous two-year running average for that complex (Table 4) and multiply by 100.
Example: to calculate the 2016 percent change in the Mesa Complex:
(370 – 287) / 287 X 100 = 29%

20
REFERENCE AREA
Table 6. Peak Number of Males Attending All Reference Area Lek Complexes.
Year Ryegrass Complex East Fork Complex Speedway
Complex Combined Reference Area
2007 687 274 934 1895
2008 598 251 819 1668
2009 726 213 611 1550
2010 545 142 467 1154
2011 555 NA* 350 NA
2012 406 142 349 897
2013 525 134 298 957
2014 614 165 249 1028
2015 713 213 515 1441
2016 715 270 731 1716 *Lek data provided by WGFD
Table 7. Average Number of Males Attending Reference Area Lek Complexes.
Year Ryegrass Complex
East Fork Complex Speedway Complex Combined Reference Area
2006-2007 572 250 908 1730
2007-2008 643 263 877 1782
2008-2009 662 232 715 1609
2009-2010 636 178 539 1352
2010-2011 550 NA 409 NA
2011-2012 481 NA 350 NA
2012-2013 466 138 324 927
2013-2014 570 150 274 993
2014-2015 664 189 382 1235
2015-2016 714 242 623 1579 *Note: the East Fork complex was not included in the 2010-2012 calculations because data was not collected in 2011. Although the running two-year average could be calculated, it would not be possible to calculate the percent change since there is not a running two-year value for the years 2011-2012.
The two-year average is calculated by adding two consecutive years of the peak number of males attending the lek complex (Table 6) and dividing by 2.
Example: 2015-2016 average for Ryegrass Complex
(713 + 715) / 2 = 714

21
Table 8. Percent Change in Number of Males Attending Reference Area Lek Complexes.
Year Ryegrass Complex East Fork Complex
Speedway Complex Combined Reference Area
2007 66% 34% 19% 35%
2008 5% 0% -10% -4%
2009 13% -19% -30% -13%
2010 -18% -39% -35% -28%
2011 -13% NA -35% -23*
2012 -26% NA -15% -21*
2013 4% NA -15% -4*
2014 32% 20% -23% 11%
2015 25% 42% 88% 45%
2016 8% 43% 91% 39% *Note: The East Fork complex was not included in the 2010-2013 calculations because data was not collected in 2011 due to heavy snow conditions. Although the running two-year average could be calculated, it would not be possible to calculate the percent change since there is not a running two-year value for the years 2011-2013.
The percent change in number of males attending reference area lek complexes is calculated using the following calculation:
The current year annual peak male attendance for a complex (Table 6) minus the previous two-year running average for that complex (Table 7); divide this number by the previous two-year running average for that complex (Table 7) and multiply by 100.
Example: to calculate the 2016 percent change in the Ryegrass Complex:
(715 – 664) / 664 X 100 = 8%

22
Appendix C
23
Figure 1. Sage-grouse winter concentration areas.