2015 06 15 eu refining roundtable_iea
TRANSCRIPT

Fifth Meeting of the EU Refining ForumBrussels, 15 June 2015
International Energy Agency
Recent Developments in EU Refining and in the Supply and Trade of Petroleum Products
© OECD/IEA 2014
© OECD/IEA 2012 © OECD/IEA 2014
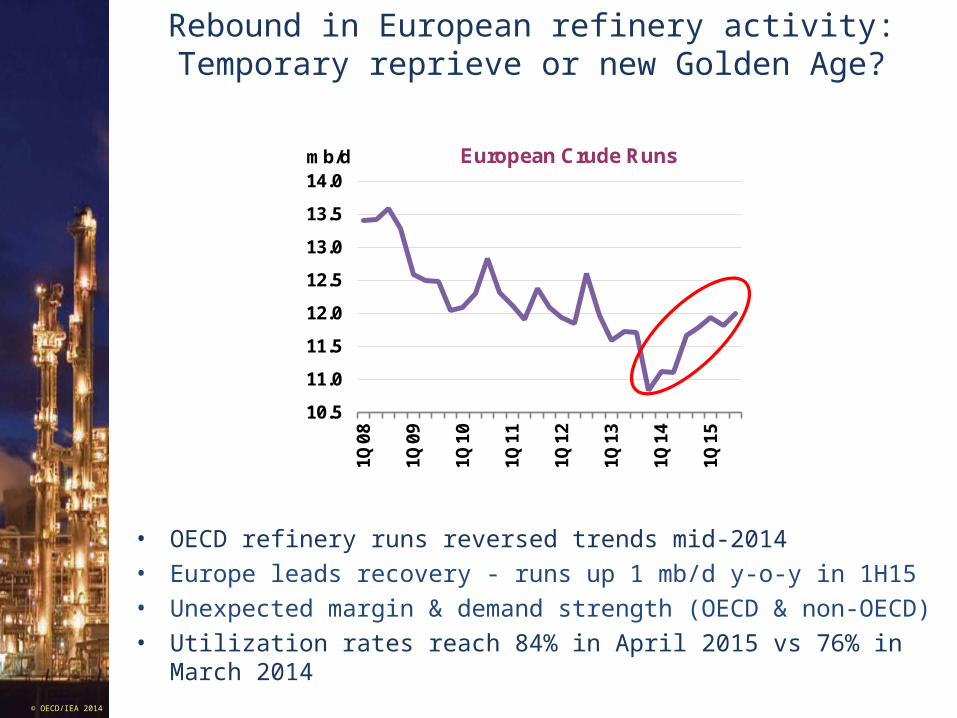
Rebound in European refinery activity:Temporary reprieve or new Golden Age?
• OECD refinery runs reversed trends mid-2014 • Europe leads recovery - runs up 1 mb/d y-o-y in 1H15• Unexpected margin & demand strength (OECD & non-OECD) • Utilization rates reach 84% in April 2015 vs 76% in March 2014
10.5
11.0
11.5
12.0
12.5
13.0
13.5
14.0
1Q08
1Q09
1Q10
1Q11
1Q12
1Q13
1Q14
1Q15
mb/d European Crude Runs

© OECD/IEA 2012 © OECD/IEA 2014
Lingering threat of over-capacity
• New capacity of 6.4 mb/d by 2020• Led by non-OECD Asia, Middle East• Scaled back since oil price drop
– Chinese projects stalling, new closures
• New product bypassing refining system• Surplus capacity still seen up to 5 mb/d in 2020, from 6-yr low
~3 mb/d in 2014
-1 000
- 500
0
500
1 000
1 500
2 000
2014 2015 2016 2017 2018 2019 2020
kb/d
OECD Americas
OECD Europe
OECD Asia Oceania
China
Other Asia
Middle East
Other non-OECD
Total Net
Global crude distillation capacity additions

© OECD/IEA 2012 © OECD/IEA 2014
EU as “sick man” of refining industry
• Falling regional demand
• High energy & labour costs
• Ageing, fragmented industry
– Only one European refinery > 400 kb/d (Shell Pernis)
– Vs. 10 in Asia, 8 in N. America, 5 in the Middle East
• Disadvantaged feedstock costs
• Heavy regulatory burden
© OECD/IEA 2012 © OECD/IEA 2014
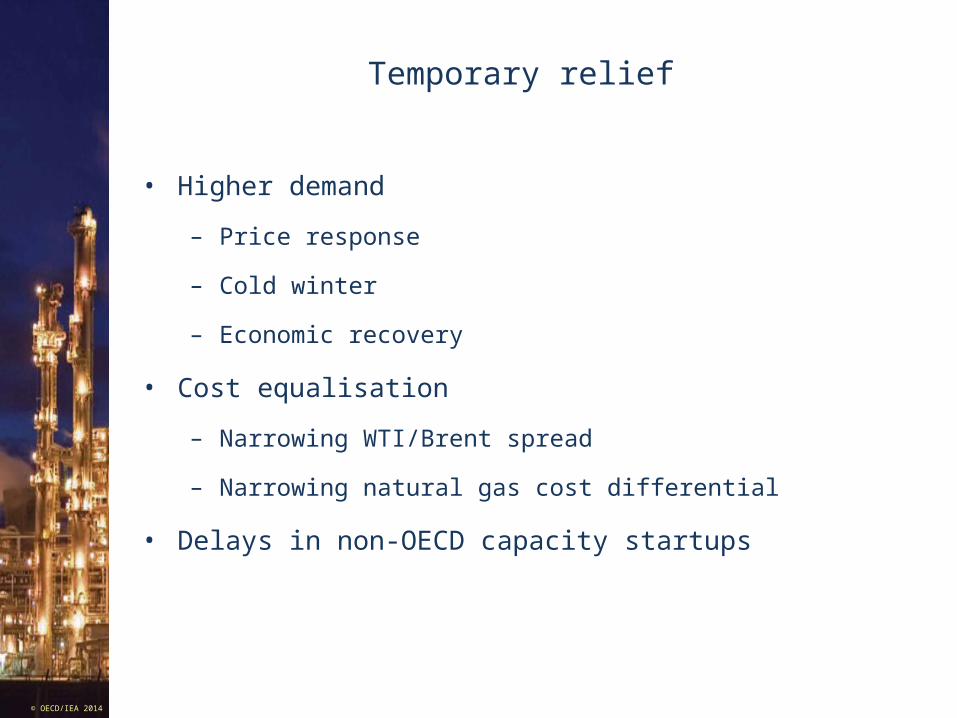
Temporary relief
• Higher demand
– Price response
– Cold winter
– Economic recovery
• Cost equalisation
– Narrowing WTI/Brent spread
– Narrowing natural gas cost differential
• Delays in non-OECD capacity startups

© OECD/IEA 2012 © OECD/IEA 2014
Price reset
• 60% drop in crude oil prices June 2014 - January 2015• From backwardation to contango• Slowing US LTO supplies, Atlantic surplus lift NYMEX WTI
more than Brent (WTI-Brent narrowed to $4/bbl)
40
50
60
70
80
90
100
110
120
Jan 14 Apr 14 Jul 14 Oct 14 Jan 15 Apr 15
$/bblCrude Futures
Front Month Close
NYMEX WTI ICE Brent
Source: ICE, NYMEX

© OECD/IEA 2012 © OECD/IEA 2014
Demand rebound
• First time annual demand growth > 2 mb/d since 2010
-1%
0%
1%
2%
3%
-1
0
1
2
3
1Q2011 1Q2013 1Q2015
mb/d Global y-on-y absolute growthTotal products growth rate
LPG Naphtha GasolineJetKero Diesel RFOOther Total (RHS)

© OECD/IEA 2012 © OECD/IEA 2014
Non-OECD startup delays
• 1.5 mb/d aggregated delays
• Saudi Arabia (Yanbu), UAE (Ruwais), India (Paradip), Brazil
(Abreu e Lima), Colombia (Cartagena expansion)
-1.5
-1.0
-0.5
0.0
0.5
1.0
1.5
2.0
2.5
1Q13 3Q13 1Q14 3Q14 1Q15 3Q15
mb/d Global Crude ThroughputsAnnual Change
OECD Non-OECD

© OECD/IEA 2012 © OECD/IEA 2014
Non-OECD capacity fails to keep up with demand
• Global refinery crude intake estimated 1.4 mb/d higher for each of the first three quarters.
However, non-OECD refiners fail to meet demand as new refineries slow to start up – providing support to OECD and entire oil complex
While OECD – essentially Europe – was responsible for most of growth so far this year, non-OECD to take over in 3Q
- 0.5
0.0
0.5
1.0
1.5
2.0
2.5
1Q12 1Q13 1Q14 1Q15
mb/d Non-OECD Throughputs vs. DemandAnnual growth
Crude Runs Oil Product Demand

© OECD/IEA 2012 © OECD/IEA 2014
European refiners pick up the slack as runs grow faster than regional demand
• Demand up by 0.5 mbd in 1Q15 y-o-y, reversing earlier drops
• European throughputs fall faster than demand in 2014…
• …but rebound faster than demand in 2015
-1.5
-1.0
-0.5
0.0
0.5
1.0
1.5
1Q09 1Q10 1Q11 1Q12 1Q13 1Q14 1Q15
mb/d Demand, crude runs change y-o-y
delta demand delta crude runs

© OECD/IEA 2012 © OECD/IEA 2014
European refinery margins pick up lifted by gasoline cracks
• NWE simple margins turned clearly positive in 2015, though
runs had increased already from mid-2014
• NWE cracking margins reach levels unseen since early 2012
-7.5-5.0-2.50.02.55.07.5
10.012.515.0
Jan 08 Jan 10 Jan 12 Jan 14
$/bbl Refining Margins North West Europe
Brent (Cracking) Brent (HS)
Urals (Cracking) Urals (HS)

© OECD/IEA 2012 © OECD/IEA 2014
2014-1H15 to be a low in surplus capacity
• Surplus global refining capacity hit 6-year low ~3 mb in 2014 as OECD refinery closures offset new non-OECD capacity
• Refinery margins gets significant boost from mid-year• New capacity puts system under renewed pressure from
2015 onward
0.0
1.0
2.0
3.0
4.0
5.0
6.0
7.0
2006 2008 2010 2012 2014 2016 2018 2020
mb/d
Global surplus refinery capacity

© OECD/IEA 2012 © OECD/IEA 2014
Non-OECD accounts for 90% of refining capacity growth
• Non-OECD Asia adds 42% of total, or 2.7 mb/d of crude distillation capacity
• Middle East expands capacity by a further 1.7 mb/d, taking total capacity to 10.3 mb/d at the end of the decade
OECD10%
China24%
Other Asia18%
Middle East26%
Latin America8%
Others14%

© OECD/IEA 2012 © OECD/IEA 2014
More OECD closures in the cards
• Refinery utilisation up to 84% in April 2015• Total of 4.8 mb/d of capacity shut in OECD since 2008• Additional 450 kb/d announced in Asia Oceania through 2017• More shutdowns likely to be announced
• Total to cut 263 kbd of capacity (closure of La Mede, trims Lindsey capacity by 110 kbd)
0
200
400
600
800
1 000
1 200
1 400
2008 2010 2012 2014 2016
mb/d
Americas Europe Asia Oceania
50%
60%
70%
80%
90%
100%
2007 2009 2011 2013 2015 2017 2019
Americas Europe Asia Oceania
OECD refinery closures OECD refinery utilisation rates

© OECD/IEA 2012 © OECD/IEA 2014
Russia’s “pivot to Asia”
Rosneft supply deals with CNPC, Sinopec, Essar, PetroVietnam
-0.60 -0.40 -0.20 0.00 0.20 0.40
China
Oth Asia
Oth Eur
Mid East
L. America
OECD Am
Africa
OECD AO
OECD Eur
mb/d
FSU export growth, 2014-20

© OECD/IEA 2012 © OECD/IEA 2014
European middle-distillates imports stabilizeIncreasing volumes coming from US, India… and Middle East?
• European gasoil imports stabilizing ~ 47 mt/yr since 2013, jet imports are reaching 20 mt/yr
• Middle East OPEC is top jet fuel supplier• FSU ~ 1/2 of diesel imports, followed by U.S. (25-30%) and India (~10%)• Middle East to ship more middle distillates to Europe as new refineries
ramp up?
05
101520253035404550
2000 2001 2002 2003 2004 2005 2006 2007 2008 2009 2010 2011 2012 2013 2014
other India OPEC US FSU
mt/year OECD Europe gasoil/diesel imports
02468
101214161820
2000 2001 2002 2003 2004 2005 2006 2007 2008 2009 2010 2011 2012 2013 2014
other India OPEC US FSU
mt/year OECD Europe jet fuel imports

© OECD/IEA 2012 © OECD/IEA 2014
Trouble ahead?
• European demand strength expected to be short-lived– Opportunistic buying post-price drop may be losing steam– Weather wildcard– Efficiency gains– Mature, ageing market– Tepid economic growth
• Respite of non-OECD import demand also temporary– New capacity to be eventually brought on line– China shifts gears, lowers demand growth rate
• Longer-term climate policies dampen prospects for oil in fuel mix as fuel mix evolves
• Global product trade to loom larger in European supply