2015 06-11-preliminary-results-presentaion
TRANSCRIPT

WS Atkins plc
Preliminary results for the year ended 31 March 2015
1
11 June 2015

Uwe Krueger
Chief executive officer
2
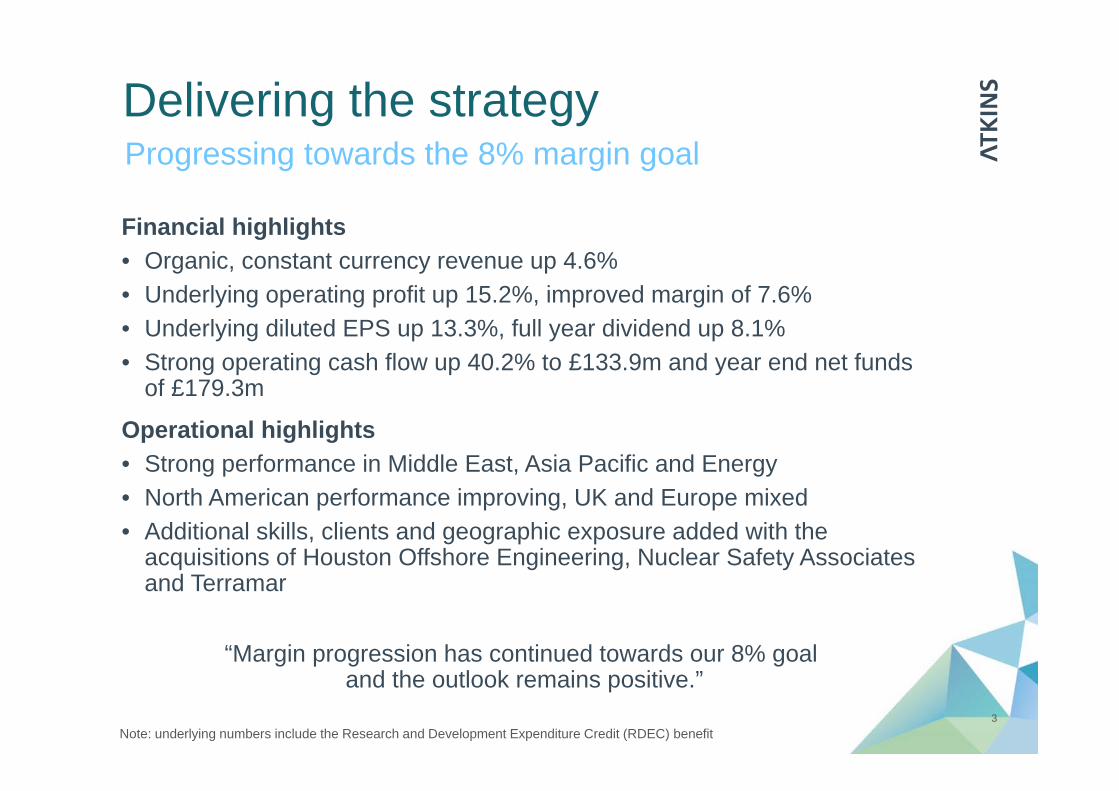
Delivering the strategy
Financial highlights• Organic, constant currency revenue up 4.6%• Underlying operating profit up 15.2%, improved margin of 7.6%• Underlying diluted EPS up 13.3%, full year dividend up 8.1%• Strong operating cash flow up 40.2% to £133.9m and year end net funds
of £179.3m
Operational highlights• Strong performance in Middle East, Asia Pacific and Energy• North American performance improving, UK and Europe mixed• Additional skills, clients and geographic exposure added with the
acquisitions of Houston Offshore Engineering, Nuclear Safety Associates and Terramar
“Margin progression has continued towards our 8% goaland the outlook remains positive.”
3
Progressing towards the 8% margin goal
Note: underlying numbers include the Research and Development Expenditure Credit (RDEC) benefit
Heath Drewett
Group finance director
4
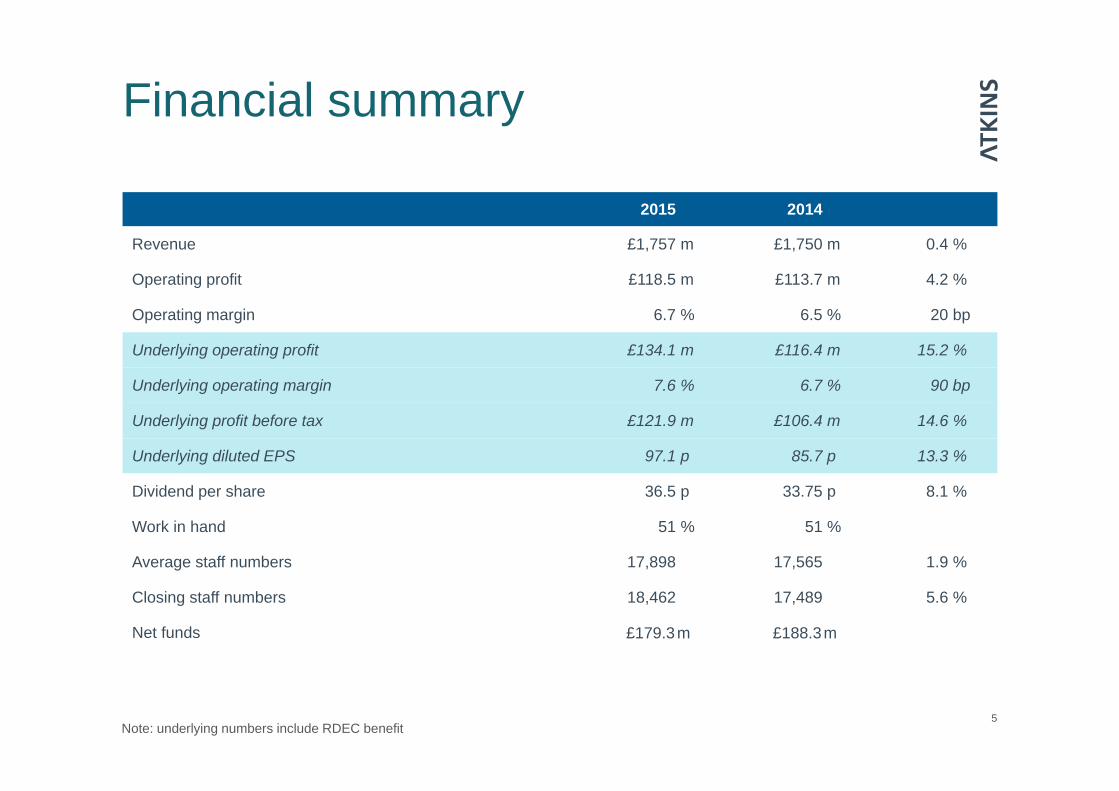
Financial summary
5
2015 2014
Revenue £1,757 m £1,750 m 0.4 %
Operating profit £118.5 m £113.7 m 4.2 %
Operating margin 6.7 % 6.5 % 20 bp
Underlying operating profit £134.1 m £116.4 m 15.2 %
Underlying operating margin 7.6 % 6.7 % 90 bp
Underlying profit before tax £121.9 m £106.4 m 14.6 %
Underlying diluted EPS 97.1 p 85.7 p 13.3 %
Dividend per share 36.5 p 33.75 p 8.1 %
Work in hand 51 % 51 %
Average staff numbers 17,898 17,565 1.9 %
Closing staff numbers 18,462 17,489 5.6 %
Net funds £179.3m £188.3m
Note: underlying numbers include RDEC benefit

£1,750m
£1,639m
£1,757m
42
76(23)
(88)
FY14 Revenue FX impact Disposals/acquisitionimpact
Baseline revenue(continuing)
Acquisitions Organic growth FY15 Revenue
Revenue bridge
6
4.6%
Organic, constant currency growth

• Revenue growth of 2.7% excluding effects of highways services disposal and joint venture accounting change
• Aerospace market downturn, rail contract negotiations and water and environment rightsizing impacted first half performance
• Early adoption of Research and Development Expenditure Credit (RDEC) has increased our segmental profit by around £5m
• Reorganisation of the UK to streamline businesses, expected to deliver year on year margin progress in a stable market.
UK and EuropeImproved second half performance
7
2015 2014
Revenue (£m) 903.8 998.3 (9.5) %
Operating profit (£m) 60.7 62.6 (3.0) %
Operating margin 6.7 % 6.3 % 40 bp
Average staff numbers 9,405 9,751 (3.5) %
Staff numbers 9,642 9,544 1.0 %

North AmericaConsultancy margins improving
8
2015 2014
Revenue (£m) 341.4 380.9 (10.4) %
Operating profit (£m) 20.0 19.1 4.7 %
Operating margin 5.9 % 5.0 % 90 bp
Average staff numbers 2,794 2,970 (5.9) %
Staff numbers 2,735 2,836 (3.6) %
• Revenue down 3.8% excluding effects of currency headwinds, Peter Brown disposal (in August 2013) and joint venture accounting change
• New organisational model around the Technical Professional Organisation (TPO) driving improved resource management and utilisation
• Consultancy margin improved to 6.6%, with further progress expected next year.
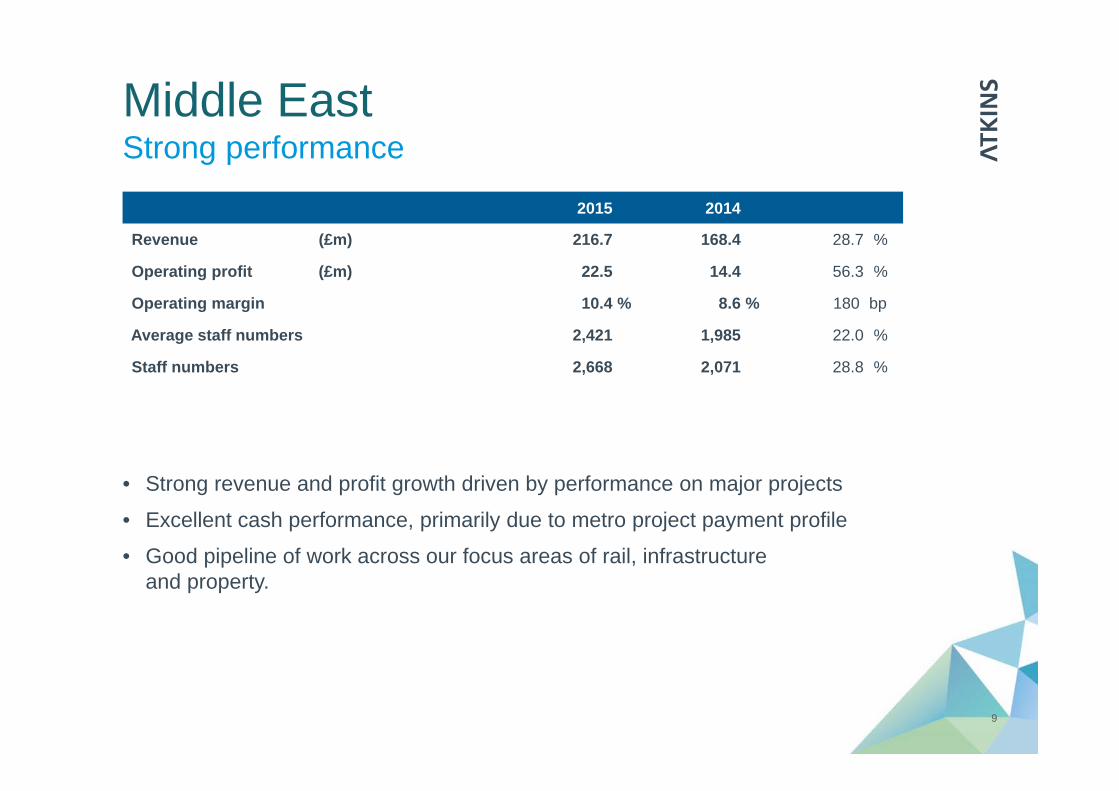
Middle EastStrong performance
9
2015 2014
Revenue (£m) 216.7 168.4 28.7 %
Operating profit (£m) 22.5 14.4 56.3 %
Operating margin 10.4 % 8.6 % 180 bp
Average staff numbers 2,421 1,985 22.0 %
Staff numbers 2,668 2,071 28.8 %
• Strong revenue and profit growth driven by performance on major projects
• Excellent cash performance, primarily due to metro project payment profile
• Good pipeline of work across our focus areas of rail, infrastructure and property.

Asia PacificContinued progress
10
2015 2014
Revenue (£m) 109.7 100.5 9.2 %
Operating profit (£m) 9.8 8.0 22.5 %
Operating margin 8.9 % 8.0 % 90 bp
Average staff numbers 1,561 1,357 15.0 %
Staff numbers 1,523 1,498 1.7 %
• Good revenue and profit growth boosted by a full year of Confluence
• Mainland China slowdown in the second half likely to impact in current year
• Positive revenue outlook driven by good performance in Hong Kong, some early wins in SE Asia and engagement with Chinese contractors
• Further investment for growth planned across the region.
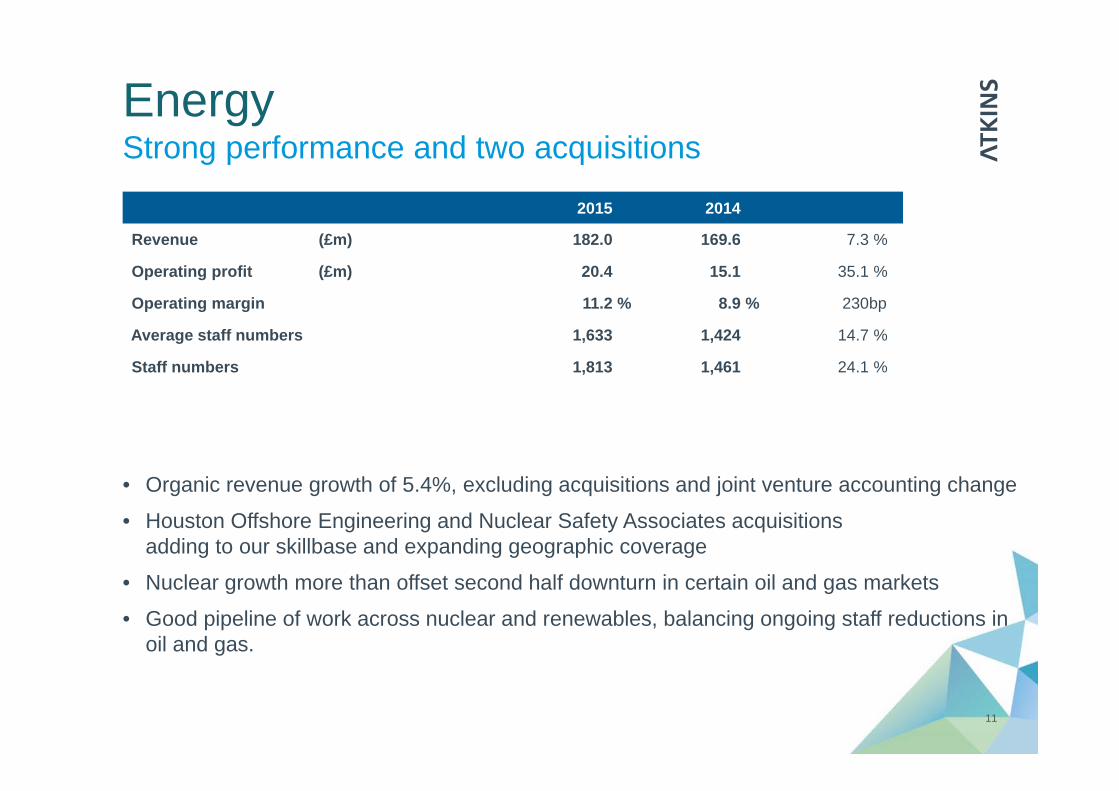
EnergyStrong performance and two acquisitions
11
2015 2014
Revenue (£m) 182.0 169.6 7.3 %
Operating profit (£m) 20.4 15.1 35.1 %
Operating margin 11.2 % 8.9 % 230bp
Average staff numbers 1,633 1,424 14.7 %
Staff numbers 1,813 1,461 24.1 %
• Organic revenue growth of 5.4%, excluding acquisitions and joint venture accounting change
• Houston Offshore Engineering and Nuclear Safety Associates acquisitions adding to our skillbase and expanding geographic coverage
• Nuclear growth more than offset second half downturn in certain oil and gas markets
• Good pipeline of work across nuclear and renewables, balancing ongoing staff reductions in oil and gas.
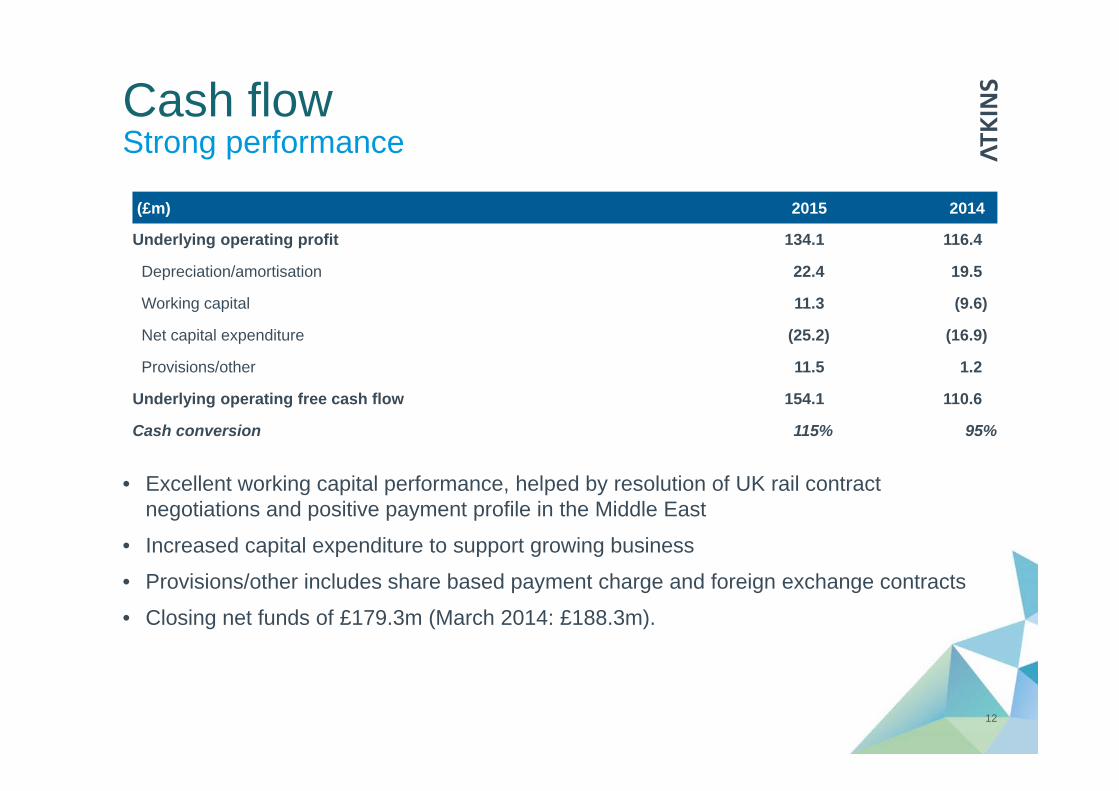
Cash flow
12
(£m) 2015 2014
Underlying operating profit 134.1 116.4
Depreciation/amortisation 22.4 19.5
Working capital 11.3 (9.6)
Net capital expenditure (25.2) (16.9)
Provisions/other 11.5 1.2
Underlying operating free cash flow 154.1 110.6
Cash conversion 115% 95%
• Excellent working capital performance, helped by resolution of UK rail contract negotiations and positive payment profile in the Middle East
• Increased capital expenditure to support growing business
• Provisions/other includes share based payment charge and foreign exchange contracts
• Closing net funds of £179.3m (March 2014: £188.3m).
Strong performance

Pension
• £238m IAS 19 deficit net of deferred tax at 31 March 2015 (March 2014: £258m)
• Strong asset performance and liability hedging offsetting impact of falling interest/discount rates
• Deficit repayment of £32m in 2014/15, thereafter escalating at 2.5% per annum.
13
Asset performance mitigates discount rate fall
342
249
206187
242217
263 258235 238
Sep2010
Mar2011
Sep2011
Mar2012
Sep2012*
Mar2013*
Sep2013*
Mar2014
Sep2014
Mar2015
IAS19 deficit net of deferred tax (£m)
* Restated for IAS19 revision
Summary
• Good results, improved margin and a strong cash performance
• Focus on three pillar strategy continues
• Outlook for 2015/16 is for continued underlying growth and performance in line with expectations.
14
Delivering the strategy

Uwe Krueger
Chief executive officer
15

Strategic progress
• Three pillar strategy is working: operational excellence, portfolio optimisation and sector/regional focus
• Operational excellence centres on margin improvement and cash generation
• Actions to increase shareholder value.
16
6.5 6.46.7
7.3
4.0
4.5
5.0
5.5
6.0
6.5
7.0
7.5
8.0
2012 2013 2014 2015
Operating margin (%)
68% 73%95%
115%
0%
50%
100%
150%
2012 2013 2014 2015
Cash flow conversion* (%)
Financial delivery
* Underlying operating free cash flow/underlying operating profit
7.6
7.3% excluding RDEC

Strategic progress
17
30.532.0
33.75
36.5
10.0
20.0
30.0
40.0
2012 2013 2014 2015
+5.2%+4.9%
+5.5%+8.1%
Creating shareholder value
Consistent dividend growth
79.082.6
85.7
97.1
30.0
40.0
50.0
60.0
70.0
80.0
90.0
100.0
2012 2013 2014 2015
+5.3%+4.6% +3.8%
+13.3%
Underlying diluted EPS growth
penc
e
penc
e

• Full year dividend up 8.1%
• HOE• NSA• Terramar
• SE Asia• Technology• Partnerships• Client
engagement
Progressive dividend policy
Capital allocation
18
Key priorities
Reinvest for organic growth
Acquisitions in line with our strategy

Acquisition strategy
19
Disciplined approach
• Organic growth remains our priority, augmented by appropriate M&A• Focused on additional skills, clients and/or geographic presence• Cultural fit and strategic alignment are critical considerations• Strong financial discipline with focus on shareholder value.

Looking forward
20

UK and Europe
• Ongoing Government support for UK infrastructure spend. National Infrastructure Plan 2014 supported by an investment pipeline of £460bn
• Well funded markets in rail, roads, water, airports and education
• Competitive landscape
21
Market drivers
Our priorities• Embed new operating structure
and cross sell our expertise • Enhance our offering through
technology eg Building Information Modelling (BIM) on HS2
• Work collaboratively both internally and with our clients.
Heathrow AirportTerminals 2 and 5 Delivery of IT outsourcing consultancy, programme and project management, systems development, mechanical + engineering services and telecoms consultancy across a range of projects.

North America
• Economic recovery creating demand for infrastructure
• Ageing legacy assets – investment growth expected after prolonged period of underfunding
• Long term Federal funding uncertainty
22
Market drivers
Our priorities• Focused revenue targeting• Client centric selling effort• Compete for larger design and
build projects (rail and metro in particular)
• Continue to drive productivity and reduce sub contracting through use of TPO.
Houston light railAtkins provides project management oversight for federally funded mass transit projects nationwide.

Middle East
• Energy-rich Governments pushing for economic diversification
• Growing populations and social expectations requiring transport infrastructure and creation of world-class cities
23
Market drivers
Our priorities• Deliver on major programmes
in growth markets• Client advisory services• Continual drive for operational
excellence• Remaining adaptive to external
market influences, oil price and budgetary impacts.
CPOQatarAtkins’ role is to co-ordinate current and planned road, rail, metro and other major transport and infrastructure projects, as part of Qatar’s 2030 vision.

Asia Pacific
• Acceleration and scale of urbanisation drives unprecedented infrastructure spend
• Significant lack of infrastructure in SE Asia and limited funding resources demand cost effective solutions
• Outbound investment by Chinese contractors and state-owned enterprises
24
Market drivers
Our priorities• Grow organically and
through acquisition in region• Build on our programme
management capability• Further develop relationships
with the Chinese contractors• Leverage our global design
centres in Bangalore and Delhi.
Aerospace CityMalaysiaAtkins has completed the concept design and masterplan for the Asia Aerospace City (AAC) in Subang, Malaysia.

Energy
• Population and income growth for both developing and developed nations
• Strengthening consensus on the need to address climate change via nuclear, renewables and prioritising gas over oil development
25
Market drivers
Our priorities• Short term resource
management in oil and gas• Grow in the Middle East• Enhance our offering with skills
acquired through NSA and HOE• Increase our involvement in new
build activity via a strengthened design capability
• Partnerships.
Renewable energy
We provide engineering design services to DONG Energy, the world’s leading offshore wind developer, for three offshore substations at its proposed HornseaProject One offshore wind farm.
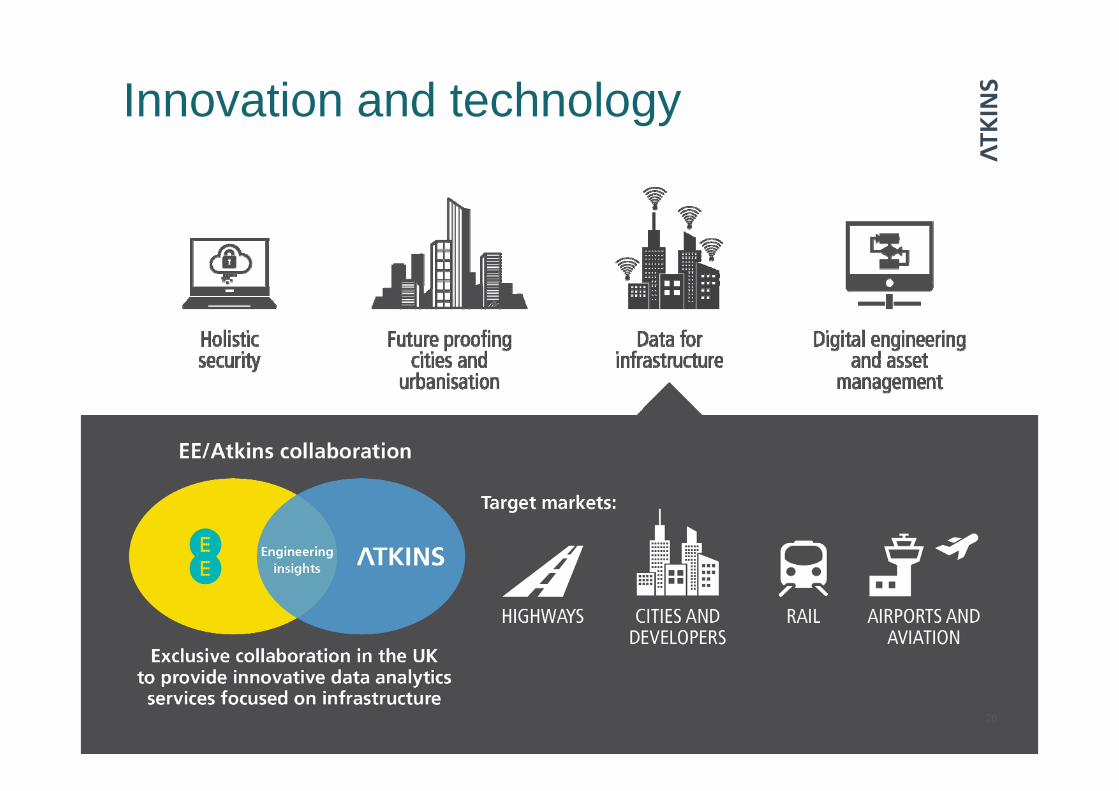
Innovation and technology
26

Our people
27
• Diverse Board• Women account for 30% of promotions in the UK• UK and Europe improved gender diversity to over 25%• Over 40% of vacancies in Asia Pacific were filled by women• Women account for over 50% of graduate engineers in the global design
centre (GDC)• Energy increased the number of new female recruits in the UK from
18% to 24%• Founder member of the 5% club (currently at 8.9% in the UK).

Summary
• Our strategy is delivering through:
• operational excellence
• portfolio optimisation
• sector/regional focus
• Objective to deliver profitable growth by addressing strategic priorities in our selected markets
• Margin progression has continued towards our 8% goal and the outlook remains positive.
28
Delivering the strategy

Appendices
29

Profit bridge
30
Underlying profit before tax
114.2
106.4
121.9
106.7
10.5
2.7
5.0
12.7
2.2 0.4
6.9
1.5
4.4
2.8
2013/14Reported
Profit ondisposal
Amortisationof intangibles
2013/14Underlying
RDEC Businessperformance
Other 2014/15Underlying
Profit ondisposal
Amortisationof intangibles
Deferredacquisitionpayments
Transactioncosts
Nedtechimpairment
2014/15Reported

Segmental summary
31
£m Revenue Operating profit/(loss) Operating margin
UK and Europe 904 60.7 6.7 %
North America 341 20.0 5.9 %
Middle East 217 22.5 10.4 %
Asia Pacific 110 9.8 8.9 %
Energy 182 20.4 11.2 %
Total for segments 1,754 133.4 7.6 %
Joint ventures included above - (0.1)
Total before unallocated items 1,754 133.3 7.6 %
Unallocated central items 3 (14.8)
Total for Group 1,757 118.5 6.7 %
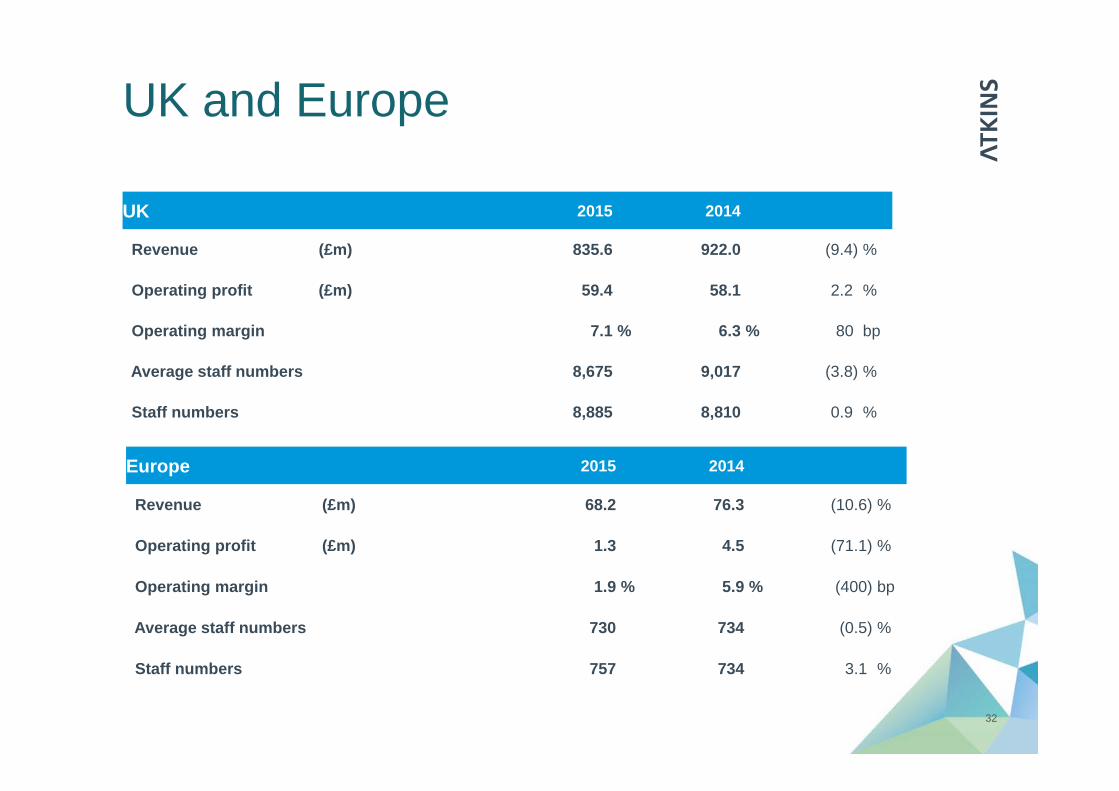
UK and Europe
32
UK 2015 2014
Revenue (£m) 835.6 922.0 (9.4) %
Operating profit (£m) 59.4 58.1 2.2 %
Operating margin 7.1 % 6.3 % 80 bp
Average staff numbers 8,675 9,017 (3.8) %
Staff numbers 8,885 8,810 0.9 %
Europe 2015 2014
Revenue (£m) 68.2 76.3 (10.6) %
Operating profit (£m) 1.3 4.5 (71.1) %
Operating margin 1.9 % 5.9 % (400) bp
Average staff numbers 730 734 (0.5) %
Staff numbers 757 734 3.1 %
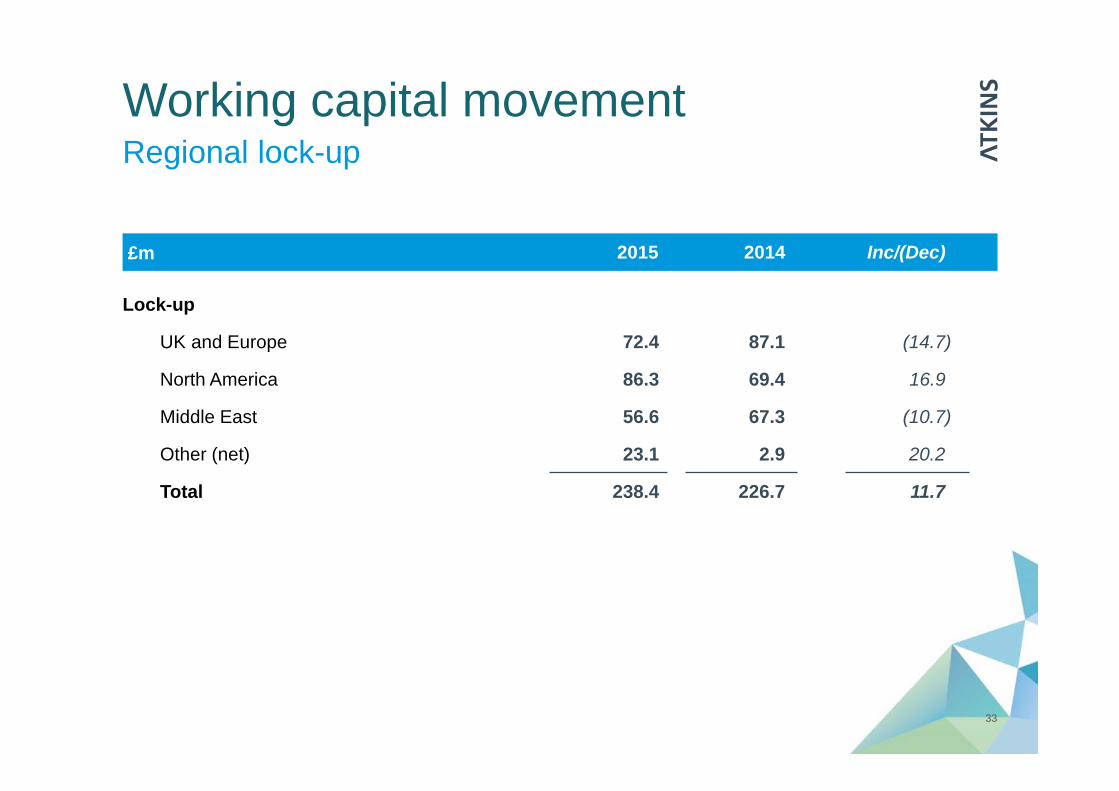
Working capital movement
33
Regional lock-up
£m 2015 2014 Inc/(Dec)
Lock-up
UK and Europe 72.4 87.1 (14.7)
North America 86.3 69.4 16.9
Middle East 56.6 67.3 (10.7)
Other (net) 23.1 2.9 20.2
Total 238.4 226.7 11.7

Disclaimer
The information in this presentation pack, which does not purport to be comprehensive, has been provided by Atkins and has not been independently verified. While this information has been prepared in good faith, no representation or warranty, express or implied, is or will be made and no responsibility or liability is or will be accepted by Atkins as to or in relation to the accuracy or completeness of this presentation pack or any other written or oral information made available as part of the presentation and any such liability is expressly disclaimed. Further, whilst Atkins may subsequently update the information made available in this presentation, we expressly disclaim any obligation to do so
The presentation contains indications of likely future developments and other forward-looking statements that are subject to risk factors associated with, among other things, the economic and business circumstances occurring from time to time in the countries, sectors and business segments in which the Group operates. These and other factors could adversely affect the Group’s results, strategy and prospects. Forward-looking statements involve risks, uncertainties and assumptions. They relate to events and/or depend on circumstances in the future which could cause actual results and outcomes to differ materially from those currently expected. No obligation is assumed to update any forward-looking statements, whether as a result of new information, future events or otherwise.
34