2015 01 infra_reit_website_s11
TRANSCRIPT
InfraREIT, Inc.January 29, 2015

Forward Looking Statements
These presentations contain “forward-looking statements” about the business, financial performance, contracts, leases and prospects of
InfraREIT, L.L.C. and, following the merger of InfraREIT, L.L.C. with and into InfraREIT, Inc., InfraREIT, Inc. (the “Company”). Words such
as “could,” “will,” “may,” “assume,” “forecast,” “position,” “predict,” “strategy,” “expect,” “intend,” “plan,” “estimate,” “anticipate,” “believe,”
“project,” “budget,” “potential” or “continue” and similar expressions are used to identify forward-looking statements, although not all
forward-looking statements contain such identifying words. These forward-looking statements are based on management’s current
expectations and assumptions about future events and are based on currently available information as to the outcome and timing of future
events. The Company’s actual results, performance or achievements could differ materially from those expressed or implied by such
statements. The Company’s capabilities or performance, stockholder value as well as any other statements that are not historical facts in
this presentation are forward-looking statements that involve certain risks and uncertainties, many of which are difficult to predict and
beyond the Company’s control. Factors that could cause actual results to differ materially from the results contemplated by such forward-
looking statements include, without limitation, risks that the projects the Company expects will not materialize for a variety of reasons,
including as a result of reductions in oil and gas drilling and related activity in the Permian Basin due to lower oil and gas prices relative to
our current expectations; the Company’s ability to acquire T&D assets on terms that are accretive to stockholders; the Company’s current
reliance on its tenant for all of the Company’s revenues and, as a result, the Company’s dependency on its tenant’s solvency and
financial and operating performance; defaults on or non-renewal or early termination of leases by the Company’s tenant; risks related to
future lease negotiations; changes in the regulated rates the tenants of the Company’s assets may charge their customers; the
completion of the Company’s capital expenditure projects on time and on budget; competitive conditions for the development and
acquisition of T&D assets; insufficient cash available to meet distribution requirements; the price and availability of debt and equity
financing; increased interest rates; changes in the availability and cost of capital; the Company’s level of indebtedness or debt service
obligations; changes in governmental policies or regulations with respect to the Company’s permitted capital structure, acquisitions and
dispositions of assets, recovery of investments and the Company’s authorized rate of return; weather conditions and other natural
phenomenal the effects of existing and future tax and other laws and governmental regulations; the Company’s failure to qualify or
maintain its status as a REIT; availability of qualified personnel; the termination of the Company’s management agreement or
development agreement or the loss of the services of the Company’s manager or the loss of access to the development function of the
Company’s developer; the effects of future litigation; changes in the tax laws applicable to REITs; adverse economic developments in the
electric power industry; changes in general business and economic conditions, particularly in Texas; and certain factors discussed
elsewhere in the Company’s prospectus. When considering forward-looking statements, you should keep in mind the risk factors and
other cautionary statements described under the heading “Risk Factors” included in the Company’s prospectus. Should one or more of
these risks or uncertainties materialize, or should underlying assumptions prove incorrect, actual results may vary materially from those
indicated. This presentation speaks only as of the date hereof, and the Company disclaims any obligation to update or revise any
forward-looking statements, whether as a result of new information, future events or otherwise, except as required by law.
2

Introduction to InfraREIT
High-growth company focused on owning electric transmission & distribution
(T&D) infrastructure assets in the U.S., with an emphasis on the Texas market
and the Southwest
Unique opportunity to invest in a rapidly expanding, dividend-focused business
Significant growth opportunities in our current service territories that we expect
will facilitate the double-digit growth in Cash Available for Distribution,
complemented by a robust pipeline of development projects and potential
acquisition opportunities
Experienced management team
Closely aligned with Hunt, our development partner and long-term investor 3

Attractive Asset
Portfolio
Stable Cash Flow
Strong Track
Record
Constructive
Regulatory
Environment
Efficient Structure
High-Growth
Opportunities
~$1.1 bn in regulated electric T&D assets (rate base)
Transmission assets currently comprise ~75% of rate base
100% of revenue driven by regulated asset base
REIT revenue governed by multi-year leases
Increased rate base from $60 mm in 2009 to ~$1.1 bn in 2014
Successfully developed 300 miles and 4 substations of CREZ
transmission system
Closed acquisitions and completed rate case under REIT structure
Constructive T&D regulatory framework in Texas
Texas regulation supportive of REIT structure
Ability to do interim rate filings minimizes regulatory lag
REIT structure enables structurally advantaged cash generation
Hunt is highly aligned with shareholders
Footprint Projects expected to enable >10% CAD / share CAGR through
2018
Robust pipeline of ROFO projects, other T&D projects from Hunt and 3rd
party acquisitions
Target CAD / share CAGR of 10% - 15% through 2018
Investment Highlights
4

Hunt Consolidated: A Proven Energy Developer
Founded in 1934, the Hunt Oil Company and Hunt Consolidated (a diversified
holding company managed by the Ray L. Hunt family) are actively engaged in
energy and infrastructure businesses throughout the world
Hunt has a long history of entrepreneurial activity and a successful track record
in developing and constructing large complex projects, such as the Texas CREZ
project
Hunt has successfully partnered with large multinationals, international partners,
and governments, and has a presence in 14 countries around the world
5

Strategic Sponsor with Long-Term Alignment
Pro-forma for the offering, Hunt will own approximately 27.1%(1) of the
Company (common stock and operating units)
Lock-up agreements in respect of common stock and operating units
Incentive distribution feature in the management agreement
Hunt is required to offer specific development projects (ROFO Projects)
to InfraREIT
6
Hunt intends for InfraREIT to be the primary owner of Hunt’s future T&D
development projects
Through its ownership and its agreements as manager (Hunt
Manager) and developer (Hunt Developer), Hunt is highly aligned
with InfraREIT shareholders
(1) Assumes $23 IPO price. See “Principal Stockholders” in the prospectus.

Attractive Asset Profile
7
Dallas
Austin
San Antonio
Houston
El Paso
Amarillo
Texas
StantonCeleste
Brady
McAllen
Railroad DC Tie
Service Territory
Panhandle Transmission
Railroad DC Tie
PanhandleTransmission
~75% of our rate base
~ 620 miles
Transmission
Operations Center
Railroad DC Tie with
Mexico (300 MW)
Distribution ~25% of our rate base
~10,500 miles
Over 50,000 electric
delivery points

Constructive Regulatory Environment
8
2014 Rate Case Settlement: 9.7% allowed ROE and 55% debt / 45% equity
ERCOT
Texas has its own electrical grid managed by the Electric
Reliability Council of Texas (ERCOT)
Electric utilities are subject to regulation by the Public Utility
Commission of Texas (PUCT)
Transmission revenue requirement can be updated through
a rate case or an interim Transmission Cost of Service
(TCOS) filing (twice per year)
Distribution rates typically updated through a rate case
State government and regulators focused on further
enabling the growth of the Texas economy by providing
reliable and inexpensive electric service
REIT structure approved by the PUCT

Proven Results & Track Record
9
0
250
500
750
1,000
Rate Base $ millions
2009 2014-Q3
$60 mm
$1,100 mm
25%
75%
Distribution Transmission
The CREZ Project, capital expenditures and acquisitions have enabled us to
significantly grow our business, with a heavy focus on Transmission
2014 Rate Base
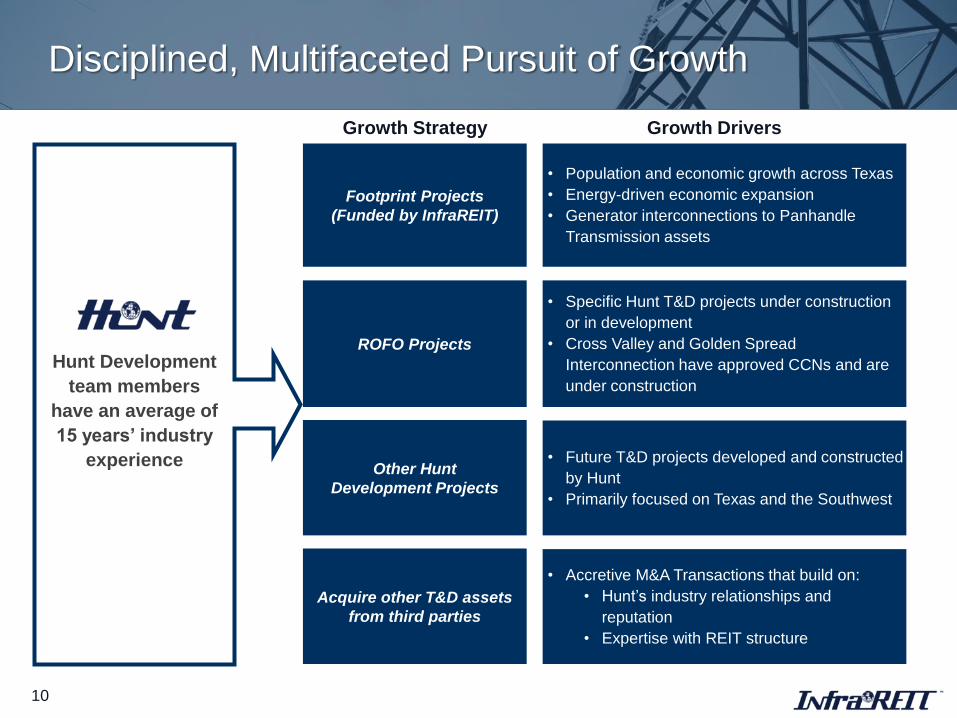
Disciplined, Multifaceted Pursuit of Growth
10
Footprint Projects
(Funded by InfraREIT)
Hunt Development
team members
have an average of
15 years’ industry
experience
ROFO Projects
Growth Strategy Growth Drivers
• Population and economic growth across Texas
• Energy-driven economic expansion
• Generator interconnections to Panhandle
Transmission assets
• Specific Hunt T&D projects under construction
or in development
• Cross Valley and Golden Spread
Interconnection have approved CCNs and are
under construction
• Accretive M&A Transactions that build on:
• Hunt’s industry relationships and
reputation
• Expertise with REIT structure
• Future T&D projects developed and constructed
by Hunt
• Primarily focused on Texas and the Southwest
Other Hunt
Development Projects
Acquire other T&D assets
from third parties

Renewable Energy Development and Interconnection in the Panhandle
and South Plains (CREZ Project)
Connects high-potential renewables zones to the North and Central Texas
load pockets
ERCOT reports 6,266 MW of new capacity in the Panhandle that has
signed generation interconnection requests
The GSEC Interconnection (ROFO Project) connects to Panhandle
Transmission Lines
Economic Expansion in West Texas
Investment required to ensure reliability and meet identified customer
requirements
Midland County population grew by 30.6% between 2000-2013 and is
projected to grow by 16.4% between 2013-2023
Regional electricity usage has grown rapidly; significant unmet needs
Economic and Population Growth in South Texas
Sharyland’s McAllen service area and Railroad DC Tie benefit from strong
population growth in the Rio Grande Valley and expanding economic
activity on both sides of the Texas and Mexico border
Track record and relationships in South Texas contributed to Cross Valley
Transmission Line (ROFO Project) opportunity
Economic Drivers of Footprint Growth
11 Source: ERCOT, US Census Bureau, Texas State Data Center
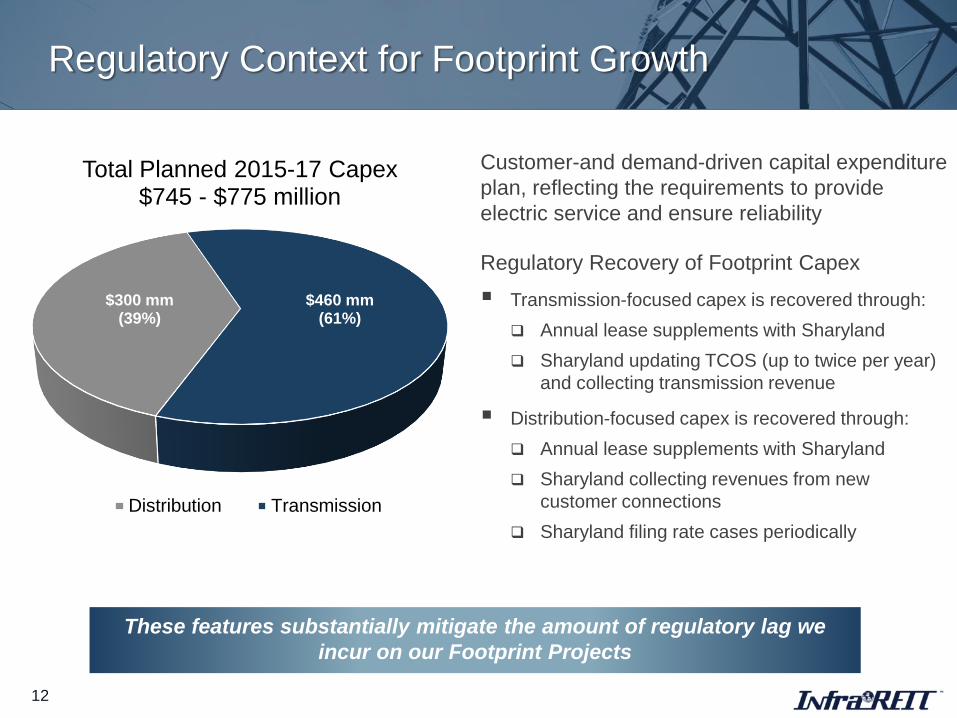
Customer-and demand-driven capital expenditure
plan, reflecting the requirements to provide
electric service and ensure reliability
Regulatory Recovery of Footprint Capex
Transmission-focused capex is recovered through:
Annual lease supplements with Sharyland
Sharyland updating TCOS (up to twice per year)
and collecting transmission revenue
Distribution-focused capex is recovered through:
Annual lease supplements with Sharyland
Sharyland collecting revenues from new
customer connections
Sharyland filing rate cases periodically
Regulatory Context for Footprint Growth
12
These features substantially mitigate the amount of regulatory lag we
incur on our Footprint Projects
$300 mm(39%)
$460 mm(61%)
Total Planned 2015-17 Capex$745 - $775 million
Distribution Transmission

Robust Pipeline of Development Projects
13
NV
CA
OK
TX
AZNM
MEXICO
Additional U.S. –
Mexico DC Ties
Additional South Texas
Transmission / Generation
Interconnections
Import capacity from
New Mexico and
Arizona to California
PJM and MISO
interconnection
ERCOT
Southeast Loop
Transmission
Line
South Plains
Reinforcement
NM
TX
AZ
NV
CA
M E X I C O
ROFO
Project
Estimated
Project CostExpected
Completion Status
Cross
Valley Line $160-$185mm 2016
Under
construction
GSEC Inter-
connection$100-$120mm 2016
Under
construction
Southline $700-$800mm --Draft EIS
Published
Verde $60-$80mm --In
development
Southline
Transmission
Project
Verde Transmission
Project
Cross Valley
Transmission Line
Golden Spread
Electric Coop
(GSEC)
Interconnection
Lubbock Power & Light
Interconnection
Under Construction Other ROFO Additional Development Opportunities
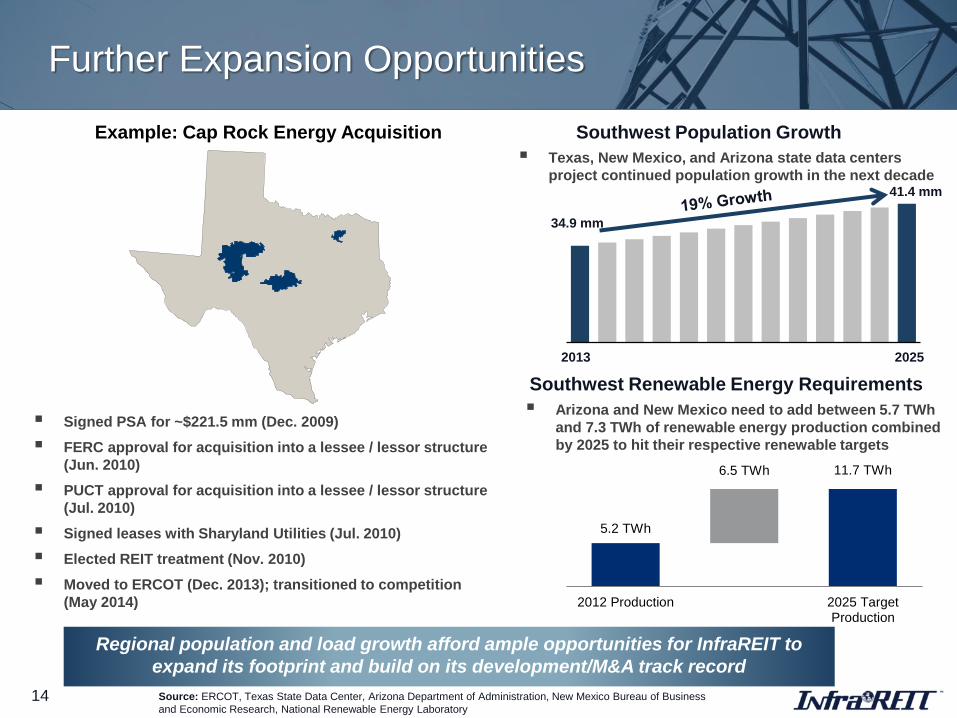
Further Expansion Opportunities
14
Southwest Renewable Energy Requirements
5.2 TWh
11.7 TWh6.5 TWh
2012 Production 2025 TargetProduction
Arizona and New Mexico need to add between 5.7 TWh
and 7.3 TWh of renewable energy production combined
by 2025 to hit their respective renewable targets
Southwest Population Growth
Regional population and load growth afford ample opportunities for InfraREIT to
expand its footprint and build on its development/M&A track record
Source: ERCOT, Texas State Data Center, Arizona Department of Administration, New Mexico Bureau of Business
and Economic Research, National Renewable Energy Laboratory
Example: Cap Rock Energy Acquisition
Signed PSA for ~$221.5 mm (Dec. 2009)
FERC approval for acquisition into a lessee / lessor structure
(Jun. 2010)
PUCT approval for acquisition into a lessee / lessor structure
(Jul. 2010)
Signed leases with Sharyland Utilities (Jul. 2010)
Elected REIT treatment (Nov. 2010)
Moved to ERCOT (Dec. 2013); transitioned to competition
(May 2014)
Texas, New Mexico, and Arizona state data centers
project continued population growth in the next decade
34.9 mm
41.4 mm
2013 2025

Board Structure
Management
Related Party
Transactions
Management
Agreement
9 total members, 6 independent
CEO, CFO and GC are officers of InfraREIT and Hunt Manager
Require majority approval by the independent board members
(i.e. ROFO Project acquisitions)
Hunt Manager responsible for day-to-day business and legal
activities of InfraREIT
Annual base fee equal to $10 million through March 31, 2015,
$13.1 million for April 1, 2015 through March 31, 2016, and
1.50% of total equity as of the previous year thereafter
Incentive fee equal to 20% of operating partnership distributions
per unit in excess of the Threshold Distribution Amount (120% of
initial distribution) payable quarterly
2015 distribution per unit: $0.225 quarterly
Threshold Distribution: $0.270 quarterly
Governance & Management
15
SDTS(2)
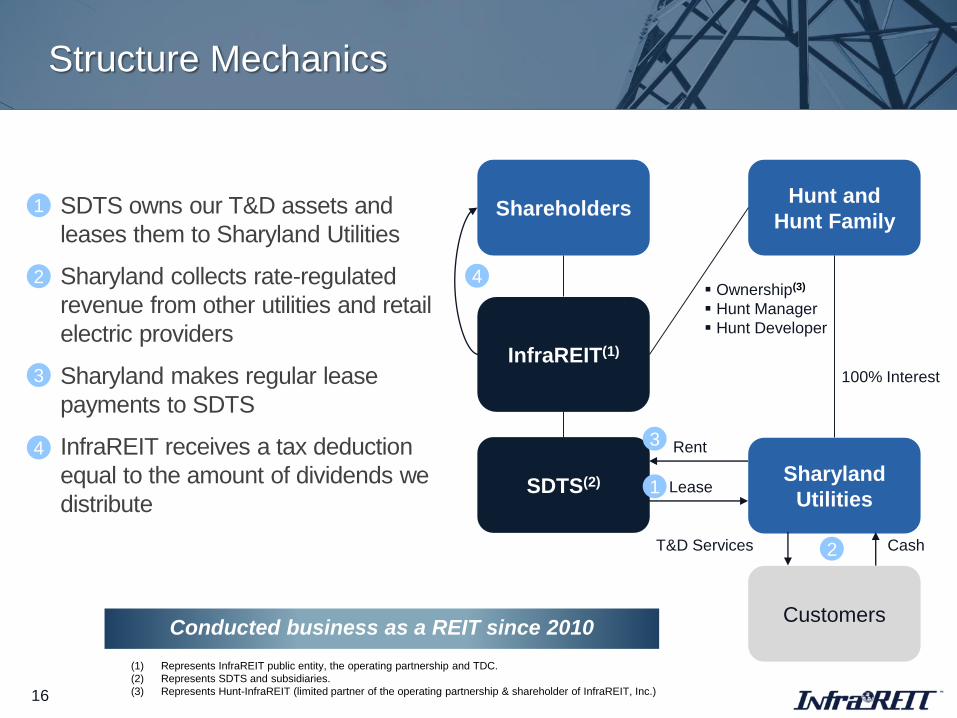
Structure Mechanics
16
SDTS owns our T&D assets and
leases them to Sharyland Utilities
Sharyland collects rate-regulated
revenue from other utilities and retail
electric providers
Sharyland makes regular lease
payments to SDTS
InfraREIT receives a tax deduction
equal to the amount of dividends we
distribute
1
2
3
4
Shareholders
InfraREIT(1)
Hunt and
Hunt Family
Sharyland
Utilities
Customers
T&D Services Cash
Lease
Rent
1
2
3
4 Ownership(3)
Hunt Manager
Hunt Developer
100% Interest
(1) Represents InfraREIT public entity, the operating partnership and TDC.
(2) Represents SDTS and subsidiaries.
(3) Represents Hunt-InfraREIT (limited partner of the operating partnership & shareholder of InfraREIT, Inc.)
Conducted business as a REIT since 2010
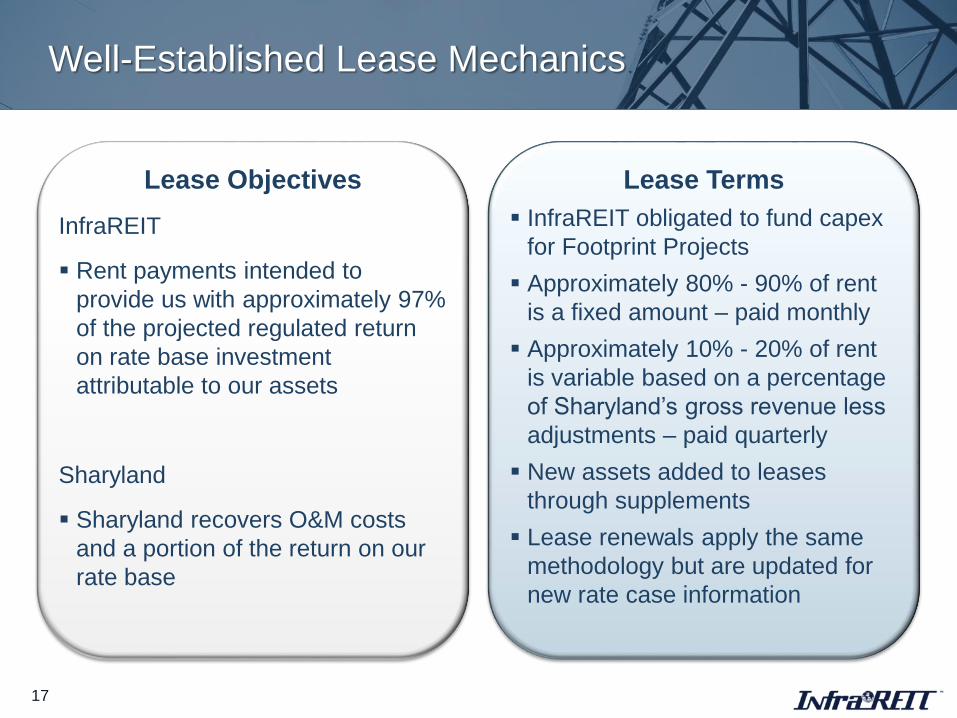
Well-Established Lease Mechanics
17
Lease Terms
InfraREIT obligated to fund capex
for Footprint Projects
Approximately 80% - 90% of rent
is a fixed amount – paid monthly
Approximately 10% - 20% of rent
is variable based on a percentage
of Sharyland’s gross revenue less
adjustments – paid quarterly
New assets added to leases
through supplements
Lease renewals apply the same
methodology but are updated for
new rate case information
Lease Objectives
InfraREIT
Rent payments intended to
provide us with approximately 97%
of the projected regulated return
on rate base investment
attributable to our assets
Sharyland
Sharyland recovers O&M costs
and a portion of the return on our
rate base

Building Our Income Statement
18
Lease Revenue
Less: Corporate SG&A
Less: Depreciation
Operating Income
Less: Interest Expense
Less: Income Tax Expense
Net Income
A
B
C
D
E
Approximately 97% of regulated return on rate base
(traditional utility model)
Primarily management fee, public company costs and
professional fees at InfraREIT
PUCT-approved depreciation rates on our assets
InfraREIT consolidated interest expense
As a REIT, corporate taxes applied to net taxable income,
less deduction for dividends paid
A
B
C
D
E

Financing Strategy
19
Focus on Regulated
T&D Opportunities
Maintain Strong Balance Sheet
Grow Dividends
Sign long-term leases
that reflect regulated
rate structure
Minimize regulatory
lag with prudent rate
case / TCOS filings
80% - 85% long-term
CAD payout ratio
Construct Footprint
Projects
Acquire ROFO Projects
Acquire Other Hunt
Development Projects
Opportunistically
acquire other T&D
assets
Target consolidated credit metrics of 60% Debt / Capitalization and 12% FFO / Debt
Maintain 55% Debt / Capitalization at regulated subsidiary
Maintain significant liquidity to support capex plan and financial flexibility

Robust CAD & Dividend Growth Targets
20
Targeting a 10% - 15% CAGR of CAD /
share from 2015-18
Expect to achieve the lower half of
the range based on Footprint Projects
Ability to exceed the midpoint of the
range through accretive acquisitions
of Cross Valley Line and GSEC
Interconnection
Ability to achieve the top of the range
through the successful development
and acquisition of Southline, other
significant third-party acquisitions, or
additional Footprint Projects
Cash Available for Distribution (CAD) per Share(1)
$ millions
$1.07
0.002015E 2018E
($/S
ha
re)
(2)
10%+
15%
CAD/Share
CAGR
(1) See appendix for more detail on calculation of estimated CAD for 2015
(2) Based upon a total of 44,014,971 shares and 60,593,728 OP units outstanding after this offering and the reorganization.

Attractive Asset
Portfolio
Stable Cash Flow
Strong Track
Record
Constructive
Regulatory
Environment
Efficient Structure
High-Growth
Opportunities
~$1.1 bn in regulated electric T&D assets (rate base)
Transmission assets currently comprise ~75% of rate base
100% of revenue driven by regulated asset base
REIT revenue governed by multi-year leases
Increased rate base from $60 mm in 2009 to ~$1.1 bn in 2014
Successfully developed 300 miles and 4 substations of CREZ
transmission system
Closed acquisitions and completed rate case under REIT structure
Constructive T&D regulatory framework in Texas
Texas regulation supportive of REIT structure
Ability to do interim rate filings minimizes regulatory lag
REIT structure enables structurally advantaged cash generation
Hunt is highly aligned with shareholders
Footprint Projects expected to enable >10% CAD / share CAGR through
2018
Robust pipeline of ROFO projects, other T&D projects from Hunt and 3rd
party acquisitions
Target CAD / share CAGR of 10% - 15% through 2018
Investment Highlights
21
Appendix
22

Estimated Cash Available for Distribution
23
Estimated Cash Available for Distribution for the twelve months ending December 31, 2015 (1)
$ millions2015
Net Income Before Noncontrolling Interest 5.7
Add: Depreciation 40.0
Funds from Operations Before Noncontrolling Interest (2) 45.7
Add: Amortization of Deferred Financing Cost 3.1
Add: Non-cash consideration paid in Class A OP units 9.1
Add: Non-cash equity compensation 0.6
Less: Allowance for Funds Used During Construction – Equity (1.3)
Add (Less): Effect of Straight-line Rents 7.9
Less: Capital Expenditures to Maintain Net Assets (40.0)
Add: Reorganization expenses 39.6
Cash Available for Distribution 64.7
Less: Growth Capital Expenditures – Footprint (208.3)
Add: Financing Required to Fund Growth Capital Expenditures and Principal Amortization 208.3
Estimated Cash Available for Distribution After Investing and Financing Activities (CAD) 64.7
Average Shares Outstanding (mm of shares) 60.6
CAD / Share 1.07
CAD Payout Ratio 84.3%
Dividend / Share 0.90
(1) Estimates are for Footprint Projects only (no ROFO Projects are included). Estimated Cash Available for Distribution is based on numerous
assumptions and subject to the risks described in the prospectus. See “Distribution Policy” and “Risk Factors” in the prospectus.
(2) For a discussion of Funds from Operations Before Noncontrolling Interest, see slide 26

Debt Obligations & Available Liquidity
24
Long-Term Debt (rate / maturity)
($ millions)
Outstanding
As of Sept. 30, 2014
TDC Senior Secured Notes
(8.50% / December 30, 2020)$ 20.3
SBC Senior Secured Notes
(6.47% / September 30, 2030)106.6
McAllen Senior Secured Notes
(7.25% / December 30, 2029)46.7
CREZ Term Loan Facility
(2.41%(1) / June 20, 2018)400.9
CREZ Senior Secured Fixed Rate Note
(5.04% / June 20, 2018)60.0
Total $ 634.5
Post-IPO Facilities
Liquidity Facilities
($ millions)
Total
Amount
Outstanding
Post-OfferingAvailable
InfraREIT Partners Revolver $ 75 $ 0 $ 75
SDTS Revolver 250 0 250
Total $ 325 $ 0 $ 325
(1) CREZ term loan accrues interest at LIBOR plus 2.25% for a period of three years, at which point the interest rate
will increase to LIBOR plus 2.50%.

Lease Summary
25
Leases
Lease
Expiration
Date
Total Electric
Plant
($ mm) (1)
Summary of Assets
CREZ Lease 12/31/2020 $644Substantially all of our Panhandle
transmission assets
S/B/C Lease 12/31/2015 290
Our T&D assets located in and around
Stanton, Brady and Celeste, Texas, other
than our 138 kV transmission loop
Other Leases (2) 12/31/2019 –
12/31/2022184
Our assets located in South Texas, including
our Railroad DC Tie, our transmission
operation centers in Amarillo, Texas; our 138
kV transmission line that loops around our
Stanton, Texas territory; and a small portion
of our Panhandle transmission assets
(1) Consists of electric plant, net for the applicable lease as of September 30, 2014.
(2) Includes McAllen Lease, Stanton Transmission Loop Lease and ERCOT Transmission Lease

Non-GAAP Legend
In this prospectus, we refer to “Funds from Operations,” which is a financial measure that is derived on the basis of
methodologies other than in accordance with U.S. GAAP. In this prospectus, when we use the phrase “before noncontrolling
interest” to modify net income or Funds from Operations, we are referring to the applicable amount of net income or Funds
from Operations, in each case before any reduction to such item as a result of the noncontrolling interest in our Operating
Partnership. The National Association of Real Estate Investment Trusts, or NAREIT, defines Funds from Operations as net
income (computed in accordance with GAAP), excluding gains and losses from sales of property (net) and impairments of
depreciated real estate, plus real estate depreciation and amortization (excluding amortization of deferred financing costs) and
after adjustments for unconsolidated partnerships and joint ventures. Applying the NAREIT definition to our financial
statements results in Funds from Operations representing net income before net income attributable to noncontrolling interest,
depreciation, impairment of assets and gain (loss) on sale of assets. Funds from Operations does not represent cash
generated from operations as defined by GAAP and it is not indicative of cash available to fund all cash needs, including
distributions.
Our management uses Funds from Operations before noncontrolling interest as an important supplemental measure of our
operating performance. We use this metric before noncontrolling interest as we feel it is important to evaluate our entire
consolidated business. This performance measure provides perspectives not immediately apparent from net income. We
consider Funds from Operations to be an important supplemental disclosure of operating performance for an equity REIT due
to their widespread acceptance and use among REITs. In addition, we believe that Funds from Operations is frequently used
by securities analysts, investors and other interested parties in the evaluation of REITs. We offer this measure to assist the
users of our financial statements in assessing our operating performance under GAAP, but this measure is non-GAAP
measures and should not be considered a measure of liquidity, alternatives to net income or indicators of any other
performance measure determined in accordance with GAAP, nor is it indicative of funds available to fund our cash needs,
including capital expenditures, make payments on our indebtedness or make distributions. However, our method of calculating
Funds from Operations may be different from methods used by other companies and, accordingly, may not be comparable to
similar measures as calculated by other companies that do not use the same definition or implementation guidelines or
interpret the standards differently from us. Investors should not rely on Funds from Operations as a substitute for any GAAP
measure, including net income, cash flows provided by operating activities or revenues.
26