2014_nguyen et al._the journal of supercritical fluids
TRANSCRIPT
Cp
THa
b
c
a
ARR2A
KLLCHBN
1
opaccdamvbbpcL[
u
(
0h
J. of Supercritical Fluids 86 (2014) 67– 75
Contents lists available at ScienceDirect
The Journal of Supercritical Fluids
jou rn al hom epage: www.elsev ier .com/ locate /supf lu
atalytic depolymerisation and conversion of Kraft lignin into liquidroducts using near-critical water
hi Dieu Huyen Nguyena, Marco Maschietti a,∗, Tallal Belkheirib, Lars-Erik Åmandb,ans Theliandera, Lennart Vamlingb, Lars Olaussonc, Sven-Ingvar Anderssona
Chalmers University of Technology, Department of Chemical and Biological Engineering, SE-412 96 Gothenburg, SwedenChalmers University of Technology, Department of Energy and Environment, SE-412 96 Gothenburg, SwedenMetso Power AB, Box 8734, SE-402 75 Gothenburg, Sweden
r t i c l e i n f o
rticle history:eceived 4 October 2013eceived in revised form6 November 2013ccepted 27 November 2013
a b s t r a c t
A high-pressure pilot plant was developed to study the conversion of LignoBoost Kraft lignin into bio-oiland chemicals in near-critical water (350 ◦C, 25 MPa). The conversion takes place in a continuous fixed-bed catalytic reactor (500 cm3) filled with ZrO2 pellets. Lignin (mass fraction of approximately 5.5%) isdispersed in an aqueous solution containing K2CO3 (from 0.4% to 2.2%) and phenol (approximately 4.1%).The feed flow rate is 1 kg/h (reactor residence time 11 min) and the reaction mixture is recirculated inter-nally at a rate of approximately 10 kg/h. The products consist of an aqueous phase, containing phenolic
eywords:igninignoBoostatalytic conversionydrothermal conversionio-oil
chemicals, and a bio-oil, showing an increased heat value (32 MJ/kg) with respect to the lignin feed. The1-ring aromatic compounds produced in the process are mainly anisoles, alkylphenols, guaiacols andcatechols: their overall yield increases from 17% to 27% (dry lignin basis) as K2CO3 is increased.
© 2013 Elsevier B.V. All rights reserved.
ear-critical water
. Introduction
After cellulose, lignin is the second most abundant naturalrganic polymer found on earth, being the first among those com-osed of aromatic units (phenylpropane monomer units). A vastmount of lignin is extracted from wood in the Kraft pulping pro-ess and thereby ends up in the black liquor. Today this liquor isoncentrated by means of evaporation and used as fuel in the pro-uction of heat and power for the pulping process itself. So far only
small proportion of the lignin (approx. 1%) has been used as a rawaterial in the production of materials and chemicals with a higher
alue than fuel. A new process called “LignoBoost” has recentlyeen developed with the aim of extracting part of the lignin in thelack liquor at a high purity level, thus exploiting the energy sur-lus of Kraft pulp mills. The LignoBoost process has recently gainedommercial status; therefore, in years to come, a huge amount ofignoBoost Kraft lignin is expected to be available for valorisation
1,2].Lignin is an amorphous biopolymer whose primary aromaticnits are linked together randomly by different types of ether
∗ Corresponding author. Tel.: +46 031 772 2989; fax: +46 031 772 2995.E-mail addresses: [email protected], [email protected]
M. Maschietti).
896-8446/$ – see front matter © 2013 Elsevier B.V. All rights reserved.ttp://dx.doi.org/10.1016/j.supflu.2013.11.022
(C O C) and carbon–carbon (C C) bonds [3]. Its chemical structuresuggests that this biopolymer could be a good source of liquid fueladditive and commercially important chemicals, phenolics in par-ticular, if it could be broken down into smaller molecular units thatretain the oxy-aromatic nature [4,5]. In the quest to reach this goal,several processes for depolymerisation and conversion of differenttypes of lignin have been investigated for decades, such as pyrolysis,which uses thermal treatment in the absence of air, hydrogenolysis,which is a thermal process in the presence of gaseous hydrogen or ofa hydrogen-donating solvent, and oxidative cracking, which occursin the presence of oxidising agents such as hydrogen peroxide [5].
More recently, it has been demonstrated that lignin can bedepolymerised and converted into smaller molecular units insupercritical water. This process was, for example, carried out bySaisu et al. [6] at 400 ◦C without using a catalyst: they found that theyield of monomeric phenolic compounds was lower than expected.This was probably due to the re-polymerisation of monomers,resulting in the formation of char. Many authors [6–8] have how-ever found that adding phenol to the reacting system decreases theformation of char. The effect of phenol in particular was studied indetail by Fang et al. [8], who decomposed lignin in supercritical
water at temperatures between 400 ◦C and 600 ◦C in a micro-reactor. More specifically, according to these authors, phenol allowsthe system to become homogeneous at the reaction conditions andprevents the re-polymerisation reactions, which lead to char being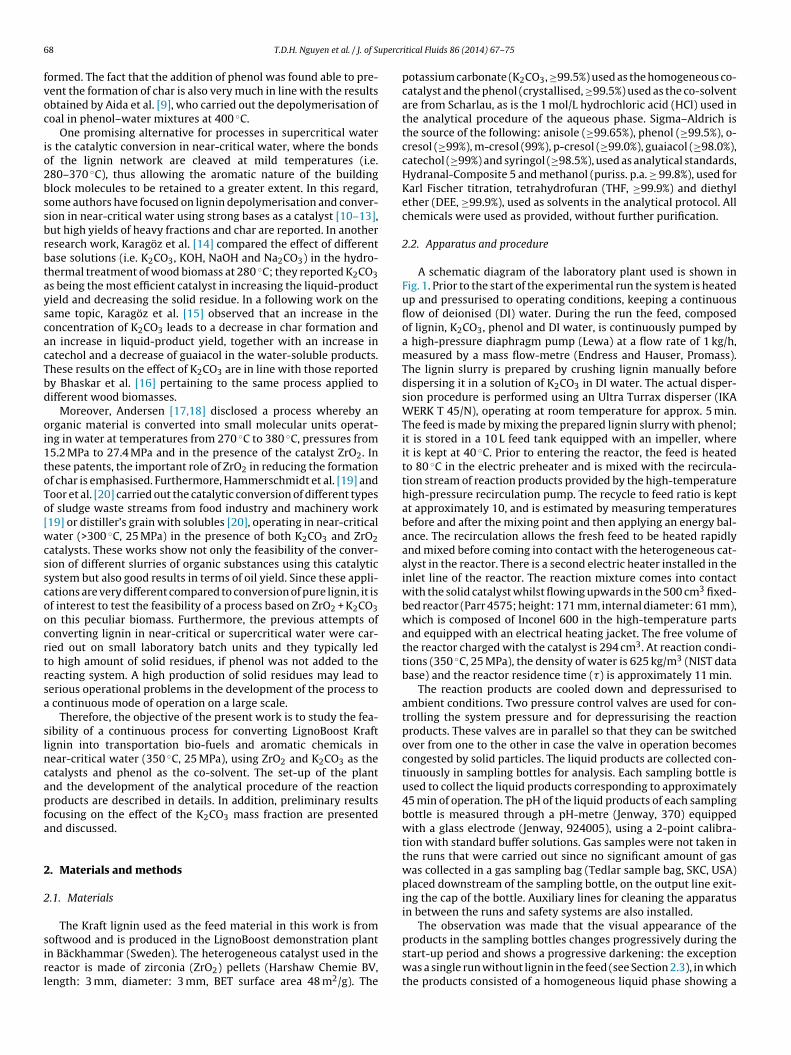
6 upercr
fvoc
io2bssbrbtayscacTbd
oi1toTo[wcsscoocrtrsa
slncapfa
2
2
sirl
8 T.D.H. Nguyen et al. / J. of S
ormed. The fact that the addition of phenol was found able to pre-ent the formation of char is also very much in line with the resultsbtained by Aida et al. [9], who carried out the depolymerisation ofoal in phenol–water mixtures at 400 ◦C.
One promising alternative for processes in supercritical waters the catalytic conversion in near-critical water, where the bondsf the lignin network are cleaved at mild temperatures (i.e.80–370 ◦C), thus allowing the aromatic nature of the buildinglock molecules to be retained to a greater extent. In this regard,ome authors have focused on lignin depolymerisation and conver-ion in near-critical water using strong bases as a catalyst [10–13],ut high yields of heavy fractions and char are reported. In anotheresearch work, Karagöz et al. [14] compared the effect of differentase solutions (i.e. K2CO3, KOH, NaOH and Na2CO3) in the hydro-hermal treatment of wood biomass at 280 ◦C; they reported K2CO3s being the most efficient catalyst in increasing the liquid-productield and decreasing the solid residue. In a following work on theame topic, Karagöz et al. [15] observed that an increase in theoncentration of K2CO3 leads to a decrease in char formation andn increase in liquid-product yield, together with an increase inatechol and a decrease of guaiacol in the water-soluble products.hese results on the effect of K2CO3 are in line with those reportedy Bhaskar et al. [16] pertaining to the same process applied toifferent wood biomasses.
Moreover, Andersen [17,18] disclosed a process whereby anrganic material is converted into small molecular units operat-ng in water at temperatures from 270 ◦C to 380 ◦C, pressures from5.2 MPa to 27.4 MPa and in the presence of the catalyst ZrO2. Inhese patents, the important role of ZrO2 in reducing the formationf char is emphasised. Furthermore, Hammerschmidt et al. [19] andoor et al. [20] carried out the catalytic conversion of different typesf sludge waste streams from food industry and machinery work19] or distiller’s grain with solubles [20], operating in near-criticalater (>300 ◦C, 25 MPa) in the presence of both K2CO3 and ZrO2
atalysts. These works show not only the feasibility of the conver-ion of different slurries of organic substances using this catalyticystem but also good results in terms of oil yield. Since these appli-ations are very different compared to conversion of pure lignin, it isf interest to test the feasibility of a process based on ZrO2 + K2CO3n this peculiar biomass. Furthermore, the previous attempts ofonverting lignin in near-critical or supercritical water were car-ied out on small laboratory batch units and they typically ledo high amount of solid residues, if phenol was not added to theeacting system. A high production of solid residues may lead toerious operational problems in the development of the process to
continuous mode of operation on a large scale.Therefore, the objective of the present work is to study the fea-
ibility of a continuous process for converting LignoBoost Kraftignin into transportation bio-fuels and aromatic chemicals inear-critical water (350 ◦C, 25 MPa), using ZrO2 and K2CO3 as theatalysts and phenol as the co-solvent. The set-up of the plantnd the development of the analytical procedure of the reactionroducts are described in details. In addition, preliminary resultsocusing on the effect of the K2CO3 mass fraction are presentednd discussed.
. Materials and methods
.1. Materials
The Kraft lignin used as the feed material in this work is from
oftwood and is produced in the LignoBoost demonstration plantn Bäckhammar (Sweden). The heterogeneous catalyst used in theeactor is made of zirconia (ZrO2) pellets (Harshaw Chemie BV,ength: 3 mm, diameter: 3 mm, BET surface area 48 m2/g). Theitical Fluids 86 (2014) 67– 75
potassium carbonate (K2CO3, ≥99.5%) used as the homogeneous co-catalyst and the phenol (crystallised, ≥99.5%) used as the co-solventare from Scharlau, as is the 1 mol/L hydrochloric acid (HCl) used inthe analytical procedure of the aqueous phase. Sigma–Aldrich isthe source of the following: anisole (≥99.65%), phenol (≥99.5%), o-cresol (≥99%), m-cresol (99%), p-cresol (≥99.0%), guaiacol (≥98.0%),catechol (≥99%) and syringol (≥98.5%), used as analytical standards,Hydranal-Composite 5 and methanol (puriss. p.a. ≥ 99.8%), used forKarl Fischer titration, tetrahydrofuran (THF, ≥99.9%) and diethylether (DEE, ≥99.9%), used as solvents in the analytical protocol. Allchemicals were used as provided, without further purification.
2.2. Apparatus and procedure
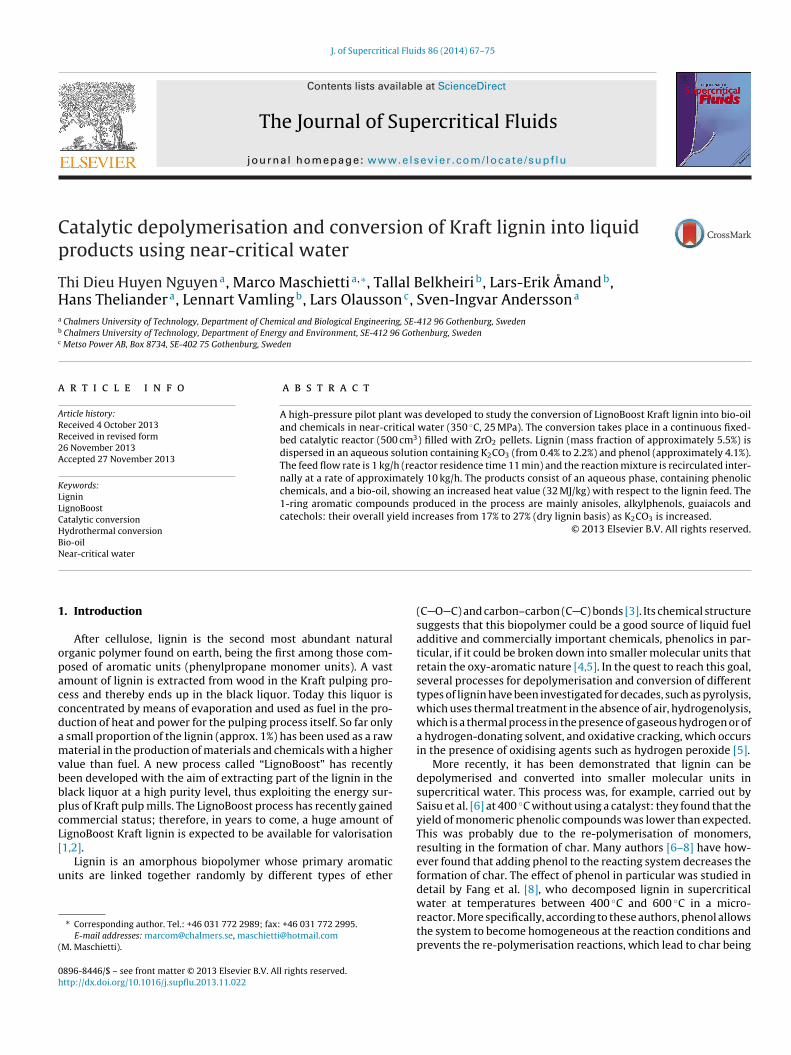
A schematic diagram of the laboratory plant used is shown inFig. 1. Prior to the start of the experimental run the system is heatedup and pressurised to operating conditions, keeping a continuousflow of deionised (DI) water. During the run the feed, composedof lignin, K2CO3, phenol and DI water, is continuously pumped bya high-pressure diaphragm pump (Lewa) at a flow rate of 1 kg/h,measured by a mass flow-metre (Endress and Hauser, Promass).The lignin slurry is prepared by crushing lignin manually beforedispersing it in a solution of K2CO3 in DI water. The actual disper-sion procedure is performed using an Ultra Turrax disperser (IKAWERK T 45/N), operating at room temperature for approx. 5 min.The feed is made by mixing the prepared lignin slurry with phenol;it is stored in a 10 L feed tank equipped with an impeller, whereit is kept at 40 ◦C. Prior to entering the reactor, the feed is heatedto 80 ◦C in the electric preheater and is mixed with the recircula-tion stream of reaction products provided by the high-temperaturehigh-pressure recirculation pump. The recycle to feed ratio is keptat approximately 10, and is estimated by measuring temperaturesbefore and after the mixing point and then applying an energy bal-ance. The recirculation allows the fresh feed to be heated rapidlyand mixed before coming into contact with the heterogeneous cat-alyst in the reactor. There is a second electric heater installed in theinlet line of the reactor. The reaction mixture comes into contactwith the solid catalyst whilst flowing upwards in the 500 cm3 fixed-bed reactor (Parr 4575; height: 171 mm, internal diameter: 61 mm),which is composed of Inconel 600 in the high-temperature partsand equipped with an electrical heating jacket. The free volume ofthe reactor charged with the catalyst is 294 cm3. At reaction condi-tions (350 ◦C, 25 MPa), the density of water is 625 kg/m3 (NIST database) and the reactor residence time (�) is approximately 11 min.
The reaction products are cooled down and depressurised toambient conditions. Two pressure control valves are used for con-trolling the system pressure and for depressurising the reactionproducts. These valves are in parallel so that they can be switchedover from one to the other in case the valve in operation becomescongested by solid particles. The liquid products are collected con-tinuously in sampling bottles for analysis. Each sampling bottle isused to collect the liquid products corresponding to approximately45 min of operation. The pH of the liquid products of each samplingbottle is measured through a pH-metre (Jenway, 370) equippedwith a glass electrode (Jenway, 924005), using a 2-point calibra-tion with standard buffer solutions. Gas samples were not taken inthe runs that were carried out since no significant amount of gaswas collected in a gas sampling bag (Tedlar sample bag, SKC, USA)placed downstream of the sampling bottle, on the output line exit-ing the cap of the bottle. Auxiliary lines for cleaning the apparatusin between the runs and safety systems are also installed.
The observation was made that the visual appearance of the
products in the sampling bottles changes progressively during thestart-up period and shows a progressive darkening: the exceptionwas a single run without lignin in the feed (see Section 2.3), in whichthe products consisted of a homogeneous liquid phase showing a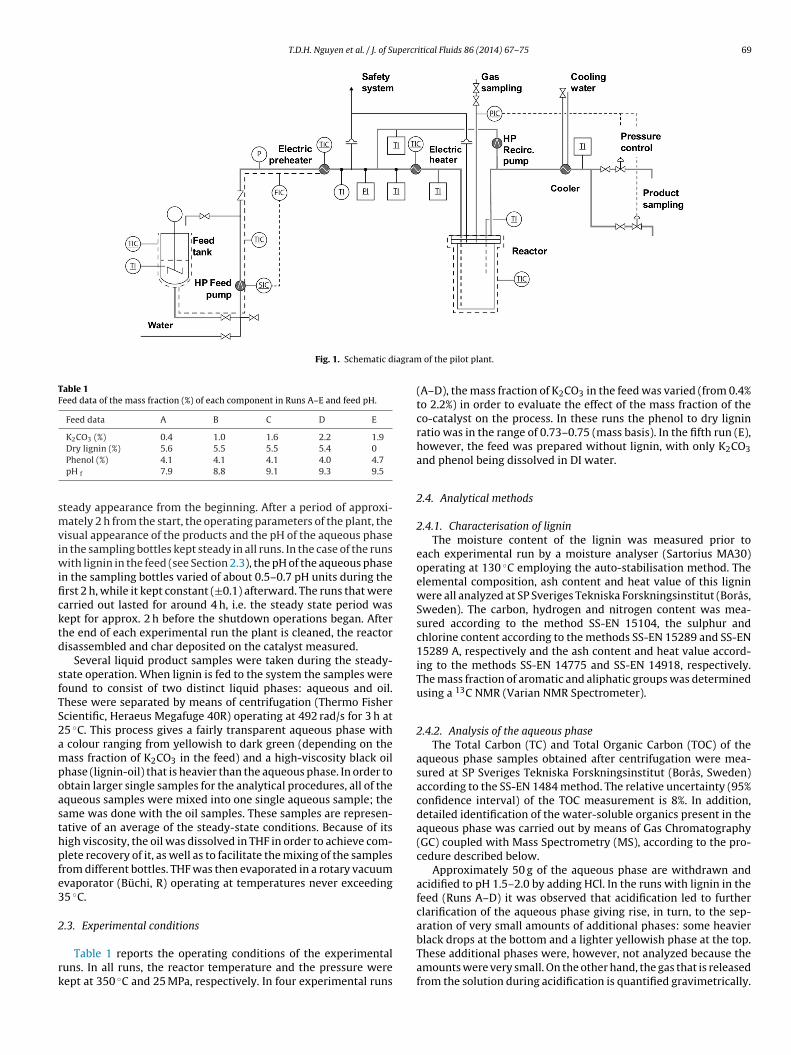
T.D.H. Nguyen et al. / J. of Supercritical Fluids 86 (2014) 67– 75 69
Fig. 1. Schematic diagram
Table 1Feed data of the mass fraction (%) of each component in Runs A–E and feed pH.
Feed data A B C D E
K2CO3 (%) 0.4 1.0 1.6 2.2 1.9
smviwificktd
sfTS2ampoasthpfe3
2
rk
Dry lignin (%) 5.6 5.5 5.5 5.4 0Phenol (%) 4.1 4.1 4.1 4.0 4.7pH f 7.9 8.8 9.1 9.3 9.5
teady appearance from the beginning. After a period of approxi-ately 2 h from the start, the operating parameters of the plant, the
isual appearance of the products and the pH of the aqueous phasen the sampling bottles kept steady in all runs. In the case of the runs
ith lignin in the feed (see Section 2.3), the pH of the aqueous phasen the sampling bottles varied of about 0.5–0.7 pH units during therst 2 h, while it kept constant (±0.1) afterward. The runs that werearried out lasted for around 4 h, i.e. the steady state period wasept for approx. 2 h before the shutdown operations began. Afterhe end of each experimental run the plant is cleaned, the reactorisassembled and char deposited on the catalyst measured.
Several liquid product samples were taken during the steady-tate operation. When lignin is fed to the system the samples wereound to consist of two distinct liquid phases: aqueous and oil.hese were separated by means of centrifugation (Thermo Fishercientific, Heraeus Megafuge 40R) operating at 492 rad/s for 3 h at5 ◦C. This process gives a fairly transparent aqueous phase with
colour ranging from yellowish to dark green (depending on theass fraction of K2CO3 in the feed) and a high-viscosity black oil
hase (lignin-oil) that is heavier than the aqueous phase. In order tobtain larger single samples for the analytical procedures, all of thequeous samples were mixed into one single aqueous sample; theame was done with the oil samples. These samples are represen-ative of an average of the steady-state conditions. Because of itsigh viscosity, the oil was dissolved in THF in order to achieve com-lete recovery of it, as well as to facilitate the mixing of the samplesrom different bottles. THF was then evaporated in a rotary vacuumvaporator (Büchi, R) operating at temperatures never exceeding5 ◦C.
.3. Experimental conditions
Table 1 reports the operating conditions of the experimentaluns. In all runs, the reactor temperature and the pressure wereept at 350 ◦C and 25 MPa, respectively. In four experimental runs
of the pilot plant.
(A–D), the mass fraction of K2CO3 in the feed was varied (from 0.4%to 2.2%) in order to evaluate the effect of the mass fraction of theco-catalyst on the process. In these runs the phenol to dry ligninratio was in the range of 0.73–0.75 (mass basis). In the fifth run (E),however, the feed was prepared without lignin, with only K2CO3and phenol being dissolved in DI water.
2.4. Analytical methods
2.4.1. Characterisation of ligninThe moisture content of the lignin was measured prior to
each experimental run by a moisture analyser (Sartorius MA30)operating at 130 ◦C employing the auto-stabilisation method. Theelemental composition, ash content and heat value of this ligninwere all analyzed at SP Sveriges Tekniska Forskningsinstitut (Borås,Sweden). The carbon, hydrogen and nitrogen content was mea-sured according to the method SS-EN 15104, the sulphur andchlorine content according to the methods SS-EN 15289 and SS-EN15289 A, respectively and the ash content and heat value accord-ing to the methods SS-EN 14775 and SS-EN 14918, respectively.The mass fraction of aromatic and aliphatic groups was determinedusing a 13C NMR (Varian NMR Spectrometer).
2.4.2. Analysis of the aqueous phaseThe Total Carbon (TC) and Total Organic Carbon (TOC) of the
aqueous phase samples obtained after centrifugation were mea-sured at SP Sveriges Tekniska Forskningsinstitut (Borås, Sweden)according to the SS-EN 1484 method. The relative uncertainty (95%confidence interval) of the TOC measurement is 8%. In addition,detailed identification of the water-soluble organics present in theaqueous phase was carried out by means of Gas Chromatography(GC) coupled with Mass Spectrometry (MS), according to the pro-cedure described below.
Approximately 50 g of the aqueous phase are withdrawn andacidified to pH 1.5–2.0 by adding HCl. In the runs with lignin in thefeed (Runs A–D) it was observed that acidification led to furtherclarification of the aqueous phase giving rise, in turn, to the sep-aration of very small amounts of additional phases: some heavier
black drops at the bottom and a lighter yellowish phase at the top.These additional phases were, however, not analyzed because theamounts were very small. On the other hand, the gas that is releasedfrom the solution during acidification is quantified gravimetrically.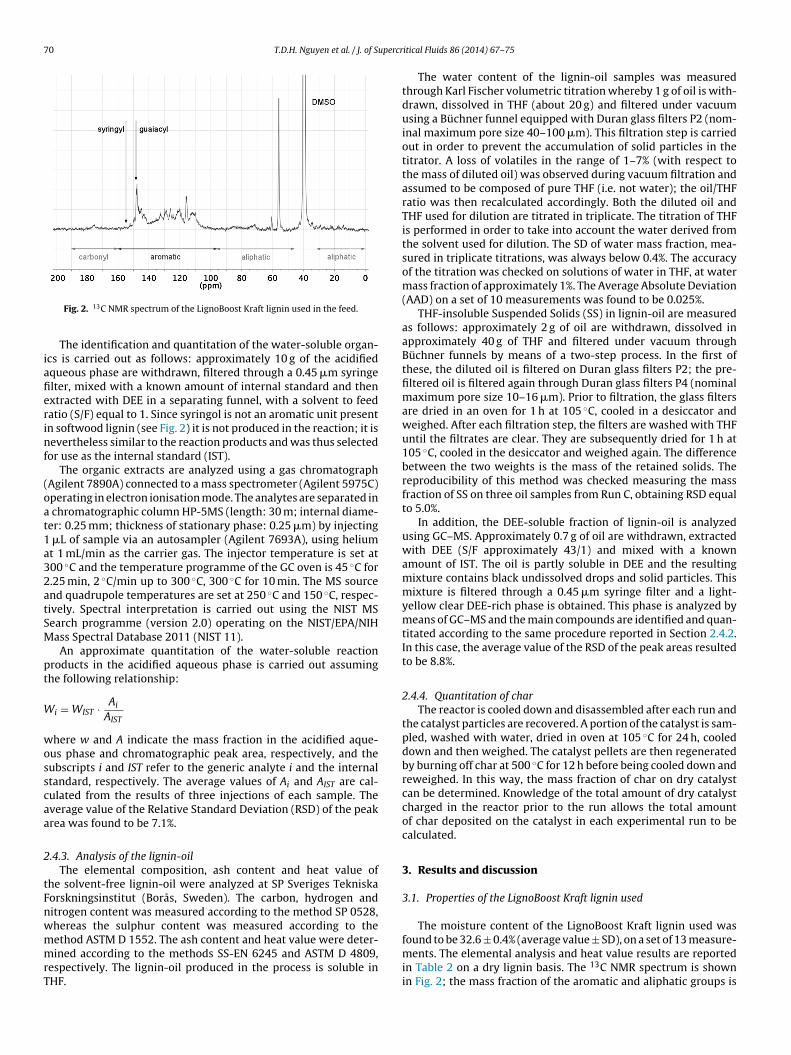
70 T.D.H. Nguyen et al. / J. of Supercr
iafierinf
(oat1a32atSM
pt
W
wosscaa
2
tFnwmmrT
Fig. 2. 13C NMR spectrum of the LignoBoost Kraft lignin used in the feed.
The identification and quantitation of the water-soluble organ-cs is carried out as follows: approximately 10 g of the acidifiedqueous phase are withdrawn, filtered through a 0.45 �m syringelter, mixed with a known amount of internal standard and thenxtracted with DEE in a separating funnel, with a solvent to feedatio (S/F) equal to 1. Since syringol is not an aromatic unit presentn softwood lignin (see Fig. 2) it is not produced in the reaction; it isevertheless similar to the reaction products and was thus selected
or use as the internal standard (IST).The organic extracts are analyzed using a gas chromatograph
Agilent 7890A) connected to a mass spectrometer (Agilent 5975C)perating in electron ionisation mode. The analytes are separated in
chromatographic column HP-5MS (length: 30 m; internal diame-er: 0.25 mm; thickness of stationary phase: 0.25 �m) by injecting
�L of sample via an autosampler (Agilent 7693A), using heliumt 1 mL/min as the carrier gas. The injector temperature is set at00 ◦C and the temperature programme of the GC oven is 45 ◦C for.25 min, 2 ◦C/min up to 300 ◦C, 300 ◦C for 10 min. The MS sourcend quadrupole temperatures are set at 250 ◦C and 150 ◦C, respec-ively. Spectral interpretation is carried out using the NIST MSearch programme (version 2.0) operating on the NIST/EPA/NIHass Spectral Database 2011 (NIST 11).An approximate quantitation of the water-soluble reaction
roducts in the acidified aqueous phase is carried out assuminghe following relationship:
i = WIST · Ai
AIST
here w and A indicate the mass fraction in the acidified aque-us phase and chromatographic peak area, respectively, and theubscripts i and IST refer to the generic analyte i and the internaltandard, respectively. The average values of Ai and AIST are cal-ulated from the results of three injections of each sample. Theverage value of the Relative Standard Deviation (RSD) of the peakrea was found to be 7.1%.
.4.3. Analysis of the lignin-oilThe elemental composition, ash content and heat value of
he solvent-free lignin-oil were analyzed at SP Sveriges Tekniskaorskningsinstitut (Borås, Sweden). The carbon, hydrogen anditrogen content was measured according to the method SP 0528,hereas the sulphur content was measured according to the
ethod ASTM D 1552. The ash content and heat value were deter-ined according to the methods SS-EN 6245 and ASTM D 4809,espectively. The lignin-oil produced in the process is soluble inHF.
itical Fluids 86 (2014) 67– 75
The water content of the lignin-oil samples was measuredthrough Karl Fischer volumetric titration whereby 1 g of oil is with-drawn, dissolved in THF (about 20 g) and filtered under vacuumusing a Büchner funnel equipped with Duran glass filters P2 (nom-inal maximum pore size 40–100 �m). This filtration step is carriedout in order to prevent the accumulation of solid particles in thetitrator. A loss of volatiles in the range of 1–7% (with respect tothe mass of diluted oil) was observed during vacuum filtration andassumed to be composed of pure THF (i.e. not water); the oil/THFratio was then recalculated accordingly. Both the diluted oil andTHF used for dilution are titrated in triplicate. The titration of THFis performed in order to take into account the water derived fromthe solvent used for dilution. The SD of water mass fraction, mea-sured in triplicate titrations, was always below 0.4%. The accuracyof the titration was checked on solutions of water in THF, at watermass fraction of approximately 1%. The Average Absolute Deviation(AAD) on a set of 10 measurements was found to be 0.025%.
THF-insoluble Suspended Solids (SS) in lignin-oil are measuredas follows: approximately 2 g of oil are withdrawn, dissolved inapproximately 40 g of THF and filtered under vacuum throughBüchner funnels by means of a two-step process. In the first ofthese, the diluted oil is filtered on Duran glass filters P2; the pre-filtered oil is filtered again through Duran glass filters P4 (nominalmaximum pore size 10–16 �m). Prior to filtration, the glass filtersare dried in an oven for 1 h at 105 ◦C, cooled in a desiccator andweighed. After each filtration step, the filters are washed with THFuntil the filtrates are clear. They are subsequently dried for 1 h at105 ◦C, cooled in the desiccator and weighed again. The differencebetween the two weights is the mass of the retained solids. Thereproducibility of this method was checked measuring the massfraction of SS on three oil samples from Run C, obtaining RSD equalto 5.0%.
In addition, the DEE-soluble fraction of lignin-oil is analyzedusing GC–MS. Approximately 0.7 g of oil are withdrawn, extractedwith DEE (S/F approximately 43/1) and mixed with a knownamount of IST. The oil is partly soluble in DEE and the resultingmixture contains black undissolved drops and solid particles. Thismixture is filtered through a 0.45 �m syringe filter and a light-yellow clear DEE-rich phase is obtained. This phase is analyzed bymeans of GC–MS and the main compounds are identified and quan-titated according to the same procedure reported in Section 2.4.2.In this case, the average value of the RSD of the peak areas resultedto be 8.8%.
2.4.4. Quantitation of charThe reactor is cooled down and disassembled after each run and
the catalyst particles are recovered. A portion of the catalyst is sam-pled, washed with water, dried in oven at 105 ◦C for 24 h, cooleddown and then weighed. The catalyst pellets are then regeneratedby burning off char at 500 ◦C for 12 h before being cooled down andreweighed. In this way, the mass fraction of char on dry catalystcan be determined. Knowledge of the total amount of dry catalystcharged in the reactor prior to the run allows the total amountof char deposited on the catalyst in each experimental run to becalculated.
3. Results and discussion
3.1. Properties of the LignoBoost Kraft lignin used
The moisture content of the LignoBoost Kraft lignin used was
found to be 32.6 ± 0.4% (average value ± SD), on a set of 13 measure-ments. The elemental analysis and heat value results are reportedin Table 2 on a dry lignin basis. The 13C NMR spectrum is shownin Fig. 2; the mass fraction of the aromatic and aliphatic groups is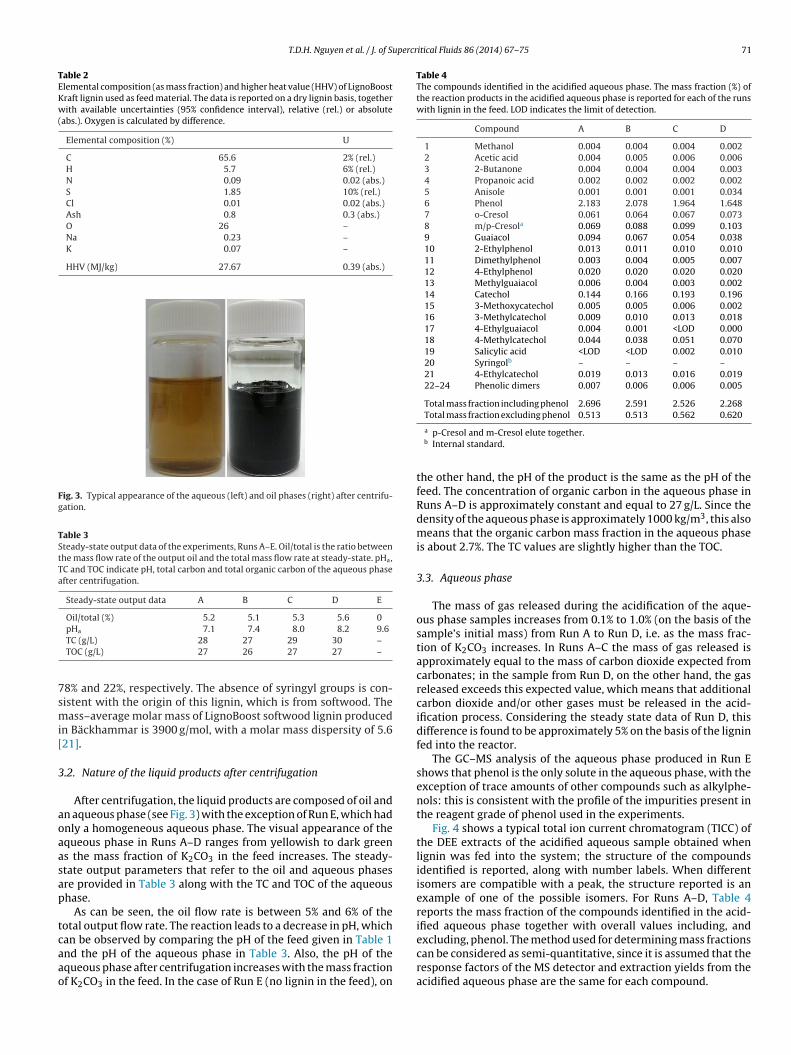
T.D.H. Nguyen et al. / J. of Supercritical Fluids 86 (2014) 67– 75 71
Table 2Elemental composition (as mass fraction) and higher heat value (HHV) of LignoBoostKraft lignin used as feed material. The data is reported on a dry lignin basis, togetherwith available uncertainties (95% confidence interval), relative (rel.) or absolute(abs.). Oxygen is calculated by difference.
Elemental composition (%) U
C 65.6 2% (rel.)H 5.7 6% (rel.)N 0.09 0.02 (abs.)S 1.85 10% (rel.)Cl 0.01 0.02 (abs.)Ash 0.8 0.3 (abs.)O 26 –Na 0.23 –K 0.07 –
HHV (MJ/kg) 27.67 0.39 (abs.)
Fig. 3. Typical appearance of the aqueous (left) and oil phases (right) after centrifu-gation.
Table 3Steady-state output data of the experiments, Runs A–E. Oil/total is the ratio betweenthe mass flow rate of the output oil and the total mass flow rate at steady-state. pHa,TC and TOC indicate pH, total carbon and total organic carbon of the aqueous phaseafter centrifugation.
Steady-state output data A B C D E
Oil/total (%) 5.2 5.1 5.3 5.6 0pH 7.1 7.4 8.0 8.2 9.6
7smi[
3
aoaasap
tcaao
Table 4The compounds identified in the acidified aqueous phase. The mass fraction (%) ofthe reaction products in the acidified aqueous phase is reported for each of the runswith lignin in the feed. LOD indicates the limit of detection.
Compound A B C D
1 Methanol 0.004 0.004 0.004 0.0022 Acetic acid 0.004 0.005 0.006 0.0063 2-Butanone 0.004 0.004 0.004 0.0034 Propanoic acid 0.002 0.002 0.002 0.0025 Anisole 0.001 0.001 0.001 0.0346 Phenol 2.183 2.078 1.964 1.6487 o-Cresol 0.061 0.064 0.067 0.0738 m/p-Cresola 0.069 0.088 0.099 0.1039 Guaiacol 0.094 0.067 0.054 0.03810 2-Ethylphenol 0.013 0.011 0.010 0.01011 Dimethylphenol 0.003 0.004 0.005 0.00712 4-Ethylphenol 0.020 0.020 0.020 0.02013 Methylguaiacol 0.006 0.004 0.003 0.00214 Catechol 0.144 0.166 0.193 0.19615 3-Methoxycatechol 0.005 0.005 0.006 0.00216 3-Methylcatechol 0.009 0.010 0.013 0.01817 4-Ethylguaiacol 0.004 0.001 <LOD 0.00018 4-Methylcatechol 0.044 0.038 0.051 0.07019 Salicylic acid <LOD <LOD 0.002 0.01020 Syringolb – – – –21 4-Ethylcatechol 0.019 0.013 0.016 0.01922–24 Phenolic dimers 0.007 0.006 0.006 0.005
Total mass fraction including phenol 2.696 2.591 2.526 2.268Total mass fraction excluding phenol 0.513 0.513 0.562 0.620
a
TC (g/L) 28 27 29 30 –TOC (g/L) 27 26 27 27 –
8% and 22%, respectively. The absence of syringyl groups is con-istent with the origin of this lignin, which is from softwood. Theass–average molar mass of LignoBoost softwood lignin produced
n Bäckhammar is 3900 g/mol, with a molar mass dispersity of 5.621].
.2. Nature of the liquid products after centrifugation
After centrifugation, the liquid products are composed of oil andn aqueous phase (see Fig. 3) with the exception of Run E, which hadnly a homogeneous aqueous phase. The visual appearance of thequeous phase in Runs A–D ranges from yellowish to dark greens the mass fraction of K2CO3 in the feed increases. The steady-tate output parameters that refer to the oil and aqueous phasesre provided in Table 3 along with the TC and TOC of the aqueoushase.
As can be seen, the oil flow rate is between 5% and 6% of theotal output flow rate. The reaction leads to a decrease in pH, which
an be observed by comparing the pH of the feed given in Table 1nd the pH of the aqueous phase in Table 3. Also, the pH of thequeous phase after centrifugation increases with the mass fractionf K2CO3 in the feed. In the case of Run E (no lignin in the feed), ona p-Cresol and m-Cresol elute together.b Internal standard.
the other hand, the pH of the product is the same as the pH of thefeed. The concentration of organic carbon in the aqueous phase inRuns A–D is approximately constant and equal to 27 g/L. Since thedensity of the aqueous phase is approximately 1000 kg/m3, this alsomeans that the organic carbon mass fraction in the aqueous phaseis about 2.7%. The TC values are slightly higher than the TOC.
3.3. Aqueous phase
The mass of gas released during the acidification of the aque-ous phase samples increases from 0.1% to 1.0% (on the basis of thesample’s initial mass) from Run A to Run D, i.e. as the mass frac-tion of K2CO3 increases. In Runs A–C the mass of gas released isapproximately equal to the mass of carbon dioxide expected fromcarbonates; in the sample from Run D, on the other hand, the gasreleased exceeds this expected value, which means that additionalcarbon dioxide and/or other gases must be released in the acid-ification process. Considering the steady state data of Run D, thisdifference is found to be approximately 5% on the basis of the ligninfed into the reactor.
The GC–MS analysis of the aqueous phase produced in Run Eshows that phenol is the only solute in the aqueous phase, with theexception of trace amounts of other compounds such as alkylphe-nols: this is consistent with the profile of the impurities present inthe reagent grade of phenol used in the experiments.
Fig. 4 shows a typical total ion current chromatogram (TICC) ofthe DEE extracts of the acidified aqueous sample obtained whenlignin was fed into the system; the structure of the compoundsidentified is reported, along with number labels. When differentisomers are compatible with a peak, the structure reported is anexample of one of the possible isomers. For Runs A–D, Table 4reports the mass fraction of the compounds identified in the acid-ified aqueous phase together with overall values including, and
excluding, phenol. The method used for determining mass fractionscan be considered as semi-quantitative, since it is assumed that theresponse factors of the MS detector and extraction yields from theacidified aqueous phase are the same for each compound.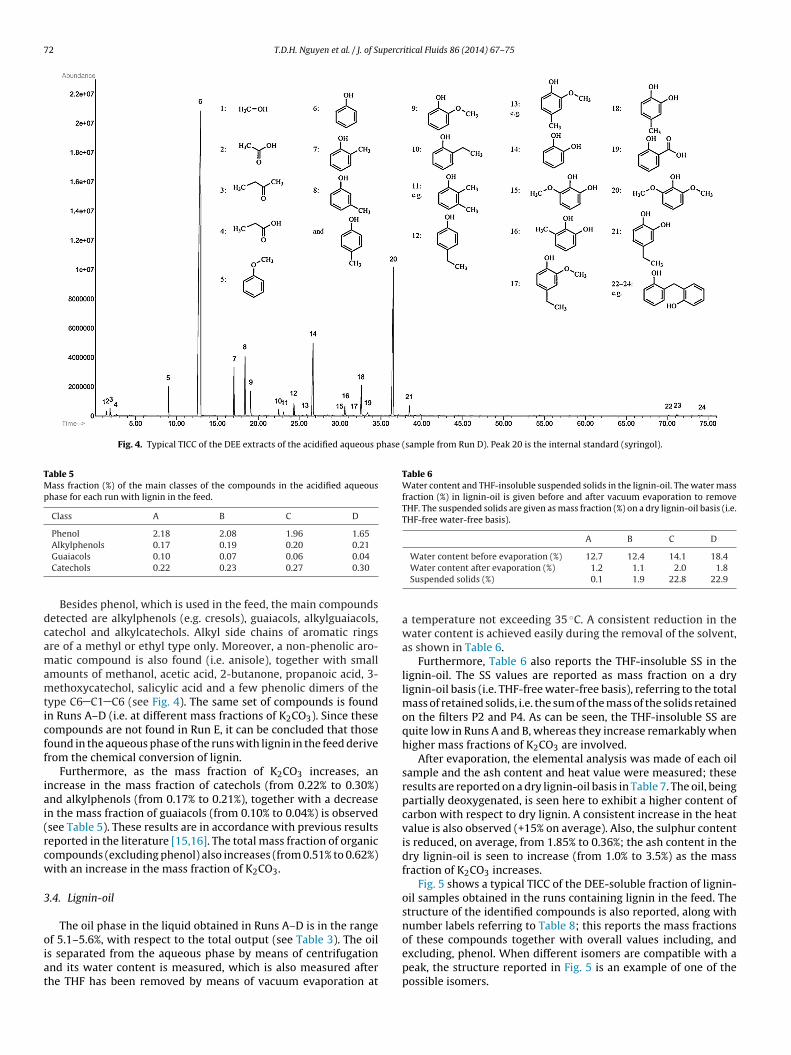
72 T.D.H. Nguyen et al. / J. of Supercritical Fluids 86 (2014) 67– 75
Fig. 4. Typical TICC of the DEE extracts of the acidified aqueous phase (sample from Run D). Peak 20 is the internal standard (syringol).
Table 5Mass fraction (%) of the main classes of the compounds in the acidified aqueousphase for each run with lignin in the feed.
Class A B C D
Phenol 2.18 2.08 1.96 1.65Alkylphenols 0.17 0.19 0.20 0.21
dcamamticff
iai(rcw
3
oiat
Table 6Water content and THF-insoluble suspended solids in the lignin-oil. The water massfraction (%) in lignin-oil is given before and after vacuum evaporation to removeTHF. The suspended solids are given as mass fraction (%) on a dry lignin-oil basis (i.e.THF-free water-free basis).
A B C D
Water content before evaporation (%) 12.7 12.4 14.1 18.4
Guaiacols 0.10 0.07 0.06 0.04Catechols 0.22 0.23 0.27 0.30Besides phenol, which is used in the feed, the main compoundsetected are alkylphenols (e.g. cresols), guaiacols, alkylguaiacols,atechol and alkylcatechols. Alkyl side chains of aromatic ringsre of a methyl or ethyl type only. Moreover, a non-phenolic aro-atic compound is also found (i.e. anisole), together with small
mounts of methanol, acetic acid, 2-butanone, propanoic acid, 3-ethoxycatechol, salicylic acid and a few phenolic dimers of the
ype C6 C1 C6 (see Fig. 4). The same set of compounds is foundn Runs A–D (i.e. at different mass fractions of K2CO3). Since theseompounds are not found in Run E, it can be concluded that thoseound in the aqueous phase of the runs with lignin in the feed deriverom the chemical conversion of lignin.
Furthermore, as the mass fraction of K2CO3 increases, anncrease in the mass fraction of catechols (from 0.22% to 0.30%)nd alkylphenols (from 0.17% to 0.21%), together with a decreasen the mass fraction of guaiacols (from 0.10% to 0.04%) is observedsee Table 5). These results are in accordance with previous resultseported in the literature [15,16]. The total mass fraction of organicompounds (excluding phenol) also increases (from 0.51% to 0.62%)ith an increase in the mass fraction of K2CO3.
.4. Lignin-oil
The oil phase in the liquid obtained in Runs A–D is in the range
f 5.1–5.6%, with respect to the total output (see Table 3). The oils separated from the aqueous phase by means of centrifugationnd its water content is measured, which is also measured afterhe THF has been removed by means of vacuum evaporation atWater content after evaporation (%) 1.2 1.1 2.0 1.8Suspended solids (%) 0.1 1.9 22.8 22.9
a temperature not exceeding 35 ◦C. A consistent reduction in thewater content is achieved easily during the removal of the solvent,as shown in Table 6.
Furthermore, Table 6 also reports the THF-insoluble SS in thelignin-oil. The SS values are reported as mass fraction on a drylignin-oil basis (i.e. THF-free water-free basis), referring to the totalmass of retained solids, i.e. the sum of the mass of the solids retainedon the filters P2 and P4. As can be seen, the THF-insoluble SS arequite low in Runs A and B, whereas they increase remarkably whenhigher mass fractions of K2CO3 are involved.
After evaporation, the elemental analysis was made of each oilsample and the ash content and heat value were measured; theseresults are reported on a dry lignin-oil basis in Table 7. The oil, beingpartially deoxygenated, is seen here to exhibit a higher content ofcarbon with respect to dry lignin. A consistent increase in the heatvalue is also observed (+15% on average). Also, the sulphur contentis reduced, on average, from 1.85% to 0.36%; the ash content in thedry lignin-oil is seen to increase (from 1.0% to 3.5%) as the massfraction of K2CO3 increases.
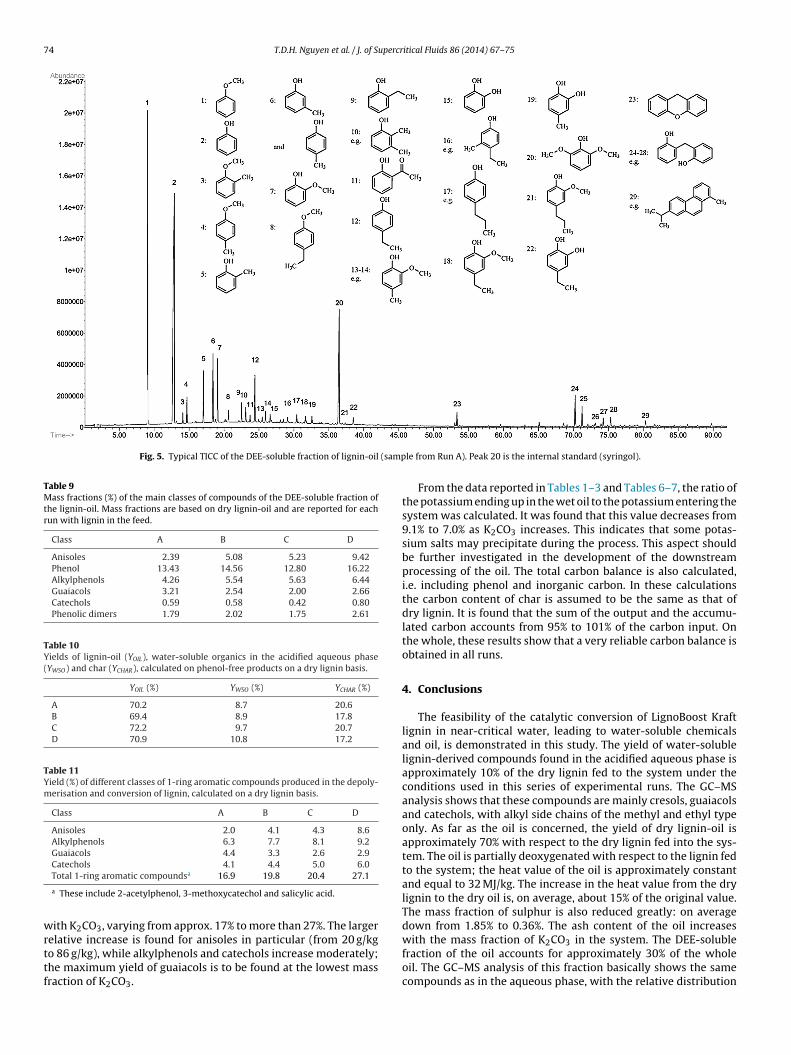
Fig. 5 shows a typical TICC of the DEE-soluble fraction of lignin-oil samples obtained in the runs containing lignin in the feed. Thestructure of the identified compounds is also reported, along withnumber labels referring to Table 8; this reports the mass fractions
of these compounds together with overall values including, andexcluding, phenol. When different isomers are compatible with apeak, the structure reported in Fig. 5 is an example of one of thepossible isomers.
T.D.H. Nguyen et al. / J. of Supercritical Fluids 86 (2014) 67– 75 73
Table 7Elemental composition (as mass fraction) and HHV of the lignin-oil obtained by hydrothermal depolymerisation and conversion of LignoBoost Kraft lignin. The data is reportedon a dry lignin-oil basis, together with available uncertainties (95% confidence interval), relative (rel.) or absolute (abs.). Oxygen is calculated by difference.
Elemental composition (%) A B C D U
C 74.6 74.2 74.9 74.8 1.1% (rel.)H 6.9 6.9 6.6 6.5 4% (rel.)N <0.1 <0.1 <0.1 – 20% (rel.)S 0.37 0.38 0.38 0.29 16% (rel.)Cl <0.01 <0.01 <0.01 <0.01 –Ash 1.0 2.1 2.8 3.5 –O 17 16 15 15 –Na <0.01 <0.01 0.01 <0.01 –K 0.46 1.00 1.60 1.90 –
oto62otohaciopcstn(c
TT
HHV (MJ/kg) 31.93 31.83
The DEE-soluble fraction of lignin-oil contains a large amountf 1-ring aromatic compounds. Besides phenol (from 13% to 16%),he compounds with higher mass fractions based on dry lignin-il are anisoles (from 2.4% to 9.4%), alkylphenols (from 4.3% to.4%), guaiacols (from 2% to 3%) and catechols (below 1%). Some-ring phenolic compounds (phenolic dimers), with a C6 C1 C6r C6 C2 C6 structure, are also found. Most of the compounds inhe DEE-soluble fraction of lignin-oil are the same as in the aque-us phase, with distribution coefficients depending on their beingydrophilic or hydrophobic in nature. For example, catechol is rel-tively more abundant in the aqueous phase whereas anisole isoncentrated in the oil. In addition, some compounds not foundn the aqueous phase are identified in the DEE-soluble fractionf lignin-oil, as in the case of alkylanisoles, 1-ring phenolic com-ounds with propyl side chains, ethylcresol, acetylphenol and twoompounds with 3 rings (see Fig. 5). The total mass fraction of DEE-oluble compounds in lignin-oil increases with K2CO3; with regard
o specific classes of compounds, the amount of anisoles, alkylphe-ols and catechols increases whilst that of the guaiacols decreasessee Table 9). These trends are also found for the water-solubleompounds in the aqueous phase.able 8he compounds identified in the DEE-soluble fraction of the lignin-oil. Mass fractions (%)
Compound A
1 Anisole 2.103
2 Phenol 13.428
3 2-Methylanisole 0.064
4 4-Methylanisole 0.133
5 o-Cresol 0.936
6 m/p-Cresola 1.202
7 Guaiacol 1.969
8 4-Ethylanisole 0.087
9 2-Ethylphenol 0.538
10 Dimethylphenol 0.251
11 2-Acetylphenol 0.102
12 4-Ethylphenol 1.006
13–14 Methylguaiacols 0.514
15 Catechol 0.182
16 Ethylcresol 0.096
17 Propylphenol 0.231
18 4-Ethylguaiacol 0.571
19 4-Methylcatechol 0.196
20 Syringolb –
21 4-Propylguaiacol 0.156
22 4-Ethylcatechol 0.213
23 9H-Xanthene 0.232
24–28 Phenolic dimers 1.786
29 Isopropyl-methyl-phenanthrene 0.367
Total mass fraction including phenol 26.36
Total mass fraction excluding phenol 12.94
a p-Cresol and m-Cresol elute together.b Internal standard.
31.90 31.86 0.16 (abs.)
3.5. Product yields and carbon balances
Product yields are calculated taking three different products intoconsideration: dry lignin-oil (OIL), water-soluble organics in theacidified aqueous phase (WSO) and char (CHAR). The correspond-ing yields (Y) are defined here as the mass of phenol-free productsrelative to the mass of dry lignin fed into the system. The calcula-tions are made assuming that the average rate of char formationduring the entire run (i.e. start-up, steady-state and cooling down)is equal to the rate of formation at steady-state. The yield of themain classes of 1-ring aromatic compounds is also calculated, tak-ing into account the quantities found in both the aqueous and theoil phase.
Table 10 shows that the yield of dry lignin-oil is approximatelyconstant around 70%. However, the amount of water-soluble organ-ics found in the acidified aqueous phase varies from 9% to 11% ofdry lignin, with a trend showing a slight increase as the mass frac-
tion of K2CO3 increases. As far as char deposited on the catalyst isconcerned, this fraction is about 20% of the dry lignin fed to thesystem. In the case of the conversion of lignin to 1-ring aromaticcompounds (see Table 11), the total yield increases remarkablybased on dry lignin-oil are reported for each of the runs with lignin in the feed.
B C D
4.412 4.414 8.17014.559 12.797 16.220
0.147 0.173 0.2700.330 0.409 0.6521.155 1.158 1.3061.809 1.923 2.2571.729 1.344 1.8180.189 0.238 0.3230.563 0.511 0.5410.361 0.402 0.5070.153 0.156 0.2381.241 1.200 1.3630.469 0.399 0.5290.206 0.181 0.2750.128 0.144 0.1600.281 0.288 0.3010.276 0.204 0.2490.202 0.122 0.282– – –0.069 0.050 0.0610.167 0.113 0.2450.169 0.100 0.4492.015 1.747 2.6140.322 0.242 0.212
30.95 28.32 39.0416.39 15.52 22.82
74 T.D.H. Nguyen et al. / J. of Supercritical Fluids 86 (2014) 67– 75
Fig. 5. Typical TICC of the DEE-soluble fraction of lignin-oil (samp
Table 9Mass fractions (%) of the main classes of compounds of the DEE-soluble fraction ofthe lignin-oil. Mass fractions are based on dry lignin-oil and are reported for eachrun with lignin in the feed.
Class A B C D
Anisoles 2.39 5.08 5.23 9.42Phenol 13.43 14.56 12.80 16.22Alkylphenols 4.26 5.54 5.63 6.44Guaiacols 3.21 2.54 2.00 2.66Catechols 0.59 0.58 0.42 0.80Phenolic dimers 1.79 2.02 1.75 2.61
Table 10Yields of lignin-oil (YOIL), water-soluble organics in the acidified aqueous phase(YWSO) and char (YCHAR), calculated on phenol-free products on a dry lignin basis.
YOIL (%) YWSO (%) YCHAR (%)
A 70.2 8.7 20.6B 69.4 8.9 17.8C 72.2 9.7 20.7D 70.9 10.8 17.2
Table 11Yield (%) of different classes of 1-ring aromatic compounds produced in the depoly-merisation and conversion of lignin, calculated on a dry lignin basis.
Class A B C D
Anisoles 2.0 4.1 4.3 8.6Alkylphenols 6.3 7.7 8.1 9.2Guaiacols 4.4 3.3 2.6 2.9Catechols 4.1 4.4 5.0 6.0
wrttf
Total 1-ring aromatic compoundsa 16.9 19.8 20.4 27.1
a These include 2-acetylphenol, 3-methoxycatechol and salicylic acid.
ith K2CO3, varying from approx. 17% to more than 27%. The larger
elative increase is found for anisoles in particular (from 20 g/kgo 86 g/kg), while alkylphenols and catechols increase moderately;he maximum yield of guaiacols is to be found at the lowest massraction of K2CO3.le from Run A). Peak 20 is the internal standard (syringol).
From the data reported in Tables 1–3 and Tables 6–7, the ratio ofthe potassium ending up in the wet oil to the potassium entering thesystem was calculated. It was found that this value decreases from9.1% to 7.0% as K2CO3 increases. This indicates that some potas-sium salts may precipitate during the process. This aspect shouldbe further investigated in the development of the downstreamprocessing of the oil. The total carbon balance is also calculated,i.e. including phenol and inorganic carbon. In these calculationsthe carbon content of char is assumed to be the same as that ofdry lignin. It is found that the sum of the output and the accumu-lated carbon accounts from 95% to 101% of the carbon input. Onthe whole, these results show that a very reliable carbon balance isobtained in all runs.
4. Conclusions
The feasibility of the catalytic conversion of LignoBoost Kraftlignin in near-critical water, leading to water-soluble chemicalsand oil, is demonstrated in this study. The yield of water-solublelignin-derived compounds found in the acidified aqueous phase isapproximately 10% of the dry lignin fed to the system under theconditions used in this series of experimental runs. The GC–MSanalysis shows that these compounds are mainly cresols, guaiacolsand catechols, with alkyl side chains of the methyl and ethyl typeonly. As far as the oil is concerned, the yield of dry lignin-oil isapproximately 70% with respect to the dry lignin fed into the sys-tem. The oil is partially deoxygenated with respect to the lignin fedto the system; the heat value of the oil is approximately constantand equal to 32 MJ/kg. The increase in the heat value from the drylignin to the dry oil is, on average, about 15% of the original value.The mass fraction of sulphur is also reduced greatly: on averagedown from 1.85% to 0.36%. The ash content of the oil increases
with the mass fraction of K2CO3 in the system. The DEE-solublefraction of the oil accounts for approximately 30% of the wholeoil. The GC–MS analysis of this fraction basically shows the samecompounds as in the aqueous phase, with the relative distribution
upercr
dnpa
p1iiii1it
A
tAtEu
R
[
[
[
[
[
[
[
[[[
[
T.D.H. Nguyen et al. / J. of S
epending on whether they are hydrophilic or hydrophobic inature. In addition, some compounds not found in the aqueoushase, such as alkylanisoles, alkylphenols with propyl side chainsnd 3-ring aromatic compounds, are identified in the oil.
Regarding the conversion of dry lignin into 1-ring aromatic com-ounds, it is found that the total yield increases remarkably (from69 g/kg to 271 g/kg) as the mass fraction of K2CO3 in the feed is
ncreased from 0.4% to 2.2%. Furthermore, there is a remarkablencrease in the yield of anisoles, together with moderate increasesn the yields of alkylphenols and catechols, as the amount of K2CO3ncreases. At the highest mass fraction of K2CO3 used in this study,
kg of dry lignin gives 86 g anisoles, 92 g alkylphenols, 29 g gua-acols and 60 g catechols. Under this operating condition anisole ishe most abundant product, with a yield of 75 g/kg.
cknowledgements
This work is supported by grants from Chalmers Energy Ini-iative – LignoFuel Project, Metso Power AB, The Swedish Energygency and Ångpanneförenings Forskningsstiftelse. Our thanks go
o Lars Nordstierna for the NMR analysis and Bengt Erichsen, Lenalisabeth Fogelquist and Tommy Friberg for their technical contrib-tions to the experiments.
eferences
[1] P. Tomani, The LignoBoost process, Cellulose Chemistry and Technology 44(2010) 53–58.
[2] H. Theliander, Withdrawing lignin from black liquor by precipitation, filtrationand washing, in: First Nordic Wood Biorefinery Conference, 2008, pp. 36–42.
[3] G. Gellerstedt, G. Henriksson, Lignins: major sources, structure and properties,in: M.N. Belgacem, A. Gandini (Eds.), Monomers, Polymers and Composites fromRenewable Resources, Elsevier, Amsterdam, 2008, pp. 201–224.
[4] A. Vigneault, D.K. Johnson, E. Chornet, Base-catalyzed depolymerization of
lignin: separation of monomers, Canadian Journal of Chemical Engineering 85(2007) 906–916.[5] M.P. Pandey, C.S. Kim, Lignin depolymerization and conversion: a review ofthermochemical methods, Chemical Engineering and Technology 34 (2011)29–41.
[
itical Fluids 86 (2014) 67– 75 75
[6] M. Saisu, T. Sato, M. Watanabe, T. Adschiri, K. Arai, Conversion of ligninwith supercritical water–phenol mixtures, Energy and Fuels 17 (2003)922–928.
[7] K. Okuda, M. Umetsu, S. Takami, T. Adschiri, Disassembly of lignin andchemical recovery – rapid depolymerization of lignin without char for-mation in water–phenol mixtures, Fuel Processing Technology 85 (2004)803–813.
[8] Z. Fang, T. Sato, R.L. Smith Jr., H. Inomata, K. Arai, J.A. Kozinski, Reaction chem-istry and phase behavior of lignin in high-temperature and supercritical water,Bioresource Technology 99 (2008) 3424–3430.
[9] T.M. Aida, T. Sato, G. Sekiguchi, T. Adschiri, K. Arai, Extraction of Tai-heiyo coal with supercritical water–phenol mixtures, Fuel 81 (2002)1453–1461.
10] J.E. Miller, L.R. Evans, J.E. Mudd, K.A. Brown, Batch microreactor studies of lignindepolymerization by bases: 2. Aqueous solvents, Sandia National LaboratoriesReport, SAND2002-1318, 2002.
11] G. Unkelbach, D. Schmiedl, R. Schweppe, T. Hirth, Catalyzed hydrothermaldegradation of lignins from biorefineries to aromatic compounds, in: 11thEuropean Workshop on Lignocellulosics and Pulp, 2010, pp. 57–60.
12] D. Schmiedl, G. Unkelbach, J. Graf, R. Schweppe, Studies in catalyzed hydro-thermal degradation processes on sulphur-free lignin and extractive separationof aromatic SYNTHONs, in: Second Nordic Wood Biorefinery Conference, 2009,pp. 189–196.
13] J.-M. Lavoie, W. Baré, M. Bilodeau, Depolymerization of steam-treated ligninfor the production of green chemicals, Bioresource Technology 102 (2011)4917–4920.
14] S. Karagöz, T. Bhaskar, A. Muto, Y. Sakata, T. Oshiki, T. Kishimoto,Low-temperature catalytic hydrothermal treatment of wood biomass:analysis of liquid products, Chemical Engineering Journal 108 (2005)127–137.
15] S. Karagöz, T. Bhaskar, A. Muto, Y. Sakata, Hydrothermal upgrading of biomass:effect of K2CO3 concentration and biomass/water ratio on products distribu-tion, Bioresource Technology 97 (2006) 90–98.
16] T. Bhaskar, A. Sera, A. Muto, Y. Sakata, Hydrothermal upgrading of woodbiomass: influence of the addition of K2CO3 and cellulose/lignin ratio, Fuel 87(2008) 2236–2242.
17] K. Andersen, Gasification process, DE 3806732 A1, 1989.18] K. Andersen, Gasification process, EP 0402405 B1, 1990.19] A. Hammerschmidt, N. Boukis, E. Hauer, U. Galla, E. Dinjus, B. Hitzmann, T.
Larsen, S.D. Nygaard, Catalytic conversion of waste biomass by hydrothermaltreatment, Fuel 90 (2011) 555–562.
20] S.S. Toor, L. Rosendahl, M.P. Nielsen, M. Glasius, A. Rudolf, S.B. Iversen, Contin-
uous production of bio-oil by catalytic liquefaction from wet distiller’s grainwith solubles (WDGS) from bio-ethanol production, Biomass and Bioenergy 36(2012) 327–332.21] J. Waltersson, The metal binding properties of Kraft lignin (Degree Thesis),Mälardalens Högskola Eskilstuna Västerås, Sweden, 2009.