2014 updated explainer on poverty and inequality in the eu
DESCRIPTION
EAPN issues its new and long-awaited Explainer on Poverty and Inequality in the EU, an update of the Explainer of the same name issued in 2009 and one of EAPN's most popular publications. This explainer sets out to provide a simple introduction to the poverty debate. It focuses primarily on current perspectives on the nature and extent of poverty, its causes and its links to inequality. It explains how poverty is understood and measured currently in the EU, and highlights some of the shortcomings of these approaches.TRANSCRIPT

2014
POVERTYAND
INEQUALITYIN THE EU
EAPN EXPLAINER #6


2014
POVERTYAND
INEQUALITYIN THE EU
EAPN EXPLAINER #6
This publication is supported under the European Community Programme for Employment and Social Solidarity—PROGRESS (2007–2013).
This programme is managed by the Directorate-General for Employ-ment, social affairs and equal opportunities of the European Commission. It was established to financially support the implementation of the objectives of the European Union in the employment and social affairs area, as set out in the Social Agenda, and thereby contribute to the achievement of the Lisbon Strategy goals in these fields.
The seven-year Programme targets all stakeholders who can help shape the development of appropriate and effective employment and social legislation and policies, across the EU-27, EFTA-EEA and EU candidate and pre-candidate countries.
PROGRESS mission is to strengthen the EU contribution in support of Member States’ com-mitment. PROGRESS will be instrumental in:
y providing analysis and policy advice on PROGRESS policy areas; y monitoring and reporting on the implementation of EU legislation and policies in
PROGRESS policy areas; y promoting policy transfer, learning and support among Member States on EU objectives
and priorities; and y relaying the views of the stakeholders and society at large.
For more information see: http://ec.europa.eu/progress
The information contained in this publication does not necessarily reflect the position or opinion of the European Commission.
EUROPEAN ANTI-POVERTY NETWORK RÉSEAU EUROPÉEN DE LUTTE CONTRE LA PAUVRETÉ ET L’EXCLUSION SOCIALE
SQUARE DE MEEÛS, 18 – 1050 BRUSSELS Tel: +32 (0)2 226 58 50
[email protected] - www.eapn.eu
For more information about this publication, EAPN’s policy work and positions, please contact Sian Jones, Policy Coordinator, EAPN Secretariat, at [email protected].
To find out more about EAPN’s work on employment, visit the EAPN website: www.eapn.eu
ISBN 978-2-930252-81-0

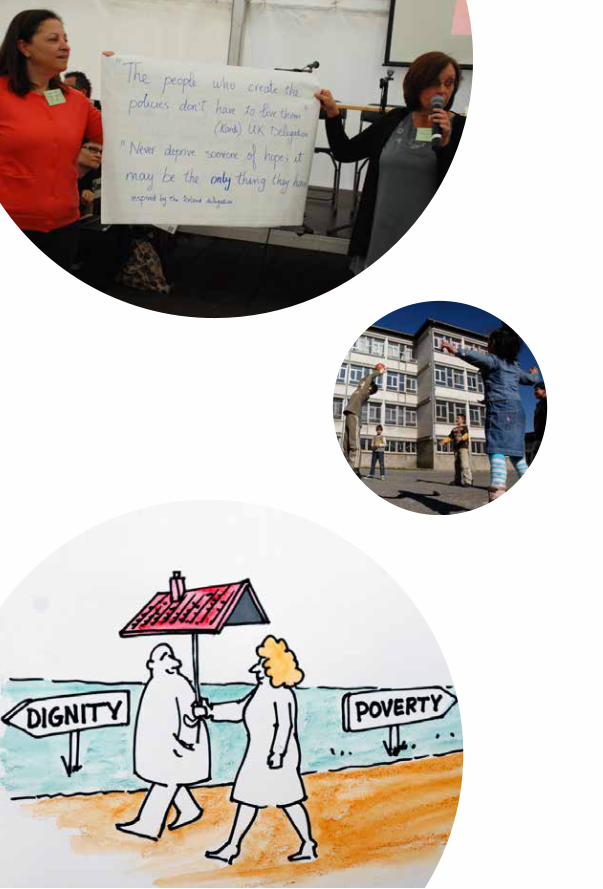
Cover page: Slogan by the Portuguese Delegation at the 12th European Meeting of People experiencing Poverty in Brussels, 2013 © Rebecca Lee/EAPN; Drawing on dignity and poverty, 6th European Meeting of People experiencing Poverty, Brussels, 2007 @ Bob Vincke and Emile De Bolle; Group photo of Delegates, 12th European Meeting of People experiencing Poverty in Brussels, 2013 © Rebecca Lee/EAPN; Norwegian Delegation at the 12th European Meeting of People experiencing Poverty in Brussels, 2013 © Rebecca Lee/EAPN. p.8: Slogan by the Portuguese Delegation at the 12th European Meeting of People experiencing Poverty in Brussels, 2013 © Rebecca Lee/EAPN; p.11: Estonian Delegation at the 12th European Meeting of People experiencing Poverty in Brussels, 2013 © Rebecca Lee/EAPN; p.12: Greek, Portuguese and Icelandic Delegations at the 12th European Meeting of People experiencing Poverty in Brussels, 2013 © Rebecca Lee/EAPN; p.16: Slovakian Delegation at the 12th European Meeting of People experiencing Poverty in Brussels, 2013 © Rebecca Lee/EAPN; p.18: UK Delegation at the 12th European Meeting of People experiencing Poverty in Brussels, 2013 © Rebecca Lee/EAPN; Children © UNICEF/SWZ/2011/John McConnico; Drawing on dignity and poverty, 6th European Meeting of People experiencing Poverty, Brussels, 2007 @ Bob Vincke and Emile De Bolle; p.26: European Parliament, 12th European Meeting of People experiencing Poverty in Brussels, 2013 © Rebecca Lee/EAPN; p.28: Demonstration of Indignados, Brussels, 15 October 2011 © Rebecca Lee/EAPN; Message at the 2012 EAPN Annual Conference © Rebecca Lee/EAPN; Mind The Gap © Emanuel Batalha, 12/08/2007, http://10-20mm.blogspot.com/2007/08/mind-gap.html; p.31: Sharing © Megan Russell, 26/07/2007; p.33: Slogan by the Portuguese Delegation at the 12th European Meeting of People experiencing Poverty in Brussels, 2013 © Rebecca Lee/EAPN; p.34: 9th European Meeting of People experiencing Poverty, 2010 © Rebecca Lee/EAPN, Message at the 2012 EAPN Annual Conference © Rebecca Lee/EAPN; Group photo of Delegates, 12th European Meeting of People experiencing Poverty in Brussels, 2013 © Rebecca Lee/EAPN; p.36: Slogan by the German Delegation at the 12th European Meeting of People experiencing Poverty in Brussels, 2013 © Rebecca Lee/EAPN.
This EAPN Explainer on Poverty and Inequality in the EU is the 6th in a series of EAPN Explainers, tackling key issues and debates, which are also priorities within the EU poverty discourse, in understandable, everyday language. They are aimed primarily at people working in civil-society organisations, but also at anybody who is concerned with how to make progress on reducing poverty and social exclusion in the EU.
The booklet is equally intended as a tool for other civil society organisations, trade unions, academics, the media and other stakeholders, including public opinion, to understand the causes and the impact of poverty, social exclusion and inequalities for those directly experiencing them and also for society as a whole.
It is an update of EAPN’s 2009 Explainer on Poverty and Inequality in the EU.
EAPN has already issued a series of 5 explainers:
y Poverty and Inequality in the EU (2009)
y Adequacy of Minimum Income in the EU (2010)
y Wealth, Inequality and Social Polarisation in the EU (2011)
y Towards Children’s Well-being in Europe –Explainer on Child Poverty in the EU (2013), jointly with Eurochild.
y Quality of Work and Employment in the EU (2014)
All EAPN’s publications are available on EAPN’s website www.eapn.eu.
Photo acknowledgments:

7
Contents
CONTENTS . . . . . . . . . . . . . . . . . . . . . . . . . . . . . . . . . . . . . . . . . . . . . . . . . . . . . . . . . . . . . 7
INTRODUCTION . . . . . . . . . . . . . . . . . . . . . . . . . . . . . . . . . . . . . . . . . . . . . . . . . . . . . . . . 9
Why an explainer on Poverty and Inequality? . . . . . . . . . . . . . . . . . . . . . . . . . . . . . . . . . . . . . . . . .9What this explainer will tell you? . . . . . . . . . . . . . . . . . . . . . . . . . . . . . . . . . . . . . . . . . . . . . . . . . . . .10How this booklet was developed . . . . . . . . . . . . . . . . . . . . . . . . . . . . . . . . . . . . . . . . . . . . . . . . . . . .10
POVERTY: WHAT ARE WE SPEAKING OF?. . . . . . . . . . . . . . . . . . . . . . . . . . . . . . . . . 13
Absolute poverty . . . . . . . . . . . . . . . . . . . . . . . . . . . . . . . . . . . . . . . . . . . . . . . . . . . . . . . . . . . . . . . . . .13Relative poverty . . . . . . . . . . . . . . . . . . . . . . . . . . . . . . . . . . . . . . . . . . . . . . . . . . . . . . . . . . . . . . . . . . . .13The new notion of ‘at risk of poverty or social exclusion’ . . . . . . . . . . . . . . . . . . . . . . . . . . . . .14The day-to-day struggle . . . . . . . . . . . . . . . . . . . . . . . . . . . . . . . . . . . . . . . . . . . . . . . . . . . . . . . . . . . .16
HOW IS POVERTY MEASURED? . . . . . . . . . . . . . . . . . . . . . . . . . . . . . . . . . . . . . . . . . . 19
The At Risk Of Poverty or Social Exclusion (AROPE) Composite Indicator . . . . . . . . . . . . .19Living below the poverty line: the AROP indicator . . . . . . . . . . . . . . . . . . . . . . . . . . . . . . . . . . .19Social benefits drastically reduce income poverty . . . . . . . . . . . . . . . . . . . . . . . . . . . . . . . . . . .19Measuring deprivation: the Severe Material Deprivation (SMD) indicator. . . . . . . . . . . . . .20Low work intensity . . . . . . . . . . . . . . . . . . . . . . . . . . . . . . . . . . . . . . . . . . . . . . . . . . . . . . . . . . . . . . . . .20Poverty is a more complex reality . . . . . . . . . . . . . . . . . . . . . . . . . . . . . . . . . . . . . . . . . . . . . . . . . . .21
POVERTY: FACTS AND TRENDS . . . . . . . . . . . . . . . . . . . . . . . . . . . . . . . . . . . . . . . . . . 25
The picture of poverty across the EU . . . . . . . . . . . . . . . . . . . . . . . . . . . . . . . . . . . . . . . . . . . . . . . .25Is the EU going to eradicate poverty? . . . . . . . . . . . . . . . . . . . . . . . . . . . . . . . . . . . . . . . . . . . . . . . .26
INEQUALITY: WHAT IS IT? . . . . . . . . . . . . . . . . . . . . . . . . . . . . . . . . . . . . . . . . . . . . . . . 29
How it is measured . . . . . . . . . . . . . . . . . . . . . . . . . . . . . . . . . . . . . . . . . . . . . . . . . . . . . . . . . . . . . . . . .29Inequality: Key facts and trends . . . . . . . . . . . . . . . . . . . . . . . . . . . . . . . . . . . . . . . . . . . . . . . . . . . . .30
CAUSES OF POVERTY AND INEQUALITY . . . . . . . . . . . . . . . . . . . . . . . . . . . . . . . . 31
Key factors . . . . . . . . . . . . . . . . . . . . . . . . . . . . . . . . . . . . . . . . . . . . . . . . . . . . . . . . . . . . . . . . . . . . . . . . .32
WHAT EAPN FIGHTS FOR . . . . . . . . . . . . . . . . . . . . . . . . . . . . . . . . . . . . . . . . . . . . . . . 35
KEY SOURCES OF INFORMATION AND DATA . . . . . . . . . . . . . . . . . . . . . . . . . . . . . 37


9
IntRoDUCtIon
Poverty in the EU Union is a very real problem which brings misery to the lives of many people, curtails their fundamental rights, limits the opportunities they have to achieve their full potential, brings high costs to society and hampers sustainable economic growth.
Why an explainer on Poverty and Inequality?
In spite of the overall wealth of the European Union (EU), poverty in the EU is still at a relatively high level with 16.9% of the EU population, that is about 85 million people, at risk of relative income poverty and more than 124,2 million people or 24,8 % of the population at risk of poverty and social exclusion - whether being at risk of relative poverty, severely materially deprived or living in a household with very low work intensity.
The crisis has clearly generated more poverty. However, the extent and seriousness of the problem is often not well understood either by policy makers or the general public. As a result, sufficient urgency is not given to its eradication. Often this is because people only think of poverty as being something which is so extreme that it threatens people’s very existence and they associate this mainly with developing countries.
However, the reality is that poverty in the EU Union is a very real problem which brings misery to the lives of many people, curtails their fundamental rights, limits the opportunities they have to achieve their full potential, brings high costs to society and hampers sustainable economic growth.
Poverty also reflects failures in the systems for redistributing resources and opportunities in a fair and equitable manner. These lead to deep-seated inequalities and thus to the contrast of excessive wealth concentrated in the hands of a few while others are forced to live restricted and marginalised lives, even though they are living in a rich economic area. Experience shows that the crisis has had the most devastating impact in the less re-distributive countries with weaker social protection systems. Moreover, austerity policies and cuts in social protection and services have pushed even more people into poverty.

10
The debate on poverty in the EU is often closely associated with “social exclusion”. The term social exclusion is used to emphasize the processes which drive people to the edge of society, which limit their access to resources and opportunities, and curtail their participation in normal social and cultural life leaving them feeling marginalised, powerless and discriminated against.
Another common term associated with poverty is “vulnerability”. People are in a vulnerable situation when their personal well-being is put at risk because they lack sufficient resources, are at risk of being in debt, suffer poor health, experience educational disadvantage, or live in inadequate housing and environment. These are important related concepts. However, not all people who are socially excluded or vulnerable are poor and EAPN in this explainer wishes to focus primarily on the specific dimensions of poverty and inequalities in the EU context.
What this explainer will tell you?
This explainer sets out to provide a simple introduction to the poverty debate. It focuses primarily on current perspectives on the nature and extent of poverty, its causes and its links to inequality. It explains how poverty is understood and measured currently in the EU, and highlights some of the shortcomings of these approaches. This explainer, firstly published in 2007 and updated in 2009 as part of EAPN’s build-up campaign around the 2010 European Year Combating Poverty, was the first of a series of explainers aiming at making poverty more visible, understood and acted on. This version (2014) provides an update, incorporating the latest EU SILC data, and the new EU policy context, namely the Europe 2020 Strategy.
All figures mentioned in this Explainer are 2012 Eurostat and EU SILC data (latest data available).
How this booklet was developed
This explainer is an update of the explainer on Poverty and Inequality in the EU produced by EAPN in 2009. The original explainer was the result of a fruitful collaboration between Hugh Frazer and the EAPN Social Inclusion Review Group.
As this topic is central to EAPN’s work, both at the EU and national levels, the idea of the explainer came out of a need to build a clear consensus amongst the network on what poverty is, in order to inform our common anti-poverty advocacy work towards national and European decision-makers.
The main source of information is EU and other International sources and data combined with reflections from the direct experience on the ground of EAPN’s national membership in 29 European countries, as well as 18 European Organisations.
This update was drafted by Claire Champeix (EAPN Secretariat, Brussels) with support from Sian Jones (EAPN Secretariat) and the EAPN EU Inclusion Strategies Group. The authors would particularly like to thank Michela Gobbo for help with finalizing the text, and to Rebecca Lee and Nellie Epinat (EAPN Secretariat) for proof-reading the final text and coordinating the layout and photographs.
All direct quotes in this explainer come from people experiencing poverty in different European countries. To preserve anonymity, names have been omitted.


12

13
PoVeRtY: WHAt ARe We sPeAKInG oF?
One of the problems with discussing poverty is clarifying what it means and how it can be defined. At the EU level, the notions of absolute and relative poverty are both used to describe poverty. Since 2010, the composite notion of Risk of Poverty or Social Exclusion, which brings together relative monetary poverty, material deprivation and exclusion from the labour market, is also used.
Absolute poverty
Absolute or extreme poverty is when people lack the basic necessities for survival. For instance they may be starving, lack clean water, proper housing, sufficient clothing or medicines and be struggling to stay alive.
The United Nations tends to focus its efforts on eliminating absolute or extreme poverty. The first goal of the United Nations Millennium Development Goals is to eradicate extreme poverty and hunger. Eradicating extreme poverty is translated into the target “halve, between 1990 and 2015, the proportion of people whose income is less than $1,25 a day”1. This target was reached in 2010, when the rate fell to less than half the 1990 rate (700 million fewer people lived in conditions
1. The international poverty line was set at $1 a day at the time the MDGs were established, but since 2008, the World Bank has defined people living in extreme poverty as those living on less than $1.25 a day, reflecting higher price levels in many developing countries than previously estimated. http://www.un.org/millenniumgoals/poverty.shtml
of extreme poverty in 2010 than in 1990) but still 1.2 billion people are living in extreme poverty at the global level.
Although absolute poverty is more common in developing countries, it has increased considerably in Europe over the last few years, particularly with the crisis and the consequent austerity measures.
Relative poverty
Relative poverty is where some people’s way of life and income is so much worse than the general standard of living in the country or region in which they live that they struggle to live a normal life and to participate in ordinary economic, social and cultural activities. What this means will vary from country to country, depending on the standard of living enjoyed by the majority.

14
The European Union’s Social Inclusion Process uses a relative definition of poverty.
What is Relative poverty?
People are said to be living in poverty if their income and resources are so inadequate as to preclude them from having a standard of living considered acceptable in the society in which they live.
Because of their poverty they may experience multiple disadvantages through unemployment, low income, poor housing, inadequate health care and barriers to lifelong learning, culture, sport and recreation. They are often excluded and marginalised from participating in activities (economic, social and cultural) that are the norm for other people and their access to fundamental rights may be restricted.
European Commission, Joint Report on Social Inclusion 2004
The new notion of ‘at risk of poverty or social exclusion’
Until 2010, relative poverty was the main focus when monitoring poverty at the EU level. In 2010, the EU adopted the Europe 2020 Strategy, aimed at guiding the EU towards a smart sustainable and inclusive economy.
Among the five headline targets of this strategy, a poverty target was adopted for the first time, to reduce by 20 million the number of people ‘At Risk of Poverty or Social Exclusion’ (AROPE).
The AROPE indicator is defined as the share of population in at least one of the following three conditions:
Î At risk of poverty (AROP), mean-ing below the relative monetary poverty threshold (60% of median equalized household income)
Î In a situation of severe material dep-rivation (SMD)
Î Living in a household with very low work intensity
The AROPE indicator reflects the multiple facets of poverty and exclusion across an enlarged EU. Read more about this in the next chapter.
The reality of poverty
These “official” definitions, however, often do little to capture the reality of the day-to-day struggle of living in poverty. To understand this better, is it vital to ask people who are themselves experiencing poverty what this means and to involve them directly in identifying and delivering the solutions.
EAPN is committed to ensuring that the voices of those experiencing poverty are heard when describing and defining poverty (see box below) and to promoting their active participation in the development, implementation and monitoring of policies and programmes to eradicate it.

15
What does poverty mean? - What people in poverty think?Lack of basic necessities
“I can afford only cheap food; fruit and vegetables to feed children is too expensive; fish is not affordable; “healthy food” is too expensive for me.”
“I do not live, I survive.”
“My children can see that they don’t have what the others have.”
isoLation
“I have lost friends as I cannot participate in their activities; even to participate in self-help groups needs money and time; I’m short of money and time to participate in discussions.”
“I cannot afford a daily paper; books, especially scientific literature is too expensive.”
bureaucracy and Lack of information
“The system is too complicated, I don’t know where to get what.”
“I have slept in cardboard boxes. I had the choice to die on the street or to take back my life in my own hands. I went to social services to get help to find
a house. I was confronted with an enormous bureaucracy. I had to tell my story several times, each time again and it took years before I got a house.”
“Every time I tell my life to civil servants I receive a lot of compassion, but rules prevent effective aid.”
Lack of resPect and Lack of hoPe
“The way people look at you is humiliating. You are not considered a human being.”
“There is humiliation in being written out of the ordinary decisions that affect you everyday”
“Sometimes you get the feeling that animals are better protected because if you beat a dog you will be sentenced and maybe put into prison whereas if you beat someone I am not sure that you will always be punished for that….
My feeling is that dogs are more respected and better treated than Gypsies.”
“I don’t see any progress since years. I have no future.”
“I feel a little bit like Don Quixote. I am fighting against windmills here and there
and there is no real hope anymore”.
“Give us back our future!”
Lack of decent work
“I work illegally. This is not because I think it is good - I am fully aware of the consequences-, but this is the only way for me to get a job.”
“People live off nothing. Our salaries are too low.”
“Employers do not respect us and our rights.”
fear for one’s chiLdren
“It is impossible for me to invite the friends of my children at home, because my home is so small. So my children in turn are not invited any more. Thus they become also excluded. We are obliged to lead a hidden life.”
“I can deny myself much, but my children have a right to a dignified life.”
“The problem is not that we run out of money occasionally. The real problem is that we live our entire lives this way and our children grow up in this too.”
Voices of people participating in the 6th, 10th and 11th european meetings of People experiencing Poverty (organized under the auspices of the Austrian Presidency of the EU in 2006, of the Hungarian Presidency of the EU in 2011 and
under the Danish Presidency in 2012.

16
The day-to-day struggle
This means that the reality of poverty in the EU is much more a day-to-day struggle to live and survive which can adversely affect your health and psychological well-being and put stress on your personal relationships.
Living in poverty can mean:
y becoming isolated from family and friends;
y lacking hope and feeling powerless and ex-cluded with little control over the decisions that affect your day-to-day life;
y lacking information about the support and services available to you;
y having problems in getting your basic needs met and accessing decent housing, health services and schools and lifelong learning opportunities;
y living in an unsafe neighborhood with high levels of crime and violence and poor envi-ronmental conditions or in a remote and iso-lated rural area;
y going without very basic necessities because you may not be able to afford essential utili-ties like water, heat and electricity or to buy healthy food or new clothing or to use public transport;
y being unable to afford to buy medicines or visit the dentist;
y living from day to day with no savings or re-serves for times of crisis such as losing a job or falling ill and thus falling into debt;
y being exploited and forced into illegal situa-tions;
y experiencing racism and discrimination;
y being unable to participate in normal social and recreational life such as going to the pub or cinema or sports events, visiting friends or buying birthday presents for family members.
Overall, the reality of poverty in the EU is that it affects many aspects of people’s lives and limits people’s access to their fundamental rights. People affected often experience a range of different disadvantages which combine to reinforce each other and trap them in poverty. Poverty limits the opportunity for people to reach their full potential. For instance, children growing up in poverty are more likely to suffer poor health, do less well at school and become the next generation of adults at risk of unemployment and long-term poverty.

17
THE PROBLEM WITH COMPARING RELATIVE POVERTY LEVELS
comparing relative poverty levels between different coun-tries does not sufficiently take into account the differences in standards of living. in reality it is more a measure of inequality.
for example a person who is relatively poor in a rich country usually suffers less material deprivation than someone who is living in a country with low overall living standards. in these countries poverty can be more extreme, you are more likely to lack basic necessities and sur-vival can be more of a struggle, but because the general living standards are lower in these countries, there may be less rela-tive poverty i.e. less difference between the “poor” and the liv-ing standards of everybody else.
this can lead to misunderstand-ings about the extent of poverty and run the risk of underplay-ing the severity of the poverty suffered by some groups, par-ticularly in some new member states. of course, the worst situation is to be found in those eu countries with both a low overall standard of living and a high level of relative poverty.
in order to take account of the different economic situation in different member states, when the eu list of commonly agreed indicators for social inclusion were endorsed by the 2001 Laeken european council, it was emphasized that the value of the at-risk-of-poverty threshold should always accompany the indicator of those at risk of poverty i.e. what it means in monetary terms - purchasing power in euros.
18

19
HoW Is PoVeRtY MeAsUReD?
The At Risk Of Poverty or Social Exclusion (AROPE) Composite Indicator
People are considered to be At Risk of Poverty or Exclusion if they are at risk of relative monetary poverty (AROP indicator) and/or severely materially deprived (SMD indicator) and/or living in households with very low work intensity. People are counted only once even if they fall under all of the three situations.
Living below the poverty line: the AROP indicator
Within the EU, relative poverty is measured by using relative-income poverty lines. This involves working out average or median equalized household incomes in a country.
A poverty line is then set, which is a percentage of that average income. Commonly these poverty lines range from 40-70% of household income. This gives one an overall picture of the risk-of-poverty rate but the figures can also be broken down by age, gender, household type and employment status to give a more detailed picture of who is at greatest risk. This means that one can examine the particular situation of specific groups such as children or older people or the unemployed.
In the EU, people falling below 60% of median income are said to be “at-risk-of monetary poverty” (AROP indicator).
One of the limitations of a relative income poverty line is that choosing a cutoff point is a rather arbitrary process. It tells us what proportion of people are poor but does not sufficiently take into account other factors that affect people’s situations such as how far below the poverty threshold they are or the length of time they have been poor.
Measuring the poverty gap can help to assess in which state poor people falling below a poverty threshold actually are, that is the intensity of poverty. The poverty gap measures the distance between the (median equalized) income of people living below the poverty threshold and the value of that poverty threshold in terms of purchasing power.
Social benefits drastically reduce income poverty
When measuring relative monetary poverty, it is interesting to look at levels of poverty before and after income transfers through a country’s social welfare system as this gives an indication of the effectiveness of a country’s system of redistribution.

20
In the EU Member States the risk-of-poverty rate would be considerably higher than it is in reality if there were no social transfers. In the most generous and efficient systems the relative monetary poverty rate is reduced by social transfers by 50% (in Denmark, Ireland, Luxembourg, Austria, Finland, and Sweden) or more whereas in the least efficient the rate is reduced by only 20% or less (in Bulgaria, Greece and Italy).
Measuring deprivation: the Severe Material Deprivation (SMD) indicator
Deprivation indicators are another important approach to measuring relative poverty. These are an attempt to move beyond just monetary indicators and to take better into account the actual standard of living that people enjoy.
Essentially the approach involves identifying goods or activities which are seen as basic necessities in the country someone is living.
In some countries poverty is measured by combining relative income lines with deprivation indicators.
At the EU level, extreme poverty is approached through the indicator of severe material deprivation (SMD). A person is considered as severely materially deprived when s/he cannot afford at least 4 of a list of 9 items considered to be necessary or desirable, namely: to pay rent or utility bills, to keep home adequately warm, to face unexpected expenses, to eat meat, fish or a protein equivalent every second day, to take a week’s holiday away from home, run a car, a washing machine, a colour TV, or a telephone.
This indicator presents some limitations linked to the small number of items in the list and the low relevance of some of them. It is being improved but because of the regulatory and data collection delays, it will be several years before an improved indicator can be made available at EU level.
Low work intensity
The work intensity of a household is the ratio of the total number of months that all working-age (18-59 years) household members have worked during the income reference year and the total number of months the same household members theoretically could have worked in the same period.
A household is considered to have a very low intensity when its work intensity falls below a threshold set at 0.20. This indicator attempts to capture how many people are living in job-less or nearly job-less households. In 2012, 10,5% of the European population lived in households with very low work intensity. That rate varies among the Member States: the indicator is less than 7% in Sweden, Luxembourg, Cyprus, Czech Republic and Poland; it exceeds 12% in Bulgaria, Hungary, the United Kingdom, Belgium, Greece, Spain and Croatia.
Very low work intensity is most common in single-person households (23,8%) and single-person households with dependent children (28,7%).

21
the eu poverty headline target: an opportunity for the fight against poverty?In 2010 the EU agreed on the Europe 2020 Strategy, aiming at guiding key policies such as economic, employment, research, education and social policies – implemented both at the EU and at the national level - on the path towards “a smart, sustainable and inclusive growth”.
“Lifting at least 20 million people out of poverty and social exclusion” is one of the five headline targets of this strategy. It is monitored on the basis of the aggregate at-risk-of-poverty-or social exclusion indicator, and allow Member States to prioritize how they want to contribute to this EU objective, i.e. which indicator they wish to track progress towards the target by.
A series of instruments have been put in place to coordinate actions implemented by the Member States, including Integrated Guidelines published by the Commission and the Council, National Reform Programmes drafted by Member States reporting on their policies and how they contribute to the goals, and Country-Specific Recommendations agreed by the Commission and the Council on the basis of their analysis of progress made by each Member State.
Anti-poverty organisations welcomed the adoption of this target as a major achievement, and a possible driver for the fight against poverty. But to date the ambition to reach the target objective is clearly lacking. The reality is that the cumulative objectives of Member States fall significantly below the target of reducing by 20 million the number of people living in poverty or social exclusion. The current economic stagnation, austerity policies and lack of ambition from Member States make the realisation of the target unlikely if current policies are pursued.
Poverty is a more complex reality
The AROPE composite indicator captures just part of the picture and does not fully describe the complexity of poverty. It is important that its three components keep being monitored separately. It is also important to measure other elements that capture the multi-dimensional nature of poverty.
These include things such as the level of indebtedness, the extent of poor health or educational disadvantage, the number of people living in inadequate housing and poor environmental conditions and the extent to which people have inadequate access to public services.
At the EU level, an extended set of indicators exists since 2001 in the framework of the Social Open Method of Coordination in the field of social protection and social inclusion. It includes a set of sixteen core indicators (including at risk-of-poverty rate, but also indicators on access to health, school dropout, in-work poverty….) as well as six contextual indicators (such as unemployment rate, life expectancy, social protection expenditure…). New indicators are being developed.

22
the open method of coordination or social omc2
The European Commission supports and complements the Member States’ policies in the fields of social inclusion and social protection. It works together with EU countries through the Social Protection Committee using the Open Method of Co-ordination in the areas of social inclusion, health care and long-term care and pensions (social OMC).
The social OMC is a voluntary process for political cooperation based on agree-ing common objectives and measuring progress towards these goals using common indicators and through com-mon reporting (National Social Reports), exchange and review mechanisms (Peer Review). The process also involves close co-operation with stakeholders, includ-ing Social Partners and civil society.
Existing indicators however -which are delayed in time-, cannot accurately reflect rapid changes in the situation of people.
Most EAPN networks consider that the dramatic deterioration of the living conditions of the most vulnerable due to the economic crisis and austerity policies wasn’t reflected by the EU indicators in a timely enough way. Official indicators should be complemented by quantitative and qualitative information gathered by NGOs working on the ground. For examples, the number of requests for food aid registered is a relevant alert signal of a degradation of the social situation.
Most EAPN networks consider that more work needs to be done to capture the di-verse reality of poverty from the perspective of those suffering from it, as part of the EU’s Social Open Method of Coordination.2. See http://epp.eurostat.ec.europa.eu/portal/page/portal/employment_social_policy_equality/introduction
the ‘social trends to watch’: using social indicators to raise the profile of social issues
Indicators from the social portfolio have been used by the Commission and the Social Protection Committee to monitor developments in each Member State. It is vital that the outcomes of this sur-veillance are taken into account in the general coordination of policies at the EU level in the framework of the Europe 2020 Strategy.
Since 2011, indicators are being used in the Joint Assessment Framework (JAF) developed at EU level to monitor na-tional developments in the employment and social areas.
The Social Protection Committee has set up in 2012 a new tool using the current indicators aimed at strengthening the monitoring of the social situation and the evidence base: The Social Protection Performance Monitoring using an ex-tensive set of indicators helps to identify Trends To Watch and recent trends de-fined as areas where significant numbers of countries perform badly or positively.
Simple, clear and strong messages are now formulated by the SPC in their Annual Report, on the basis of these. EAPN questions: Will they be given sufficient attention in policy making processes strongly dominated by mac-roeconomic and financial concerns? Will the ‘Social Trends To Watch’ be integrated into the National Reform Programmes and the Country Specific Recommendations addressed by the Commission to each Member State?

23
Other methods
Other ways to measure poverty include:
• The Budget Standard Approach or Reference Budgets where poverty is calculated based on the cost of a specific basket of goods and services (i.e. covering things like food, clothing, personal care, health related costs, household goods and services, educational costs, housing, transport, fuel etc.) that are considered by experts or by society in general to represent a basic standard of living3.
• The Food Ratio Method where the poor are distinguished from the non-poor by how much of their income they spend on basic necessities such as food, clothes and shelter – generally research has shown that people on low incomes have to spend a higher proportion of their incomes on basic ne-cessities leaving almost nothing for participating in normal social, recreational and cultural activities.
• The United Nations Poverty Index which combines measures such as life expectancy, literacy, long-term unemployment and relative income into a single composite measure. Read more here.
• The UNICEF Report Card on Child Well-Being which moves beyond just income poverty and com-bines indicators of material well-being, health and safety, educational well-being, family and peer re-lationships, behaviours, risk and subjective well-being. Read more here.
3. This approach has been strongly endorsed by the Commission as part of the Social Investment Package published in February 2013, in the Active Inclusion Implementation Report, with proposals to support the development of a common methodology together with Member State representatives. See EC COM: Towards Social Investment for Growth and Cohesion including implementing the European Social Fund (2014-20)

24
` The use of equalized household income, runs the danger of underrepresenting the situation of women or dependent adults within the household, as assumptions are made that income is equally distributed within the household i.e. that each partner in the family has access to the same amount of money. Women’s generally lower income is often hidden, which is the more serious where they have the direct responsibility for the expenditure for children or other dependents.
` Overall, national and European data on relative income poverty (the at risk-of-poverty line) do not identify some key groups at very high risk such as people living in institutions, homeless people and other difficult to-reach groups such as black and minority ethnic people or migrants and asylum seekers. Thus more focused research is needed on these groups.
` The at-risk-of-monetary-poverty rate is a relative measure of poverty based on the median threshold. This threshold varies over time and in a number of Member States it has fallen in recent years due to the economic crisis, because of the general drop in household incomes. As a result the at-risk-of-monetary-poverty
rate may have remained stable or even reduced (e.g. in Bulgaria) whereas the living conditions of the most vulnerable have actually deteriorated appallingly. This has made it difficult to highlight the social consequences of the crisis and of the austerity cuts. No indicators taken in isolation can depict the social situation in a given country. Analysis should take on board the broad context and build on the expertise of people in poverty themselves and the NGOs working with them on the ground.
` The real value of the poverty threshold
Comparing monetary poverty rates between countries can hide significant differences in the real standard of living unless the actual value of the poverty threshold is taken into account, within each country. That is, when you look at how much money somebody has to live on if they are on the poverty line in different countries (the at-risk-of-poverty threshold) the differences can be stark.For instance a single person on the poverty line in Romania lives on only € 2,161 a year, € 3,476 in Bulgaria, and between €3,603 and €5,117 in Latvia, Lithuania, Hungary and Poland. He/she would earn €15,996 in Luxemburg and €11,196 euros in Denmark.

25
PoVeRtY: FACts AnD tRenDs
The picture of poverty across the EU
The most recent data available (2012) show that 24,8% of the EU population, that is about 124,5 million people, are at risk of poverty or social exclusion. 16,9% of the population in the EU is at risk of relative income poverty, 9,9% is severely materially deprived, and 10,5% is living in households with very low work intensity.
However there is a wide difference between Member States: for instance, between 15% and 18,5% of the population are at risk of poverty or social exclusion in the Czech Republic, Luxembourg, Netherlands, Austria, Sweden, whereas 40% or over are at risk in Bulgaria and Romania.
Children (0-17) have a particularly high rate of poverty or social exclusion at 28%. One-parent households and those with dependent children have the highest poverty risk. For single parents with dependent children the risk of monetary relative poverty is 34,5%.
The risk is also particularly high among young people (18-24) at 23,1% .
Women are globally more at risk of relative monetary poverty with a rate of 17, 6%.
4. This chapter presents the latest EU figures on poverty that can be found on the Eurostat website at http://epp.eurostat.ec.europa.eu/portal/page/portal/eurostat/home/ and that rely strongly on the analysis developed by the European Commission in its publication Employment and Social Development in Europe 2012 published in January 2013.
Of course, these figures do not include some of those in the most extreme situations such as some minority ethnic groups, especially the Roma, immigrants including undocumented migrants, the homeless, people living in or leaving institutions etc.
The crisis has reversed the decreasing trend in severe material deprivation (SMD) which rose markedly in several Member States between 2008 and 2012. The most notable rises were in Greece, Lithuania and Hungary (up around 8 percentage points), while Ireland, Estonia, Malta, Cyprus Latvia and Italy also experienced rises between 4,5 and 7 percentage points. Overall at the EU level, single-person households with dependent children are the most severely materially-deprived (21,3%) followed by single households (both male and female 12,2%) and households with two adults and three or more dependent children (11,8%).
In most, but not all, Member States where poverty affects a large share of the population, it also tends to be more severe. The depth or severity of poverty (i.e. how far below the at-risk-of-poverty threshold the income of people at risk of poverty is) for the EU as a whole in 2012 was 23,5 % : this means that half of those living under the poverty line were at least 23,5 % below the relevant at-risk of poverty threshold. The depth of poverty ranges from as low as 15 % in Finland to as high as 28,6% in Latvia and

26
30,9% in Romania. In Spain, this rate jumped from 24,4 % in 2008 to 31,4 % in 2012. The depth of poverty has worsened in most countries during the crisis: among people facing monetary poverty, more people have dropped to the bottom of the income distribution ladder since the beginning of the crisis.
Unemployment is a key factor in people being at risk of poverty.
In 2012, 46,7 % of people who were unemployed were at risk of poverty. Severe material deprivation among unemployed people is also higher than within the whole population. In 2012, 12,5 million people in the EU suffered both severe material deprivation and were living in a household with very low work intensity.
Thus, while a job is a key route out of poverty, not all jobs pay enough to actually lift someone out of poverty. The working poor represent 1/3 of the working age adults at risk of poverty.
In 2012, 9,1% of the people in employment were living under the poverty threshold. In-work poverty significantly increased in 1/3 of EU countries between 2006 and 2011 (in Bulgaria, Denmark, France, Germany, Ireland, Malta, the Netherlands, Romania, Slovenia,
and Spain). 19,1% of workers were in poverty in
Romania in 2012, 12,3% in
Spain and 15,1 % in
Greece.
Is the EU going to eradicate poverty?
The EU has set itself the objective to overcome poverty and make significant progress on the eradication of poverty since 2000. In 2010, the Heads of States and Governments committed themselves to reducing poverty and social exclusion by at least 20 million people. Is this going to happen?
The 2012 overall figure for the percentage of people-at-risk-of-monetary poverty (16,9%) is not very different from that from 2005 (16,4%) but in a context of decreasing household income this may hide increasing monetary poverty in reality. The AROPE indicator has not varied a lot since 2008 (23,7 %) but the crisis appears to have stopped the previous trend of slow continuous reduction.
It is very important to acknowledge that since the crisis the divergence between different parts of the EU is growing, with a new divide emerging between Southern and Eastern European countries where the social situation is deteriorating more severely than in Western and Northern countries. Countries with robust welfare systems have shown better resilience.
Austerity policies implemented although the EU have accelerated this social deterioration, through the limitations in wages and benefits and the cuts in services.
Whether poverty and social exclusion will be effectively combated over the next years will depend notably on the capacity of the EU and the Member States to acknowledge the negative impact of harsh austerity policy and to implement a balanced approach to crisis recovery likely to preserve human capital, human dignity and the European Social Model.

27
the harsh sociaL imPact of the crisis
Poverty in Europe has not been created by the financial and economic crisis which started in 2008. However the crisis and the austerity policies implemented throughout the EU has been dramatically increasing the extent and the depth of poverty. This is particularly the case for countries for which the support from international organisations (International Monetary Fund, European Central Bank) as well as from the EU (Troika Programme countries) has been made conditional on huge budget cuts.
The social impact of the crisis and of the austerity measures has been too often underplayed. Millions of EU inhabitants are now trapped in a vicious circle, as this crisis has impacted on the most vulnerable in several ways:
y Unemployment, but also reduced salaries and hours, and general weakening of employment rights and quality of work;
y Mortgage crisis, forcing people to leave their homes often still with huge debts to repay;
y Reduced unemployment and social assistance benefits (reduction in duration, amounts, tightened eligibility rules…);
y Reduced access to public services (including health, transport…) due to budget cuts at national and local level;
y Decrease in public and private funding, weakening the last resort emergency services that people in need have been relying on.
The consequences are enormous, notably the substantial worsening of the persistence and depth of poverty and the rise of child poverty. The lasting exclusion from the labour market of large numbers of young people raises burning challenges for their future: will they be a ‘lost generation’? The deterioration of mental health, the increasing feeling of despair - and increasing number of suicides- are also extremely worrying. Inequalities are worsening and social cohesion is at stake, in times of rising xenophobia with a loss of trust towards democratic institutions including towards the future EU project5.
5
5. For a detailed analysis, see Social Europe, current challenges and the way forward, Report by the Social Protection Committee, 2013, http://ec.europa.eu/social/main.jsp?langId=en&catId=758.

28
29
IneQUALItY: WHAt Is It?
The problem of poverty is fundamentally linked to the issue of how resources are distributed and redistributed in a country. in the colour shade of the chapter
Unlike poverty, which concentrates on the situation of those at the bottom of society, inequality shows how resources are distributed across the whole society. This gives a picture of the difference between average income, and what poor and rich people earn, and highlights how well different Member States redistribute or share the income they produce.
Data on inequality is vital when considering poverty, as the overall distribution of resources in a country affects the extent and depth of poverty. This is important as the monetary poverty levels in the EU are calculated in relation to median income. Looking at inequalities is particularly crucial at a time when in many countries the financial efforts necessary to get out of the budget crisis are not necessarily asked of the rich.
Generally, countries with high levels of inequality are also likely to have high levels of poverty and those with lower levels of inequality are likely to have lower levels of poverty. This shows that the problem of poverty is fundamentally linked to the issue of how resources are distributed and redistributed in a country.
How it is measured
Income inequality in the EU is normally measured in two ways: the S80/S20 ratio and the Gini coefficient. Both these measures can be difficult to understand and have some basic limitations in terms of capturing an accurate picture on inequality.
The S80/S20 ratio is the ratio of the total income received by the 20% of the country’s population with the highest income to that received by the 20% of the country’s population with the lowest income. The higher the ratio the greater the inequality.
The Gini coefficient is a way of measuring the inequality of distribution of income in a country. It takes account of the full income distribution whereas the S80/S20 ratio only looks at the top and bottom. It is a technical formula which identifies the relationship of cumulative shares of the population arranged according to the level of income, to the cumulative share of the total amount received by them. If there were perfect equality (i.e. if each person received the same income), this coefficient would be 0%. If the entire national income were in the hands of only one person then the coefficient would be 100%. The higher the coefficient - the greater the inequality in the distribution of income in a country. You can read more about the technical aspects of the Gini coefficient in Wikipedia.
30
PoVerty and weaLth haVe to be studied toGether.
In the EU inequality is studied by looking at the distribution of income. However, this is only part of the picture.
Another key element in inequality is the study of wealth: where it comes from, who has it, and how society redistributes it. An important area is the extent to which
people own capital and assets of one sort or another – for example, property, shares and investments.
However, there is a lack of comparable data across Europe on ownership of capital and assets. Unfortunately depending on income distribution only gives a partial picture and may well lead to a significant underestimation of inequality in some Member States. (See EAPN Explainer on wealth, inequality and social polarisation).
Inequality: Key facts and trends
There is a considerable diversity within the EU in the degree of income inequality, measured by the ratio of the income share of the top 20% to that of the bottom 20%. The ratio for the EU’s 27 Member States before Croatia joined as a whole is 5,1 (2012) but this varies from 3,4 up to 7.2. Austria, Belgium, Czech Republic, Finland, Hungary, Luxembourg, Netherlands, Sweden, Slovenia and Slovakia have the lowest inequality ranging between 3,4 and 4,1 while the highest inequality is to be found in Bulgaria, Greece, Latvia, Lithuania, Portugal, Romania and Spain ranging from 5,3 up to 7,2. There has been a steady upward trend in inequality since 2000 when the EU ratio was 4,5.
The Gini coefficient shows a similar ranking pattern to the S80/S20 ratio. The overall EU figure (2012) is 30,6, an increase from 29 in 2000. The lowest inequality is in Austria, Czech Republic, Finland, Hungary, Netherlands, Slovenia, Slovakia, and Sweden, (23,7 to 27,6) and the highest is Bulgaria, Greece, Latvia, Portugal, Romania, Spain and the UK (33,2 to 35,7).

31
CAUses oF PoVeRtY AnD IneQUALItY
The overall persistent high level of poverty in the EU suggests that poverty is primarily the consequence of the way society is organized and resources are allocated. The decisions over how to eradicate poverty in the end are political choices about the kind of society we want.
Some people imagine that in a rich region like the EU, no one can be poor or if they are it must be the result of some personal failings or problems. However, this is not the case.
The overall persistent high level of poverty in the EU suggests that poverty is primarily the consequence of the way society is organized and resources are allocated, whether these are financial or other resources such as access to housing, health and social services, education and other economic, social and cultural services.
In times of austerity, some political choices made have deepened poverty and inequalities (cuts in income and services, deregulation of the labour market...).
Indeed, the fact that there are very different levels of poverty in different Member States demonstrates clearly that different approaches to allocating resources and opportunities lead to different outcomes.
The least unequal societies in Europe tend to have the lowest levels of poverty, and to have been less impacted by the crisis. This is primarily because these Governments choose to give priority to ensuring adequate minimum income levels and ensuring good access to services, through the social protection system and through guaranteeing minimum wage levels. They are usually the most effective at redistributing wealth through the tax and other systems. This means that the decisions over how to eradicate poverty in the end are political choices about the kind of society we want.

32
Key factors
In terms of individuals, some key factors are seen as making a person more “at risk” of being in poverty such as:
Î unemployment or having a poor quality (i.e. low paid or precarious) job as this limits access to a decent income and cuts people off from social networks;
Î low levels of education and skills because this limits people’s ability to access decent jobs to develop themselves and participate fully in society;
Î the size and type of family i.e. large families and lone-parent families tend to be at greater risk of poverty because they have higher costs, lower incomes and more difficulty in gaining well paid employment;
Î gender - women are generally at higher risk of poverty than men as they are less likely to be in paid employment, tend to have lower pensions, are more involved in unpaid caring responsibilities and when they are in work, are frequently paid less even for the same job ;
Î disability or ill-health because this limits ability to access decent employment and also leads to increased day to day costs;
Î being a member of minority ethnic groups such as the Roma and immigrants/undocumented migrants as they suffer particularly from discrimination and racism and thus have less chance to access employment, and often are forced to live in worse physical environments and have poorer access to essential services;
Î living in a remote or very disadvantaged community where access to services is worse;
All these factors create additional barriers and difficulties, but should be seen within the overall structural context of how a particular country chooses to distribute wealth, tackle inequality and face difficult times.


34

35
WHAt eAPn FIGHts FoR
As shown in this explainer defining poverty and social exclusion is a complex task. A multiplicity of approaches exist that try to define poverty.
These definitions are useful but should always be used with care since each definition reflects a specific point of view and often goes together with specific policy options.
In the end, if an approach of poverty is to be underpinned by the respect for the dignity and the rights of people, the following prerequisites should be matched.
These points have been constantly promoted by EAPN:
✔ People experiencing poverty as well as the organisations working with them should always be part of the debate on the definition and indicators of poverty; only their participation is likely to ensure that indicators reflect the complex reality on the ground and can be the reference for efficient solutions;
✔ Poverty is multidimensional and should not be restricted to one or another dimension; both relative and absolute poverty should be considered;
✔ At the national and regional levels tools for the analysis and the monitoring of
poverty and social exclusion should be constantly improved both at the national and EU levels to allow new developments to be taken into account as well as the social impact of new policies to be assessed; governments should also rely on the immediate knowledge of NGOs working with people experiencing poverty on the ground;
✔ At the EU level, the full set of social indicators agreed under the social OMC should be at the centre of EU policy making and should also be used to prevent negative social impact of other policies (i.e. ex-ante coordination); the relevance, timeliness and comparability of these indicators should be constantly improved; qualitative information coming from NGOs working with People Experiencing Poverty on the Ground should also be used at the EU level;
✔ Awareness of the reality of poverty and of the trends observed through indicators should be raised amongst wider audiences; action should be taken in this direction at the national and EU levels; outcomes of the monitoring of quantitative and qualitative indicators should be the subject of democratic debate in National Parliament and in the European Parliament;
36
✔ Monitoring poverty should go together with monitoring inequalities; policies for combating poverty should address the widening inequalities in our societies. Better indicators should be developed to capture inequalities in wealth, as well as inequality and in access to services and other resources, and rights. Eradicating poverty implies rethinking about the society we want and to move towards a more equal society.
✔ Awareness should also be raised on the reasons why poverty should be combated. Poverty is first an attack on fundamental rights and the EU set itself the duty of combating poverty and established concrete targets which should be implemented. Poverty is also endangering the future prosperity of our society as well as economic recovery. Fighting poverty is a wise investment, not a luxury expense.
✔ A Poverty Target is useful as a political instrument to drive policies against poverty, if it is underpinned by serious policy ambition, treated equally with other targets, applied consistently by EU Member States and given a high level of priority among other objectives.
✔ The targets also need to be linked to concrete instruments for delivery i.e. a an EU and national multidimensional anti-poverty strategy, supported by adequate EU and national funding; A strategy should be used as a tool to mainstream the fight against poverty and social exclusion in all policies and ensure that different policies pursue this objective consistently;
✔ Social protection benefits, but also accessible quality services and personalized pathways to employment should be implemented by Member States to fight poverty and social exclusion according to an integrated ‘Active Inclusion’ approach6 for people who are able to work or find quality jobs, but access to rights, resources and services must be guaranteed to all groups, at all ages if poverty is to be tackled effectively and the transmission of poverty avoided.
✔ In their concerted efforts to exit from the crisis Member States should avoid generating even more poverty among the people of the European Union, by ensuring a coherent, balanced approach to economic and social policy that contributes to building a strong European Social Model.
6. See http://ec.europa.eu/social/main.jsp?catId=1059&lang Id=en and EAPN’s publications Active Inclusion: Making It Happen (2011): http://www.eapn.eu/en/news-and-publications/publications/eapn-books/active-inclusion-making-it-happen, and 10 Arguments in support of Active Inclusion (2014): http://www.eapn.eu/images/stories/docs/EAPN-position-papers-and-reports/2014-10-Arguments-to-support-Active-Inclusion.pdf

37
KeY soURCes oF InFoRMAtIon AnD DAtA
EU-SILC
The main source for comparable annual data on the level and composition of poverty and inequality in the EU is Community Statistics on Income and Living Conditions (EU-SILC).
The statistics can be found on the Eurostat web site at: http://epp.eurostat.ec.europa.eu/portal/page/portal/eurostat/home
Eurostat
Eurostat is the official statistical data office of the EU and in addition to EU-SILC has a lot of relevant data pertaining to issues of poverty and inequality.
Eurostat website: http://epp.eurostat.ec.europa.eu/portal/page/portal/eurostat/home
In addition Eurostat produces a number of relevant publications such as the Statistics in Focus bulletin, the annual European Social Statistics and various sectoral publications.
DG Employment, Social Affairs and Equal Opportunities, European Commission
It produces valuable analyses of data on poverty and social exclusion as part of the EU social inclusion process. In particular the annual Employment and Social Developments reviews contain important information and analysis. These can be found on the DG’s
social inclusion web site under Publications and documents at: http://ec.europa.eu/social/home.jsp?langId=en
Also on this web site one can find important research reports on different aspects of poverty and social exclusion in the EU. These include studies commissioned by the European Commission http://ec.europa.eu/social/main.jsp?catId=791&langId=en and reports prepared by the network of independent experts on social inclusion who advise the European Commission
http://ec.europa.eu/social/main.jsp?catId=1025&langId=en
Social Protection Committee
(2013) Social Europe – Many ways, one objective - Report of the Social Protection Committee (19/03/2014)
http://ec.europa.eu/social/main.jsp?catId=738&langId=fr&pubId=7695
European Networks of Independent Experts on Social Inclusion
(2013) Investing in children: breaking the cycle of disadvantage (an analysis by the European Network of Independent Experts on Social Inclusion)
http://ec.europa.eu/social/main.jsp?catId=1025&langId=en&newsId=2061&moreDocuments=yes&tableName=news

38
European Networks
EAPN produces regular reports, briefings and tool kits on poverty and social exclusion in the EU, reflecting the work carried out by its national networks (www.eapn.eu).
In addition to EAPN, there are a number of key European-level networks of organisations involved in the fight against poverty and social exclusion and members of EAPN which prepare important reports and information briefings on particular aspects of poverty and social exclusion. These include:
• AGE PLATFORM EUROPE (a European network of and for people aged 50+ representing directly over 30 million older people in Europe): http://www.age-platform.org/
• CARITAS EUROPA (a network of Catholic relief, development and social service organisations): http://www.caritas-europa.org/
• EUROCHILD (a network of organisations and individuals working in and across Europe to improve the quality of life of children and young people): http://www.eurochild.org/
• FEANTSA (the European Federation of National Organisations working with the Homeless): http://www.feantsa.org/
• ATD QUART MONDE (International Movement ATD Fourth World): http://www.atd-quartmonde.org/
More European networks can be found in EAPN’s membership list http://www.eapn.eu/en/who-we-are/our-members, on the European Commission’s social inclusion
website http://ec.europa.eu/social/main.jsp?langId=en&catId=750 and the SOCIAL PLATFORM’s web site (The Platform of European Social NGOs: http://www.socialplatform.org/).
Eurofound
The European Foundation for the Improvement of Living and Working Conditions is an EU body that conducts a number of surveys on employment and social conditions in EU countries. Among its regular surveys are the European Quality of Life Survey, the European Working Conditions Survey and the European Survey on Working Time and Work-Life Balance: http://www.eurofound.europa.eu/index.htm
OECD
The Organisation for Economic Co-operation and Development provides important comparative statistics and reports on social protection and related matters: http://www.oecd.org/
UNICEF
The UNICEF Innocenti Research Centre in Florence produces important reports on child poverty including its recent report An overview of child well-being in rich countries: http://www.unicef.org/research/index.html
UNDP
The United Nations Development Programme publishes an annual Human Development Report which produces a Human Development Index, a composite index of quality of life and standard of living indicators: http://hdr.undp.org/en/

39
The UNDP’s regional office for Europe and the Commonwealth of Independent States also produces important statistics and reports on poverty in its region: http://europeandcis.undp.org/?menu=p_practice&FocusAreaId=1
Indicators
Important information and the result of discussions on indicators to measure poverty and social exclusion can be found on the web site of the Indicator’s Sub Group of the EU’s Social Protection Committee: http://ec.europa.eu/social/main.jsp?catId=830&langId=en
Another very detailed and useful discussion on indicators and statistics in the EU’s social inclusion process can be found in The EU and Social Inclusion: Facing the challenges by E. Marlier et al (The Policy Press, 2007)
http://policypress.universitypressscholarship.com/view/10.1332/policypress/9781861348845.001.0001/upso-9781861348845-chapter-7

This EAPN Explainer on Poverty and Inequality in the EU is the 6th in a series of EAPN Explainers, tackling key issues and debates, which are also priorities within the EU poverty discourse, in understandable, everyday language. They are aimed primarily at people working in civil-society organisations, but also at anybody who is concerned with how to make progress on reducing poverty and social exclusion in the EU.
The booklet is equally intended as a tool for other civil society organisations, trade unions, academics, the media and other stakeholders, including public opinion, to understand the causes and the impact of poverty, social exclusion and inequalities for those directly experiencing them and also for society as a whole.
This explainer sets out to provide a simple introduction to the poverty debate. It focuses primarily on current perspectives on the nature and extent of poverty, its causes and its links to inequality. It explains how poverty is understood and measured currently in the EU, and highlights some of the shortcomings of these approaches. This explainer, firstly published in 2007 and updated in 2009 as part of EAPN’s build-up campaign around the 2010 European Year Combating Poverty, was the first of a series of explainers aiming at making poverty more visible, understood and acted on. This version (2014) provides an update, incorporating the latest EU SILC data, and the new EU policy context, namely the Europe 2020 Strategy.
Poverty in the EU Union is a very real problem which brings misery to the lives of many people, curtails their fundamental rights, limits the opportunities they have to achieve their full potential, brings high costs to society and hampers sustainable economic growth.
This explainer was drafted by Claire Champeix (EAPN Secretariat, Brussels) with support from Sian Jones (EAPN Secretariat) and the EAPN EU Inclusion Strategies Group. It is an update of the explainer on Poverty and Inequality in the EU produced by EAPN in 2009. The original explainer was the result of a fruitful collaboration between Hugh Frazer and the EAPN Social Inclusion Review Group.
european anti-Poverty network. reproduction permitted, provided that appropriate reference is made to the source. september 2014.
The European Anti-Poverty Network (EAPN) is the largest European network of national, regional and local networks, involving anti-poverty NGOs and grassroots groups as well as European Organisations, active in the fight against poverty and social exclusion. It was established in 1990.