2014 · the afs 2014 and the sr 2014. the three reports are complementary and cross references are...
TRANSCRIPT

20 2014INTEGRATED REPORT

CONTENTSTransnet’s reporting for 2014 consists of three reports
Volume 1
Volume 2
Volume 3
20 2014INTEGRATED REPORT
20
SUSTAINABILITY REPORT
2014
The Integrated Report 2014 (IR 2014) is the Company’s primary report to all stakeholders.
The Annual Financial Statements 2014 (AFS 2014) including reports of the independent auditors, directors and the corporate governance report.
The Sustainability Report 2014 (SR 2014) documents Transnet’s economic, social and environmental dividends.
20 2014ANNUAL FINANCIAL STATEMENTS
Throughout the reports, readers are referred to places where they can find more detail on particular topics, using these pointers:
Refers to Volume 1 for further information
Refers to Volume 2 for further information
Refers to Volume 3 for further information
SOCIAL DIVIDENDS
FINANCIAL SUSTAINABILITY
HUMAN CAPITAL
CAPITAL INVESTMENT
ECONOMIC DIVIDENDS
PRODUCTIVITY AND EFFICIENCY
ENVIRONMENTAL DIVIDENDSREGULATORY
SAFETY, HEALTH, ENVIRONMENT AND QUALITY (SHEQ)
VOLUME GROWTH GOVERNANCE
Commentary on the Market Demand Strategy (MDS) focus areas and sustainability outcomes are indicated by these icons:
About the Integrated Report– Suite and interaction between reports 1– Reporting philosophy and approach 2– Summary of materiality and boundary 2– Approach to assurance 2– Performance overview 2– Condolences 2– Appreciation 3– Board responsibility and approval statement 3
About Transnet – Who we are 4– Where we operate and what we do 4– Our support processes 6– Conditions under which we operate 7– Our business model – how Transnet creates value 8– Performance highlights 11– Abridged governance and assurance 14– Remuneration 29
Material issues– Material issues determination process 33– Transnet’s material issues 37
Strategic overview – The MDS is focused on delivering key outcomes 40– About MDS 42– Implementing MDS 43
Performance and outlook – Executive performance review 47– Outlook 56– Transnet Freight Rail 58– Transnet Engineering 76– Transnet National Ports Authority 88– Transnet Port Terminals 104– Transnet Pipelines 120
Annexure A: – Consolidated value added statement 132
Abbreviations and acronyms 133Glossary of terms 135Corporate information 136
Forward-looking informationAll references to forward-looking information and targets in the 2014 reports are extracted from the 2015 Transnet Corporate Plan approved by the Board of Directors.
Transnet’s Integrated Report 2014, Annual Financial Statements 2014 and Sustainability Report 2014 are available in PDF on www.transnet.net and via this QR code on mobile devices.
Follow us on

1
Volume 1 Volume 2 Volume 3 Online
Integrated Report
Annual Financial Statements
Sustainability Report
PURPOSE To provide our stakeholders with a succinct view of how we respond to our context, stakeholders, risks and opportunities as well as monitor specific outcomes which constitute our focus for long-term value creation.
To report our financial performance, position, changes in equity and cash flows for the financial year ended 31 March 2014 in accordance with the Frameworks and Guidelines outlined below.
To report against the Transnet Sustainability Framework which defines our long-term developmental focus in terms of economic, social and environmental dividends.
To provide users with supplementary and/or more detailed information to the three reports.
CONTENTS The report presents Transnet’s commitment to adding value within the developing economy of South Africa whilst addressing material company, shareholder, investor and other stakeholder matters as well as integrating economic, environmental, social and cultural sustainability across the organisation for the benefit of all stakeholders.
The AFS 2014 includes reports of the Independent Auditors, the Audit Committee, the Directors, the Annual Financial Statements and the Corporate Governance report.
The SR 2014 documents Transnet’s performance against economic, social and environmental dividends.
are available online.
Governance Report for the 2014 Financial Year.
Register.
Index.
Black Economic Empowerment (B-BBEE) information.
Compact.FRAMEWORKS AND GUIDELINES APPLIED
Integrated Reporting Council (IIRC) Integrated Reporting Framework v1.0.
Governance for South Africa (2009)
Financial Reporting Standards (IFRS).
Act, No 71 of 2008 (Companies Act).
Management Act, No 1 of 1999 (PFMA).
Initiative (GRI) G4.
Global Compact (UNGC).
Project (CDP).
Stakeholder Engagement Standard.
SUITE AND INTER ACTION BETWEEN R EPORTSTransnet SOC Ltd’s (Transnet or the Company) reporting for 2014 consists of three reports: the IR 2014, the AFS 2014 and the SR 2014. The three reports are complementary and cross references are provided throughout the reports for ease of reference.
ABOUT THE
INTEGRATED REPORT

INTEGRATED REPORT 20142
ABOUT THE
INTEGRATED REPORT
R EPORTING PHILOSOPHY AND APPROACHThe IR 2014 is Transnet’s primary report to stakeholders and provides an overview of performance as well as an outlook for the period 1 April 2013 to 31 March 2014.
Integrated Reporting is a powerful platform for stakeholders to assess Transnet’s performance and prospects in delivering cost-effective and efficient regional rail, ports and pipeline infrastructure and services in the context of our commercial and developmental objectives. The IR 2014 focuses on reporting matters that affect our ability to create value over the short, medium and long term, and gives all stakeholders quality information that supports integrated decision-making in the Company.
Transnet has been an active participant in the IIRC Pilot Programme since its inception and therefore has been following the developments and application of the Integrated Reporting Framework. Transnet aims to further enhance reporting guided by our ongoing reporting improvement process as well as reporting best practice.
SUMMARY OF MATERIALITY AND BOUNDARYTransnet defines materiality for its reporting as those issues that substantively affect Transnet’s ability to create and sustain value over the short, medium and long term. Transnet’s material issues were determined through a structured process of identifying relevant issues, evaluating their importance and prioritising which are material. For more information on the materiality determination process undertaken refer to page 33.
The boundary of this report is largely limited to the Transnet legal entity. There are instances for some of the material issues where reporting has extended to other entities or groups of entities outside of Transnet. This is disclosed in more detail for each of the material issues in this report.
As part of the SR 2014, we aligned the Transnet material issues to the
Transnet Sustainability Framework which was brought forward into Transnet’s application of GRI G4. For more information on this process, refer to Appendix D of the SR 2014.
APPROACH TO ASSUR ANCEAn integrated assurance approach has been developed which encompasses the assurances provided by management, internal specialists, internal audit, external audit and other consultants and service providers. Transnet has also commissioned additional external assurance on certain aspects of the non-financial information reported in the SR 2014 by the Company’s external auditors, SizweNtsalubaGobodo. For more information on our integrated assurance approach, refer to page 24.
PER FOR MANCE OVERVIEWSouth Africa has achieved a historic milestone in celebrating 20 years of freedom in its burgeoning democracy. Similarly Transnet also attained a historical first by achieving R31,8 billion capital expenditure for the year; and awarding the 465 diesel and 599 electric locomotive contracts. These unprecedented achievements were realised in the context of weak economic fundamentals; however the Company continued to demonstrate financial stability during the year, enabling it to persist with its execution of the MDS.
CONDOLENCESThe Board would like to convey its heartfelt condolences to the families and friends of the seven colleagues who lost their lives during the financial year. Although this is a decrease from the previous financial year, when we lost nine of our colleagues, it is still one death too many.
The Board would also like to express its sympathies to the families of the 106 members of the public who lost their lives tragically due to Transnet’s operations. This was also a decrease from the loss of 125 public lives last year and Transnet is redoubling its efforts in all areas of safety to ensure that such tragic losses have not been in vain.

3
APPR ECIATION The Board would like to express its deep admiration and gratitude to the former Minister of Public Enterprises, Mr Malusi Gigaba for his dedication to Transnet. His passion, hard work and commitment to a better South Africa serves as an exemplar to all. He will be sorely missed and we wish him well in his new portfolio.
The Board would also like to thank the chairperson of the Portfolio Committee on Public Enterprises, Mr Peter Maluleke, for his strategic direction and oversight in the year under review.
On a final note, the Board would like to warmly welcome the new Minister of Public Enterprises, Ms Lynne Brown to the
Ministry. The Board looks forward to a long and fruitful engagement with the Minister in her challenging new role.
BOAR D R ESPONSIBILITY AND APPROVAL STATEMENTThe Board, assisted by its Committees, is ultimately responsible for overseeing the integrity of the IR 2014. The Board has applied its collective mind to the preparation and presentation of the IR 2014 and has concluded that the IR 2014 is presented in accordance with the International Integrated Reporting Framework v1.0.
The IR 2014 was approved by the Board and signed on its behalf by:
Mafika Mkwanazi Brian Molefe Anoj SinghChairperson Group Chief Executive Group Chief Financial Officer
28 May 2014 28 May 2014 28 May 2014
Johannesburg Johannesburg Johannesburg

INTEGRATED REPORT 20144
ABOUT
TRANSNET
WHO WE AR ETransnet is South Africa’s State-owned freight transport and logistics company and is the custodian of the country’s rail, ports and pipeline networks.
In line with Government’s New Growth Path (NGP) and the National Development Plan (NDP), SOCs are required to contribute to economic growth through the provision of world-class infrastructure and technologies; expansion of economic infrastructure; job creation and skills development; as well as industrial capacity building through a strategic approach to procurement and operations.
Transnet has a responsibility to unlock economic, social and environmental value through the execution of its mandate whilst building a commercially viable business enterprise.
Transnet’s mandate, vision and mission reflect the Ministry of Public Enterprises’ objectives:
Mandate To assist in lowering the cost of doing business in South Africa, enabling economic growth and ensuring security of supply through providing appropriate
port, rail and pipeline infrastructure in a cost-effective and efficient manner, within acceptable benchmarks.
VisionTo meet customer demand for reliable freight transport and handling through:
of its unique set of assets;
sustainability in all we do.
MissionTo enable the competitiveness, growth and development of the South African economy by delivering reliable freight transport and handling services that satisfy customer demand.
WHER E WE OPER ATE AND WHAT WE DOTransnet has a coordinating Corporate Centre located in Johannesburg, South Africa and five Operating divisions with operations spread across the Republic of South Africa. In future, Transnet plans to expand operations further into the African continent. Currently, Transnet has four satellite offices in Africa.
SA LDA NH A
M A PU TO
R ICH A R DS BAY
SISHEN
DUR BA N
NGQUR A
EAST LONDON
BEIT BR IDGE
NORTH WEST
NORTHERN CAPE
EASTERN CAPE
WESTERN CAPE
LIMPOPO
MPUMALANGA
NATALFREE STATE
GAUTENG
Rail
Transnet Corporate Centre (Johannesburg)
Ports and TerminalsPipelines
Engineering
Bloemfontein, Durban, Uitenhage, Salt River)
Geographic location of the Transnet Corporate Centre and Operating divisions.
CA PE TOW N PORT ELIZA BETH

5
Transnet Freight Rail (Freight Rail), the largest of the five Operating divisions, operates a rail network across South Africa which transports bulk, break-bulk and containerised freight. The Freight Rail network and rail services provide strategic links between mines, production hubs, distribution centres and ports; and connect with the over-border railways of the region. Shifting rail-friendly freight off roads and onto rail reduces logistic costs, impacts positively on the road network and has many indirect benefits for the country, including a reduction in transport sector carbon emissions.
Transnet Engineering provides maintenance and refurbishment services of rolling stock and specialised equipment to Freight Rail, Transnet National Ports Authority (National Ports Authority), Transnet Port Terminals (Port Terminals) and Transnet Pipelines (Pipelines) and is integral to Transnet achieving optimal use of equipment in conducting its core business.
South African ports owned by National Ports Authority facilitate 98% of South Africa’s global trade and services the shipping feeder network connecting the west and east coasts of Africa. Approximately 31% of South Africa’s Gross Domestic Product (GDP) is derived from exports and around 33% of GDP is derived from imports1.
Port Terminals operates all of South Africa’s container and automotive port terminals and some bulk and break-bulk terminals.
Pipelines transports fuel from coastal refineries and crude oil imports to the inland market. Transnet has begun operating the New Multi-Product Pipeline (NMPP), which enables an increase in volume throughput to meet forecast market demand.
1 The South African Reserve Bank national income and production accounts of South Africa Summary of GDP, expenditure and national disposable income. Quarterly Bulletin, March 2014.

INTEGRATED REPORT 20146
ABOUT
TRANSNET (continued)
Transnet employs a total of 54 671 permanent employees and 8 893 contractors.
Transnet’s customers are principally large mining, shipping, manufacturing, agricultural, industrial, retail and energy contributors to the South African economy.
Transnet’s services are both outbound (South African businesses moving products to markets) and inbound (bringing products to South African markets). The commodities transported in the most significant volumes are: mining exports, general freight2 and petroleum products3. The sectors that Transnet provides services to include:
The way in which Transnet sources and utilises assets, people and skills, finances and natural resources carries significant responsibility. This is because the quality and sustainability of Transnet’s infrastructure and services impacts the short, medium and long term prospects of thousands of companies, tens of thousands of employees, investors, all spheres of Government, and communities across the country.
OUR SUPPORT PROCESSESTransnet’s core business is underpinned by the support process provided by Transnet Corporate Centre and the Specialist Units. These support processes respond to risks and opportunities and focus on achieving the Company’s targeted outcomes. (Refer to Transnet’s business model on page 10).
Transnet Engineering also houses the Company’s Research and Development (R&D) unit to capture opportunities for technology innovation.
Total revenue
R56,6BN
Total permanent headcount
54 671
Total rail volumes
210,4MT
Total container volumes
4,6MTEUs
Total petroleum volumes
16,6BL
REV ENUE PER COMMODIT Y (R BILLION)
PERM A NENT HEA DCOUNT R AIL VOLUMES (MT)
Freight Rail – 29 225
Engineering – 12 428
Port Terminals – 6 624
National Ports Authority – 3 823
Pipelines – 621
Capital Projects – 720
Property – 555
Group services – 675
General Freight Business – 87,9
Export Coal – 68,2
Export Iron Ore – 54,3
2 General freight includes: containerised cargo, local manganese, minerals, local coal, local iron ore, chrome and ferrochrome, agricultural products, iron and steel, fertilisers, cement, fast-moving consumer goods, bulk liquids, wood and wood products, industrial chemicals, intermediate products and automotive products.
3 Petroleum products include: crude oil, refined petroleum products, aviation turbine fuel and methane-rich gas products.
General freight – 19 619
Export coal – 8 909
Bulk – 4 171
Export iron ore – 4 961
Piped products – 2 862
Break-bulk – 1 141
Maritime containers – 7 924
Other – 7 019

7
Transnet Corporate Centre’s main objective is to set strategic direction and to maintain and review policy development through the following support processes:
Officer, including:– Treasury, financial management
and control, capital integration and assurance, integrated supply chain management, governance and risk, reporting and taxation;
private sector participation;
Transnet’s Specialist Units are tasked with the following supporting roles:
large infrastructure capacity expansion projects on behalf of, and with input from, the Operating divisions.
non-core property portfolio comprising commercial and residential properties (approximately 13% of the total Transnet property portfolio).
Company’s corporate social investment projects.
CONDITIONS UNDER WHICH WE OPER ATETransnet’s mandate requires both prudent planning and bold action, particularly in volatile global and local economic conditions. Transnet’s infrastructure and services are intended to benefit South Africa and the Southern African Development Community (SADC) as a whole, facilitating economic, domestic, regional and global activity.
Transnet raises debt on the capital markets without Government guarantees. Transnet pays corporate taxation under the same laws applicable to private and listed companies in South Africa.
This year saw no significant changes in the way Transnet is owned, structured or functions.
Tariffs charged by Transnet’s National Ports Authority and Pipelines Operating divisions are determined by independent economic regulators, the Ports Regulator and the National Energy Regulator of South Africa (NERSA) respectively. The Company operates in compliance with over 250 regulations.
The MDS provides the strategic direction for the Company and entails deploying significant planned capital, in the short and medium term, to expand the country’s freight railway, ports and pipeline infrastructure and improve operational effectiveness of the freight logistics system.
There is clear recognition by the Shareholder, Board of Directors and management that logistics productivity and reliability are determining factors shaping South Africa’s ability to compete globally. Transnet must, therefore, find ways to invest counter-cyclically through the peaks and troughs of economic cycles thereby stimulating and supporting the Company’s operations in periods of higher growth.
Advancing the strategic objective of further integrating South Africa into the region and the rest of the continent and improving country competitiveness, many initiatives are underway to build Transnet’s organisational capability and to embed a high-performance culture. Transnet has a robust business model and business practices and harnesses its capitals to realise value for stakeholders. (Refer to page 8).
Critical challenges are recognised and are being addressed. External challenges include: regulatory uncertainty, particularly in respect of regulated tariff determination; sluggish economic growth, both global and domestic, which impacts freight volumes and revenues; volatile commodity markets; skills constraints; and energy vulnerability. Internal challenges include: operational efficiencies and customer satisfaction; skills constraints; efficiency of capital execution; and information systems enablement. (Refer to page 8).

INTEGRATED REPORT 20148
ABOUT
TR ANSNET (continued)
coal iron ore manganese chrom
e ferrochrome ste el cement agricultural products fertilis
HOW TRANSNET CREATES VALUE Infrastructure
investment
Volume growth
Productivity
and efficiency
Volume growth
Financial stability
Regulatory
Safety, health, environment a
quality (SHEQ)
Human capital development
– South Africa’s National Development Pl– Global and domestic economic condition– Volatile commodity markets.– Unemployment and inequality.– Skills shortages.– Technology advances.– Regulation.
CO
NT
EX
TR
ISK
SO
PP
OR
TU
NIT
IES
– Regulatory uncertainty.– Capital projects on time, on budget.– Volumes and revenue growth.– Business interruption and incident
management.– Funding and liquidity.– Energy security.– Human resource capability.– ICT utilisation.– Suppliers and customers.– Environmental and social sustainability.
– Collaboration with customers and logistics service providers.
– Small business advancement.– Supplier development.– Skills development.– Regional integration.– African markets.– Technology applications.– Diversification of electricity suppliers.– Private sector partnerships.
INPUTSValue deployed in 2014.
FINANCIAL CAPITAL– Share Capital R12,7 billion.– Long- and short-term borrowings
R90,4 billion.– Cash generated from operations
R24,0 billion.
MANUFACTURED CAPITAL– Property, plant and equipment
R207,3 billion.– Investment property R8,6 billion.
HUMAN CAPITAL– 54 671 permanent headcount.– Training spend R621 million.
INTELLECTUAL CAPITAL– Custodian of the country’s freight
railway, ports and pipelines, infrastructure and technologies.
– R100 million invested in R&D.
SOCIAL AND RELATIONSHIP CAPITAL– Customers.– Government and regulators.– Employees.– Funders.– Suppliers.– Organised labour.– Communities.– Pensioners.
NATURAL CAPITALConsumed:– 3,6TWh coal-fired electricity.– 256 million litres diesel.– Water, air, ecosystems.

9
sers forestry products chemicals aggregate automotives fast-moving consumer goo
NA
TIONAL PORTS AUTHORITY
PORT TERMINALS
FREIGHT RAIL
E
NGINEERING
PIPELINES
FREIGHT RAIL20 500km railway including
1 500km heavy haul.
1 888 locomotives, 71 075 wagons in service.
R99,7bn total assets.
29 225 employees.
ENGINEERING132 depots and 6 factories.
Manufacture and maintenance of locomotives, wagons, coaches and provision of engineering services
to ports and harbours.
R11,2bn assets.
12 428 employees.
PIPELINES3 800km pipelines transporting
refined petroleum, crude oil, jet fuel, and gas.
R32,3bn total assets.
621 employees.
and
an.ns.
.

10
ods containerised cargo
cru
de o
il
r
efi n
ed p
etro
leum
pro
duct
s
a
viat
ion
turb
ine
fuel
m
etha
ne-r
ich
gas
ECONOMIC DIVIDENDS
SOCIAL DIVIDENDS
ENVIRONMENTAL DIVIDENDS
OUTCOMESTo build sustainable value.
NATIONAL PORTS AUTHORITYOwns and manages 8 commercial ports.
R72,5bn total assets.
3 823 employees.
PORT TERMINALS
5 container terminals.
3 auto terminals.
3 bulk terminals.
5 break-bulk terminals.
R19,0bn total assets.
6 624 employees.
Capital investment R312,2 billion by 2021.Volumes by 2021
Rail: 343,9mt per annum.Ports: 6,1m TEUs per annum.Pipelines: 18,5Ml per annum.
Financial stabilityGearing <50%.Cash interest cover >3,0 times.Investment grade credit ratings.
Regulatory certainty.Productivity and efficiency
Rail reliability – 10% improvement.Port efficiency – 8,5% improvement.Pipeline delivery to order – 95%.
Human capital by 2021Permanent employees 65 785.Skills investment 4% of payroll per annum.
Economy-wide jobs 494 891.Local supplier industry development.Private sector participation.Rural development support.Regional logistics integration.
Mature governance.Zero tolerance for fraud and corruption.Zero harm: safety and security vigilance to protect employees, customers, communities and assets.Employment equity, with focus on women and people with disabilities.B-BBEE Level 1 by 2018.Corporate social investment. Proactive stakeholder engagement to build common value.
Modal shift from road to rail (35% market share), lowering transport sector carbon emissions.Energy efficiency.Climate change mitigation.Climate change adaptation.Water use efficiency.Waste management optimisation.Biodiversity enhancement.

INTEGRATED REPORT 201411
ABOUT
TR ANSNET (continued)
OU
N(continued)
– Revenue increased by 12,8% to R56,6 billion.
– EBITDA increased by 12,3% to R23,6 billio
– Cash generated from operations after workingcapital changes increase11,6% to R25,3 billio
– Gearing at 45,9% and cinterest cover at 3,7 timwell within targets.
2014
Transnet has persisted in the execution of
its counter-cyclical investment strategy of
R312,2 billion over seven years. Despite continued
economic volatility and regulatory uncertainty
in 2014, the Company reports strong financial
performance, purchase of new equipment, rail
market share growth in general freight, skills
investment, an improved safety record, black-
economic empowerment and local supplier
development through procurement spend, and
energy efficiency gains.
FREIGHT RAIL
R34,4bn – RevenueR25,1bn – Capital investm
1,3% – Volume growth to 29,7% – ROTA0,82 – DIFR
Transnet Operating divisions’ steady results
indicate resilience in the face of economic
slowdown, labour unrest, inclement weather
conditions, customer and own operational
challenges, regulatory uncertainty,
electricity outages and depressed commodity
prices. Opportunities were seized by Freight
Rail for volume growth in the container
and automotive sectors, while Engineering
increased revenue by pursuing new over-
border markets. Sluggish Port and Pipeline
volumes reflect the slow pace of economic
activity.
GROUP HIGHLIGHTS
OPERATING DIVISIONS HIGHLIGHTS

INTEGRATED REPORT 201412
on.
g d by
on.
cash mes,
Capital investment increased by 15,6% to R31,8 billion.
– R13,3 billion invested in expanding infrastructure and equipment.
– R18,5 billion invested to maintain capacity.
– R50 billion, 1 064 locomotive contract signed, R4,9 billion invested in current year.
– Rail: Freight volumes increased by 1,3% to 210,4mt.
– Ports: TEU volumes increased by 5,4% to 4,64 million TEUs.
– Pipelines: Petroleum product volumes increased by 4,4% to 16,6 billion litres.
– R621 million invested in skills development (3% of payroll).
– 3 340 apprentices and 483 engineering bursars in the talent pool.
ment
210,4mt
ENGINEERING
R13,4bn – RevenueR1,0bn – Capital investment6,4% – ROTA0,61 – DIFR
POTE
R8R14 5con5,40,5
NATIONAL PORTS AUTHORITY
R9,9bn – RevenueR1,2bn – Capital investment4 641 (000 TEUs) – Total container volumes8,0% – ROTA0,17 – DIFR
R40gros– R– 1– 4
RecoR38totaspen
R10deve

13
ORT ERMINALS
8,5bn – Revenue1,7bn – Capital investment503 (000 TEUs) – Total ntainer volumes4% – ROTA53 – DIFR
PIPELINES
R3,1bn – Revenue
R3,4bn – Capital investment
16,6bl – Total volume of petroleum products8,6% – ROTA0,39 – DIFR
0,9 billion s value added
R44,0% reinvested.4,4% to lenders.
41,6% to employees.
ognised B-BBEE spend of 8,8 billion or 94,4% of l measured procurement
nd.
0,9 billion supplier elopment contracted.
– DIFR performance of 0,69 – better than the target of 0,75.
– R174 million spent on Corporate social investment across South Africa.
– Total electricity consumption reduced 0,2%.
– Electricity regenerated by new locomotives: 176 185MWh for the year.
– Traction energy efficiency improved 2,4%.
– Road-to-rail gains reduced transport sector carbon emissions by 835 670tCO2e.

INTEGRATED REPORT 201414
ABOUT
TRANSNET (continued)
ABRIDGED GOVER NANCE AND ASSUR ANCECreating value through governanceTransnet views governance as a vital ingredient in operating a successful business, as well as providing assurance to stakeholders that the Company is well managed and functioning with integrity and accountability. The governance relationship with the sole Shareholder which is Government, exercised through the Ministry of Public Enterprises, is managed through the Shareholder’s Compact, which sets out the requirements and expectations of the Shareholder. The Company derives its mandate from the Ministry’s Statement of Strategic Intent.
The primary purpose of the Board of Directors is to ensure that the Company is sustainable, capable of fulfilling its objectives, statutory and otherwise. In order to fulfil this purpose, the Board of Directors provides strategic direction to the Company.
Leadership structureGovernance is essentially about effective leadership based on an ethical foundation. Appropriate leadership, oversight and accountability have been established through the appointment of the Board of Directors and determining its objectives. The Board of Directors and its Committees’ Mandates are adequately aligned to respond to the direction of the Company, taking into consideration the risks facing the Company and its risk appetite. Appropriate governance structures at supporting levels, have
been established with clear, concise and approved mandates.
The Board of Directors delegates powers to its Committees that are specialists in appropriate areas to assist in the achievement of its objectives. The Board of Directors also delegates powers to the Group Chief Executive to strategically manage the business and provide sufficient direction to the operations to ensure that the strategy is successfully implemented. The Group Chief Executive is assisted by the Group Executive Committee with specific mandates, based on the Delegation of Authority Framework.
The Company has established the Audit Committee and the Remuneration, Social and Ethics Committee in compliance with the Companies Act.
The requirements for constitution, functioning and reporting of the Audit Committee are strictly adhered to. Further to the statutory Committees, the following Board Committees have been constituted to assist in the fulfilment of its objectives:
Committee.
Committee.

15
The governance structure of the Company is depicted in the diagram below:
Shareholder (Minister of Public
Enterprises)
Shareholder’s Compact
BoardChairperson:
ME Mkwanazi
Delegation of Authority Framework
Group Executive
Committee Chairperson:
B Molefe
Divisional Executive
Committees
Freight Rail
National Ports Authority
Pipelines
Port Terminals
Transnet Engineering
Audit Committee
Chairperson: IB Skosana
Remuneration, Social and
Ethics Committee
Chairperson: NR Njeke
Corporate Governance and
Nominations Committee
Chairperson: ME Mkwanazi
Board Risk Committee
Chairperson: DLJ Tshepe
Board Acquisitions
and Disposals Committee
Chairperson: IM Sharma
Policy and
Regulation
Committee
Chairperson:
KC Phihlela
Finance
Committee
Chairperson:
A Singh
Capital
Investment
Committee
Chairperson:
B Molefe
NMPP
Governance
Steering
Committee
Chairperson:
B Molefe
Risk
Management
Committee
Chairperson:
DC Moephuli
Human
Resources
Committee
Chairperson:
EAN Sishi
Business
Information
Management
Committee
Chairperson:
M Matooane
Group Broad-
Based Black
Economic
Empowerment
Committee
Chairperson
NJ Mabandla
Results
Management
Office Review
Committee
Chairperson:
R Lepule
Property
Committee
Chairperson:
R Lepule

1 2 3 4 5 6 7
BOARD OF DIRECTORS
Mr Mafika Mkwanazi(Chairperson)Date of birth:January 1954.Date of appointment:13 December 2010.Qualifications:Bachelor of Science in Mathematics and Applied Mathematics (University of Zululand) and Bachelor of Science in Electrical Engineering (University of Natal).Area of expertise:Operations, Corporate Governance andStrategy.
Mr Brian Molefe(Group Chief Executive Officer)Date of birth:December 1966.Date of appointment:16 February 2011.Qualifications:Masters of Business Leadership (University of South Africa); Postgraduate Diploma in Economics (London University); School of Oriental and African Studies; Bachelor of Commerce (University of South Africa).Area of expertise:Finance, Management Leadership, Economics and Investments.
Mr Anoj Singh(Group Chief Financial Officer)Date of birth:August 1973.Date of appointment:6 March 2009.Qualifications:Bachelor of Accounting; Postgraduate Diploma in Accountancy (University of Durban-Westville) and CA(SA). Area of expertise:Finance and Business.
Mr Mike Fanucchi
Date of birth:May 1964.Date of appointment:13 December 2010.Qualifications:Graduate Diploma in Engineering; Bachelor of Science in Engineering (Mech) Industrial and Masters of Science in Engineering Management (University of Witwatersrand).Area of expertise:Engineering, Procurement and Logistics.
Ms Yasmin Forbes
Date of birth:February 1959.Date of appointment:24 June 2011.Qualifications:MA Business Administration; Diploma in Marketing; Public Relations Practitioner. Area of expertise:IT and Corporate Governance.
Mr Harry Gazendam
Date of birth:November 1954.Date of appointment:13 December 2010.Qualifications:Bachelor of Administration (University of Pretoria); BProc (University of South Africa); Diploma in Labour Relations (University of South Africa); EDP (UCLA California) and AEDP (Wharton Business School, University of Pennsylvania, New York). Area of expertise:Legal/Compliance, Human Resources, Business Management and Corporate Governance.
Ms Nazmeera Moola
Date of birth:November 1977.Date of appointment:13 December 2010.Qualifications:Bachelor of Business Science (University of Cape Town); and CFA Charter holder.Area of expertise:Accounting/Finance, Strategy and Risk Management.
Full CVs of the Board and Executive committee members are available on the website www.transnet.net
INTEGRATED REPORT 201416
ABOUTTRANSNET (continued)
1 2
34
5
6 7 7

8 9 10 11 12 13 14Ms Nomavuso Mnxasana
Date of birth:September 1956.Date of appointment:31 January 2013.Qualifications:BCompt Honours (University of South Africa); and CA(SA).Area of expertise:Accounting/Finance and Risk Management.
Ms Nunu Njeke
Date of birth:August 1963.Date of appointment:23 May 2006.Qualifications:Bachelor of Administration (University of Swaziland); MBA (Morgan State University, Maryland, USA) and Diploma in Advertising (AAA School of Advertising).Area of expertise:Marketing, Human Resources and Remuneration.
Mr Iqbal Sharma
Date of birth:March 1967.Date of appointment:13 December 2010.Qualifications:Bachelor of Science and Bachelor of Science Honours (University of Wisconsin, Oshkosh, USA).Area of expertise:Business Management, Engineering, Strategy and Corporate Governance.
Mr Israel Skosana
Date of birth:July 1953.Date of appointment:13 December 2010.Qualifications:Bachelor of Commerce (University of the North); BCompt Honours (University of South Africa); Certificate in the Theory of Accountancy (University of South Africa); Advance Management Programme (Harvard Business School) and CA(SA).Area of expertise:Accounting/Finance, Business Management, Risk Management and Corporate Governance.
Ms Ellen Tshabalala
Date of birth:August 1958.Date of appointment:13 December 2010.Qualifications:International Licentiate Diploma of Banking (Institute of Bankers); Bachelor of Commerce (University of South Africa); Post graduate Diploma in Labour Relations (University of South Africa).Area of expertise:Business Management and Strategy.
Ms Doris Tshepe
Date of birth:August 1973.Date of appointment:13 December 2010.Qualifications:BProc (University of the North); LLB (University of Natal) and Masters in Tax Law (University of Witwatersrand).Area of expertise:Legal/Compliance, Corporate Governance and Risk Management.
Ms Ayanda Ceba(Group Company Secretary)Date of birth:September 1976.Date of appointment:1 April 2009.Qualifications:BProc (University of Durban, Westville); LLB (University of Durban, Westville).Area of expertise:Legal and Corporate Governance.
17
8 9
10
11 12
1314

INTEGRATED REPORT 201418
ABOUT
TRANSNET (continued)
GROUP EXECUTIVE COMMITTEE
INTEGRATED REPORT 201418
1 2 3 4 5 6 7
Mr Brian MolefeYear joined Transnet:2011.Position:Group Chief Executive.Area of expertise:Finance, management, leadership, economics and investments.
Mr Anoj SinghYear joined Transnet:2003.Position:Group Chief Financial Officer.Area of expertise:Finance and business.
Mr Siyabonga GamaYear joined Transnet:1994.Position:Chief Executive – Transnet Freight Rail.Area of expertise:Management, transport, logistics, operations and finance.
Mr Mark Gregg-MacdonaldYear joined Transnet:2001.Position:Group Executive – Planning and Monitoring.Area of expertise:Manufacturing, construction, cellular communications, management and finance.
Ms Raisibe LepuleYear joined Transnet:2012.Position:Group Executive – Results Management Office. Area of expertise:Economics, public administration, transport, logistics and property.
Ms Nonkululeko MabandlaYear joined Transnet:2012.Position:Group Executive – Legal Services and Compliance. Area of expertise:Legal, management and governance.
Ms Disebo MoephuliYear joined Transnet:2006.Position:Chief Risk Officer. Area of expertise:Management, finance and risk management.
8Mr Charl MöllerYear joined Transnet:1975.Position:Chief Executive – Transnet Capital Projects.Area of expertise:Engineering, management and finance.
1
2 3
4
5
6 7 8

1919
Mr Tau MorweYear joined Transnet:1997.Position:Chief Executive – Transnet National Ports Authority.Area of expertise:Transport, logistics and management.
10Mr Khomotso PhihlelaYear joined Transnet:2003.Position:Group Executive – Commercial.Area of expertise:Management, operations, and engineering.
Ms Sharla PillayYear joined Transnet:2003.Position:Chief Executive – Transnet Pipelines. Area of expertise:Finance, information technology, procurement and strategy.
Ms Nonkululeko SishiYear joined Transnet:2012.Position:Group Executive – Human Resources.Area of expertise:Human Resources and management.
Ms Mantsika MatooaneYear joined Transnet:2013.Position:Group Executive – Enterprise Information Management Systems. Area of expertise:Information technology, management and operations.
Ms Mmathabo SukatiYear joined Transnet:2013.Position:Chief Audit Executive. Area of expertise:Finance, accounting, auditing, risk management, governance and management.
Mr Karl SocikwaYear joined Transnet:1995.Position:Chief Executive – Transnet Port Terminals.Area of expertise:Organisational development, operations and legal.
Mr Richard VallihuYear joined Transnet:1995.Position:Chief Executive – Transnet Engineering.Area of expertise:Management, finance, transport and information technology.
9 11 12 13 14 15 16
9 10
11
12 13
14 1516

INTEGRATED REPORT 201420
Wide angle view of Ermelo marshalling yard
To ensure effective management and monitoring of the business, the Board of Directors and the Group Executive Committee have established a number of Committees, that respond to the elements of its Mandate and Company Strategy. The link between Management and the Board Committees for each reporting element is indicated below:
Integrated Reporting element Job to be done
Stakeholder engagement and relationships. Effective stakeholder engagement and responsiveness.
Risks and opportunities. Review the adequacy and effectiveness of the risk management function including ERM, financial risk, commercial risk, regulatory risk, technology risk, market risk, operational risk, environmental, health and safety risks.
Effective identification and assessment of material issues.
Strategy and resource allocation. Appropriate strategic response including:
Advise the Board of Directors on responsible corporate citizenship and sustainability.
Performance and outlook. Appropriate financial and non-financial performance measurement and management including:
and determining incentives.
Remuneration. Appropriate remuneration structured to align performance against strategy in short-, medium- and long-term incentives.
Governance. Governance and assurance processes over financial and non-financial factors to oversee execution of strategy and structures in accordance with policy and regulation.
ABOUT
TRANSNET (continued)

21
Committees of the BoardCommittees of the Group Executive Committee
Empowerment Committee.
Committee.
Committee.
Committee.
Committee.
Committee.Committee.
Committee.

INTEGRATED REPORT 201422
Board compositionThe Company’s Memorandum of Incorporation provides that there shall not be less than 10 and not more than 14 directors, of whom not less than eight shall be non-executive directors and two executive directors. As at 31 March 2014, the Board of Directors comprised 13 directors of whom the majority (11), are independent and non-executive, including the Chairperson.
Chairperson and Group Chief ExecutiveThe Chairperson, Mr Mkwanazi, is an independent non-executive director. The roles of the Chairperson and the Group Chief Executive are separate with their individual responsibilities clearly defined. The Chairperson is responsible for leading the Board of Directors and ensuring its effectiveness. The Group Chief Executive is responsible for the execution of the Company’s strategy and its day-to-day business, supported by the Group Executive Committee which he chairs.
Independent non-executive directorsThe independent non-executive directors have diverse skills, experience and backgrounds. They are principally free from any business relationship that could hamper their objectivity or judgement in terms of the business and activities of the Company. All the independent non-executive directors have unrestricted access to information, documents, records and property of the Company in the interest of fulfilling their responsibilities. The independent non-executive directors contribute a variety of skills, business acumen, independent judgement and experience on various issues, including strategy, corporate governance, performance and general leadership, whilst the executive directors provide an operational understanding of the Company.
Directors’ independence is determined
Code, which includes the number of years a director has served on the Board of Directors. A review, as provided for in the
independence of long serving directors. None of the serving directors have been in service in that capacity for more than nine years.
The longest serving member of the Board of Directors, Ms Njeke, has been a non-executive director since May 2006. An assessment will be conducted by the Board of Directors during the 2015 financial year to ascertain her independence.
LENGTH OF TENURE OF NON-EXECUTIV E DIRECTORS AT 31 M A RCH 2014
3-6 years 8
0-3 years 2
6-9 years 1
DIRECTORS’ GENDER REPRESENTATION AS AT 31 M A RCH 2014 (INCLUSIV E OF EXECUTIV E DIRECTORS)
Female 6
Male 7
ABOUT
TRANSNET (continued)

23
Group Company Secretariat FunctionThe Group Company Secretary is responsible for developing systems and processes to enable the Board of Directors to discharge its functions efficiently and effectively. The Group Company Secretary prepares Annual Work Plans for the Board of Directors and its Committees in conjunction with the Chairpersons of the respective Committees. These Annual Work Plans are approved by the respective governance structures for implementation. The Group Company Secretary advises the Board of Directors on corporate governance issues and the requirements of the Companies Act. The Board of Directors has unfettered access to the services and advice of the Group Company Secretary.
In addition to various statutory functions, the Group Company Secretary provides individual independent non-executive
directors and the Board of Directors with induction training as well as guidance on duties, responsibilities and powers; and the impact of regulatory developments on the business. In consultation with the Chairperson, the Group Company Secretary ensures that the contents of the agenda are relevant to Board of Directors’ decision-making and the Board of Directors’ resolutions are communicated throughout the Company in a timely and appropriate manner. A number of instruments have been introduced to ensure that the Board of Directors functions smoothly; eg introduction of the Resolutions Register which is communicated to line functions for execution, and a status tracker for the approved Annual Work Plans. The Group Company Secretary acts as the primary point of contact between the Board of Directors and the Company.
Directors’ balance of skills and expertiseThe diagram below reflects the skills and expertise which are balanced to ensure effective discussions in fulfilling the Board of Directors’ mandate. Details on the individual Directors skills and expertise are set out on pages 16 and 17 of this report.
Operations
Corporate
governance
MathematicsLegal and
Compliance
Business
leadership and
acumen
Commerce/
economics
Engineering
Marketing
and public
relations
Accounting
Management
Engineering
Procurement
LogisticsIT governance
Risk
management
Legal/
compliance
Accounting/
finance
Strategy
Marketing
Human
resource and
remuneration
EconomicsBOA RD OF DIRECTORS

INTEGRATED REPORT 201424
Board of Directors’ Strategy and Deep Dive SessionsAs part of its Annual Work Plans, the Board of Directors and its Committees hold Strategy Workshops and Deep Dive Sessions where matters of a strategic nature are dealt with in detail to ensure thorough interrogation and analysis. During the year under review, the Board of Directors convened two Board Strategy Workshops and one Deep Dive Session.
ComplianceThe Company has an established formal Compliance Function. As is the case with all Company policies, the Company’s Compliance Policy is reviewed biannually or updated as and when necessary. The Compliance Policy forms the foundation of the Company’s Compliance Framework.
The Company considers non-compliance with legislative requirements as a key risk, as it not only exposes the Company to fines and civil claims, but can also result in loss of operational authorisations and reputational harm.
Management of potential conflicts of interestsThe Companies Act codified the fiduciary duties of directors and prohibits the use of position, privileges or confidential information for personal gain or improperly benefiting another person.
In instances where an independent non-executive director or a Prescribed Officer has any direct or indirect personal or private business interest, that independent non-executive director or Prescribed Officer must be recused from the proceedings when the matter in which he/she has interest on is considered, unless the Board of Directors, or its Committees or Group Executive Committee decides that the member’s interest in the matter is trivial or irrelevant.
For all formal meetings, registers for declaration of interests and related-party disclosures are completed by the Directors and attendees. In addition, the Company requires all employees to sign confidentiality and declaration of interest forms when adjudicating on procurement contracts.
EthicsTransnet’s Code of Ethics (the Code) promotes a culture of entrenched values, principles, standards and norms that guide the behaviour of the Board of Directors, employees, service providers, suppliers and trade partners.
Transnet also concludes Integrity Pacts with all bidders and suppliers, which have replaced Transnet’s Supplier Code of Conduct. The Integrity Pacts aim to enable Transnet to obtain the desired contract at a reasonable and competitive price in conformity to the defined specifications of the works, goods and services; and to deter bidders and suppliers from bribing or participating in any corrupt practice in order to secure a contract.
There is a Tip-Offs Anonymous Hotline for reporting concerns about unethical or unlawful behaviour. The hotline is managed by Internal Audit and all reported cases are investigated through an established forensics investigation process. The hotline is available 24 hours a day, seven days a week and the call centre agents are able to converse in all 11 official South African languages. Transnet employees are protected from victimisation by the Transnet Whistle Blowing Policy in so far as reporting is undertaken in line with the Protected Disclosures Act.
During the next financial year, the Company intends to undertake an Ethics Climate Survey, develop an Ethics Compliance Programme, and approve an Anti-corruption Policy.
To read more on Transnet’s ethics and integrity refer to the SR 2014 page 18.
Assurance and effectiveness
Integrated assurance approachOne of the responsibilities of the Board of Directors is effective risk management for the attainment of Transnet’s objectives and thus is a key focus area for the Company.
Against the backdrop of the continued weak economic conditions that equally affected the volumes and revenue growth of Transnet, there was a need to ensure vigilant risk management with a specific focus on regulatory compliance, health, safety, environmental compliance,
ABOUT
TRANSNET (continued)
Refer to page 18

organisational reputation, business processes, project and financial risk management.
The Board of Directors continued to demonstrate its support and commitment to the enterprise risk management (ERM) framework and recognise the importance of a strong control environment in managing risks, improving performance, enhancing governance, instilling stakeholder confidence and strengthening the reputation of the Company.
The Company is tightening its control frameworks around the capital investment programme as well as controls aimed at mitigating the key MDS risks and other emerging risks inherent in major change initiatives.
Transnet’s control framework encompasses a range of governance and operational components comprising:
operational);
investigation; and
Values and ethics form the keystone of an effective control environment and strong emphasis is placed on applying the Transnet Code of Ethics and Culture Charter.
An integrated assurance plan has been designed to emphasise high-risk areas. It encompasses the assurances provided by management, internal specialists, internal audit, external audit and other consultants and service providers. Integrated assurance provides the Audit Committee with an overview of the coverage of the critical risks, as well as the effectiveness of the critical controls that mitigates the critical risks without sifting through numerous reports from the various assurance providers.
Efforts will continue to enhance the process of integrated assurance and move to the next level of maturity. This process will not be limited to key risks only, but
will be expanded to the capital planning and integration processes in the coming financial year.
The plan enables the Board of Directors and its Committees, including the Board Risk and the Audit Committee, to remain apprised of management efforts to mitigate risks to an acceptable level and to improve the control environment. Collectively the activities performed from which assurance is provided by various role players are referred to as the four lines of defence in the integrated assurance model, involving:
Management-based assurance: This is considered the first line of defence, whereby Transnet management reviews and monitors risks and their related controls. This includes oversight of strategy implementation, performance measures, control self-assessments and the continuous monitoring of mechanisms and systems. Management oversight aims to establish and maintain a sound control environment for managing risk and governance.
Internal assurance: As the second line of defence, internal assurance functions within Transnet provide assurance on the adequacy and effectiveness of controls. Risk management, legal, compliance, health and safety, and quality assurance factors are included.
Independent assurance: Independent assurance functions provide independent and objective assurance on the overall adequacy and effectiveness of controls, governance and management of critical risks. This is predominantly the role of internal audit, external audit and other credible external assurance providers. Collectively they represent the third line of defence.
Oversight committees: Properly mandated Board Committees and Group Executive Committees oversee the adequacy and effectiveness of the risk management process as the fourth and final line of defence.
25

INTEGRATED REPORT 201426
Assurance matrix:
Content Assurance providers Outcome Framework/standard
Annual financial statements.
SizweNtsalubaGobodo Inc.
opinion.
Auditing (ISA).
Review of internal controls and risk management.
Audit.
Safety Association (NOSA).
Standards Organisation (ISO) accreditation bodies.
satisfactory rating.
controls: requires improvement.
assessment: satisfactory rating.
management: requires improvement rating.
safety and environment including ISO 9000 and 14000.
including Risk Management and Compliance Institute of South Africa guidelines.
Organisations of Treadway Commission (COSO).
Information and Related Technology (COBIT).
Broad-Based Black Economic Empowerment (B-BBEE) contributor level.
Audit.B-BBEE Act and Charters:
Sector Charter.
Corporate governance. Audit. established.
of controls: satisfactory rating.
Selected sustainability key performance indicators.
Limited assurance.
(GRI) G4 Guidelines.
ABOUT
TRANSNET (continued)

27
The responsibility for review of the IR 2014 and AFS 2014 resides with the Audit Committee. Responsibility for the SR 2014 resides with the Remuneration, Social and Ethics Committee. These Board of Directors sub-committees recommended the reports to the Board of Directors for approval. The integrated assurance approach, including consideration of additional independent assurance, is being further developed for all aspects of the reports.
Compliance including PFMA, King III, Companies ActTransnet recognises its accountability to all its stakeholders under the regulatory requirements applicable to its business and is committed to high standards of integrity in the conduct of its business. In view of the importance of complying to the ever-increasing universe of regulatory requirements, and the increased national and international emphasis placed on the supervision thereof, the Board of Directors, Executive Committee and employees are regularly appraised of the compliance requirements, internal controls are constantly being developed and tested to ensure compliance and continuous training is implemented.
Assessment InstrumentThe Company has utilised the Institute of Directors of South Africa (IoDSA) Governance Assessment Instrument (GAI) as the due process by which assurance is provided that every recommended
Practices are either applied or not applied, with the latter carrying an explanation of a compensating practice, or alternatively the reason for non-application and corrective action to be taken.
Practices that support the 75 principles
which confirms the extent to which the Principles are applied by way of a rating as follows:AAA Highest applicationAA High applicationBB Notable applicationB Moderate applicationC Application to be improvedL Low application
Assurance of the accuracy and validity of these results is provided by the review performed by the Group Executive Committee, the Corporate Governance and Nominations Committee and the Board of Directors.
Fuel tankers being transported by rail in
Jameson Park

INTEGRATED REPORT 201428
Effectiveness of governance structures
Independent performance evaluation of the Board, its Committees and Directors
An annual independent Board of Directors evaluation is conducted to assess the effectiveness of the Board of Directors and the individual contributions of the directors. The process is managed by independent service providers. Three evaluation processes were carried out at the end of the 2013 financial year. The first evaluation sought to measure the performance of individual directors based on their general contribution and their involvement and participation in meetings,
while the second aimed to review the overall functioning and performance of the Board of Directors as a unit and the third evaluation measured the effectiveness of the various Board Committees. The findings of these evaluations were considered by the Board of Directors in May 2014 and were compared to the previous year’s assessment, with appropriate action plans being formulated.
There was overall satisfaction in terms of the Board dynamic and marked improvement was noted with reference to the effective role of the Company Secretary. There was notable improvement in all areas.
ABOUT
TRANSNET (continued)
King III governance register at: 11 April 2014
AAA Highest application AA High application BB Moderate application C Application to be improved L Low application
Transnet SOC Ltd – 1990/000900/30IoDSA GAI
scoreApplied/partially
applied/not applied
– Chapter 1: Ethical leadership and corporate citizenship AAA Applied
– Chapter 2: Boards and directors AAA Applied
– Chapter 3: Audit committees AAA Applied
– Chapter 4: The governance of risk AAA Applied
– Chapter 5: The governance of information technology AAA Applied
– Chapter 6: Compliance with laws, rules, codes and standards AAA Applied
– Chapter 7: Internal audit AAA Applied
– Chapter 8: Governing stakeholder relationships AAA Applied
– Chapter 9: Integrated reporting and disclosure AAA Applied
Overall score AAA Powered by IoDSA GAI
Disclaimer:The assessment criteria of the IoDSA web-based tool, the governance assessment instrument (GAI) have been based on the practice recommendations of the King III report. These criteria are intended to assess quantitative aspects of corporate governance only and not qualitative governance. As such, the results are proposed to serve as an indication of the structures, systems and processes in place and are not intended to include an indication of the governance culture of an entity.The responsibility for the input of data in order to attain a result through the use of this is that of the user and the entity in respect of which the user licence has been granted (licencee). The results based on the use of the GAI may be based on the subjective opinion of the licencee or the representative user(s) and may not be a true reflection of the actual state of the governance structures, systems and processes at the entity.The IoDSA makes no warranty or representation as to the accuracy or completeness of either the assessment criteria or the results. Neither the IoDSA nor any of its affiliates nor the software developer shall be held responsible for any direct, indirect, special, consequential or other damage of any kind suffered or incurred, as a result of reliance on the results produced through the use of the GAI.

29
R EMUNER ATIONRemuneration philosophy and structureThe objective of the Transnet reward philosophy is to provide a framework for fair and transparent reward dispensation. Remuneration structures are engineered to incentivise the right performance within the Company and ensures that all employees are paid a fair and competitive salary. There are three elements to Transnet’s remuneration structure:
The components of the remuneration structures, by employee level, have been illustrated alongside to demonstrate the extent of variability of remuneration to Company performance. The headcount numbers are inclusive of fixed-term contractors.
Containers and straddle carriers
at the Cape Town Container
Terminal
EXECUTIV E COMMITTEE – 16 EMPLOYEES
FST* EMPLOYEES – 4 883 EMPLOYEES
Guaranteed pay 55,2%
STI – annual 24,0%
LTI 20,8%
Guaranteed pay 92,5%
STI – annual 6,5%
STI – gain share 1,0%
M A NAGEMEN T – 5 746 EMPLOYEES
Guaranteed pay 85,8%
STI – annual 13,4%
LTI 0,8%
BA RGAINING UNIT – 52 814 EMPLOYEES
Guaranteed pay 94,6%
STI – annual 4,4%
STI – gain share 1,0%
EXTENDED EXECUTIV E COMMITTEE – 105 EMPLOYEES
Guaranteed pay 61,5%
STI – annual 21,5%
LTI 17,0%
* First line managers, specialists and technicians.

INTEGRATED REPORT 201430
The objectives and overview of each structure are summarised below:
Remuneration structure Objective
Guaranteed pay The objective of guaranteed pay is for the employer to reward employees in terms of a fixed monetary (cash) amount that is normally determined based on the complexity of the job.
Short-term incentive scheme
The STI scheme is designed with the specific objective to drive the achievement of annual Company targets as agreed with the Shareholder in the Shareholder’s Compact. In addition to the annual component of the STI scheme, a gain share incentive scheme was implemented for bargaining unit employees. The objective of the gain share is to enhance line of sight between targets and actual performance as well as to ensure internal parity.
The bargaining unit employees in the Container Sector of Transnet Port Terminals are excluded from the gain share payment and participate in a Container Sector Productivity Scheme. Employees are eligible for monthly incentive payments if specific performance norms are achieved.
Long-term incentive scheme
The LTI scheme is designed with the specific objective to ensure the continued focus on execution and achievement of the Company’s strategy, to attract and retain key talent, to drive long-term sustainable value creation, to encourage stretch performance and reward and recognise employees for high sustainable performance.
ABOUT
TRANSNET (continued)

31
Overview
In general, guaranteed remuneration is based on the market median. Salary increases occur annually, based on an approved mandate obtained from the Remuneration and Social Ethics Committee of the Board and motivated by the specific analyses of relevant internal and external factors. Annual increases for management levels are also informed by individual performance ratings. Increases for bargaining unit employees are informed by the outcome of the annual wage negotiation process. Transnet does not support interim/ad hoc salary increases.The DPE conducted a remuneration study amongst SOCs. In the last financial year, Transnet implemented a moratorium on annual salary increases for members of the Group Executive Committee and Extended Executive Committee pending the outcome of the study at that time. As a result members did not receive a remuneration adjustment to guaranteed pay in the 2013 financial year. In the current year, guaranteed remuneration of the Group Executive Committee was increased by 5%, effective 1 April 2013. The recommendations of the study will be taken into consideration in terms of the future increases.Guaranteed pay of the next four employee categories, were adjusted, on average, in the current financial year as follows:
The eligibility range of percentages linked to specific business performance achievement is calculated as follows:
Qualifying percentage
Employment category Grade level Threshold On-target Maximum
Group executive committee A 25% 50% 100%
Extended executive committee B 20% 40% 80%
Strategic management C and D 16% 32% 50%
Senior management E 10% 20% 30%
Tactical management F 8,5% 17% 25%
First line manager, specialist and technician G 6% 12% Gain shareBargaining unit Below G 5% 10%
STI – Annual component
The 2014 STI component was based on the EBITDA achievement of 104,7% (after adjusting for exogenous factors as approved by the Remuneration, Social and Ethics Committee of the Board) and moderated in line with Transnet’s
percentages are further modified with individual performance assessment ratings in terms of the rules of the incentive scheme.
STI – Gain share component
The gains share component for 2014 was based on the achievement of EBITDA, volume and operational targets as agreed for individual Operating divisions.The LTI scheme is applicable to executive and selected senior managers. The value generated by the STI paid during a given year will generally be matched on a Rand-for-Rand basis as an LTI payable on the third anniversary of the STI payment.The 2011 conditional award in respect of the LTI scheme vested at the end of the 2014 financial year. The value of the LTI payment is impacted by the level of achievement of specific company and individual performance objectives. The payment of these vested amounts will take place at the end of July 2014 following the conclusion of the annual financial statements.The LTI has specific clauses dealing with company performance over the banking period and to this effect a group modifier has been introduced. The Group LTI modifier for the vesting of the 2011 conditional award is the average achievement return on average total assets (ROTA) (excluding capital work-in-progress) against the target over the three years of the banking period.Targets are set on an annual basis and have also been included in the Transnet Corporate Plan.

INTEGRATED REPORT 201432
ABOUT
TRANSNET (continued)
Further detail regarding the application of the reward structure for 2014 as well as the independent non-executive directors’ remuneration are outlined in more detail in the annual financial statements.
Individual performance managementIndividual performance of managers in Transnet has a significant impact on the determination of the STI payment and the annual salary increase. Transnet has implemented the Balanced Scorecard Performance Management Methodology for the Management category as well as for First Line Managers, Specialists and Technicians.
The Company targets as per the Shareholder’s Compact and the Corporate Plan are annually translated into a corporate scorecard and then cascaded to all managers across Transnet. Performance as measured against corporate and individual objectives informs the STI payments and annual individual increases.
Remuneration focus areas going forwardThe MDS has resulted in a drive to review remuneration policies and practices across the business. The newly developed workforce plan will be implemented to ensure that the right skills are available at the right time to ensure the achievement of the rigorous objectives of the MDS.
The Department of Public Enterprises has released the Remuneration and Incentive Standards for SOCs early in 2014 after completing the remuneration study on all SOCs. Transnet has conducted a detailed analysis of the standards and is in process of reviewing the Transnet Remuneration Philosophy to align with the standards, where required. The alignment will focus primarily on the fee structure of the non-executive directors, the STI scheme and guaranteed pay practices. The revised Reward Philosophy will be finalised and rolled out during the 2015 financial year. The reward dispensation for the management category is also being reviewed with the objective to create a career path framework for managers, specialists and technical skills.
Teamwork is one of the values of our Culture Charter
Report of the Directors

33
MATERIAL ISSUES DETER MINATION PROCESSTransnet defines materiality for its reporting as issues4 that substantively affect Transnet’s ability to create and sustain value over the long term.
Transnet’s material issues were determined through a structured process of identifying relevant issues and prioritising those that are material, using a number of sources, including:
issued to Transnet by the Minister of Public Enterprises and the annual Compact that Transnet signs with the Minister;
strategic risks;
Transnet operates; and
This was complemented by a review of Transnet’s coverage in the external media. The material issues were reviewed in a materiality workshop of senior management. This process has informed both the SR and IR content as well as reporting boundaries (refer Appendix E for the boundary matrix).
Statement of Strategic Intent and Shareholder’s CompactThe Statement of Strategic Intent issued by the Shareholder, represented by the Minister of Public Enterprises outlines five objectives for Transnet:
percentage of transportable GDP;
maximising the role of rail in the national transport task;
provision of both infrastructure and operations where required;
and the rest of the continent; and
impact of all interventions undertaken by the Company in the achievement of these objectives.
The annual Compact that Transnet signs with the Shareholder sets out specific annual targets to achieve the strategic outcomes required. These targets are set every year to inform Transnet’s annual Corporate Plan.
Transnet’s Sustainability Framework Transnet’s Sustainability Framework is aligned to the Minister’s Statement of Strategic Intent and the Shareholder’s Compact to ensure that Transnet accounts for long-term economic, social and environmental outcomes.
Enterprise Risk ManagementThe issues that affect Transnet’s ability to create value in the short, medium and long term can be grouped into three categories:
are managed daily through implementing policies and process controls;
could significantly affect Transnet’s ability to implement its strategy, but could be mitigated if they are understood and proactively addressed; and
opportunities which affect nations and companies globally; some of which could be mitigated by localised efforts or through collective or multilateral actions.
Transnet’s strategic risk profile is generated from the Transnet ERM Strategy Framework, based on ISO 31000:2009.
MATERIAL
ISSUES
4 With the multitude of terms used in the IR Framework and GRI G4 guidelines guiding Transnet’s reporting, Transnet uses the word ‘issue’ to refer to matters, topics, and aspects. Not all ‘issues’ will necessarily be ‘material issues’.

INTEGRATED REPORT 201434
MATERIAL
ISSUES (continued)
1 Changes in regulatory environment (ie economic, technical and compliance) – spending on capital investment based on assumptions that may be negatively impacted by subsequent changes in regulation.
2 Inability to deliver on the capital investment plan due to the ineffective application of current capital and procurement operating methodology.
3 Inability to attract additional volumes as new capacity is created and to protect current volumes against new entrants.
4 Operational and business interruption due to derailments, safety incidents, cable theft, lack of effective application of information technology (ICT) and natural disasters.
5 Credit rating downgrade leading to funding and liquidity risks – loans being recalled.
6 Security of energy supply – inability to ensure sustainable supply.
7 People management, talent attraction and skills development to operate the newly acquired assets.
8 ICT infrastructure and technological risks to broader business enablement.
9 Counterparty risk certainty of delivery by suppliers/customers. Commodity and Concentration Risks (Third-party Supplier Risks).
10 Environmental activism increased pressure to be a sustainable
organisation.
Strategic residual risks heat map.
Priority I risk – Transnet Group CE and Board level Priority II risk – Operating divisions’ CEO’s level Priority III risk – General Managers’ level Priority IV risk – Managers’ level Priority V risk – Employees’ level
Lik
elih
ood
rati
ng
Consequence rating
E99%
D>50%
C>20%
B>1%
A<1%
7 6 5 4 3 2 1
43
21
5 6
10
9 7 8
A strategic risk profile is generated for each Operating Division, and updated regularly for emerging risks. The output from risk assessments is held in risk registers and risk treatment plans that are stored in the risk information management system. Risks are allocated to specific risk owners for monitoring and review. The risk treatment actions are allocated to task owners to track and monitor completion thereof.
The results of the risk assessment reviews are presented to Operating divisions or Specialist Units, Risk Management Committees and to the Transnet Risk Management Committee.
all significant and strategic risks. The potential exposure is determined in Rand value for all significant risks. The process
involves relevant stakeholders and is collaborative.
Priority I risks requires management to take action to reduce residual risk or to tolerate the exposure at current residual levels, with authorisation by the Group Chief Executive and the Board of Directors. Priority II risks requires management to take action to reduce residual risk or manage risk reduction through the business plan.
The Board has delegated the quality, integrity and reliability of the Group’s risk management to the Board Risk Committee.
The key medium-term issues derived from the ERM analysis, which support the material issues disclosed in the next section, are as follows:

35
Business environmentSlow rates of global and local economic growth, volatile commodity markets, widening social inequality, structural unemployment, technology advances, skills shortages, and the demand for natural resources characterise the business environment within which Transnet operates. These factors have a direct impact on Transnet’s customers, funders, employees and suppliers. The freight system’s ability to effectively respond to these trends is integral to Transnet’s business sustainability. The MDS recognises this, positioning the Company to meet demand, pursue developmental outcomes, and build a sustainable enterprise.
South Africa’s NDP, endorsed by Government in 2012, aims to eliminate poverty and reduce inequality by 2030. The long-term structural reforms outlined in the NDP are complemented by the nearer-term goals set out in the NGP; regular updates to the Industrial Development Plan; and the work of the Presidential Infrastructure Coordinating Commission (PICC). The NDP’s focus areas are: the economy and employment; economic infrastructure; transition to a low-carbon economy; South Africa in the region and the world; human settlements; education, training and innovation; healthcare; social protection; safe communities; a capable state; fighting corruption and enhancing accountability; and transforming society and unifying the country.
These NDP focus areas constitute Government’s framework of policy and planning priorities. They are all relevant to the scope of Transnet’s mandate, highlighting the complex socio-economic challenges within which the Company operates.
Public sector investment in economic infrastructure is a key component of South Africa’s economic growth path. The share of the public sector in overall fixed investment rose from under 30% of GDP in 1994 to 38% in 2013, while SOCs, especially Transnet and Eskom, accounted for approximately half of all public investment in 20135. South Africa’s economic infrastructure nevertheless still lags demand and much more is required to stimulate the levels of growth which are needed to create and sustain employment and to break poverty and inequality.
The key issues derived from this business environment, which support Transnet’s material issues outlined later in this section, are as follows:
demand;
operations;
performance, including safety;
investment.
5 The Presidency, Republic of South Africa, 2014: Twenty Year Review South Africa. <http://www.thepresidency-dpme.gov.za/news/Pages/20-Year-Review.aspx>.
Inbound class 18 locomotives with mixed load

INTEGRATED REPORT 201436
MATERIAL
ISSUES (continued)
Stakeholder engagements Our stakeholders are those individuals or groups of individuals or organisations to whom we have a legal, financial or operational responsibility; those who are directly affected by Transnet’s operations; and those who are likely to directly influence Transnet’s performance.
Transnet is streamlining business processes to improve shared value creation through stakeholder engagement. In 2013, we concluded a stakeholder engagement analysis to determine the quality of engagements and to identify ways to improve. A number of improvement areas were identified in respect of our policy, process controls and reporting. We undertook a number of steps to institute a more systematic approach to the management of stakeholder engagement, including:
stakeholder engagements;
policy and process control framework; and
stakeholder relationships.
Through the stakeholder engagement process, we have identified the following key stakeholder groups.
of Public Enterprises;
Government and Regulators;
For a comprehensive understanding of Transnet’s stakeholder engagement process, stakeholder concerns and our response, refer to page 21 of the SR 2014.
Maintenance crew performing repairs
on a rail line
Refer to page 21

37
Stakeholder interests and concerns gleaned through the engagement process have been comprehensively considered through our material issues determination process. By applying the materiality filters, these have informed the material issues which are presented in the following section; and have also helped to shape our strategic response to those material issues. Where particular stakeholder concerns or interests are reflected in the material issues presented, these stakeholders have been linked to the respective material issues in the table below.
TR ANSNET’S MATERIAL ISSUESThe material issues, context of the issues and strategic response, identified through the materiality determination process are as follows (in order or prioritisation):
Material issue Why is this material to Transnet Potential impact on Transnet Strategic response
1. Regulatory uncertainty methodology applied in economic
regulation by the Ports Regulator for the annual approval of National Ports Authority tariffs.
Regulator of South Africa’s annual determination of Pipelines revenue.
corporatisation of National Ports Authority.
duration for Port Terminals at Port of Ngqura.
of National Ports Act for provision of new port services.
future port infrastructure affixed to the seabed arising from provisions of the Integrated Coastal Management Act.
fees charged by the Rail Safety Regulator.
funding and capital investment planning.
financial stability will affect loan covenants and future funding.
funding for investment are based on regulatory, revenue and cost assumptions that can change significantly though administrative action.
licences affects deployment of resources and investment.
Ports infrastructure affects investment.
Ongoing engagements with the Shareholder, Government policy departments and regulators.
Stakeholders: Government and Regulators; Investors; Shareholder; Customers
2. Capital projects on time and within budget
technical skills and experience are needed to deliver capital projects to plan.
capital projects are prioritised and addressed based on demand projects, business cases and expected growth opportunities.
delays affect revenues, reputation, funding and investment sequencing.
economy.
further embed project lifecycle process methodology, rigorous feasibility gate reviews and project risk management.
approvals.
Stakeholders: Customers; Investors; Shareholder; Suppliers

INTEGRATED REPORT 201438
MATERIAL
ISSUES (continued)
Material issue Why is this material to Transnet Potential impact on Transnet Strategic response
3. Volume and revenue growth freight logistics services is
dependent on volume and revenue growth to finance investments.
import/export markets affects volumes and revenues.
volumes and revenues affects capital allocations and timing.
customers where Transnet capacity falls short.
attract new customers.
customer responsiveness and satisfaction.
volume demand.
planning and execution.
marketing and Africa strategy.
take-or-pay agreements are implemented.
Stakeholders: Customers; Investors; Shareholder; Government and Regulators
4. Business interruption and incident management
Adverse impacts of: negatively impact on operational systems, resource allocations, volumes, revenues, reputation.
economy.
management.
efficiency and productivity.
systems.
management.
management.
Stakeholders: Customers; Shareholder; Investors; Employees; Organised Labour; Public
5. Funding and liquidity generate cash in the short, medium
and long term and attract cost-effective funding.
negatively impact the Company’s going-concern status and impact on its credit rating, cost of funds and investment plans.
the cash interest cover.
the country influence Transnet’s ability to attract investors.
funding strategy.
with providers of financial capital.
Stakeholders: Investors; Shareholder; Customers

39
Material issue Why is this material to Transnet Potential impact on Transnet Strategic response
6. Energy securityelectricity supply at a reasonable price in order to operate the railways, ports and pipelines.
resilience by improving energy management and efficiency, and adopting alternative energy solutions.
management, energy efficiency measures, investigation of alternative supplies.
with Eskom.
Stakeholders: Suppliers; Customers; Shareholder; Investors
7. Human resources capability
and mature management to deliver on MDS.
management constraints limit Transnet’s ability to effectively deliver on infrastructure plans and operating efficiency improvements.
strategy for performance and talent management and skills development.
Stakeholders: Employees; Organised Labour; Customers; Shareholder
8. ICT utilisation
asset losses and disruptions.
infrastructure.
reduce asset losses and business disruptions.
of new technologies to improve efficiencies.
research and development and adoption of appropriate technology.
Stakeholders: Suppliers; Customers
9. Suppliers and customers disruptions.
to wider base of companies, including new entrants.
chains and the nature of customer’s operations impact on capital projects, operational systems, volumes, revenues and reputation.
management.
relations.
and execution.
Stakeholders: Suppliers; Customers; Investors; Shareholder
10. Environmental and social sustainability
customers are developing new mines.
uncertainty.
change mitigation and adaptation in design.
measures factored into project plans.
is part of Transnet’s mandate.
infrastructure for industries which may not be sustainable.
risk.
Transnet invests and operates are integral to lasting business solutions.
strategies and risk analysis.
reviews and project risk management.
Stakeholders: Customers; Suppliers; Shareholder; Government and Regulators; Investors; Public; Employees; Organised Labour

INTEGRATED REPORT 201440
Continued financial stability and strength
STRATEGIC
OVERVIEW
Capital investment programme
R312,2bn investment
programme, over the
next seven years.
Sustaining capital
investment makes up
51% of total planned
capital expenditure.
Expanding technological know-how and grow product offering.
Capacity ahead of demand.
Technology and innovation.
Greater efficiency and safety.
Rail volumes will
increase from around
210,4 million tons to
343,9 million tons
per annum by 2021.
A switch from road to
rail will reduce costs, congestion
and carbon emissions.
Mitigate against
further deterioration
of the secondary road
network.
Ensuring operational excellence across the
business. Upgrades and expansions will improve
efficiency.
12% per annum
growth in
revenue over the
next seven years.
Maintain investment grade credit rating over the next seven years.
Hybrid capital to minimise impact on key financial ratios.
Unlock private sector investment.
To maintain gearing <50% and cash interest cover >3,0 times
THE MDS IS FOCUSED ON DELIVERING KEY OUTCOMES
Significant productivity and operational efficiency improvements
Shift from road to rail via volume growth
Becoming a key supplier for
thermal coal and
manganese exports as
well as maintaining
position as a credible
supplier of iron ore
locally and abroad.
Position South Africa as
the leading logistics hub
in the region.
Become the regional
container
transshipment hub
for sub-Saharan Africa.Improved infrastructure
can lower supply-chain costs of
businesses in South
Africa.
Enabling economic growth

41
By 2021, Transnet’s total procurement spend (tmps)
with black women-owned companies should account
for 5% of the budget.
Position Transnet
Engineering to become the
preferred supplier of
rolling stock in Africa.
Hundreds of thousands.The total number of
jobs we will create
within the South
African economy.
65 785 permanent
employees by 2021.
20,3% increase in
permanent employees
over the seven-year
period to support
growth of the business.
Provide integrated fuel
solution via pipe and
rail to Botswana and
Zimbabwe.
Increase over-border
volumes in our rail
business from 7,2mt to
18,6mt by 2021.
R9 031billion, the amount we will
spend on training,
skills development
bursaries and
grants by 2021.
5 735 Artisans are to be
trained from the period
2015 to 2021.
B-BBEE Level 1 by
2018.
Safety is a vital element of Transnet’s operations and is managed through the
Transnet Safety, Health, Environment and Quality Management system. The
Transnet seven Golden Safety Actions, communicated to all company
employees, set the benchmark for safe behaviour within Transnet.
Zero tolarance for fatalities.
DIFR consistently below 0,8.
Transnet will continue
to support government
in driving
transformation.
Review pricing in order to
comply with economic
regulations.
Job creation, skills development, localisation, empowerment and transformation opportunities
Active participation in regional integration initiatives and structures
Prioritising safety and security
Creating regulatory certainty and compliance with policy

INTEGRATED REPORT 201442
STRATEGIC
OVERVIEW (continued)
ABOUT MDSThere is clear recognition by the Shareholder, Board of Directors and Group Executive Committee that the Company must find ways to invest counter-cyclically – through the peaks and troughs of economic cycles – in order to both stimulate and support periods of higher growth. There is also recognition that logistics productivity and reliability are determining factors shaping South Africa’s ability to compete in global trade.
In 2012, the Board of Directors responded to the Shareholder’s Statement of Strategic Intent through the adoption of a new strategy, the MDS in response to these imperatives. The objectives of the MDS are aligned to the Statement of Strategic Intent issued by the Minister of Public Enterprises. The MDS implementation plan is encapsulated through six pillars and two foundational enablers as follows:
Capital Planning and execution
Volumes and customer satisfaction
Operational efficiencies and productivity
Finance and funding
Regulatory and key stakeholder engagement
Safety risk and sustainability
Human capital
Building organisation readiness and a high performance culture
The MDS remains the epicentre of Transnet’s strategic direction, but requires ongoing attention to bring aspirations closer to economic reality. The illustration below depicts the strategy evolution thus far:
Quantum leap
base stabilised.
strategy.
backlog maintenance.
results.
MDS crafted
estimated.
plan developed.
plans in place.
assumed.
Year 1 completed
successfully but not all targets achieved.
not grow as planned (port demand met).
demand validated, lower than planned.
investment plan updated and aligned.
Year 2 adjusted
adjusted downward in line with market sentiment with continuation of aggressive investment strategy.
Year 3 planning
demand lower than originally anticipated.
targets taking into account current market and capability.
allocated and aligned to capacity requirements to maximise value.
key constraint.
2008-12
2012
2013
2014
2015
Year under review

43
IMPLEMENTING MDSBoth the progress on MDS implementation and performance relative to MDS targets are reviewed on an annual basis, which includes an in-depth assessment of where we are as a Company, the external environment, and the risks and opportunities we face in executing our plans. The Government, through the Shareholder Representative (Minister of Public Enterprises), and the Board of Directors concludes a Shareholder’s Compact on an annual basis, as required by the Public Finance Management Act. The Shareholder’s Compact stipulates and defines, amongst others, the Company’s mandate and strategic objectives over the medium term, which in turn forms the basis for the Corporate Plan. The Corporate Plan is prepared on an annual basis by the Group Executive Committee and is approved by the Board of Directors.
The information included in the Corporate Plan provides guidance to management on the strategic business and economic perspectives as well as the key focus areas and related targets to successfully execute the Company’s mandate. It also serves as reference to all investors and funders of the sustainability of the Company. The preparation of the Transnet Corporate Plan follows a robust and structured process and flows from a culmination of activities, initiatives and processes within Transnet, including:
associated objectives and targets using the requirements of the Compact with the Shareholder. This informs the plans of the Operating divisions;
which reflects the future capacity and investment requirements, provides guidance to the Operating divisions in developing their capital investment plans;
inputs from customers, financial plans, funding requirements, operational plans, capital investments and risk management strategies across the Company through a strategic planning and budgeting process;
functional workshops, reviews and approval sessions with the key internal stakeholders including the Board of Directors and the Group Executive Committee; and
the commitment from all internal stakeholders and to clearly define deliverables as this forms the basis for the performance agreements concluded for the 2014 financial year.
Performance information and other criteria comparing actual 2014 results to the 2014 targets, as required in terms of section 55(2) of the PFMA is set out in the Report of the Directors in the AFS 2014. Measuring the Company’s entire performance against the Shareholder’s
targets during the 2014 financial year. Our strategic report at Company and Operating Division level is unpacked in the sections which follow in this report.
Several initiatives were launched to improve implementation and risk management processes, especially given the weak market in the current financial year and the higher level of financial risk this exposes the Company to:
Committee (RMO) to support the delivery of operational priorities and capability building;
to enhance Transnet’s capital execution capability, ensure delivery according to plan and create a buffer for the capital programme to manage cost and schedule overruns;
market share and enhance revenue diversification; and
programme which was launched in mid-2012.
The strategic focus areas for 2014 are presented in greater detail on the following pages.

INTEGRATED REPORT 201444
Key performance area Objectives
The expansion and maintenance of economic
infrastructure
Ensure the provision of critical logistics infrastructure and capacity over the short term, however, aligned to a long term national plan that is geared towards meeting the growing demands of the total national economy.
aligned to key Government planning departments.
Oversee a sustainable capital investment approach characterised by intelligent investment decisions and financial prudence to meet industry demands and customer expectations over the medium term.
infrastructure network that allows for supply chain optimisation at the network and industry level.
capacity ahead of demand.
projects.
successfully.
Develop and implement a collaborative approach to Private Sector Participation on a case by case basis with the intention to leverage collective resources in the provision of infrastructure and transport services.
infrastructure provision to enhance service offerings and to improve the competitiveness of the freight logistics system.
Growing volumes and improving market share
Transformation of the surface transport market through dedicated management with a mandate to deliver an integrated domestic intermodal transport system, industry solutions, long-term infrastructure and reliable, cost-effective services whilst aggressively growing rail’s market share in those contested sectors of the economy.
costs, congestion and carbon emissions.
miners.
experience.
commodity channels.
and utilisation of port infrastructure.
Enabling regional integration
Support Government in driving regional integration.
integration of the freight system to stimulate intra-regional trade and lower transport costs.
infrastructure delivery and promote the adoption of certain standards to contribute to regional integration.
STRATEGIC
OVERVIEW (continued)

45
Key performance area Objectives
Improving performance, productivity and operational
efficiencies
Operational excellence across the entire organisation informed by global best practise and driven by a performance culture that is firmly entrenched within the organisation.
tangible benefits and improved levels of productivity and reliability to benchmark.
performance culture.
performance indicators.
Promoting sustainable growth
Sustainable growth encompassing corporate social investment and environmental responsibility. This area of focus is becoming increasingly important as Transnet becomes more prominent within the economy.
sustainability in everything we do’.
Transnet to develop opportunities for economic, social and environmental value creation.
Quantify and reliably measure Transnet’s contribution to reducing the total cost of logistics as a percentage of transportable GDP.
Economic dividends
and service debt.
whilst maintaining financial position.
transportable GDP.
Social dividends
transparency.
operations.
fostering mutually beneficial relationships.
Environmental dividends
and more efficient mobility.
energy.
energy requirements and reducing carbon emissions.
mitigation and adoption policies.

INTEGRATED REPORT 201446
Key performance area Objectives
Prioritising safety, skills development and procurement
The implementation of global best practices with respect to safety, skills development and procurement.
In terms of safety, a fundamental respect for the value of human life and resources.
Safety
a vital and integrated element of operations.
workplace and nurturing staff wellness.
In terms of skills development the need to maintain and develop the intellectual capacity of the Company.
Skills development
developing a skills and talent pipeline that addresses business priorities.
approach with visible return on investment.
With respect to procurement the need for transparent governance and tangible benefits for all social and economic stakeholders.
Procurement
national growth and transformation targets.
relationship management.
delivery of planned capital acquisitions.
Creating regulatory certainty and compliance with policy
including optimising the social and economic impact of all
interventions
The ongoing compliance with the policy and regulatory environment with a view to support Government in driving regional integration, economic transformation, beneficiation, industrialisation, aggressive job creation and the development of a supplier base that meets B-BBEE criteria.
Government’s objectives.
ensure fair return on investment.
for regulated businesses.
Driving research and the deployment of new and
cutting-edge technologies
The introduction and establishment of a robust Centre of Excellence to drive research and the deployment of new and cutting-edge technologies to address the need for competitiveness, growing demand and cost savings.
Research
products and processes.
capability to improve and enhance service delivery.
and integration with partners and customers.
solutions.
monitoring.
STRATEGIC
OVERVIEW (continued)

47
EXECUTIVE PER FOR MANCE R EVIEWThis executive performance review provides an overview of the:
position;
major projects;
impact;
For a full appreciation of the Company’s performance and report back on its strategic imperatives please refer to the Operating Division report backs which follow where these have been covered in greater detail.
Group financial performance and positionRevenue for the year increased by 12,8% to R56,6 billion (2013: R50,2 billion), mainly as a result of mineral and chrome volumes increasing by 14,2% as well as strong growth in the containers on rail and automotive sectors of 25,2%, which performed well in excess of GDP growth of 3,8%, reflecting market share gains. Port container volumes increased by 6,3% and petroleum volumes increased by 4,4%.
Operating costs increased by 13,1% to R33,0 billion (2013: R29,1 billion) mainly due to an increase in energy costs of 10,3% as well as an increase in personnel costs of 14,6%. Energy costs increased mainly due to the higher electricity tariffs as well as fuel price increases impacted by foreign exchange volatility. Personnel costs increased to R16,6 billion (2013: R14,5 billion) mainly due to an average wage increase across the Company relating to the two-year wage agreement concluded with the recognised labour unions, as well as the filling of the MDS critical vacancies. The operating cost increase was limited primarily as a result of numerous cost-reduction initiatives implemented throughout the Company, which resulted in a R2,1 billion saving in planned costs.
Consequently, earnings before interest, taxation, depreciation and amortisation (EBITDA) increased by 12,3% to
R23,6 billion (2013: R21,1 billion), while the EBITDA margin decreased slightly to 41,8% (2013: 41,9%).
Depreciation, derecognition and amortisation of assets for the year increased by 15,7% to R10,7 billion (2013: R9,3 billion), mainly as a result of capital investments for the year as well as the depreciation of revalued port facilities and pipelines. This trend is expected to continue in line with the execution of the capital investment programme.
Profit from operations after depreciation and amortisation increased by 9,6% to R12,9 billion (2013: R11,8 billion).
Impairment of assets, amounting to R107 million (2013: R588 million) relates primarily to the impairment of property, plant and equipment; and more specifically, to port operating assets as a result of the independent valuation performed in the current year.
Post-retirement benefit obligations are actuarially assessed in accordance with IAS 19: Employee Benefits, and adjusted accordingly. Consequently a cost of R388 million (2013: R251 million) was recognised during the year, which includes a provision of R75 million for an ex-gratia pension payment that will be made to the most disadvantaged pensioners.
Fair value adjustments amounted to R264 million (2013: R222 million). These adjustments comprise an investment property fair value gain of R647 million, recognised in terms of IAS 40: Investment Property, and a R72 million gain
derivative financial instruments for the year. More specifically, these gains arose from the ’mark to market’ of foreign exchange hedges that Transnet executed to eliminate foreign currency risk, as well as those hedges that have
IAS 39: Financial Instruments: Recognition and Measurement. These gains were off-set by a fair value loss of R455 million raised in terms of IFRS 13: Fair Value Measurement, due to the recognition of credit risk associated with derivative instrument counter parties.
PERFORMANCE
AND OUTLOOK
20142013201220112010
35
61
0
37
95
2 45
90
0
50
19
4 56
60
6
REVENUE
12,3%
20142013201220112010
14
40
9
15
76
3 18
88
2
21
05
1 23
63
9
EBITDA
13,2%

48 INTEGRATED REPORT 2014
Accordingly, net profit from operations before net finance costs increased by 13,5% to R12,7 billion (2013: R11,2 billion).
Net finance costs increased by 8,0% to R5,6 billion (2013: R5,1 billion) in line with expectations, due to increased borrowings to fund the capital investment programme. Capitalised borrowing costs amounted to R1,3 billion (2013: R1,1 billion), an increase of 22,3% in line with the capital expenditure programme.
The taxation charge of R2,0 billion (2013: R1,9 billion) comprises a current taxation credit of R59 million (2013: charge of R39 million) and a deferred taxation charge of R2,0 billion (2013: R1,9 billion). The decrease in the current taxation charge arose mainly due to an increase in wear and tear allowances and deductible maintenance expenditure claimed. The effective taxation rate for the Group is 27,5% (2013: 31,3%).
Profit for the year amounted to R5,2 billion (2013: R4,1 billion), an increase of 24,9% compared to the prior year.
Revaluation of property, plant and equipmentThe Group assesses the revaluation of its pipeline networks and port infrastructure in line with its accounting policy, which requires an independent valuation every
three years, as well as index valuations in the intervening periods. During the year, an index valuation was performed on the pipeline networks; with an independent valuation being performed on port infrastructure and port operating assets.
Accordingly, the carrying value of port facilities required a revaluation adjustment of R7,8 billion (2013: R1,3 billion). The carrying value of pipeline networks required a revaluation adjustment of R467 million (2013: R423 million) in accordance with IAS 16: Property, Plant and Equipment.
Deferred taxationThe deferred taxation liability increased to R25,2 billion (2013: R20,5 billion), as a result of the charge of R2,0 billion for the year, together with the deferred taxation impact of R2,3 billion on the revaluation of property, plant and equipment, which has been recorded directly in equity.
Cash flowsCash generated from operations amounted to R24,0 billion (2013: R22,6 billion), an increase of 6,4% from the prior year, evidencing the Group’s ability to generate strong sustainable cash flows. Cash generated from operations (after working capital changes) increased by 11,6% to R25,3 billion (2013: R22,6 billion) following the implementation of an active programme to improve working capital management.
PERFORMANCE
AND OUTLOOK (continued)
Loaded coal train going to Richards Bay

49
The cash interest cover ratio at 3,7 times (2013: 3,7 times) is significantly above the target of 3,0 times, despite an increase in net finance costs from increased borrowings to fund the capital investment programme.
BorrowingsTransnet raised R22,4 billion for the year, made up of the following funding initiatives:
Development Bank; and
Transnet repaid borrowings amounting to R8,0 billion, which related predominantly to loans and commercial paper that matured during the year.
The gearing ratio increased to 45,9% (2013: 44,6%) due mainly to significant capital expenditure payments made in the final quarter of the 2014 financial year. This level is still well below the Group’s target range of 50,0%, reflecting the significant capacity available to pursue the counter-cyclical investment strategy. The gearing ratio is not expected to exceed the target ratio in the medium term.
Derivative financial assets and liabilitiesDerivative financial instruments are held by the Group to hedge financial risks associated with its capital investment
to market’ of these derivative financial instruments resulted in a net derivative financial asset of R7,3 billion (2013: R3,8 billion). The recent volatility of foreign exchange rates gave rise to this net asset position. Cross-currency interest rate hedges and forward exchange contracts were executed to eliminate foreign currency and interest rate risks on borrowings. These hedges have been hedge accounted for in terms of IAS 39: Financial Instruments: Recognition and Measurement.
Pension and post-retirement benefit obligations The Group provides various post-retirement benefits to its active and retired employees, including pension and post-retirement medical benefits, amongst others. The two defined benefit funds, namely the Transnet sub-fund of the Transport Pension Fund (TTPF) and the Transnet Second Defined Benefit Fund (TSDBF), are fully funded with actuarial surpluses of R2,3billion (2013: R1,7 billion) and R2,6 billion (2013: R2,3 billion) respectively. Transnet has not recognised any portion of the surplus on these funds, as the fund rules at present do not allow for the distribution of a surplus. The post-retirement medical benefit obligation is approximately R1,2 billion (2013: R1,4 billion).
In addition to the annual statutory increases, two ad hoc bonuses proposed by the TSDBF and the TTPF Board of Trustees – and approved by the Transnet Board of Directors – were paid to the beneficiaries of the TSDBF and TTPF during April 2013 and December 2013, amounting to R178 million and R167 million respectively, thereby supplementing the statutory increases. The total value of ad hoc bonuses paid by the TTPF and TSDBF to their beneficiaries amounted to R142 million and R1,9 billion respectively. Additionally, the Board of Trustees of the TTPF and TSDBF approved the payment of a further ad hoc bonus to their beneficiaries amounting to R18 million and R160 million respectively. The combined bonus amounts were paid in April 2014. These payments continue to supplement the current statutory increase for TTPF and TSDBF beneficiaries to provide pensioners with increases above CPI.
In addition to the payments by the TTPF and TSDBF, Transnet has again made an ex gratia payment to its most disadvantaged pensioners from both the TTPF and TSDBF, amounting to R70 million. The payment was made specifically to those pensioners with very low pensions despite long service. This brings the total amount of ex gratia payments made by Transnet to beneficiaries of the defined benefit funds to R448 million.

INTEGRATED REPORT 201450
Contingencies and commitmentsNo material movements occurred in contingencies and commitments since 31 March 2013.
GuaranteesThe sole Shareholder in Transnet SOC Ltd, namely the South African Government, has guaranteed certain borrowings of the Group amounting to R3,5 billion (2013: R3,5 billion) representing 4,0% of total borrowings of R86,6 billion. These guarantees were issued pre 2000.
Capital investment and progress on major projectsThe Group’s capital investment for the year amounted to R31,8 billion (2013: R27,5 billion) – excluding capitalised borrowing costs – representing a 15,6% increase from the prior year’s investment. The increase is due mainly to capital expenditure of R4,9 billion being expended earlier than expected on the 1 064 locomotive contract before year-end. The R31,8 billion investment represents R13,3 billion invested in the expansion of infrastructure and equipment, whilst R18,5 billion was invested in maintaining capacity.
Iron ore line expansion up to 60,0mtThe iron ore line is the main export channel for iron ore from the mines in the Northern Cape to the Port of Saldanha. Rail capacity was increased to 60,0mt and port capacity to 58,0mt over the quay wall.
Phase 1A to C to increase the iron ore line capacity to 60,0mt is complete. The pre-feasibility study to expand the capacity is in progress. The business case is currently undergoing a detailed validation process from a commercial, technical and economic perspective. Phase 1D, being the addition of a third tippler and associated rail works, has been approved by the Board for approximately R1,6 billion. The third tippler will ensure that 60,0mt can be exported on a sustainable basis as the two existing tipplers currently do not allow for any down-time.
All 32 locomotives required to facilitate the increase in iron ore capacity to 60,0mt have been tested and were accepted into operations by December 2013. Transnet’s investment in the iron ore expansion project and locomotive acquisitions for the year amounted to R626 million. Overall, 54,3mt in iron ore volumes were transported during the year.
Coal line expansion up to 81,0mtThe coal line is the main export channel for transporting coal, and starts at the mines in Mpumalanga and ends at the Port of Richards Bay. Plans are in place to increase rail capacity to 81,0mt in the near future and thereafter to 97,5mt. The total expansion and sustaining capital investment for the coal and mineral system programme is estimated at R45,5 billion over the next seven-year period of the MDS.
Final designs to expand capacity to 81,0mt are nearing completion and a number of work packages are already in execution. The land acquisition process is well underway for constructing substations on privately-owned land. Negotiations are underway with Eskom to ensure that the upgrading of the electrical supply between Ermelo and Richards Bay is completed according to schedule. The project is expected to be completed by the 2018 financial year.
All 110 Class 19E dual voltage locomotives have been delivered and accepted into operations. This will facilitate the planned expansion of the coal line to 81,0mt. A total of R214 million was invested in the coal line expansion to 81,0mt. Transnet transported 68,2mt of export coal during the year.
Transnet concluded a contract for the supply of 100 additional electric locomotives on 17 March 2014.
PERFORMANCE
AND OUTLOOK (continued)
20142013201220112010
18
44
1
21
50
4
22
25
9
27
47
1 31
76
6
CAPITAL INVESTMENT
14,6%

51
The locomotives are destined for the export coal line and will enable existing coal line locomotives to be cascaded to the general freight business (GFB). The investment in the 100 electric locomotives is intended to mitigate against the anticipated shortfall in MDS volumes resulting from the tractive capacity shortages due to the delays in the execution of the general freight locomotive acquisition programme.
General Freight Business (GFB) R20,7 billion was invested in the GFB and relates to the upgrade and maintenance of infrastructure and rolling stock. Transnet transported 88,0mt of GFB volumes during the year.
The project to acquire 43 diesel locomotives for GFB is complete and all the locomotives were accepted into operations by July 2013. Overall R173 million was invested in the acquisition of these locomotives during the year.
The contract for the supply of 95 Class 20E electric locomotives for GFB was signed in October 2012. Nine locomotives were delivered during the year. Commissioning tests have confirmed that the quality of these locomotives is in line with expectations. Transnet invested R527 million on this acquisition during the year.
Electric Locomotive and Bombardier Transportation South Africa contracts for the supply of 599 electric locomotives, while General Electric South Africa Technologies and CNR Rolling Stock South Africa (Pty) Ltd will build and supply 465 diesel locomotives. The multi-billion rand acquisition is South Africa’s single biggest infrastructure investment initiative by a corporate.
This marks a significant milestone in the company’s history together with substantial socio-economic benefits for South Africa. The drive to modernise our fleet is intended to improve reliability and availability of locomotives. This will improve customer satisfaction,
ultimately leading to our crucial goal of road-to-rail migration of cargo in line with government’s objectives. These milestones will be achieved as more than half of the current locomotive fleet will be renewed with this acquisition.
In line with South Africa’s commitment to boost its manufacturing capacity, all the locomotives except 70 will be built at Transnet Engineering’s plants
driving South Africa’s regional integration objectives. Transnet Engineering is the company’s engineering, manufacturing and rolling stock maintenance division.
Transnet Engineering’s role in the agreement has been defined to ensure that it transforms into an OEM over time. Transnet Engineering will share approximately 16% of the total build programme – about a third of which will be outsourced to local emerging engineering and manufacturing firms. This will enable it to create export capability for locomotives and related products. In total, the localisation elements are expected to contribute over R90 billion to the economy.
In terms of the agreements signed with the successful bidders, the last locomotive will roll off the production line within three and a half years. In other words, at the programme’s peak, Transnet will be producing 480 locomotives per year at 48 per month. The rationale for splitting the work emanates from the suppliers ability to stick to an extremely tight delivery schedule, which was one of the key considerations in assessment of the bids. It is our view that no single supplier would have the capacity or resources to deliver within the timelines we had envisaged.
The majority of the locomotives will be deployed in Transnet Freight Rail’s general freight business, which is all cargo - excluding the dedicated heavy haul lines for iron ore and coal. Freight Rail, which accounts for roughly 50% of Transnet’s revenue and capital expenditure requirements, will grow its volumes to 350 million tonnes from the current 207 million tonnes. Just over 60% of the growth will be from the GFB.

INTEGRATED REPORT 201452
In addition, the Company signed a contract for 60 class 43 diesel locomotives.
These locomotives will modernise the fleet and are intended to improve reliability and availability of locomotives, thereby improving customer satisfaction and increasing road-to-rail migration. The investment is intended to increase the capacity of Freight Rail’s GFB from 80mt to 177mt.
The business case to expand manganese export capacity to 16mt through a new bulk terminal in the Port of Ngqura was completed in November 2013 and has proceeded through Transnet’s approval process. The business case was submitted to the Shareholder in February 2014 as per the requirements of Section 54 of the PFMA.
A total of R3,7 billion was invested in infrastructure maintenance initiatives. Further, to keep the condition of the rolling stock at an acceptable level, Transnet invested R2,3 billion and R2,1 billion in the maintenance and overhauling of locomotives and wagons respectively.
During the year, 3 281 wagons were built as part of the MDS’s wagon-build project. The total investment in the wagons built amounted to R3,3 billion.
Ngqura Container TerminalThe construction work packages forming part of the expansion of the Ngqura Container Terminal are complete, except for the construction of a new administration building for National Ports Authority, and the construction of an administration craft basin for tugs. Tenders were awarded for the first phase of the administration building, with the tender for the building and administration of the craft basin due to go to market in June 2014.
Transnet has acquired port equipment to complete the work packages required to increase capacity. The majority of the required equipment was delivered by the end of the year and R250 million was invested for this purpose.
Durban Container TerminalThe project to increase the capacity of the container terminal in Durban is complete with only a limited number of work packages outstanding. The old fuel supply point will now be decommissioned. The scour protection at South Quay is due for completion in the 2015 financial year.
Reconstruction of sheet piled berths at Maydon Wharf, Port of Durban Transnet has commenced the reconstruction and deepening of seven steel sheet piled berths at Maydon Wharf in the Port of Durban. Construction on the first of these berths (Berth 12) was successfully completed and is fully operational. The contract for the remaining six berths has been awarded and onsite construction is expected to commence in the near future. Operational disruptions will be minimised at Maydon Wharf during the roll-out of the planned investment of R1,6 billion.
New Multi-Product Pipeline (NMPP) The NMPP is a strategic investment to secure the long-term supply of petroleum products from the coastal terminals in Durban to the inland market (predominantly Gauteng). It is one of the largest and most complex multi-product pipelines in the world. An innovative engineering project in concept and design, the pipeline component of the NMPP system of assets is buried underground over a distance of 717 kilometres.
The 24” trunk line (555 kilometres), together with three 16” inland pipelines (162 kilometres), three trunk line pump stations and two trunk line metering stations are operational; and construction on the coastal terminal (TM1) and inland terminal (TM2) is in progress. Currently, 4 350 people are employed on the project. The trunk line was successfully commissioned in December 2011 and put into operation in January 2012. The trunk line, which is designed for multi-product service (both petrol and diesel) currently operates in diesel service only. Once TM1 and TM2 are operational, the trunk line will be used in a multi-product service capacity. The NMPP trunk line has a current capacity of approximately
PERFORMANCE
AND OUTLOOK (continued)

53
4,4 billion litres per annum; and the Durban to Johannesburg pipeline’s current capacity is capped at approximately 3,5 billion litres per annum, providing a total capacity of 7,7 billion litres between Durban and Gauteng.
The NMPP transported 2,3 billion litres of fuel during the year, notwithstanding certain challenges being experienced at the NMPP terminals, including unusually inclement weather, protracted industrial action and technical complications. These challenges were not initially anticipated and have necessitated a detailed review of the programme in line with Transnet’s governance processes.
Overall, R21,4 billion had been invested in the NMPP project at the end of March 2014, with the investment for the year amounting to R3,1 billion.
Economic, social and environmental impact
Broad-Based Black Economic Empowerment (B-BBEE) and supplier developmentAs a State-owned Company, Transnet’s B-BBEE verification covers six of the seven elements of the Generic Transport Public Sector Scorecard, excluding the ownership element. The Rail Charter, Maritime Charter and Property Charter are also applied. Transnet was rated a Level 3 B-BBEE contributor in 2013.
Transnet undertakes all its procurement activities in a manner that protects and advances persons, or categories of persons, who have been disadvantaged by past discrimination and ensures that procurement activities are fair, equitable, transparent, competitive and cost-effective. Transnet’s procurement activities contribute directly to the economic transformation of South Africa and as such, have the ability to decrease income inequalities, whilst significantly increasing the number of previously disadvantaged individuals who manage, own and control businesses.
Transnet’s total recognised B-BBEE spend, as per the Department of Trade and Industry Codes, is R38,8 billion or 94,4% of Total Measurable Procurement Spend of R41,1 billion as at 31 March 2014 (2013:
R33,4 billion or 88,1% of R37,9 billion). During the year, Transnet spent R8,19 billion (21,1% of B-BBEE spend) on black-owned enterprises; R1,56 billion (4,0% of B-BBEE spend) on black woman-owned enterprises; R3,61 billion (9,3% of B-BBEE spend) on qualifying small enterprises; and R1,97 billion (5,1% of B-BBEE spend) on exempted micro-enterprises.
Transnet’s Supplier Development programme promotes skills development and the creation and preservation of jobs. It further encourages the transfer of intellectual property and the localisation of supply; and ultimately promotes industrialisation through contractually obligated supplier development plans. Since inception of the programme, total contract value to date amounts to R29,4 billion (2013: R17,1 billion). Supplier development obligations concluded with suppliers during the year amounted to R10,9 billion or 37% of contract value (2013: R7,2 billion or 42,0% of contract value). Of these supplier development obligations, R5,9 billion or 54% were fulfilled during the year (2013: R4,0 billion or 55,5%).
The award for the 1 064 locomotives fulfilled the requirements for stringent local content, skills development and training commitments, as stipulated by the Supplier Development Programme. The OEMs exceeded the minimum local content compliance criteria for rolling stock of 60% for electric locomotives and 55% for diesel locomotives. In line with South Africa’s commitment to boost local manufacturing capacity, all the locomotives – except 70 – will be built at Transnet Engineering’s plants.
Further, Transnet approved various enterprise development initiatives to provide both financial and non-financial support to qualifying black-owned enterprises, black women-owned enterprises, qualifying small enterprises and exempted micro-enterprises. The Company remains committed to empowering small, medium and black-owned enterprises as well as giving effect to Government’s policy on B-BBEE.

INTEGRATED REPORT 201454
SafetySafety performance is measured against the industry recognised rolling 12-month
Company recorded a DIFR performance of 0,69 against the target of 0,75 (2013: 0,74), which is exceptional by international standards. This is the third consecutive year that the Company recorded a DIFR ratio below 0,75.
Despite considerable efforts to improve safety, the Company regrets to report seven employee fatalities during the year, compared to nine in the prior year.
A total of 106 public fatalities were reported during the year, compared to 125 in the prior year. These fatalities were due mainly to people trespassing onto operating railway lines.
The Board and management conveys its deepest condolences to the families, colleagues and friends of Transnet employees and members of the public who lost their lives, and strongly reaffirms its continued commitment to the safety of employees and the public as a vital component of the Company’s operations.
Corporate social investment (CSI)The Transnet Foundation invested R174 million (excluding capital expenditure of R2,9 million) in CSI initiatives across South Africa during the year, with approximately 75,86% spent on healthcare, education, sports development, container assistance and employee volunteer programmes. Whilst the Transnet Foundation remains the custodian of the Company’s CSI initiatives, the operating divisions respond proactively to the needs of vulnerable communities surrounding their operations.
The Company’s flagship CSI project, encompassing the Phelophepa I and Phelophepa II Healthcare Trains, continued to provide dentistry, optometry, pharmacy and various counselling services to rural communities, accessing 288 026 patients during the year.
The Rural and Farm Schools Sport programme hosted a national sport tournament during the year, from which
nine learners were selected to play for Banyana Banyana, and 14 were identified as potential qualifiers to be recruited to the SAFA/Transnet School of Excellence.
The Transnet Employee Volunteer Programme (EVP) has expanded to De Aar and the West Coast, whilst aligning with Transnet’s operations. During the year, employees gave their professional,
targeted community development projects in Transnet’s EVP Villages.
The Container Assistance Programme (CAP), in partnership with the SAPS, continues to support Freight Rail’s efforts to conduct safe rail operations and community safety awareness programmes. Further, the CAP’s partnerships with various Government departments have resulted in a bouquet of previously inaccessible Government services now being available to rural communities.
Grants and donations form a substantial part of Transnet’s social interventions to alleviate poverty and to help build stronger communities. To date, the Company has spent more than R22 million in strategic commercial and non-commercial donations as a demonstration of its commitment to good corporate citizenry.
Energy efficiency Transnet recorded a 0,2% decrease in electricity consumption compared to the prior year. In terms of electric traction (which constitutes 74% of the Company’s total power consumption) Freight Rail achieved a 2,4% energy efficiency gain. This was partly due to the regeneration capabilities of the new 15E and 19E locomotives on the iron ore and coal lines, which together regenerated approximately 176 185MWh during the year.
The Company’s carbon emissions increased by 0,9% to 4,24mtCO2e compared to prior year. This is due to increased use of diesel tractive power. Market share gains from road hauliers in Freight Rail’s top 10 general freight commodities resulted in carbon emissions savings for the South African transport sector of 835 670tCO2e.
PERFORMANCE
AND OUTLOOK (continued)

55
Human capitalTransnet’s permanent employee headcount at 31 March 2014 was 54 671. The Company spent 3,0% of its labour cost on training during the year, prioritising training for artisans, engineers, and engineering technicians. During the year, 138 full-time engineering bursaries were awarded in various disciplines and 3 699 high school learners were sponsored through the rail cadet scheme. In addition, 339 engineering technician trainees were given workplace experience opportunities; with 1 552 new apprentices joining Transnet’s apprenticeship scheme; and 89 new graduates-in-training being contracted by the Company. Sector-specific skills development training continued to focus on maritime, rail and port terminal operations, with 1 569 learners participating in these programmes. Currently, the Company has access to 3 340 apprentices and 483 engineering bursars in its talent pool.
Transnet exceeded its employment equity targets across all job grades. The employee ethnic group profile for the year was 67,9% Black African, 9,8% Coloured, 3,8% Indian, and 18,5% White. Female representation now exceeds 24,4% in executive, senior, professional and skilled technical levels, including a 50,0% representation in the Group Executive Committee. Representation of people with disabilities remains a challenge, improving to 1,6% (2013: 0,8%) of the total headcount.
Economic regulationTransnet Pipelines’ tariffs are regulated by the National Energy Regulator of South Africa (NERSA), whereas National Ports Authority’s tariffs are regulated by the Ports Regulator of South Africa.
PipelinesPipelines filed a tariff application for a revenue requirement of R3 351 million for the 2015 tariff period, translating
as a 19,88% increase in revenue driven by an increase in the regulatory asset base. However, at the public hearing held on 6 February 2014, Pipelines amended its tariff application, requesting an allowable revenue increase of only 1,54% as a consequence of both the Inland Accumulation Facility and the Coastal Accumulation Facility coming into operation later than expected. The delay was largely due to labour strikes and weather-related deferrals.
On 13 March 2014 NERSA approved an allowable revenue increase of 5,08%, which included a deferment of the clawback over a period of two years.
National Ports AuthorityThe tariff application for 2015 has been prepared on the basis of the guidelines contained in the Interim Regulatory Manual issued by the Ports Regulator. This has been done on the premise that National Ports Authority’s tariff methodology position paper is still under review by the Regulator.
In considering its role as facilitator of economic growth – and its commitment to reducing the cost of doing business in South Africa – the National Ports Authority applied for a tariff increase of 8,5% in its tariff application.
On 28 March 2014, the Ports Regulator issued its Record of Decision, which awarded the following tariff adjustments:
All cargo dues to increase by 5,90%, with the exception of: (i) An 8,15% tariff increase in dry bulk
cargo dues for coal, iron ore and manganese; and
(ii) An 8,15% tariff increase on all marine services and related tariffs.

INTEGRATED REPORT 201456
OUTLOOKThe global economy appears to be transitioning toward a period of stable, but slower growth. As a result, prospects for the South African and regional economies are brighter. On the back of continuing investments in the natural resources sector and stronger domestic demand, GDP is estimated to grow by 3,0% in 2014 and 3,5% in 2015. This will support growth in domestic and regional freight demand.
Global container volumes are estimated to have grown by 3,2% in 2013 and are forecast to grow by an average annual rate of 5,3% to 2017. Transnet estimates average container growth of 31,0% (3,9% CAGR) over the next seven years driven by domestic GDP growth, expanding intra-regional trade and transshipment activities.
Ongoing industrialisation and urbanisation, particularly in Asia will continue to drive demand for iron ore and associated minerals. World trade of iron ore is estimated to have increased by 8,0% in 2013 and is forecast to grow at an average annual rate of 4,1% to 2018. South Africa with its high quality ore and relatively low cost production continues to present an attractive alternative to Brazilian and Australian supply into Asia.
World thermal coal trade is estimated to have increased by 1,8% in 2013 and is forecast to grow at an average rate of 2,2% over the next five years. Despite policy changes regarding coal use in response to environmental concerns, the relatively low cost and reliability of coal will continue to support its use, particularly in emerging economies. Coal is anticipated to account for between 27% to 28% of the global energy market share over the next three decades. South Africa is well positioned to supply coal into the growing coal markets of China and India.
China’s industrialisation, emerging middle class and urbanisation will in the long-term remain the main drivers for demand growth. The planned MDS ramp-up in capacity will take place over a number of years after which the global recovery is expected to be assured. This will ensure that South Africa is ready to take advantage of the next upturn in the cycle.
In general, demand side risks appear to have diminished and growth opportunities for the next financial year remain positive. Despite the three-year economic slowdown, the MDS will still be achieved over the long term, albeit on a different trajectory. The aggressive investment that underpins the MDS is targeted primarily at satisfying demand that has been validated with customers seeking additional capacity.
Going forward, greater emphasis will be placed on measurement and monitoring systems and processes to enable a higher level of granularity in performance and risk management and end-to-end visibility of commodity supply chains.
fundamental imperative for the Company.
The strategic focus areas, key performance areas and objectives for 2015 have been refined slightly but remain largely unchanged. Volume and revenue projections have been adjusted to reflect capacity delivery constraints and lower market demand. Despite the lower market demand, key financial ratios have remained in line with approved parameters.
PERFORMANCE
AND OUTLOOK (continued)

57
ZPMC tandem lift STS cranes at Port of Durban

INTEGRATED REPORT 2014
MAIN
HEADING (continued)
58
ABOUT
FREIGHT RAIL
The 2014 financial year marked the second year of Transnet Freight Rail’s (Freight Rail’s) implementation of the MDS. The business has recorded substantial successes in recent years whilst operating within a severely capacity-constrained model. The focus on efficient and customer-oriented delivery has advanced the business closer to its goal of operating a scheduled railway. Freight Rail’s business model, comprising six business units, and operated on an integrated rail network, supported by the National Command Centre, has enabled it to prioritise key aspects of the business to better meet customer need.
BUSINESS OVERVIEW AND BUSINESS MODEL

59
Various global sector indicators currently rank Freight Rail at between 9th and 12th position in terms of major railways world-wide (World Bank Databank Business Monitor International). The longer-term goal is to position the business amongst the top five world railways. This positioning does not merely represent size of the network and rolling stock fleet, but also reflects efficiencies of the railway system.
Accordingly, the business is modernising the locomotive fleet, and upgrading and building new wagons to meet customer demand for specific commodity types. Freight Rail is also investing in the upgrade of the rail network and in a number of key strategic expansion projects. These include increasing capacity for transporting coal, iron ore and manganese; and developing technologies for intermodal road-to-rail solutions. Investment capital is also allocated to eliminating legacy systems and, where appropriate, introducing technology to reduce human error (such as the Yard Automation systems). Freight Rail has embarked on a major drive to improve efficiency, productivity and asset utilisation by building critical skills and operational competencies. Looking ahead, investment in the upgrade and maintenance of the rail network, together with investing in a competent and high-performing workforce will ensure safe and world-class rail operations.
Freight Rail plans to expand the rail business to include 3 300 locomotives and 85 000 wagons; and will build an additional 700 kilometres of rail network over the next five years. This includes the proposed new Waterberg network of 560 kilometres, as well as construction of additional loops sections and yards. During this time, unutilised yards will be rationalised. The export coal and iron ore lines are world-renowned heavy haul rail corridors. The upgrades to the Postmasburg – Port Elizabeth/Ngqura network corridor and the deployment of new 20E locomotives and wagons will result in the manganese export corridor operating as a new heavy haul corridor.
Freight Rail’s market development initiatives target the retention and growth of traditional rail customers in mining and heavy manufacturing sectors, including companies that beneficiate mining commodities. Other major customers are active in the fuel, chemicals, agricultural and timber sectors. The business will target new customers in the FMCG, textile and light manufacturing industries, where there are opportunities for ‘rail friendly’ commodity types to be shifted from road to rail. Traditional customers seek reliable, cost-effective and repetitive services. New customers will require greater levels of service reliability, predictability and flexibility – general prerequisites for an intermodal service. Freight Rail’s road to rail strategy aims at reducing the cost of doing business in South Africa and to create competitive supply chains

INTEGRATED REPORT 201460
ABOUT
FREIGHT RAIL (continued)
by transferring the transportation of rail friendly freight on the more cost competitive rail platform.
Freight Rail will penetrate new markets by implementing new technologies and processes and by improving market positioning amongst existing customers. Further growth in the shift of traffic from road to rail requires the development of an intermodal system. Freight Rail will achieve this by partnering with road hauliers and logistics service providers. These industry partnerships will help to level the road-to-rail modal imbalance and support the manufacturing sector as well as contribute to rural development by developing skills and creating jobs. This strategy not only supports growth in South Africa but also boosts regional growth in Southern Africa. Potential customers are open to the utilisation of rail services – and are becoming more so as the awareness of environmentally friendly transport solutions become more prevalent. The potential for levying a carbon taxation further drives this trend towards rail.
Freight Rail will address the fundamental railway-related challenge of reducing operating costs by improving asset utilisation, labour productivity and service efficiencies. These improved efficiencies – and associated reductions, will be achieved by accelerating the implementation of the ‘Lean’ and ‘Six sigma’ programmes.
The continued implementation of the MDS will enable volume growth from the current 210,4mtpa to 343,9mtpa over seven years, with the resultant increase in rail market share as well as the inevitable shift of future traffic from road to rail.
Strategic initiatives to address these objectives include:
Programme.
safety drive.
oriented performance culture.
refinement of the organisational business model for customer-facing business units.
Routine maintenance being carried out on a railway track in Emerlo

61
PER FOR MANCE R EVIEW AND OUTLOOKOverview of key performance indicatorsKey performance area and indicator Unit of measure
2013actual
2014target
2014actual
2015target
Infrastructure and maintenance
Capital expenditure(a)(c) R million 18 277 19 019 25 115 19 555
Volume and revenue growth
Commodity classification
– General freight business mt 82,60 91,22 87,96 95,30
– Export coal mt 69,21 77,00 68,19 75,00
– Export iron ore mt 55,91 61,50 54,27 58,05
Total volumes mt 207,72 229,72 210,42 228,35
Operational efficiency
Asset utilisation
General freight business Gtkm/Ntkm n/a 1,67 1,54 1,70
Export coal Gtkm/Ntkm n/a 1,58 1,57 1,60
Export iron ore Gtkm/Ntkm n/a 1,41 1,39 1,40
Loco-utilisation(b)
General freight business GTK’000/locco/month 4 973,00 5 370,00 4 786 5 335,00
Export coal GTK’000/locco/month 24 998,00 26 810,00 25 925 26 868,00
Export iron ore GTK’000/locco/month 47 530,00 55 000,00 51 983 55 000,00
Cycle time
Export coal hours 68,00 56,00 69,84 56,00
Export iron ore hours 94,00 76,00 93,91 76,00
Wagon turnaround time
GFB 11,30 8,60 10,74 10,30
Density
Northcor Tonkm/Routekm n/a 1,60 1,71 1,70
Capecor Tonkm/Routekm n/a 3,90 4,03 4,01
Southcor Tonkm/Routekm n/a 2,55 2,86 2,85
Natalcor Tonkm/Routekm n/a 6,70 6,98 6,97
RBaycor Tonkm/Routekm n/a 36,20 37,37 37,50
NWestcor Tonkm/Routekm n/a 3,80 4,18 4,01
Eastcor Tonkm/Routekm n/a 3,20 3,04 3,04
NEastcor Tonkm/Routekm n/a 5,70 7,00 6,78
Saldanha Tonkm/Routekm n/a 55,30 57,32 58,10
Sentracor Tonkm/Routekm n/a 4,30 4,97 5,00
(a) Excluding capitalised borrowing costs, intangible assets and includes capitalised finance leases.(b) Excluding shunting and B-fleet locomotives.(c) Includes R1,2 billion (R600 million each in year 1 and year 6) for TE projects not allocated to specific programmes.n/a not applicable.

INTEGRATED REPORT 201462
ABOUT
FREIGHT RAIL (continued)
Key performance area and indicator Unit of measure
2013actual
2014target
2014actual
2015target
Service delivery
On-time departure (average deviation from scheduled times)
General freight business minutes 280,00 225,00 212,77 217,00 Export coal minutes 206,00 120,00 42,91 90,00 Export iron ore minutes 73,00 60,00 8,95 60,00 On-time arrivals (average deviation from scheduled times)
General freight business minutes 356,00 260,00 340,05 259,00 Export coal minutes 332,00 240,00 133,69 180,00 Export iron ore minutes 140,00 120,00 128,72 225,00 Human capital
Employment equity % 82,00 76,00 82,52 80,00 Training spend % of personnel cost 3,70 2,96 1,54 2,10 Employee turnover % 4,00 5,00 4,83 5,00 Employee headcount permanent 29 489 34 004 29 225 33 974 Tariffs
Average tariff increase – GFB % n/a 7,90 7,60 8,67 Financial value creation
EBITDA margin % 40,80 43,81 41,92 45,59 Operating profit margin % 22,40 24,90 21,58 25,90 Gearing % 49,91 53,90 46,52 49,80 Net debt to EBITDA times 2,40 2,45 2,23 2,20 Return on average total assets – excluding CWIP % 10,80 11,30 9,7 11,40 Asset turnover – excluding CWIP times 0,48 0,42 0,45 0,44 Cash interest cover times 5,30 4,90 8,75 5,67 Risk, safety, health and environment
Cost of risk % of revenue 4,60 5,50 5,30 5,50 DIFR rate 0,86 1,20 0,82 1,15 Number of safety incidents number 755,00 599,00 701,00 526,00 Number of derailments – mainline number 85,00 85,00 116,00 75,00 Number of derailments – shunting number 296,00 247,00 242,00 217,00

63
OPER ATIONAL PER FOR MANCE COMMENTARYCapital planning and executionGoals and objectives for the reporting year 2014
expenditure in rolling stock and infrastructure at R19 019 million.
allocation for specific growth market segments.
standardising the network and rolling stock.
year capital investment plan of R209,9 billion.
Performance against objectives
and infrastructure amounted to R25 115 million, (140,0% of re-phased target and 132,0% of original target). The variance from the original budget is mainly attributable to the acceleration of the 1 064 locomotives for the general freight business to accommodate the future expected demand in volumes. This was offset by the underspend in delayed new wagon-build programme.
the combined effects of project cost savings of R192 million; as well as materials availability and timeline adjustment for certain projects.
Export coal
R3 235 million. Coal line expansion and sustaining programmes are nearing completion. – Ermelo third balloon is complete,
except for drainage and final testing of the welds.
– Infrastructure work for the 81mtpa expansion commenced and the four feeder cable projects are progressing well.
– Construction on the Saaiwater and Blackhill yards is scheduled to start in 2015.
Export iron ore
amounted to R1 015 million.
to increase the tractive power capacity of the ore line to 60mtpa, and have been delivered and accepted into operations. The project is ahead of schedule and nearing completion.
1C (60mtpa), 44 Class 15E locomotives have been acquired and are in operation.
infrastructure capacity from 47mtpa to 60mtpa is nearing completion. Remaining projects include the Erts yard facilities and planned Eskom work.
been received for the tippler 3 and associated rail lines (sustained capital). The programme is currently in the appeal stage. No detrimental impact is envisaged.
safety and maintenance of the network are nearing completion. The WILMA (technology for testing rail stress) rollout is complete and the Ultrasonic Broken Rail Detector (UBRD) is scheduled for completion by end-June 2014.
was paid to Eskom in January 2014 for transformers to support the increase in electrical supply on the export iron ore line.
General freight
amounted to R20 865 million.
support general freight traffic growth, with 1 064 locomotives to be procured over the next four years.
maintenance projects is on track.
on order, nine have been delivered to date. Local assembly for the remaining 86 20E electric locomotives started in February at Transnet Engineering’s facility in Koedoespoort, Pretoria.
acquired, delivered and accepted into operations. These additions to the rolling stock fleet are key elements to increasing capacity and service delivery, as well as reducing electricity supply constraints.

INTEGRATED REPORT 201464
locomotives is ahead of schedule due to the accelerated acquisition of on-board cameras.
LOOKING FORWAR D
over the next seven years aims to address the continued locomotive shortages and to provide infrastructure expansionary requirements for the general freight business.
the most profitable commodity haulages and advance the road-to-rail strategy. Commodities to be targeted for growth include containerised commodities, manufactured goods and domestic coal – contributing to security of supply to meet South Africa’s electricity requirements.
to create capacity ahead of demand to respond to known and validated market requirements. Rail network upgrades and replacements are planned to restore the network to world-class standards to reduce incidents, increase operational productivity and increase railed commodity tonnages.
rehabilitation of specific and prioritised branch lines earmarked for concession and increased agricultural activities. As Freight Rail enters the third year of the MDS, the Capital Investment Plan is being refined to align key strategic projects and to firm up execution timelines. During the year, the validation of market demand for freight movement formed the basis for the reprioritisation of the capital portfolio. Whilst some projects may be delayed as a result of unavoidable procurement, or contracting and other operational issues, capital optimisation and efficient asset utilisation are the main drivers for effective capital investment. Key focus areas of the capital plan are: – Procurement of locomotives to
replace the aged fleet and additional locomotives to meet capacity requirements for general freight. This will lower the cost of doing business,
resulting in an efficient and reliable fleet, with greater productivity and availability due to a standardised fleet and reduced maintenance costs.
– The requirement for wagons is reviewed annually to meet the dynamic commodity mix. Investments in specialised wagons to service key sectors, such as automotive, containerised and intermodal business, as well as other major mining commodities (eg manganese, magnetite and domestic coal) are proceeding. The wagon build programme will be executed ahead of demand to make efficient use of Transnet Engineering’s capacity.
– The focus of the rail network remains the reduction of incidents, improved safety standards, optimal utilisation of slot capacity to execute; and a consistent focus on the modernisation of the network. Upgrades and replacements are planned for the required restoration of the network to world-class standards.
– Key coal expansionary projects will be accelerated to meet the volume ramp-up to 97mt by 2021. The procurement of 100 additional 19E compatible heavy haul locomotives; as well as the rehabilitation and construction of a double line of the Overvaal tunnel, and all post infrastructure expansion work packages (including electrical upgrade) following the 81mtpa project, will be accelerated by approximately 12 months.
– The iron ore industry has indicated that there is insufficient production capacity to support the planned increase from the current 60mt to 82mt in the MDS. Accordingly, the revised capital programme for expansion of the ore line corridor has been scaled down in line with the validated volume ramp up to 70mt by 2021.
options to optimise capital expenditure by way of ongoing capital scrubbing and various operational efficiency gains.
ABOUT
FREIGHT RAIL (continued)

65
Volumes and customer satisfactionGoals and objectives for the reporting year 2014
to rail.
ore line.
Performance against objectives
to-rail shift and export lines’ tonnage growth to achieve a stretched total target of 230mt. This necessitated providing capacity to meet market demand. A ‘customer service culture’ was further entrenched in the business, with improvements in operational efficiency to enhance customer satisfaction. Growing the rail footprint in the Southern African region with rural development as a strategic priority.
rail tonnage growth of 210,4mt (2013: 207,7mt); and recorded 6,5% year-on-year growth for general freight traffic (82,6mt – 88,0mt), demonstrating the growing road-to-rail shift and improved performance relative to previous years, albeit in a sluggish economic climate.
was recorded in the Container and Automotive Business, exceeding budget by 19%.
in 2014 against the target of 77mt, executing 88% of budget. Several major incidents contributed to the deviation, including the Richards Bay Coal Terminal (RBCT) power outage in quarter 4 of 2014, resulting in an estimated 2,3mt loss followed by an Eskom power failure
in March 2014; as well as derailments in September and December 2013, and also in March 2014; the prolonged scheduled occupation at the Ermelo balloon in May 2013; and a 33-day strike at Ermelo in October 2013 and at various mines in September 2013.
the budget of 18mt, demonstrating a budget execution rate of 83%. The 3,1mt shortfall against budget was due to major incidents such as the Ressano Garcia line shutdown resulting from a collapsed rail bridge near Maputo (under repair for eight weeks) as well as Eskom tippler challenges and mining stockpile shortages.
iron ore portfolio with considerable effort, given the product challenges at the Kumba Kolomela mine and off-spec product at Assmang’s Khumani mine. Four junior miners were successfully introduced to the export iron ore corridor.
manganese ore portfolio, demonstrating 6% year-on-year growth. Junior miners were introduced to the manganese ore export channel by establishing the Lohatlha bulk common user facility. Currently three customers participate and a total of 196,200 tonnes were railed since June 2013. Freight Rail engaged an independent service provider to operate the Lohatlha terminal, thereby assisting junior miners with loading at the facility.
business (ABL) revised the strategy to refine operational and collaboration models linked to the diverse customer and commodity portfolio, including the strategic commodities of grain, fuel and commodities transported to the Southern African region.

INTEGRATED REPORT 201466
Service Charter during the year. A cross-functional team was established to develop a holistic, integrated approach to embed a customer-centric culture across the organisation. Action plans have been generated and are monitored to address service gaps identified in the annual Customer Satisfaction Surveys, as well as performing ongoing Voice of Customer Surveys. Attributes showing marginal improvement from 2012 to 2013 include:
Service delivery dimension 2013 2012 %
Reliability 4,69 4,62 0,7
Deliver on promise 5,24 4,69 5,5
Provide proactive solutions 4,81 4,59 2,2
Visibility (track and trace) 5,85 5,82 0,3
Barloworld Logistics, Imperial Logistics and Unitrans Logistics during the year. DB Schenker is likely to enter into an automotive sector-focused agreement with Freight Rail to migrate freight from road to rail.
are integral to the agriculture, mining and timber sectors and serve as important feeders into the broader Freight Rail business. Investment in branch lines continues in the context of the challenges of economic resuscitation of rural and small towns, food security and opportunities for road-to-rail migration.
Highlights achieved for branch lines during 2014 included:
– The Belmont – Douglas branch line in the Northern Cape (originally built to 11t/axle loading) is in the final stages of upgrading to a 20t/axle loading to create a more efficient and cost-effective operation by railing greater wagon-loads of grain. 120 construction phase jobs were created and R41 million was invested in the upgrade.
– Freight Rail commenced the reconstruction of 21 kilometres of railway line from Balfour North Station to Grootvlei Station in February 2013, this being one of several collaboration projects between Transnet and Eskom. Transnet and Eskom have committed to collaborate on growing Eskom coal volumes from less than 10mt in 2012 to 32mt in 2019. Approximately 300 jobs were created during construction.
LOOKING FORWAR D
attracting new business, particularly through the development of road-to-rail technologies and intermodal solutions.
~25% to ~35% by 2021.
7,2mt in 2014 to 18,6mt in 2021.
will expand its services from handling customer complaints to include the handling of new business enquiries.
ABOUT
FREIGHT RAIL (continued)
Shunting yard at Germiston

67
Operational efficiency and productivityGoals and objectives for the reporting year 2014
through organisational development and performance (ODP) processes and initiatives. This involves the accelerated implementation of ‘Lean’ and ‘Six sigma’ programmes.
improved reliability and customer service delivery.
and wagon turnaround times.
and systems (eg, crew management systems) to reduce human error and improve network reliability.
National Command Centre.
Performance against objectives
Continuous improvement processes and initiatives highlighting a positive trend included
and trains as a result of continuous improvement and lean projects.
and 40 were trained in ‘Green Belt Six Sigma’.
savings. At the beginning of the year an overspend amount of R597 million had been projected. The budget was reduced by 40% compared to the previous year’s actual and did not account for operational activity and salary increases. The actual overspend was contained to R387 million, which represents a saving of 35%. Initiatives implemented to realise savings included engaging unions and first-line managers to eliminate overtime payment averages for attending training (saving of R26 million); and reducing rest-day overtime (47%), 12-hour exceedings (12%), normal overtime (25%), Sunday overtime (7%). Freight Rail will continue to ensure compliance with the Variation Agreement by not exceeding 80 hours of overtime for each employee, reducing to zero 12-hour exceedings and further reduce rest day work.
organisation, 23 ‘value chain’ processes were identified for Levels 1 and 2. All activities, organisational design, metrics, decisions and initiatives are derived with the sole purpose of enhancing and optimising performance of business processes in response to the MDS targets.
(CPL) has enabled Freight Rail to be benchmarked against global standards in terms of its crew re-certification process. The duration for the certification process has been reduced from 22 days to three days, with the focus on ‘on the Job’ evaluation.
Scheduled railway for improved reliability and customer service delivery
year-on-year improvement for the general freight, coal and iron ore businesses, due mainly to improved planning and rescheduling capabilities, as well as adherence to pre departure countdown processes.
freight improved significantly by 24% to 212,8 minutes while on-time arrivals improved by 4,5% to 340 minutes.
and is being implemented to improve preparation of trains to ensure on-time departures. The improvement in the departure trend benefited the ‘on-time arrival’ KPI.
(3OOC) project has been registered with the national business council (NBC) and the labour consultation process has been initiated. The consolidation of single man cabins into existing centralised train control areas is 34% complete.
Asset utilisation
improved significantly year-on-year by parking off excess capacity as a result of aging fleets and improved cycles. Turnaround time improved from 11,30 days to 10,74 days.
increased marginally since the previous year, from 68 hours to 69,84 hours.

INTEGRATED REPORT 201468
This was largely caused by incidents on the coal line. The view is that the super-efficient Shongololo wired distributed power train, once fully implemented, will reduce cycle times to about 51 hours from the current 69 hours. It will also create wagon savings of 600 units.
improvement on target, demonstrating that longer, heavier and ‘compliance to design’ trains are meeting Freight Rail’s drive to improve productivity. This is a new KPI, hence there are no results for the previous year’s performance. However the performance against the targets set for 2014 indicate significant improvement. – General freight: actual of 1,54 against
a target of 1,67. – Coal line: actual of 1,80 against a
target of 1,58. – Iron ore line: actual of 1,39 against a
target of 1,41.
and 15E locomotives on the coal and iron ore export lines resulted in improved energy efficiency gains. Freight Rail’s regenerated electricity is used in the locomotives themselves and any excess electricity is transmitted back into the Eskom grid.
Rail technology implementation to reduce human error
Equipment, such as Wayside readers, hot box detectors and Wheel Profile Machines improved safety, monitoring and management of trains.
power (wired distributed power and radio distributed power) improved Freight Rail’s ability to run longer safer trains, thereby increasing the capacity of limited slots.
keeping on SAP in areas such as medical
history, compulsory certification and the risk profile of an area through its crew management system, promoting an improved safety culture.
LOOKING FORWAR D
will be a priority to improve operational efficiency, service reliability and predictability.
future. Freight Rail intends to increase the number of wired distributed power trains with the injection of more dual powered locomotives. This will enable the coal line to remove old, unreliable and antiquated locomotives, leading to improved adherence to a scheduled railway, and improved cycle times and predictability, thereby further stabilising the coal line.
substantial growth opportunity for Freight Rail and with the injection of the 95 20E dual powered locomotives, the operation will yield improved reliability and efficiency going forward.
increase from 56 to 70 trains per week in the year ahead as a result of the highly reliable class 43 locomotives. The increase in the number of trains to be run is based on customer contracted volumes for the year ahead.
Beitbridge by introducing a new train route from Richards Bay using the Class 43 locomotives. Increased reliability and efficiency will further improve cycle times.
performance (ODP) processes and related programmes aim to improve operational efficiency KPIs by at least 5%, including asset utilisation, wagon turnaround times and service delivery targets.
ABOUT
FREIGHT RAIL (continued)

69
Human capitalGoals and objectives for the 2014 reporting year
uses a Workforce Plan for budget purposes as well as develop plans to mitigate against future risks of the business with regard to skills shortages.
programme to recognise ongoing high performance and excellence at four levels (local, business unit, Freight Rail-wide and the Transnet group)
proactively.
perspective, target 76% black employees, with a target of 35% female employees and a target of 2% people with disabilities (PWDs).
methodology with particular emphasis on usage of the automated system for all employees in Grades A to G to achieve 100% compliance by year-end.
Performance against objectives
‘Strategic Workforce Planning’ based on current supply and future demand. Actual training for the ‘workplace skills plan’ exceeded the year-to-date targeted number of employees by 5,79%.
financial constraints.
Awards ceremony was held in June 2013. The table shows the number of employees recognised in these categories in the Recognition and Rewards Scheme:
Individuals (including teams) 48
Team awards 30
Legends 31
Train drivers 25
union took place in Emerlo during the year.
concluded with recognised labour unions.
management standards and controls.
was achieved and exceeded with 82,63% representation of black employees.
representation was achieved against a target of 35%. Further work is required in this area.
disabilities reached 1,9% against a target of 2%. The target for the 2015 financial year has been increased to 2,3%.
programme continued during the year.
programme was piloted at the ABL business and in the ODP department.
was introduced with 100% managers contracted for the review period.
management capacity across the business.
recruitment, individual development planning and performance management (balanced scorecards) for levels A to F.
to improve the management of employee records.
to the HC portal (ESS/MSS), including single sign-on capability from Windows access, scanned document attachment, and revised workflow escalations for leave applications.
developed and configured in SAP HCM.
was implemented for levels C and D and will be implemented for Levels E and F in 2015.
were trained in 2014.
finalised.
LOOKING FORWAR D
culture of high performance across the business in the year ahead.
focussing on previously disadvantaged professionals, people with disabilities and women.

INTEGRATED REPORT 201470
processes and procedures will be implemented for supervisors.
time and attendance system will enable employees to clock in and out at the start and end of their shifts on a biometric device that will perform automatic time and pay calculations interfacing into payroll. This would ensure that employees time is managed according to company policy and that calculations are standardised. A proof of concept is planned for Ermelo in quarter 2 of 2015.
amended by Parliament to make provision for the establishment of a Rail Corporate University.
aligned with the Leadership Brand Archetype – was developed and EVP brand engagement and ‘socialisation’ is due to be implemented in 2015.
Regulatory and key stakeholder engagementGoals and objectives for the 2014 reporting year
Regulatory position.
Performance against objectives
the working relationship with the shareholder on railway policy matters during the year and continued the comprehensive process of policy alignment with the Department of Public Enterprises (DPE) to engage with the Department of Transport (DoT) on the anticipated National Rail Policy and Economic Regulation. In September 2013, DoT issued the revised Green Paper on National Rail Policy and embarked on the stakeholder engagement process with various stakeholders.
in making inputs as the DoT develops a pragmatic and implementable National Rail Policy. In particular, the business continued to engage with the DoT and DPE with respect to a Cost-Benefit-Analysis of a Standard Gauge (SG)
ABOUT
FREIGHT RAIL (continued)
policy proposal and Private Sector Participation (PSP) in rail.
analysis of the relevant transport modes (road, rail, maritime and aviation) in its Single Transport Economic Regulator (STER) development process. Freight Rail responded to a questionnaire with a view to engaging with the DoT. Transnet and Freight Rail, through the DPE, are fully engaged in this process.
LOOKING FORWAR D
Standard Gauge Cost Benefit Analysis and other key policy issues.
Policy together with DPE.
DoT on the second STER Bill to ensure alignment on critical aspects.
Rail ‘Position Paper’ on Economic Regulation.
Routine maintenance being carried out at Emerlo shunting yard

71
Safety, risk and sustainabilityGoals and objectives for the 2014 reporting year
match world-class standards.
prevent accidents and acts of crime and sabotage.
railway operators to build a sustainable Safety Culture.
assessments (EIAs) for major capital programmes.
asbestos removal waste licences for all major asbestos contaminated sites as well as the Conversion of De Aar Quarry into an asbestos landfill site, asbestos clean-up projects and the Airborne Asbestos Monitoring Project.
improve energy efficiency of the business by measuring the performance of the Greenhouse Gas (GHG) Inventory. GHG emissions were 0,42% higher than 2013 largely due to the increased use of locomotives in a bid to achieve volume growth (MDS) and the obligations of the road-to-rail migration strategy.
Standards as per the Rail Safety Regulator’s requirements.
Performance against objectives
Safety
reduction in the number of safety incidents. Shunting derailments were reduced by 17%.
considered world-class performance in the rail industry. Performance has improved consistently over the past five years, demonstrating an overall improvement in the safety culture.
turnover increased by 3%, from 4,9% to 5,1%, due to the combined effects of a 15% increase in insurance premiums, 5% increase in retained losses, 10% increase in the cost of managing risk and lower-than-expected turnover for 2014.
implementation of the Human Factors Management Standards as per the Rail Safety Regulator’s (SANS 3000) requirements.
Energy, waste and environment
environmental impact assessment process to convert the De Aar quarry into an asbestos waste landfill site. During the year an approved asbestos inspection authority was contracted to undertake asbestos air quality assessments at 11 high risk asbestos contaminated sites. Asbestos removal waste licences have been obtained for all major contaminated sites and these sites will be cleared once the De Aar quarry landfill site is approved and operational.
Environmental Management System (EMS) implementation is taking place in operational areas. Three sessions were held in Richards Bay, Vryheid and Nelspruit during the year.
forum which meets every two months. This forum monitors performance and evaluates whether the measures adopted for energy efficiency are effective. The following significant energy efficiency gains for regeneration were recorded in Freight Rail:– Class 19E locomotives working on
the coal line regenerated 27% of energy consumed on a round trip between Ermelo and Richards Bay, resulting in 76 682MWh (14%) energy regeneration in 2014.
– Class 15E locomotives working on the iron ore line regenerated 28% of energy consumed on a round trip from Sishen to Saldanha, resulting in 99 502MWh (24%) energy regeneration.
environmental contribution in the form of carbon emissions reduction in the South African transport sector by gaining market share in a number of commodity groups where there is strong competition with road hauliers. This rail tonnage gain amounts to volumes permanently taken off road.

INTEGRATED REPORT 201472
LOOKING FORWAR D
in order to reduce human error incidents through standardisation of the Train Authorisation and Train Control systems.
that must be automated so as to reduce derailments due to human error.
by applying best practice lessons from benchmarking exercises within the business.
Human Factors Management Standards as per the Rail Safety Regulator’s requirements until April 2016.
intensity and improve energy efficiency.
Building organisational readiness and a high performance cultureGoals and objectives for the 2014 reporting year
the leadership brand archetype.
(EVP) and a brand engagement process; and embed leadership archetypes as part of the change management process, aligned with the Culture Charter and Customer Service Charter. For Freight Rail to become one of the top five in the world, it needs to ensure exceptional customer service delivery, which can only be realised through engaged, empowered and inspired employees.
(ie compliance risk identification, risk assessment, risk management, monitoring and reporting) as defined in the Compliance Framework in Rail Network and the six business units.
professional learning (CPL) and develop critical grades: Train Crew and Train Control. Increase the number of train drivers on the CPL programme as well as the number of employees trained on Lean Six Sigma.
Engineering and Technical Training and Development.
train handling skills.
programmes across the organisation to promote a high performance culture.
Performance against objectives
identified as ‘chief inspirational leaders’, to drive the culture change associated with the leadership brand archetype. The latter included the change management process as part of ‘Inspiring Ways’.
external – were identified to epitomise exemplary leadership behaviours. They were exposed to senior Freight Rail’s leadership to align organisational thinking, a process to be implemented across different levels.
was developed and Human Resource project streams were established. Each ‘stream’ includes project plans that feed into the EVP project and align with the CVP (customer value proposition). The EVP brand engagement process will commence in the new financial year.
the embedding of compliance processes (ie compliance risk identification, risk assessment, risk management, monitoring and reporting) as defined in the Compliance Framework in Rail Network and the six business units. Going forward, the maturity of compliance processes in these areas will be measured against the compliance maturity model. Where regular engagement with Regulators and Government Departments is required for regulatory certainty and operational efficiencies, appropriate mandates and engagement protocols have been established and formalised.
for train drivers resulted in major travel and accommodation savings.
Lean Six Sigma training exceeded the year-to-date target by 44%.
full accreditation status and SGS recommended ISO 9001:2008 – Quality Management System Certification.
ABOUT
FREIGHT RAIL (continued)

73
(Societe Generale de Surveillance SA (SGS) is a Swiss inspection, verification, testing and certification services company which conducts ISO audit inspections and verification audits). The School of Rail (SoR) achieved ISO 9001 certification and partnered with the Universities of Cape Town and Pretoria for engineering development.
target by 0,5%, achieving an enrolment of 2 410 attendees against a target of 2 400.
LOOKING FORWAR D
interventions for the 2015 financial year to realign with projected MDS volume projections.
increased locomotive fleet to harness market opportunities and to continue to grow rail market share. New locomotives are in the procurement phase, however, delivery of substantial locomotive quantities are only expected from 2016 onwards. The locomotive fleet will be the major determinant of capacity and therefore is likely to inhibit volume growth for at least the next two years.
interface closely with customers and implement appropriate operating models to meet their tonnage demands and to improve service delivery.
of resources and improved operational performance – and to manage deviations that cause delays and cancellations – operating plans will be supported by organisational development and performance (ODP); and will be strengthened by logistics integration activities and the National Command Centre (NCC).
developed in the last quarter of 2014. The five pillars of this work include the Shareholder Compact, a high performance culture, service excellence, value-driven cost, and network velocity. The project will be rolled out during 2015 to achieve the targeted EBITDA, capture market share, enhance asset utilisation, improve customer service and empower
people. It will further introduce strategic initiatives identified for PSPs.
governance will be employed to maintain integrated end-to-end business processes and enabling data. The Governance Framework will empower process owners and process operators with up-to-date, readily available standardised and integrated end-to-end processes, with accountabilities, tools, and data and business rules applicable to the process.
Rail’s employee value proposition (EVP) is refocusing and delivering a positive employee experience through six key themes (employee touch points), underpinned by targeted outcomes and emotional value benefits. These benefits include: team work, inspirational leadership, learning and development, understanding of ‘my role’, understanding of ‘my responsibility’, employee engagement, and reward and recognition.
implemented in Freight Rail’s SoR training programmes. The customer service training will be implemented from July 2014 onwards for all levels in the organisation, with an initial focus on key customer service (commercial). Personnel recruitment was identified as one of the key processes that impact the development and employment of colleagues, thus impacting negatively on Freight Rail’s employment brand. To address this and other key dependencies, a Lean Recruitment Project is scheduled to start in May 2014.
Railway track at Orkney

INTEGRATED REPORT 201474
FINANCIAL PER FOR MANCE R EVIEWOperating Division performance
Salient features
Year-ended31 March
2014R million
Year-ended31 March
2013R million
%change
Revenue 34 411 31 797 8,2– General freight 19 619 17 125 14,6– Export coal 8 909 8 610 3,5– Export iron ore 4 961 4 181 18,7– Other 922 1 881 (51,0)Operating expenses (19 987) (18 835) 6,1– Energy costs (4 543) (4 121) 10,2– Maintenance costs (1 370) (1 294) 5,9– Material costs (949) (1 005) (5,6)– Personnel costs (10 732) (9 765) 9,9– Other costs (2 393) (2 650) (9,7)Profit from operations before
depreciation, derecognition, amortisation
and items listed below (EBITDA)
14 424 12 962 11,3
Depreciation, derecognition and amortisation
(6 999) (5 852) 19,6
Profit from operations before items listed below
7 425 7 110 4,4
Impairments and fair value adjustments 103 (62) (266,1)Net finance costs (2 359) (1 978) 19,3Profit before taxation 5 169 5 070 2,0Taxation (1 528) (1 619) (5,6)Profit after taxation 3 641 3 451 5,5Total assets (excluding CWIP) R million 82 452 70 844 16,4Profitability measures
EBITDA margin* % 41,9 40,8 1,2Operating margin** % 21,6 22,4 (0,8)Return on average total assets (excluding CWIP)***
% 9,7 10,8 (1,1)
Asset turnover (excluding CWIP)**** times 0,45 0,48 (6,2)Capital expenditure^ R million 25 115 18 277 37,4Capitalised maintenance expenditure R million 8 155 6 861 18,9Employees
Number of employees (permanent) number 29 225 29 489 (0,9)Revenue per employee Rand 1,18 1,08 9,2
* EBITDA expressed as a percentage of revenue.** Profit from operations before impairment of assets, fair value adjustments, net finance costs and taxation
expressed as a percentage of revenue.*** Profit from operations before impairment of assets, fair value adjustments, net finance costs and taxation
expressed as a percentage of average total assets excluding capital work-in-progress.**** Revenue divided by average total assets excluding capital work-in-progress.^ Capital expenditure (replacement + expansion) excluding borrowing costs, intangible assets and including
capitalised finance leases.
ABOUT
FREIGHT RAIL (continued)

75
Volume performance was negatively affected by the economic slowdown, depressed commodity prices, labour unrest, and inclement weather conditions in the last quarter. Accordingly, volumes for the year increased marginally by 1,3% to 210,4mt (2013: 207,7mt). Despite slower than expected volume growth, revenue for the year increased by 8,2% to R34,4 billion (2013: R31,8 billion). This is mainly attributable to price inflation adjustments and revenue yield strategies focusing on commodities that provide Freight Rail with higher contribution to costs.
Coal volumes decreased to 83,1mt (2013: 84,3mt). The decline in volumes was mainly due to the impact of the economic slowdown, a series of safety incidents, traction power constraints, a slightly longer maintenance shutdown than originally envisaged occasioned by unforeseen events diagnosed during the shutdown as well as a two week power disruption at the Richards Bay Container Terminal in February 2014. These incidents negatively impacted volumes which showed signs of recovery in the second quarter of the year following the maintenance shutdown. Furthermore, planned implementation of the new operating model (project Shongololo), aimed at improving operational efficiencies and volumes railed, was negatively impacted by these incidents and thus the desired results of this project were not realised during the year.
The container and automotive business increased volumes by 25,2% to 13,4mt (2013: 10,7mt), evidencing continued success in growth of market share arising from the road-to-rail modal shift.
Despite volumes lost in the first quarter of the financial year, owing to the breakdown of a bridge in Mozambique, mineral mining and chrome volumes increased by 14,2% to 18,5mt compared to the prior year (2013: 16,2mt). Growth in volumes is mainly attributable to improved operational efficiencies, which illustrates improved customer relations and an emerging service ethic epitomising, the success of the road-to-rail strategy implemented by Freight Rail.
Iron ore and manganese volume performance declined to 62,9mt (2013: 64,3mt), as a result of operational issues at key mines as well as tippler problems at the ports.
Steel and cement volumes increased to 21,4mt (2013: 20,9mt). The marginal increase is mainly due to the slowdown in economic growth that affected demand from customers.
Agriculture and bulk liquids volumes decreased marginally to 11,1mt (2013: 11,3mt). Strategies to further reposition the value proposition of this business are continuing, the fruits of which will only begin to emerge during the latter part of the next financial year.
Net operating expenses increased by 6,1% to R20,0 billion (2013: R18,8 billion). This was driven largely by an increase of 9,9% in personnel costs; a 10,5% increase in electricity costs; an increase in fuel costs of 10,0% due to sharp increases in crude oil prices; and a deterioration in the Rand/US Dollar exchange rate. These above inflation increases were offset by cost reductions in professional fees, travel and accommodation as well as data costs as a result of implemented cost-reduction initiatives amounting to R1,2 billion. This resulted in an increase of 11,3% in EBITDA to R14,4 billion (2013: R13,0 billion).
EBITDA margin improved by 1,1% to 41,9%. The improvement is attributable to growth in revenue of 8,2% whilst year-on-year increase on operating expenses was contained at 6,1%. In view of flat volume performance, attributable to depressed economic environment, Freight Rail implemented cost saving initiatives and reduced discretionary costs in order to improve profitability margins.
Financial gearing improved to 46,5% (2013: 49,8%). The improvement is mainly due to the regearing done in the current financial year.
Despite the increase in revenue year-on-year, asset turnover deteriorated to 0,45 times (2013:0,48 times). This is attributable to the increase in asset base, which grew at a proportion higher than the increase in revenue.
Return on average total assets slightly decreased to 9,7% (2013:10,8%). This performance is attributable to lower than expected increase in profit from operations, whilst the average asset base increased by 16,7%.
In line with an impressive 11,3% increase in EBITDA to R14,4 billion (2013: R13,0 billion), net debt to EBITDA also improved slightly to 2,2 times (2013: 2,4 times). Slight improvement in this ratio is attributable to the increase in EBITDA at a rate slightly higher than the growth in debt.
Cash interest cover increased to 8,8 times (2013: 5,3 times). The improvement is mainly attributable to a 10% increase in cash generated from operations (before working capital movement), and a favourable increase in working capital for the year. This favourable increase arose due to better working capital management and as a result of the 1 064 locomotive deal being concluded before the end of March 2014, resulting in an 84% increase in cash generated from operations after changes in working capital.

INTEGRATED REPORT 2014
MAIN
HEADING (continued)
76
ABOUT
TRANSNET ENGINEERING
Transnet Engineering (Engineering) is the backbone of South Africa’s Railway industry. With nine product-focused businesses, Almost 12 500 staff country-wide, 132 depots, six main factories, and over 150 years of experience in rail, Engineering is ideally positioned to service this vital sector.
BUSINESS OVERVIEW AND BUSINESS MODEL

77
The business operates in the following service areas:
and maintenance of electrical Alternating Current (AC) and Direct Current (DC) diesel locomotives.
freight wagons for various commodities.
maintenance of suburban and mainline passenger rail coaches.
to ports and harbours across the SADC region.
services such as rotating machines, rolling stock equipment, cast components, wheels, tarpaulins, intermodal containers, cleaning and logistic services, as well as port and terminal equipment.
Engineering’s internal structure comprises nine businesses, namely: wagon, locomotive, coach, rolling stock equipment, rotating machines, wheel, auxiliary, port equipment and foundry businesses. The wagon, locomotive, coach and ports businesses are the primary customer-facing entities and revenue generators, while the remaining five operational businesses provide a supportive role within the organisation, with the exception of the auxiliary business, which focuses a substantial portion of its activity directly on serving Freight Rail.
Through its six well equipped, ISO 9001:2008 certified factories and its workforce of almost 12 500 qualified personnel, Engineering extends its railway customer portfolio to Africa and the world. As a result, many of Engineering’s plants have received ‘centres of excellence’ awards and accreditation by original equipment manufacturers (OEMs). Engineering also has more than 100 wagon and locomotive depots for in-service maintenance of rolling stock throughout South Africa.
Engineering continues to explore the African market for opportunities to provide rolling stock to other countries on the continent. Various railways and mining companies such as Vale and Rio Tinto have been engaged as part of the strategy to access this market. Several memoranda of understanding (MOUs) have been signed with regional railways for cooperation, including TransNamib, Botswana Railways, among others.
The business continues to position itself strategically to become an OEM for diesel and electric locomotives. During the year, Engineering adopted a strategy to collaborate with existing OEMs. Locomotives in Africa are supplied by major OEMs such as General Electric (GE) and Electro Motive Diesel (EMD). Accordingly, Engineering has positioned itself as an African base for refurbishing locomotives that were previously supplied by these OEMs.

INTEGRATED REPORT 201478
ABOUT
TRANSNET ENGINEERING (continued)
Engineering is certified as a centre of excellence for the refurbishment of components for these OEMs in the African market. Such components include traction motors and engines. This strategy will position Engineering to become a contact for all refurbishment projects on the continent.
In March 2014, Engineering was awarded a subcontractor share in the country’s sizeable locomotive new-build programme worth approximately R50 billion. The programme is part of Transnet’s long-term MDS, geared towards investing in capital infrastructure to increase volumes and reduce the cost of doing business in South Africa. The contract was awarded to four OEMs to build 1 064 diesel and electric locomotives to be introduced into the existing Freight Rail fleet.
The first batch of 70 locomotives will be assembled in the OEM factories and the remaining batch of 994 locomotives will be assembled at the newly upgraded production lines in Engineering’s Koedoespoort and Durban factories. Local engineers and production supervisors will be up-skilled in preparation for the South African production.
During the year, Engineering continued to strengthen its research and development activities to explore and integrate innovative business practices. This process yielded the following benefits for the business:
of the 350 SCL 18 and 19 automotive wagons at the Uitenhage factory.
crossing system to reduce the number of rail accidents throughout the country. The system is now being piloted in North West and Western Cape where there are high risk sites.
with special tools and equipment in partnership with the Council for Scientific and Industrial Research (CSIR) to enhance Engineering’s scientific capability.
In terms of skills development, Engineering expanded its apprenticeship programme with the support of the Department of Higher Education and Training (DHET),
by increasing the number of apprentices attending its School of Engineering from 2 000 at the beginning of the year to 3 000. R175 million was received from the DHET NSF programme.
Engineering has merged its auxilliary and ports businesses to form one formidable ports business that will expand the footprint of the business into the ports environment. This effectively reduces the number of internal businesses from nine to eight from 1 April 2014.
Engineering’s strategic focus will continue to support the broader goals of the MDS to lower the cost of doing business in South Africa, and specifically, to support Freight Rail in growing volumes and improving its market share. The African market will become increasingly important to Engineering’s revenue stream; as will the Passenger Rail Agency of South Africa (PRASA) through its GO upgrade programme and the anticipated fleet modernisation programme.
The maintenance depots continue to focus on improving operational efficiencies by concentrating on availability and reliability of rolling stock, particularly for the key Freight Rail corridors. Engineering will also continue to support Freight Rail in its strategic objective to become a scheduled railway by ensuring that train delays, cancellations and volumes lost due to traction delays, are minimised. The manufacturing and overhaul activities of the plants are geared to provide Freight Rail with additional capacity through new and refurbished locomotives and wagons.
PER FOR MANCE R EVIEW AND OUTLOOKCore initiatives for the year
with the aim of enhancing skills and operational know how.
improving operational efficiencies by concentrating on availability and reliability of rolling stock.
engineers, technicians and artisans.

79
Overview of key performance indicators
Key performance area and indicator Unit of measure2013
actual2014
target2014
actual 2015
target
Infrastructure and maintenance
Capital expenditure(a) R million 1 315,00 954,00 975,00 1 094,00Planned maintenance R million 309,00 288,00 261,00 254,00Innovation
Research and development cost R million n/a 150,00 79,00 80,00Operational efficiency and productivity
Train cancellations due to traction % – 6,00 4,00 6,00Net volume lost due to traction mt – 7,00 2,60 7,00Traction delays % – 40,00 6,40 40,00Skills development
Practical training 1 and 2 (P1 and P2) headcount n/a 100 147 100Technician training headcount n/a 50 82 100Engineers in training headcount n/a 15 77 50Graduates in training headcount n/a 100 35 40Rural development (youth development) headcount n/a 120 88 120ABET learners headcount n/a 200 149 200Women development headcount n/a 150 42 50Employment equity targets
Total blacks % n/a 75,00 78,70 76,00Total females % n/a 22,00 20,60 35,00Total people with disability % n/a 1,30 1,50 2,00Supervisory development headcount n/a 500,00 430,00 200,00Financial value creation
EBITDA margin % 11,30 14,10 6,60 12,60Operating profit margin % 9,80 12,50 4,80 10,30Gearing % 48,50 33,10 46,96 35,70Net debt to EBITDA times 2,20 1,08 3,27 1,65Return on average total assets % 14,70 19,40 6,40 14,50Asset turnover times 1,50 1,49 1,34 1,41Cash interest cover times 2,30 6,80 2,96 6,50External revenue R million 1 371,00 2 633,00 1 616,00 2 400,00Internal revenue R million 11 692,00 n/a 11 737,00 11 453,00Total revenue R million 13 063,00 n/a 13 353,00 13 853,00Human capital
Training spend % of personnel cost 6,40 6,00 4,20 5,00Employee turnover % 18,90 6,50 6,00 6,00Employee headcount permanent 12 752 12 663 12 428 12 485Revenue per employee R million 1,02 1,10 1,07 1,11Risk, safety, health and environment
Cost of risk % of revenue 2,10 2,30 5,00 5,00DIFR rate 0,76 0,79 0,61 1,00
(a) Excluding capitalised borrowing costs and intangible assets.n/a not applicable.

INTEGRATED REPORT 2014
ABOUT
TR ANSNET ENGINEERING (continued)
80
OPER ATIONAL PER FOR MANCE COMMENTARYCapital planning and executionGoals and objectives for the 2014 reporting year
capital projects in the 2014 financial year in lieu of replacement and maintenance expenditure as well as expansion.
production of the remaining CSR locomotives.
and derailment recoveries.
higher productivity.
Performance against objectives
upgrade and replacement of machinery and equipment, such as the automation of the Rolling Stock Equipment Spring Shop in the Durban factory.
and all machinery commissioned to stimulate job creation for the local community.
was upgraded to make provision for the assembly of the 85 remaining CSR locomotives due for production in Koedoespoort.
to ensure the recovery of sales pricing of full economic costs to fund future capital investment and cost of capital.
for depots and factories to enhance productivity and reduce the risk of injuries.
LOOKING FORWAR D
South Africa’s substantial locomotive build programme, R100 million will be invested in the upgrade of locomotive production lines in Durban and Koedoespoort in preparation for the assembly of 994 of the 1 064 locomotives to be produced by four international OEMs.
an OEM, Engineering will design and build the TransAfrica locomotive, equipped with technical capabilities that will cater for the difficult conditions in the African market.
budgeted at R1,1 billion and total capital expenditure over the coming seven-year period is budged at R6,3 billion.
decrease by 1,8%, from R12,3 billion to R12,1 billion from 2014 to 2015.
the capital budget on replacement and maintenance of the production assets to enhance operational efficiency. The budgeted revenue of R13,9 billion translates into R1,4 billion operating profit for 2015, yielding a return on total assets of 14,5%.
Class 34 locomotive at Koedoespoort

81
Volumes and customer satisfactionGoals and objectives for the 2014 reporting year
improve rolling stock reliability to enhance volume growth and improve customer service.
Performance against objectives
support to Freight Rail through the improvement of traction, train delays, cancellations and volumes lost due to traction delays. The minute delays were reduced by 14% compared to the previous year. In turn, these efforts supported Freight Rail’s strategic imperative to grow volumes and ensure customer-satisfaction.
programme, wheel-failure has been significantly reduced, and the availability and reliability of locomotives and wagons have been significantly improved. The cost of production has also been reduced. The success of the Lean Six Sigma programme can also be attributed to the delivery of the SCL 18 and 19 wagons nearly three months ahead of schedule.
diversify revenue streams, Engineering has identified the African continent as a market for the supply of rolling stock. During the year, customer contracts signed on the continent were valued at R1,1 billion.
LOOKING FORWAR D
will enhance customer interfaces.
reliability of rolling stock.
Operational efficiency and productivityGoals and objectives for the 2014 reporting year
locomotive and wagon failures, thereby increasing rolling stock capacity to move more volumes.
business through Lean Six Sigma.
Performance against objectives
Six Sigma programmes to improve maintenance turnaround time.
further embedded in all Engineering’s businesses.
4,9% to R1,1 million (2013: R1 million).
for production requirements in certain sections of the business.
LOOKING FORWAR D
mentorship programme at all maintenance depots and factory facilities.
seven-year spend of R30 million.
Richards Bay.
wagons build.
Bonginkosi Mnisi, laser cutting at Bay II, Koedoespoort

INTEGRATED REPORT 2014
ABOUT
TR ANSNET ENGINEERING (continued)
82
Human capitalGoals and objectives for the 2014 reporting year
employees to fixed-term contract employees.
perspective, target 76% black employees, with a target of 22% female employees and a target of 1,3% people with disabilities.
Performance against objectives
permanent employees to fixed-term contract employees from 94,4% to 95%.
from the multifunctional utilisation of employees through Outcome Based Modular Learning (OBML).
was achieved and exceeded with 78,7% representation of black employees.
of total personnel, against a target of 22%.
disabilities reached 1,5% against a target of1,3%. The target for the 2015 financial year was increased to 2%.
LOOKING FORWAR D
the Strategic Workforce Plan.
effective resource utilisation.
through training and development, and maintain an engineering and technical skills pipeline.
Regulatory and key stakeholder engagementGoals and objectives for the 2014 reporting year
identified regulatory requirements applicable to Rail Engineering.
each critical regulatory compliance requirement.
Performance against objectives
reviews of legislation applicable to the business.
developed for all major legislation impacting on Engineering’s business.
LOOKING FORWAR D
specific African countries aligned to the Engineering Africa strategy.
level of compliance, and update Control Compliance Plans.
Welding at Bay 20, Koedoespoort

83
Safety, risk and sustainabilityGoals and objectives for the 2014 reporting year
and target a reduced DIFR of 0,76.
address specific trends in the regions and businesses.
Programme.
Hearing Conservation Programmes to address noise-induced hearing loss (NIHL) cases.
to improve productivity.
hydrocarbon pollution control as per the three-year programme.
Bloemfontein, Uitenhage, Salt River, and Germiston in line with new legislation.
as per the anticipated recommended remedial actions.
plant’s efficiency in view of possible upgrades to avoid environmental pollution.
implementation of Climate Change Strategy.
Performance against objectives
Safety
its safety culture for all employees through the effective implementation of the Internal Safety Leagues, as evidenced by the significant reduction in the DIFR from 0,76 in 2013 to 0,61 in the 2014 financial year.
Implementation of the Hearing Conversation Programme where existing efforts are being examined for improvement. These include the ongoing medical surveillance programme and the provision of customised hearing protection devices.
performed for all businesses and non-conformance reports and stop certificates for SHE contraventions were issued where appropriate. The Isometrix SHEQ integrated management system has been developed and will be rolled out in the next financial year.
SHE’ re-induction’ training. All new employees receive mandatory induction training prior to commencing work.
and awareness on hand injuries was conducted for all operational employees.
two fatalities at its factories in this financial year.
Energy, waste and environment
sustainability initiatives such as energy and water efficiency as well as waste management.
(R&D) commenced a fuel cell feasibility study in October 2013 to explore the use of fuel cells in locomotives. The study will be completed by the end of August 2014.
as part of the Freight Rail hydrocarbon pollution programme have been cleaned. Engineering will also develop its own programme to ensure that hydrocabon pollution is well managed at all its sites.
Bloemfontein, Uitenhage, Salt River, and Germiston in line with new legislation were developed and implemented. Recycling initiatives were also rolled out as part of this programme.
sites and these were confirmed through a detailed scientific soil assessment study. Plans based on the recommendations of the study will be developed for implementation in 2015.
plant is currently underway.
(ISO 14001) is currently being implemented as part of the Engineering SHE IMS.

INTEGRATED REPORT 2014
ABOUT
TR ANSNET ENGINEERING (continued)
84
LOOKING FORWAR D
Plant Equipment warehouse in the Koedoespoort factory.
decanting analysis on existing chemicals utilised in the regions.
Impact Assessment process for the development of hazardous landfill sites.
data software for the management information system (MIS) for easy information referencing.
Building organisational readiness and a high performance cultureGoals and objectives for the 2014 reporting year
among supervisory level employees and women.
competencies.
management, and manage non-performance and absenteeism.
100 unskilled young people; giving them skills required in the market.
Performance against objectives
a leadership programme at supervisory level and for women.
technicians in training was increased, especially among young women, to enhance the pool of managers, engineers and artisans in the industry.
recruited as part of the National Skills Programme.
of young people in the rural areas was implemented and 88 youths were trained.
development programme focusing on the improvement of supervisors’ skills in financial management, and managing non-performance and absenteeism. The programme has trained 430 supervisors in this financial year.
LOOKING FORWAR D
competent female managers that can assume future top leadership positions in Engineering.
principles to improve productivity and efficiency.
achieve a Level 1 contribution status.
Mapule Legodi, amature winder taping coils in Koedoespoort

85
FINANCIAL PER FOR MANCE R EVIEWOperating Division performance
Salient features
Year-ended31 March
2014R million
Year-ended31 March
2013R million
%change
Revenue 13 353 13 063 2,2
– Internal 11 737 11 692 0,4
– External 1 616 1 371 17,9
Operating expenses (12 467) (11 589) 7,6
– Energy costs (221) (228) (3,1)
– Maintenance costs (261) (309) (15,5)
– Material costs (6 521) (5 916) 10,2
– Personnel costs (4 708) (4 424) 6,4
– Other costs (756) (712) 6,2
Profit from operations before
depreciation, derecognition, amortisation
and items listed below (EBITDA) 886 1 474 (39,9)
Depreciation, derecognition and amortisation (246) (193) 27,5
Profit from operations before items listed below 640 1 281 (50,0)
Impairments and fair value adjustments 3 (6) (150,0)
Net finance costs (393) (253) 55,3
Profit before taxation 250 1 022 (75,5)
Taxation (79) (290) (72,8)
Profit after taxation 171 732 (76,6)
Total assets (excluding CWIP) R million 10 134 9 820 3,2
Profitability measures
EBITDA margin* % 6,6 11,3 (4,7)
Operating margin** % 4,8 9,8 (5,0)
Return on average total assets (excluding CWIP)*** % 6,4 14,7 (8,3)
Asset turnover (excluding CWIP)**** times 1,34 1,50 (10,8)
Capital expenditure^ R million 975 1 315 (25,9)
Employees
Number of employees (permanent) number 12 428 12 752 (2,5)
Revenue per employee Rand 1,07 1,02 4,9
* EBITDA expressed as a percentage of revenue.** Profit from operations before impairment of assets, fair value adjustments, net finance costs and taxation
expressed as a percentage of revenue.*** Profit from operations before impairment of assets, fair value adjustments, net finance costs and taxation
expressed as a percentage of average total assets excluding capital work-in-progress.**** Revenue divided by average total assets excluding capital work-in-progress.^ Capital expenditure (replacement + expansion) excluding borrowing costs and intangible assets.

INTEGRATED REPORT 2014
ABOUT
TR ANSNET ENGINEERING (continued)
86
Engineering’s revenue increased by 2,2% to R13 353 million from R13 063 million recorded in the prior year. Although revenue generated from Freight Rail sales remained almost constant year on year, Engineering’s continued focus on exploiting opportunities in the African market yielded results as external revenue increased by 17,9% from R1 371 million recorded in 2013 to R1 616 million in 2014, notwithstanding a 23,7% decrease in PRASA sales from R645 million in 2013 to R492 million in 2014.
There was a significant upward pressure on input costs during the year. Labour costs increased largely due to an 8,5% salary increase awarded to the bargaining employees across Transnet. Further, material costs increased by 10% mainly due to the rapid prolonged depreciation of the rand against other major currencies. Adding to Engineering’s
operating costs is its role in supporting the national development objectives as evidenced by R80 million spent on research and development projects and an additional R120 million spent on skills and development training. Despite these costs which increased at a rate far much higher than inflation, net operating expenses increased by only 7,6% during the year, due to effective implementation of cost-containment initiatives.
The combined effect of the input cost increases compounded by pressure on pricing of Engineering’s commodities was a 40,0% decrease in EBITDA from R1 474 million in 2013 to R886 million in 2014.
Looking ahead, Engineering plans to increase revenue from R13,4 billion in 2014 to R13,9 billion in 2015.

87
Read more on page 52 of this report.
Koedoespoort Bay 1: New Class 43 diesel locomotive under construction.

INTEGRATED REPORT 2014
MAIN
HEADING (continued)
88
ABOUT
NATIONAL PORTS AUTHORITY
Transnet National Ports Authority (National Ports Authority) operates as a landlord port authority responsible for ensuring the safe, efficient, effective and economic functioning of the national ports system. Its key business activity is to provide and manage port infrastructure and maritime services. In a broader context, the National Ports Authority promotes market collaboration to influence the development of trade and commerce for the benefit of the national economy and the region.
BUSINESS OVERVIEW AND BUSINESS MODEL

89
The National Ports Authority owns and manages eight commercial ports within South Africa. A ninth port, Port Nolloth, is primarily a fishing port and is utilised by the De Beers Group for mining-related activities. The National Ports Authority’s target market comprises port users, including terminal operators, shipping lines, ship agents, cargo owners; as well as the clearing and forwarding industry.
Port infrastructure and maritime services are provided in five market segments, including containers, dry bulk, liquid bulk, break-bulk and the automotive sector. The major commodities handled at the ports include coal, iron ore, containers, automotive, steel, fruit, ferrochrome, petroleum products and manganese. Growth of these commodities is a function of global demand, logistics infrastructure capacity and supply chain efficiencies, which include port efficiencies.
The National Ports Authority’s business is organised into two key operational areas, namely: port infrastructure and maritime operations. The port infrastructure segment is responsible for the integrated planning, development and maintenance of port infrastructure. These activities are executed through port development framework plans and capital investment and maintenance programmes.
The maritime business manages marine operations, lighthouse services, dredging services and navigational services. Marine operations encompass pilotage, towage
and vessel berthing services, whereas the dredging component is responsible for the maintenance dredging and hydro graphic survey of all ports. The latter entails the dredging of approximately four million metres cubed material every year to ensure ports are dredged to set requirements for the safe passage and navigation of vessels.
The lighthouse and navigational services component ensures that aids to navigation, such as lighthouses and navigational systems, are optimally managed. Currently 45 lighthouses span the South African coastline.
National Ports Authority offers a combination of complementary port facilities and services. Each port has its natural geographic territory with defined markets informing the nature and scope of services, facilities and the types of cargo handled at each port. The business model of the organisation are premised on the Ports Act and the functions of a landlord Port Authority. The core functions of the National Ports Authority, in terms of section 11 of the Ports Act, are as follows:
port infrastructure;
services;
including the management of port activities and the port regulatory function at all South African ports; and

INTEGRATED REPORT 201490
ABOUT
NATIONAL PORTS AUTHORITY (continued)
navigation of vessels within port limits and along the coast.
In addition to the above, the Ports Act promotes the development of trade through market collaboration and influence for the economic benefit of the country and the region. In line with this mandate, the Ports Act therefore serves to augment the role of the National Ports Authority in the economy by partnering with all customers and stakeholders including the Ports Regulator. A key role of the Ports Regulator is to regulate port tariffs in a manner that seeks to promote the sustainability and growth of the economy and the organisation. The Ports Regulator also assumes the role of market facilitator on contentious matters relating to customers.
The National Ports Authority has adopted a three-tier strategy which aims to create port infrastructure capacity ahead of demand, improve the efficiency of the port
system and enhance the position of ports as integrated gateways for trade.
PER FOR MANCE R EVIEW AND OUTLOOKCore initiatives for the year
operations performance standards.
Management System.
application of the PLP process.
fleet maintenance programme.
dredging programme for safe navigation of vessels.
strategy.
environmentally friendly port system.
Containers being loaded and unloaded at Durban Container Terminal

91
Overview of key performance indicators
Key performance area and indicator Unit of measure2013
actual2014
target2014
actual 2015
target
Infrastructure and maintenance
Capital expenditure (R million)(a) R million 1 698 2 554 1 188 2 369
Volume growth
Containers (‘000 TEUs) ‘000 TEUs 4 403 4 611 4 641 4 844
Break-bulk (million tons) million tons 8,90 10,70 8,72 9,97
Liquid bulk (million kilolitres) million kilolitres 41,80 42,20 39,28 36,28
Dry bulk (million tons) million tons 154,60 169,40 159,46 166,97
Vehicles (units) units 667 266 592 543 692 287 667 333
Productivity
Anchorage waiting time
– Durban average hours 61,00 46,00 57,00 40,00
– Cape Town average hours 53,00 35,00 35,00 34,00
– Port Elizabeth average hours 56,00 84,00 25,00 30,00
– Ngqura average hours 44,00 32,00 49,00 45,00
– Richards Bay average hours 71,00 30,00 57,00 80,00
Average ship turnaround time
– Durban containers STAT hour 53,00 59,00 58,00 57,00
– Cape Town containers STAT hour 44,00 30,00 29,00 30,00
– Port Elizabeth containers STAT hour 31,00 26,00 26,00 26,00
– East London containers STAT hour n/a 60,00 52,00 60,00
– Richards Bay containers STAT hour n/a 110,00 70,00 109,00
– Ngqura containers STAT hour 51,00 29,00 44,00 45,00
Dry bulk
– Coal (RBCT) hours n/a 47,00 45,00 46,00
– Iron ore (Saldanha) hours n/a 55,00 47,00 54,00
– Manganese (PE) hours n/a 69,00 73,00 78,00
Berth occupancy
– Durban % n/a 85,00 78,00 70-80
– Cape Town % n/a 70,00 67,00 60-70
– Port Elizabeth % n/a 50,00 55,00 55-65
– Ngqura % n/a 75,00 68,00 70-80
(a) Capital expenditure excludes capitalised borrowing costs and intangible assets.n/a not applicable.

INTEGRATED REPORT 201492
ABOUT
NATIONAL PORTS AUTHORITY (continued)
Key performance area and indicator Unit of measure2013
actual2014
target2014
actual 2015
target
Berth utilisation (%)
– Durban % n/a 80,00 76,00 70-80
– Cape Town % n/a 70,00 62,00 50-60
– Port Elizabeth % n/a 60,00 51,00 55-65
– Ngqura % n/a 75,00 70,00 75-85
– East London % n/a 40,00 31,00 n/a
– Richards Bay % n/a 40,00 73,00 n/a
Human capital
Training spend (% of personnel cost) % of personnel cost 6,00 8,00 8,30 6,90
Employee turnover (%) % 4,90 0,70 4,55 3,00
Employee headcount (permanent) permanent 3 584 4 409 3 823 4 210
Revenue per employee (R million) R million 2,33 2,50 2,59 2,80
Financial value creation
EBITDA margin (%) % 67,10 68,20 67,36 70,93
Operating profit margin (%) % 51,90 56,15 53,70 57,52
Gearing (%) % 43,20 32,60 38,21 32,07
Net debt to EBITDA (times) times 3,70 2,20 2,84 2,04
Return on average total assets (%) % 6,90 10,21 7,97 10,40
Asset turnover (times) times 0,13 0,18 0,15 0,18
Cash interest cover (times) times 3,90 4,00 4,64 4,72
Risk, safety, health and environment
Cost of risk (% of revenue) % of revenue 2,50 2,40 2,20 3,00
DIFR rate 0,25 0,71 0,17 0,66
n/a not applicable.

93
OPER ATIONAL PER FOR MANCE COMMENTARYCapital planning and executionGoals and objectives for the 2014 reporting year
budget and maintenance plans for the financial year 2014. Budgeted capital expenditure for 2014 is R2,554 billion.
Plan (NPP) and key port development action plans and strategies.
planning of ports with rail, road and other logistic partners; as well as customers and stakeholders in the total supply chain to enable optimal infrastructure solutions.
project plans for infrastructure projects at all ports.
initiatives, such as asset inspections. Complete RUL reports for all ports by March 2014. Complete training for RUL Phase 2 by March 2014.
Project Lifecycle Methodology (PLP) for infrastructure capital project management to enhance project quality, cost adherence and timely delivery.
and project plans for marine fleets for all ports.
according to planned programmes for all ports.
Performance against objectives
to implement the seven-year capital investment programme of R43 billion. Capital expenditure for the year amounted to R1,2 billion against a budget of R2,6 billion.
further support port plans. The ports of Saldanha, Mossel Bay and Cape Town signed memoranda of understanding (MOUs). Port planners are ensuring joint planning on all strategic integrated projects (SIPs) at provincial, city, and government sessions.
remained on track. Actual maintenance, excluding dredging for 2014, was R292,3 million against a budget of R348 million. Dredging for 2014 was R184,2 million against a budget of R253,7 million. The new grab dredger – to be acquired in June 2014 – will increase capacity.
remaining useful life (RUL) of wet assets for all ports. RUL training was not completed during the year and will be conducted internally by Group Capital. Transnet’s lifting of the moratorium on training will assist the process going forward.
achieved for the year was 2 670 600m3. The new grab dredger to be acquired in June 2014 will assist in increasing capacity and improving output going forward.
launched during the year to enhance critical internal processes, including procurement cycle times.
LOOKING FORWAR D
The following mega projects are targeted for cash flow in 2015 – most span more than two years – and are in different phases of implementation and delivery.
at the Port of Ngqura.
walls at Maydon Wharf at the Port of Durban.
Terminal berths.
Port of East London.
Mooring System in the Port of Ngqura.
at the Tanker Basin at the Port of Cape Town.
for coal at the Port of Richards Bay.
various ports.
construction at the Port of Saldanha.

INTEGRATED REPORT 2014
ABOUT
NATIONAL PORTS AUTHORITY (continued)
94
Future initiatives include the following:
Framework Plans (PDFPs) with the Freight Demand Model (FDM).
model. Complete the first round of RUL inspections and finalise the methodology. Ensure reliable port infrastructure and record keeping.
approved programme.
trailing suction hopper dredger, with construction due to commence in 2014.
and deliver two tugs in 2014.
maintenance dredging, as per the dredging programme.
service (VTS) asset management programme. Develop the associated business case and asset management plan.
and conclude lease agreements with preferred bidders.
Volumes and customer satisfactionGoals and objectives for the 2014 reporting year
follows:– Containers: 4 611 000 TEUs.– Dry bulk: 169 362 000 tons.– Liquid bulk: 42 202 000 kilo litres.– Break-bulk: 10 731 000 tons.– Automotive: 592 543 units.
optimisation programme.
oil majors, aligned with one-year issued licences. Target rental income of R49,2 million.
development and request for proposal (RFP) processes to create commercial and revenue capacity; and track RFP processes for key terminals.
implementing a customer survey action plan to improve the satisfaction index. Improve by 10% in all areas.
strategies and sector-defined value propositions.
key account plans for main revenue customers.
Performance against objectives
with an improvement of 0,65% above target; however the transshipments were below target. Container volumes reached 4 641 000 TEUs against a target of 4 611 000 TEUs.
by 5,84% mainly due to a series of incidents affecting the Richards Bay coal line. These included Freight Rail’s various derailments culminating in significantly reduced coal volumes and a nine-day power failure at Richards Bay Container Terminal (RBCT) in the beginning of the year, which crippled the coal industry. Further, iron ore performed below target as a result of an ore shortage from the mines and further mechanical challenges experienced at the terminal. Dry bulk volumes reached 159 464 000 tons against a target of 169 362 000 tons.
by maintenance shutdowns at the refineries resulting in mainly domestic requirements being serviced, and import and export trade being marginally compromised. Liquid bulk volumes reached 39 278 000 kilo litres against a target of 42 202 000 kilo litres.
below target following on from the previous financial trend, with most commodities being migrated to containerisation. Break bulk volumes reached 8 715 000 tons against a target of 10 731 000 tons.
by 16,83% with clear indications of increased productivity as OEMs ramped up capacity to meet awarded contracts along with high domestic requirements from rental companies and government departments. Automotive volumes reached 692 287 units against a target of 592 543 units.

95
commercialisation opportunities were identified, mainly in Maydon Wharf and Island View precincts, and negotiations are currently underway with tenants. Port vacancies were advertised in all the ports and are 50% filled, with the balance in process.
updated. A lease management regime framework was developed; and a leasing strategy was completed, together with precinct plans and draft land-use plans.
tracked during the year and the most recent outcomes reflect as follows:– The Cape Town RFP is going through a
clarification process with two bidders.– The RFP for Ngqura Container
Terminal was suspended by the DoT and details of the process were requested for follow-up together with a list of bidders.
– The Ngqura Manganese Terminal project is dependent on the acquisition of land from Coega Development Corporation (CDC). Negotiations are currently underway. The Group Chief Executive has approved negotiations for a 99-year lease with CDC. The RFP will be finalised once the land acquisition is concluded.
favourable scores were achieved on all dimensions relating to operations and service; infrastructure and capacity; customer relations; business alignment; and knowledge and skills.
during the year and implementation is ongoing. The plan was shared with internal stakeholders for alignment and input. The plan was aligned with new business development initiatives and, accordingly, shared with Exco and the port manager. Currently, National Ports Authority is in the process of splitting sector-specific responsibilities amongst regional marketing managers to improve role allocation. Key account management plans are in place and are constantly reviewed and updated regularly.
LOOKING FORWAR D
customer engagement efforts by
prioritising productive activity to grow and retain profitable customer relationships. The SAP CRM system is due to be fully rolled out in September 2014 and will enable National Ports Authority to support its customers in an efficient and professional manner.
effective supply chain solutions and will identify new commercial opportunities within the value chains of different industries.
Ports Act will be applied for Ngqura Manganese Terminal (NMT). National Ports Authority will negotiate and finalise the NMT Terminal Operator Agreement and utilisation of Coega Development Corporation land as a stockpile area.
to roll out a five-year marketing communication plan and to monitor and evaluate market impact.
Operational efficiency and productivity Goals and objectives for the 2014 reporting year
pursuit of operational excellence.
Standards Framework to improve marine and terminal performance including vessel turnaround times.
senior oversight of compliance and ports performance, including SHEQ performance.
alignment.
monitor and track compliance to set operational targets with strong focus on achieving minimal or no delays.
measure port system capacity and efficiency processes to ensure effective and efficient operations.
assist with terminal collaboration and performance oversight.

INTEGRATED REPORT 2014
ABOUT
NATIONAL PORTS AUTHORITY (continued)
96
Performance against objectives
year at different time horizons to embed Port System operations. These include: – Twice-daily performance conferences
(mornings and evenings) to assess daily port performance among the ports.
– Weekly business review sessions, attended by port managers across the ports, to reflect on the previous week and to plan for the week ahead.
– Monthly Exco meetings with port managers hosted by the COO and attended by port managers and their teams; these Exco meetings precede the OPCO and focus on port business management in general.
and tactical implementation is underway. A key strategic driver is the quest for operational excellence, with key initiatives, including the implementation of the port operational centres (POCs).
introduced as a mechanism for preventing and managing risks leading to workplace safety incidents, including disabling injury accidents. VFL relies on workplace observation and behavioural correction by managers and leadership. During the year, a total of 3 406 VFL inspections were conducted across the ports. The DIFR reflected a company-wide decrease of 74%, from 0,66 in 2012 to 0,17 in 2014.
Framework was developed and gave expression to the Terminal Operations Performance Standards (TOPS), which have been completed and are currently being introduced into operations. Quarterly performance reviews have commenced.
covered by the framework and are due to be completed in Quarter 3 of 2015, including:– Marine Operations Performance
Standards (MOPS).– Rail Operations Performance
Standards (ROPS).– Road Haulers Operations
Performance Standards (HOPS).
operations managers, were introduced at the ports to exercise port performance oversight; and to ensure that performance standards and stipulations of operating licence agreements are adhered to. The Precincts Strategy was implemented in Durban, dividing the Port of Durban into five precincts and allocating oversight responsibilities to precinct managers (senior operations managers). Oversight teams include safety and health representatives under the leadership of port managers to monitor SHEQ performance across the ports.
introduced to align and integrate port capacity planning with customer service priorities. The initiative was started in quarter 1 of 2014 and is ongoing, enabling the ports to better position themselves to respond to customer needs. Customers already engaged include Transnet Port Terminals, Bidvest, Grinrod, MOL, Maersk and MSC.
each licensed terminal operator to outline design capacity, installed and operating capacity.– Performance achievements: Tugs: 1,08
actual versus 1,3 target; Pilots: 0,93 actual versus 1,3 target; Berthing: 1,3 actual versus 1 target.
– Operational Centres – port implementation plans are in place. Execution currently underway for installation of civil, electrical and IT systems. Durban has been identified as a pilot port with go-live planned for June/July 2014.
LOOKING FORWAR D
Operations Performance Standards (MOPS).
Terminal Operator Performance Standards (TOPS).
of capacity simulation and terminal operational oversight reviews.

97
Human capitalGoals and objectives for the 2014 reporting year
perspective, target representation of black employees at 76%; and a target of 2% people with disabilities.
skills development and employment equity pillars.
planning to increase capacity to deliver on capital expenditure commitments.
Performance against objectives
81% black employee representation against a target of 76%. The target of 2% for people with disabilities was also achieved.
3% target.
labour engagements by conducting all meetings as indicated in the Recognition Agreement. Overall, 66% of the meetings were held.
development and employment equity pillars for B-BBEE proved challenging. The targets for black PWDs was 3%; however, only 1,4% was achieved. The employment of black females with disabilities at 0,5% also fell short of the target of 1,5%. The overall score for the skills development pillar fell short of the targeted 16 points, although the score improved to 13,55 points.
as the target for a 90-day recruitment turnaround time was achieved with an average turnaround time of 87 days.
business needs have been developed and incorporated in budgets.
LOOKING FORWAR D
Authority will target the following improvements:– Double the pipeline for critical skills,
which is currently at 168 (primarily Marine and Engineering skills), with a target of 300.
– Improve the B-BBEE score by training and recruiting more black females and people with disabilities.
– Reduce absenteeism to 2,5%.– Improve communication and training
for the job evaluation process, strategic workforce planning, performance management and recognition programmes.
following plans and programmes:– Talent management action plans
and associated talent management programmes aimed at employee levels E-F.
– On-boarding and induction programmes.
– A leadership development programme for employee levels C-F.
– Culture Charter and related programmes.
– Training programmes for change management and continuous improvement.
– Implement learnership engagement programmes.
Melvin Pillay, an electrician at Port of Richards Bay

INTEGRATED REPORT 2014
ABOUT
NATIONAL PORTS AUTHORITY (continued)
98
Regulatory and key stakeholder engagementGoals and objectives for the 2014 reporting year
direction and support to terminal operators, tenants, stevedoring, and all other port users on all National Ports Authority’s sites to achieve compliance with the requirements of the National Ports Act in terms of the licences and agreements. This includes compliance oversight audits in conjunction with the licensing teams, as well as security, facilities, maintenance, and terminal performance teams within port operations.
Licences and all activity-based licences, which consist of port activities relating to stevedoring, waste disposal, and diving.
Application for the 2015 financial year to the Ports Regulator.
Pricing Strategy and submit to the Ports Regulator for approval.
Plan (LUP) for all ports.
critical stakeholders in the system.
database.
(DDOP) stakeholder mapping process.
Centre; Isipingo recreational and waterfront concept; and the Durban BAT centre precinct.
resources and ensure ongoing progress monitoring.
Performance against objectives
activity-based licences are audited on an annual basis commencing on 1 April and ending on 31 March. The first cycle of comprehensive audits was performed, enabling National Ports Authority to establish a baseline for findings. A few activity-based licences were not audited for reasons
such as companies’ discontinuation of port operations or challenges in scheduling audits with a licencee. Overall, 262 audits were performed nationally, completing 100% of terminal audits, 89% of diving audits, 93% of waste removal audits and 90% of stevedore audits.
Ports Authority submitted its tariff application to the Ports Regulator for approval, requesting required revenues of R10 493 million (to fund its capital and operating expenditure), which translated into an average tariff increase of 8,5%. The target was set to ensure this objective was achieved before the start of the new financial year.
made a determination on the tariff application allowing National Ports Authority to recover revenues of R10 674 million, thereby successfully completing this objective within the target framework.
pricing strategy were submitted to the Ports Regulator for approval. Stakeholder consultation was completed by the Ports Regulator. This culminated in the Ports Regulator issuing an Interim Regulatory Manual as a guideline for the preparation of the tariff application for 2015. The objective to finalise the tariff methodology and pricing strategy will be carried forward into the new financial year.
the compliance plan) have been created and updated.
completed.
comprising African Port Authorities, SADC chambers. Critical stakeholders have been mapped in the system.
been completed and is being updated continuously.
stakeholder mapping process has been completed, along with FEL1 engagement. FEL2 engagement plans are in progress.

99
DDOP Youth Centre have been finalised and are awaiting approval. The Isipingo recreational and waterfront concept has been developed and presented to City stakeholders. The Durban BAT centre precinct is progressing well.
An external consulting company is assisting with SD and B-BBEE progress monitoring.
LOOKING FORWAR D
by the end of April 2014. Results of audits will be followed up so that non-conformances are closed out. Non-conformances will be analysed to identify trends, thereby enabling National Ports Authority to highlight focus areas to be proactively managed.
a graduated and strategic risk-based approach to compliance and enforcement in the future. This approach recognises that breaches of the rules and standards established by the National Ports Act will be effectively and efficiently addressed. It also recognises the roles of both co-regulation, as set out in the legislation it administers; and of engaging with the regulated community to promote voluntary compliance.
and beyond, will be the preparation of a multi-year tariff application for submission to the Ports Regulator. Submission will be targeted for end-August 2014.
finalisation of the tariff methodology and pricing strategy for the end of the 2015 financial year.
intends to achieve the following imperatives:– Fostering industry compliance with,
and contribution to, the regulatory framework without imposing undue financial or administrative burdens.
– Encouraging a compliance culture within the ports system and adherence to regulatory obligations.
– Promoting a port system that is respectful of industry standards and
diligent in responding to community concerns.
– Creating regulatory certainty and ensuring compliance with regulations and policy.
– Performing licence oversight audits for safety health and environment (SHE), as well as security and maintenance; monitoring and managing compliance with licence conditions for terminal operators and other port service providers.
– Implementing baseline rating systems for all audits.
– Enhancing port performance in terms of the international ship and port facility security code (ISPS).
Safety, risk and sustainabilityGoals and objectives for the 2014 reporting year
by ensuring a reduced DIFR rating, supported by visible felt leadership (VFL) and behavioural improvement programmes, such as safety leagues (PSL, GSL, ISL).
Implement a proactive environmental plan, focusing on the following: – The Air Quality Management
Programme, prioritising the development of an emission inventory.
– A marine water monitoring project.– The management of biodiversity,
ballast water, and estuarine, sensitive areas.
– Implementing ISO 14001 management systems.
– Waste management.– Introducing a sustainability reporting
programme.
Performance against objectives
achieved. Internal safety leagues have been implemented. League rankings are issued monthly and safety league performance is included in monthly reports. Continuous assistance is provided to teams and a bonus points evaluation committee has been instituted to empower teams. VFL has been implemented at all ports and is ongoing.

INTEGRATED REPORT 2014
ABOUT
NATIONAL PORTS AUTHORITY (continued)
100
have been completed.
Quality Management Programme was implemented and emissions inventories were developed and updated with findings from the associated air quality screening and monitoring process.
for all ports have been completed and recommendations will be reviewed for implementation.
in the drafting of the Ballast Water Act. Numerous ports already have ballast water management plans. Durban Port implemented an estuarine management plan. All ports have programmes to control alien plant removal.
certification during the year.
strategies and plans in place. During the year, waste management plans were further refined and contamination levels were assessed for most identified sites. Numerous sites recycled oil and paper.
assessments (EIAs) have been documented and applications for environmental authorisation were lodged with the Department of Environmental Affairs (DEA) and tracked through regular progress meetings.
LOOKING FORWAR D
programme to improve risk governance and reporting.
opportunity management.
assurance model.
of 3.
insurance claims across all portfolios.
improve to a rating of 0,49 by 2021.
league and encourage visible leadership.
module at all ports. Assess National Ports Authority health environment and trends for corrective actions.
Phase 2 of climate change impact assessments for port infrastructure with action plans.
seasons’ monitoring. Evaluate results and develop a marine water report.
Plans (AQMP). Install real-time air quality monitoring station in ports.
investment (CSI) – new South Durban Basin, Port of Mossel Bay, 10 schools in KwaZulu-Natal and North West.
New tugs at the Port of Durban

101
Building organisational readiness and a high performance cultureGoals and objectives for the 2014 reporting year
system to serve as an integrated IT platform and provide service to all port users. Implement the system in three ports during the year.
Management system; and provide appropriate training.
System (MIS), Business Intelligence (BI) and LIVE Office. Ensure close-out and post-implementation review of MIS and LIVE office.
for integrated customer relations management. Implement the SAP CRM RDS and contact centre solution.
management methodology.
requirements. Perform a diagnosis of training underspend. Complete 100% of all qualifications on LSO.
development; and update personal qualifications for a credible and accurate competency database. Ensure 100% user training to improve recruitment turnaround. Focus on targeted selection (i.e. at least 75% of hiring managers trained on targeted selection).
Performance against objectives
system (IPMS) blueprint was completed for all ports as per the project plan, with a few weeks delay on sign-off.
integrated with the Transnet Group system implementation.
MIS and BI reporting protocols and dashboards.
11 March 2014 and a service provider was appointed. The contract for the contact centre with SCM governance is still due
to be vetted. The delay in formalising the site for Port Operations’ head office has delayed the installation of the contact centre.
trained 57% people with disabilities (PWDs) against a target of 75%. Overall, 53 positions were allocated to graduates-in-training (GITs) against a target of 50.
initiative, ‘Technogirl’, enabled 200 of an initial target of 100 female learners to receive workplace exposure.
methodology was introduced for employee levels A – D, with the business achieving 96% training success against its 90% training target. A talent conference was held for this group.
into training programmes in February 2014. All have passed module 1 exams, with 10 helicopter pilots passing their CPLs and six engineering trainees progressing well with in-service training.
are complete.
LOOKING FORWAR D
integrated port management system (IPMS).
contact centre and CRM system.
associated bursary programmes.

INTEGRATED REPORT 2014102
FINANCIAL PER FOR MANCE R EVIEWOperating Division performance
Salient features
Year-ended31 March
2014R million
Year-ended31 March
2013R million
%change
Revenue 9 917 8 328 19,1– Containers 3 475 3 319 4,7 – Break-bulk 265 250 6,0 – Dry bulk 902 820 10,0 – Liquid bulk 603 588 2,6 – Automotive 578 517 11,8 – Other 4 094 2 834 44,5Operating expenses (3 237) (2 742) 18,1 – Energy costs (399) (353) 13,0 – Maintenance costs (296) (276) 7,2– Material costs (85) (75) 13,3 – Personnel costs (1 767) (1 472) 20,0 – Other costs (690) (566) 21,9 Profit from operations before
depreciation, derecognition, amortisation
and items listed below (EBITDA) 6 680 5 586 19,6 Depreciation, derecognition and amortisation (1 354) (1 266) 7,0 Profit from operations before items listed below 5 326 4 320 23,3Impairments and fair value adjustments 446 108 313,0 Net finance costs (1 521) (1 723) (11,7)Profit before taxation 4 251 2 705 57,2Taxation (1 086) (779) 39,4Profit after taxation 3 165 1 926 64,3Total assets (excluding CWIP) R million 70 068 63 681 10,0Profitability measures
EBITDA margin* % 67,4 67,1 0,3Operating margin** % 53,7 51,9 1,8Return on average total assets (excluding CWIP)*** % 8,0 6,9 1,1Asset turnover (excluding CWIP)**** times 0,15 0,13 15,4Capital expenditure^ R million 1 188 1 698 (30,0)Employees
Number of employees (permanent) number 3 823 3 584 6,7Revenue per employee Rand 2,59 2,32 11,6
* EBITDA expressed as a percentage of revenue.** Profit from operations before impairment of assets, fair value adjustments, net finance costs and taxation
expressed as a percentage of revenue.*** Profit from operations before impairment of assets, fair value adjustments, net finance costs and taxation
expressed as a percentage of average total assets excluding capital work-in-progress.**** Revenue divided by average total assets excluding capital work-in-progress.^ Capital expenditure (replacement + expansion) excluding borrowing costs and intangible assets.
ABOUT
NATIONAL PORTS AUTHORITY (continued)

103
Revenue increased by 19,1% to R9,9 billion (2013: R8,3 billion). This increase is mainly attributable to an improvement in volume growth in the following categories:
4 641 203 TEUs (2013: 4 403 358 TEUs).
159 464 133 tons (2013: 154 644 955 tons).
692 287 units (2013: 667 266 units).
Net operating expenses increased by 18,1% to R3,2 billion (2013: R2,7 billion), mainly as a result of a 34,0% increase in training costs. The increase in training costs by R0,03 billion is due to the introduction of training in the areas of aircraft maintenance, aircraft avionics, helicopter pilot training, and cadet training.
Energy costs increased by 13,0% to R0,40 billion (2013: R0,35 billion). The cost increase was mainly due to electricity tariff and fuel price increases.
Total labour costs increased by 20,0% to R1,77 billion (2012: R1,47 billion). This increase includes the performance bonus payout.
Direct salaries showed an increase of 12% to R0,85 billion (2013: R0,76 billion). This can be attributed to an 8,5% salary increase and permanent headcount increase of 4,0%.
Other operating costs increased by 21,9% to R0,7 billion (2013: R0,6 billion). The R0,17 billion variance can be largely attributed to rates and taxes.
Accordingly, EBITDA increased by 19,6% to R6,7 billion (2013: R5,6 billion).
National Ports Authority anticipates an increase in revenue of R1,8 billion for 2015; and operating expenses and EBITDA are expected to increase by R0,2 billion and R1,7 billion respectively in the same period.
GM Mokoena and Sanele Sithole, cargo coordinators with the car loading vessel in the background

INTEGRATED REPORT 2014
MAIN
HEADING (continued)
104
ABOUT
PORT TERMINALS
With more than 90% of the world’s trade (in volume) being seaborne and approximately 98% of South Africa’s exports being conveyed by sea, the country’s commercial ports and terminals play a strategic role in facilitating trade and economic growth in the Southern African region.
Port Terminals plays an integral role in the logistics chain by providing cargo handling, storage and warehousing services to a wide range of shipping lines, freight forwarders and cargo owners. Operations are divided into four major business segments, namely Containers, Bulk, Break-Bulk and Automotive. Port Terminals manages 16 cargo terminal facilities across seven South African ports with a total staff complement of more than 6 500 employees.
BUSINESS OVERVIEW AND BUSINESS MODEL

105
The South African Government has embarked on a significant infrastructure drive to boost the economy and to alleviate poverty. As part of the MDS, Port Terminals will invest R37,2 billion over the next seven years to maintain and create new terminal capacity, ensuring that its terminals can facilitate projected demand.
The container sector will see the largest expansion, with capacity increasing by 41% from 5,6 million twenty-foot equivalent units (TEUs) in 2014 to 7,9 million TEUs per annum in 2021. The bulk sector will increase its capacity from 93 million tons per annum in 2014 to 99 million tons in 2021, while break-bulk capacity will increase from 15,6 million tons per annum in 2014 to 16,6 million tons in 2021. Automotive capacity will increase by 25% from 787 000 fully built units (FBUs) in 2014 to 987 000 FBUs in 2021.
The fleet of ship-to-shore (STS) cranes in the container sector is planned to increase from 43 cranes in 2014 to 64 cranes in 2021. The number of straddle carriers will increase from 159 to 202; and there will be an increase in the number of Rubber Tyred Gantries (RTGs), from 72 to 140. In the bulk sector, the number of tipplers will increase from six to nine and the number of shiploaders/unloaders will increase from 19 to 21.
Port Terminals’ role in the MDS is as follows:
with the NGP and NDP, with particular emphasis on capacity expansion.
through the continuous improvement of operational efficiencies.
infrastructure and equipment to facilitate growth, taking cognisance of supplier development and skills transfer strategies.
in the rest of the world by operating terminals and offering operational, technical and systems advice.
new markets.
South Africa and Southern Africa’s ports and the interconnectivity between ports and rail.
maintenance strategy to ensure equipment reliability.
systems.

INTEGRATED REPORT 2014106
ABOUT
PORT TERMINALS (continued)
PER FOR MANCE R EVIEW AND OUTLOOKOverview of 2014 performanceContainer volumes increased by 6,3% to 4 503 425 TEUs (2013: 4 236 685 TEUs). There was a 2,0% increase in automotive volumes to 687 799 units (2013: 674 231 units) and a 3,4% increase in bulk and break-bulk volumes to 88,2mt (2013: 85,3mt).
Port Terminals’ primary measure of container efficiency, average moves per gross crane hour’ (GCH) across all terminals remained fairly stable overall compared to the previous year. The Cape Town Container Terminal improved its GCH from 31 in the prior year to 34 in the current year. Durban Pier 1 improved its GCH marginally from 23 to 24. The Durban Pier 2 GCH decreased from 28 to 25 due to problems experienced with the operational system, inclement weather conditions and teething problems relating
to the introduction of the new tandem lift cranes. The Ngqura Container Terminal GCH decreased from 32 to 26 due to capacity constraints relating to landside equipment.
The Dry Bulk Terminal at Richards Bay improved its loading rate to 752 tons per hour from 729 tons per hour in the prior year. The loading rate at the Saldanha Iron Ore Terminal increased by 3,3% from 7 899 to 8 157 tons per hour.
Revenue increased by 15,0% to R8,5 billion (2013: R7,4 billion). Net operating expenses increased by 11,9% to R6,1 billion (2013: R5,4 billion) mainly due to increased personnel costs, energy costs and the increase in land rental and associated rates and taxes.
As a result of the above, EBITDA increased by 23,2% to R2,5 billion (2013: R2,0 billion).
Hebron Mbuyisa, machine operator and Mirriam Mthiyane, cargo coordinator

107
OVERVIEW OF KEY PER FOR MANCE INDICATORSOperational performance commentary
Key performance area and indicator Unit of measure2013
actual2014
target2014
actual 2015
target
Infrastructure and maintenance
Capital expenditure(a) R million 2 208,00 1 859,00 1 651,00 1 908,86
Volume growth
Containers ‘000 TEUs 4 237 4 600 4 503 4 888
Break-bulk mt 9,70 10,40 11,16 14,52
Bulk mt 75,60 84,80 77,06 81,89
Vehicles units 674 231 593 064 687 799 662 274
Operational efficiency and productivity
Container dwell time
DCT – Pier 1
Imports days 3,00 3,00 2,74 3,00
Exports days n/a 5,00 4,94 5,00
Transshipment days n/a 10,00 6,26 10,00
DCT – Pier 2
Imports days n/a 3,00 1,86 3,00
Exports days n/a 5,00 5,42 5,00
Transshipment days n/a 10,00 8,00 10,00
CTCT
Imports days n/a 3,00 2,16 3,00
Exports days n/a 5,00 4,87 5,00
Transshipment days n/a 15,00 7,59 15,00
Moves per gross crane hour
DCT – Pier 1 number 23,00 28,00 24,00 26,00
DCT – Pier 2 (prime berths – 108, 203 and 204) number 28,00 30,00 25,00 28,00
CTCT number 31,00 32,00 34,00 32,00
PE number 27,00 27,00 24,00 25,00
Ngqura number 32,00 32,00 26,00 30,00
Container moves per ship working hour
DCT – Pier 1 number 43,00 53,00 46,00 45,00
DCT – Pier 2 number 62,00 68,00 59,00 62,00
CTCT number 55,00 55,00 48,00 52,00
PE number 40,00 45,00 39,00 43,00
Ngqura number 54,00 55,00 47,00 51,00

INTEGRATED REPORT 2014108
ABOUT
PORT TERMINALS (continued)
Key performance area and indicator Unit of measure2013
actual2014
target2014
actual 2015
target
Train turnaround time
DCT – Pier 1 hours n/a 6,00 3,40 6,00
DCT – Pier 2 hours n/a 6,00 4,60 6,00
CTCT hours n/a 6,00 1,70 6,00
Saldanha*** minutes n/a 105,00 104,00 105,00
Richards Bay* hours n/a 12,00 9,00 12,00
Port Elizabeth hours n/a 12,00 10,30 12,00
Truck turnaround time
DCT – Pier 1 minutes 47,00 35,00 44,30 35,00
DCT – Pier 2 minutes 32,00 35,00 38,00 35,00
CTCT minutes 21,00 35,00 19,80 35,00
NCT minutes 33,00 35,00 35,40 35,00
RB MPT (Bulk) minutes 26,00 35,00 21,20 35,00
Loading rate (per hour)
Saldanha Iron Ore Terminal tons 7 899,00 8 094,00 8 157,00 8 094,00
RB DBT – Loading tons 729,00 700,00 752,00 730,00
RB DBT – Offloading tons 502,00 500,00 478,00 500,00
Human capital
Training spend % of personnel costs 2,20 3,10 3,40 2,80
Employee turnover % 4,80 4,70 3,17 5,00
Employee headcount permanent 6 662 7 269 6 624 8 340
Revenue per employee (permanent) R million 1,11 1,20 1,29 1,19
Tariff increases
Average tariff increase** % n/a 6,00 4,60 tba
Financial value creation
EBITDA margin (%) % 26,89 31,00 28,81 30,19
Operating profit margin (%) % 7,81 11,60 10,45 12,33
Gearing (%) % 37,40 42,00 36,73 32,05
Net debt to EBITDA (times) times 2,34 2,41 2,09 1,50
Return on average total assets (%) % 4,40 5,76 5,35 8,00
Asset turnover (times) times 0,52 0,45 0,50 0,65
Cash interest cover (times) times 7,30 4,80 2,60 7,96
Risk, safety, health and environment
Cost of risk (% of revenue) % of revenue 3,15 3,30 3,05 3,30
DIFR rate 0,45 0,78 0,53 0,76
(a) Capital expenditure excludes capitalised borrowing costs, and intangible assets.* Based on 50 wagon trains.** Container sector. CPI based on BER.*** Rake process time inside tippler – Subject to service design review. TPT shall report on moves/GCH for the Ports of Richards Bay and East London on a quarterly basis.n/a not applicable.

109
OPER ATIONAL PER FOR MANCE COMMENTARYCapital planning and executionGoals and objectives for the 2014 reporting year
was budgeted for expansion (R790 million) and maintenance (R1 069 million) projects. The projects included the acquisition of cranes, RTGs, straddle carriers, shiploaders, surfacing projects and improving employee facilities.
Performance against objectives
year amounted to R1 651 million. Key infrastructure developments in this period include: – Acquisition of 18 RTGs to support four
additional STS cranes at the Ngqura Container Terminal.
– Acquisition of seven tandem lift cranes at Durban’s Pier 2 Container Terminal, capable of servicing the latest generation vessels, with a span of 24 containers across the deck. These cranes have the ability to lift 2 x 40 foot or 4 x 20 foot containers in tandem mode.
– Replacement of 13 straddle carriers at Durban’s Pier 2 Container Terminal with the latest diesel-electric technology for improved efficiency and lower running costs.
– Acquisition of a shiploader and unloader at the Richards Bay Terminal to support the business strategy to increase capacity from 18mtpa to 26,6mtpa over the next seven years.
– Upgrade of the Berth 108 staff facility at Durban’s Pier 2 Container Terminal to cater for additional employees.
– Completion of Saldanha Phase 1C expansion project to increase capacity to 60mtpa.
LOOKING FORWAR D
R37,2 billion into port infrastructure over the next seven years from 2015 to 2021.
fleet size and terminal infrastructure, the planned expansionary projects include:– The Richards Bay expansion project,
which is necessary to create capacity and improve efficiencies at the terminal.
– The Durban Pier 1 Phase 2 (also known as the Salisbury Island project) expansion project will increase the terminal’s capacity by 1 320 000 TEUs, from 680 000 TEUs per annum in 2014 to 2 000 000 TEUs per annum in 2022.
– Berth 205 at Durban Pier 2 will be expanded with the objective of increasing the terminal’s capacity by 400 000 TEUs.
– The Ngqura Container Terminal will be expanded from 1 500 000 TEUs per annum to 1 850 000 TEUs per annum. This project is necessary to ensure that the terminal is able to capture the transshipment demand.
– The Saldanha iron ore terminal will be expanded from 60mtpa to 72mtpa in 2020.
– The Cape Town Container Terminal will be expanded from 1 000 000 TEUs per annum to 1 300 000 TEUs per annum.
– Capacity will be expanded in the automotive sector in Durban. This investment will increase the capacity of the Durban Car Terminal by 160 000 units, from 520 000 units to 680 000 units per annum.

INTEGRATED REPORT 2014
ABOUT
PORT TERMINALS (continued)
110
Volumes and customer satisfactionGoals and objectives for the 2014 reporting year
unconstrained demand for logistics services in Southern Africa.
by engaging customers to utilise Ngqura Container Terminal as a transshipment hub.
additional capacity creation and increased volumes.
agreements (eg, ‘take or pay’ contracts) for certain sectors.
Performance against objectives
Containers
a year-on-year growth of 6,3% on the previous year, volumes were 2,1% below budget with imports, exports and transshipments at 2,9%, 1,7% and 1,5% respectively. The year was particularly challenging for the container sector due to unfavourable global and local market conditions. Further, the weakening Rand facilitated the export market.
was unfavourable compared to budget, as shipping lines changed their shipping routes to direct calls to reduce their operating costs. The loss of the West Africa transshipments from a key customer at the Ngqura Container Terminal significantly impacted transshipment volumes.
impacted by teething problems associated with the newly purchased tandem lift cranes, as well as the berth 108 outage, due to scour protection by the National Ports Authority. Further challenges included delays due to repairs to safety critical areas, such as stack and pavement rehabilitation; as well as the mid-life refurbishment of the Liebherr cranes at Pier 2, which commenced in quarter 4 of 2014; and the loss of a feeder service to Mozambique.
volumes faltered in May with delays in berthing vessels resulting from difficulties with the Navis post-upgrade system. The injection of the West Africa volumes into Ngqura Container Terminal in the first half of the financial year resulted in volumes exceeding the terminal’s capacity, leading to berthing delays, particularly for feeder vessels.
Bulk
reflecting a growth of 1,9% on the previous year, volumes ended the financial year at 9,2% below budget with imports being 1,5% above budget and exports 10,2% below budget. Industrial unrest in the mining sector was a contributing factor to lower mineral bulk products.
not materialise due to customer-related cash flow challenges.
partly due to supply challenges at the mines as well as a slowdown in demand as a result of the economic recession. Eskom outages impacted volumes in the first quarter; and volumes in the Saldanha Iron Ore and Port Elizabeth Manganese terminals were adversely impacted by a slow recovery after the planned maintenance shutdown.
volumes at Port Elizabeth was compensated for by 450 000 tons moving through Port Elizabeth Multi-Purpose Terminal (MPT) via a skip operation.
budget due to lower demand.
Bulk Terminals were 7,6% above budget due to an increase in demand.
Break-bulk
of 15,1% on the previous year. Volumes performed at 7,2% above budget with imports at 18,4% above budget and exports at 3,8% above budget.
contributed positively to the break-bulk volumes. The import of windmills in Saldanha MPT and Project cargo at Durban MPT also had a positive impact on break bulk volumes. A manganese

111
skip operation was started successfully at Saldanha MPT in February 2014, with 90 000 tons handled in the last two months of the 2014 financial year.
Automotive
growth of 2% on the previous year despite two strikes in the year.
budget with imports and exports being 18,3% and 14,6% above budget respectively, while transshipment volumes were 30% below budget.
recovery in quarter 4 of 2014 following the re-tooling closure of a key customer and another customer’s cut in production due to lower local demand and increased global competition for distribution.
LOOKING FORWAR D
a new export channel with 560 000 tons budgeted for the 2015 financial period, which will help boost the Port Elizabeth container volumes and revenues.
Container Terminal poses a challenge in achieving the 2015 budget. Discussions with the customer are in progress to regain these volumes or secure additional alternative transshipment volumes.
stable. Manganese volumes in Port Elizabeth will be constrained due to increased customer allocation; however, Port Terminals is creating capacity at the Saldanha MPT to handle manganese via skip and skiptainer operations for future years.
volumes for the new financial year by securing a national cement contract for key customers. Warehousing space constraints posed a challenge for the storage of this commodity during the year. Accordingly, back of port operations are being investigated to mitigate this risk.
Ro-Ro terminal are impacting further growth in this sector. Growth in the auto sector is expected to slow down in 2015 due to the current economic climate. In 2017 volumes are expected to
be adversely impacted by a customer’s planned shutdown for re-tooling and upgrades to the plant.
market share are primary business imperatives for the year ahead in line with achieving the MDS objectives. The business has been structured towards high level performance efficiencies to improve customer satisfaction, which will in turn support anticipated economic growth.
through the use of technology to ensure that information is available for faster decision-making, thereby further enhancing service offerings.
coordination project, a decision has been taken to develop joint operation centres (JOCs) in key commodity flow locations such as Durban, Richards Bay, Saldanha and Port Elizabeth. The JOCs will provide supply chain logistics visibility to all customers, thereby decreasing lead time from pit to port.
planning centre, with particular focus on the container sector, will ensure that South African ports continue to be attractive to all shipping lines. Port Terminals intends to promote and facilitate efficient cargo movement, thereby enabling shipping lines to save more with slow steaming and more predictable berthing schedules, resulting in decreased demurrage costs.
fully fledged transshipment unit in 2015. A focused approach is required to provide a synchronised service to this specialised market segment. With transshipment volumes growing by 16,6% between 2012 and 2014, Port Terminals will continue to play a significant role in the repositioning of goods across the African continent and the world at large in support of the Global Strategy.
land utilisation, and deploy advanced technology and equipment in operations in order to increase capacity across all terminals. This will be a key focus area to ensure that capacity is created ahead of demand.

INTEGRATED REPORT 2014
ABOUT
PORT TERMINALS (continued)
112
Operational efficiency and productivityGoals and objectives for the 2014 reporting year
targets for all terminals.
Durban Pier 2 and 32 moves per hour in Ngqura and Cape Town.
terminals, particularly in Richards Bay.
improve efficiencies.
across business segments to improve productivity.
to below 35 minutes for container terminals.
Performance against objectives
below the targets at all terminals during the year.
achieved the desired GCH at Durban’s Pier 2 Container Terminal (DCT Pier 2) due to a variety of teething issues, including electronic and mechanical problems.
consistently below target at all terminals.
and current norms are consistently above the targeted 8 094 tons per hour mark.
(1) at DCT Pier 2 impacted the terminal’s ability to operate effectively. Additional resources have been employed and are currently being trained. On completion of training, the terminal will be able to operate 13 cranes simultaneously.
container terminals was 32,4 minutes.
LOOKING FORWAR D
whereby a ‘pre-advise’ alert will be sent to the trucking company by way of an electronic data interchange short message system (EDI-SMS) to pick up a container as soon as it becomes available. This is expected to reduce dwell time.
on site at DCT Pier 2 to resolve the electronic and mechanical problems so that the tandem lift mode can be utilised.
the norm of 32 moves per hour at the Cape Town Container Terminal with the addition of two new cranes in July 2014.
to improve at the Ngqura Container Terminal when the four additional STS cranes become fully operational in June 2014.
to 51 in 2015 and up to 55 in 2021.
improve the train turnaround times at DCT Pier 2.
expected to keep train turnaround times at 10 hours.
expected to improve significantly due to the following:– The capital expenditure of
R100 million, which has been set aside to restore the plant.
– New quayside equipment (ship-loader and unloader) which were commissioned in 2013.
be maintained below the industry norm of 35 minutes. The implementation of a mandatory truck booking system in Durban and a new staging area for Pier 1 is expected to contribute towards the optimum turnaround of trucks.
1 A ‘gang’ is a team of people who operate a crane and all its supporting equipment, including operational processes.

113
Human capitalGoals and objectives for the 2014 reporting year
employees.
card rating.
perspective, target 35% female employees and target of 2% people with disabilities.
employees at 76%.
is protected.
resources.
recruitment service by improving recruitment turnaround times.
relationships with the aim to build harmonious relationships and decrease industrial action.
Employee Care initiative.
Transformation Unit to change the culture of operations by realigning employees’ vision with the strategic intent and values of the organisation.
Transformation project (such as ‘mission directed work teams’).
Performance against objectives
6 624 permanent employees while revenue increased by 15,0%.
of Level 3 with 84,88 points, marginally less than the Level 2 rating of 85 points.
the workforce.
of the workforce.
were exceeded with black employees representing 81,7% of the total workforce.
plans for critical skills for 3,7% of employees, against the target of 4,7%.
succession plans for important resources during the year.
measures the implementation of gangs(1)’ recruitment and training according to plan, is currently at 84 days and within the target of 90 days.
developed in May 2013. The benefits of this initiative include improving employee morale; positioning Port Terminals as an ‘employer of choice’; and creating financial awareness amongst employees. The project is expected to take two to three years, depending on construction at the various sites and comprises three pillars:– Infrastructure development (staff
facilities). – Employee Assistance Programme
(financial management services). – Value-added services to employees
(eg staff uniforms).
Employee Care Strategy will be implemented in two phases. Terminals will pursue ‘FEL1’ and ‘FEL2’ of the national strategy while Port Terminals’ Capital Projects department will pursue ‘FEL3’ and ‘FEL4’ of the strategy.
LOOKING FORWAR D
initiatives for each B-BBEE pillar to reach a level 2 rating.
its implementation of the National Employee Care project in 2015 and 2016.
Care Project, targeted for June 2014, aims to deliver inspirational initiatives to promote high levels of interest, enthusiasm and professional pride among employees (including family members) in terms of their association with Port Terminals.
implement a Change Management Strategy in 2015.

INTEGRATED REPORT 2014
ABOUT
PORT TERMINALS (continued)
114
Regulatory and key stakeholder engagementGoals and objectives for the 2014 reporting year
and control self-assessments (CSAs) across the business.
a bid to operate the Ngqura Container Terminal, as well as the Manganese Terminal in the Port of Ngqura.
employees, the relevant government departments, customers and the local communities where Port Terminals operate.
Performance against objectives
Control Framework for the National Ports Act 12 of 2005, the enabling legislation promulgating the parameters within which the terminals operate. The Critical Control Framework and the control self-assessments have been rolled out across the business and aids as a control to ensure compliance with the National Ports Act and the Terminal Operator Licences issued to Port Terminals. Port Terminals was issued with a satisfactory report by Transnet Group Internal Control. Compliance Audits have been conducted internally and by Port Terminals, which further confirmed a satisfactory compliance status.
19 Terminal Operator Licences with effect from 1 July 2012, except for the Ngqura Container Terminal Operator
Licence, which was issued to Port Terminals pursuant to the section 79 directive issued by the Minister of Transport. Port Terminals is to operate the Port of Ngqura for a limited period of three years, with effect from 3 October 2012 subject to the National Ports Authority resuming a competitive process for the licensing of the Port of Ngqura in accordance with section 56 of the National Ports Act.
employee engagements through the National Business Forum and Regional Business Forums (engaging the Bargaining Units).
with the Department of Public Enterprises in agreeing the Shareholder’s Compact targets.
with the local communities as and when required (eg community engagement regarding air emissions in Saldanha).
LOOKING FORWAR D
gear itself towards a bid to operate the Ngqura Container Terminal as a transshipment hub within Port Terminals’ group of complementary container terminals, as well as preparing for the bid to operate the manganese terminal in the Port of Ngqura.
platform to raise and track actions with key stakeholders.

115
Safety, risk and sustainabilityGoals and objectives for the 2014 reporting year
promote a safety mindset.
reduce the number and cost of incidents.
revenue.
rate (DIFR) to below 0,78.
to the previous year for both diesel and electricity usage.
Performance against objectives
Safety
revenue was 3,1% against a target of 3,3%.
a target of 0,78. The management of employee health continues to remain a focal point facilitated through the onsite terminal clinics undertaking annual medicals.
by NOSA and the results this year indicated a renewed safety effort. Out of 16 audits, seven obtained a five-star status and nine terminals were rated at a four-star. The average percentage score of the audits increased marginally, from 89,24% in 2013 to 89,72% in 2014.
ISO 9001 and OHSAS 18001 certified.
Energy, waste and environment
were met.
due to a number of variables. These include increased volumes and cross haulage earlier in the year and longer travel time for equipment as a result of the outage of berth 108 at DCT Pier 2 in the latter part of the year. These variables will be reviewed in the 2015 financial year.
LOOKING FORWAR D
rating in the NOSA audits of 2015.
will focus on aligning activities to revised environmental legislation and ensuring the Integrated Safety, Health, Environment and Quality/Railway Safety (SHEQ/RS) Management System remains compliant with international best practice.
interaction will be explored further in the year ahead giving rise to more inclusive decisions. Compliance with air emissions licence requirements remains a strategic focus for the year ahead; and enhanced monitoring of dust emissions from port terminal activities will ensure negative environmental impacts are minimised.
management and recycling will be fully implemented in 2015 leading to cost reduction, and ensuring sustainable activities. Terminals where housekeeping requires attention will be prioritised to ensure handling practices meet environmental standards.
towards minimising audit findings relating to its Energy Management process and build a solid foundation for the ISO 50001 Energy Management System, planned for future implementation.
energy reduction, replacement of old lighting technology and reduced energy costs.

INTEGRATED REPORT 2014
ABOUT
PORT TERMINALS (continued)
116
Building organisational readiness and a high performance cultureGoals and objectives for the 2014 reporting year
procurement, enterprise development and socio-economic development.
3,1% of total labour costs.
budget of R4,7 million for 2014.
Development Programme.
workplace experience.
‘Technogirls’ job-shadowing programme.
people with disabilities.
to electronic format (e-Performance system).
opportunities for port equipment.
Performance against objectives
preferential procurement, enterprise development and socio-economic development.
training spend of 3,1% of total labour costs. This included the training of 805 operators of lifting equipment (OLEs) in sector-specific skills and 111 cargo coordinators.
R6,5 million exceeded the 2014 target.
as per the Artisan Agreement.
exceeded the target, achieving an overall intake of 222 learners (engineers-in-training, apprentices and technicians-in-training), including 20 graduates-in-training. Port Terminals
also exceeded its targets for learnerships and workplace experience with the enrolment of 122 unemployed youth on various learning programmes and learnerships.
in the job-shadowing programme.
participated in the learnership and graduate-in-training programmes.
at Port Terminals received a qualified balanced scorecard residing in the e-Performance system, with all final year performance assessments being conducted electronically.
Department of Trade and Industry (DTI) to investigate sustainable localisation opportunities for the fabrication of port equipment.
LOOKING FORWAR D
enhance skills ahead of demand by offering technical, operational and leadership skills programmes. To support capital expansion and maintenance plans, Port Terminals will enhance technical skills by training 70% of artisans; implement an accelerated artisan development programme; as well as roll out the Government Certificate of Compliance (GCC) programme.
local service delivery partners, such as the Maritime School of Excellence, as well as international partners such as APEC, Navis and the International Labour Organisation (ILO). The development of women will receive renewed focus through an additional R5 million training spend on special programmes.
on-the-job training will be enhanced through the re-licensing of operators, as required every two years. All terminal

117
executive managers will undergo the Advanced Operations and Productivity Management programme. Customer excellence training, Six Sigma skills and Lean principles courses will also be offered.
following strategic goals in the 2015 financial year:– Proactively pursue initiatives geared
to support the replacement of retiring employees in critical positions.
– Accelerate the development of technical and operations skills.
– Implement retention initiatives for critical skills.
– Introduce a formal mentorship programme for critical skills.
– Embed the utilisation of newly implemented automated systems (e-performance and recruitment).
– Promote Port Terminals as an employer of choice.
– Embed workforce planning at Port Terminals.
– Cascade and entrench the newly introduced balanced scorecard methodology among all management cadre.
– Train and prepare supervisory employees to utilise the automated system.
– Equip managers to handle and address poor performance.
– Refine existing incentive schemes to align with productivity targets.
Equipment operation at the Cape Town Container Terminal

INTEGRATED REPORT 2014118
FINANCIAL PER FOR MANCE R EVIEWOperating Division performance
Salient features
Year-ended31 March
2014R million
Year-ended31 March
2013R million
%change
Revenue 8 535 7 424 15,0– Containers 4 449 4 003 11,2– Bulk 2 666 2 345 13,7– Break-bulk 876 614 42,7– Automotive 544 462 17,7Operating expenses (6 076) (5 428) 11,9– Energy costs (520) (439) 18,4– Maintenance costs (306) (282) 8,4– Material costs (358) (350) 2,3– Personnel costs (3 124) (2 714) 15,1– Other costs (1 768) (1 643) 7,6Profit from operations before
depreciation, derecognition, amortisation
and items listed below (EBITDA) 2 459 1 996 23,2Depreciation, derecognition and amortisation (1 566) (1 416) 10,6Profit from operations before items listed below 893 580 54,0Impairments and fair value adjustments (216) (20) 980,3Net finance costs (443) (342) 29,6Profit before taxation 234 218 7,3Taxation (95) (91) 4,4Profit after taxation 139 127 9,4Total assets (excluding CWIP) R million 17 070 16 261 5,0Profitability measures
EBITDA margin* % 28,8 26,9 1,9Operating margin** % 10,5 7,8 2,6Return on average total assets (excluding CWIP)*** % 5,4 4,1 1,3Asset turnover (excluding CWIP)**** times 0,51 0,46 12,2Capital expenditure^1 R million 1 651 2 208 (25,2)Employees
Number of employees (permanent) number 6 624 6 662 (0,6)Revenue per employee Rand 1,3 1,1 15,6
* EBITDA expressed as a percentage of revenue.** Profit from operations before impairment of assets, fair value adjustments, net finance costs and taxation
expressed as a percentage of revenue.*** Profit from operations before impairment of assets, fair value adjustments, net finance costs and taxation
expressed as a percentage of average total assets excluding capital work-in-progress.**** Revenue divided by average total assets excluding capital work-in-progress.^ Capital expenditure (replacement + expansion) excluding borrowing costs, intangible assets and including
capitalised decommissioning liabilities.1 Capital expenditure excludes savings of R222 million, R30 million optimisation and prior year accelerated
spend of R134 million.
ABOUT
PORT TERMINALS (continued)

119
The 2014 financial year reflected a positive revenue performance, growing 15% compared to the previous year.
Operating expenses grew by 11,9% year-on-year. The primary cost drivers were as follows:
driven by higher volumes as well as increases in fuel and electricity prices of 21% and 12% respectively.
increased by 5,1% due to unforeseen equipment breakdowns.
due to wage increases, incentives and increase in training costs.
by 7,6%. This was primarily due to the 15,6% increase in land rental from the National Ports Authority. This was mitigated by savings attributable to aggressive cost saving measures targeting discretionary spend and tight cost reduction measures to mitigate the adverse impact of the abovementioned cost drivers.
The EBITDA margin was 28,8%, which is an increase from the previous year’s margin of 26,9%.
Return on total average assets (ROTA) is currently at 5,4%. This is a significant increase on the previous year (2013: 4,1%)
due to a combination of a higher operating profit and lower capitalisations in the current year.
Revenue growth of 15% exceeded that of the asset base of 4%, indicating more efficient utilisation of the existing asset base.
Revenue per employee improved from R1,1 million in 2013 to R1,3 million in 2014. Headcount decreased by 0,6% while revenue increased by 15,0%. This drop in headcount was as a result of the austerity measures limiting recruitment to critical skills and operational employees only.
Port Terminals set out to realise a cost savings target of R153 million through the development of achievable cost saving initiatives. This was achieved through regular tracking and monitoring to ensure effective financial management.
Port Terminals anticipates an increase in revenue of R1,4 billion for 2015; and operating expenses and EBITDA are expected to increase by R0,9 billion and R0,5 billion respectively in the same period. While this is a significant challenge, Port Terminals is committed to utilising its skills base to grow the business by attracting additional volumes.
New quay walls at Cape Town Container Terminal

INTEGRATED REPORT 2014
MAIN
HEADING (continued)
120
ABOUT
PIPELINES
Pipelines manages, operates and maintains 3 800 kilometres of high pressure petroleum and gas pipeline infrastructure, traversing five provinces. This infrastructure includes depots, pump stations, workshops, a tank farm and a refractionator.
Pipelines plays a pivotal role in the logistics supply chain by ensuring the safe and efficient supply of petroleum products from coastal refineries and crude oil imports to the inland market. In providing an efficient, environmentally sensitive and reliable medium of supply, Pipelines contributes to lowering the overall cost of doing business in South Africa.
BUSINESS OVERVIEW AND BUSINESS MODEL

121
Pipelines’ client base comprises Shell, BP, Engen, Sasol, Chevron, Total, PetroSA, AfricOil, Khulaco, GTL Petroleum and Vuyo Petroleum. Products currently transported include unleaded petrol, diesel, jet fuel, crude oil and methane-rich gas. Feasibility studies are currently under the way to assess the compatibility of biofuels with other pipeline products.
Over-border deliveries to Botswana through Freight Rail and road transportation account for 78% of product handled at Tarlton. The refractionator ensures that intermixture (interface) volumes are processed into petrol and diesel. The completion of the coastal and inland terminals will conclude Phase 1 of the New Multi-product Pipeline (NMPP), thereby enabling multi-product transportation in the trunk-line. Following the completion of Phase 1, the decommissioning of the Durban-Johannesburg Pipeline (DJP) will commence. Methane-rich gas is transmitted from Secunda to KwaZulu-Natal for use by industries along the route.
In support of Transnet’s role in driving economic growth in South Africa through its Market Demand Strategy (MDS), Pipelines’ value proposition will continue to promote an integrated pipeline and rail service, providing an end-to-end, reliable, efficient and cost-effective service for oil companies.
Pipelines will facilitate the Clean Fuels 2 (CF2) requirements in July 2017 and commence preparation for CF3 requirements. Depending on market growth, Phase 2 of the NMPP estimated for implementation in 2021 has the
potential to increase capacity from 1 000m3 to 1 400m3 per hour.
Looking ahead, Pipelines intends to establish an African footprint by offering technical, operational consultancy and training services to other pipeline companies in the SADC region including Kenya. Pipelines will explore the immediate business opportunities identified in Zambia, Mozambique and Botswana. The strategic expansion of services into the continent supports the South African Government’s objective of regional integration for African cooperation and development.
PER FOR MANCE R EVIEW AND OUTLOOKCore initiatives for the year
Tarlton.
clients.
of fuel in pipeline.
successfully increase of the headcount to 732 employees.
three routes with Freight Rail.
with clients.
maintaining the DJP whilst the NMPP nears completion and successfully operate the NMPP as a full multi-products pipeline.
the TPL School of Excellence.

INTEGRATED REPORT 2014122
ABOUT
Pipelines (continued)
Overview of key performance indicators
Key performance area and indicatorUnit
of measure2013
actual2014
target2014
actual2015
target
Infrastructure and maintenance
Capital expenditure(a) R million 2 799,00 3 268,00 3 377,00 1 865
Actual versus planned maintenance % n/a n/a n/a 90
Production interruptions number n/a n/a n/a 438
Volume growth
Total petroleum products Mℓ 15 882 16 750 16 583 16 665
Refined Mℓ 10 432 10 812 10 659 11 118
Crude Mℓ 4 237 4 901 4 807 4 510
Avtur Mℓ 1 005 1 037 1 117 1 037
Gas million m3 472 561 491 446
Storage Mℓ 857 879 771 837
Operational efficiency and productivity
Capacity utilisation (actual usage: capacity)
DJP and NMPP Mℓ/week n/a n/a n/a 105:168
NMPP Mℓ/week 51:84 48:84 51:84 n/a
DJP Mℓ/week 66:82 56:68 59:68 n/a
Crude Mℓ/week 80:134 94:134 92:134 87:134
Avtur Mℓ/week 17:24 20:24 20:24 20:24
Gas (actual usage: capacity) million m3/month 39:57 39:57 41:57 37:57
Tank turns times 33 31 27 30
Operating cost per Mℓ.km R/Mℓ.km 89,0 122,0 99,3 129,0
Electricity efficiency kWh per Mℓ.km 29,0 29,0 27,80 35,70
Service delivery
‘Off spec’ volumes (litres per billion litres delivered)
litres per billion litres delivered 541 288 500 000 708 089 450 000
Number ‘off spec’ delivery events per thousand dockets 0,08 0,53 0,29 0,14
Ordered versus delivered volume % 100 95 99 95
Planned versus actual delivery time % 77 80 82 83
Human capital
Training spend % of personnel cost 11,50 8,60 4,93 5,90
Employee headcount number 627,00 732,00 621,00 761
Employment equity % of black employees 83,00 83,00 84,00 83
Female employees % of headcount 30,00 30,00 33,00 32
People with disabilities % of headcount 2,80 3,00 2,97 3
Employee turnover % 6,60 6,00 7,55 5
Absenteeism index % 1,96 1,70 1,67 1,65

123
Key performance area and indicatorUnit
of measure2013
actual2014
target2014
actual2015
target
Financial value creation
EBITDA margin (%) % 76,50 71,60 74,77 68,14
Gearing % 44,80 50,50 47,45 48,31
Operating profit margin % 57,20 51,50 54,25 45,64
Net debt to EBITDA times 4,20 5,53 4,97 6,34
Return on average total assets % 8,26 6,60 8,60 6,33
Asset turnover times 0,15 0,10 0,16 0,14
Cash interest cover times 3,71 1,70 2,17 1,50
Risk, safety, health and environment
Cost of risk % of revenue 2,50 3,00 3,27 3,33
Number of petroleum spillages per 1 609km of pipeline number 17,00 22,00 16,00 16,05
Number of storage spillages per billion litres of storage capacity number 587,00 498,00 1 174,00 571,43
Number of gas leaks number Zero Zero Zero Zero
DIFR rate 0,81 0,85 0,39 0,75
Number of level 1 non-compliance incidents to operating licence per year number Zero Zero Zero Zero
Procurement
B-BBEE level – 3 4 3
(a) Capital expenditure excludes capitalised borrowing costs, intangible assets and includes decommissioning liabilities.n/a not applicable.– not available.
Equipment operation (Alrode manifold)

INTEGRATED REPORT 2014
ABOUT
PIPELINES (continued)
124
OPER ATIONAL PER FOR MANCE COMMENTARYCapital planning and executionGoals and objectives for the 2014 reporting year
Committee’s focus on monitoring progress against schedules and budgets. Target 91% completion of Terminal 1 (coastal terminal) and 90% completion for Terminal 2 (inland terminal) on the NMPP project.
security and fire upgrade projects.
at R3 268 million.
Performance against objectives
the NMPP – such as inclement weather, strike action, as well as poor project execution and contract management – Terminal 1 (coastal terminal) achieved 83% completion against a target of 91% completion; and Terminal 2 (inland terminal) is 79% complete against a target of 90%. The preliminary ability to operate date for Terminal 2 is October 2014 and April 2015 for Terminal 1. Terminal 1 dates are dependent on the results of all the hydrotesting of the tanks.
National Key Point compliance and improve security at all depots was divided into five ‘clusters’. Cluster 1, comprising eight sites, was not fully completed in the year. The delays in completing cluster 1 were due to contractor performance, which has since been addressed and every endeavour is being made to complete the project. Pipelines completed the design engineering in the fire upgrade project for the first five priority sites. The next project phase will be to execute work at the first five priority sites and to design the remaining 20 sites. Delays in this project are being addressed.
R3 377 million, compared to a budget of R3 268 million, and is mainly attributed to the overspend on the NMPP project.
LOOKING FORWAR D
within the revised schedule.
Cluster 1 site and the completion of the eight sites in Cluster 2 of the Security Upgrade Project.
sites in the fire upgrade project to commence as well as the design of the remaining 20 sites.
ABOUT
PIPELINES (continued)
Refractor at Tarlton

125
Volumes and customer satisfactionGoals and objectives for the 2014 reporting year
transportation.
products by 3,6%
of crude volumes.
oriented service delivery and customer engagement.
to establish needs and continuity of supply at Tarlton.
Performance against objectives
16 583 billion litres compared to a target of 16 750 billion litres, reflecting a 1% negative deviation. This is, however, an increase of 4,4% compared to the previous year. Refined products increased by 2,2% compared to the previous year, but reflected a negative deviation of 1,4% against budget, due mainly to the slowdown in economic activity and the impact of fuel price increases during the year.
13,5% compared to the previous year, which included a Natref shutdown in October 2012, it was 1,9% below budget.
year, and reflected an improvement of 7,6% against budget, due mainly to the batches delivered from the coast.
81% was achieved which confirms the Company’s commitment to excellent service delivery.
Executive Committee during the year to understand their business strategy and to present an update of the Business’s strategy and progress to date.
delivery was continually enhanced through ongoing monthly customer engagements.
to discuss low volumes at Tarlton and to increase the use of this facility.
LOOKING FORWAR D
transportation.
of above 80%.
clients for petroleum transportation in Transnet.
of products (50ppm and 10ppm).
by June 2014.
Tanker loading at Tarlton

INTEGRATED REPORT 2014
ABOUT
PIPELINES (continued)
126
Operational efficiency and productivityGoals and objectives for the 2014 reporting year
delivery time.ℓ/w combined utilisation of
the DJP and the NMPP.
Mℓ/km compared to target
International Airport (ORTIA) at 20Mℓ/wk.
Performance against objectives
actual delivery time of orders s placed on the pipeline system.
the NMPP was 110Mℓ/w, exceeding the target of 104Mℓ/w
ℓ.km improved by 8,3% compared to target.
ℓ.km improved by 18,9% compared to target.
than target.
LOOKING FORWAR D
DJP and the NMPP by 2,7%.
delivery time of orders by 1,2%.
Human capitalGoals and objectives for the 2014 reporting year
headcount to 732.
of Pipelines and internal courses.
the employment equity targets.
programme.
Performance against objectives
decreased by 1,0%, from 627 employees to 621. The decrease was mainly due
to delays in the recruitment process. Interventions have been implemented to address the recruitment process and to enhance the process.
disabilities was achieved.
the workforce which is an improvement on the 30% target.
were exceeded with black employees representing 84% of the total workforce. An EE Plan has been developed and is in execution which is aligned to NEAP and provincial targets.
at 1,7%.
accredited.
successfully been embedded informally in the business; however the workforce planning tool needs to be embedded throughout the organisation, especially as the business grows.
LOOKING FORWAR D
761 employees.
of personnel costs.
and regularly monitor compliance thereto.
attendance system.
transformation projects.
compliance and efficiency.
tool within the business.
which includes the women development programme as well as programmes to upskill people living with disabilities and the youth.
manage change effectively.
ABOUT
PIPELINES (continued)

127
Regulatory and key stakeholder engagement
conditions.
with DPE and DoE.
of Environmental Affairs, and Water Affairs.
Performance against objectivesNERSA approved an allowable revenue increase of 5,08% for the 2015 financial year, which was lower than the Pipelines application. The difference is mainly attributable to the revised commissioning dates for the terminals. The tariff increase is in accordance with NERSA’s tariff methodology.
NERSA licence conditions.
tariff was applied as per the multi-year gas and storage tariff applications approved by NERSA.
DPE and DoE were held during the year.
of Environmental Affairs and Water Affairs to ensure compliance to legal requirements.
Plan (AQMP) was developed thereafter based on the findings of the study. Actions from the AQMP are in the process of being implemented.
LOOKING FORWAR D
conditions.
Reporting Manuals and NERSA approved tariff methodologies in the filing of Tariff Applications.
NERSA and customers on the proposed penalties to be phased in to change customer behaviour and create more certainty on long-term demand.
universe to facilitate commercial opportunities.
contracted to undertake air quality monitoring, emissions inventory and dispersion modelling at nine depots for the 2015 period.
The XP type wagon being loaded with fuel

INTEGRATED REPORT 2014
ABOUT
PIPELINES (continued)
128
Safety, risk and sustainabilityGoals and objectives for the 2014 reporting year
NOSA rating.
incidents; and improve health and safety practices.
contaminated sites, with a target of 22 pipeline spillages per 1 609 kilometres of pipeline.
around the Jameson Park fuel terminal (this area is demarcated by the Lesedi municipality as an environmentally sensitive area and it has protected species. In accordance with Pipelines’ EIA approval, the biodiversity offset area must protect the species and area).
Performance against objectives
platinum NOSA rating with an overall improvement in the effort rating.
improved health and safety practices and awareness.
the previous year and were 28% below target.
travelled decreased by 23% and no major accidents were reported.
spillages per 1 609 kilometres of pipeline for the year which was lower than the target.
mainly due to the five leak incidents during the year and the associated environmental rehabilitation costs.
is still under discussion with all the relevant stakeholders.
LOOKING FORWAR D
programmes to minimise third-party activities within the servitude area.
ABOUT
PIPELINES (continued)
Manifold in operation at Jameson Park

129
Building organisational readiness and a high performance cultureGoals and objectives for the 2014 reporting year
programme.
Programme.
Programme for Pipelines employees.
programme.
Pipelines’ culture charter.
employees living with disabilities to enhance their professional competencies.
through training and development.
programme.
Performance against objectives
statutory training programmes, were implemented.
(OBML) training was successfully implemented during the year and the programme is now well embedded in Pipelines. A new OBML matrix is being been developed to include the NMPP pipeline requirements and is currently under discussion with all roleplayers.
talent management programmes were successfully embedded in the organisation.
been developed and implemented for Pipelines employees.
were conducted throughout Pipelines ahead of schedule.
were conducted throughout all Pipelines’ sites.
Tarlton, Alrode, Waltloo, Langlaagte, Secunda and Witbank with no abnormalities identified thus far. The programme is being rolled out at all other Pipelines’ sites.
Wellness activities for the year focused on creating ongoing awareness for health risks through the Medical Surveillance Programme, Employee Assistance Programme and Health Risk Assessments, thereby providing a supportive environment for employees to manage identified health risks.
awareness programmes promoting healthy lifestyle conditions; and on-site professional services were provided to personnel in Head Office.
box initiative to encourage two-way communication and to identify areas of improvement in support of the culture charter behaviours and values.
all Pipeline employees living with disabilities to be more effective in their roles within the organisation. This programme will be embedded in the capacity strategy going forward and will be extended as a ‘learnership’ requirement for all entry level positions.
4,93% of personnel costs, mainly due to the deferment of NMPP training. All statutory training was completed.
Pipelines development programme was completed.
LOOKING FORWAR D
Pipelines development programme in April 2014 and implementation will take between six to eight months.
continue roll-out of medical surveillance programmes.
strategy.
requirements and training is rolled out accordingly.
in order to understand employees needs.

INTEGRATED REPORT 2014130
FINANCIAL PER FOR MANCE R EVIEW Operating Division performance
Salient features
Year-ended31 March
2014R million
Year-ended31 March
2013R million
%change
Revenue 3 114 2 829 10,1– Refined and synthetics 1 600 1 529 4,6– Aviation fuel 60 60 (0,8)– Crude 1 039 841 23,5– Gas 163 86 89,4– Handling 93 73 27,4– Other 96 115 (16,5)– Clawback 63 125 (49,5)Operating expenses (786) (665) (18,2)– Energy costs (206) (192) (7,1)– Maintenance costs (73) (49) (49,4)– Material costs (11) (10) (8,6)– Personnel costs (318) (275) (15,5)– Other costs (178) (139) (28,3)Profit from operations before
depreciation, derecognition, amortisation
and items listed below (EBITDA) 2 328 2 164 7,6Depreciation, derecognition and amortisation (639) (547) (16,7)Profit from operations before items listed below 1 689 1 617 4,5Impairments and fair value adjustments (2) (46) 95,7Net finance costs (38) (298) 87,2Profit before taxation 1 649 1 273 29,5Taxation (482) (391) (23,3)Profit after taxation 1 167 882 32,3Total assets (excluding CWIP) R million 19 860 19 458 2,1Profitability measures
EBITDA margin* % 74,8 76,5 (1,7)Operating margin** % 54,3 57,2 (3,0)Return on average total assets (excluding CWIP)*** % 8,6 8,3 0,3Asset turnover (excluding CWIP)**** times 0,16 0,15 5,6Capital expenditure^ R million 3 377 2 799 20,7Employees
Number of employees (permanent) number 621 627 (1,0)Revenue per employee R million 5,01 4,51 11,2
* EBITDA expressed as a percentage of revenue.** Profit from operations before impairment of assets, fair value adjustments, net finance costs and taxation
expressed as a percentage of revenue.*** Profit from operations before impairment of assets, fair value adjustments, net finance costs and taxation
expressed as a percentage of average total assets excluding capital work-in-progress.**** Revenue divided by average total assets excluding capital work-in-progress.^ Capital expenditure (replacement + expansion) excluding borrowing costs, intangible assets and including
capitalised decommissioning liabilities.
ABOUT
PIPELINES (continued)

131
Overall performancePipelines delivered exceptional financial results for the year, with revenue increasing by 10,1% to R3 114 million from R2 829 million mainly due to an 8,53% increase in allowable revenue granted by NERSA and an increase in refined and crude volumes transported. Net operating expenses increased by 18,2% to R786 million (2013: R665 million) compared to the prior year. This increase is mainly attributable to maintenance cost on the extended NMPP servitude and environmental rehabilitation costs.
The EBITDA achievement of R2 328 million is 7,6% higher than the prior year. These results were attained in a challenging economic and operational environment, demonstrating the operating division’s ability to implement most of its strategic objectives, all of which are grounded in Transnet’s MDS for 2014.
This performance set the bar high in terms of stakeholder expectations, particularly Pipelines’ customers. The positive results of the year’s customer survey further validated the Company’s commitment to operational excellence in support of the MDS. Going forward, Pipelines will continue to deliver on these expectations, especially in light of the delays in completing the NMPP project.
The objective of providing an end-to-end integrated fuel logistical service to clients is on track, albeit behind schedule due to the complexities associated with the implementation of an integrated IT platform. Accordingly, Pipelines will roll out this integration in a phased approach, with the first phase being the integration of rail services in the supply of jet fuel to ORTIA. This project has commenced and lessons learned in this phase will be applied before future phases are rolled out.
Although inland market petroleum consumption declined by 1% since 2011, Pipelines recorded a 4% improvement in market share in terms of transportation to the inland market area. This is attributed to operational efficiency and the NMPP trunkline’s available capacity. Pipelines therefore successfully met its main
objective for the year, which was to keep the inland market wet, resulting in no stock-outs.
A review of 20 years of democracy has shown that our volumes transported increased by 26%. Revenue increased from R442 million in 1994 to R3 114 million in the current year. Employment equity moved from 58% black employees and only 6% females to 84% black and 33% female employees in 1994 and 2014 respectively. In the senior management cadre, black employment equity increased from 0% to 100% and in the middle management cadre from 0,3% to 10,3% and supervisory from 1% to 9,5%.
Focus for coming yearIn the next year the focus will be in three areas namely:
infrastructure;
share; and
Volume growth will be facilitated by utilising the NMPP trunkline as a full multi-product pipeline as well as providing additional service offerings to customers, such as the additive dosing capability at the Tarlton depot; and by making the refractionator available for use by all customers. Pipelines have together with specific customers done trials and implemented the transport of fuels previously regarded as niche grades and not considered for Pipeline transport due to the volume and quality issues. These grades were transported by road and rail only until now. The volumes, although still small are expected to grow as our customers facilities are converted to receive these grades of fuel.
Pipelines and Freight Rail will develop a full supply chain solution for the National Oil Company of Botswana, thereby promoting regional integration. Further, Pipelines will continue to promote and seize opportunities to train and consult on technical and operational aspects of depots and pipelines in the region.

INTEGRATED REPORT 2014132
ANNEXURE A
CONSOLIDATED VALUE ADDED STATEMENTfor the year ended 31 March 2014
2014 R million
Value apportioned
%2013
R million
Value apportioned
%
Revenue 56 606 50 194 Cost of materials and services (16 338) (14 636)
Net operating expenses excluding depreciation, derecognition and amortisation (32 967) (29 143)– Excluding: personnel costs 16 629 14 507
Value added by operations 40 268 98% 35 558 98% Other income 644 2% 651 2%
– Fair value adjustments 264 222 – Income from associates 14 24 – Investment and other income 366 405
Value added/created 40 912 100% 36 209 100%
Applied as follows:Employees 17 017 42% 14 758 41%
– Personnel costs 16 629 14 507 – Post-retirement benefit
obligation costs 388 251
Providers of capital# 5 917 14% 5 545 15%
– Lending institutions 5 917 5 545
Government (55) 0% 43 0%
– South African normal taxation (59) 39 – Capital gains taxation – – – Foreign taxation 4 4
Re-invested to maintain and
expand operations 18 033 44% 15 863 44%
– Depreciation, amortisation and impairment 10 843 9 865
– Deferred taxation 2 019 1 859 – Net profit 5 171 4 139
Value apportioned 40 912 100% 36 209 100%
In addition to value apportioned to Government the following amounts were paid to the South African Revenue Services (SARS):
# Borrowing costs amounting to R1 288 million (2013: R1 053 million) were capitalised.

133
ABBREVIATIONS AND ACRONYMS
ACSA Airports Company South Africa SOC Ltd
AFD Agence Française de Developpement – French Development Bank
AfDB African Development Bank
AFS Annual financial statements
AIDS Acquired immune deficiency syndrome
B-BBEE broad-based black economic empowerment
BCM business continuity management
bp basis point
BRICS Brazil, Russia, India, China and South Africa
CD chart datum
CDP Carbon Disclosure Project
CFRC critical financial reporting controls
CGT Capital gains taxation
COE Centre of Excellence
COPEX Capitalised operating expenditure
CPI Consumer price index
CSDP Competitive Supplier Development Programme
CSI Corporate social investment
CWIP Capital work-in-progress
DBT Dry Bulk Terminal
DCT Durban Container Terminal
DEA Department of Environmental Affairs
DFI Development Finance Institution
DIA Durban International Airport
DIFR disabling injury frequency rate
DJP Durban-to-Johannesburg pipeline
DMTN Domestic Medium-Term Note
DoT Department of Transport
DPE Department of Public Enterprises
DTI Department of Trade and Industry
EAP Employee Assistance Programme
EBIT earnings before interest and taxation
EBITDA earnings before interest, taxation, depreciation, derecognition and amortisation
ECA Export Credit Agency
ED Enterprise development
EE employment equity
EIA environmental impact assessment
EIMS enterprise information management services
ERM Enterprise-wide Risk Management
FEL front-end loading
FINCO Group Finance Committee
GBP Pound Sterling
GCH gross crane moves per hour
GE General Electric
GHG greenhouse gases
GIT Graduate-in-Training
GMTN Global Medium-Term Note
GRI Global Reporting Initiative
HCM Human Capital Management
HCT HIV/Aids Testing and Counselling
HIV human immunodeficiency virus
HR Human Resources
IAS International Accounting Standards
IASB International Accounting Standards Board
ICM Act Integrated Coastal Management Act, No 24 of 2008
IFRIC International Financial Reporting Interpretations Committee
IFRS International Financial Reporting Standards
IIRC International Integrated Reporting Council

INTEGRATED REPORT 2014134
IR Integrated Report
iSCM integrated Supply Chain Management
JBIC Japan Bank for International Cooperation
JPY Japanese Yen
King IIIAfrica – 2009
LTI long-term incentive scheme
LTPF long term planning framework
MDS Market Demand Strategy
mℓ/km million litres per kilometre
mt million tons
NEMA National Environmental Management Act, No 107 of 1998
NGP New Growth Path
NIHL noise-induced hearing loss
Ports Act National Ports Act, No 12 of 2005
PP preferential procurement
Prasa Passenger Rail Agency of South Africa
PSP Private Sector Participation
ROD Record of Decision
ROTA return on total average assets
RTG Rubber tyred gantry crane
SADC Southern African Development Community
Satawu South Africa Transport and Allied Workers Union
SATS South African Transport Services
SD Sustainable Report
SHEQ Safety, health, environment and quality
SMME Small, medium and micro-enterprise
SOC State-owned company
SOP standard operating procedure
SPAD Signals passed at danger points
SPO strategic performance objective
SRAB starting regulatory asset base
SSI Statement of Strategic Intent
STAT ship turnaround time
STI short-term incentive scheme
STS ship-to-shore
SVA Shareholder value add
TEU twenty-foot equivalent unit
TSDBF Transnet Second Defined Benefit Fund
TWR Train working rules
UKLA
USA United States of America
US$ US Dollar
Utatu United Transport and Allied Trade Union
WACC weighted average cost of capital
ZAR South African Rand
ABBREVIATIONS
AND ACRONYMS (continued)

135
Asset turnover (times)Revenue divided by average total assets (total assets excluding capital work-in-progress).
Average total assets
the total assets at the beginning of the reporting period plus total assets at the end of the reporting period, divided by two.
Cash interest cover (times)Cash generated from operations after working capital changes, divided by net finance costs (net finance costs includes finance costs, finance income and capitalised borrowing costs from the cash flow statement).
DebtInterest-bearing borrowings (short and long term), post-retirement benefit obligations, derivative financial liabilities plus bank overdraft, less short-term investments and net cash and cash equivalents.
EBITDAProfit/(loss) from operations before depreciation, amortisation, profit on sale of interest in businesses, impairment of assets, dividend received, post-retirement benefit obligation income/(costs), fair value adjustments, income/(loss) from associates and net finance costs.
EBITDA margin Profit/(loss) from operations before depreciation, amortisation, profit on sale of interest in businesses, impairment of assets, dividend received, post-retirement benefit obligation income/(costs), fair value adjustments, (loss)/income from associates and net finance costs expressed as a percentage of revenue.
EquityIssued capital and reserves.
Debt (for gearing calculation)Long-term borrowings, short-term borrowings, employee benefits, derivative financial liabilities plus bank overdraft less other short-term investments, less derivative financial assets and less cash and cash equivalents.
GearingDebt expressed as a % of the sum of debt and Shareholder’s equity.
Headline earningsAs defined in Circular 3/2009, issued by the South African Institute of Chartered Accountants, separates from earnings all items of a capital nature. It is not necessarily a measure of sustainable earnings.
Operating profitProfit or loss from operations after depreciation and amortisation but before profit on sale of interest in businesses, impairment of assets, dividends received, post-retirement benefit obligation income/(costs), fair value adjustments, income/(loss) from associates and net finance costs.
Operating profit marginOperating profit expressed as a percentage of revenue.
Profit/(loss)Profit or loss after taxation.
Return on average total assets Operating profit expressed as a percentage of average total assets (average total assets exclude capital work-in-progress).
Return on net assetsProfit before taxation expressed as a percentage of net assets.
Shareholder value addEBIT less the cost of capital. Cost of capital is the average total assets, excluding capital work-in-progress, multiplied by WACC.
Total assetsNon-current and current assets.
Total debtNon-current and current liabilities.
Total debt-to-equity ratioTotal debt expressed as a ratio to equity.
GLOSSARY OF TERMS

INTEGRATED REPORT 2014136
Executive directors: B Molefe (Group Chief Executive). A Singh (Group Chief Financial Officer).
Independent non-executive directors: ME Mkwanazi (Chairperson), MA Fanucchi, Y Forbes, HD Gazendam,
Group Company Secretary: Ms ANC Ceba
47th Floor, Carlton Centre, 150 Commissioner Street, Johannesburg, 2001.
PO Box 72501, Parkview, 2122, South Africa.
Auditors:SizweNtsalubaGobodo Inc., 20 Morris Street East, Woodmead, Johannesburg, 2191.
With effect from 1 August 2013, the Company’s internal audit function has been
SekelaXabiso (Pty) Ltd has its business address at:1st Floor Building 22BThe Woodlands Office Park20 Woodlands DriveWoodmeadJohannesburg
Nkonki Inc has its business address at: 3 Simba RoadSunninghillJohannesburg
85 Empire RoadParktownJohannesburg
Transnet SOC Ltd:47th Floor, Carlton Centre150 Commissioner StreetJohannesburg2001
Incorporated in the Republic of South Africa.Registration number 1990/000900/30.
CORPORATE INFORMATION

9 1 9

WWW.TRANSNET.NET

i
20 2014ANNUAL FINANCIAL STATEMENTS

CONTENTS
Forward-looking informationAll references to forward-looking information and targets in the 2014 reports are extracted from the 2015 Transnet Corporate Plan approved by the Board of Directors.
Transnet’s Integrated Report 2014, Annual Financial Statements 2014 and Sustainability Report 2014 are available in PDF on www.transnet.net and via this QR code on mobile devices.
Feedback on the reports is encouraged.
Approval of the Annual Financial Statements 2Independent auditor’s report to Parliament on Transnet SOC Ltd 4Audit Committee report 6Report of the Directors 10Accounting policies 31Annual financial statements 54Annexure A Financial Risk Management 102Annexure BProperty, plant and equipment reconciliation 118Annexure CDisposal groups classified as held-for-sale and
related notes 120Annexure DSubsidiaries, associates and joint ventures 122Annexure EIrregular expenditure, fruitless and wasteful
expenditure and losses through criminal
conduct 126Annexure FMeasurement of level 3 fair values 128Annexure GNew financial reporting standards and
interpretations issued but not yet effective 129Corporate governance 132Abbreviations and acronyms 160Glossary of terms 161Corporate information 162
Transnet’s reporting for 2014 consists of three reports
Volume 1
Volume 2
Volume 3
20 2014INTEGRATED REPORT
20
SUSTAINABILITY REPORT
2014
The Integrated Report 2014 is the Company’s primary report to all stakeholders.
The Annual Financial Statements 2014 including reports of the independent auditors, directors and the corporate governance report.
The Sustainability Report 2014 documents Transnet’s economic, social and environmental dividends.
20 2014ANNUAL FINANCIAL STATEMENTS
Revenue increased by 12,8% to R56,6 billion.
EBITDA increased by 12,3% to R23,6 billion.
Profit for the year increased by 24,9% to R5,2 billion.
Gearing at 45,9% and cash interest cover at 3,7 times.
Capital investment increased by
15,6% to R31,8 billion.
Cash generated from operations after working capital changes increased by 11,6% to R25,3 billion.
Strong volume growth in the
automotive and containers on rail
of 25,2%.
B-BBEE spend of R38,8 billion or
94,4% of total measured procurement
spend for the year per DTI codes.
Performance highlights
Throughout the reports, readers are referred to places where they can find more detail on particular topics, using these pointers:
Refers to Volume 1 for further information
Refers to Volume 2 for further information
Refers to Volume 3 for further information

2014
2014201320122011201020142013201220112010
18
44
1
21
50
4
22
25
9
27
47
1 31
76
6
CAPITAL INVESTMENT(R MILLION)
14,6%
30,2%
B-BBEE SPEND AS PER DTI CODES (R MILLION)
38
84
8
13
51
0 19
42
0
25
80
8
33
44
9
20142013201220112010
CASH INTEREST COVER (TIMES)
3,7
4,1
3,9
4,2
3,7
Minimum3,0
20142013201220112010
35
61
0
37
95
2 45
90
0
50
19
4 56
60
6
REVENUE(R MILLION)
12,3%
20142013201220112010
14
40
9
15
76
3 18
88
2
21
05
1 23
63
9
EBITDA(R MILLION)
13,2%
20142013201220112010
GEARING (%)4
5,9
39
,8 41
,1
41
,9 44
,6
Maximum50,0
1

ANNUAL FINANCIAL STATEMENTS 20142
Directors’ responsibilitiesThe Board of Directors is required, by the Companies Act, No 71 of 2008 of South Africa (Companies Act), and the Public Finance Management Act No 1, 1999, of South Africa (PFMA), to prepare annual financial statements which fairly present the state of affairs of Transnet SOC Ltd (Transnet or the Company) and its subsidiaries (the Group) as at the end of the financial year, the profit or loss and cash flows of the Company and the Group for the financial year then ended.
In preparing these annual financial statements, the directors are required to:
that the Company and/or the Group will continue in business for the foreseeable future.
The Board of Directors of the Company are responsible for the maintenance of adequate accounting records, maintenance of appropriate systems of internal control as well as the preparation and integrity of the annual financial statements and related information.
Directors’ statementsThe Audit Committee has evaluated the Company and Group annual financial statements and has recommended their approval to the Board of Directors. In preparing the Company and Group annual financial statements, the Company and the Group have complied with International Financial Reporting Standards (IFRS) and the Companies Act. In addition, the Group has complied with the reporting requirements of the PFMA, except as set out in the Report of the Directors on pages 18 and 19.
estimates. Judgements and estimates made in the application of IFRS, that have a significant impact on the annual financial statements are disclosed in the notes to the annual financial statements.
The Board of Directors have every reason to believe that the Company and Group have adequate resources and facilities in place to be able to continue in operation for the foreseeable future. Therefore, the Board of Directors are satisfied that Transnet is a going concern and have continued to adopt the going-concern basis in preparing the annual financial statements.
The external auditor, SizweNtsalubaGobodo, are responsible for independently auditing and reporting on the annual financial statements in conformity with International Standards on Auditing. Their unmodified audit report on the annual financial statements, prepared in terms of the Public Audit Act of South Africa, Act No 25 of 2004 (PAA), appears on pages 4 to 5.
The Internal Audit activities are in accordance with the preapproved Internal Audit Plan. The Internal Audit Plan is reviewed and approved by the Audit Committee annually. Transnet Internal Audit has executed the Internal Audit Plan during the year and has provided assurance to the Board of Directors as to the state of the internal controls of the Company. Their assessment of the internal controls of the Company is included in the Audit Committee Report. The Audit Committee has reviewed the effectiveness of the Company’s internal controls and considers the systems appropriate for the effective operation of the Company.
APPROVAL OF THE ANNUAL FINANCIAL STATEMENTS FOR THE YEAR ENDED 31 MARCH 2014

3
The Board of Directors are of the opinion that the Company and the Group have complied with applicable laws and regulations except as disclosed in the Report of the Directors as set out on pages 18 and 19.
The Board of Directors are of the opinion that these annual financial statements fairly present the financial position of the Company and the Group as at 31 March 2014, and the results of their operations and cash flow information for the year then ended.
The annual financial statements have been prepared under the supervision of the Group Chief Executive.
ME Mkwanazi B Molefe A SinghChairperson Group Chief Executive Group Chief Financial Officer
28 May 2014 28 May 2014 28 May 2014
Johannesburg Johannesburg Johannesburg
GROUP COMPANY SECR ETARY CERTIFICATEFOR THE YEAR ENDED 31 MARCH 2014
I hereby certify that in terms of section 88(2)(e) of the Companies Act, the Company has lodged with the Registrar of Companies all such returns for the year ended 31 March 2014, as are required of a public company in terms of this Act, and that all such returns are true, correct and up to date.
ANC CebaGroup Company Secretary
28 May 2014
Johannesburg

ANNUAL FINANCIAL STATEMENTS 20144
INDEPENDENT AUDITOR’S REPORT TO PARLIAMENT ON TRANSNET SOC LTDFOR THE YEAR ENDED 31 MARCH 2014
Report on the consolidated financial statements Introduction
We have audited the consolidated and separate annual financial statements of Transnet SOC Ltd and its subsidiaries as set out on pages 31 to 131, which comprise the consolidated and separate statements of financial position as at 31 March 2014, the consolidated and separate statements of comprehensive income, statements of changes in equity and statements of cash flows for the year then ended, and the notes, comprising a summary of significant accounting policies and other explanatory information.
The accounting authority’s responsibility for the consolidated financial statements
The Board of Directors which constitutes the accounting authority is responsible for the preparation and fair presentation of these consolidated and separate financial statements in accordance with International Financial Reporting Standards and the requirements of the Public Finance Management Act (PFMA) of South Africa, Act No 1 of 1999 and the Companies Act of South Africa (Companies Act), Act No 71 of 2008 and for such internal control as the accounting authority determines is necessary to enable the preparation of consolidated and separate financial statements that are free from material misstatement, whether due to fraud or error.
Auditor’s responsibility
Our responsibility is to express an opinion on these consolidated and separate financial statements based on our audit. We conducted our audit in accordance with the Public Audit Act of South Africa, Act No 25 of 2004 (PAA), the General Notice issued in terms thereof and International Standards on Auditing. Those standards require that we comply with ethical requirements and plan and perform the audit to obtain reasonable assurance about whether the consolidated and separate financial statements are free from material misstatement.
An audit involves performing procedures to obtain audit evidence about the amounts and disclosures in the
including the assessment of the risks of material misstatement of the consolidated and separate financial statements, whether due to fraud or error. In making those risk assessments, the auditor considers internal control relevant to the entity’s preparation and fair presentation of the consolidated and separate financial statements in order to design audit procedures that are appropriate in the circumstances, but not for the purpose of expressing an opinion on the effectiveness of the entity’s internal control. An audit also includes evaluating the appropriateness of accounting policies used and the reasonableness of accounting estimates made by management, as well as evaluating the overall presentation of the consolidated and separate financial statements.
We believe that the audit evidence we have obtained is sufficient and appropriate to provide a basis for our audit opinion.
Opinion
In our opinion, the consolidated and separate financial statements present fairly, in all material respects, the financial position of Transnet SOC Ltd and its subsidiaries as at 31 March 2014, and their financial performance and cash flows for the year then ended in accordance with International Financial Reporting Standards and the requirements of the PFMA and the Companies Act.
Other reports as required by the Companies Act.
We draw attention to the matter below. Our opinion is not modified in respect of this matter:
As part of our audit of the financial statements for the year ended 31 March 2014, we have read the Report of the Directors and the Audit Committee’s Report for the purpose of identifying whether there are material inconsistencies between these reports and the audited financial statements. These reports are the responsibility of the respective preparers. Based on reading these reports we have not identified material inconsistencies between the reports and the audited financial statements. However, we have not audited these reports and accordingly we do not express an opinion on these reports.
Report on other legal and regulatory requirementsIn accordance with the PAA and the General Notice issued in terms thereof, we report the following findings on the
laws and regulations and internal control, but not for the purpose of expressing an opinion.
Predetermined objectives
We performed procedures to obtain evidence about the usefulness and reliability of the information in the Shareholder's Compact – Performance Criteria (performance information) in the Report of the Directors of Transnet SOC Ltd as set out on pages 12 to 15 of the annual financial statements.We evaluated the reported performance information against the overall criteria of usefulness and reliability.

5
We evaluated the usefulness of the reported performance information to determine whether it was presented in accordance with the National Treasury’s annual reporting principles and whether the reported performance was
were well defined, verifiable, specific, measurable, time bound and relevant, as required by the National Treasury’s Framework for managing programme performance information.
We assessed the reliability of the reported performance information to determine whether it was valid, accurate and complete.
We did not raise any material findings on the usefulness and reliability of the reported performance information
Additional matter
Although we raised no material findings on the usefulness and reliability of the reported performance information
Achievement of planned targets
Of the total number of 193 targets planned for the period ended 31 March 2014, 69 of the targets were not achieved during the period under review. This represents 36% of the total planned targets that were not achieved during the year under review. This was due to adverse global as well as domestic economic conditions, resulting in low customer demand, customer production problems and challenges in the operating environment. This matter
Compliance with laws and regulations
We performed procedures to obtain evidence that the entity had complied with applicable laws and regulations regarding financial matters, financial management and other related matters. Our findings on material non-compliance with specific matters in key applicable laws and regulations as set out in the General Notice issued in terms of the PAA are as follows:
Expenditure management
As disclosed in Annexure E of the financial statements, the accounting authority did not take effective steps to prevent irregular expenditure, fruitless and wasteful expenditure and losses resulting from criminal conducted, as required by section 51(1)(b)(ii) of the Public Finance Management Act (PFMA) in respect of the items detailed in that annexure.
Internal control We considered internal control relevant to our audit of the financial statements, annual performance report and compliance with laws and regulations. The matters reported below under the fundamentals of internal control are limited to the deficiencies that resulted in the findings on compliance with laws and regulations included in this report.
Financial and performance management
The matters identified and reported under the compliance with laws and regulations section above have risen due to non-adherence with operational policies in the expenditure, procurement and contract management processes. The controls over these areas have continually been improved since these matters occurred.
Other reportsInvestigations in progress and completed
During the financial year under review Transnet SOC Ltd initiated investigations into alleged irregularities or fraud. No material findings were identified relating to those investigations completed during the year. At the reporting date, certain investigations are still ongoing.
Agreed-upon procedure engagements
An agreed upon procedures engagement was performed on the National Treasury consolidation template. The report covered the period from 1 April 2013 to 31 March 2014.
SizweNtsalubaGobodo Inc.
Per Collins Mashishi CA(SA)Director20 Morris Street East, Woodmead, Johannesburg, 219128 May 2014

ANNUAL FINANCIAL STATEMENTS 20146
As required by the Public Finance Management Act (PFMA), the Audit Committee report is prepared as prescribed by Regulation 27 of the Treasury Regulations and in line with the recommendations of the King III Report on Corporate Governance for South Africa and its Code of Governance Principles. The Audit Committee performs its duties in accordance with PFMA and in terms of section 94(7) of the Companies Act.
The terms of reference are set out in the Audit Committee mandate, which is approved by the Board of Directors and is continuously reviewed and updated for changes in legislation, business circumstances and corporate governance practices. The Audit Committee confirms that it has complied with its statutory obligations and discharged its duties in accordance with the mandate.
The role of the Committee is defined in its mandate and cover, amongst others, the following key aspects: Board of Directors in discharging its duties relating to the accounting policies, safeguarding of
assets, the operation of adequate systems of financial control, recording and reporting, and the preparation of financial statements in compliance with the applicable legal requirements and accounting
the Board of DirectorsBoard of Directors for
to the Company.
Composition and meetings of the Audit Committee The Audit Committee comprises the following independent non-executive directors of the Company duly appointed by the Shareholder at the annual general meeting in line with legislative requirements.
Mr IB Skosana was appointed as Chairperson on 6 July 2012. The qualifications and experience of the members are detailed in the abridged governance and assurance section in the 2014 Integrated Report.
The Chairperson of the Audit Committee has been appointed as a member of the Board Risk Committee to ensure alignment between these functions.
The Audit Committee held five scheduled meetings for the year ended 31 March 2014, and member attendance at these meetings is reflected in the Corporate Governance report on page 155.
The Auditor-General of South Africa has a standing invitation to attend Audit Committee meetings. The Group Chief Executive, the Group Chief Financial Officer, the Chief Audit Executive and other key executive members are required to attend meetings of the Audit Committee. In addition the representatives from the Office of the Auditor General of South Africa, Transnet Internal Audit function together with the External Auditors have a standing invitation to attend all Committee meetings. The Internal Auditors, the External Auditors, and Management are afforded individual closed sessions with the Audit Committee.
AUDIT COMMITTEE REPORT FOR THE YEAR ENDED 31 MARCH 2014

7
Summary of the main activities undertaken by the Audit Committee during the year In line with the PFMA, the Companies Act and King III, the Audit Committee executed the following activities during the year:
External audit
Board of Directors
Board of Directors:
– The results for the quarters ended 30 June 2013 and 31 December 2013.
policies and practices, and recommended any changes considered appropriate in terms of IFRS to the Board of Directors
to the Board of Directors for approval
(as identified in the Auditing Profession Act) identified and reported by the external auditor.
Internal audit
control environment, systems and processes together with the adequacy and appropriateness of the

ANNUAL FINANCIAL STATEMENTS 20148
AUDIT COMMITTEE REPORT FOR THE YEAR ENDED 31 MARCH 2014(continued)
Other matters
recommended to the Board of Directors that the Company and Group continue to adopt the going-concern
Board of Directors in discharging its duties relating to the Company's system of internal controls, risk management, compliance and Information and Communication Technology (ICT)
including without limitation, the Companies Act, PFMA, Treasury regulations and the Income tax Act No 58
Activities and the Risk Management Strategies to the Board of DirectorsBoard of Directors
provide a coordinated approach to all assurance activities.
Annual evaluation by the Audit CommitteeAs required by the PFMA, Companies Act and King III, the Audit Committee has performed an annual assessment and evaluation of the Company's system of internal controls together with the effectiveness of the finance function, including the competency of the Group Chief Financial Officer. The results are presented below.
Evaluation of the internal control environment
Based on the engagement with external and internal auditors, together with the review of their reports, the Audit Committee's overall assessment of the Company's internal control environment is presented in the table below.
Based on the reviews executed by Transnet Internal Audit, their overall assessment of the effectiveness of the system of internal controls and risk management for the year is as follows:
Risk and control component Process
2014assessment
2013assessment
Governance Financial Satisfactory Satisfactory
Operational Requires improvement Satisfactory
People Financial Satisfactory Satisfactory
Operational Requires improvement Requires improvement
Method and practices Financial Satisfactory Satisfactory
Operational Requires improvement Requires improvement
9
Although there is a need for continuous improvement, the Audit Committee is of the view that the internal controls of the Company are appropriate in terms of:
Assessment of the finance function and competence of the Group Chief Financial Officer
The Audit Committee is satisfied with:
responsibilities commensurate with the position.
Recommendation of the annual financial statementsThe Audit Committee has evaluated the annual financial statements for the year ended 31 March 2014 and is of the view that they comply, in all material respects, with the requirements of the PFMA and in the manner required by the Companies Act. The Audit Committee is further satisfied that the annual financial statements have been prepared in accordance with IFRS and that the adoption of the going-concern basis is appropriate.
The Audit Committee is of the opinion that the annual financial statements fairly present the financial position of the Company and the Group as at 31 March 2014, and the results of their operations and cash flow information for the year then ended and has, therefore, recommended the adoption of these annual financial statements by the Board of Directors.
IB Skosana
Chairperson
28 May 2014
Johannesburg

ANNUAL FINANCIAL STATEMENTS 201410
REPORT OF THE DIRECTORS FOR THE YEAR ENDED 31 MARCH 2014
IntroductionThe Board of Directors is pleased to present its Integrated Report, in both printed and electronic formats, in line with the requirement of King III Code on Corporate Governance (King III) and the audited annual financial statements of Transnet SOC Ltd (Transnet or the Company) and its subsidiaries (the Group) for the year ended 31 March 2014.
Ownership and Shareholder’s expectationsTransnet is a public company, wholly owned by the Government of the Republic of South Africa and is the custodian of the country’s rail, ports and pipelines. Transnet is responsible for enabling the competitiveness, growth and development of the South African economy through delivering reliable freight transport and handling services that satisfy customer demand.
As the custodian of ports, rail and pipelines, Transnet has a responsibility to ensure the optimal development of the national freight system. Furthermore, as a responsible corporate citizen and key implementing agent of the developmental state, Transnet is required to conduct its activities in a manner that optimises
integration, industrial capability building and energy efficiency.
Transnet’s strategy and implementation plan is guided by the Statement of Strategic Intent (SSI) issued by the
the national freight system as follows:
With the Market Demand Strategy (MDS), Transnet has achieved a very high degree of alignment between its strategic plan and the requirements of the Shareholder Representative. The MDS is underpinned by a R312,2 billion capital investment plan and is an essential element of the country’s economic growth and development strategy.
The MDS, which is aimed at increasing rail capacity to satisfy latent demand for rail services and on ensuring that port and pipeline capacity remains ahead of demand, targets aggressive growth in investment, volumes, revenue and profit.
The MDS will focus on the following key areas:
Board of DirectorsThe composition of the Board of Directors at 31 March 2014 is shown below:
Executive directors: B Molefe (Group Chief Executive), A Singh (Group Chief Financial Officer).
Independent non-executive directors: ME Mkwanazi (Chairperson), MA Fanucchi, Y Forbes, HD Gazendam,
Summary curricula vitae of each director are set out on pages 16 and 17 of the 2014 Integrated Report.

11
The following independent non-executive director retired from the Board of Directors with effect from 25 June 2013:
The following matters are covered in the Corporate Governance report:
OutlookThe global economy appears to be transitioning toward a period of stable, but slower growth. As a result, prospects for the South African and regional economies are brighter. On the back of continuing investments in the natural resources sector and strong domestic demand, GDP is estimated to grow by 3,0% in 2014 and 3,5% in 2015. This will support growth in domestic and regional freight demand.
Global container volumes are estimated to have grown by 3,2% in 2013 and are forecast to grow by an average annual rate of 5,3% to 2017. Transnet estimates average container growth of 31,0% over the next seven years driven by domestic GDP growth, expanding intra-regional trade and transshipment activities.
Ongoing industrialisation and urbanisation, particularly in Asia, will continue to drive demand for iron ore and associated minerals. World trade of iron ore is estimated to have increased by 8,0% in 2013 and is forecast to grow at an average annual rate of 4,1% to 2018. South Africa with its high quality ore and relatively low-cost production continues to present an attractive alternative to Brazilian and Australian supply into Asia.
World thermal coal trade is estimated to have increased by 1,8% in 2013 and is forecast to grow at an average rate of 2,2% over the next five years. Despite policy changes regarding coal use in response to environmental concerns, the relatively low cost and reliability of coal will continue to support its use, particularly in emerging economies. Coal is anticipated to account for between 27,0% to 28,0% of the global energy market share over the next three decades. South Africa is well positioned to supply coal into the growing coal markets of China and India.
In general, demand-side risks appear to have stabilised and growth opportunities for the next financial year remain positive.
Strategy overview and performance for the year
Performance for the year March 2014 March 2013 % change
Revenue (R million) 56 606 50 194 12,8EBITDA (R million) 23 639 21 051 12,3EBITDA margin (%) 41,8 41,9 (0,1)Equity attributable to the equity holder (R million) 97 113 84 954 14,3Gearing (%) 45,9 44,6 1,3Capital investment 31 766 27 471 15,6Cash generated from operations after working capital changes (R million) 25 271 22 641 11,6Cash interest cover (times) 3,7 3,7 –
Detailed commentary on the performance for the year is contained in the 2014 Integrated Report on pages 47 to 55.

ANNUAL FINANCIAL STATEMENTS 201412
REPORT OF THE DIRECTORS FOR THE YEAR ENDED 31 MARCH 2014(continued)
Shareholder’s Compact – performance criteriaThe Shareholder’s Compact Key Performance Indicators (KPIs), which are revised annually by agreement between the Board of Directors and the Shareholder Representative, serve as the performance monitoring framework for the Company. Performance against the Shareholder's Compact 2014 financial year targets is
to audit review and the Company’s auditors have reported no adverse findings on the performance against
The Company achieved an aggregate volume performance of 95,1%, despite the decline in the growth of both global and domestic economies, customer production problems, and challenges in the operating environment. Low customer demand, mainly due to the economic decline, resulted in volume losses mainly affecting export coal and export iron ore. Focused attention on operational improvement initiatives resulted in a 12,9% year-on-year improvement in operational efficiencies.
Measuring the Company’s performance against the operational KPI targets of the Shareholder’s Compact in Annexure B, 61,0% of the targets for the 2014 financial year were fully achieved. Performance against other annexures, that is A, C, D, F and G is reported in the quarterly reports to the Shareholder Representative. Annexure E pertains to the Significance and Materiality Framework in terms of section 55(2) of the PFMA and is reported to the Shareholder Representative where relevant, upon acquisition or disposal of an asset that is at least equal to the materiality threshold.
Transnet Group
Key performance area Key performance indicator Unit of measure
2014 Compact
target2014
Actual
Financial value creation Return on total average assets(a) % 8,0 6,5
Cash interest cover times 3,3 3,7
Gearing % 46,6 45,9
Operating expenditure as a % of revenue % 57,1 58,2
Innovation Research and development cost R million 194,0 100,4
(a) Excluding Port Regulator claw backs.

13
Transnet Freight Rail
Key performance area
Key performance indicator
Unit of measure
2014 Compact
target2014
Actual
Financial Return on total average assets % 11,4 10,5
Tariffs Average tariff increases – General freight business (GFB)
% 7,9 7,6
Market share Volume Total volumes mt 229,7 210,4
Bulk – Export coal mt 77,0 68,2– Export iron ore mt 61,5 54,3– Export manganese (PE) mt 5,1 5,0– Export manganese (DBN) mt 1,3 1,0– Export coal non-RBCT mt 6,2 4,9– Eskom coal(a) mt 11,8 11,9– Domestic coal mt 8,9 7,8– Chrome and ferrochrome mt 5,2 4,7– Domestic iron ore mt 7,9 7,3– Domestic manganese mt 1,9 2,0– Mineral mining mt 13,0 13,4– Other mt 2,5 2,1
Intermediate
manufacturing and
manufacturing
– Agriculture mt 4,6 3,5– Bulk liquids mt 2,1 1,9– Iron and steel mt 0,8 0,6– Wood and wood products mt 2,5 2,4– Fertilisers mt 0,1 0,1– Industrial chemicals mt 0,9 1,1– Cement mt 7,3 7,8– Intermodal wholesale mt 7,8 9,7– FMCG long distance mt 0,8 0,7– Automotive mt 0,5 0,3
Productivity Asset utilisation Iron ore Gtkm/Ntkm 1,4 1,4Export coal Gtkm/Ntkm 1,6 1,8GFB(b) Gtkm/Ntkm 1,7 1,5
Density Saldanha Tonkm/Routekm
55,3 57,3
RBaycor Tonkm/Routekm
36,2 37,4
Natalcor Tonkm/Routekm
6,7 7,0
NEastcor Tonkm/Routekm
5,7 7,0
Sentracor Tonkm/Routekm
4,3 5,0
Capecor Tonkm/Routekm
3,9 4,0
NWestcor Tonkm/Routekm
3,8 4,2
Eastcor Tonkm/Routekm
3,2 3,0
Southcor Tonkm/Routekm
2,6 2,9
Northcor Tonkm/Routekm
1,6 1,7
(a) 11,8mt gross; 11,5mt net.(b) GFB asset utilisation will be further broken down in the 2015 Shareholder’s Compact.

ANNUAL FINANCIAL STATEMENTS 201414
REPORT OF THE DIRECTORS FOR THE YEAR ENDED 31 MARCH 2014(continued)
Key performance area
Key performance indicator
Unit of measure
2014 Compact
target2014
Actual
Service On-time departure – Export coal Average deviation from scheduled times (minutes)
120 43– Export iron ore 60 9– GFB 225 213
On-time arrival – Export coal Average deviation from scheduled times (minutes)
240 134– Export iron ore 120 129– GFB 260 340
Transnet Engineering
Key performance area
Key performance indicator
Unit of measure
2014 Compact target
2014 Actual
Financial External revenue R million 2 633 1 616Innovation Research and development cost R million 150 79Volume growth(a) Train cancellations due to traction % 6 4
Net volume lost due to traction mt 7 2,6Traction delays % 40 6
(a) Volume growth to be separated into export iron ore, export coal and GFB for the 2015 Shareholder’s Compact.
Transnet National Ports Authority
Key performance area
Key performance indicator
Unit of measure
2014 Compact target
2014 Actual
Productivity Anchorage – Durban Hours 46 57
– Cape Town 35 35
– Port Elizabeth 84 25
– Ngqura 32 49
– Richards Bay 30 57
Ship turnaround time(a) Containers
– Durban Hours 59 58
– Cape Town 30 29
– Port Elizabeth 26 26
– Port of East London 60 52
– Richards Bay 110 70
– Ngqura 29 44
Dry bulk
– Coal (RBCT) Hours 47 45
– Iron ore (Saldanha) 55 47
– Manganese (PE) 69 73
Berth occupancy – Durban % 85 78
– Cape Town 70 67
– Port Elizabeth 50 55
– Ngqura 75 68
Berth utilisation – Durban % 80 76
– Cape Town 70 62
– Port Elizabeth 60 51
– Ngqura 75 70
– East London 40 31(b)
– Richards Bay 40 73(b)
(a) Shipping delays to be quantified and reported on a quarterly basis.(b) Transnet will measure and report quarterly on berth utilisation at the Ports of East London and Richards Bay.

15
Transnet Port Terminals
Key performance area
Key performance indicator Unit of measure
2014 Compact target
2014 Actual
Financial Return on total average assets % 5,8 7,0
Tariff increases Average tariff increase (containers) % 6 4,6
Productivity Dwell time DCT – Pier 1
– Imports Days 3 2,7
– Exports Days 5 4,9
– Transshipment(a) Days 10 6,3
DCT – Pier 2
– Imports Days 3 1,9
– Exports Days 5 5,4
– Transshipment Days 10 8,0
CTCT
– Imports Days 3 2,2
– Exports Days 5 4,9
– Transshipment Days 15 7,6
Moves per gross crane hour(b)
DCT – Pier 1 Moves/GCH 28 24
DCT – Pier 2 (prime berths 108, 203, 204)
30 25
CTCT 32 34
Ngqura 32 26
Service delivery Train turnaround time DCT – Pier 1 Hours 6 3
DCT – Pier 2 Hours 6 5
CTCT Hours 6 2
Saldanha(c) Minutes 105 104
Richards Bay Hours 12 9
Port Elizabeth Hours 12 10
Truck turnaround time DCT – Pier 1 Minutes 35 44
DCT – Pier 2 Minutes 35 38
CTCT Minutes 35 20
Ngqura Minutes 35 35
Richards Bay Minutes 35 21
(a) Transnet Port Terminals shall not encourage transshipment dwell times of greater than five days. (b) Transnet Port Terminals shall report on moves/GCH for the Ports of Richards Bay and East London on a quarterly basis.(c) Rake process time inside tippler – subject to service design review.
Transnet Pipelines
Key performance area
Key performance indicator Unit of measure 2014 Compact target
2014 Actual
Service reliability Ordered versus delivered volumes (% of deliveries within 5% of order)
% 95 99
Planned versus actual delivery time (% of deliveries within two hours of plan)
% 80 82
Operating cost per Mℓ.km (Nominal R/Mℓ.km)
Rand 122 99
Capacity utilisation
NMPP – actual usage (Mℓ/week) Ratio 48:84 51:84
Market share Total petroleum products Billion litres 16,75 16,58

ANNUAL FINANCIAL STATEMENTS 201416
REPORT OF THE DIRECTORS FOR THE YEAR ENDED 31 MARCH 2014(continued)
Accounting policiesThe accounting policies applied in the preparation of the annual financial statements for the year ended 31 March 2014 are in accordance with IFRS and are consistent with those applied in the prior year except for the adoption of new and revised IFRS as described on pages 52 and 53.
Judgements made by management in the application of IFRS that have a significant impact on the annual financial statements are disclosed in the accompanying notes to the annual financial statements.
Share capitalThere has been no change in the authorised or issued share capital of the Company during the year. The issued share capital of the Company is 12 660 986 310 ordinary shares of R1 each. Further details pertaining to the Company’s share capital are contained in note 21 to the annual financial statements.
DividendsNo dividends were declared in the current year. The dividend policy is reviewed annually and approved by the
the capital investment programme. The policy provides that dividends will be declared to the Shareholder
are maintained.
Divisions, subsidiaries and associate companiesThe Company intends to finalise the liquidation of Spoornet do Brasil Ltda (SdbL) during the course of the next financial year. A detailed list of subsidiaries and associate companies are contained in annexure D to the annual financial statements.
Revaluation of property, plant and equipment – port facilities and pipeline networksThe accounting policies of the Company require port infrastructure assets, port operating assets and pipeline networks to be carried at revalued amounts. A full revaluation of these assets is conducted every three years, with an index revaluation being performed in the intervening years.
During the current year, a full revaluation was performed on port operating assets by independent valuation experts, Deloitte & Touche, using the depreciated replacement cost approach. Index valuations were applied to port infrastructure and pipeline networks.
Port facilities
The carrying value of port infrastructure was revalued by R6 838 million (2013: R1 063 million) and port operating assets were revalued by R945 million (2013: R262 million).
Pipeline networks
The carrying value of pipeline networks was revalued by R467 million (2013: R423 million).
Capital expenditure and commitmentsThe Group’s capital investment for the year ended 31 March 2014 amounted to R31,8 billion (excluding capitalised borrowing costs), a 15,6% increase from the prior year’s investment of R27,5 billion. R13,3 billion was invested in the expansion of current infrastructure and equipment, while R18,5 billion was invested in maintaining existing capacity. The Group has achieved 111,2% of the R28,6 billion capital expenditure budget for the year.
Further details regarding capital expenditure and commitments are contained in note 30 of the annual financial statements.
FundingAs at 31 March 2014, the Company’s total borrowings amounted to R90,4 billion (2013: R73,1 billion), an increase of R17,3 billion compared to the prior year. This increase can be attributed mainly to the R5 billion
various sources including Development Finance Institutions (DFIs), Export Credit Agencies (ECAs), domestic bonds, commercial paper and bank loans.

17
As a result of the additional funding raised, the gearing ratio deteriorated to 45,9% compared to the 44,6% at 31 March 2013. This level is still below the Group’s target range of 50,0%, reflecting the additional capacity available to fund future capital expenditure. The gearing ratio is not expected to exceed the target ratio over the medium term.
Credit rating
Transnet is officially rated by two credit rating agencies, namely, Standard and Poor’s (S&P) and Moody’s. Both credit rating agencies have introduced new rating methodologies. However, Transnet’s credit rating grade did not change under the new reviewing approach. Thus, the rating agencies confirmed that Transnet's credit rating remained unchanged at the issuer grade of BBB and a standalone of BBB+ from S&P and A3 with a standalone of A3 from Moody’s, both with a negative outlook. Transnet’s credit rating is depicted below:
Long-term rating category Standard & Poor’s Moody’s
Foreign currency BBB A3
Local currency A- Baa1
National rating Aa3.za
Rating outlook Negative Negative
of South Africa’s rating is likely to lead to a downgrade for Transnet. However, it will take a downgrade of a further 1 notch by Standard and Poor’s and 3 notches by Moody’s for Transnet to be sub-investment grade, which could negatively impact the funding programme.
Post-retirement benefit obligationsBenefit funds
The Group provides various post-retirement benefits to its active and retired employees, including pension, post-retirement medical and other benefits. The two defined benefit funds, namely the Transnet Sub-fund of the Transport Pension Fund (TTPF) and the Transnet Second Defined Benefit Fund (TSDBF), are fully funded with actuarial surpluses of R2,3 billion (2013: R1,7 billion) and R2,6 billion (2013: R2,3 billion) respectively. Transnet has not recognised any portion of the surplus on these funds, as the fund rules at present do not allow for the distribution of a surplus to the Group.
The Board of Trustees of the TTPF and TSDBF approved the payment of ad hoc bonuses to their beneficiaries amounting to R17 million and R161 million respectively, and paid these amounts in November 2013. The total value of ad hoc bonuses paid by the TTPF and TSDBF to their beneficiaries amounts to R142 million and R1,9 billion respectively. The Board of Trustees of the TTPF and TSDBF have also approved the payment of a further ad hoc bonus to their beneficiaries amounting to R18 million and R160 million respectively, and paid this amount in April 2014.
These payments continue to supplement the current statutory increase of the beneficiaries of the TTPF and TSDBF to provide pensioners with increases above CPI.
In addition to the payments by the TTPF and TSDBF, Transnet has again made an ex gratia payment to its most disadvantaged pensioners of both the TTPF and TSDBF, amounting to R70 million in September 2013. The payment has been made in particular to those pensioners with very low pensions despite long service. This brings the total amount of ex gratia payments made by Transnet to beneficiaries of the defined benefit funds to R448 million.
In addition, Transnet has again made provision for an ex gratia payment to its most disadvantaged pensioners of the TTPF and TSDBF of R75 million.
Following the recommendations made by the Portfolio Committee on Public Enterprises, prospective pension increase policies have been developed by the TTPF and TSDBF targeting additional increases that will not vest, and are with the Shareholder Representative for approval, together with the concurrence of the Minister of Finance.

ANNUAL FINANCIAL STATEMENTS 201418
REPORT OF THE DIRECTORS FOR THE YEAR ENDED 31 MARCH 2014(continued)
SATS pensioners’ post-retirement medical benefit obligations
Transnet is committed to identifying a sustainable long-term solution for the provision of medical scheme benefits to SATS pensioners and their dependants.
The post-retirement medical benefit obligation is approximately R1,2 billion as at 31 March 2014 (2013: R1,4 billion).
Passenger Rail Agency of South Africa (PRASA)The total amount owed by PRASA at 31 March 2014 was R1,8 billion (March 2013: R1,4 billion). PRASA paid R758 million (March 2013: R1,2 billion) to Transnet for the year ended 31 March 2014.
Subsequent to year end the Board of Directors approved the write-off of an amount of R641 million in relation to the PRASA debt, taking into consideration PRASA’s funding constraints. In addition, PRASA paid Transnet an amount of R400 million in relation to the debt as at 31 March 2014.
Transnet remains committed to working with PRASA in providing passenger rail services in South Africa.
Compliance and legislationTo the best knowledge and belief of the Board of Directors, the Company has, during the year, complied, in all material respects, with all legislation and regulations applicable to it, except as noted below.
PFMA compliance
Transnet has implemented and maintained sound governance structures and processes in compliance with the provisions of the PFMA. PFMA compliance is one of the key business issues that the Company manages and monitors. This monitoring function is achieved through the following:
Representative and cascaded throughout the Company.
Sections 51 and 55 of the PFMA impose certain obligations on the Company relating to the prevention,
To comply with the PFMA’s obligations, the Board of Directors has a materiality framework, which was
The Shareholder Representative has determined that the materiality limit for reporting in terms of sections 55(2)(b)(i), (ii) and (iii) of the PFMA is R25 million per transaction.
Due to significant management focus and attention, the Board of Directors is pleased to report a decrease in all categories of reportable expenditure in terms of the PFMA. The most significant improvement recorded is in the area of irregular expenditure which has reduced from R230,8 million to only R49,6 million.
Category of reportable items R millionNumber of
incidents
Number of finalised
disciplinaries/criminal cases
Fruitless and wasteful expenditure*** 13,0 32* 21/0
Losses through criminal conduct*** 39,9 54* 10/334
Non-collection of revenue*** 0,8 1 2/0
Total irregular expenditure*** 49,6** 18 7/0Less: Irregular expenditure condoned*** (6,8) (4) 0/0
Remaining irregular expenditure*** 42,8 14 7/0
* Represents cumulative reportable items of the same nature.** Includes an item under investigation pending finalisation.*** Refer to annexure E for further disclosure.
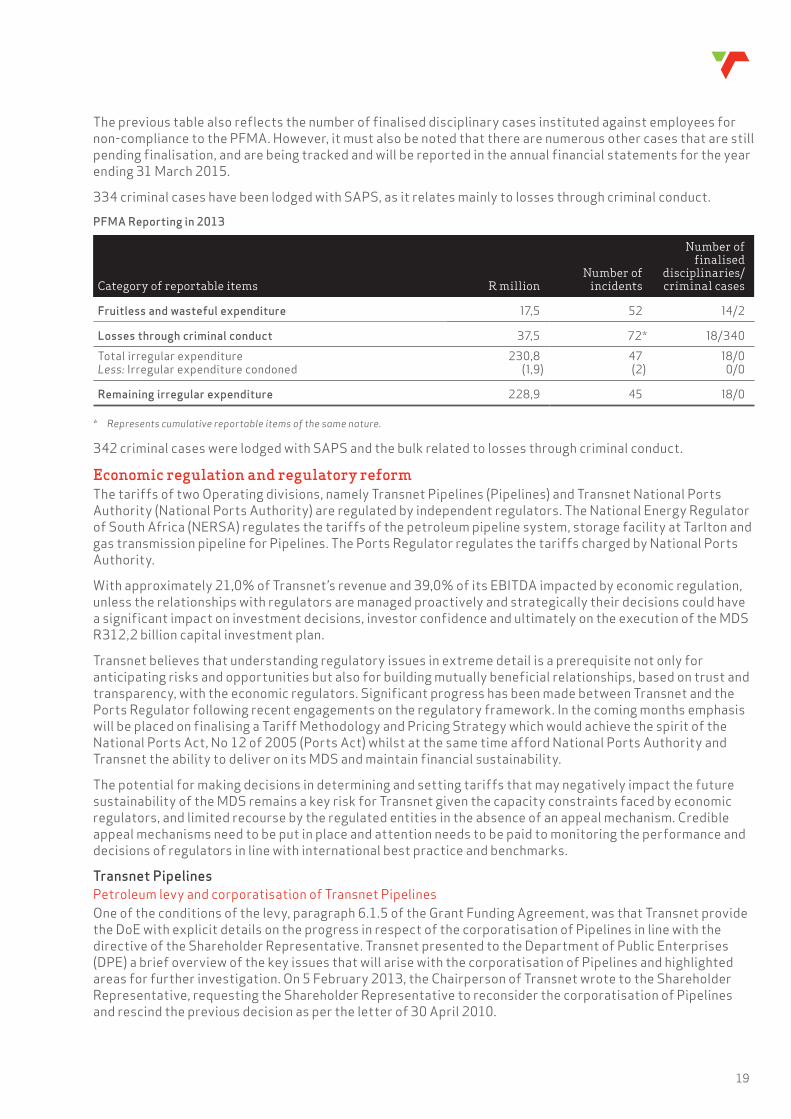
19
The previous table also reflects the number of finalised disciplinary cases instituted against employees for non-compliance to the PFMA. However, it must also be noted that there are numerous other cases that are still pending finalisation, and are being tracked and will be reported in the annual financial statements for the year ending 31 March 2015.
334 criminal cases have been lodged with SAPS, as it relates mainly to losses through criminal conduct.
PFMA Reporting in 2013
Category of reportable items R millionNumber of
incidents
Number of finalised
disciplinaries/criminal cases
Fruitless and wasteful expenditure 17,5 52 14/2
Losses through criminal conduct 37,5 72* 18/340Total irregular expenditure 230,8 47 18/0Less: Irregular expenditure condoned (1,9) (2) 0/0
Remaining irregular expenditure 228,9 45 18/0
* Represents cumulative reportable items of the same nature.
342 criminal cases were lodged with SAPS and the bulk related to losses through criminal conduct.
Economic regulation and regulatory reformThe tariffs of two Operating divisions, namely Transnet Pipelines (Pipelines) and Transnet National Ports Authority (National Ports Authority) are regulated by independent regulators. The National Energy Regulator of South Africa (NERSA) regulates the tariffs of the petroleum pipeline system, storage facility at Tarlton and gas transmission pipeline for Pipelines. The Ports Regulator regulates the tariffs charged by National Ports Authority.
With approximately 21,0% of Transnet’s revenue and 39,0% of its EBITDA impacted by economic regulation, unless the relationships with regulators are managed proactively and strategically their decisions could have a significant impact on investment decisions, investor confidence and ultimately on the execution of the MDS R312,2 billion capital investment plan.
Transnet believes that understanding regulatory issues in extreme detail is a prerequisite not only for anticipating risks and opportunities but also for building mutually beneficial relationships, based on trust and transparency, with the economic regulators. Significant progress has been made between Transnet and the Ports Regulator following recent engagements on the regulatory framework. In the coming months emphasis will be placed on finalising a Tariff Methodology and Pricing Strategy which would achieve the spirit of the National Ports Act, No 12 of 2005 (Ports Act) whilst at the same time afford National Ports Authority and Transnet the ability to deliver on its MDS and maintain financial sustainability.
The potential for making decisions in determining and setting tariffs that may negatively impact the future sustainability of the MDS remains a key risk for Transnet given the capacity constraints faced by economic regulators, and limited recourse by the regulated entities in the absence of an appeal mechanism. Credible appeal mechanisms need to be put in place and attention needs to be paid to monitoring the performance and decisions of regulators in line with international best practice and benchmarks.
Transnet Pipelines
Petroleum levy and corporatisation of Transnet PipelinesOne of the conditions of the levy, paragraph 6.1.5 of the Grant Funding Agreement, was that Transnet provide the DoE with explicit details on the progress in respect of the corporatisation of Pipelines in line with the directive of the Shareholder Representative. Transnet presented to the Department of Public Enterprises (DPE) a brief overview of the key issues that will arise with the corporatisation of Pipelines and highlighted areas for further investigation. On 5 February 2013, the Chairperson of Transnet wrote to the Shareholder Representative, requesting the Shareholder Representative to reconsider the corporatisation of Pipelines and rescind the previous decision as per the letter of 30 April 2010.

ANNUAL FINANCIAL STATEMENTS 201420
On 24 May 2013, the Shareholder Representative responded to the Chairperson of Transnet stating that he has written to the Ministers of Finance and Energy recommending that the condition for Pipelines to be corporatised be waived at this point in time. The Shareholder Representative also informed Transnet that it would therefore be required to provide audited ringfenced divisional accounts since the granting of the levy. The Shareholder Representative further pointed out that in the future there may be a government imperative which needs to be fulfilled and would necessitate the need for the corporatisation of Pipelines. Should this be the case, it may be necessary to resuscitate the issue of corporatisation. Transnet awaits the response from the Ministers of Finance and Energy through the office of the Shareholder Representative.
The potential corporatisation of Pipelines poses significant risks to Transnet, as it could have a material adverse impact on Transnet, both financially and strategically, and could constitute an event of default under some of Transnet’s funding agreements.
TariffsOn 31 July 2013, Transnet submitted its 2015 Petroleum Pipeline System Tariff Application in terms of section 4(f) of the Petroleum Pipelines Act, No 60 of 2003. The tariff application has been guided by the National Energy Regulator of South Africa’s (NERSA) 'Tariff Methodology for the Setting of Tariffs in the Petroleum Pipelines Industry, 5th Edition' approved on 31 March 2011 (the methodology).
Transnet has filed for a revenue requirement of R3 351,48 million for the 2015 tariff period, a 19,88% increase in revenue from the 2014 allowable revenue of R2 795,61 million as was set by NERSA. At the public hearing, 6 February 2014, Pipelines amended its tariff application requesting an allowable revenue increase of 1,54% to R2 838,5 million. With this amendment Pipelines indicated that the Coastal Accumulation Facility will come into operation on 1 April 2015 and the Inland Accumulation Facility on 1 October 2014.
On 13 March 2014, NERSA made its final tariff determination for the Transnet petroleum pipeline system. NERSA approved an allowable revenue increase of 5,08% to R2 937,74 million.
Transnet National Ports Authority
The potential corporatisation of Transnet National Ports AuthorityThe National Ports Act, No 12 of 2005 (Ports Act) provides for the corporatisation of National Ports Authority. On 17 June 2008, the Government, through the President of the Republic of South Africa, informed Transnet in writing that it would not initiate the corporatisation process and that appropriate amendments to the Ports Act will be considered.
On 28 September 2012, at a National Ports Consultative Committee Meeting (NPCC) held in Cape Town between port stakeholders and National Ports Authority, the issue of National Ports Authority corporatisation was tabled. The consensus of the NPCC members, representing the Department of Public Enterprises (DPE), Department of Transport (DoT), Department of Trade and Industry (DTI), port users and the Ports Regulator, was that changes to the section 3(2) of the Ports Act and other relevant sections of the Ports Act be effected.
On 10 January 2013 a letter was sent to the Shareholder Representative as a recommendation to take the process of legislative review forward in the least cumbersome way possible. To this end, Transnet recommended a one worded amendment to the Ports Act which would have the effect of giving the Shareholder Representative the discretion to corporatise instead of the current obligatory provision in section 3(2) which mandates the Shareholder Representative to corporatise without any discretion in this regard. This can be done by substituting the word 'must' with the word 'may' in section 3(2) of the Ports Act.
On 10 June 2013, DoT informed Transnet of The National Ports Act Amendment Bill, 2013, which states that section 3 of the principal Act is hereby amended by the substitution of section 3(2) for the following:'As soon as this Act takes effect, the shareholding Minster [must] may ensure that the necessary steps are taken for the incorporation of the National Port Authority of South Africa as a company contemplated in subsection 3.'
Transnet awaits the finalisation of this amendment. Transnet is currently conducting a comprehensive review of all aspects of the Ports Act, to be tabled at the next meeting of the NPCC and presented to the DPE for discussions with the DoT.
REPORT OF THE DIRECTORS FOR THE YEAR ENDED 31 MARCH 2014(continued)

21
The engagements between Transnet and DPE are aimed at ensuring that the appropriate amendments to the Ports Act are effected. The potential corporatisation of National Ports Authority poses significant risks to Transnet, as it could have a material adverse impact on the Company, both financially and strategically, and could trigger default clauses of Transnet’s funding agreements.
National Environmental Management: Integrated Coastal Management Act, No 24 of 2008 Amendment BillThe Integrated Coastal Management Act contains a number of sections detrimental to Transnet which the Bill issued in March 2011, still fails to address. The main issue for Transnet revolves around section 11 of the Act (not yet in operation) which provides that coastal public property vests in the citizens of South Africa and is held in trust by the State. The effect of this provision would be to deprive Transnet of its ownership of the assets in the sea, seashore and the seabed within ports (estimated at R46 billion as at 31 March 2013).
Transnet submitted its comments to the Department of Environmental Affairs in March 2011 and it simultaneously raised the matter with the Department of Public Enterprises for the Minister to intervene at a ministerial level. During July 2012 a revised version of the ICM Bill was issued which to some extent addressed some of Transnet’s concerns. However, Transnet feels that there are certain areas of the latest version of the Bill which could negatively impact on how Transnet conducts its business going forward. Transnet has also been advised by senior counsel that the current version of the Bill may still result in Transnet losing ownership of its assets in the sea, seashore and seabed within ports.
The Chairman has written to the Minister of Water and Environmental Affairs on 31 March 2014, wherein an exemption from section 11 of the Act has been requested. A response hereto is awaited from the Minister’s office.
TariffsOn 13 September 2013, National Ports Authority submitted its 2015 tariff application to the Ports Regulator (Regulator) in terms of section 72(1)(a) of the National Ports Act, No 12 of 2005 and the Interim Regulatory Manual (IRM), applicable to the 2015 tariff year. Application of the IRM resulted in a revenue requirement of R10 947 million comprising of real estate business revenue of R2 113 million and marine business revenue of
Given the significant nature of Transnet’s investments through its MDS, National Ports Authority and Transnet Group has considered its role of facilitating economic growth and its commitment to reducing the cost of doing business in South Africa. National Ports Authority is of the view that it can deliver on the planned execution of the MDS with marine business cash revenue of R8 380 million. For the 2015 financial year, the National Ports Authority therefore applied to the Regulator for a revenue of R10 493 million comprising marine business revenue of R8 380 million and real estate business revenue of R2 113 million. This translates
The difference between 14,39% and the 8,5% has been addressed by requesting a reduction of Excessive Tariff Increase Margin Credit (ETIMC) provision created by the Regulator as part of previous tariff determinations.
On 28 March 2014, the Regulator issued the National Ports Authority 2015 Tariff Determination Statement. The Regulator decided to approve the following specific tariffs as set out in the tariff book:
(ii) 8,15% tariff increase on all marine services and related tariffs, (sections 1-8 of the tariff book excluding
(iii) 8,15% tariff increase in dry bulk cargo dues for coal , iron ore and manganese.

ANNUAL FINANCIAL STATEMENTS 201422
REPORT OF THE DIRECTORS FOR THE YEAR ENDED 31 MARCH 2014(continued)
The Regulator increased the required revenue from R9 838 million (2014 decision) to R10 674 million, which consisted of marine business revenue of R8 562 million and real estate business revenue of R2 112 million.
Port of Ngqura licenceIn January 2012 the Minister of Transport issued a directive and on 3 October 2012 issued an amendment thereto directing National Ports Authority, in terms of section 79 of the National Ports Act, to issue Transnet
National Ports Authority commencing a public process to licence an operator in terms of section 56.
The decision to limit Port Terminal’s operation at the Ngqura Container Terminal to three years and the requirement for National Ports Authority to undertake a section 56 process would have economic, legal and
(a) The period Port Terminals was allowed to operate the Ngqura Container Terminal did not give Port Terminals sufficient opportunity to recover its investment in the terminal which includes both the capital investment and operating expenses incurred during the initial period of operation when the developing volume container traffic was insufficient to cover Port Terminal’s expenses and to allow a reasonable return.
(b) The concessioning of the Ngqura Container Terminal was likely to run counter to the national, strategic and economic interests of the Republic and these interests are best promoted through Port Terminal’s continued operation of the terminal.
2013, to issue a directive in terms of section 79(1), directing National Ports Authority to issue a licence to Port Terminals to operate the Ngqura Container Terminal for a period of 20 years on the basis that the direction is necessary to promote the national, strategic and economic interests of this country.
suspend the section 56 process at the container terminal. National Ports Authority complied with the directive immediately and addressed a letter to the Minister of Transport seeking clarity on the way forward.
relevant to the matter. These were provided by National Ports Authority on 20 January 2014. A final response from the Minister of Transport is awaited.
Freight Rail
The DoT Draft Green Paper on Rail Reform was issued to various stakeholders in April 2012 for comment. Transnet, supported by the DPE, presented its position to DoT and engagements are ongoing to ensure alignment before the Draft Green Paper is submitted to Cabinet.
DPE hosted numerous workshops with DoT and Transnet Freight Rail (Freight Rail) for information sharing and alignment.
During these meetings, DoT acknowledged the value of the MDS and that the proposed rail policy should not
explicit about short, medium and long-term interventions over a period of 30-40 years.
DoT also acknowledges that the policy does not provide sufficient details, and is not explicit in other areas and that more analysis needs to be done in consultation with DPE/Freight Rail/National Treasury. Discussion and alignment is still required on:

23
Railway safety permit fee
The Railway Safety Regulator (RSR) and DoT intend to implement a new rail safety permit fee methodology which will be utilised to levy safety permit fees. In terms of section 23 of the National Railway Safety Regulator Act, 2002, the Minister of Transport must annually determine fees that the Regulator must charge for safety permits. The RSR has advised the rail industry that it requires the rail industry to fund 60% of its operating costs, being the shortfall in the RSR’s budget. The impact to Transnet is that Transnet’s overall rail safety permit fees will increase by 161% from R24 515 800 to R63 970 895, with Freight Rail being the most significantly impacted Operating Division. Transnet will fund approximately 91% of the shortfall in the RSR
has written to the Shareholder Representative requesting an engagement between the Minister of Transport and the Shareholder Representative.
Memorandum of IncorporationThe Company’s new Memorandum of Incorporation, aligned with the provisions of the Companies Act was approved by the Shareholder Representative at the annual general meeting on 25 June 2013. The approved Memorandum of Incorporation was subsequently filed with the Companies and Intellectual Property Commission on 1 July 2013. The Company received confirmation from the Companies and Intellectual Property Commission that the Memorandum of Incorporation was ‘Accepted and Filed’ on 25 November 2013.
Judicial proceedings
entered into by Transnet, as either defendant or plaintiff, where the outcome can be assessed with reasonable certainty. These estimates take into account the legal opinions obtained for the Group. The contingent liabilities of the Group have been disclosed in note 31 to the annual financial statements.
Transnet pensioners’ application
Transnet received a Notice of Motion in terms of which two Transnet pensioners have applied to the North Gauteng High Court to institute a class action against seven respondents, including Transnet. Should the
Benefit Fund and the Transport Pension Fund: Transnet Sub-fund. Transnet is of the view that the case has no merit and is opposing the application.
All seven respondents have filed their Heads of Argument and the application will be heard during the week of 21 to 25 July 2014.
MV Smart notice of claim
National Ports Authority received a notice of claim for the loss of cargo during the grounding of the MV Smart vessel on 19 August 2013. Transnet remains confident that it is not liable for any such claims. No legal proceedings have been instituted to date.
Going concernThe successful execution of the Market Demand Strategy is critical to Transnet as it forms the basis of future growth for the Company and the South African economy. Consequently the successful execution of the borrowing strategy and the ability of the Company to meet its commitments to investors are of paramount importance.
Given the dynamic management reporting approach to achieve the agreed financial metrics and improve profitability based on operating and financial indicators, the Board of Directors are confident that the Company will be a going concern for the foreseeable future.
The funding requirement for the next 15 months to 30 June 2015 is R19,6 billion, including the cash buffer of R1 billion. Sufficient facilities are available to Transnet (detailed in the following table) thus enabling the Company to adequately diversify its funding and minimise exposure to financial risk.

ANNUAL FINANCIAL STATEMENTS 201424
REPORT OF THE DIRECTORS FOR THE YEAR ENDED 31 MARCH 2014(continued)
Sources of funding R million
Cash on hand at 31 March 2014 3,6GMTN 5,7DMTN 8,0ECAs 3,0DFIs 8,0Other loans 6,9Committed facilities 7,6
Total 42,8
The Board of Directors, having considered all significant variables that may impact the Group’s cash flow requirements, are of the opinion that adequate funding is available. This, together with the fact that the
supports the going-concern assumption as appropriate in the preparation of the Group results for the year ended 31 March 2014.
Remuneration report Introduction
The remuneration report details the Transnet remuneration philosophy as well as the reward interventions that occurred during the 2014 reporting period for non-executive directors, members of the Group and Operating divisional executive committees, managers and bargaining unit employees.
Terminology
For the purposes of this report:
specialists and technicians.
The Transnet reward philosophy
dispensation that:
Transnet is committed to rewarding existing high performing and prospective employees with competitive and sector comparable packages. However, it is recognised that the recruitment pool for this talent will also include other public and private sector employers, who have greater financial flexibility at their disposal. In view of this, Transnet will continue to consider and introduce clear and transparent reward packages that are both affordable and recognise either individual or team high performance.
The Transnet Remuneration Philosophy and Framework form an integrated part of the key deliverables of the Human Resources Strategy and therefore the reward strategies remain focused on entrenching a performance driven culture.

25
Transnet has embarked on the robust MDS which entails the achievement of rigorous financial and operational
MDS. The successful execution of the MDS, not only serves the interest of Transnet, but will hugely impact the South African economy.
The Human Resources strategy, inclusive of the reward strategy, is designed to facilitate the achievement of
Objectives of the remuneration strategy
– Comply with employment and taxation legislation.
The different reward elements are discussed in detail in the paragraphs below:
Guaranteed pay
The remuneration philosophy for Transnet takes into account the different hierarchical levels informed by
Executive and management levels are remunerated on a total cost to company basis, first line managers,
benefits dispensation.
In general, guaranteed remuneration is based on the market median. Salary increases occur annually, based on an approved mandate obtained from the Remuneration Social and Ethics Committee of the Board of Directors and motivated by the specific analyses of relevant internal and external factors. Annual increases for management levels are also informed by individual performance ratings. Increases for bargaining unit employees are informed by the outcome of the annual wage negotiation process. Transnet does not support interim/ad hoc salary increases.
retirement funding, risk cover and a death benefit.
Bargaining unit employees, who opt to become a member of one of the Transnet recognised medical schemes, are eligible to receive a medical subsidy.
MDS has resulted in a drive to review remuneration policies and practices across the business. The newly developed workforce plan will be implemented to ensure that the right skills are available at the right time to
During the past financial year, Transnet concluded a two-year wage agreement with the recognised unions. The current reporting period marks the second year of the two-year agreement. Transnet will, in the next financial year endeavour to again negotiate a multi-year wage agreement to ensure a stable workforce for the

ANNUAL FINANCIAL STATEMENTS 201426
REPORT OF THE DIRECTORS FOR THE YEAR ENDED 31 MARCH 2014(continued)
During the 2014 financial year, Transnet has implemented an amendment to the collective agreement governing the employment conditions for first line managers, specialists and technicians. The purpose of the amendment to the agreement was to address pay parity within this group of employees. To this effect, the amendment introduced entry threshold pay levels for the specific occupational categories covered by the agreement.
Negotiations in respect of the introduction of maximum pay levels and a method of pay progression for bargaining unit employees in the scope of the reward model agreement are still in progress. Towards the end of the reporting period, management and labour representatives went on a study tour to Brazil to benchmark pay progression practices in similar companies.
The Department of Public Enterprises has released the Remuneration and Incentive Standards for State-owned Companies early in 2014. Transnet has conducted a detailed analysis of the standards and is in process of reviewing the Transnet Remuneration Philosophy and Framework to align with the standards, where required. The revised Reward Philosophy will be finalised and rolled out during the 2015 financial year.
career path framework for managers, specialists and technical skills.
a culture and environment for superior performance which facilitates employee development and retention of critical and key skills.
Variable pay
Transnet has implemented a short- and a long-term incentive scheme.
The short-term incentive scheme is applicable to all employees and is governed by detailed ground rules, annually approved by the Remuneration, Social and Ethics Committee. The long-term incentive scheme is applicable to executive and selected senior managers.
performance indicators as stated in the Shareholder's Compact.
Management has a higher component of at-risk pay (variable pay) which is dependent on the achievement of
The detail of the short- and long-term incentive schemes are described in more detail below:
Short-term incentive scheme
business targets and to reward employees for this effort.
The bonus pool, funding the payment of the annual short-term incentive, is generated by the achievement of the 'Earnings before Interest, Taxation, Depreciation and Amortisation' (EBITDA) target. The pool is modified by a productivity measure relating to the key performance indicators as per the Shareholder's Compact as well as the safety achievement. The non-achievement of productivity and safety targets can reduce the bonus pool with up to 50%.
Employees on management levels qualify for an annual short-term incentive payment provided that the
level of the manager. Individual bonus percentages are further modified with individual performance assessment ratings.

27
In addition to the annual component of the short-term incentive scheme, a gain share incentive scheme was
unit employees could potentially earn:
secondary measure targets. Employees have the opportunity to gain up to a maximum of 16% per annum when super stretch business targets are exceeded (120% of EBITDA).
The combined annual and gain share components of the short-term incentive scheme allows bargaining unit
annual cost to company package for first line managers, specialists and technicians.
Long-term incentive scheme
achievement of the Transnet strategy, to retain key talent who ensure the success of the growth strategy, to encourage stretch performance and reward performance above target.
The LTI is designed on a three-year rolling basis to ensure sustained business performance and retention.
The value generated by the STI paid during a given year will generally be matched on a Rand for Rand basis as an LTI payable on the third anniversary of the STI payment.
Individual performance as well as the talent management framework informs key talent who may participate in the LTI. It further impacts on the vesting of the conditional award.
The LTI has specific clauses dealing with company performance over the banking period and to this effect a group modifier has been introduced. Return on total average assets (ROTA) (excluding capital work-in progress) are used as the Group LTI modifier. Targets are set on an annual basis and will also be included in the Transnet Corporate Plan.
The LTI scheme applies to the Group Executive Committee, Extended Executive Committee and key employees on the levels below Extended Executive Committee.
Individual performance management
Transnet has implemented the Balanced Scorecard Performance Management Methodology for the management category as well as for first line managers, specialists and technicians.
and then cascaded to all managers across Transnet. Performance in terms of the corporate as well as individual scorecards forms the basis for the determination of short-term incentive payments and annual increases.
Remuneration for Group Executives
effective 1 April 2013.
The table below depicts the guaranteed pay of the Group Executives for the 2014 financial year.

ANNUAL FINANCIAL STATEMENTS 201428
REPORT OF THE DIRECTORS FOR THE YEAR ENDED 31 MARCH 2014(continued)
Guaranteed pay of Transnet Group Executives
Executive Committee member
SalaryR thousand
Post-retirement
benefit fund contributions
R thousand
Othercontributions
R thousand
Otherpayments
R thousandTotal 2014
R thousandTotal 2013
R thousand
B Molefe** 5769 529 – 123 6 421 6 004
– – – – – 1 125
S Gama 4 370 311 – 119 4 800 4 537
M Gregg-Macdonald 2 726 265 – 117 3 108 2 873
CA Möller 3 015 238 – 2 3 255 3 047
T Morwe 3 467 247 6 2 3 722 3 694
M Moses+ – – – – – 1 699
KC Phihlela 3 231 216 – 82 3 529 3 335
A Singh** 3 797 348 – 177 4 322 3 529
KXT Socikwa 3 511 320 – 164 3 995 3 776
R Vallihu 3 449 272 – 159 3 880 3 553
EAN Sishi 2 659 259 – 35 2 953 2 780
DC Moephuli 2 561 272 – 2 2 835 450
S Pillay 2 032 171 – 2 2 205 1 068
NJ Mabandla 2 281 237 – 2 2 520 2 000
RE Lepule 2 658 259 2 2 919 1 853
MA Sukati@ 1 901 160 – 1 2 062 –
MA Matooane@ (Dr) 408 115 – – 523 –
47 835 4 219 6 989 53 049 45 323
** Group Executives who are members of the Board of Directors.@ Employed during the year. + Resigned during the prior year. Dr Doctor.
The recommendations as contained in the remuneration and incentive standards of the Department of Public Enterprises will be taken into consideration in terms of future increases for the Group Executives.
Executive remuneration – variable
The members of the Transnet Group Executive Committee qualify for an annual short-term incentive payment
Individual bonus percentages are further modified with individual performance assessment ratings.
The eligibility percentages linked to specific business performance achievement is indicated in the table below:
Employment category Grade level
Qualifying percentage
Threshold On-target Maximum
Group Executive Committee A 25% 50% 100%
Extended Executive Committee B 20% 40% 80%
Short– and long-term incentive payments
The short-term incentive payment for the 2014 financial year was based on the actual achievement of the annual EBITDA as well as the productivity and safety modifiers at Group and Operating Division levels.

29
The financial year 2014 marked the second year of the MDS and Transnet has posted reasonable achievements for the financial year, despite more difficult economic conditions and operational challenges compared to the prior year.
The 2011 conditional award in respect of the Transnet long-term incentive scheme vested at the end of the 2014 financial period. The value of the long-term incentive payment is impacted by the level of achievement
The members of the Group Executive Committee were eligible for payment in respect of the long-term incentive scheme based on the ground rules of the scheme.
The payment of these vested amounts will take place at the end of July 2014 following the conclusion of the annual financial statements.
The table below reflects the short– and long-term incentive payments for the Group Executives.
Transnet executive
LTI2014
R thousand
LTI2013
R thousand
STI2014
R thousand
STI2013
R thousand
B Molefe** – – 2 952 1 218
S Gama 2 653 3 583 2 259 928
M Gregg-Macdonald 2 115 2 349 1 447 607
CA Möller 2 036 2 592 1 001 629
T Morwe 1 964 3 079 1 297 738
KC Phihlela 2 381 2 771 1 645 667
A Singh** 2 857 1 942 1 989 802
KXT Socikwa 2 716 2 884 1 880 741
R Vallihu 2 199 3 041 1 781 720
DC Moephuli 1 199 1 927 1 336 497
S Pillay 893 1 467 1 045 375
NJ Mabandla – – 1 1 1 1 446
RE Lepule – – 1 361 319
EAN Sishi – – 1 353 564
MA Sukati@ – – 1 013 –
MA Matooane@ (Dr) – – 307 –
21 013 25 635 23 777 9 251
** Group Executives who are members of the Board of Directors.@ Employed during the year.Dr Doctor.
Remuneration structure for independent non-executive directors
Independent non-executive directors are appointed by the Shareholder Representative for a three-year term. The Memorandum of Incorporation of the Company, require that the independent non-executive directors be submitted for re-election for each of the three years at the Company’s annual general meeting. Among the issues considered by the Shareholder Representative prior to re-election is the individual independent non-executive director’s performance.
The Shareholder Representative approves, in advance, the fees payable to independent non-executive directors. The independent non-executive directors are paid an annual retainer as well as an additional retainer fee for committee membership.
Fees paid to independent non-executive directors are differentiated based on their appointments to the various Committees of the Board of Directors.

ANNUAL FINANCIAL STATEMENTS 201430
REPORT OF THE DIRECTORS FOR THE YEAR ENDED 31 MARCH 2014(continued)
At the 2013 annual general meeting, the Shareholder Representative approved a 5,0% fee increase with retrospective effect from 1 April 2013.
The table below depicts the actual remuneration for the independent non-executive directors for the 2014 financial year.
Independent non-executive directorsSalary
R thousand
Otherpayments
R thousand
Total 2014
R thousand
Total 2013
R thousand
ME Mkwanazi (Chairperson) 1 048 2 1 050 1 000
NBP Gcaba** – – – 156
MP Moyo** – – – 163
630 – 630 525
Y Forbes 653 _ 653 539
MA Fanucchi 472 – 472 450
NK Choubey* 98 – 98 375
HD Gazendam 634 – 634 564
IB Skosana**** 551 – 551 488
BD Mkhwanazi** – – – 163
– – – 187
N Moola 472 – 472 450
IM Sharma 551 – 551 488
574 – 574 501
DLJ Tshepe 630 – 630 506
NP Mnxasana 472 – 472 138
6 785 2 6 787 6 693
* Retired during the financial year.** Retired during the 2013 financial year.**** Director's fees paid to Kapela Investment Holdings (Pty) Limited.
The recommendations in respect of the fee structure for independent non-executive directors as contained in the Remuneration and Incentive Standards of the Department of Public Enterprises will be taken into consideration in determining the future fee structure for the independent non-executive directors.

31
Transnet SOC Ltd (the Company) is a company domiciled in South Africa.
The consolidated financial statements for the year ended 31 March 2014 comprise the Company and its
The consolidated financial statements were authorised for issue by the Board of Directors on 28 May 2014.
Statement of complianceThe consolidated financial statements have been prepared in accordance with International Financial Reporting Standards (IFRS) issued by the International Accounting Standards Board (IASB), interpretations of those standards issued by the International Financial Reporting Interpretations Committee (IFRIC) and applicable legislation.
Critical judgements and estimates
estimates and assumptions that affect the application of policies and reported amounts of equity, assets and liabilities, revenue and expenses.
The estimates and underlying assumptions are based on historical experience, independent experts’ advice and inputs and various other factors that are considered to be reasonable under the circumstances. Actual results may differ from these estimates.
The estimates and underlying assumptions are reviewed on an ongoing basis. Revisions to accounting estimates are recognised in the period in which the estimate is revised if the revision affects only that period or in the period of the revision and future periods if the revision affects both current and future periods.
Judgements and estimates made by management in the application of IFRS that have a significant effect on the financial statements are discussed in the relevant accounting policies below and the accompanying notes to the annual financial statements:
Summary of significant accounting policiesBasis of preparation
The consolidated financial statements of the Group (financial statements) are presented in South African Rand, rounded to the nearest million. The financial statements are prepared on the historical cost basis, except for the following assets and liabilities that are stated at fair value: unlisted investments, derivative financial instruments, financial instruments held at fair value through profit or loss, financial instruments classified as available-for-sale and investment properties. Certain classes of property, plant and equipment are carried at revalued amounts.
The financial statements are prepared on the going-concern basis.
Except as otherwise disclosed, these accounting policies are consistent with those applied in previous years and are consistently applied throughout the Group.
Basis of consolidationSubsidiaries
Subsidiaries (including consolidated structured entities such as trusts) are investee entities controlled by the Group. Control exists when the Group (a) has power over the investee, (b) is exposed, or has rights, to variable returns from its involvement with the investee, and (c) has the ability to use its power to affect its returns. The Group has power over an investee when it has existing substantive rights that give it the current ability to direct the relevant activities that significantly affect the returns of the investee. The consolidated financial statements include the results of the Company and its subsidiaries, from the effective dates of acquisition to the effective dates of disposal.
Business combinations
The acquisition method of accounting in accordance with IFRS 3 Business Combinations is applied in accounting for the acquisition of subsidiaries. The cost of an acquisition is measured as the sum of:
ACCOUNTING POLICIES FOR THE YEAR ENDED 31 MARCH 2014

ANNUAL FINANCIAL STATEMENTS 201432
Acquisition-related costs such as advisory, legal and accounting fees are recognised in profit or loss in the period in which they are incurred and the services received.
Identifiable assets acquired, liabilities and contingent liabilities assumed in a business combination are measured initially at their fair values at the acquisition date, irrespective of the extent of any non-controlling interest. Non-current assets acquired in a business combination that are classified as held-for-sale are measured in accordance with IFRS 5 Non-current Assets Held-for-sale and Discontinued Operations at fair value less costs to sell. The excess of the cost of acquisition over the fair value of the Group’s share in the net identifiable assets acquired and liabilities assumed is recognised as goodwill and accounted for in terms of the accounting policy on Intangible Assets and Goodwill. If the cost of acquisition is less than the fair value of the net assets acquired, the difference is recognised directly in profit or loss as a gain from a bargain purchase. The interest of the non-controlling shareholders is stated at their proportion of the fair value of the assets, liabilities and contingent liabilities recognised.
When the Group acquires a business, it assesses the identifiable assets and liabilities assumed for appropriate classification and designation in accordance with the contractual terms, economic circumstances and pertinent conditions as at the acquisition date. This includes the separation of embedded derivatives.
If the business combination is achieved in stages, the acquisition date fair value of the Group’s previously held equity interest in the acquiree is remeasured to fair value at the acquisition date through profit or loss.
Any contingent consideration to be transferred by the Group is recognised at fair value at the acquisition date. Subsequent changes to the fair value of the contingent consideration which is deemed to be an asset or liability will be recognised in accordance with IAS 39 Financial Instruments: Recognition and Measurement either in profit or loss or as a change to other comprehensive income. If the contingent consideration is classified as equity, it is not remeasured until it is finally settled within equity.
Losses incurred by a subsidiary are attributed to the non-controlling interest even if that results in a deficit balance.
Where there is a change in the interest in a subsidiary that does not result in a loss of control, the difference between the fair value of the consideration transferred or received and the amount by which the non-
in equity.
Where there is a change in the interest in a subsidiary that results in loss of control, the Group:
profit or loss or retained earnings, as appropriate.
Inter-company transactions, balances and unrealised gains on transactions between Group entities are eliminated. Unrealised losses are also eliminated unless the transaction provides evidence of an impairment of the asset transferred. All intra-group transactions, balances, income and expenses are eliminated in full on consolidation.
Accounting policies of subsidiaries have been changed where necessary to ensure consistency with the policies of the Group.
Investments in subsidiaries are carried at cost less any accumulated impairment losses in the Company financial statements.
Equity accounted investments
applies the equity accounting method to these investments which are carried in the statement of financial position at cost, including goodwill, plus the Group’s share of post-acquisition reserves less any accumulated impairment losses.
ACCOUNTING POLICIES FOR THE YEAR ENDED 31 MARCH 2014(continued)

33
Equity accounted income represents the Group’s proportionate share of the post-acquisition profits of the investee and the taxation thereon, net of the Group’s proportionate share of inter-group profits. Losses
financial statements until the investment is written down to a nominal value. Thereafter, losses are accounted for only to the extent that the Group is committed to providing financial support to the investee. The carrying amount of the investments is reduced to recognise any decline in value.
associate’s net assets is recognised as Goodwill and is included in the carrying value of the investment. If the cost of acquisition is less than the fair value of the net assets acquired, the difference is recognised immediately in profit or loss.
the unrealised losses provide evidence of an impairment of the asset transferred.
Investments in associates
of the financial and operating policies of the entity. Significant influence is presumed in instances where the Group has an equity stake greater than 20% but less than 50% in an entity.
Investments in associates are equity accounted in the consolidated financial statements for the period in which the Group exercises significant influence, except when the investment is classified as held-for-sale, in which case it is accounted for in accordance with IFRS 5 Non-current Assets Held-for-sale and Discontinued Operations.
Long-term loans to associates, which are part of the long-term investment, are treated as a part of the investment in the associates.
arrangement.
classified as held-for-sale, in which case it is accounted for in accordance with IFRS 5 Non-current Assets Held-for-sale and Discontinued Operations.
Separate financial statements
are carried at cost less any accumulated impairment losses.
RevenueRevenue is recognised at the fair value of the consideration received or receivable from the sale of goods and services in the ordinary course of the Group’s activities. Revenue is shown net of value added taxation, returns, rebates and discounts and after eliminating inter-group transactions.
The Group recognises revenue when the amount of revenue can be reliably measured, it is probable that future economic benefits will flow to the Group and when specific criteria have been met for each of the Group’s activities as described below. The Group bases its estimates on historical results, taking into consideration the type of customer, the type of transaction and the specific circumstances of each arrangement.
Where extended payment terms are granted by the Group, whether explicitly or implicitly, the effect of the time value of money is taken into account in the measurement of revenue irrespective of other factors such as the cash selling prices of the goods.
Rail transportation services
Revenue from rail freight and related services is recognised in profit or loss when the service is rendered by reference to the stage of completion of transactions as freight moves from the point of origin to destination.

ANNUAL FINANCIAL STATEMENTS 201434
ACCOUNTING POLICIES FOR THE YEAR ENDED 31 MARCH 2014(continued)
Engineering contracts revenue
Revenue arising from engineering contracts, including maintenance services is recognised when the outcome of the contract can be measured reliably by reference to the stage of completion of the contractual activity. Contract revenue includes the initial amount agreed in the contract plus any variations in contract work, claims and incentive payments receivable less penalties incurred to the extent that it is probable that they will result in revenue and can be measured reliably.
The stage of completion is assessed by reference to surveys of work performed. When the outcome of a construction contract cannot be estimated reliably, contract revenue is recognised only to the extent of contract costs incurred in the period that are likely to be recoverable. An expected loss on a contract is recognised immediately in profit or loss.
Ports revenue
Port infrastructure and related servicesPorts revenue comprise port dues, light dues, vessel traffic services, berthing services, towage and pilotage and similar services related to the provision of port infrastructure and facilities to clients. The revenue is recognised in the period in which the service is rendered in accordance with the tariff schedule.
Port operationsPort operating revenue comprises freight handling, storage and other services related to the handling and processing of cargo through port terminals. The revenue is recognised when the service is rendered.
Pipelines revenue
Revenue from the transportation of petroleum and gas products is recognised at the point of delivery in the period the service is rendered based on the contractual terms and the related volumes transported. Revenue from the storage and handling of petroleum products is recognised when services are rendered over the period of the contract.
Two of the Group’s Operating divisions, namely National Ports Authority and Pipelines are regulated entities
respectively. Both regulators apply the required revenue approach and the claw back mechanism in setting future revenues and tariffs. The timing of recognition of certain revenues in these rate-regulated operations reflects the economic impact of the regulators’ decisions regarding future revenues and tariffs arising from the application of the claw back mechanism.
under or over-recovery of revenue in the current period that is expected to be recovered or clawed back by the regulators in setting tariffs for future periods. The Group recognises a liability for amounts accrued in the current and prior periods in excess of the allowed revenue set by the regulator, less allowable expenses incurred in generating the excess revenue. The liability is subsequently released to revenue in the periods
discounted.
The net effect of over and under-recovery is disclosed as other liabilities in the statement of financial position.
Rental income
Revenue arising from the rental of property is recognised in profit or loss on a straight-line basis over the term of the lease in accordance with the substance of the relevant agreements. Lease incentives granted are recognised as an integral part of the total rental income.
Dividend income
Dividend income is recognised in profit or loss on the date the Group’s right to receive payments is established, which in the case of quoted securities is usually the ex-dividend date.
Government grants
Government grants are recognised at fair value when there is reasonable assurance that the grant will be received and all relevant conditions will be complied with.

35
Where the grant relates to an expense item, it is recognised as income over the periods necessary to match the grant on a systematic basis to the costs that it is intended to compensate.
Where the grant relates to an asset, the fair value is credited to a deferred income account and is released to profit or loss over the expected useful life of the relevant asset on a straight-line basis.
Transactions giving rise to adjustments to revenue/purchases
The Group accounts for cash discounts and rebates received/(given) as follows:
deducted from the cost of inventories purchased.
Finance incomeFinance income is accrued on a time basis, by reference to the principal outstanding and the effective interest rate applicable, which is the rate that exactly discounts estimated future cash receipts through the expected life of the financial asset to the asset’s net carrying amount.
Finance costsFinance costs comprise interest payable on borrowings calculated using the effective interest rate method, dividends on redeemable preference shares, amortisation of discounts on bonds and foreign exchange gains or losses, less amounts capitalised to qualifying assets.
Capitalised borrowing costs
The Group capitalises borrowing costs that are directly attributable to the acquisition, construction or production of a qualifying asset, as part of the cost of that asset, until such time that the asset is substantially ready for its intended use. The Group identifies a qualifying asset as one that necessarily takes six months or more to get ready for its intended use.
To the extent that funds are borrowed specifically for the purpose of obtaining a qualifying asset, the Group capitalises the actual borrowing costs incurred on that borrowing during the period less any investment income on the temporary investment of the borrowed funds.
To the extent that a qualifying asset is funded via general borrowings, the Group determines borrowing costs eligible for capitalisation by applying the weighted average cost of borrowings for the period, other than borrowings made specifically for the purpose of obtaining qualifying assets, to the expenditures on that asset.
All other borrowing costs are recognised in profit or loss under finance costs in the period in which they are incurred.
Foreign currencyFunctional and presentation currencies
Items included in the financial statements of each of the Group entities are measured using the currency of the primary economic environment in which the entity operates (the functional currency). The consolidated financial statements are prepared in South African Rand, which is the Company and Group’s functional and presentation currency.
Foreign currency transactions
Transactions in currencies other than the Group’s functional currency are defined as foreign currency transactions. Transactions in foreign currencies are translated into the functional currency at exchange rates ruling on transaction dates. Monetary assets and liabilities denominated in foreign currencies are translated into the functional currency at the rate of exchange ruling at the reporting date.
Non-monetary assets and liabilities that are measured in terms of historical cost in a foreign currency are translated at the exchange rates ruling at the original transaction date. Non-monetary assets and liabilities that are carried at fair value denominated in the foreign currency are translated into the functional currency at the exchange rate ruling when the fair value was determined.

ANNUAL FINANCIAL STATEMENTS 201436
ACCOUNTING POLICIES FOR THE YEAR ENDED 31 MARCH 2014(continued)
Exchange differences are recognised in profit or loss in the period in which they arise except for:
settlement is neither planned nor likely to occur, which form part of the net investment in the foreign operation and are initially recognised in the foreign currency translation reserve and subsequently recognised in profit or loss on disposal of the net investment.
Financial statements of foreign entities
The financial statements of foreign entities are translated into South African Rand as follows:
liabilities of the foreign entity and translated at the rates of foreign exchange ruling at the reporting date.
On consolidation, exchange differences arising from the translation of the net investment in foreign operations and of related hedges where hedge accounting is applied are recognised in other comprehensive income and presented as a separate component of equity.
On disposal, such translation differences are recognised in profit or loss as part of the gain or loss on disposal.
TaxationIncome taxation on profit or loss for the period comprises current and deferred taxation. Income taxation is recognised in the profit or loss except to the extent that it relates to items recognised in other comprehensive income or directly in equity.
The taxation effect of transactions with shareholders in their capacity as shareholders, including transactions with non-controlling interests, are recognised directly in equity and presented in the statement of comprehensive income.
Current taxation
The charge for current taxation is the amount of income taxes payable in respect of the taxable profit for
taxation rates that have been enacted or substantively enacted at the reporting date.
Deferred taxation
A deferred taxation liability is recognised for all taxable temporary differences and a deferred taxation asset is recognised for all deductible temporary differences. The following temporary differences are not provided for:
probable they will not reverse in the foreseeable future.
The amount of deferred taxation provided is based on the expected manner of realisation or settlement of the carrying amount of assets and liabilities and is calculated using the taxation rates that have been enacted or substantively enacted at the reporting date. Deferred taxation is charged or credited in the profit or loss, except where it relates to items charged or credited to other comprehensive income or recognised directly in equity.

37
A deferred taxation asset is recognised to the extent that it is probable that future taxable profits will be available to be utilised against the associated unused taxation losses and deductible temporary differences. Deferred taxation assets are reduced to the extent that it is no longer probable that the related taxation benefit will be realised.
Deferred taxation liabilities are recognised for taxable temporary differences associated with investments
reversal of the temporary differences and it is probable that it will not reverse in the foreseeable future.
Deferred taxation assets and liabilities are offset when they relate to income taxes levied by the same taxation authority and the Group has the legal right to and intends to settle its current taxation assets and liabilities on a net basis.
In terms of the measurement criteria set out in IAS 12 Income Taxes, the Group has assessed its intention at the reporting date on recovering an asset or liability to the extent that this intention influences the rate of taxation to be applied in calculating deferred taxation. In this regard, the Group has recognised deferred taxation as follows:
Land
As land is deemed to be realised through sale, there is no deferred tax effect on the difference between the tax base and the original cost of the land. Deferred taxation is calculated on the difference between the carrying amount and the capital gains taxation (CGT) base cost at the CGT rate.
Asset in respect of which no taxation allowances are granted
No deferred taxation is raised in the case where neither the accounting nor the taxation profit is affected. Where the asset is revalued, deferred taxation is calculated based on the Group’s intention. Where the intention is to sell the asset, deferred taxation is raised at the CGT rate on the difference between the CGT base cost and the revalued carrying amount. Where the intention is to use the asset, deferred taxation is raised at the usage rate on the difference between the taxation base and the revalued carrying amount.
Asset (other than land) carried at cost
Where an asset is carried under the cost model and a taxation allowance is available to be claimed against the asset, deferred taxation is calculated on the difference between the carrying amount and the taxation base at the usage rate.
Asset (other than land) carried at the revalued amount with the intention to use
As the future benefits are expected to flow from the use of the assets, deferred taxation is calculated at the usage rate on the difference between the taxation base and the revalued carrying amount.
Asset (other than land) carried at the revalued amount with the intention to sell
Where the intention is to recover the benefits of the asset through sale, deferred taxation is calculated at usage rate on the difference between the taxation base and the original cost, and at the CGT rate on the difference between the CGT base cost and the revalued carrying amount.
Asset (other than land) carried at the revalued amount with the intention to use and sell
Where the intention is to recover the benefits of the asset through both use and sale, deferred taxation is calculated to reflect this intention. Deferred taxation is calculated at the usage rate on the difference between the taxation base and the original cost, at the CGT rate on the difference between the CGT base cost and the future selling price (residual value), and at the usage rate on the difference between the future selling price and revalued carrying amount.
Investment property (other than land) carried at fair value
Deferred taxation on depreciable investment property (ie buildings) carried at fair value is calculated at the usage rate on the difference between the taxation base, where taxation allowances are available, and the original cost, and at the CGT rate on the difference between the CGT base cost and the fair value. Where the
all of the asset’s economic benefits over the life of the asset, deferred taxation is calculated at the usage rate on the difference between the taxation base and fair value.

ANNUAL FINANCIAL STATEMENTS 201438
ACCOUNTING POLICIES FOR THE YEAR ENDED 31 MARCH 2014(continued)
Dividend taxation
Dividend taxation is levied at a rate of 15% on dividends paid to a shareholder. The taxation is levied on the date of a dividend payment, which is deemed to be the date on which the dividend accrues to the shareholder. Dividend taxation is withheld by the company paying the dividend. An exemption from dividend taxation is provided for, inter alia, where the beneficial owner is the Government.
Property, plant and equipmentProperty, plant and equipment is stated at cost, or revalued amount, less accumulated depreciation where appropriate and any accumulated impairment losses.
Recognition and measurement
Port operating assets, pipeline networks and port infrastructure assets are carried at revalued amounts. Formal revaluations are performed every three years by independent experts applying internationally acceptable and appropriately benchmarked valuation techniques such as depreciated optimised replacement cost and modern equivalent asset valuation methods dependent on the asset class being revalued. The revaluation is limited to the lower of the fair value amount determined per the revaluation method and discounted cash flows. Appropriate indices are applied in the intervening periods to ensure that the assets are carried at fair value at the reporting date.
Revaluation surpluses that arise are recognised in other comprehensive income and are accumulated in the revaluation reserve in equity, except to the extent that they reverse a revaluation decrease for the same asset previously recognised in profit or loss, in which case the surplus is credited to the profit or loss to the extent of the decrease previously recognised. A decrease in the carrying amount arising on the revaluation of an asset is recognised as an expense in profit or loss to the extent that it exceeds the balance, if any, held in the revaluation reserve relating to a previous revaluation of that asset. On the subsequent sale or retirement of a revalued asset, the attributable revaluation surplus included in the revaluation reserve is transferred to retained earnings.
Cost includes expenditure that is directly attributable to the acquisition of the asset, borrowing costs
Assets under construction, including capital work-in-progress, are stated at cost less any accumulated impairment losses. The cost of self-constructed assets includes the cost of materials, direct labour, the initial estimate, where relevant, of the costs of dismantling and removing the items and restoring the site on
appropriate proportion of production overheads.
Where components of an item of property, plant and equipment have different useful lives, they are accounted for as separate items of property, plant and equipment and depreciated separately over their respective useful lives.
equipment if they meet the definition in IAS 16 Property, Plant and Equipment. Otherwise, they are classified as inventory.
Subsequent costs
The Group recognises in the carrying amount of an item of property, plant and equipment the cost of replacing part of such an item when that cost is incurred and it is probable that the future economic benefits embodied within the item will flow to the Group and the cost of the item can be measured reliably. The carrying amount of the replaced part is derecognised. All other costs are recognised in the profit or loss as expenses when incurred.
recognition criteria are met.
Depreciation
Depreciation is recognised in profit or loss on a straight-line basis over the estimated useful lives (or the term
repairs and overhauls are depreciated over the remaining useful life of the related asset or to the date of the
use. Assets are depreciated over the following periods:

39
Asset class Years
Buildings and structures 10 – 50Buildings and structures components 5 – 25Permanent way and works 3 – 95Aircraft including components 8 – 15Pipelines including network components 6 – 75Port infrastructure 12 – 100Floating craft including components 5 – 40Port operating equipment including components 3 – 40Rolling stock 30 – 60Rolling stock components 25 – 60Containers 10 – 20Vehicles 3 – 15Machinery, equipment and furniture 3 – 50
if appropriate. Changes resulting from this review are accounted for prospectively as changes in estimates.
Items of property, plant and equipment are derecognised when they are either disposed of or when no further economic benefits are expected to flow from their use or disposal. Any gain or loss arising on the disposal or retirement of an item of property, plant and equipment is calculated as the difference between the sales proceeds (if any) and the carrying amount of the asset and is recognised in profit or loss.
Investment propertiesInvestment properties are properties held to either earn rentals and/or for capital appreciation (including properties under construction for such purposes) and are initially measured at cost, including transaction costs. Subsequent to initial recognition, investment properties are carried at fair value. Gains and losses arising from changes in the fair value of investment properties are recognised in profit or loss in the period in which they arise. Rental income from investment properties is accounted for as described under the Revenue accounting policy.
Where an item of property, plant and equipment is transferred to investment property following a change in its use, any difference arising at the date of transfer between the carrying amount of the item immediately prior to transfer and its fair value is treated as a revaluation. Upon disposal of the item the gain is transferred to retained earnings. Any loss arising from the transfer is recognised immediately in profit or loss unless it is a reversal of a previous revaluation surplus in which case the loss is recognised in other comprehensive income and reduces the existing revaluation surplus.
If an investment property becomes owner-occupied, it is reclassified as property, plant and equipment and its fair value at the date of the reclassification becomes its deemed cost for subsequent accounting purposes.
Some properties comprise a portion that is held to earn rentals or for capital appreciation and another portion that is held for use in the production or supply of goods or services or for administrative purposes (owner occupied). If these portions could be sold separately or leased out separately under a finance lease, the Group accounts for the different portions separately as investment property or property, plant and equipment. If the portions are not separable, the entire property is only classified as investment property if
equipment.
The Group has areas where multiple buildings are on a single erf or multiple erfs defined as one area called a precinct. Certain buildings may be owner occupied and others rented to third parties or vacant. For classification purposes, a precinct, station or intermodal hub is assessed in its entirety and is classified as investment property if the relevant criteria are met.
Properties which were acquired for administrative purposes but are currently vacant or occupied by a third-party tenant with a long-term lease in excess of five years are classified as investment property even though there may be no plans to dispose of the assets. If the lease term is less than five years, the asset is not classified as investment property. If the criteria in IFRS 5 Non-current Assets Held-for-sale and Discontinued Operations are met, the asset is classified as Non-current Assets Held-for-sale.

ANNUAL FINANCIAL STATEMENTS 201440
ACCOUNTING POLICIES FOR THE YEAR ENDED 31 MARCH 2014(continued)
The Group’s intention in respect of back of port properties is for the Group to hold these properties strategically for future development. Until the future strategic purpose of these properties is formalised through the relevant governance structures, they shall be held for capital appreciation.
For valuation purposes the external rentals within the precinct, station or intermodal hub as well as for back of port properties are used as the basis to determine the fair value of these properties using the normalised income method of valuation which entails the capitalisation of the normalised net annual income from the property.
Intangible assets and goodwillSoftware and licences
Software and licences are recognised and measured at cost less accumulated amortisation and any accumulated impairment losses.
Costs associated with researching or maintaining computer software programs are recognised as an expense as incurred. Costs that are directly associated with the development of identifiable software products controlled by the Group that will probably generate economic benefits beyond one year and for which the costs can be measured reliably, are recognised as intangible assets. Direct costs include the software development employee costs and an appropriate portion of relevant overheads. Costs relating to the acquisition of licences are capitalised and amortised on a straight-line basis over the licence period when available for use.
Research and development
Research costs, undertaken with the prospect of gaining new scientific or technical knowledge and understanding, are recognised in the profit or loss in the period in which they are incurred. Development costs, arising from the application of the research findings to a plan or design for the production of new or substantially improved products and processes are recognised as an asset if, and only if the Group can demonstrate all of the following:
The expenditure capitalised includes the cost of materials, direct labour and an appropriate portion of overheads.
Pre-feasibility and feasibility study expenses are classified and accounted for as either research or development costs in accordance with the above criteria.
Capitalised development costs are stated at cost less accumulated amortisation and any accumulated impairment losses. Development assets that have finite useful lives are amortised on a straight-line basis over their useful lives. Development assets with indefinite useful lives are not amortised, but are tested for impairment at each reporting date.
Development costs previously recognised as an expense are not recognised as an asset in a subsequent period.
Subsequent expenditure
Subsequent expenditure on capitalised intangible assets is capitalised only when it increases the future economic benefits embodied in the specific asset to which it relates. All other expenditure is recognised in profit or loss as incurred.
Amortisation and impairment
Intangible assets with an indefinite useful life and intangible assets not yet available for use are not amortised but are tested for impairment at each reporting date.
Intangible assets with a finite useful life are carried at cost less accumulated amortisation and any accumulated impairment losses. Amortisation is recognised on a straight-line basis over their estimated

41
useful lives. The estimated useful life and amortisation method are reviewed at the end of each annual reporting period, with the effect of any changes in the estimate being accounted for on a prospective basis. The estimated useful lives for the current and comparative periods are as follows:
Asset class Years
Software 5
Licences term of the licence
Goodwill
measured at cost, being the excess of the cost of the acquisition over the net fair value of the Group’s share in the identifiable assets acquired and liabilities assumed.
After initial recognition, goodwill is measured at cost less any accumulated impairment losses. Goodwill in respect of subsidiaries is tested for impairment annually as well as when there is an indication of impairment. For the purpose of impairment testing goodwill is, from the acquisition date, allocated to each of the Group’s cash-generating units that are expected to benefit from the business combination, irrespective of whether other assets or liabilities of the acquiree are allocated to those units (refer 'Impairment of Non-financial assets'). Any impairment losses recognised are not subsequently reversed.
amount of the investment and is not tested separately for impairment on an annual basis (ie it is assessed
Goodwill arising on the acquisition of subsidiaries is presented separately on the statement of financial position.
Where goodwill forms part of a cash-generating unit and part of the operation within that unit is disposed of, the goodwill associated with the operation disposed of is included in the carrying amount of the operation when determining the gain or loss on disposal of the operation. Goodwill disposed of in this circumstance is measured based on the relative values of the operation disposed of and the portion of the cash-generating unit retained.
Gain from a bargain purchase
A gain from a bargain purchase represents the excess of the net fair value of the Group’s share in the identifiable assets acquired and liabilities assumed over the cost of the acquisition.
The gain is recognised immediately in profit or loss, but only after a reassessment of whether all assets and liabilities of the acquiree have been identified and the fair values of all the assets acquired, liabilities assumed and the consideration given up.
Servitudes
Servitudes arising from a binding agreement that meet the definition of an intangible asset are recognised either as a separate intangible asset or as part of the related item of property, plant and equipment. Servitudes are recognised as part of property, plant and equipment where the tangible asset is considered to be the more significant element of the combined asset.
Impairment of non-financial assetsThe carrying amounts of the Group’s tangible and intangible assets, other than investment property, non-current assets held-for-sale, inventories and deferred taxation assets are reviewed at each reporting date to determine whether there is any indication of impairment. If such an indication exists, the recoverable amount of the individual asset is estimated to determine the extent of the impairment loss (if any). Where an asset does not generate cash flows that are independent from other assets, the Group estimates the recoverable amount of the cash-generating unit to which the asset belongs. The Group considers its five operating segments or divisions per the segmental report as separate cash-generating units for the purposes of impairment testing.
Goodwill, intangible assets with an indefinite useful life and intangible assets not yet available for use are tested for impairment annually and whenever there is an indication that the asset may be impaired.
If the recoverable amount of an asset (or cash-generating unit) is estimated to be less than its carrying amount, the carrying amount of the asset (or cash-generating unit) is reduced to its recoverable amount.

ANNUAL FINANCIAL STATEMENTS 201442
ACCOUNTING POLICIES FOR THE YEAR ENDED 31 MARCH 2014(continued)
An impairment loss is recognised immediately in profit or loss, unless the relevant asset is carried at a revalued amount, in which case the impairment loss is treated as a revaluation decrease to the extent of the balance in the revaluation reserve relating to that asset. Impairment losses recognised in respect of cash-generating units are allocated first to reduce the carrying amount of any goodwill allocated to the cash-generating unit (group of units) and then to reduce the carrying amount of the other assets in the cash-generating unit (group of units) on a pro rata basis.
Calculation of recoverable amount
The recoverable amount of an asset is the higher of the asset’s fair value less costs to sell and its value-in-use. Fair value less costs to sell is determined by ascertaining the current market value of the asset and deducting any costs relating to the realisation of the asset. In assessing the value-in-use, the expected future cash flows from the asset are discounted to their net present values using a pre-tax discount rate that reflects current market assessments of the time value of money and the risks specific to the asset (and the business unit to
generate independent cash flows, the recoverable amount is determined for the cash-generating unit to which the asset belongs.
Reversal of impairment
An impairment loss in respect of goodwill, whether recognised at an interim reporting date or at year-end, is not reversed in subsequent periods.
In respect of other assets, a previously recognised impairment loss is reversed if the recoverable amount increases as a result of a change in the estimates previously used to determine the recoverable amount, to an amount not higher than the carrying amount that would have resulted, net of depreciation or amortisation had no impairment loss been recognised. A reversal of an impairment loss is recognised immediately in profit or loss, unless the relevant asset is carried at a revalued amount, in which case the reversal of the impairment loss is treated as a revaluation increase.
Financial instrumentsRecognition
Financial assets and financial liabilities are recognised in the statement of financial position when the Group becomes party to the contractual provisions of the instruments. The Group applies trade date accounting for 'regular way' purchases and sales of financial assets.
Classification
The Group classifies its financial assets in the following categories: at fair value through profit or loss, loans and receivables, available-for-sale and held-to-maturity. The classification depends on the purpose for which the financial assets were acquired. Management determines the classification of its financial assets at initial recognition.
Financial assets at fair value through profit or lossFinancial assets at fair value through profit or loss are financial assets held for trading and financial assets specifically designated into this category on initial recognition.
A financial asset is classified as held for trading if it is acquired principally for the purpose of selling in the short term, is part of a portfolio of identified financial instruments that are managed together and for which there is evidence of a recent actual pattern of short-term profit-taking or is a derivative (unless it is designated as a hedging instrument in an effective hedge or is a financial guarantee contract).
Financial assets or liabilities may be designated as at fair value through profit or loss on initial recognition when:
otherwise arise from measuring financial assets or liabilities, or recognising gains and losses on them on a
fair value basis in accordance with a documented risk management or investment strategy, and information
or
resulting from those financial instruments.

43
The fair value designation, once made, is irrevocable.
Loans and receivablesLoans and receivables are non-derivative financial assets with fixed or determinable payments that are not quoted in an active market, other than those designated on initial recognition as 'at fair value through profit or loss' or as 'available-for-sale'. Loans and receivables are included in current assets, except for maturities greater than twelve months after the end of the reporting period which are classified as non-current assets. The Group’s loans and receivables comprise ‘trade and other receivables’ and cash and cash equivalents in the statement of financial position.
Available-for-sale financial assetsAvailable-for-sale financial assets are non-derivative financial assets that are either designated into this category at initial recognition or not classified in any of the other categories. They are included in non-current assets unless the investment matures or management intends to dispose of it within twelve months of the end of the reporting period, in which case they are included in current assets.
Held-to-maturity financial assetsHeld-to maturity financial assets are non-derivative financial assets with fixed or determinable payments and a fixed maturity that the Group has the positive intention and ability to hold to maturity, other than assets that are included in the other categories above.
Measurement
Financial instruments are initially recognised at their fair value plus, in the case of a financial asset or a financial liability not carried at fair value through profit or loss, transaction costs that are directly attributable to the acquisition or issue of the financial asset or financial liability.
The best evidence of the fair value of a financial instrument at initial recognition is the transaction price, ie the fair value of the consideration given or received, unless the fair value of that instrument is evidenced by comparison with other observable current market transactions in the same instrument (ie without modification or repackaging) or based on a valuation technique whose variables include only data from observable markets. Where the transaction price does not provide the best evidence of fair value at initial recognition, the financial instrument is initially measured at the transaction price and any difference between this price and the value initially obtained from a valuation model is subsequently recognised in profit or loss on the basis of the individual facts and circumstances of the transaction but not later than when the valuation is supported wholly by observable market data or when the financial instrument is derecognised.
Subsequent to initial recognition these instruments are measured as set out below:
Investments
After initial recognition, investments in the Group’s market-making portfolios in both bonds and money market instruments, which are classified as held-for-trading, as well as those classified as available-for-sale, are measured at fair value. Fair value is the market value for listed investments and either the market value of a substantially similar investment or the present value of expected future cash flows of the net asset base for unlisted investments. Gains or losses on investments held-for-trading are recognised in profit or loss.
Other long-term investments that the Group is able to and intends to hold to maturity are subsequently measured at amortised cost using the effective interest rate method, less any impairment losses. Amortised cost is calculated by taking into account any discount or premium on acquisition over the period to maturity.
Derivative instruments and hedge accounting
The Group uses derivative financial instruments, which include futures, forward exchange and currency option contracts, cross currency and interest rate swaps and interest rate options to hedge its exposures arising from operational, financing and investment activities.
In accordance with the Financial Risk Management policy, the Group does not trade in derivative financial instruments for speculative purposes.
Derivatives embedded in other financial instruments or non-derivative host contracts are treated as separate derivatives when their risks and characteristics are not closely related to those of host contracts and the host contracts are not carried at fair value through profit or loss. The Group assesses whether an embedded derivative is required to be separated from the host contract and accounted for as a stand-alone derivative

ANNUAL FINANCIAL STATEMENTS 201444
ACCOUNTING POLICIES FOR THE YEAR ENDED 31 MARCH 2014(continued)
when the Group first becomes a party to the contract. Subsequent reassessment is only performed by the Group if there is a change in the terms of the contract that significantly modifies the cash flows that otherwise would be required under the contract.
Subsequent to initial recognition, derivative financial instruments are measured at fair value. The fair value
instrument in a cash flow hedge, refer below). The fair value of interest rate swaps is the estimated amount that the Group would receive or pay to terminate the swap at the reporting date, taking into account current interest rates and the current creditworthiness of the swap counterparties. The fair value of the forward exchange contracts is their quoted market price at the reporting date, being the present value of the quoted forward price.
The Group applies fair value and cash flow hedge accounting to qualifying hedge relationships in accordance with IAS 39 Financial Instruments: Recognition and Measurement by designating certain derivatives as hedges of the variability in the fair value of recognised assets, liabilities or unrecognised firm commitments (fair value hedges) or hedges of the variability in cash flows attributable to particular risks associated with recognised assets, liabilities or highly probable forecast transactions (cash flow hedges). At the inception of the hedge relationship, the relationship between the hedging instrument and the hedged item is documented,
at the inception of the hedge relationship and on an ongoing basis, the Group assesses whether the hedging instrument is highly effective in offsetting changes in fair value or cash flows of the hedged item.
Changes in the fair value of derivatives that are designated and qualify as fair value hedges are recognised in profit or loss immediately, together with any changes in the fair value of the hedged asset, liability or unrecognised firm commitment that are attributable to the hedged risk.
The effective portion of changes in the fair value of derivatives that are designated and qualify as cash flow hedges is initially recognised in other comprehensive income and accumulated in the cash flow hedge accounting reserve in equity. The gain or loss relating to the ineffective portion is recognised immediately in profit or loss.
The amounts initially recognised in other comprehensive income and included in equity are reclassified from equity to profit or loss in the period(s) in which the hedged item affects profit or loss and are included in the same line as the hedged item. However, where the forecast transaction that is hedged results in the recognition of a non-financial asset or a non-financial liability, the gains and losses previously accumulated in equity are transferred from equity and included in the initial cost or other carrying amount of the non-financial asset or non-financial liability.
Hedge accounting is discontinued when the Group revokes the hedging relationship, the hedging instrument expires or is sold, terminated, or exercised, or no longer qualifies for hedge accounting.
Long-term loans and advances
Long-term loans and advances are measured at amortised cost, using the effective interest rate method, less any impairment recognised. Amortised cost is calculated by taking into account any transaction costs, and any discount or premium on settlement.
Trade and other receivables
Trade and other receivables, which generally have 30 to 90-day terms, are recognised and carried at amortised cost using the effective interest method. Allowances for irrecoverable amounts are recognised in
difference between the carrying amount and the present value of estimated future cash flows discounted at the effective interest rate computed at initial recognition.
The allowance accounts in respect of trade and loan receivables are used to record impairment losses unless the Group is satisfied that no recovery of the amount is possible, in which case the amount is considered irrecoverable and is written off against the financial asset directly.
The Group renegotiates terms for financial assets that would otherwise be past due or impaired in instances where the debtor provides evidence of the ability to meet the obligations in terms of the renegotiated terms.
these financial assets.

45
Cash and cash equivalents
Cash and cash equivalents comprise cash at bank and on hand, and instruments which are readily convertible,
cash equivalents are measured at amortised cost.
For the purposes of the consolidated cash flow statements, cash and cash equivalents include bank overdrafts.
Financial liabilities
After initial recognition, financial liabilities other than financial liabilities at fair value through profit or loss are subsequently measured at amortised cost using the effective interest method. Amortised cost is calculated by taking into account any transaction costs, and any discount or premium on settlement.
Market-making bond portfolio
Financial liabilities at fair value through profit or loss are measured at fair value and the resultant gains and losses are recognised in profit or loss.
Financial liabilities designated at fair value through profit or loss represent a portion of the Group’s bonds that are part of the Group’s market making portfolio. The Group makes a market in its bonds to ensure that the bonds remain attractive to investors. Positions in the Group’s bonds are hedged with opposite positions in Government or Corporate bonds. These bonds are managed and their performance is evaluated on a fair value basis in accordance with the Group’s risk management strategy. Buybacks on bonds are performed on a first-in-first-out (FIFO) basis.
Interest-bearing borrowings
Interest-bearing borrowings are recognised initially at fair value less related transaction costs. Subsequent to initial recognition, interest-bearing borrowings are stated at amortised cost. Any difference between cost and redemption value is recognised in the profit or loss over the period of the borrowings on an effective interest basis.
Trade payables and accruals
Liabilities for trade and other amounts payable which are settled within normal terms are stated at amortised cost.
Impairment of financial assets
such factors as significant financial difficulty experienced by the debtor, breach of contract by the debtor, concessions granted to the debtor by the Group to restructure payment terms, probability of bankruptcy or financial reorganisation of the debtor, and observable data indicating a measurable decrease in estimated future cash flows from a group of debtors even though the decrease cannot yet be identified with individual debtors in the portfolio.
If evidence of impairment exists, the estimated recoverable amount of the asset (or group of assets) is determined and an impairment loss is recognised for the difference between the recoverable amount and the carrying amount as follows:
its discounted estimated recoverable amount (present value of estimated future cash flows, discounted at the original effective interest rate), and the resulting loss is recognised in profit or loss for the period. Receivables with a short duration are not discounted. Assets that are assessed not to be impaired
impairment for a portfolio of receivables could include the Group’s past experience of collecting payments, an increase in the number of delayed payments in the portfolio past the average credit period of 30 days, as well as observable changes in national or local economic conditions that correlate with default on receivables.
the cumulative loss that was previously recognised in other comprehensive income is removed from equity and recognised in profit or loss for the period even though the financial asset has not been derecognised.

ANNUAL FINANCIAL STATEMENTS 201446
ACCOUNTING POLICIES FOR THE YEAR ENDED 31 MARCH 2014(continued)
An impairment loss in respect of a held-to-maturity security or a receivable carried at amortised cost is
to an event occurring after the impairment loss was recognised. The impairment loss is reversed only to the extent that the asset’s carrying amount does not exceed the carrying amount that would have been determined if no impairment loss has been recognised.
An impairment loss in respect of an investment in an equity instrument classified as available-for-sale is not reversed through profit or loss. An impairment loss in respect of a debt instrument classified as available-for-
an event occurring after the impairment loss was originally recognised in profit or loss.
An impairment loss in respect of an unquoted equity instrument that is not carried at fair value because its fair value cannot be measured reliably, whether recognised at an interim reporting date or at year-end, is not reversed in subsequent periods.
Offset
Where a legally enforceable right of offset exists for recognised financial assets and financial liabilities, and there is an intention to settle the liability and realise the asset simultaneously, or settle on a net basis, all related financial effects are offset.
Financial liabilities and equity
Financial instruments issued by the Group are classified as either financial liabilities or equity according to their substance and the definitions of financial liabilities and equity.
Equity instruments
An equity instrument is any contract that evidences a residual interest in the assets of the Group after deducting all of its liabilities. Equity instruments are recognised at the fair value of the proceeds received, net of direct issue costs.
Gains and losses on financial instruments
Net gains or net losses on:Available-for-sale financial assets are determined with reference to quoted share prices on the stock
are recognised in profit and loss when the right to receive payment is established. Impairment losses are recognised in profit or loss for the period.
Loans and receivables and financial assets held-to-maturity represent impairment losses or reversal of impairment losses, interest earned on outstanding balances, as well as gains or losses recognised on derecognition of the asset. These gains or losses are recognised in profit or loss for the period under finance costs.
Financial assets and liabilities held-for-trading mark-to-market of these instruments using market inputs, as well as gains or losses on derecognition. Interest
the fair value line.
Financial liabilities designated as at fair value through profit and lossarise as a result of the mark-to-market on the bonds using prices quoted on the Bond Exchange of South
net losses are recognised in profit and loss for the period on the fair value line.
Financial liabilities at amortised cost represent the amortisation of discounts on or premiums given/received, interest costs as well as any derecognition gains or losses on these liabilities. Gains or losses on liabilities held at amortised cost are recognised in profit or loss for the period under finance costs.
Basis for determining the fair value of financial instruments
Derivatives
The fair values of derivative financial assets and liabilities are determined based on the net present values of all future cash flows, discounted at the prevailing market interest rates at the reporting date. Fair value includes non-performance (ie credit) risk. Only observable market data is used (no estimates) when
Scholes principles are used to value options.

47
BondsThe fair value of bonds designated at fair value through profit or loss is determined by applying the Johannesburg Securities Exchange (JSE) and Bond Exchange of South Africa (BESA) closing rates with the South African Bond formula.
Other non-derivative financial assets and liabilitiesThe fair values of other non-derivative financial assets and liabilities are determined based on the net present values of all future cash flows, discounted at the prevailing market interest rates at the reporting date. Fair value includes non-performance (ie credit) risk.
Short-term financial assets and liabilities The carrying amounts of financial assets and liabilities with a maturity of six months or less are assumed to approximate fair value.
Derecognition
Financial assets (or a portion thereof) are derecognised when the Group’s rights to the cash flows expire, or when the Group transfers substantially all the risks and rewards related to the financial asset or when the Group loses control of the financial asset. On derecognition, the difference between the carrying amount
reported in equity are included in profit or loss.
Financial liabilities (or a portion thereof) are derecognised when the obligations specified in the contract are discharged, cancelled or expire. On derecognition, the difference between the carrying value of the financial liability, including related unamortised costs, and settlement amounts paid is included in profit or loss.
InventoriesInventories are stated at the lower of cost and estimated net realisable value. Net realisable value represents the estimated selling price in the ordinary course of business, less all estimated costs of completion and selling.
Cost is determined as follows:
plus direct labour cost and an appropriate portion of related manufacturing overhead cost, based on normal capacity.
A provision for inventory obsolescence is raised to write down inventory to net realisable value based on a physical count and inspection of inventory items which is performed at least annually and takes into account the age, condition and usage rates of the inventory.
Write-downs to net realisable value and other inventory expenses are recognised in profit or loss in the period in which they arise.
Construction contractsConstruction contract balances represent the gross unbilled amount expected to be collected from customers for contract work performed to date. They are measured at cost plus profit recognised to date less
and an allocation of fixed and variable overheads incurred in the Group’s contract activities based on normal operating capacity.
Construction work-in-progress is presented as part of trade and other receivables in the statement of financial position. Where payments received from customers exceed the income recognised, the difference is presented as deferred income in the statement of financial position.
Non-current assets classified as held-for-sale and discontinued operationsNon-current assets and disposal groups are classified as held-for-sale if their carrying amount will be recovered principally through a sale transaction rather than continuing use. This condition is regarded as met only when the sale is highly probable and the asset or disposal group is available for immediate sale in its present condition. Management must be committed to the sale, which should be expected to qualify for recognition as a completed sale within one year from the date of classification.

ANNUAL FINANCIAL STATEMENTS 201448
ACCOUNTING POLICIES FOR THE YEAR ENDED 31 MARCH 2014(continued)
Immediately before classification as held-for-sale, the measurement of the assets (and all assets and liabilities in a disposal group) is brought up-to-date in accordance with applicable IFRS. Then, on initial classification as held-for-sale, non-current assets and disposal groups are recognised at the lower of carrying amount and the fair value less costs to sell.
Impairment losses on initial classification as held-for-sale are recognised in profit or loss, even where the assets were carried at revalued amounts. The same applies to gains and losses on subsequent measurement. A gain or subsequent increase in fair value less costs to sell may not exceed the cumulative impairment losses previously recognised in terms of IFRS 5 Non-current Assets Held-for-sale and Discontinued Operations or IAS 36 Impairment of Assets.
Non-current assets classified as held-for-sale are not depreciated or amortised whilst classified as such.
business or geographical area of operations or is a subsidiary acquired exclusively with a view to resell.
Classification as a discontinued operation occurs upon disposal or when the operation meets the criteria to be classified as held-for-sale, if earlier. A disposal group that is to be abandoned may also qualify as a discontinued operation.
Where assets or disposal groups classified as held-for-sale are not disposed of within the one-year requirement of the standard, and management believes that the delay was caused by events or circumstances beyond the Group’s control and there is sufficient evidence that the Group remains committed to its plan to sell the assets or disposal groups, such asset or disposal groups will continue to be classified as held-for-sale.
Share capitalIncremental costs directly attributable to the issue of new shares are shown in equity as a deduction, net of taxation, from the proceeds. Incremental costs directly attributable to the issue of new shares for the acquisition of a business are recognised in profit or loss in the period in which they are incurred.
When share capital is repurchased, the amount of the consideration paid, including directly attributable costs, is deducted from equity. Repurchased shares are classified as treasury shares and presented as a deduction from the total equity until they are cancelled, reissued or disposed of.
Dividends are recognised as a liability in the period in which they are declared.
Employee benefitsThe Group operates several defined benefit funds and a defined contribution fund. The assets of each scheme are held separately from those of the Group and are administered by the schemes’ trustees. The defined benefit funds are actuarially valued for accounting purposes by professional independent consulting actuaries on an annual basis.
Defined contribution fund
The Group’s contributions to the defined contribution fund are recognised in profit or loss in the period to which they relate.
Defined benefit funds
The benefit costs and obligations under the defined benefit funds are determined separately for each fund
The service cost and net interest on the net defined benefit liability or asset are recognised in profit or loss. Where the benefits of a plan are amended or curtailed, the change in the present value of the net defined benefit obligation relating to past service by the employees is recognised in profit or loss in the period of the amendment.
Remeasurements of the net defined benefit liability or asset, comprising actuarial gains and losses, the effect of changes in the asset ceiling (where applicable) and the return on the plan assets (excluding interest) are recognised in other comprehensive income in the period in which they arise.
The post-retirement benefit obligation recognised in the statement of financial position represents the present value of the defined benefit obligation less the fair value of any plan assets. Any asset resulting from this calculation is limited to any economic benefits available in the form of refunds from the plans or reductions in the future contributions.

49
Post-retirement medical benefits
Post-retirement medical benefits are provided by the Group to qualifying employees and pensioners. The medical benefit costs are determined through annual actuarial valuations by independent consulting
policy described above.
Short- and long-term benefits
The cost of all short-term employee benefits, such as salaries, bonuses, housing allowances, medical and other contributions is recognised in profit or loss in the period in which the employee renders the related service.
The Group’s net obligation in respect of long-term service benefits, other than pension plans and post-retirement medical benefits is the amount of future benefit that employees have earned in return for their service in the current and prior periods.
Termination benefits
Termination benefits are payable whenever an employee’s employment is terminated before the normal retirement date or whenever an employee accepts voluntary redundancy in exchange for these benefits. The Group recognises termination benefits when it has demonstrated its commitment to either terminate the employment of current employees according to a detailed formal plan without possibility of withdrawal or to provide termination benefits as a result of an offer made to encourage voluntary redundancy.
LeasesGroup as a lessee
Leases of property, plant and equipment where the Group assumes substantially all the risks and rewards of ownership are classified as finance leases. Finance leased assets and the related liabilities recognised at the commencement of the lease term at the lower of the fair value of the leased property and the present value of the minimum lease payments. Each lease payment is allocated between the liability and finance charges so as to achieve a constant periodic rate of interest on the remaining balance of the liability. The corresponding rental obligations, net of finance charges, are recognised in other long-term payables.
The interest element of the finance lease payment is recognised in the profit or loss or capitalised to qualifying assets over the lease period if the relevant criteria are met. Any contingent rentals are charged as expenses in the period in which they are incurred. Property, plant and equipment acquired under a finance lease is depreciated over the shorter of the asset’s useful life and the lease term.
Leases where the lessor retains a significant portion of the risks and rewards of ownership are classified as operating leases. Payments made under operating leases, net of any incentives received from the lessor, (including contracts with fixed escalation clauses), are charged to the profit or loss on a straight-line basis over the period of the lease.
The Group capitalises all leasehold improvements and depreciates them over their useful life or the remaining period of the lease (if shorter).
Group as a lessor
When assets are leased out under a finance lease, the Group derecognises the leased asset and recognises the net investment in the lease as a receivable. The difference between the gross receivable and the present value of the receivable is recognised as unearned finance income. Lease income is recognised over the term of the lease using the net investment method, which reflects a constant periodic rate of return.
Assets leased to third parties under operating leases are included under property, plant and equipment (or investment property where applicable) in the statement of financial position. They are depreciated over their expected useful lives on a basis consistent with similar owned property, plant and equipment. Rental income (net of any incentives given to the lessee) is recognised on a straight-line basis over the lease term.
Sale and leaseback
Where a sale and leaseback agreement is classified as a finance lease, any excess of the sale proceeds over the carrying value is deferred and recognised in the profit or loss over the period of the lease.
Where a sale and leaseback agreement is classified as an operating lease and the transaction took place at fair value, any excess or deficit of the sale proceeds over the carrying values of the assets sold is recognised

ANNUAL FINANCIAL STATEMENTS 201450
ACCOUNTING POLICIES FOR THE YEAR ENDED 31 MARCH 2014(continued)
in the profit or loss in the year in which it arises. If the deficit is compensated for by future lease payments at below market price, the deficit is deferred and amortised in proportion to the lease payments over the period for which the asset is expected to be used. If the sale price is above fair value, the excess over fair value shall be deferred and amortised over the period for which the asset is expected to be used.
Determining whether an arrangement contains a lease
The Group ensures that the following two requirements are met, in order for an arrangement transacted by the Group to be classified as a lease in terms of IAS 17 Leases:
(lessee) the right to control the use of the underlying asset. This will be the case if any one of the following conditions are met:– The purchaser has the ability or right to operate the asset or direct others to operate the asset in a
manner it determines while obtaining or controlling more than an insignificant amount of the output or other utility of the asset.
– The purchaser has the ability or right to control physical access to the asset while obtaining or controlling more than an insignificant amount of the output or other utility of the asset.
– There is only a remote possibility that parties other than the purchaser will take more than an insignificant amount of the output or other utility of the asset and the price that the purchaser will pay for the output is neither contractually fixed per unit of output nor equal to the current market price per unit at the time of delivery.
The Group’s assessment of whether an arrangement contains a lease is made at the inception of the arrangement, with reassessment occurring in the event of limited changes in circumstances as specified by IFRIC 4 Determining whether an Arrangement contains a Lease.
ProvisionsProvisions are recognised when the Group has a present obligation (legal or constructive) as a result of a past event, it is probable that the Group will be required to settle the obligation, and a reliable estimate can be made of the amount of the obligation.
The amount recognised as a provision is the best estimate of the consideration required to settle the present obligation at the end of the reporting period, taking into account the risks and uncertainties surrounding the obligation. Where the effect of time value of money is material, provisions are determined by discounting the expected future cash flows at a pre-taxation rate that reflects current market assessments of the time value of money and the risks specific to the liability.
When some or all of the economic benefits required to settle a provision are expected to be recovered from a third party, a receivable is recognised as an asset if it is virtually certain that the reimbursement will be received and the amount of the receivable can be measured reliably.
Warranties
A provision for warranties is recognised when the underlying products or services are sold. The provision is based on historical warranty data and a weighting of all possible outcomes against their associated probabilities.
Restructuring
A provision for restructuring costs is recognised when the Group has a detailed formal plan for the restructuring and the Group has raised a valid expectation in those affected that it will carry out the restructuring by starting to implement that plan or announcing its main features to those affected by it. Restructuring provisions only include those direct expenditures which are necessarily entailed by the restructuring and not associated with the ongoing activities of the Group. Future operating costs are not provided for.
Decommissioning and environmental liabilities
Decommissioning liabilitiesA provision for the dismantling and removal of an item of property, plant and equipment and restoring the site is recognised when the Group has a present obligation (legal or constructive) to decommission the asset

51
and restore the site on which the asset is located and a reliable estimate can be made of the amount of the obligation.
The amount recognised as a provision is the best estimate of the cost to dismantle and remove the item and rehabilitate the site and may change from year to year taking into account the changes in intended use of the asset, new techniques and knowhow in rehabilitating affected sites, estimated risks and uncertainties surrounding the obligation and the time value of money. These estimates are reviewed at least annually.
Decommissioning costs where the obligation arises as a result of either having acquired or constructed the asset or as a consequence of having used the asset in the current and/or prior periods for purposes other than to produce inventories are capitalised as part of the cost of the asset. Where the obligation arises as a result of having used the asset to produce inventories, the decommissioning costs are recognised as part of the cost of the inventory.
The effect of subsequent changes to assumptions in estimating an obligation for which the provision was
obligation which do not relate to the initial acquisition or construction of a related asset are recognised in profit or loss.
Environmental liabilitiesIn accordance with the Group’s environmental policy and applicable legal requirements, a provision for environmental rehabilitation in respect of clean-up costs is recognised when the Group has a present obligation (legal or constructive) as a result of a past event and a reliable estimate can be made of the amount of the obligation.
The Group’s environmental obligations arise from legislation which requires the Group to remove waste material and remediate land contaminated by asbestos, ferromanganese, manganese, mixed soil (including chrome, sulphur and manganese), fuel and rubble.
A number of factors are considered in determining the amount of the obligation, including:
The above estimates are reviewed at least annually and the effect of subsequent changes thereto is recognised prospectively in profit or loss as a change in accounting estimate.
Onerous contracts
A provision for onerous contracts is recognised when the unavoidable costs of meeting the Group’s obligations under a contract exceed the economic benefits expected to be received under the contract.
Other provisions
Other provisions, for example, third-party claims, freight insurance, customer claims and leave pay provisions are recognised when they meet the recognition requirements as per IAS 37 Provisions, Contingent Liabilities and Contingent Assets.
Contingent liabilities
Contingent liabilities are (a) possible obligations of the Group that arise from past events whose existence will be confirmed only by the occurrence or non-occurrence of one or more uncertain future events not wholly within the control of the Group, or (b) present obligations that arise from past events and it is either not probable that an outflow of resources embodying economic benefits will be required to settle the obligation or the amount of the obligation cannot be measured with sufficient reliability. Contingent liabilities are not recognised in the financial statements but are disclosed in the notes to the financial statements unless the probability of occurrence is remote.
Contingent assets
Contingent assets are possible assets of the Group that arise from past events and whose existence will be confirmed only by the occurrence or non-occurrence of one or more uncertain future events not wholly

ANNUAL FINANCIAL STATEMENTS 201452
ACCOUNTING POLICIES FOR THE YEAR ENDED 31 MARCH 2014(continued)
within the control of the Group. Contingent assets are not recognised in the financial statements and are only disclosed in the notes to the financial statements where an inflow of economic benefits is probable.
Financial guarantees
A financial guarantee contract is a contract that requires the issuer to make specified payments to reimburse the holder for a loss it incurs because a specified debtor fails to make payment when due in accordance with the original or modified terms of the debt instrument. The Group recognises financial guarantee contracts initially at fair value. Subsequently these are recognised at the higher of:
Provisions, Contingent Liabilities and Contingent Assetsand
with IAS 18 Revenue.
Legal claims
A provision for legal claims is recognised when all the recognition criteria for provisions above are met and is based on legal opinion, taking into account the risk and uncertainties surrounding the obligation.
Compensation receivableCompensation receivable from third parties such as insurance companies in respect of assets that are impaired, lost or given up or for any other loss incurred is recognised in the profit or loss when, and only when, it is virtually certain that the payment will be received and the amount can be measured reliably.
Segmental disclosureFor management purposes, the Group is organised into five Operating divisions based on their products and/or services, which form the basis of reporting segment information in accordance with IFRS 8 Operating Segments. Further information on the operations of the Operating divisions is available in the 2014 Integrated Report.
The operating segments are identified on the basis of internal reports that the Group’s chief operating decision-maker reviews regularly in allocating resources to segments and in assessing their performance. Reportable segments are identified based on quantitative thresholds of revenue, profit or loss and assets.
Transfer prices between operating segments are on an arm’s length basis, similar to transactions with third parties. Inter-segment revenues are eliminated upon consolidation and reflected in the 'elimination of inter-segment transactions' column of the segmental report.
Related-party transactionsTransactions with related parties are conducted on an arm’s length basis similar to transactions with third parties.
Application of new and revised International Financial Reporting Standards (IFRS)In the current year, the Group applied a number of new and revised IFRS issued by the IASB that are effective for financial periods beginning on or after 1 January 2013.
New standards
IFRS 10 Consolidated Financial StatementsIFRS 10 replaces parts of IAS 27 Consolidated and Separate Financial Statements that dealt with consolidated financial statements and SIC-12 Consolidation – Special Purpose Entities. IFRS 10 changes the
(b) it is exposed, or has rights, to variable returns from its involvement with the investee, and (c) has the ability to use its power to affect its returns. All three of these criteria must be met for an investor to have control over an investee. Previously control was defined as the power to govern the financial and operating policies of an entity so as to obtain benefits from its activities.
The change in the definition of control did not affect the assessment of control for entities controlled by the Group. As a result, the IFRS did not have any effect on the Group financial statements.
IFRS 11 Joint ArrangementsIFRS 11 replaces IAS 31 Interests in Joint Ventures and the guidance contained in a related interpretation, SIC-13 Jointly Controlled Entities – Non Monetary Contributions by Venturers. Under IFRS 11 there are only

53
considering the structure, the legal form of the arrangement, the contractual terms agreed by the parties to the arrangement and, when relevant, other facts and circumstances.
on the Group financial statements.
IFRS 12 Disclosure of Interests in Other Entities
arrangements, associates and unconsolidated structured entities. The new standard has resulted in more extensive disclosures in the consolidated financial statements. These disclosures are included in Notes 12, 13 and Annexure D to the Group financial statements.
IFRS 13 Fair Value MeasurementIFRS 13 establishes a single source of guidance for fair value measurements and disclosures about fair value
apply to both financial instruments and non-financial instrument items for which other IFRS require or permit fair value measurements such as property, plant and equipment carried under the revaluation model and investment property carried at fair value.
The standard also requires that the fair value of financial assets and liabilities, including derivatives, includes the effect of non-performance risk (ie credit risk). The change resulted in R455 million fair value loss in profit or loss with a corresponding credit to the derivative asset.
The standard did not have any other impact on the Group financial statements except as described above with respect to financial instruments, and the additional disclosures included in Notes 9, 10 and Annexure A to the Group financial statements. The standard was applied prospectively from 1 April 2013.
Revised standards
IAS 1 Presentation of Financial StatementsThe amendments introduce new terminology, whose use is not mandatory, for the statement of comprehensive income and income statement. Under the amendments, the 'statement of comprehensive income' is renamed as the 'statement of profit or loss and other comprehensive income' and the 'income statement' is renamed as the 'statement of profit or loss'. The Group has not adopted the new terminology in its financial statements.
The revised standard also requires items of other comprehensive income to be grouped into two categories in the other comprehensive income section: (a) items that will not be reclassified subsequently to profit or loss, and (b) items that may be reclassified subsequently to profit or loss when specific conditions are met. The income tax on the items of other comprehensive income shall be allocated on the same basis as above. These amendments will be adopted in the new financial year.
IAS 19 Employee BenefitsThe revised IAS 19 replaces the interest cost on the defined benefit obligation and the expected return on plan assets with net interest expense/(income) on the net defined benefit liability/(asset) calculated at a discount rate which reflects the yield on high quality corporate bonds or government debt. The change resulted in an increase in the net defined benefit expense in profit or loss with a corresponding increase in actuarial gains (remeasurements) on the plan assets recognised in other comprehensive income. The net impact on shareholder’s equity is R nil – refer note 36. The standard was applied retrospectively.

ANNUAL FINANCIAL STATEMENTS 201454
INCOME STATEMENTS FOR THE YEAR ENDED 31 MARCH 2014
Company Group
2013 Restated R million
2014
R million Notes
2014
R million
2013 Restated R million
50 156 56 570 Revenue 1 56 606 50 194 (29 213) (32 952) Net operating expenses excluding depreciation,
derecognition and amortisation2 (32 967) (29 143)
20 943 23 618 Profit from operations before depreciation,
derecognition, amortisation and items listed below
23 639 21 051
(9 277) (10 736) Depreciation, derecognition and amortisation 3 (10 736) (9 277)
11 666 12 882 Profit from operations before the items listed below 4.1 12 903 11 774 (551) (110) Impairment of assets 4.2 (107) (588)
1 37 Dividends received 4.3 (251) (388) Post-retirement benefit obligation expense 4.4 (388) (251) 222 264 5 264 222
13 14 24
11 087 12 685 Profit from operations before net finance costs 12 686 11 181 (5 545) (5 911) Finance costs 6 (5 917) (5 545)
385 346 Finance income 7 366 405
5 927 7 120 Profit before taxation 7 135 6 041 (1 892) (1 953) Taxation 8 (1 964) (1 902)
4 035 5 167 Profit for the year 5 171 4 139

55
STATEMENTS OF COMPREHENSIVE INCOME FOR THE YEAR ENDED 31 MARCH 2014
Company Group
2013 Restated R million
2014
R million Notes
2014
R million
2013 Restated R million
4 035 5 167 Profit for the year 5 171 4 139 Other comprehensive income
1 252 6 118 Net items that will not be reclassified subsequently to profit or loss 6 118 1 182
1 744 8 507 Items that will not be reclassified subsequently to profit or loss 8 507 1 652
1 772 8 269 – Gains on revaluations 8 269 1 680
(28) 238 – Actuarial gains/(losses) on post-retirement
benefit obligations 238 (28)
(492) (2 389)Taxation relating to components that will not be reclassified subsequently to profit or loss 8.1 (2 389) (470)
237 865 Net items that may be reclassified subsequently to profit or loss 870 212
329 1 195 Items that may be reclassified subsequently to profit or loss 1 200 304
– – – Exchange differences on translation of
foreign operations 5 (25) 329 1 195 – Gains on cash flow hedges 1 195 329
(92) (330)Taxation relating to components that may be reclassified subsequently to profit or loss 8.1 (330) (92)
1 489 6 983 Other comprehensive income for the year,
net of taxation 6 988 1 394
5 524 12 150 Total comprehensive income for the year 12 159 5 533

ANNUAL FINANCIAL STATEMENTS 201456
DISCLOSURE OF COMPONENTS OF OTHER COMPREHENSIVE INCOME FOR THE YEAR ENDED 31 MARCH 2014
Company Group
2013 Restated R million
2014
R million Notes
2014
R million
2013 Restated R million
Items that will not be reclassified
subsequently to profit or loss
1 272 5 951 Net gains on revaluation reserve 5 951 1 202
1 772 8 269 Gains on revaluations 8 269 1 680
423 467 – Gain on revaluation of pipeline networks 22 467 423 1 325 7 783 – Gain on revaluation of port facilities 22 7 783 1 325
(93) 26 – Decommissioning restoration liability
22 26 (93)
9 27 – Net gain on revaluation of land, buildings
and structures 22 27 9
16 (34)– (Loss)/gain on revaluation of other
investments 22 (34) 16 92 – – Transfer in on liquidation of subsidiary – –
(500) (2 318) Taxation effect of revalued items 8.1 (2 318) (478)
(20) 167 Net actuarial gains/(losses) on post-
retirement benefit obligations 167 (20)
(28) 238 Actuarial gains/(losses) on post-retirement benefit obligations 22 238 (28)
9 20 – Actuarial gain on the Transport Pension
Fund: Transnet Sub-fund 32.1.2 20 9
(1) – – Actuarial loss on the Transnet Second
Defined Benefit Fund 32.1.3 – (1)
(8) 10 – Actuarial gain/(loss) on the Transnet Top
Management Pension 32.1.4 10 (8)
(62) 21 – Actuarial gain/(loss) on the Transnet
Workmen’s Compensation Act Pensioners 32.1.4 21 (62)
(41) 65 – Actuarial gain/(loss) on the Transnet SATS
Pensioners medical benefits 32.2.1 65 (41)
75 122 – Actuarial gain on the Transnet employees
medical benefits 32.2.2 122 75
8 (71) Taxation effect of net actuarial (gains)/losses 8.1 (71) 8
Items that may be reclassified subsequently
to profit or loss
237 865 Net gain on cash flow hedging reserve 865 237
329 1 195 – Gains on cash flow hedges 22 1 195 329 (92) (330) – Taxation effect of cash flow hedge gains 8.1 (330) (92)
– – Net movement on foreign currency
translation reserve 22 5 (25)
1 489 6 983 Other comprehensive income for the year 6 988 1 394

57
STATEMENTS OF FINANCIAL POSITION AS AT 31 MARCH 2014
Company Group
2013 R million
2014R million Notes
2014R million
2013 R million
ASSETSNon-current assets
176 921 207 322 Property, plant and equipment 9 207 322 176 921 7 938 8 572 Investment properties 10 8 572 7 938
534 972 Intangible assets 11 972 534 208 3 Investments in subsidiaries 12
10 9 13 105 93 3 821 7 346 Derivative financial assets 14 7 346 3 821
4 29 Long-term loans and advances 15 29 4 671 716 Other investments and long-term financial assets 16 716 671
190 107 224 969 225 062 189 982
Current assets
3 400 3 241 Inventories 17 3 241 3 400 6 243 7 769 Trade and other receivables 18 7 774 6 248
34 58 Derivative financial assets 14 58 34 1 359 67 Other short-term investments 16 67 1 359
2 258 3 508 Cash and cash equivalents 19 3 633 2 598
13 294 14 643 14 773 13 639 275 238 Assets classified as held-for-sale 20 238 275
13 569 14 881 15 011 13 914
203 676 239 850 Total assets 240 073 203 896
EQUITY AND LIABILITIESCapital and reserves
12 661 12 661 Issued capital 21 12 661 12 661 72 114 84 264 Reserves 22 84 452 72 293
84 775 96 925 Attributable to the equity holder 97 113 84 954
Non-current liabilities
3 117 2 968 Employee benefits 23 2 968 3 117 66 768 82 993 Long-term borrowings 24 82 995 66 770
62 46 Derivative financial liabilities 14 46 62 1 902 1 890 Long-term provisions 25 1 890 1 902
20 471 25 209 Deferred taxation liabilities 26 25 209 20 471 6 221 4 615 Other non-current liabilities 16 4 615 6 221
98 541 117 721 117 723 98 543
Current liabilities
11 849 14 329 Trade payables and accruals 28 14 357 11 884 6 318 7 449 Short-term borrowings 29 7 449 6 318
52 12 Current taxation liability 17 56 23 37 Derivative financial liabilities 14 37 23
991 816 Short-term provisions 25 816 991 1 127 2 561 Other current liabilities 16 2 561 1 127
20 360 25 204 25 237 20 399
203 676 239 850 Total equity and liabilities 240 073 203 896

ANNUAL FINANCIAL STATEMENTS 201458
STATEMENTS OF CHANGES IN EQUITY FOR THE YEAR ENDED 31 MARCH 2014
Issued capital
R million
Revaluation
reserve R million
Foreign currency
translation reserve
R million
Actuarial gains and
losses R million
Cash flow hedging reserve
R million Other
R million
Retained earnings
R million Total
R million
CompanyOpening balances as
at 1 April 2012 12 661 30 488 – 1 985 (76) 250 33 943 79 251 Restated total comprehensive income/(loss) for the year (net of taxation) – 1 272 – (20) 237 – 4 035 5 524
Total comprehensive income/(loss) for the year as previously reported – 1 272 – (221) 237 – 4 236 5 524 Change in accounting policy (net of taxation) – – – 201 – – (201) –
Restated balances
at 31 March 2013 12 661 31 760 – 1 965 161 250 37 978 84 775
Profit for the year – – – – – – 5 167 5 167 Other comprehensive income for the year – 5 951 – 167 865 – – 6 983
Balances at
31 March 2014 12 661 37 711 – 2 132 1 026 250 43 145 96 925
GroupOpening balances as at 1 April 2012 12 661 30 558 20 1 985 (76) 249 34 024 79 421 Restated total comprehensive income/(loss) for the year (net of taxation) – 1 202 (25) (20) 237 – 4 139 5 533
Total comprehensive income/(loss) for the year as previously reported – 1 202 (25) (221) 237 – 4 340 5 533 Change in accounting policy (net of taxation) – – – 201 – – (201) –
Restated balances
at 31 March 2013 12 661 31 760 (5) 1 965 161 249 38 163 84 954
Profit for the year – – – – – – 5 171 5 171 Other comprehensive income for the year – 5 951 5 167 865 – – 6 988
Balances at
31 March 2014 12 661 37 711 – 2 132 1 026 249 43 334 97 113
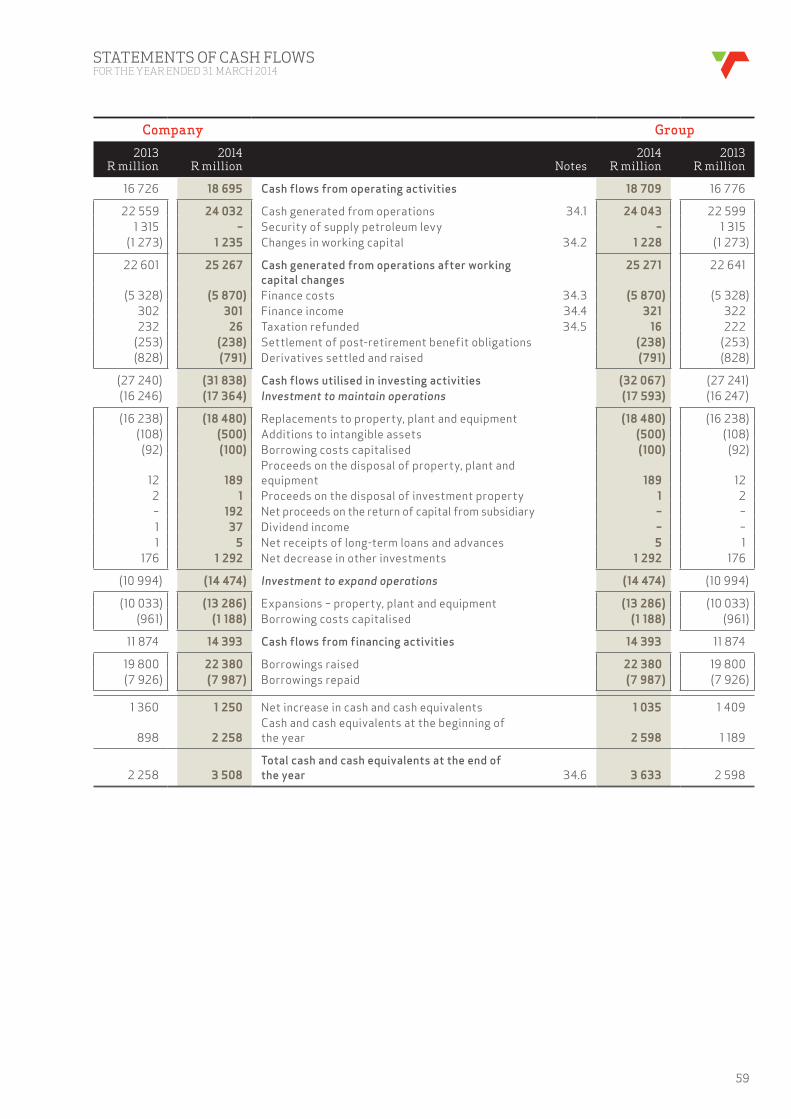
59
STATEMENTS OF CASH FLOWS FOR THE YEAR ENDED 31 MARCH 2014
Company Group
2013 R million
2014R million Notes
2014R million
2013 R million
16 726 18 695 Cash flows from operating activities 18 709 16 776
22 559 24 032 Cash generated from operations 34.1 24 043 22 599 1 315 – Security of supply petroleum levy – 1 315
(1 273) 1 235 Changes in working capital 34.2 1 228 (1 273)
22 601 25 267 Cash generated from operations after working
capital changes
25 271 22 641
(5 328) (5 870) Finance costs 34.3 (5 870) (5 328) 302 301 Finance income 34.4 321 322 232 26 Taxation refunded 34.5 16 222
(253) (238) Settlement of post-retirement benefit obligations (238) (253) (828) (791) Derivatives settled and raised (791) (828)
(27 240) (31 838) Cash flows utilised in investing activities (32 067) (27 241) (16 246) (17 364) Investment to maintain operations (17 593) (16 247)
(16 238) (18 480) Replacements to property, plant and equipment (18 480) (16 238) (108) (500) Additions to intangible assets (500) (108)
(92) (100) Borrowing costs capitalised (100) (92)
12 189 Proceeds on the disposal of property, plant and equipment 189 12
2 1 Proceeds on the disposal of investment property 1 2 – 192 Net proceeds on the return of capital from subsidiary – – 1 37 Dividend income – – 1 5 Net receipts of long-term loans and advances 5 1
176 1 292 Net decrease in other investments 1 292 176
(10 994) (14 474) Investment to expand operations (14 474) (10 994)
(10 033) (13 286) Expansions – property, plant and equipment (13 286) (10 033) (961) (1 188) Borrowing costs capitalised (1 188) (961)
11 874 14 393 Cash flows from financing activities 14 393 11 874
19 800 22 380 Borrowings raised 22 380 19 800 (7 926) (7 987) Borrowings repaid (7 987) (7 926)
1 360 1 250 Net increase in cash and cash equivalents 1 035 1 409
898 2 258 Cash and cash equivalents at the beginning of the year 2 598 1 189
2 258 3 508 Total cash and cash equivalents at the end of
the year 34.6 3 633 2 598

ANNUAL FINANCIAL STATEMENTS 201460
SEGMENTAL REPORT FOR THE YEAR ENDED 31 MARCH 2014
Freight Rail R million
Engineering R million
National Ports
Authority R million
For the year ended 31 March 2014External revenue* 34 111 1 616 8 727Internal revenue 300 11 737 1 190
Total revenue 34 411 13 353 9 917Energy costs (4 543) (221) (399)Maintenance costs (1 370) (261) (296)Material costs (949) (6 521) (85)Personnel costs (10 732) (4 708) (1 767)Other costs (2 393) (756) (690)
Earnings before interest, taxation, depreciation, derecognition and amortisation (EBITDA) 14 424 886 6 680Depreciation, derecognition and amortisation (6 999) (246) (1 354)Impairment of assets (11) – (22)Dividends received and income from associates – – –
114 3 468Finance costs (2 412) (393) (1 525)Finance income 53 – 4
Profit before taxation 5 169 250 4 251
Total assets## 99 733 11 206 72 454Total liabilities 61 752 6 774 38 048Capital expenditure*** 25 115 975 1 188Cash generated from operations after working capital changes 22 131 1 179 7 716Net cash surplus/(shortfall) 10 (85) 2 338EBITDA margin 41,9% 6,6% 67,4%Number of employees 29 225 12 428 3 823
For the year ended 31 March 2013 (Restated)External revenue* 30 608 1 371 7 410Internal revenue 1 189 11 692 918Total revenue 31 797 13 063 8 328Energy costs (4 121) (228) (353)Maintenance costs (1 294) (309) (276)Material costs (1 005) (5 916) (75)Personnel costs (9 765) (4 424) (1 472)Other costs (2 650) (712) (566)Earnings before interest, taxation, depreciation, derecognition and amortisation (EBITDA) 12 962 1 474 5 586Depreciation, derecognition and amortisation (5 852) (193) (1 266)Impairment of assets (91) – (13)Dividends received and income from associates – – –
29 (6) 121Finance costs (2 031) (252) (1 728)Finance income 53 (1) 5Profit before taxation 5 070 1 022 2 705Total assets## 80 011 10 782 66 107Total liabilities 48 606 6 954 38 317Capital expenditure*** 18 277 1 315 1 698Cash generated from operations after working capital changes 12 044 554 5 194Net cash surplus/(shortfall) 6 1 3 616EBITDA margin 40,8% 11,3% 67,1%Number of employees 29 489 12 752 3 584* Revenues from segments below the quantitative thresholds are attributable to two operating segments of Transnet. Those segments
include Transnet Property that manages internal and external leases of commercial and residential property and Transnet Capital Projects.** Other adjustments include the Corporate Centre functions.*** Excludes capitalised borrowing costs and intangible assets, includes capitalised finance leases and capitalised decommissioning liabilities.## Excludes assets classified as held-for-sale.

61
Port Terminals
R millionPipelines R million
Total for reportable
segments R million
All other segmentsand other
adjustments** R million
Elimination of intersegment transactions
R millionTotal
R million
8 531 3 099 56 084 522 – 56 6064 15 13 246 2 763 (16 009) –
8 535 3 114 69 330 3 285 (16 009) 56 606(520) (206) (5 889) (142) – (6 031)(306) (73) (2 306) (74) 2 171 (209)(358) (11) (7 924) 60 5 052 (2 812)
(3 124) (318) (20 649) (1 625) 5 645 (16 629)(1 768) (178) (5 785) (3 847) 2 346 (7 286)
2 459 2 328 26 777 (2 342) (796) 23 639(1 566) (639) (10 804) (124) 192 (10 736)
(236) (7) (276) 169 – (107)– – – 14 – 14
20 5 610 (734) – (124)(449) (44) (4 823) (8 306) 7 212 (5 917)
6 6 69 7 509 (7 212) 366
234 1 649 11 553 (3 814) (604) 7 135
19 042 32 324 234 759 16 736 (11 660) 239 83510 055 19 373 136 002 13 152 (6 194) 142 960
1 651 3 377 32 306 254 (794) 31 7661 291 1 974 34 291 (9 020) n/a 25 271
(74) 26 2 215 (1 180) n/a 1 03528,8% 74,8% 38,6% n/a n/a 41,8%
6 624 621 52 721 1 950 n/a 54 671
7 421 2 823 49 633 561 – 50 1943 6 13 808 2 621 (16 429) –
7 424 2 829 63 441 3 182 (16 429) 50 194(439) (192) (5 333) (137) – (5 470)(282) (49) (2 210) (186) 2 142 (254)(350) (10) (7 356) (20) 4 784 (2 592)
(2 714) (275) (18 650) (1 201) 5 344 (14 507)(1 643) (139) (5 710) (3 673) 3 063 (6 320)
1 996 2 164 24 182 (2 035) (1 096) 21 051(1 416) (547) (9 274) (156) 153 (9 277)
(10) (48) (162) (426) – (588)– – – 24 – 24
(10) 2 136 (165) – (29)(374) (302) (4 687) (7 562) 6 704 (5 545)
32 4 93 7 016 (6 704) 405218 1 273 10 288 (3 304) (943) 6 041
18 377 28 098 203 375 13 040 (12 794) 203 62110 477 16 704 121 058 5 700 (7 816) 118 9422 208 2 799 26 297 2 225 (1 051) 27 4713 602 3 012 24 406 (1 765) n/a 22 641
(85) – 3 538 (2 029) n/a 1 50926,9% 76,5% 38,1% n/a n/a 41,9%6 662 627 53 114 1 612 n/a 54 726

ANNUAL FINANCIAL STATEMENTS 201462
Company Group
2013 R million
2014 R million
2014 R million
2013 R million
1. Revenue 48 696 53 961 Rendering of services 53 997 48 734
1 323 1 446 Rental income 1 446 1 323 14 10 Finance income from lending activities 10 14
764 1 077 Construction contracts (refer note 27) 1 077 764
50 797 56 494 56 530 50 835 (641) 76 76 (641)
50 156 56 570 56 606 50 194
Refer to the Segmental Report for the split of revenue streams.
2. Net operating expenses excluding depreciation, derecognition and amortisation
313 334 Accommodation and refreshments 334 313 720 923 Electronic data costs 923 720
5 470 6 031 Energy costs 6 031 5 470 374 406 Health and sanitation 406 374 205 232 Insurance 232 205 254 209 Maintenance costs 209 254
1 599 1 681 Managerial and technical consulting fees (refer note 4.1) 1 681 1 599
2 592 2 812 Material costs 2 812 2 592 1 479 1 854 Operating lease charges (refer note 4.1) 1 854 1 479
14 507 16 629 Personnel costs 16 629 14 507 90 106 Printing and stationery 106 90
62 (54)(Profit)/loss on disposal of property, plant and equipment (refer note 4.1) (54) 62
190 186 Promotions and advertising 186 190 783 843 Security 843 783 262 313 Telecommunications 313 262
95 99 Transport 99 95
137 100 Research and development costs (refer note 4.1) 100 137
81 248 Other costs 263 11
29 213 32 952 32 967 29 143
NOTES TO THE ANNUAL FINANCIAL STATEMENTS FOR THE YEAR ENDED 31 MARCH 2014

63
Company Group
2013 R million
2014 R million
2014 R million
2013 R million
3. Depreciation, derecognition and amortisationDepreciation and derecognition
(refer annexure B)
6 528 7 775 Depreciation – owned assets at historic cost 7 775 6 528
23 11 Aircraft 11 23 108 110 Floating craft 110 108 751 754 Land, buildings and structures 754 751
498 652 Machinery, equipment and furniture 652 498 745 892 Permanent way and works 892 745
4 344 5 295 Rolling stock and containers 5 295 4 344 59 61 Vehicles 61 59
2 352 2 593 Depreciation – owned assets revalued portion 2 593 2 352
515 607 Pipeline networks 607 515 1 837 1 986 Port facilities 1 986 1 837
205 197 Depreciation – leased assets at historic cost 197 205
17 24 Machinery, equipment and furniture 24 17 28 22 Permanent way and works 22 28
160 151 Rolling stock and containers 151 160
9 085 10 565 10 565 9 085
Amortisation of intangible assets (refer note 11)
192 171 Software and licences 171 192
9 277 10 736 Total depreciation, derecognition and
amortisation
10 736 9 277

ANNUAL FINANCIAL STATEMENTS 201464
NOTES TO THE ANNUAL FINANCIAL STATEMENTS FOR THE YEAR ENDED 31 MARCH 2014(continued)
Company Group
2013 R million
2014 R million
2014 R million
2013 R million
4.1 Profit from operations before impairment of assets, dividends received, post-retirement benefit obligation income, fair value adjustments and income from associates and joint venturesis stated after taking into account the following amounts:Auditors’ remuneration
Group auditors 30 50 Audit fees –current year 50 30 23 35 Audit fees –prior year 35 23 13 12 Fees for audit related and other services 12 13 3 5 Expenses 5 3
69 102 102 69
1 599 1 681 Managerial and technical consulting fees 1 681 1 599
Operating lease charges
861 1 025 Land, buildings and structures 1 025 861 562 717 Vehicles 717 562
35 70 Rolling stock 70 35 21 42 Other 42 21
1 479 1 854 1 854 1 479
62 (54)(Profit)/loss on disposal of property, plant and
equipment (54) 62
137 100 Research and development costs 100 137
Directors’ and executives’ emoluments
(full details are disclosed in the Report of the
Directors)
14 19 Executive directors 19 14 7 7 Independent non-executive directors 7 7
67 79 Senior executives 79 67
88 105 105 88

65
Company Group
2013 R million
2014 R million
2014 R million
2013 R million
4.2 Impairment of assets
67 177 Property, plant and equipment (refer annexure B) 177 67 29 – Intangible assets (refer note 11) – 29
(38) 3 Impairment/(reversal of impairment) of associates and subsidiaries – (1)
(3) (30) Long-term loans and advances (refer note 15) (30) (3) 496 (40) Trade and other receivables (40) 496
551 110 107 588
4.3 Dividends received
– 36 Dividends from subsidiary 1 1 Dividends from associate
1 37
Restated Restated
4.4 Post-retirement benefit obligation expense
23 33 Transport Pension Fund: Transnet Sub-fund 33 23 (1) – Transnet Second Defined Benefit Fund – (1) 6 6 Transnet Top Management Pension 6 6
35 32 Transnet Workmen’s Compensation Act pensioners 32 35
56 56 Transnet SATS Pensioners’ post-retirement medical benefits 56 56
62 58 Transnet employees’ post-retirement medical benefits 58 62
70 203 Other post-retirement and medical benefits (refer note 23) 203 70
251 388 388 251
5. Fair value adjustments 98 (372) (372) 98
274 647 (refer note 10) 647 274 (150) (11) (11) (150)
222 264 264 222
6. Finance costs 179 10 Net foreign exchange loss on translation 16 179 38 31 Discounts on bonds amortised (refer note 24) 31 38 16 15 Finance lease obligation 15 16
6 365 7 142 Interest cost – financial liabilities at amortised cost 7 142 6 365
6 598 7 200 Gross finance costs 7 206 6 598 (1 053) (1 288) Borrowing costs capitalised* (1 288) (1 053)
5 545 5 911 5 917 5 545
* The weighted average capitalisation rate on funds borrowed is generally 9,47% per annum (2013: 11,84% per annum).

ANNUAL FINANCIAL STATEMENTS 201466
NOTES TO THE ANNUAL FINANCIAL STATEMENTS FOR THE YEAR ENDED 31 MARCH 2014(continued)
Company Group
2013 R million
2014 R million
2014 R million
2013 R million
7. Finance income 232 244 Interest received – bank deposits 264 252
70 57 Interest received – loans and receivables 57 70 83 45 Interest received – held-to-maturity 45 83
385 346 366 405
Restated Restated
8. Taxation South African normal taxation
34 (66) – Current year (59) 39Deferred taxation (refer note 26)
1 858 2 019 – Current year 2 019 1 859Foreign taxation
– – – Current year 4 4
1 892 1 953 1 964 1 902
% % Reconciliation of taxation rate % % 28,00 28,00 Standard rate – South African normal taxation 28,00 28,00
3,74 (0,57) (0,47) 3,33
3,76 1,73 Expenses not included for taxation purposes 1,92 3,33 (0,02) (0,53) Exempt local dividends
– (0,84) taxation charge (1,46) – – (0,93) Release on prescription of taxation return (0,93) –
31,74 27,43 Effective rate of taxation 27,53 31,33
8.1 Taxation recognised in other comprehensive incomeArising on the taxation effects of items
recognised in comprehensive income:
(102) (135)Gain on revaluation of pipeline networks and decommissioning restoration liability (135) (102)
(370) (2 181)Gain on revaluation of port facilities and decommissioning liability (2 181) (370)
(2) (8)Gain on revaluation of land, buildings and structures (8) (2)
(26) 6 Loss/(gain) on revaluation of investments to market value (ALL Group Ltd) 6 (4)
(92) (330) Cash flow hedge gain (330) (92)
8 (71)Actuarial (gain)/loss on post-retirement benefit obligations (71) 8
(584) (2 719)Total taxation recognised in other
comprehensive income (2 719) (562)

67
Company Group
2013 R million
2014 R million
2014 R million
2013 R million
9. Property, plant and equipment (refer annexure B)Property, plant and equipment is stated at historical cost except for pipeline networks and port facilities, which are stated at revalued amounts.
176 921 207 322 Net book value 207 322 176 921
246 537 295 979 Gross carrying value 295 979 246 537 (69 616) (88 657) Accumulated depreciation and impairment (88 657) (69 616)
Comprising:Historical cost
135 645 164 176 Gross carrying value 164 176 135 645
157 157 – Aircraft 157 157 2 131 2 270 – Floating craft 2 270 2 131
22 392 24 057 – Land, buildings and structures 24 057 22 392 7 199 8 109 – Machinery, equipment and furniture 8 109 7 199
25 166 28 897 – Permanent way and works 28 897 25 166 57 857 69 278 – Rolling stock and containers 69 278 57 857
988 1 049 – Vehicles 1 049 988 19 755 30 359 – Capital work-in-progress 30 359 19 755
(31 893) (37 883) Accumulated depreciation (37 883) (31 893)
(109) (120) – Aircraft (120) (109) (485) (594) – Floating craft (594) (485)
(4 308) (5 105) – Land, buildings and structures (5 105) (4 308) (3 784) (4 374) – Machinery, equipment and furniture (4 374) (3 784) (5 099) (5 853) – Permanent way and works (5 853) (5 099)
(17 568) (21 266) – Rolling stock and containers (21 266) (17 568) (540) (571) – Vehicles (571) (540)
(1 294) (1 129) Accumulated impairment (1 129) (1 294)
(1) (1) – Floating craft (1) (1) (162) (164) – Land, buildings and structures (164) (162) (164) (155) – Machinery, equipment and furniture (155) (164)
(250) (43) – Permanent way and works (43) (250) (493) (544) – Rolling stock and containers (544) (493)
(6) (5) – Vehicles (5) (6) (218) (217) – Capital work-in-progress (217) (218)
102 458 125 164 Net book value of property, plant and equipment
stated at historic cost 125 164 102 458
Revaluation 110 892 131 803 Gross carrying value 131 803 110 892
28 782 30 714 – Pipeline networks 30 714 28 782 82 110 101 089 – Port facilities 101 089 82 110
(35 585) (48 616) Accumulated depreciation (48 616) (35 585)
(10 266) (11 927) – Pipeline networks (11 927) (10 266) (25 319) (36 689) – Port facilities (36 689) (25 319)
(844) (1 029) Accumulated impairment (1 029) (844)
(246) (252) – Pipeline networks (252) (246) (598) (777) – Port facilities (777) (598)
74 463 82 158 Net book value of property, plant and equipment
stated at revalued amounts 82 158 74 463

ANNUAL FINANCIAL STATEMENTS 201468
NOTES TO THE ANNUAL FINANCIAL STATEMENTS FOR THE YEAR ENDED 31 MARCH 2014(continued)
Company Group
2013 R million
2014 R million
2014 R million
2013 R million
176 921 207 322 Total net book value 207 322 176 921
9. Property, plant and equipment (refer annexure B) (continued)Land, buildings and structures
A register of land, buildings and structures is available for inspection at the Company.
During the year, the Group transferred R5 million (2013: R96 million) from investment properties to property, plant and equipment. The fair values of these properties are deemed cost for subsequent accounting in accordance with IAS 40.
Rolling stock
565 667 Included in rolling stock assets are capitalised leased assets with a carrying value of 667 565
These assets were part of a sale and lease back arrangement giving rise to a finance lease entered into in 1997. The present value of the lease commitments has been settled in full.
Pipeline networks
The Group’s policy is to perform a revaluation of its pipeline networks every three years and apply appropriate valuation indices in the intervening years. An external revaluation was performed in the 2012 year, by Arthur D. Little Inc., an independent firm of professional valuers on the basis of the modern equivalent net asset value. In the current year an index revaluation resulted in a net increase of R467 million (2013: R423 million) to the carrying value of the Group’s pipeline networks, which has been
Fair value hierarchy
– Level 1 – quoted prices in active markets –– Level 2 – significant observable inputs –
18 535 Level 3 – significant unobservable inputs* 18 535
18 535 18 535
15 580 15 610 The historic cost carrying values of these assets amount to 15 610 15 580
* Refer to annexure F for more detail regarding the measurement of level 3 fair values.

69
Company Group
2013 R million
2014 R million
2014 R million
2013 R million
9. Property, plant and equipment (refer annexure B) (continued)Port facilitiesThe Group’s policy is to perform a revaluation of its port operating assets and infrastructure every three years and apply appropriate valuation indices in the intervening years. In the current year, a full revaluation was performed on port operating assets by independent valuation experts, Deloitte & Touche, using the depreciated replacement cost approach. This resulted in an increase of R945 million for port operating assets (2013: index valuation of R262 million). Index valuations were applied to port infrastructure and resulted in an increase of R6 838 million (2013: R1 063 million) for port infrastructure.In prior years, the Group assumed a 0,0% tariff increase rate for the purpose of calculating the terminal value in the discounted cash flow (DCF) valuation for ports infrastructure on the basis that National Ports Authority did not have an established tariff methodology which made it difficult to estimate the tariff increase rate.
In the current year, the Ports Regulator has for the first time given National Ports Authority an Interim Regulatory Manual (IRM) which sets out that future tariffs will be determined by taking into account the regulated asset base trended by the consumer price index (CPI).
As the IRM is not a final tariff methodology, management considered it prudent at this stage to apply only one third of the CPI (ie 1,5%) tariff increase rate in forecasting the terminal value of ports infrastructure until such time as there is more clarity from the Regulator.
Of the R6 838 million revaluation increase in the current period, R4 712 million is attributable to the change in tariff increase rate as described above. The DCF valuation is sensitive to changes in the terminal value growth rate. For example, a 0,5% increase in the tariff increase rate results in approximately a R1 427 million increase in the value of the port infrastructure.The estimated replacement cost of port
amounted to R57,9 billion (2013: R53,9 billion) as determined by independent valuation experts, however, the revaluation was limited to the present value of future discounted cash flows, amounting to R54,5 billion (2013: R47,9 billion).Fair value hierarchy
– Level 1 – quoted prices in active markets –– Level 2 – significant observable inputs –
63 623 Level 3 – significant unobservable inputs* 63 623
63 623 63 623
19 153 21 110 The historic carrying values of these assets amount to 21 110 19 153
* Refer to annexure F for more detail regarding the measurement of level 3 fair values.

ANNUAL FINANCIAL STATEMENTS 201470
NOTES TO THE ANNUAL FINANCIAL STATEMENTS FOR THE YEAR ENDED 31 MARCH 2014(continued)
Company Group
2013 R million
2014 R million
2014 R million
2013 R million
9. Property, plant and equipment (refer annexure B) (continued)Included in Port facilities are encumbered assets of Rnil (2013: R1 009 million) as security for finance leases.
Useful lives and residual values
The useful lives and residual values of property, plant and equipment are reviewed at each reporting date based on condition assessments, maintenance and capital expenditure plans and other available information.
Residual valuesDuring the year, management conducted their annual assessment of residual values on existing assets. The exercise resulted in a change in the residual values of the railway component of the permanent way assets based on scrap steel prices obtained during the current financial year, and steel prices as per the secondary scrap market. This resulted in a reduction in a depreciation expense of R17,4 million (2013: R22,6 million).
During the year management conducted a physical condition assessment for rolling stock assets that had been previously written off but reinstated in the prior year at their residual values after they were identified during the extensive physical verification exercise in 2013. The carrying amount
based on the average carrying amount of similar assets with respect to their age and condition. The exercise resulted in a R123 million increase in the carrying amount of these assets (2013: R195 million).
Useful livesRolling stock – locomotivesThe locomotive useful lives were re-assessed in relation to the locomotive phase out plan over the next 20 years. The exercise resulted in a net decrease in the useful lives of certain sub-components and an increase in depreciation expense of R432,0 million (2013: R127,7 million).
Rolling stock – wagons and locomotivesConsistent with the prior year, all wagon and locomotive sub-components that had capitalised expenditure incurred on them in the current year had their useful lives re-assessed and increased accordingly. The exercise resulted in a reduction in depreciation expense of R115,0 million (2013: R167,1 million).
Assets with less than two years remaining useful life

71
Company Group
2013 R million
2014 R million
2014 R million
2013 R million
Management identified assets that had a remaining useful life of twenty-four months or less that were still in use and which the Group intend to continue utilising beyond the estimated useful life. The exercise resulted in an extension in useful lives and a reduction in depreciation expense of R8,5 million (2013: R47,9 million).
prospectively.
10. Investment properties 7 732 7 938 Fair value at the beginning of the year 7 938 7 732
(96) (5)Transferred to property, plant and equipment (refer annexure B) (5) (96)
274 647 Recognised in income statement (refer note 5) 647 274 (2) (1) Disposals (1) (2)
30 – Additions – 30 – (7) Transferred to assets classified as held-for-sale (7) –
7 938 8 572 Fair value at the end of the year 8 572 7 938
Fair value hierarchy– Level 1 – quoted prices in active markets –– Level 2 – significant observable inputs –
8 572 Level 3 – significant unobservable inputs* 8 572
8 572 8 572
The fair value of the Group’s investment properties at 31 March 2014 was arrived at on the basis of valuations carried out at that date by Transnet Property valuers.The valuations, which conform to the Property Valuers Profession Act, No. 47 of 2000, were arrived at by capitalising the first year’s normalised net operating income at a market derived capitalisation rate.Various assumptions were made in order to derive the net present value of the future cash flows. These assumptions were arrived at after
The gross property rental income earned by the Group from its investment properties, which are leased out under gross operating leases, amounted to R1 446 million (2013: R1 323 million).Direct operating expenses arising on investment properties during the year amounted to R377 million (2013: R356 million).No material direct expenses (including repairs and maintenance) arising on investment property, that did not generate rental income during the year were incurred.
* Refer to annexure F for more detail regarding the measurement of level 3 fair values.

ANNUAL FINANCIAL STATEMENTS 201472
NOTES TO THE ANNUAL FINANCIAL STATEMENTS FOR THE YEAR ENDED 31 MARCH 2014(continued)
Company Group
2013 R million
2014 R million
2014 R million
2013 R million
11. Intangible assets 534 972 Intangible assets 972 534
1 588 2 184 Cost 2 184 1 588 (1 054) (1 212) Accumulated amortisation (1 212) (1 054)
Comprising:Finite life intangible assets
534 972 Software and licences: carrying value 972 534
1 588 2 184 Cost 2 184 1 588
1 582 1 588 Balance at the beginning of the year 1 588 1 582 108 500 Additions 500 108
– 1 Borrowing costs capitalised 1 – (165) (13) Disposals (13) (165)
63 108 Transfers from property, plant and equipment (refer annexure B) 108 63
(1 054) (1 212) Accumulated amortisation and impairment (1 212) (1 054)
(996) (1 054) Balance at the beginning of the year (1 054) (996) 163 13 Disposals 13 163
(192) (171) Amortisation (refer note 3) (171) (192) (29) – Impairment (refer note 4) – (29)
534 972 972 534
Software and licences are assessed as having a finite life and are amortised on a straight-line basis over a period of three to five years.
12. Investments in subsidiaries (refer annexure D)
208 3 Shares at carrying value 389 392 Amounts owing by subsidiaries
597 395 (389) (392) Provision for impairment and losses
208 3
13. Investments in associates and joint ventures (refer annnexure D)
10 9 105 93
12 10 Balance at the beginning of the year 93 72 (3) – Disposals – (3)
– – Equity accounted earnings 14 24 – – Dividends received (1) (1) – (1) Repayment of loans (1) – 1 – Reversal of impairments – 1
10 9 Directors’ valuation of unlisted investments in
105 93
14 24

73
Company Group
2013 R million
2014 R million
2014 R million
2013 R million
14. Derivative financial assets and liabilitiesBoth the Company and the Group use approved financial instruments, in particular forward exchange contracts, cross-currency swaps, options and interest rate swaps to hedge the financial risks associated with underlying business activities. All derivative financial instruments have been measured at fair value with the resulting gain or loss taken to the statement of comprehensive income.
3 855 7 404 Derivative financial assets 7 404 3 855
502 3 855 Opening balance 3 855 502 2 652 2 850 2 850 2 652
701 699 Derivatives raised and settled 699 701
85 83 Derivative financial liabilities 83 85
144 85 Opening balance 85 144 68 90 90 68
(127) (92) Derivatives raised and settled (92) (127)
2 584 2 760 Net fair value adjustments 2 760 2 584
98 (372) (372) 98 (1 004) (1 067) Finance costs (1 067) (1 004)
3 490 4 199Recognised in other comprehensive income (refer note 22) 4 199 3 490
Comprise the following financial instruments: 3 821 7 346 Non-current assets 7 346 3 821
– 6 Forward exchange contracts 6 – 3 821 7 340 Cross-currency swaps and options 7 340 3 821
34 58 Current assets 58 34
34 18 Forward exchange contracts 18 34 – 40 Cross-currency swaps and options 40 –
62 46 Non-current liabilities 46 62
62 46 Forward exchange contracts 46 62
23 37 Current liabilities 37 23
23 37 Forward exchange contracts 37 23

ANNUAL FINANCIAL STATEMENTS 201474
NOTES TO THE ANNUAL FINANCIAL STATEMENTS FOR THE YEAR ENDED 31 MARCH 2014(continued)
Company Group
2013 R million
2014 R million
2014 R million
2013 R million
14. Derivative financial assets and liabilities (continued)Fair value hedges of firm commitments
The Group entered into fair value hedges of the foreign exchange risk on firm commitments of the Group to import items of property, plant and equipment. The Group settles the contract price of these items by making pre-determined progress payments (in foreign currency) to the relevant suppliers as specified milestones are achieved.
At 31 March 2014, the Group held a series of forward exchange contracts as hedging instruments for this purpose. These hedges were assessed to be effective. The ineffective portion of the hedge has been recorded in profit and loss.
The fair values of these forward exchange contracts held as hedging instruments at 31 March 2014 are as follows:
12 – Currency bought forward – Japanese Yen profit – 12 5 – Currency bought forward – Australian Dollar
profit– 5
15 (2) Currency bought forward – United States Dollar (loss)/profit
(2) 15
(83) (57) Currency bought forward – Euro loss (57) (83)
The net fair value gain/(loss) recognised in profit or loss on these fair value hedges during the year was Rnil (2013: Rnil). This net fair value
(2013: R150 million) with respect to foreign exchange risk on the firm commitments, and a gain of R11 million (2013: R150 million) on the forward exchange contracts.The nominal values of these forward exchange contracts at 31 March 2014 are as follows:Currency bought forward – Rand equivalent
337 – Japanese Yen – 337 82 16 Australian Dollar 16 82
407 367 United States Dollar 367 407 164 286 Euro 286 164
million million million million
Currency bought forward – foreign currency
3 501 – Japanese Yen – 3 501 9 2 Australian Dollar 2 9
45 34 United States Dollar 34 45 6 15 Euro 15 6

75
Company Group
2013 R million
2014 R million
2014 R million
2013 R million
14. Derivative financial assets and liabilities (continued)Cash flow hedges
Cross-currency interest rate swapsOn 31 March 2014, the Group was party to cross-currency interest rate swap contracts which are designated as cash flow hedges of the foreign exchange rate and interest rate risks associated with foreign currency-denominated borrowings listed below.
the Japan Bank for International Cooperation (JBIC) for JPY16,5 billion and JPY4,0 billion respectively, the American Family Life Assurance Company of Columbus (AFLAC) Japan Branch for JPY15 billion, African Development Bank (AfDB) for USD369 million, Export Development Canada (EDC) for USD100 million, a US Dollar bond for USD750 million (TNUS16), a US Dollar bond for USD1 billion (TNUS22) under the GMTN programme, and a loan from KFW Ipex Bank for EUR49 million.Under the hedge for the first tranche of the JBIC
receives LIBOR +1,48% (JPY). Under the hedge for the second tranche of the JBIC loan, the Group pays
(JPY). Under the hedge for the AFLAC loan, the
fixed (JPY). Under the hedge for the AfDB loan the
+ 1,75% USD). Under the hedge for the EDC loan the
1,75% (USD). Under the hedge for the TNUS16 bond,
4,5% fixed (USD). The TNUS22 bond was hedged in two equal parts of USD500 million each. Under the hedge for the first tranche of the TNUS22 bond,
fixed (USD). Under the hedge for the second tranche of the TNUS22 bond, the Group pays
(US dollar). Under the hedge for the KFW-Ipex loan
six-month Euribor plus 1,3% (EUR).

ANNUAL FINANCIAL STATEMENTS 201476
NOTES TO THE ANNUAL FINANCIAL STATEMENTS FOR THE YEAR ENDED 31 MARCH 2014(continued)
Company Group
2013 R million
2014 R million
2014 R million
2013 R million
14. Derivative financial assets and liabilities (continued)The terms of the cross-currency interest rate swaps closely match those of the foreign currency-denominated borrowings they hedge and were assessed as highly effective hedges. The amount of ineffectiveness recognised in profit and loss for the period with respect to these hedges was a R439 million loss (2013: R18 million gain), largely due to the inclusion of credit risk in the measurement of the swaps. The amount recycled to profit and loss to offset the hedged risks was R3 004 million credit (2013: R3 161 million credit), included in finance costs.
annually in February and August until February 2021 on the JBIC hedge, semi-annually in May and November until November 2019 on the AFLAC hedge, semi-annually in February and August until February 2016 on the TNUS16 bond hedge, semi-annually in February and August until August 2018 on the AfDB hedge, semi-annually in May and November until November 2018 on the EDC hedge, semi-annually in July and January until July 2022 on both tranches of the TNUS22 bond hedge , semi- annually in March and September until March 2019 on the KFW-Ipex Bank swap.
203 340 JBIC 340 203
71 249 AFLAC 249 71
604 1 129 AfDB 1 129 604
12 155 EDC 155 12
1 561 2 597 TNUS16 2 597 1 561
1 370 2 865 TNUS22 2 865 1 370
– 50 Euro 50 –
The nominal amounts of the cross-currency interest rate swaps at 31 March 2014 are as follows:
20 901 20 346 South African Rand 20 346 20 901 38 408 35 482 Japanese Yen 35 482 38 408
2 260 2 219 United States Dollar 2 219 2 260
Option contracts
The Group’s operating activities expose it to volatility in the cost of fuel, in particular diesel. To mitigate this risk, the Group enters into commodity (gas oil) option contracts to hedge the exposure. Hedge accounting is not applied to these hedges.
– 45The fair values of these option contracts at 31 March 2014 amounts to: 45 –

77
Company Group
2013 R million
2014 R million
2014 R million
2013 R million
15. Long-term loans and advances 4 29 29 4 2 4 Balance at the beginning of the year 4 2 (1) (5) Repayments (5) (1) 3 30 Reversal of impairment 30 3
Comprising:2 27 Employee housing and other loans* 27 2
– 2 Balance at the beginning of the year 2 – (1) (5) Repayments (5) (1) 3 30 Reversal of impairment 30 3 2 2 Other loans and advances 2 2
2 2 Balance at the beginning of the year 2 2
4 29 29 4
* The loans are repayable over periods ranging from 1 to 20 years and bear interest between 5,0% to 12,0% per annum.
16. Other investments, long-term financial assets and other liabilities
671 716 Other financial assets 716 671
671 716 Total long-term investments and long-term
financial assets 716 671
1 359 67 Short-term portion of other investments including investments under resale agreement 67 1 359
1 359 67 Total short-term investments 67 1 359
3 847 3 794 Security of supply petroleum levy 3 794 3 847 9 4 Other 4 9
3 856 3 798 3 798 3 856 2 138 707 Deferred income National Ports Authority 707 2 138 2 137 3 038 Balance at the beginning of the year 3 038 2 137 (540) (2 007) Unwinding of prior year claw back (2 007) (540)
1 263 1 942 Additional claw back raised 1 942 1 263 178 (39) Interest factor on claw back (39) 178
3 038 2 934 2 934 3 038
(900) (2 227)Less: Short-term portion classified as current liabilities (2 227) (900)
227 110 Deferred income Pipelines 110 227 485 403 Balance at the beginning of the year 403 485
(485) (176) Unwinding of prior year claw back (176) (485) 403 150 Additional claw back raised 150 403 403 377 377 403
(227) (334)Less: Short-term portion classified as current liabilities (334) (227)
51 67 Add: Long-term portion classified as non-current asset 67 51
6 221 4 615 Total other non-current liabilities 4 615 6 221 1 127 2 561 Total other current liabilities 2 561 1 127

ANNUAL FINANCIAL STATEMENTS 201478
NOTES TO THE ANNUAL FINANCIAL STATEMENTS FOR THE YEAR ENDED 31 MARCH 2014(continued)
Company Group
2013 R million
2014 R million
2014 R million
2013 R million
17. InventoriesAt weighted average cost
2 207 1 931 Maintenance material 1 931 2 207 369 469 Consumables 469 369 187 183 Finished goods 183 187
264 116 Work-in-progress* 116 264 (330) (237) Provision for stock obsolescence** (237) (330)
2 697 2 462 2 462 2 697 At net realisable value
705 786 Maintenance material 786 705 37 43 Consumables 43 37
– – Finished goods – – (39) (50) Provision for stock obsolescence** (50) (39)
703 779 779 703 3 400 3 241 3 241 3 400
* Included in work-in-progress are costs for construction contracts in progress (refer note 27).
** The movement in the provision for stock obsolescence is due to slow moving items assessed at the end of the current financial year. No items of inventory have been pledged as security as at 31 March 2014 (2013: R nil).
18. Trade and other receivables 4 920 6 080 Trade receivables – net of allowance for credit losses 6 081 4 923
236 590 Amounts due from customers under construction contracts (refer note 27) 590 236
15 32 Retention debtors (refer note 27) 32 15 1 070 1 065 Prepayments and other amounts receivable 1 069 1 072
2 2 Short-term portion of loans and advances 2 2 6 243 7 769 7 774 6 248
Risk profile of allowances for credit losses
(Refer annexure A)Low risk
(595) (644) Opening balance (644) (595) (65) (322) Raised (322) (65)
15 1 Utilised 1 15 1 – Disposal – 1
(644) (965) Closing balance (965) (644)Medium risk
(32) (43) Opening balance (43) (32) (49) (23) Raised (23) (49)
1 – Utilised – 1 37 37 Disposal 37 37
(43) (29) Closing balance (29) (43)High risk
(295) (348) Opening balance (364) (312) (105) (72) Raised (72) (105)
52 35 Utilised 33 53 (348) (385) Closing balance (403) (364)
Total provisions (922) (1 035) Opening balance (1 051) (939) (219) (417) Raised (417) (219)
68 36 Utilised 34 69 38 37 Disposal 37 38
(1 035) (1 379) Closing balance (1 397) (1 051)

79
Company Group
2013 R million
2014 R million
2014 R million
2013 R million
19. Cash and cash equivalents 2 258 3 508 Cash and cash equivalents* 3 633 2 598
2 258 3 508 3 633 2 598
* Included in cash and cash equivalents are restricted benevolent accounts amounting to R138 million (2013: R131 million).
20. Assets classified as held-for-sale (refer annexure C)Non-current assets classified as held-for-sale
158 148 Property, plant and equipment 148 158 3 6 Investment property 6 3
114 84 Other investments 84 114
275 238 238 275
21. Issued capitalAuthorised
30 000 30 000 30 000 000 000 ordinary par value shares of R1 each 30 000 30 000
Issued
12 661 12 661 12 660 986 310 ordinary par value shares of R1 each (2013: 12 660 986 310). 12 661 12 661
The unissued share capital is under the control of the South African Government, the sole shareholder of the Company.Capital management
The Board’s policy is to maintain a strong capital base to maintain investor, creditor and market confidence to support future growth of the business. Capital efficiency is measured in terms of returns on equity and the asset base, as well as the gearing ratio, which is monitored by the Board. The capital structure of the Group consists of equity attributable to the equity holder, the South African Government, comprising issued capital, non-distributable reserves and retained earnings as disclosed in notes 21 and 22. Other than loan covenants,
externally imposed capital requirements.
Based on the significant capital investment plan of the Company, as well as its revenue generating ability, the target debt to equity ratio will remain below the 50% limit that forms part of the Shareholder's Compact with the Shareholder Representative (2014: actual 45,9%).There were no changes to the capital management approach during the year.

ANNUAL FINANCIAL STATEMENTS 201480
NOTES TO THE ANNUAL FINANCIAL STATEMENTS FOR THE YEAR ENDED 31 MARCH 2014(continued)
Company Group
2013Restated
R million
2014
R million
2014
R million
2013Restated
R million
22. Reserves 31 760 37 711 Revaluation reserve 37 711 31 760
3 942 4 435 Revaluation of pipeline networks 4 435 3 942
3 612 3 942 Balance at the beginning of the year 3 942 3 612 423 467 Revaluation during the year 467 423
(93) 26 Decommissioning restoration liability
26 (93)
39 048 46 831 Revaluation of port facilities 46 831 39 048
37 723 39 048 Balance at the beginning of the year 39 048 37 723 1 325 7 783 Revaluation during the year 7 783 1 325
890 917 Revaluation of land, buildings and structures* 917 890
881 890 Balance at the beginning of the year 890 881 9 27 Fair value movement during the year 27 9
108 74 ALL Group Ltd (refer Annexure D) – revaluation of investment to market value 74 108
– 108 Balance at the beginning of the year 108 92 92 – Transfer in on liquidation of subsidiary – – 16 (34) Fair value movement during the year (34) 16
(12 228) (14 546)Deferred taxation impact of items relating to revaluation reserves (14 546) (12 228)
– – Foreign currency translation reserve – (5)
– – Balance at the beginning of the year (5) 20 – – Gains/(losses) arising during the year 5 (25)
161 1 026 Cash flow hedging reserve 1 026 161
224 1 419 Gross cash flow hedging reserve 1 419 224
(105) 224 Balance at the beginning of the year 224 (105) 3 490 4 199 Gains arising during the year 4 199 3 490 (3 161) (3004) Transfer to foreign exchange differences (3 004) (3 161)
(63) (393)Deferred taxation impact of items relating to cash flow hedging reserve (393) (63)
1 965 2 132 Actuarial gains on post-retirement benefit
obligations 2 132 1 965
2 733 2 971 Gross actuarial gains on post-retirement benefit obligations 2 971 2 733
2 761 2 733 Balance at the beginning of the year 2 733 2 761 (28) 238 Gains/(losses) arising during the year 238 (28)
(768) (839) Deferred taxation impact of net actuarial gains (839) (768)
250 250 Other reserves 249 249
250 250 Share of pension fund surplus (retained for application against pensioners) 249 249
37 978 43 145 Retained earnings 43 334 38 163
33 943 37 978 Balance at the beginning of the year 38 163 34 024
4 035 5 167 Profit for the year attributable to the equity holder 5 171 4 139
72 114 84 264 84 452 72 293
* Assets revalued upon transfer to ivestment property.

81
Company Group
2013Restated
R million
2014
R million
2014
R million
2013Restated
R million
23. Employee benefits 1 959 1 668 Post-retirement benefit obligations 1 668 1 959
2 003 1 959 Balance at the beginning of the year 1 959 2 003 181 185 Income statement charge 185 181
(253) (238) Settlements during the year (238) (253) 28 (238) Actuarial (gain)/loss (238) 28
Comprising:
– – Transport Pension Fund: Transnet Sub-fund (refer note 32.1.2) – –
– – Transnet Second Defined Benefit Fund (refer note 32.1.3) – –
89 76 Transnet Top Management Pension (refer note 32.1.4) 76 89
481 440 Transnet Workmen’s Compensation Act pensioners (refer note 32.1.4) 440 481
832 689 Transnet SATS pensioners’ post-retirement medical benefits (refer note 32.2.1) 689 832
557 463 Transnet employees post-retirement medical benefits (refer note 32.2.2) 463 557
1 959 1 668 1 668 1 959
Various assumptions have been applied by management and actuaries in the calculation of post-retirement benefit obligations. The assumptions and their sensitivities are disclosed in note 32.
70 75 Other post-retirement and medical benefits 75 70
533 176 Balance at the beginning of the year 176 533 70 203 Income statement charge 203 70
(427) (206) Utilised during the year (206) (427)
176 173 173 176
(106) (98)Less: Short-term portion classified as current liabilities (98) (106)
709 807 Leave pay 807 709
1 440 1 743 Balance at the beginning of the year 1 743 1 440 764 686 Accruals made during the year 686 764 (461) (479) Utilised during the year (479) (461)
1 743 1 950 1 950 1 743
(1 034) (1 143)Less: Short-term portion classified as current liabilities (1 143) (1 034)
379 418 Incentive bonuses 418 379
2 259 1 096 Balance at the beginning of the year 1 096 2 259 772 1 555 Accruals made during the year 1 555 772
(1 935) (795) Utilised during the year (795) (1 935)
1 096 1 856 1 856 1 096
(717) (1 438)Less: Short-term portion classified as current liabilities (1 438) (717)
3 117 2 968 Total employee benefits 2 968 3 117

ANNUAL FINANCIAL STATEMENTS 201482
NOTES TO THE ANNUAL FINANCIAL STATEMENTS FOR THE YEAR ENDED 31 MARCH 2014(continued)
Company Group
2013Restated
R million
2014
R million
2014
R million
2013Restated
R million
23. Employee benefits (continued)Other post-retirement and medical benefits
Included in total employee benefits is an amount of R128 million (2013: R106 million) for the restructuring of the SATS pensioners’ medical subsidy and R75 million (2013: R70 million) relating to an ex gratia payment to disadvantaged Transnet Second Defined Benefit Fund and Transport Pension Fund: Transnet Sub-fund pensioners.Leave pay
Relates to accrual for unutilised leave at year-end. The leave is expected to be taken over the next two financial years and is calculated based on employee total cost to Company.Incentive bonuses
Accrual for incentive bonuses in terms of the incentive bonus scheme.
24. Long-term borrowings (refer annexure A)
66 768 82 993 82 995 66 770
52 564 66 768 Total long-term borrowings at the beginning of the year 66 770 52 566
16 743 15 724 Raised 15 724 16 743 3 010 2 827 Foreign exchange movement 2 827 3 010
38 31 Amortisation of discount 31 38
(5 587) (2 357)
Current portion of long-term borrowings redeemable within one year transferred to short-term borrowings (refer note 29) (2 357) (5 587)
Unsecured liabilities
43 477 53 069 Rand denominated 53 069 43 477
35 728 46 429 Bonds at nominal value 46 429 35 728 (687) (561) Unamortised discounts (561) (687)
35 041 45 868 Bonds at carrying value# 45 868 35 041 8 436 7 201 Other unsecured liabilities* 7 201 8 436
24 641 27 554 Foreign currency denominated+ 27 554 24 641
16 252 18 410 Bonds at nominal value 18 410 16 252 (125) (125) Unamortised discounts (125) (125)
16 127 18 285 Bonds at carrying value 18 285 16 127 8 514 9 269 Other unsecured liabilities 9 269 8 514
4 237 4 727 Secured loans** and capitalised finance leases^ 4 729 4 239
4 237 4 727 Rand denominated 4 727 4 237 – – Foreign currency denominated 2 2
72 355 85 350 Total long-term borrowings 85 352 72 357

83
Company Group
2013 R million
2014 R million
2014 R million
2013 R million
24. Long-term borrowings (refer annexure A) (continued)
(5 587) (2 357)
Current portion of long-term borrowings redeemable within one year transferred to short-term borrowings (refer note 29) (2 357) (5 587)
66 768 82 993 82 995 66 770
# Rand-denominated secured Eurorand bonds bear interest between 10,0% and 13,5% and are repayable in 2028 and 2029 (refer annexure A).
The Rand-denominated unsecured and non-guaranteed bonds are redeemable between 10 June 2016 and 14 November 2027 and bear interest at a rate between 6,83% and 10,8%.
† Foreign currency bonds are denominated in United States Dollar are redeemable between 10 February 2016 and 26 July 2022, and bears interest at a rate between 4,0% and 4,5%.
Foreign currency unsecured loans are denominated in Japanese Yen and United States Dollar, bears interest at rates between 1,669% and 2,7%, and is repayable between 1 August 2018 and 20 February 2021.
* Rand-denominated unsecured domestic loans bear interest at rates ranging between 6,117% and 10,95%. These liabilities are repayable over periods between 15 March 2019 and 30 November 2024.
** Rand-denominated secured loans bear interest at rates ranging between 6,125% and 8,85% with floating rates linked to JIBAR. These liabilities are repayable over periods between 30 April 2020 and 15 September 2023.
^ Rand-denominated capitalised finance lease liabilities bear interest at rates ranging between 11,0% and 16,93% with all rates fixed. These liabilities are repayable over periods between 2013 and 2027.

ANNUAL FINANCIAL STATEMENTS 201484
NOTES TO THE ANNUAL FINANCIAL STATEMENTS FOR THE YEAR ENDED 31 MARCH 2014(continued)
Company Group
2013 R million
2014 R million
2014 R million
2013 R million
25. Provisions 1 902 1 890 Comprising 1 890 1 902
1 626 1 902 Total provisions at the beginning of the year 1 902 1 626
1 719 552 Provisions raised during the year and unwinding of discounts 552 1 719
(1 386) (739) Provisions utilised (739) (1 386)
(57) 175 Decrease/(increase) in short-term provisions classified as current liabilities 175 (57)
189 340 Third-party claims 340 189
159 189 Balance at the beginning of the year 189 159 201 368 Provisions raised during the year 368 201 (171) (217) Utilised during the year (217) (171)
44 33 Customer claims 33 44
40 44 Balance at the beginning of the year 44 40 4 – Provisions raised during the year – 4 – (11) Utilised during the year (11) –
2 037 2 026 Decommissioning and environmental liabilities 2 026 2 037
1 828 2 037 Balance at the beginning of the year 2 037 1 828
350 33 Provisions raised during the year and unwinding of discounts 33 350
(141) (44) Utilised during the year (44) (141)
29 24 Restructuring 24 29
29 29 Balance at the beginning of the year 29 29 – (5) Utilised during the year (5) –
594 283 Other 283 594
504 594 Balance at the beginning of the year 594 504 1 164 151 Provisions raised during the year 151 1 164
(1 074) (462) Utilised during the year (462) (1 074)
2 893 2 706 Total provisions 2 706 2 893
991 816 Less: short-term provisions classified as current liabilities 816 991
179 340 Third-party claims 340 179 44 33 Customer claims 33 44
174 160 Decommissioning and environmental liabilities 160 174 594 283 Other 283 594
1 902 1 890 Long-term provisions 1 890 1 902
Various assumptions are applied in arriving at the carrying value of provisions that are recognised in terms of the requirements of IAS 37: Provisions, Contingent Liabilities and Contingent Assets.Management further relies on input from the Group’s lawyers in assessing the probability on matters of a contingent nature. Contingent liabilities are disclosed in note 31.

85
Company Group
2013 R million
2014 R million
2014 R million
2013 R million
25. Provisions (continued)Third-party claims
This provision represents the best estimate of known third-party claims together with an allowance for claims incurred but not yet reported based on historical experience.
Customer claims
This provision represents claims made by customers arising from non-performance on contracts or damage to goods in transit. Settlement of claims are expected in the following year.
Decommissioning and environmental liabilities
This is a provision for the dismantling and removal of an asset as a result of the requirement to restore the site on which the asset is located. The provision has been computed by discounting future cash flows.
In accordance with the Group’s environmental policy and applicable legal requirements, a provision for environmental rehabilitation in respect of clean-up costs is recognised when it meets the recognition requirements for provisions. The provision includes the estimated rehabilitation costs for the historical contamination caused by asbestos as well as costs for the rehabilitation caused by ferromanganese, manganese, mixed soil (including chrome, sulphur and manganese) fuel and rubble contamination.
Environmental provisions for the remediation of soil contaminated areas have been raised. These include provisions for the removal of asbestos, ferromanganese, manganese, mixed soil (including chrome, sulphur and manganese) fuel and rubble. These obligations arise from environmental legislation requiring Transnet to remove this waste material and remediate the land. Transnet engaged external consultants to perform risk assessments on identified areas of contamination and the Group’s related rehabilitation obligation. A number of factors were considered in determining the obligation, which included:
removal and disposal of the contamination.
areas of contamination.
replacement of asbestos roof sheeting and cladding on buildings.
Restructuring
Provision for restructuring costs in terms of strategic plans.

ANNUAL FINANCIAL STATEMENTS 201486
NOTES TO THE ANNUAL FINANCIAL STATEMENTS FOR THE YEAR ENDED 31 MARCH 2014(continued)
Company Group
2013Restated
R million
2014
R million
2014
R million
2013Restated
R million
26. Deferred taxation liabilities 20 471 25 209 Comprising: 25 209 20 471
18 029 20 471 Opening balance 20 471 18 050 1 858 2 019 Income statement charge (refer note 8) 2 019 1 859
584 2 719 Raised in other comprehensive income 2 719 562
differences 5 952 6 689 Deferred taxation assets 6 689 5 952
871 957 Provisions 957 871 1 565 1 693 Employee benefit obligations 1 693 1 565
2 138 2 146 Revenue received in advance and deferred income 2 146 2 138
1 075 925 Capitalised lease liability 925 1 075 303 295 Doubtful debts 295 303
– 673 Estimated taxation loss 673 –
26 423 31 898 Deferred taxation liabilities 31 898 26 423
147 164 Deferred expenditure 164 147 26 138 31 390 Property, plant and equipment 31 390 26 138
43 25 Future expenditure allowance 25 43 – 265 Cross-currency swaps 265 –
95 54 Other 54 95
20 471 25 209 Net deferred taxation liability 25 209 20 471
27. Construction contractsContracts in progress at the statement of
financial position date:
981 1 634 Construction costs incurred plus recognised profits less losses to date 1 634 981
(749) (1 045) Less: Progress billings (1 045) (749)
232 589 589 232
Recognised and included in the financial statements:Income statements
764 1 077 Contract revenue (refer note 1) 1 077 764
Statements of financial position
236 590 Amounts due from customers under construction contracts (refer note 18) 590 236
15 32 Retention debtors (refer note 18) 32 15
Contract revenue is recognised when the completed stage has been signed-off as proof of quality satisfaction by the external customer.

87
Company Group
2013 R million
2014R million
2014R million
2013 R million
28 Trade payables and accruals 3 650 3 456 Trade payables 3 460 3 654
8 199 10 873 Accruals 10 897 8 230
3 795 5 118 Accrued expenditure 5 142 3 826 147 111 Deposits received 111 147
1 500 1 592 Accrued interest 1 592 1 500 544 675 Personnel costs 675 544 296 393 Revenue received in advance 393 296
106 98 Other post-retirement and medical benefits (refer note 23) 98 106
1 034 1 143 Leave pay (refer note 23) 1 143 1 034 717 1 438 Incentive bonus (refer note 23) 1 438 717
60 305 SARS – value added taxation 305 60
11 849 14 329 14 357 11 884
29. Short-term borrowings
5 587 2 357 Current portion of long-term interest-bearing borrowings (refer note 24) 2 357 5 587
731 5 092 Other short-term borrowings 5 092 731
6 318 7 449 7 449 6 318
Other short-term borrowings relate to the market making portfolio and comprises the Group’s position on bonds and other financial instruments.The short-term borrowings bear interest at rates between 1,669% and 10,95%, is repayable between April 2014 and March 2015 and are not guaranteed.
30. Commitments30.1 Capital commitments*
216 54 Contracted for in US Dollars 54 216 312 – Contracted for in Japanese Yen – 312 83 107 Contracted for in Euros 107 83
13 998 140 880 Contracted for in South African Rands 140 880 13 998 41 22 Contracted for in various other currencies 22 41
14 650 141 063 Total capital commitments contracted for 141 063 14 650
292 802 171 090Authorised by the Directors but not yet contracted for 171 090 292 802
307 452 312 153 312 153 307 452
Total capital commitments are expected to be incurred as follows:
28 581 30 613 Within one year 30 613 28 581 198 055 182 158 After one year, but not more than five years 182 158 198 055
80 816 99 382 After five years, but not more than seven years 99 382 80 816
307 452 312 153 312 153 307 452

ANNUAL FINANCIAL STATEMENTS 201488
NOTES TO THE ANNUAL FINANCIAL STATEMENTS FOR THE YEAR ENDED 31 MARCH 2014(continued)
Company Group
2013 R million
2014R million
2014R million
2013 R million
30. Commitments (continued)30.2 Operating lease commitments
These capital commitments will be financed utilising net cash flows from operations, debt
use of operating leases.* Excludes capitalised borrowing costs of
R18 894 million (2013: R10 540 million).
Future minimum rentals under non-cancellable leases are as follows:Land, buildings and structures
116 138 Within one year 138 116 382 423 After one year, but not more than five years 423 382 351 296 More than five years 296 351
849 857 857 849
Aircraft, machinery, equipment, furniture and motor vehicles
115 102 Within one year 102 115 224 246 After one year, but not more than five years 246 224
7 1 More than five years 1 7
346 349 349 346
Security and maintenance contracts 130 90 Within one year 90 130
24 22 After one year, but not more than five years 22 24
154 112 112 154
Other 105 34 Within one year 34 105 118 12 After one year, but not more than five years 12 118
223 46 46 223
The operating leases relate mainly to leases of vehicles from McCarthy, Bidvest and other companies. These leases have varying terms. On certain leases, contingent rent is payable for vehicles that exceed the fixed kilometres on a monthly basis.
30.3 Finance lease commitmentsThe finance leases relate to the Kimberley De Aar transmission line and computer equipment. These finance leases have a lease term ranging between three to 15 years. The interest rates vary from 11,25% to 16,93%. Future minimum lease payments under finance leases together with the present value of the net minimum lease payments are as follows:Machinery, equipment and furniture
28 35 Within one year 35 28 58 66 After one year, but not more than five years 66 58
109 98 More than five years 98 109
195 199 Total minimum lease payments 199 195 (107) (100) Amount representing finance charges (100) (107)

89
Company Group
2013 R million
2014R million
2014R million
2013 R million
30. Commitments (continued)30.3 Finance lease commitments (continued)
88 99 Present value of minimum lease payments 99 88
Included in the financial statements as: 16 21 – Current borrowings 21 16
72 78 – Non-current borrowings 78 72
88 99 99 88
30.4 Lease rentals receivableFuture minimum rentals under operating leases are as follows:Property
1 235 1 588 Within one year 1 588 1 235 3 625 4 961 After one year, but not more than five years 4 961 3 625 4 344 7 397 More than five years 7 397 4 344
9 204 13 946 13 946 9 204
Other 24 24 Within one year 24 24
24 24 24 24
The lease rentals relate mainly to land and buildings. These are mainly short-term rentals with an escalation varying from 8,0% to 10,0%.
31. Contingent liabilities and guaranteesAsbestos roof and asbestos cladding
– –
Transnet owns buildings with asbestos roofs and asbestos cladding. In terms of the Asbestos Regulations of 2001, Transnet is responsible for taking reasonable steps to determine the location of asbestos in the workplace for the purposes of managing the potential risk associated with such materials. The assessment for the potential risk of exposure and the cost of removal is a complex scientific process which requires the expertise of an environmental specialist. In certain cases the asbestos cladding is of low friability ie dust fibres released is negligible/non-existent and therefore maintenance and inspection of the contamination is the preferred rehabilitation option, until the roofs and cladding is removed and replaced. – –
258 225Various contingent liabilities where no material
losses are expected to materialise 225 258
30 45
Various contingent assets where the inflow of
economic benefits is probable, but not
virtually certain 45 30

ANNUAL FINANCIAL STATEMENTS 201490
NOTES TO THE ANNUAL FINANCIAL STATEMENTS FOR THE YEAR ENDED 31 MARCH 2014(continued)
32. Post-retirement benefit obligations The Group offers pension benefits through two defined benefit pension funds and one defined
contribution fund. The Group also offers post-retirement medical benefits to its employees. Specific retirement benefits are offered to top management and under the Workmen’s Compensation Act. The following sections summarise the relevant components of the pension benefits and post-retirement medical benefits. (All amounts disclosed are equal for Company and Group unless otherwise stated).
32.1 Pension benefits
Transnet Sub-fund and Transnet Second Defined Benefit Fund. Except for the Transnet Retirement Fund, actuarial valuations are performed annually in accordance with IAS 19 Employee Benefits. The Transnet Pension Funds are governed by the Transnet Pension Fund Act, No 62 of 1990, as amended.
32.1.1 Transnet Retirement Fund The fund is structured as a defined contribution fund and all employees of the Group are eligible
members of the fund. There were 65 443 members at 31 March 2014 (2013: 66 322). Actuarial valuations are performed annually to determine the financial position of the fund. The last actuarial valuation was performed as at 31 March 2013 and the actuaries were satisfied with the status of the member’s credit account as at that date. The total contributions to this fund constitute member contributions of R896 million (2013: R946 million) and employer contributions of R886 million (2013: R946 million).
32.1.2 Transport Pension Fund: Transnet Sub-fund The fund is a defined benefit pension fund. The fund has been closed to new members since
1 December 2000. Members are current employees of Transnet who elected to remain as members of the fund at 1 November 2000 and pensioner members who retired subsequent to that date.
Members of the fund are entitled to minimum benefits as per the Pensions Fund Second Amendment Act, 2001, as set out in section 14A of the Act. This minimum benefit is defined in section 14B(2)(a) of the Act as the fair value equivalent of the present value of the member’s accrued deferred pension calculated at a prescribed rate of discount.
The Transnet Pension Fund Amendment Act, promulgated in the latter part of 2007, changed the name of the fund with effect from 11 November 2005 to the Transport Pension Fund. This Act restructured the Transport Pension Fund (formerly the Transnet Pension Fund) into a multi-employer pension fund. From the date this Act came into operation, all existing members, pensioners, dependant pensioners, liabilities, assets, rights and obligations, of the Transport Pension Fund, were attributed to three Sub-funds, with Transnet as the principal employer for one of the Sub-funds. In terms of these Act amendments a Sub-fund in the name of South African Airways (Pty) Ltd was also established as at 1 April 2006, with South African Airways (Pty) Limited as the principal Employer of that Sub-fund, and a further Sub-fund in the name of the South African Rail Commuter Corporation Ltd (now Passenger Rail Agency of South Africa) was established with effect from 1 May 2006, with the South African Rail Commuter Corporation Ltd as the principal employer of that Sub-fund.
All active members and pensioner members relating to South African Airways (Pty) Ltd and the South African Rail Commuter Corporation Ltd were assigned to these new Sub-funds. The Transport Pension Fund therefore comprises three independent and separate Sub-funds, each with their own principal employer. An employer’s liability to the Transport Pension Fund is limited to those attributable to its members, pensioners and dependent pensioners assigned to its Sub-fund.
There were 4 975 members and pensioners at 31 March 2014 (2013: 5 044). The fund gives members the option to transfer to the Transnet Retirement Fund twice a year. Altogether, 13 members opted to transfer to the Transnet Retirement Fund in the current year (2013: 15). The effect of this transfer is noted on the next page.

91
Group
2014 R million
2013 R million
32. Post-retirement benefit obligations (continued) 32.1 Pension benefits (continued) 32.1.2 Transport Pension Fund: Transnet Sub-fund (continued)
credit method. The principal actuarial assumptions used are as follows:Discount rate (%) 8,65 7,19 Inflation rate (%) 6,37 5,75 Salary increase rate (%) 7,37 6,75 Pension increase allowance (%) 2,00 2,00 The results of the actuarial valuation are as follows:Benefit liabilityPresent value of obligation (3 072) (3 487)Fair value of plan assets 5 364 5 235
Surplus 2 292 1 748 Unrecognised asset (2 292) (1 748)
Net asset/(liability) recognised in the statement of financial position – –
The liability recognised for this fund relating to the Company amounts to R nil (2013: R nil).The surplus was not recognised as the rules of the fund do not provide for the surpluses to be distributed.Net expense recognised in profit or lossService cost (31) (22)Net interest income 124 141
93 119 Less: Interest on asset limit (126) (142)
(33) (23)
Actual return on plan assets 481 684 Total remeasurements recognised in other comprehensive income for the year 20 9
– Net actuarial gain/(loss) 438 (73)– Interest on asset limit 126 142 – Increase in asset not recognised (544) (60)
Movements in the net asset/(liability) recognised in the statement of financial positionOpening net asset 1 748 1 688 Profit or loss as above (33) (23)Remeasurements – actuarial gain/(loss) 438 (73)
– interest on asset limit 126 142 Contributions paid by employer 13 14
Closing net asset 2 292 1 748 Asset not recognised (2 292) (1 748)
Net asset/(liability) recognised in the statement of financial position – –
Reconciliation of movement in benefit liabilityOpening benefit liability (3 487) (3 146)Service cost (31) (22)Contributions by members (9) (10)Interest cost (240) (255)Actuarial gain/(loss) 321 (361)
– Change in economic assumptions 393 (343) (36) (1)
– Bonus award to pensioners (36) (17)

ANNUAL FINANCIAL STATEMENTS 201492
NOTES TO THE ANNUAL FINANCIAL STATEMENTS FOR THE YEAR ENDED 31 MARCH 2014(continued)
Group
2014 R million
2013 R million
32. Post-retirement benefit obligations (continued) 32.1 Pension benefits (continued) 32.1.2 Transport Pension Fund: Transnet Sub-fund (continued)
Benefits paid 360 295 Expenses 2 1
(3 084) (3 498)Transfer to the retirement fund 12 11
Closing benefit liability (3 072) (3 487)
Reconciliation of movement in fair value of plan assetsOpening fair value of plan assets 5 235 4 834 Interest income 364 396 Actuarial gain 117 288 Contributions by employer and members 22 24 Benefits paid (360) (295)Expenses (2) (1)
5 376 5 246 Transfer to the retirement fund (12) (11)
Closing fair value of plan assets 5 364 5 235
The estimated contributions by both employer and members for the year beginning 1 April 2014 amount to R22 million (1 April 2013: R24 million).Sensitivity analysisClosing benefit liability based on changes in the discount rate:7,65% (2013: 6,19%) 3 356 3 8459,65% (2013: 8,19%) 2 828 3 183Closing benefit liability based on changes in the inflation rate:5,37% (2013: 4,75%) 3 025 3 4377,37% (2013: 6,75%) 3 124 3 542
Equity – local and international (%) 73 63Property (%) – 1Bonds (%) 27 33Cash (%) – 3
Total 100 100
32.1.3 Transnet Second Defined Benefit FundThe fund was established on 1 November 2000 for the benefit of existing retired members and qualifying beneficiaries. The fund includes the spouses of black pensioners who retired from Transnet between 16 December 1974 and 1 April 1986 (previously reported under the Black Widows Pension Fund before 31 March 2010). There were 22 592 members at 31 March 2014 (2013: 24 774). This excludes widows and children of pensioners, as well as the black widows. The all inclusive membership is 62 504 at 31 March 2014 (2013: 65 653). The entire obligation relates to Transnet SOC Ltd.
actuarial assumptions used are as follows:Discount rate (%) 8,46 6,60Inflation rate (%) 6,32 5,80Pension increase allowance (%) 2,00 2,00The results of the actuarial valuation are as follows:Benefit liabilityPresent value of obligation (14 470) (16 168)Fair value of plan assets 17 036 18 425

93
Group
2014 R million
2013 R million
32. Post-retirement benefit obligations (continued) 32.1 Pension benefits (continued) 32.1.3 Transnet Second Defined Benefit Fund (continued)
Surplus 2 566 2 257 Unrecognised asset (2 566) (2 257)
Net asset/(liability) recognised in the statement of financial position – –
The surplus was not recognised as the rules of the fund do not provide for the surpluses to be distributed.Net expense recognised in profit or lossService cost – – Net interest income 149 236
149 236 Less: Interest on asset limit (149) (235)
– 1
Actual return on plan assets 809 2 125 Total remeasurements recognised in other comprehensive income for the year – (1)
– Net actuarial gain/(loss) 160 (893)– Interest on asset limit 149 235 – (Increase)/decrease in asset not recognised (309) 657
Movements in the net asset/(liability) recognised in the statement of financial positionOpening net asset 2 257 2 914 Profit or loss as above – 1 Remeasurements – actuarial gain/(loss) 160 (893)
– interest on asset limit 149 235
Closing net asset 2 566 2 257 Asset not recognised (2 566) (2 257)
Net asset/(liability) recognised in the statement of financial position – –
Reconciliation of movement in benefit liabilityOpening benefit liability (16 168) (15 658)Interest cost (995) (1 173)Actuarial gain/(loss) 495 (1 609)
– change in economic assumptions 987 (1 440) (180) (8)
– bonus award to pensioners (312) (161)
Benefits paid 2 198 2 272
Closing benefit liability (14 470) (16 168)
Reconciliation of movement in fair value of plan assetsOpening fair value of plan assets 18 425 18 572 Interest income 1 144 1 409 Actuarial (loss)/gain (335) 716 Benefits paid (2 198) (2 272)
Closing fair value of plan assets 17 036 18 425

ANNUAL FINANCIAL STATEMENTS 201494
NOTES TO THE ANNUAL FINANCIAL STATEMENTS FOR THE YEAR ENDED 31 MARCH 2014(continued)
Group
2014 R million
2013 R million
32. Post-retirement benefit obligations (continued) 32.1 Pension benefits (continued) 32.1.3 Transnet Second Defined Benefit Fund (continued)
The estimated contributions by both employer and members for the year beginning 1 April 2014 amount to R nil (1 April 2013: R nil)Sensitivity analysisClosing benefit liability based on changes in the discount rate:7,46% (2013: 5,60%) 14 608 17 2589,46% (2013: 7,60%) 12 941 15 193Closing benefit liability based on changes in the inflation rate:5,32% (2013: 4,80%) 14 470 16 1687,32% (2013: 6,80%) 14 470 16 168The major categories of plan assets as a % of total plan assets are:Equity (%) 26 25Property (%) 1 2Bonds (%) 69 72Cash and net current assets (%) 4 1
Total assets at market value 100 100
32.1.4 Top Management Pension and Workmen’s Compensation Act pensionersThe Top Management Pensions are additional benefits to top up pensions received to eliminate the effects of any early retirement and resignation penalties applied under the Group’s existing pension fund schemes to management appointed prior to 1 April 1999. There were 391 members at 31 March 2014 (2013: 397). The entire obligation relates to Transnet SOC Ltd.The Workmen’s Compensation Pension Fund Act benefit relates to the pension benefits that the Company pays to current and former employees who were disabled whilst in service prior to the corporatisation of Transnet in 1990. There were 1 241 members at 31 March 2014 (2013: 1 302).Actuarial valuations for both benefits were performed to determine the present value
held to fund these obligations.The following summarises the components of expense and liability recognised in the financial statements together with the assumptions adopted.Top Management Pension
The principal assumptions in determining the benefits are as follows:Discount rate (%) 8,36 6,40 Inflation rate (%) 6,38 5,82 Salary increase rate (%) 7,38 6,82Pension increase allowance (%) 2,00 2,00Benefit liabilityPresent value of obligations (76) (89)
Liability recognised in the statement of financial position (76) (89)
Net expense recognised in profit or lossInterest cost (6) (6)
(6) (6)

95
Group
2014 R million
2013 R million
32. Post-retirement benefit obligations (continued) 32.1 Pension benefits (continued)
32.1.4 Top Management Pension and Workmen’s Compensation Act pensioners (continued) Actuarial gain/(loss) recognised in other comprehensive income for the year 10 (8)Reconciliation of movement in benefit liabilityOpening benefit liability (89) (84)Expense as above (6) (6)Actuarial gain/(loss) 10 (8)Benefits paid 9 9
Closing benefit liability (76) (89)
The estimated contributions (based on current year contribution) for the year beginning 1 April 2014 amount to R9 million (1 April 2013: R9 million).Sensitivity analysisClosing benefit liability based on changes in the discount rate:7,36% (2013: 5,40%) 81 96 9,36% (2013: 7,40%) 71 83 Closing benefit liability based on changes in the inflation rate:5,38% (2013: 4,82%) 76 89 7,38% (2013: 6,82%) 76 89 Workmen’s Compensation Act pensioners fund
The principal assumptions in determining the benefits are as follows:Discount rate (%) 8,62 6,93 Pension increase (%) 6,36 5,61 Inflation rate (%) 6,36 5,61 Benefit liabilityPresent value of obligations (440) (481)
Liability recognised in the statement of financial position (440) (481)
Net expense recognised in profit or lossInterest cost (32) (35)
(32) (35)
Remeasurements recognised in other comprehensive income for the year 21 (62)Reconciliation of movement in benefit liabilityOpening benefit liability (481) (433)Interest cost (32) (35)Actuarial gain/(loss) 21 (62)Benefits paid 52 49
Closing benefit liability (440) (481)
Sensitivity analysisClosing benefit liability based on changes in the discount rate:7,62% (2013: 5,93%) 484 534 9,62% (2013: 7,93%) 402 435 Closing benefit liability based on changes in the inflation rate:5,36% (2013: 4,61%) 392 430 7,36% (2013: 6,61%) 489 539
32.1.5 HIV/Aids benefitsTransnet Group offers certain assistance to employees diagnosed with Aids. The related data is not sufficient to actuarially value any liability the Group may have in this regard.

ANNUAL FINANCIAL STATEMENTS 201496
NOTES TO THE ANNUAL FINANCIAL STATEMENTS FOR THE YEAR ENDED 31 MARCH 2014(continued)
Group
2014 R million
2013 R million
32. Post-retirement benefit obligations (continued) 32.2 Post-retirement medical benefits
SATS Pensioners’ post-retirement medical benefitsThe SATS pensioners are the retired employees of the former South African Transport Services (SATS) and their dependants. The liability is in respect of pensioners and their dependants who have elected to belong to the Transnet in-house medical scheme, Transmed, whose membership is voluntary. Transnet subsidises the medical contribution costs at a flat contribution of R800 per principal member per month.Transnet employees post-retirement medical benefitsThis includes the current and past employees of Transnet who are members of Transnet accredited medical schemes, namely Transnet’s in-house medical aid, Transmed Medical Fund, Bestmed, Bonitas, Discovery Health and Sizwe. Membership is voluntary.Transnet subsidises members at a flat contribution of R213 per month per member family.To enable the Company to fully provide for such post-retirement medical liabilities, since April 2000, actuarial valuations are obtained annually. There are no assets held to fund the obligation.Analysis of benefit expenseThe following summarises the components of the net benefit expense recognised in both the statement of comprehensive income and statement of financial position as at
credit method has been used for the purposes of determining the actuarial valuation for both the funds.32.2.1 SATS pensionersDiscount rate (%) 8,46 6,73 Benefit liabilityPresent value of obligations (689) (832)
Liability recognised in the statement of financial position (689) (832)
Net expense recognised in profit or lossInterest cost (56) (56)
(56) (56)
Actuarial gain/(loss) recognised in other comprehensive income for the year 65 (41)Reconciliation of movement in benefit liabilityOpening benefit liability (832) (881)Interest cost (56) (56)Company contributions 134 146 Actuarial gain/(loss) 65 (41)
Closing benefit liability (689) (832)
The medical inflation has no impact on the aggregate current service cost and interest cost and the benefit liability. However, the assumed discount rate has an impact. The sensitivity of the obligation to a change in the assumed discount rate of 8,46% (2013: 6,73%) on the present value of the obligation is as follows:Sensitivity analysisClosing benefit liability based on changes in discount rate:7,46% (2013: 5,73%) 722 (879)9,46% (2013: 7,73%) 659 (790)The estimated contribution (based on current year contribution) for the year beginning 1 April 2014 is R134 million (1 April 2013: R146 million).

97
Group
2014 R million
2013 R million
32. Post-retirement benefit obligations (continued) 32.2 Post-retirement medical benefits (continued)
32.2.2 Transnet employeesDiscount rate (%) 8,46 6,73Benefit liabilityPresent value of obligations (463) (557)
Liability recognised in the statement of financial position (463) (557)
Net expense recognised in profit or lossService cost (20) (13)Interest cost (38) (49)
(58) (62)
Actuarial gain recognised in other comprehensive income for the year 122 75 Reconciliation of movement in benefit liabilityOpening benefit liability (557) (605)Expense as above (58) (62)Member and Company contributions 30 35 Actuarial gain 122 75
Closing benefit liability (463) (557)
Transnet subsidises members at a flat contribution of R213 per month per member family. The medical inflation has no impact on the aggregate current service cost and interest cost and the benefit liability. However, the assumed discount rate has an impact. The sensitivity of the obligation to a change in the assumed discount rate of 8,46% (2013: 6,73%) on the present value of the obligation is as follows:Sensitivity analysisClosing benefit liability based on changes in discount rate:7,46% (2013: 5,73%) (504) (618)9,46% (2013: 7,73%) (427) (506)The estimated contribution (based on current year contribution) for the year beginning 1 April 2014 is R30 million (1 April 2013: R35 million).
Exposure to risks:The risks faced by Transnet as a result of the post-employment pension obligations can be summarised as follows:
The risk that pensioners live longer than expected and thus their pension benefit is payable for longer
The risk that changes to legislation with respect to the post-employment liability
The risk that changes in the taxation legislation governing employee benefits may increase the liability for the Company.
The plan assets held by the Transnet Pension Fund: Transnet Sub-fund and the Transnet Second Defined Benefit Fund are primarily invested in equities and bonds. This exposes the funds to a slight concentration of market risk. If the plan assets are not adequate or suitable to fund the liabilities of the funds (and the nature thereof), Transnet will be required to fund the deficit, hence exposing it to risks on the investment return.

ANNUAL FINANCIAL STATEMENTS 201498
NOTES TO THE ANNUAL FINANCIAL STATEMENTS FOR THE YEAR ENDED 31 MARCH 2014(continued)
33. Related-party transactions Transnet is a Schedule 2 Public Entity in terms of the Public Finance Management Act (PFMA). It therefore has a significant number of related parties including other State-owned entities, Government Departments and all other entities within the national sphere of Government. The Group has utilised the database maintained by the National Treasury to identify related parties. A list of all related parties is available at the National Treasury website at www.treasury.gov.za or at the Company’s registered office.In addition, the Company has a related party relationship with its subsidiaries (see annexure D). The Group and Company have related party relationships with its associates (see annexure D) and with its directors and senior executives (key management).
Unless otherwise disclosed, all transactions with the above related parties are concluded on an arm’s length basis.
Furthermore, neither the Group nor any of its related parties is obligated to procure from or render services to their related parties.
Transactions with related entities
Services rendered to related parties comprise of principally transportation services. Services purchased from related parties comprised principally energy, telecommunications, information technology and property related services.
The following is a summary of transactions with related parties during the year and balances due at year-end according to Transnet’s records:
Company Group
2013R million
2014R million
2014R million
2013R million
Services rendered 902 390 390 902
1 616 1 203 Other public enterprises 1 203 1 616 1 348 969 National Government business enterprises 969 1 348
21 28 Associates 28 21 6 6 Subsidiaries
3 893 2 596 2 590 3 887 Services received
1 987 2 171 2 171 1 987 417 628 Other public enterprises 628 417
705 440 National Government business enterprises 440 705 3 109 3 239 3 239 3 109
Amount due (to)/from
314 298 298 314 73 132 Other public enterprises 132 73
(1 962) (1 374) National Government business enterprises (1 374) (1 962)(1 575) (944) (944) (1 575)
During the year the Group reversed R178 million (2013: raised R298 million) in relation to provisions and write-offs of bad debts on related parties and at year-end the Group had a provision of R744 million (2013: R968 million) against debtors pertaining to related parties.Subsequent to year end the Board of Directors approved the write-off of an amount of R641 million in relation to the PRASA debt, taking into consideration PRASA’s funding constraints. In addition, PRASA paid Transnet an amount of R400 million in relation to the debt as at 31 March 2014.Transactions with key management personnel
Loans to key management are included in long-term loans and advances (see note 15). Details of key management compensation are set out in the Report of the Directors of the annual financial statements.None of key management has or had significant influence in any entity with whom the Company or Group had significant transactions during the year.

99
Company Group
2013 R million
2014 R million
2014 R million
2013 R million
34. Cash flow information 34.1 Cash generated from operations
5 927 7 120 Profit before taxation 7 135 6 041 5 328 5 870 Finance costs (refer note 34.3) 5 870 5 328
(385) (346) Finance income (refer note 34.4) (366) (405) (1) (37) Dividend income
11 690 11 425 Elimination of non-cash items 11 404 11 635
9 277 10 736 – Depreciation, amortisation and derecognition
(refer note 3) 10 736 9 277 20 328 – Increase in provision for employee benefits 328 20
(38) 3 – Impairment/(reversal of impairment) of loss making
subsidiaries and associates (refer note 4.2) – (1)
493 (70)– Impairment of trade and other receivables and loans
and advances (refer note 4.2) (70) 493
67 177 – Impairment of property, plant and equipment
(refer note 4.2) 177 67 29 – – Impairment of intangible assets (refer note 4.2) – 29
1 107 (333) – Movement in provisions (333) 1 107 – – (14) (24)
(2 282) (1 565) (1 565) (2 282) 3 045 2 933 – Unrealised foreign exchange losses 2 933 3 045
62 (54)– (Profit)/loss on sale of property, plant and equipment
(refer note 2) (54) 62 2 – – Loss on disposal of intangible assets – 2
40 – – (Profit)/loss on disposal of subsidiaries – (55) 38 31 – Discount on bonds amortised (refer note 6) 31 38
9 (82) – Provision for inventory obsolescence (82) 9
114 (41)– Release of firm commitments and foreign exchange
(41) 114
(274) (647)
(refer note 5) (647) (274) (19) 9 – Other non-cash items 5 8
22 559 24 032 24 043 22 599
34.2 Changes in working capital (818) 241 Increase in inventories 241 (818)
(1 126) (1 486) Increase in trade and other receivables (1 486) (1 129) 671 2 480 Increase in trade and other payables 2 473 674
(1 273) 1 235 1 228 (1 273)
34.3 Finance costs 5 545 5 911 Finance costs 5 917 5 545
(179) (10) Net foreign exchange losses on translation (16) (179) (38) (31) Discounts on bonds amortised (31) (38)
5 328 5 870 5 870 5 328
34.4 Finance income 385 346 Finance income 366 405 (83) (45) Interest received – Held-to-maturity (45) (83)
302 301 321 322

ANNUAL FINANCIAL STATEMENTS 2014100
NOTES TO THE ANNUAL FINANCIAL STATEMENTS FOR THE YEAR ENDED 31 MARCH 2014(continued)
Company Group
2013 R million
2014 R million
2014 R million
2013 R million
34. Cash flow information (continued) 34.5 Taxation refunded
214 (52) Balance at the beginning of the year (56) 209 (34) 72 Taxation as per income statements 61 (43) 52 6 Balance at the end of the year 11 56
232 26 16 222
34.6 Cash and cash equivalents
2 258 3 508 Total cash and cash equivalents at the end of the year 3 633 2 598
Restated Restated
35. Headline earnings 4 035 5 167 Profit for the year attributable to equity holder 5 171 4 139
62 (54)(Profit)/loss on disposal of property, plant and equipment (refer note 4.1) (54) 62
2 – Loss on disposal of intangible assets – 2
(274) (647)
(refer note 5) (647) (274)
67 177 Impairment of property, plant and equipment (refer note 4.2) 177 67
29 – Impairment of intangible assets (refer note 4.2) – 29
(38) 3 Impairment/(reversal of impairment) of associates and subsidiaries (refer note 4.2) – (1)
40 – (Profit)/loss on disposal of subsidiaries – (55)
3 923 4 646 Headline earnings before taxation effects 4 647 3 969 Taxation effects
(17) 15 Profit/(loss) on disposal of property, plant and equipment 15 (17)
(1) – Loss on disposal of intangible assets – (1) 51 121 121 51
(19) (50) Impairment of property, plant and equipment (50) (19) (8) – Impairment of intangible assets – (8)
11 (1)Impairment/(reversal of impairment) of associates and subsidiaries – –
(7) – (Profit)/loss on disposal of subsidiaries – 10
3 933 4 731 Headline earnings 4 733 3 985

101
36. Restatements Change in accounting policies
The Group adopted the revised IAS 19: Employee Benefits in the current financial year. The revised standard was applied retrospectively.
The revised IAS 19 replaces the interest cost on the defined benefit obligation and the expected return on plan assets with net interest expense (income) on the net defined benefit liability (asset) calculated at a discount rate which reflects the yield on high quality corporate bonds or government debt. The change resulted in an increase in the net defined benefit expense in profit or loss with a corresponding increase in actuarial gains (remeasurements) on the plan assets recognised in other comprehensive income. The net effect on equity attributable to the shareholder for the year ended 31 March 2013 is R nil as shown below and in the statement of changes in equity.
Company Group
31 March 2013
31 March 2013
The change in accounting policies had the following impact on the financial statementsIncome statements
4 236 Profit for the year as previously reported 4 340 (201) Net effect of restatement (201)
(279) Change in net interest on post-retirement benefit obligations (279) 78 78
4 035 Restated profit for the year 4 139
Statement of comprehensive income1 288 Other comprehensive income as previously reported 1 193
201 Net effect of restatement 201
279 Change in actuarial gain on post-retirement benefit obligations 279 (78) (78)
1 489 Restated other comprehensive income 1 394

ANNUAL FINANCIAL STATEMENTS 2014102
ANNEXURE A FOR THE YEAR ENDED 31 MARCH 2014
IntroductionThe Group has a centralised Treasury function which performs a supporting role to the Transnet Operating
governance framework.
PoliciesThe Financial Risk Management policies are contained in a Board-approved Financial Risk Management
by ensuring that:
The FRMF is approved by the Board on an annual basis and is aligned with the Group Enterprise Wide Risk Management Framework (ERM), the Treasury Regulations in terms of PFMA, Public Finance Management Act No 1 of 1999 (as amended) (PFMA), King III Code and the Protocol on Corporate Governance, Charter of Best Practice of the Association of Corporate Treasurers of South Africa (ACTSA) and other applicable legislation and regulations.
Apart from the requirements of the FRMF, Treasury must operate within the limits as contained in the Transnet Delegation of Authority Framework (DOA) as approved by the Board.
Risk philosophyThe overall risk management philosophy of the Company is to the extent possible, avoid undue risks and manage business risks effectively. However, given the nature of Transnet’s business and MDS, it is not always possible to avoid risks all together. In pursuit of its business, the Group is exposed to a myriad of risks including but not limited to market, credit, liquidity and operational risks. The long-term viability, continued success and reputation of Transnet are critically dependent on the credibility of risk management, and commitment to applying leading practice in risk management.
Risk profile and risk managementFinancial risk assessment and analysis are disclosed on a monthly basis to the Group Treasurer, the Group Chief Financial Officer, the Group Finance Committee (Finco) and the Group Executive Committee. The Group Executive Committee is responsible for reporting financial risk exposures to the Board of Directors at scheduled Board meetings.
The Group’s business operations expose it to liquidity, credit, and market risk (comprising foreign currency, commodity, interest rate and other price risk), which are discussed under the headings below. Given the level of volatility in the markets, Treasury will continuously manage all risks very closely so as to implement risk mitigating initiatives timeously when required.
Liquidity risk
Liquidity risk exposures arise mainly as a result of the Group’s seven-year MDS and operational expenditure programme, the redemption of loans and daily operational cash flow requirements. The Group has established

103
During the 2014 year, Transnet used the following funding programmes extensively to mitigate liquidity
Commercial institutions R1,7 billion and call loans R4,0 billion.
Certain thresholds, which are a combination of available cash, committed and uncommitted bank facilities,
the approved policy to further ensure effective liquidity risk management. Capital market investments are
of a condition stipulated by a Regulator. The intention is always to keep the investment until maturity to avoid any capital losses.
provide Treasury with a good estimate of the Group’s future funding requirements per financial year.
Counterparty risk
Counterparty risk exposures arise mainly as a result of the investment of operational cash on hand and surplus cash due to pre-funding strategies and positive fair market values of derivative hedging instruments.
The counterparty risk policy of the Group is fully aligned with the requirements of the Treasury Regulations as referred to in the PFMA:
operational cash balances, call investments, short-term deposits, money market fund investments and positive fair market values of derivatives and trade receivables. The Group’s exposures to counterparty risks in respect of all Treasury related transactions are confined to credible counterparties and are managed within Board approved credit limits. Limits are reviewed and approved by the Board Audit Committee on an annual basis. Trade receivables are presented net of impairments. It is Treasury’s policy to perform ongoing credit evaluations of the financial position of its counterparties. Guarantees are issued under specific powers granted in terms of section 66 of the PFMA, and in accordance with a Board approved Delegation of Authority Framework (DOA).
Investments are only allowed with international counterparties that are local authorised dealers with a minimum international long-term issuer default credit rating of A- (Fitch Ratings) or A- (Standard and Poor’s) or A3 Moody’s and domestic counterparties with a minimum national long-term credit rating of A- (zaf) (Fitch Ratings) or A- (Standard and Poor’s) or A3 Moody’s and approved by the Board as an approved counterparty. In addition to this the counterparty must have a minimum short-term credit rating of F-1 (Fitch Ratings) or P-1 (Moody’s) or A-1 (Standard and Poor’s) to qualify for cash type of investments. No more than 40,0% of

ANNUAL FINANCIAL STATEMENTS 2014104
overall cash available may be invested with counterparties in the A rating category and is limited to 33,0%
surplus cash due to its diversified risk profile and enhanced return.
Market risk
This will be discussed under the following headings: foreign currency, commodity, interest rate and other price risk.
Foreign currency risk Foreign currency risk arises mainly as a result of the Group’s MDS and operational expenditure programmes, where goods are imported from foreign countries and are exposed to currency fluctuations as well as the
Transnet’s policy only allows unhedged foreign currency risk exposures limited to 0,5% of annual operational budget and 1,0% of annual capital expenditure budget. All foreign currency risk exposures are hedged within the guidelines of the Board approved FRMF and DOA as soon as the supplier and funding agreements are signed. It is the Group’s preference to enter into Rand-based supplier and funding agreements, if this can be achieved at an acceptable cost, with no foreign currency risk recourse to Transnet. If this approach is not cost effective, Transnet will then hedge on its own financial position. No pooling of hedging across
ie US Dollar (USD), Euro, Japanese Yen (JPY) and other foreign currencies. Foreign currency risk exposures are fully hedged until maturity with vanilla hedging instruments after careful consideration and analysis of the taxation, financial risk, accounting, operational and system implications. Hedge accounting is applied to
is monitored monthly by a subcommittee of FINCO to ensure proper implementation and adherence to guidelines.
Commodity risk Commodity risk refers to the potential variability in Group financial condition owing to changes in commodity prices such as Brent crude oil, steel, iron ore and others. Only fuel risk exposures are actively monitored by
agreements in respect of the general freight business of the Group are structured in such a way that tariffs
electricity and do provide a natural risk offset. Only the unhedged portion on fuel will be considered for hedging purposes in terms of approved policies. The Board approved FRMF requires the utilisation of vanilla type hedging instruments that are highly liquid with a maximum tenor of eighteen months and the underlying used in a hedging strategy must have a very high correlation with the actual product consumed. The purpose of fuel hedging is to immunise the Group’s annual approved fuel budget. Where practically possible from a cost perspective, the Operating divisions’ preference is to enter into fixed Rand contracts with suppliers as a risk mitigation against fluctuation of commodity prices over the tenures of the contracts.
Interest rate riskThis refers to the potential variability in Transnet’s financial condition owing to changes in interest rate levels. The Group’s borrowing programme, investments in interest-bearing instruments and derivative financial
as follows:
ANNEXURE A FOR THE YEAR ENDED 31 MARCH 2014(continued)

105
duration of the average payback periods of assets.
The Group measures interest rate risk by calculating the impact of fair value movements on derivatives and floating rate loans and running cash flow at risk scenarios and extreme sensitivities to determine the impact against the annually approved external finance cost budget in respect of existing liabilities and new funding requirements per financial year. All foreign currency interest rate risk exposures are hedged to Rand as soon as agreements are concluded. The Group’s Treasury is allowed to manage the fix/float interest rate risk exposure within Board approved ranges.
Other price riskThe only other market risk the Company and Group is exposed to, is equity price risk. Equity price risk is the risk of fair value changes in future cash flows of a financial instrument as a result of changes in the underlying share price. Transnet do not trade in equities and the only exposure of this nature at year-end was an equity investment in Brazil which is listed on the Brazilian Stock Exchange.
Liquidity risk
Bonds at carrying and nominal values:Transnet issues domestic bonds listed on the Johannesburg Securities Exchange (JSE), and the London Stock Exchange (LSE). The following bonds were in issue at 31 March 2014 for the Company and the Group.
2014 2013
BondRedemption
date
Coupon rate
%
Carrying value
R million
Nominal value
R million
Carrying value
R million
Nominal value
R million
Domestic Rand bonds TN17 14-Nov-17 9,25 6 813 7 000 6 772 7 000TN20 17-Sept-20 10,50 7 277 7 000 7 128 6 849TN23 06-Nov-23 10,80 7 327 7 000 7 347 7 000TN25 19-Aug-25 9,50 5 285 5 143 4 442 4 379TN27 14-Nov-27 8,90 6 370 7 000 6 350 7 000
TNF16 floating rate note 10-Jun-16 6,82 3 286 3 286 – –
TNF18 floating rate note 22-Aug-18 6,97 1 500 1 500 – –
Total domestic Rand bonds 37 858 37 929 32 039 32 228
Foreign Rand bonds 13-May-21 9,50 5 000 5 000 – –Euro 13,5% 2028* 18-Apr-28 13,50 1 955 2 000 1 955 2 000
Euro 10% 2029* 30-Mar-29 10,00 1 055 1 500 1 047 1 500
Total foreign Rand bonds 8 010 8 500 3 002 3 500
USD bonds TNUS16 10-Feb-16 4,5 7 871 7 890 6 941 6 965USD bonds TNUS22*** 26-July-22 4,0 10 414 10 520 9 186 9 287
Total foreign
currency bonds 18 285 18 410 16 127 16 252
Total bonds in issue
at year-end 64 153 64 839 51 168 51 980
* These bonds are guaranteed by the Government of the Republic of South Africa, and the Company paid R1,2 million in guarantee fees (2013: R1,2 million). The amounts in the above table are all in respect of bonds held at amortised cost.
** The TNZA21 Rand bond is a new bond issued under the GMTN programme on 13 November 2013.*** The TNUS22 is a USD denominated bond issued under the GMTN programme on 26 July 2012.

ANNUAL FINANCIAL STATEMENTS 2014106
Concentration of liquidity risk
The sources of funding are tabled below. Altogether 73,0% of the borrowings are widely held (2013: 70,0%):
Company Group
2013R million
2014R million
2014R million
2013R million
51 – Sanlam Capital Markets Ltd – 5124 – Sanlam Investment Management (Pty) Ltd – 24
584 507 Standard Bank London 507 584524 1 100 Standard Bank Corporate Investment Bank 1 100 524
4 737 2 858 RMB/Division of FirstRand Bank Ltd 2 858 4 7372 312 2 090 The Bank of Tokyo Mitsubishi Ltd 2 090 2 3121 895 1 641 Absa Bank Ltd 1 641 1 8951 481 1 531 American Family Life Assurance Co. (AFLAC) 1 531 1 481
1 729 1 585 French Development Bank 1 585 1 7293 808 3 882 Sumitomo Mitsui Banking Corporation 3 882 3 808
929 1 052 Export Development Canada 1 052 929– 1 000 Investec Bank Ltd 1 000 –
1 000 2 534 African Development Bank 2 534 1 0002 071 2 407 Nedbank Ltd 2 407 2 071
– 2 117 KFW IPEX-Bank GMBH 2 117 –245 – Blue Titanium Conduit Limited – 245
51 492 66 036Various holders of Transnet Bonds and Commercial Paper, widely held, and traded* 66 036 51 492
204 102 Other 104 206
73 086 90 442 90 444 73 088
* Includes bonds held at amortised cost R64 153 million, commercial paper R1 783 million and repo liabilities R100 million (*2013: Includes bonds held at amortised cost R51 168 million and commercial paper R324 million).
Funding plan
As a result of the Group’s MDS, the funding requirements, including loan redemptions of R41,4 billion, over the next seven years is anticipated to amount to R103,6 billion and is reflected below.
Target Projections Total
2015R million
2016R million
2017R million
2018R million
2019R million
2020 R million
2021R million R million
Loan redemptions (3 624) (7 790) (5 632) (9 379) (3 603) (2 876) (8 511) (41 415)
Total funding requirement (15 073) (17 981) (18 788) (21 847) (17 609) (11 935) (416) (103 649)
The following schedule depicts the probable sources of funding to be used by Transnet over the next four financial years, which will be driven by the Group’s business strategy, liquidity, investor/lender appetite as well as pricing.
R million2015
R million2016
R million 2017
R million 2018
Commercial paper 3 500 5 000 3 000 4 500Domestic bonds 2 200 4 000 5 500 7 000DFIs/ECAs/GMTN 4 400 5 000 6 000 6 500Bank loans/other 5 000 4 000 4 500 4 000
Total funding 15 100 18 000 19 000 22 000
ANNEXURE A FOR THE YEAR ENDED 31 MARCH 2014(continued)

107
Contractual maturity analysis
The following are the contractual maturities of financial liabilities, including interest payments and excluding the impact of netting arrangements for the Company and the Group:
Carrying value
2014R million
Contractual cash flows
2014R million
0 to 12 months
R million
1 to 2years
R million
2 to 3 years
R million
3 to 4 years
R million
4 to 5 years
R million
More than
5 yearsR million
Non-derivative financial
liabilities Bonds (Company and Group) (64 153) (109 627) (5 291) (13 217) (8 071) (11 715) (5 494) (65 839)Secured bank loans Company (5 605) (7 931) (997) (1 017) (1 044) (1 035) (1 024) (2 814)Secured bank loans Group (5 607) (7 933) (999) (1 017) (1 044) (1 035) (1 024) (2 814)Unsecured bank loans (Company and Group) (18 698) (22 074) (5 736) (2 875) (3 160) (3 042) (2 741) (4 520)Commercial paper (Company and Group) (1 783) (1 828) (1 828) – – – – –Other short-term borrowings (Company and Group) (203) (199) (199) – – – – –
Total borrowings Company (90 442) (141 659) (14 051) (17 109) (12 275) (15 792) (9 259) (73 173)
Total borrowings Group (90 444) (141 661) (14 053) (17 109) (12 275) (15 792) (9 259) (73 173)Trade payables and accruals Company** (9 375) (9 375) (9 375) – – – – –Trade payables and accruals Group** (10 717) (10 717) (10 717) – – – – –Derivative financial
liabilities (Company and
Group)Cross-currency swaps* – – – – – – – –Forward exchange contracts used for hedging (21) (52) (28) (14) (8) (2) – –
Outflow (732) (764) (559) (138) (55) (12) – –Inflow 711 712 531 124 47 10 – –
Other forward exchange contracts (62) (41) (19) (14) (8) – – –
Outflow (322) (323) (138) (114) (71) – – –Inflow 260 282 119 100 63 – – –
Total derivative financial
liabilities (83) (93) (47) (28) (16) (2) – –
* Cross-currency swaps are all in the money.** Trade payables and accruals exclude employee benefits and VAT related accruals.

ANNUAL FINANCIAL STATEMENTS 2014108
Contractual maturity analysis (continued)
Carrying value
2013R million
Contractual cash flows
2013R million
0 to 12 months
R million
1 to 2years
R million
2 to 3 years
R million
3 to 4 years
R million
4 to 5 years
R million
More than
5 yearsR million
Non-derivative financial
liabilities
Bonds (Company and Group) (51 168) (94 811) (4 266) (11 232) (4 267) (3 953) (10 953) (60 140)Secured bank loans Company (4 202) (6 050) (1 018) (645) (652) (637) (630) (2 468)Secured bank loans Group (4 204) (6 052) (1 020) (645) (652) (637) (630) (2 468)Unsecured bank loans (Company and Group) (17 189) (20 883) (5 732) (2 353) (2 454) (2 269) (2 183) (5 892)Commercial paper (Company and Group) (324) (330) (330) – – – – –Other short-term borrowings (Company and Group) (203) (311) (144) (14) (21) (12) (11) (109)
Total borrowings Company (73 086) (122 385) (11 490) (14 244) (7 394) (6 871) (13 777) (68 609)
Total borrowings Group (73 088) (122 387) (11 492) (14 244) (7 394) (6 871) (13 777) (68 609)
Trade payables and accruals Company** (9 344) (9 344) (9 344) – – – – –Trade payables and accruals Group** (10 689) (10 689) (10 689) – – – – –Derivative financial
liabilities (Company and
Group)
Cross-currency swaps* – – – – – – – –Forward exchange contracts used for hedging (57) (97) (16) (24) (32) (25) – –
Outflow (412) (453) (126) (118) (126) (83) – –Inflow 355 356 110 94 94 58 – –
Other forward exchange Contracts (28) 4 (7) – 6 5 – –
Outflow (348) (348) (99) (97) (94) (58) – –Inflow 320 352 92 97 100 63 – –
Total derivative financial
liabilities (85) (93) (23) (24) (26) (20) – –
* Cross-currency swaps are all in the money.** Trade payables and accruals exclude employee benefits and VAT-related accruals.
ANNEXURE A FOR THE YEAR ENDED 31 MARCH 2014(continued)

109
Credit riskMaximum exposure and analysis of exposures to credit risk
The following maximum exposures to credit risk existed at year-end in respect of financial assets:
2014 2013
Carrying value
R million
Neither past due
nor impairedR million
Past due but not
impairedR million
ImpairedR million
Carrying value
R million
Neither past due
nor impairedR million
Past due but not
impairedR million
ImpairedR million
CompanyTrade receivables
– Low risk 5 547 3 919 1 628 (965) 4 068 3 498 570 (644)– Medium risk 761 725 36 (29) 784 707 77 (43)– High risk 394 312 82 (385) 319 289 30 (348)
6 702 4 956 1 746 (1 379) 5171 4 494 677 (1 035)
Other amounts receivable** 802 542 260 (53) 805 473 332 (460)Investments – current 67 67 – – 1 359 1 359 – –Long and short-term loans and advances* 31 31 – – 6 6 – –Loans to subsidiaries and associates 2 2 – (392) 4 4 – (389)Guarantees issued 81 – – – 114 – – –Investment and price risk*** 18 087 – – – 8 766 – – –GroupTrade receivables
– Low risk 5 548 3 920 1 628 (965) 4 070 3 459 611 (644)– Medium risk 761 725 36 (29) 785 707 78 (43)– High risk 394 312 82 (403) 319 289 30 (364)
6 703 4 957 1 746 (1 397) 5 174 4 455 719 (1051)
Other amounts receivable** 806 546 260 (53) 807 475 332 (460)Investments – current 67 67 – – 1 359 1 359 – –Long and short-term loans and advances* 31 31 – – 6 6 – –Guarantees issued 81 – – – 114 – – –Investment and price risk*** 18 087 – – – 8 766 – – –
* Long-term advances (Company and Group) R29 million (2013: R4 million) Short-term advances (Company and Group) R2 million (2013: R2 million)** Reconciliation to note 18. Company Group Other amounts receivable R802 million (2013: R805 million) R806 million (2013: R807 million) Prepayments R263 million (2013: R265 million) R263 million (2013: R265 million) Prepayments and other amounts receivable R1 065 million (2013: R1 070 million) R1 069 million (2013: R1 072 million)*** Investment risk includes call and fixed deposits as well as money market funds. The high investment exposure for 2013 and 2014 is the
result of pre-funding done to minimise liquidity risk to fund the capital expenditure programme.
Low risk: No guarantee is required from the customer.
Medium risk: 50% – 75% guarantee required by the customer.
High risk: In such instances, customers are required either to provide 100% guarantee or transact on a cash basis only.
The balances for other receivables and loans and advances are not disaggregated for internal reporting purposes.
Price risk: The risk that financial derivatives and bond transactions have to be closed-out at a market value loss as a result of the unfavourable movements in market rates.
Bond issuer risk: The risk that an issuer of bonds will not be able to fulfil its financial obligations on maturity date in accordance with the terms and conditions of the bond issues.
IFRS 7 Financial Instruments: Disclosure, defines credit risk as the risk that one party to a financial instrument will cause a financial loss for the other party by failing to discharge an obligation. As such Transnet will suffer financial losses on guarantees issued as the Group would be required to make good the failure by a third party to discharge an obligation.
Credit enhancements in the form of title deeds and pension fund cessions for loans and advances and deposits and guarantees in respect of amounts included in trade and other receivables and loans and advances, are held by the Group. The Group took possession of some collateral during the current financial year amounting to R1,4 million (2013: Rnil).

ANNUAL FINANCIAL STATEMENTS 2014110
The following represents the ageing of the carrying value of financial assets past due but not impaired at 31 March 2014 for the Company and Group:
1 – 30 days 31 – 60 days Greater than 60 days
Past due
Low risk
Medium risk
High risk
Past due
Low risk
Medium risk
High risk
Past due
Low risk
Medium risk
High risk
2014
Trade receivables 339 292 28 19 269 265 4 – 1 138 1 071 4 63Other receivables 198 198 – – 16 16 – – 46 46 – –
2013
Trade receivables 348 332 15 1 46 42 3 1 324 237 60 27Other receivables 282 282 – – 31 31 – – 18 18 – –
Guarantees and deposits to the value of R551 million were held as collateral (2013: R346 million).
The following financial assets have been specifically impaired for the Company and Group at year-end:
2014 2013
R millionTrade
receivablesOther
receivablesTrade
receivablesOther
receivables
CompanyLow risk 123 6 128 3Medium risk 30 – 63 –High risk 297 – 14 –
GroupLow risk 123 6 128 3Medium risk 30 – 63 –High risk 297 – 14 –
Financial assets have been impaired based on the age of the debt and the inability to recover these specified assets. Guarantees and deposits amounting to R143 million (2013: R193 million) were held with respect to these. Payment terms were renegotiated with certain counterparties in respect of trade receivables during the year.
Concentration of credit risk
The Group’s and company’s 12 most significant customers (South African Industrial enterprises) comprise 54,0% of the trade receivables carrying amount at 31 March 2014 (2013: 43,0%).
The following diagram reflects the distribution of credit risk, expressed in terms of long-term credit ratings, excluding guarantees and trade receivables. The exposures below include cash investments (call, fixed deposits and money market funds), price risk exposures and operational bank balances.
M A RCH 2014TR A NSNET RISK PER LONG-TERM R ATING(R million)
M A RCH 2013TR A NSNET RISK PER LONG-TERM R ATING(R million)
A+ 6 198,0 A+ 3 749,1
Money market funds 10,0 Money market funds 2,0
A 138,0 A 820,0
AA 11 210,0 AA 2 249,2
AA- 51,0 AA- 785,6
AAA 481,0 AAA 1 159,9
ANNEXURE A FOR THE YEAR ENDED 31 MARCH 2014(continued)

111
The graph below reflects the distribution of credit risk per financial instrument per long-term credit rating category, excluding guarantees and receivables.
TR A NSNET SOC LTD RISK (IN V ESTMENTS) PER LONG-TERM R ATING 2013 (R million)
TR A NSNET SOC LTD RISK (DERIVATIV ES) PER LONG-TERM R ATING 2013 (R million)
TR A NSNET SOC LTD RISK (IN V ESTMENTS) PER LONG-TERM R ATING 2014 (R million)
A+ 835,21 A+ 2 913,40
A+ 51,01
Money market funds 2 006,00
JSE 0,05
Money market funds 9,67
A 820,09
A 137,66
AA 1 534,43
AA 714,75
AA 9 266,82
AA- 785,61
AA- 51,50
AAA 1 005,43
AAA 128,18
TR A NSNET SOC LTD RISK (DERIVATIV ES) PER LONG-TERM R ATING 2014 (R million)
A+ 6 147,17
AAA 352,64
AA 1 942,77

ANNUAL FINANCIAL STATEMENTS 2014112
Market riskForeign currency risk
The Company's and Group’s net long (short) foreign currency risk exposures as at 31 March 2014 are reflected below (expressed in notional amounts).
2014 2013
USD US$/m
JPY¥/m
EUR€m
AUD AU$/m
Other currencies
exposure in USD US$/m
USD US$/m
JPY¥/m
EUR€m
AUD AU$/m
Other currencies
exposures in USD US$/m
Foreign currency bonds (1 750) – – – – (1 750) – – – –Unsecured bank loans (469) (35 482) (50) – – (510) (38 408) – – –Brazil equity investment 8 – – – – 12 – – – –
Gross financial
position exposure (2 211) (35 482) (50) – – (2 248) (38 408) – – –Exposures for future expenditure (34) – (15) (2) (2) (47) (3 501) (6) (9) (1)
Gross foreign
currency exposure (2 245) (35 482) (65) (2) (2) (2 295) (41 909) (6) (9) (1)Forward exchange contracts 34 – 15 2 2 45 3 501 6 9 1Cross-currency swaps 2 219 35 482 50 – – 2 260 38 408 – – –
Net uncovered
exposure 8 – – – – 10 – – – –
Sensitivity analysisThe table below shows the impact on profit and loss (non-hedge accounted transactions) of a stronger and weaker Rand for the Company and Group, as a result of fair value movements of cross-currency interest rate swaps and forward exchange contracts.
2014 2013
Currency
Currency exposure
in millions of currency
Fair value R million
Impact of Rand
strength-ening
R million
Impact of Rand
weakeningR million
Currency exposure
in millions of currency
Fair value R million
Impact of Rand
strength-ening
R million
Impact of Rand
weakeningR million
AUD – – – – – – – –EUR (22) (70) (19) 19 (30) (27) (25) 25JPY – – – – – – – –USD (2) (1) (3) 3 1 0,3 2 (2)
Totals (71) (22) 22 (26,7) (23) 23
Hedge accounting is applied to 99,0% of currency hedges where structures are designated either as fair value hedges or cash flow hedges as detailed in note 14. The sensitivity analysis above includes the impact of fair value movements on derivatives that are part of effective hedge accounting, hence the analysis is on the net balance, after the offsetting effect of the hedged item and hedging instruments. The sensitivity analysis was calculated using a 95,0% confidence interval over a 90-day horizon, and assumes all other variables remain
a more accurate market value is reflected that also take market liquidity into account.
ANNEXURE A FOR THE YEAR ENDED 31 MARCH 2014(continued)

113
Value at risk (FX)The value at risk (VaR) for direct committed capital and operational exposures and the Brazilian equity investment is R8 million (2013: R12 million). VaR calculates the maximum pre-taxation loss expected (or worst case scenario) on a position held, over a 90-day horizon given a 95,0% confidence level and is used on a limited basis at Transnet. The VaR methodology is a statistically defined, probability-based approach that takes into account, inter alia, market volatilities relative to a position held. The Group uses historical simulation and the model assumes that historical patterns will repeat into the future and does not take extreme market conditions into account.
Foreign exchange ratesThe mid rates of exchange against Rand used for conversion purposes were:
2014 2013
US Dollar 10,5192 9,2869Japanese Yen 9,7987 10,1262Euro 14,4876 11,9601Australian Dollar 9,7518 9,7094
Interest rate risk
The Group’s exposure to fixed and floating interest rates on financial liabilities is as follows:
Company Group
2013R million
2014R million
2014R million
2013R million
(63 314) (72 915) Fixed rate liabilities (72 917) (63 316)(10 475) (18 255) Floating rate liabilities (18 255) (10 475)
(73 789)* (91 170)* Total (91 172)* (73 791)*
* These values include the repo liability of R100 million (2013: R115 million), which have a maturity term of one week.
The exposure to floating interest rates on foreign financial liabilities before swaps is R7 911 million (2013: R7 048 million) for the Company and Group, but the full foreign currency loan portfolio has been swapped to a fixed Rand interest rate risk exposure by means of cross-currency interest rate swaps and is included above under fixed rate liabilities. The Board approved a targeted range of fixed interest rates that may be managed to enable management to utilise interest rate yields.
Sensitivity analysisThe sensitivity analysis below reflects the interest rate impact on the finance cost budget for the 2015 financial year in respect of existing liabilities and new funding requirements.
2015 2014
Impact
Shift+100bp
R million
Shift-200bp
R million
Shift+250bp
R million
Shift-500bp
R million
Shift+500bp
R million
Shift+100bp
R million
Shift-200bp
R million
Shift+250bp
R million
Shift-500bp
R million
Shift+500bp
R million
Finance cost impact (increase)decrease (Company and Group) 163 740 (125) 1 316 (605) (258) 273 (523) 803 (966)
The impact on profit and loss of higher foreign interest rates on the Company and Group is insignificant, as all foreign debt has been swapped to a fixed Rand interest rate risk.
Price risk
The Group has an exposure to equity price risk on the Brazilian Stock Exchange. At year-end, the quoted value of the Group’s investment in Brazil was R84 million (2013: R114 million). Management believes that the foreign exchange exposure on this investment is significantly greater than that of equity price risk and as such the sensitivity for this investment has been included in the foreign currency risk net position and VaR calculations.

ANNUAL FINANCIAL STATEMENTS 2014114
Commodity price risk (fuel)
The table below shows the cash flow at risk scenarios against the approved fuel budget for the 2015 financial
energy levies). Amounts are in R million.
31 March 2014 Performance to budget
$/R9,43 $/R10,74 $/R 10,80 $/R11,80 $/R12,06358 153 145 (11) (51)299 86 76 (85) (127)106 (134) (145) (279) (306)(23) (258) (265) (380) (410)
(147) (348) (355) (478) (510)
The table below shows the cash flow at risk scenarios against the approved budget for the 2014 financial
(excluding energy levies). Amounts are in R million.
31 March 2013 Performance to budget
263 187 85 19 (93)188 106 (3) (74) (194)
41 (51) (175) (255) (391)(43) (142) (274) (360) (505)
(180) (289) (434) (529) (689)
Classification, fair values and analysis of financial instruments
Categories of financial instruments
Company Group
2013 R million
2014R million
2014 R million
2013R million
Financial assets
9 960 11 344Loans and receivables (including bank and cash, trade and other receivables) 11 474 10 305Fair value through profit and loss
3 855 7 404 – Derivatives held for hedging 7 404 3 855Financial liabilities
82 654 101 210Liabilities measured at amortised cost (including trade and other payables) 101 240 82 691Fair value through profit and loss
85 83 – Derivatives held for hedging 83 8588 99 – Finance lease liabilities 99 88
ANNEXURE A FOR THE YEAR ENDED 31 MARCH 2014(continued)

115
Except as detailed in the following table, the directors consider that the carrying amounts of financial assets and financial liabilities recorded at amortised cost in the financial statements approximate their fair values:
Company Group
2013 2014 2014 2013
Fair value
R million
Carrying value
R million
Fair value
R million
Carrying value
R million
Fair value
R million
Carrying value
R million
Fair value
R million
Carrying value
R million
81 743 72 998 80 602 90 343 Borrowings 80 604 90 345 81 745 73 000
126 88 95 99Finance lease obligations 95 99 126 88
Fair values of financial instruments
The table below provides an analysis of financial instruments that are measured subsequent to initial recognition at fair value, grouped into level 1 to 3 based on the degree of market observability of the inputs of the fair value.
identical assets or liabilities.
1 that are observable for the asset or liability, either directly (ie as prices) or indirectly (ie derived from prices). This category of instrument consists mainly of derivatives concluded for risk management purposes.
asset or liability that are not based on observable market data (unobservable inputs).
Level 1R million
Level 2R million
Level 3R million
TotalR million
2014
Financial assets at FVTPL*
Derivative financial assets used for hedging (Company and Group) – 7 404 – 7 404Financial liabilities at FVTPL*
Derivative financial liabilities used for hedging (Company and Group) – 83 – 83
2013
Financial assets at FVTPL*
Derivative financial assets used for hedging (Company and Group) – 3 855 – 3 855Financial liabilities at FVTPL*
Derivative financial liabilities used for hedging (Company and Group) – 85 – 85
* FVTPL – Fair value through profit and loss.

ANNUAL FINANCIAL STATEMENTS 2014116
Measurement of fair valuesThe table below shows the valuation techniques used in measuring level 2 and level 3 fair values, as well as the significant unobservable inputs used.
Financial instruments measured at fair value Valuation technique
Significant unobservable inputs
Inter-relationship between significant unobservable inputs and fair value measurement
Cross-currency swaps used for hedging*
Forward exchange contracts used for hedging*
Discounted cash flow method using market yield
these cash flows using the Monte Carlo simulation model, incorporating market inputs that were observable, probabilities of default, recovery rates and expected future exposures per counterparty.
Not applicable. Not applicable.
Fuel hedging options*features specific to fuel options.
Not applicable. Not applicable.
Issued bonds** Bonds were priced at fair values using quoted market prices.
Not applicable. Not applicable.
Other financial liabilities***/**
Loans were valued using risk free yield curves Not applicable. Not applicable.
* Fair values include market observable credit valuation adjustments (CVA).** Fair values include market observable debit valuation adjustments (DVA).*** Other financial liabilities include borrowings and finance lease obligations.
Transfers between level 1 and 2There were no transfers in either direction between level 1 and 2 in both the current financial year and in 2013.
Level 3 fair valuesReconciliation and transfers out of level 3: There were neither level 3 inputs nor transfers in either direction in both the current financial year and in 2013.
ANNEXURE A FOR THE YEAR ENDED 31 MARCH 2014(continued)

117
The net gains and losses on financial instruments are detailed below:
Company
Net gain/(loss) R million
2014
Liabilities measured at amortised cost* (7 174)Loans and receivables and held to maturity investments 366Liabilities held for trading** (372)
2013
Liabilities measured at amortised cost* (6 403)Loans and receivables and held to maturity investments 385Liabilities held for trading** 98
Group
Net gain/(loss) R million
2014
Liabilities measured at amortised cost* (7 174)Loans and receivables and held to maturity investments 366Liabilities held for trading** (372)
2013
Liabilities measured at amortised cost* (6 403)Loans and receivables and held to maturity investments 405Liabilities held for trading** 98
* The net loss on financial liabilities measured at amortised cost consist mainly of interest expense after offsetting against effective cash flow hedges.
** The net (loss)/gain on Company and Group financial assets and financial liabilities held for trading is a R372 million loss (2013: R98 million). These are held for hedging purposes.
Transnet’s credit rating
Transnet is officially rated by Standard and Poor’s (S&P) and Moody’s Investors Service. The Company maintained its investment grade rating for the year ended 31 March 2014 as follows:
Rating category Standard & Poor’s Moody’s
Foreign currency BBB A3Local currency A- Baa1National rating Aa3.zaRating outlook Negative Negative
The SACP (stand-alone credit profile) by S&P remained unchanged at BBB+ reflecting a strong business risk profile and continued operational and financial improvements. The BCA (Baseline Credit Assessment) by Moody’s also remained unchanged at A3, sighting the fundamental credit quality of Transnet and includes the application of the GRI (Government Related Issuer) methodology.
During the year under review, both rating agencies introduced new Rating Methodologies. On 23 December 2013, Moody’s issued the revised credit opinion on Transnet and the rating was unchanged. S&P also confirmed in January 2014 that Transnet’s rating remained unchanged after the application of the new credit review methodology.

ANNUAL FINANCIAL STATEMENTS 2014118
ANNEXURE B FOR THE YEAR ENDED 31 MARCH 2014
Aircraft R million
Floating craft
R million
Land, buildings
and structures
R million
Machinery, equipment
and furniture R million
Company and Group
Balance at the beginning of the year
Historical cost and revaluation 157 2 131 22 392 7 199 Accumulated depreciation (109) (485) (4 308) (3 784)Accumulated impairment – (1) (162) (164)
Opening net carrying value at 1 April 48 1 645 17 922 3 251
Current year movements
Replacements – 9 38 42 Expansions – 3 53 29 Acquisition through lease – – – 36 Decommissioning liability – – – – Disposals – 0 – – Depreciation (11) (110) (754) (673)Derecognition – – – (3)Revaluation – 27 – Impairment- historical cost and revaluation – – (8) (25)Transferred to intangibles assets – – – (67)Transfers from/(to) non-current assets classified as held-for-sale – – 4 (8)Transfer from investment property – – 6 –
– – – – Borrowing costs capitalised – 5 15 10 Capitalisation/(release) of firm commitment – – – (1)Transfer to inventories – – – – Transfer from capital work-in-progress to assets – 123 1 485 989
(11) 30 866 329
Closing carrying value 37 1 675 18 788 3 580
Made up as follows: Historical cost and revaluation 157 2 270 24 057 8 109 Accumulated depreciation (120) (594) (5 105) (4 374)Accumulated impairment – (1) (164) (155)
Closing carrying value at 31 March 37 1 675 18 788 3 580

119
Permanent way
and works R million
Pipeline networks R million
Port facilities R million
Rolling stock and
containers R million
Vehicles R million
Capital work-in-
progress R million
31 March2014
Total R million
31 March2013
R million
25 166 28 782 82 110 57 857 988 19 755 246 537 217 846 (5 099) (10 266) (25 319) (17 568) (540) – (67 478) (59 795)
(250) (246) (598) (493) (6) (218) (2 138) (2 098)
19 817 18 270 56 193 39 796 442 19 537 176 921 155 953
626 – 35 114 3 21 377 22 244 16 220 – – – – 2 9 399 9 486 11 233 – – – – – – 36 18 – – – – – – – – – – (70) (51) (2) (6) (129) (50)
(808) (607) (1 986) (5 089) (61) – (10 099) (8 537) (106) – – (357) – – (466) (548)
– 467 7 783 – – – 8 277 1 757 207 (7) (178) (168) 1 1 (177) (67)
– – – – – (41) (108) (63)
– – 1 7 – – 4 (38) – – – – – (1) 5 96 – – – (117) – – (117) 8 2 – 5 – – 1 250 1 287 1 053 – – – – – 159 158 (114) – – – – – – – –
3 263 412 1 840 13 333 88 (21 533) – –
3 184 265 7 430 7 672 31 10 605 30 401 20 968
23 001 18 535 63 623 47 468 473 30 142 207 322 176 921
28 897 30 714 101 089 69 278 1 049 30 359 295 979 246 537 (5 853) (11 927) (36 689) (21 266) (571) – (86 499) (67 478)
(43) (252) (777) (544) (5) (217) (2 158) (2 138)
23 001 18 535 63 623 47 468 473 30 142 207 322 176 921

ANNUAL FINANCIAL STATEMENTS 2014120
Disposal groups classified as held-for-sale
Notes2014
R million
Company and Group
Assets classified as held-for-sale
Property, plant and equipment a 148 Investment properties b 6 Other investments c 84
Total 238
ANNEXURE C FOR THE YEAR ENDED 31 MARCH 2014

121
Notes to disposal groups classified as held-for-sale
Company Group
2013 R million
2014 R million
2014 R million
2013 R million
a. Property, plant and equipment 126 158 Net carrying value at the beginning of the year 158 126
( 6) ( 6) Disposals ( 6) ( 6)
38 ( 4)Transferred (to)/from continuing operations (refer annexure B) ( 4) 38
158 148 148 158
b. Investment properties6 3 Fair value at the beginning of the year 3 6
(3) (4) Disposals (4) (3)– 7 Transferred from continuing operations 7 –
3 6 6 3
c. Other investments – 114 Balance at the beginning of the year 114 99
15 ( 30) Fair value movement during the current year (30) 1599 – Transfer in on liquidation of subsidiary – –
114 84 84 114

ANNUAL FINANCIAL STATEMENTS 2014122
Subsidiaries
Effective holding Voting
power held
2014 %
2013 %
2014 %
Local subsidiaries
Transport logistics
KN Viamax Logistics (Pty) Ltd† 100 100 100
Viaren (Pty) Ltd† 100 100 100
Property holdings
Transhold Properties (Pty) Ltd# 100 100 100
Proptrade (Pty) Ltd* – 100 –
Insurance captive cells
Spoornet Guard Risk 100 100 100
Social responsibility
Transnet Foundation Trust‡ 100 100 100
Foreign subsidiaries
Transport logistics
African Joint Air Services Ltd (Uganda)# 57 57 57
Spoornet do Brasil Ltda (Brazil)** 100 100 100
# Dormant.† In liquidation. ‡ In dissolution.* Deregistered.** Sold its investment in America Logistica do Brasil S.A. (ALL Group Ltd).
ANNEXURE D FOR THE YEAR ENDED 31 MARCH 2014

123
Shares at cost Interest of holding
company net profit/(loss) Interest of holding
company indebtedness Accumulated
impairment and losses
2014 R million
2013 R million
2014 R million
2013 R million
2014 R million
2013 R million
2014 R million
2013 R million
– – – – – – – –
– – – – – – – –
– – – – – – – –
– – – – – – – –
3 3 19 14 – – – –
– – – – – – – –
– – ( 6) – 392 389 392 389
– 205 8 – – – – –
3 208 21 14 392 389 392 389

ANNUAL FINANCIAL STATEMENTS 2014124
Associates and joint ventures^
Effective holding Shares at cost
2014 2013 2014 2013
Principal activity % % R million R million
Associates
Commercial Cold Storage (Ports) (Pty) Ltd Storage and bondage 30 30 – – Comazar (Pty) Ltd# Transport logistics 32 32 13 13 Mossel Bay Waterfront Development (Pty) Ltd#
Property development and management 15 15 2 2
Experience Delivery Company (Pty) Ltd Managing agent 11 11 – –
RainProp (Pty) LtdProperty development and management 20 20 – –
Joint ventures
Gaborone Container Terminal Container terminal 36 36 6 6
21 21
^ Incorporated in the Republic of South Africa, unless stated otherwise.# Dormant.
Summarised financial information of significant associates
Commercial Cold Storage
(Ports) (Pty) Ltd
2014R million
GaboroneContainerTerminal
2014R million
RainProp (Pty) Ltd
2014R million
Financial position
Total assets 57 60 1 022Total liabilities 12 2 588
Results of operations
Revenue 18 21 42Profit for the year 1 6 18
ANNEXURE D FOR THE YEAR ENDED 31 MARCH 2014(continued)

125
Interest of holding company indebtedness
Accumulated impairment and losses
Share of post-acquisition reserves Total
2014 2013 2014 2013 2014 2013 2014 2013
R million R million R million R million R million R million R million R million
1 1 – – 13 10 14 11 8 8 21 21 – – – –
– – 2 2 – – – – – – – – – – – –
2 3 – – 68 55 70 58
– – – – 15 18 21 24
11 12 23 23 96 83 105 93

ANNUAL FINANCIAL STATEMENTS 2014126
ANNEXURE E FOR THE YEAR ENDED 31 MARCH 2014
Disclosure of irregular expenditure, fruitless and wasteful expenditure, losses through criminal conduct and losses through non-collection of revenue
The following information relates to both Company and Group.
2014R million
2013R million
Irregular expenditure*
Opening balance – –Add: Irregular expenditure – current year 49,6 230,8Less: Amounts condoned (6,8) (1,9)
42,8 228,9Less: Amounts recoverable (not condoned) – –Less: Amounts not recoverable (not condoned) 42,8 228,9
Irregular expenditure awaiting condonation – –
Analysis of expenditure awaiting condonation per age classificationCurrent year – –Prior year – –
Total – –
2014 R million
Details of irregular expenditure – current year
Incident
Disciplinary steps taken/(criminal proceedings)
Contract costs exceeded 1/(0) 40,0Procurement and capital expenditure procedures not adhered to 4/(0) 1,0Delegation of authority contravened 2/(0) 8,6
49,6
Details of irregular expenditure condoned
Incident Condoned by (condoning authority)Delegation of authority contravened Group Chief Executive 6,8
6,8
Details of irregular expenditure recoverable (not condoned)
Incident
None –
Details of irregular expenditure not recoverable (not condoned)
Incident
Contract costs exceeded 40,0Procurement procedures not adhered to 1,0Delegation of authority contravened 1,8
42,8

127
2014R million
2013R million
Fruitless and wasteful expenditure*
Fruitless and wasteful expenditure 13,6 19,7Less: Amounts recovered (0,6) (2,2)
13,0 17,5
2014 R million
Details of fruitless and wasteful expenditure
Incident
Disciplinary steps taken/(criminal proceedings)
Mainly relates to penalties and interest for late payments 21/(0) 13,0
13,0
2014R million
2013R million
Losses through criminal conduct*
Losses through criminal conduct 41,7 39,7Less: Amounts recovered (1,8) (2,2)
39,9 37,5
2014 R million
Details of losses through criminal conduct
Incident
Disciplinary steps taken/(criminal proceedings)
Mainly relates to cable and equipment theft 10/(334) 39,9
39,9
2014R million
2013R million
Losses through non collection of revenue 0,8 –Less: Amounts recovered – –
0,8 –
2014 R million
Details of non collection of revenue
Incident
Disciplinary steps taken/(criminal proceedings)
Relates to non collection of lease rentals 2/(0) 0,8
0,8
* The Shareholder Representative has determined the materiality limit for reporting in terms of section 55(2)(b)(i), (ii), and (iii) of the PFMA at R25 million per transaction. Refer to the Report of the Directors for reporting in terms of the materiality framework.

ANNUAL FINANCIAL STATEMENTS 2014128
ANNEXURE F FOR THE YEAR ENDED 31 MARCH 2014
Measurement of level 3 fair valuesThe table below shows the valuation techniques used in measuring level 3 fair values, as well as the significant unobservable inputs used.
Asset Group Valuation technique Significant unobservable inputs Range (weighted average)
Pipeline networks Modern equivalent asset value n/a
Discounted cash flow method 11,3%
Port facilities Depreciated replacement cost 1,0% – 5,5%n/an/an/an/a
Depreciated optimised replacement cost **
36,7%n/an/an/a
Discounted cash flow method 12,2% – 14,6%
Investment property Discounted cash flow method R4,5016,0% – 20,0% (18,0%)8,5% – 20,0% (16,0%)
Yield methodology R4,508,5% – 20,0% (16,0%)
* The composite PPI is derived from the local producer price index (PPI) for local input and the imported machinery PPI for imported equipment. ** Depreciated optimised replacement cost values the relevant assets at the minimum that it would cost in the normal course of business, to
replace the existing asset with a technologically modern equivalent new asset with similar service potential (ie current capacity, functionality and remaining useful lives), allowing for any differences in the quantity and quality of output and in operating costs.

129
ANNEXURE G FOR THE YEAR ENDED 31 MARCH 2014
New financial reporting standards and interpretations issued but not yet effectiveThe following new or revised international financial reporting standards, amendments and interpretations of those standards which are applicable to the Group are not yet effective for the year ended 31 March 2014 and were not applied in preparing these financial statements:
Standard or interpretation Detail Effective date
IAS 16 and
IAS 38
(amendment)
Property, Plant and Equipment and Intangible Assets
Revaluation method- proportionate restatement of accumulated depreciation/amortisationThe amendment clarifies that when an item of property, plant and equipment is
the revaluation of the carrying amount.With the amendment, gross carrying amount is either:
change in the carrying amount or through the use of observable market data. The
between the gross carrying amount and the carrying amount of the asset after taking into account accumulated impairment losses.
carrying amount of the asset.The amendments will be applied retrospectively, and will not have a material impact on the Group’s financial statements.
Annual periods beginning on or after 1 July 2014.
IAS 19
(amendment)
Employee Benefits
Contributions from employees or third partiesIAS 19 was amended to clarify the accounting for contributions made to a defined benefit plan by employees or third parties. The amendment permits contributions that are independent of the numbers of years of service to be recognised as a reduction in the service cost in the period in which the related service is rendered
credit method.The amendments will be applied retrospectively, and will not have a material impact on the Group’s financial statements.
Annual periods beginning on or after 1 July 2014.
IAS 24
(amendment)
Related-Party Disclosures
The definition of a ‘related party’ has been amended to include a management entity that provides key management personnel services to the reporting entity, either directly or through a Group entity.The revised standard will be applied retrospectively, and will not have a material impact on the Group’s financial statements.
Annual periods beginning on or after 1 July 2014.
IAS 32
(amendment)
Financial Instruments: Presentation
Offsetting amounts in the financial statementsThe amendments clarify the application issues relating to offsetting requirements. Specifically, the amendments clarify the meaning of 'currently enforceable right of set-off’ and 'simultaneous realisation and settlement'. A consequential amendment to IFRS 7: Financial Instruments: Disclosures requires entities to disclose information about rights of offset and related arrangements (such as collateral requirements) for financial instruments under an enforceable master netting agreement or similar arrangement. The revised standard will be applied retrospectively, and will not have a material impact on the Group’s financial statements.
Annual periods beginning on or after 1 January 2014.

ANNUAL FINANCIAL STATEMENTS 2014130
ANNEXURE G FOR THE YEAR ENDED 31 MARCH 2014(continued)
Standard or interpretation Detail Effective date
IAS 36
(amendment)
Impairment of Assets
Disclosure of the Impairment discount rateThe standard was amended to require entities to disclose the discount rate used in determining impairment or reversals where the recoverable amount is determined using a present value technique. The revised standard will be applied retrospectively, and will not have a material impact on the Group’s financial statements.
Annual periods beginning on or after 1 January 2014.
IAS 39
(amendment)
Financial Instruments: Recognition and Measurement
Novation of Financial InstrumentsThe amendment allows the continuation of hedge accounting (under IAS 39 and IFRS 9) when a derivative is novated to a clearing counterparty if certain conditions are met. The revised standard will be applied retrospectively, and will not have a material impact on the Group’s financial statements.
Annual periods beginning on or after 1 January 2014.
IAS 40
(amendment)
Investment Property
Recognition of Investment Property upon acquisition
acquisition of investment property is the acquisition of an asset, a group of assets
on the guidance in IFRS 3: Business Combinations.The revised standard will be applied retrospectively, and will not have a material impact on the Group’s financial statements.
Annual periods beginning on or after 1 July 2014.
IFRS 3
(amendment)
Business Combinations
Measurement of contingent considerationThe amendment requires that contingent consideration which is classified as an asset or a liability is to be measured at fair value at each reporting date.The revised standard will be applied prospectively, and will not have a material impact on the Group’s financial statements.
Annual periods beginning on or after 1 July 2014.
IFRS 8
(amendment)
Operating Segments
Aggregation criteria for operating segments disclosure
in applying the aggregation criteria. These disclosures include:
assets is required. (Only if this information is regularly provided to the entity’s chief operating decision-maker).
The revised standard will be applied prospectively, and will not have a material impact on the Group’s financial statements.
Annual periods beginning on or after 1 July 2014.

131
Standard or interpretation Detail Effective date
IFRS 9
(new)
Financial Instruments
IFRS 9 requires all recognised financial assets to be measured either at amortised cost or fair value, depending on the business model under which they are held and the cash flow characteristics of the instrument. Debt instruments held with the
generally measured at amortised cost, while all other debt instruments and all equity instruments are measured at fair value. Derivatives embedded in host contracts that are financial assets are no longer required to be bifurcated if they are not closely related to the host contract. Instead, the entire contract is assessed for measurement either at amortised cost or at fair value depending on the business model and cash flow characteristics as stated above. Derivatives embedded in contracts that are not financial assets, including financial liabilities still need to be assessed to determine whether they should be accounted for separately.The new standard removes the cost exemption for unquoted equity instruments and contains additional disclosure requirements for financial liabilities, as well as derecognition of financial instruments.Hedge Accounting
New hedge accounting requirements have been included in IFRS 9 aimed at better aligning the accounting with how entities undertake risk management activities when hedging financial and non-financial risk exposures.
provisions. The impact on the Group’s financial statements has not yet been estimated.
No effective date, however the standard is available for application.
IFRS 13
(amendment)
Fair Value Measurement
Measurement of short-term receivables and payablesThe amendment allows entities to continue to measure their short-term receivables and payables without a stated interest rate and without discounting, provided that the effect of not discounting is immaterial.The scope of the IFRS 13 portfolio exception states that entities are permitted to measure the fair value of a group of financial assets and financial liabilities with offsetting risk positions on a net basis if certain conditions are met. The revised standard will be applied prospectively, and will not have a material impact on the Group’s financial statements.
Annual periods beginning on or after 1 July 2014.
The financial reporting standards, amendments or interpretations listed below are currently not applicable to the Group and will have no impact on the Group’s financial statements:
IFRS 2
(amendment)
Share-based Payment
Definition of ‘vesting condition’IFRS 2 has been amended to clarify the definition of ‘vesting condition’ by separately defining ‘performance condition’ and ‘service condition’.
Annual periods beginning on or after 1 July 2014.
IFRS 14
(new)
Regulatory Deferral Accounts
Reporting requirements for regulatory deferral account balances
‘regulatory deferral account balances’ that arise when an entity provides goods or
IFRS 14 is an interim solution for rate-regulated entities that have not yet adopted IFRS.
Annual periods beginning on or after 1 January 2016.

ANNUAL FINANCIAL STATEMENTS 2014132
CORPORATE GOVERNANCE FOR THE YEAR ENDED 31 MARCH 2014
Purpose and functions of governance within TransnetTransnet SOC Ltd is a Public Company, constituted by the Legal Succession Act of 1989, with the South African Government being its sole Shareholder. The Company is mandated to assist in lowering the cost of doing business in South Africa, as well as to enable economic growth and ensure the security of supply by providing appropriate port, rail and pipeline infrastructure in a cost-effective and efficient manner within acceptable benchmarks.
The Company’s Memorandum of Incorporation was approved on 25 June 2013 as per the provisions of the Companies Act, No 71 of 2008 (Companies Act). As a State-owned Company (SOC), the Public Finance Management Act, No 1 of 1999 (PFMA) serves as Transnet’s primary legislation. Details of the Company’s PFMA compliance is included on pages 18 and 19.
The Company views good governance as a vital component in operating a successful business, as well as providing assurance to stakeholders that the Company is well managed. The governance relationship with the Government as sole Shareholder, represented by the Minister of Public Enterprises, is managed through the Shareholder’s Compact, which sets out the Shareholder’s requirements and expectations of the Company.
In 2012, the Board of Directors responded to the Shareholder’s Statement of Strategic Intent by adopting the
Enterprises and cover the following eight dimensions: 1. Capital planning and execution.2. Volumes and customer satisfaction.3. Operational efficiencies and productivity.4. Finance and funding.5. Regulatory and key stakeholder engagement.6. Safety risk and sustainability.7. Human capital strategy.8. Building organisation readiness and a high performance culture.
The Company is investing R312,2 billion over the next seven years (ending 2021) to deliver on the MDS.
The role of the Board of Directors
The Board of Directors is principally responsible for managing the Company and ensuring its long-term economic, social and environmental sustainability. Accordingly, the Board of Directors has delegated management accountability to the Group Chief Executive through the Delegation of Authority Framework. The Board of Directors is further tasked with ensuring that the Company is able to fulfil its statutory and
assessing the Company’s performance against the targets outlined in the Shareholder's Compact. It further ensures that adequate budget planning processes are in place.
Board of Directors Committees
The Audit Committee and the Remuneration, Social and Ethics Committee, were established in compliance with the Companies Act. The Company adheres firmly to the Audit Committee’s constitution, as well as its functioning and reporting requirements. In addition to the statutory committees, the following Board of
The Committees’ mandates are achieved through ‘Annual Work Plans’ and ‘periodical Board of Directors workshops’, focusing on strategic planning and review of the Corporate Plan and budgets. The Board of
completeness. The Group Company Secretariat coordinates site visits to enable the Board of Directors to monitor progress in operations as part of induction training and to interact with various stakeholders, ranging from employees to service providers and key customers.

133
and focus areas going forward are addressed under 'Board of Directors and its Committees report back'.
Governance contextGovernance is underpinned by effective leadership oversight and management accountability, based on a sound ethical foundation. The Board of Directors and its Committees execute the Company’s mandates according to the strategic direction of the Company, taking into account the opportunities and risks facing the Company as well as its overarching risk appetite. Twice a year, the Board of Directors assesses the Company’s strategic implementation and ensures that corrective action is taken when challenges present. Appropriate, timely and accurate information is communicated to relevant stakeholders within the governance structures.
The Board of Directors has a duty to ensure that the Company complies with all applicable rules, laws, codes and standards, including the provisions of the Companies Act, the PFMA, and the King III Report on Governance (King III). These codes and standards cannot be read in isolation but should be interpreted in the context of the whole compliance universe applicable to the Company. Where required, the Board of Directors
of conflicts in legislation, the PFMA prevails.
As a State-owned Company, the Company enters into an annual Shareholder’s Compact with the Government of the Republic of South Africa, represented by the Minister of Public Enterprises. The Shareholder’s Compact mandates the Company to deliver on numerous strategic deliverables, including but not limited to, economic, social and environmental dividends. Accordingly, the Company develops an annual budget that covers a
commercial and operational circumstances and economic conditions. As the sole Shareholder, Government requires investment returns and other economic, developmental and infrastructural deliverables that are in the interest of the economy as a whole.
The Company further supports the implementation of Government policies and the delivery of socio-economic imperatives. These include social contributions such as skills development, transformation and
MDS whilst contributing towards Government’s National Development Plan (NDP) often results in a tension between the need to grow volumes and the parallel need to meet social responsibility targets. With the recent
be placed on the Company’s operations to balance the generation of additional revenue and volumes with the achievement of employment, training and other social development targets.
Frameworks and governance philosophySound governance principles define and direct the responsibilities of the Board of Directors. The Board of Directors applies governance principles through its Governance Framework, and ensures that impeccable governance practices are instituted by actively driving a sustained governance culture throughout the Company, based on associated norms and standards.
Leadership, oversight and accountability
Appropriate leadership, oversight and accountability is instituted through the appointment of the Board of
oversight deliverables were achieved during the year:
Company, and therein, continued to act in the best interests of the Company.
strictly monitored during the year.

ANNUAL FINANCIAL STATEMENTS 2014134
responsibilities of the Board of Directors and its Committees for the period under review.
Code on Corporate Governance.
Group Chief Executive, and Group Company Secretariat were evaluated during the year by an independent external service provider.
during the year. Training and development needs identified in the Board of Directors evaluation report were incorporated into training programmes. The Group Company Secretary continued with the annual review of the Directors’ toolkit, which includes pertinent information and resources for the Board of Directors.
managed during the year, and reviewed the Code of Ethics for adequacy.
director was done in line with applicable laws and regulations in the Integrated Report.
Group Company Secretary during the year. The mandatory duties of the Group Company Secretary are formalised and adequately defined according to the role description provided for in the Companies Act.
methodologies were in place to enhance the Company’s ability to anticipate and respond to unpredictable risks.
Direction
The Board of Directors determines the direction of the Company in response to its mandate. During the year, the Board of Directors performed the following key activities in determining the Company’s direction:
Shareholder’s Compact.
Minister and the Minister of Finance by 28 February 2014.
management’s mitigation strategies to manage the identified risks.
Structure
The Board of Directors has identified and implemented the appropriate governance structures to assist in fulfilling its responsibilities in line with the Companies Act and the requirements of the PFMA. The governance structures operate within a Board of Directors approved mandate, with clear authority levels and channels of delegation. The Committee mandates are aligned with the requirements of the Companies Act, the PFMA and King III. The performance of the governance structures is assessed annually through the Board of Directors evaluation process.
The Results Management Office Review Committee was constituted as a Committee of the Group Executive Committee to identify risks associated with the delivery of the MDS. It further supports the Company’s strategic direction and the management of critical initiatives to alleviate bottlenecks and accelerate operational delivery. Its focus is on the delivery of the most critical MDS initiatives.
A Property Committee was constituted as a Committee of the Group Executive Committee in response to
Committee assists the Corporate Centre, Operating divisions and Specialist Units in aligning practices pertaining to property strategies, initiatives, policies and procedures, thereby facilitating the development of a coordinated and consistent approach to the management of property as an asset class.
CORPORATE GOVERNANCE FOR THE YEAR ENDED 31 MARCH 2014(continued)

135
Effective meetings
The Board of Directors and its Committees meet regularly as prescribed in their mandates. The meetings are facilitated by the Group Company Secretary, and are planned for the year in the Board of Directors approved corporate calendar. However, special meetings may be convened at the request of the Chairperson, as well as at the request of any independent non-executive director or members of the Group Executive Committee. All meetings are managed by effective chairpersons, and are well attended. Timely, relevant and accurate information is provided to the Board of Directors and its Committees. The minutes of the Board of Directors and committee meetings are circulated and approved in accordance with the mandates.
Monitoring
The Board of Directors monitors the implementation of the Company’s strategy, and ensures that corrective action is taken as required. Monitoring of performance includes the following:
rules, codes and standards.
assessment of the Company’s system of internal controls and risk management.
Communication
Management ensures that relevant, timely and accurate information is communicated within the governance structures and to relevant stakeholders. This is achieved through:
Governance Framework
RegistrationAs a State-owned Company, Transnet has to comply with the specific requirements of the Companies Act in relation to the registration and filing of the Memorandum of Incorporation with the Companies and Intellectual Property Commission, as well as the filing of annual returns, and ensuring that the audited annual financial statements are available to the Shareholder Representative.
Transparency, accountability and integrity The Companies Act and the PFMA have specific requirements pertaining to the Company’s records management practices, such as the requirement for the annual financial statements to satisfy the International Financial Reporting Standards (IFRS) and for the audited annual financial statements to be prepared within five months following the financial year-end. In real terms, the Company finalises its annual financial statements within the first quarter of the new financial year and ensures that the Shareholder Representative has access to the annual financial statements.
Governance of a State-owned CompanyThe shareholder’s rights are represented according to the stipulations of the Companies Act and associated procedures are in place. Shareholder meetings are held in accordance with the Companies Act.
Appointment of the Board of DirectorsThe Company adheres to the prescribed requirements for the composition, appointment, remuneration and the election of the Board of Directors. The Board of Directors holds meetings as per the stipulations of the Companies Act and adheres to the prescribed standards of ethical and professional conduct.

ANNUAL FINANCIAL STATEMENTS 2014136
The Board of Directors further considers the extent and adequacy of indemnification and insurance provided for independent non-executive directors and prescribed officers.
Specific governance requirements
PFMAThe PFMA outlines the fiduciary duties and responsibilities of the Board of Directors and requires that it serves as the Company’s accounting authority. Transnet adheres to the requirements for the assessment of risk and annual budget submission, as well as the annual conclusion of a Shareholder’s Compact. The Company further adheres to all procedures for quarterly reporting to the Executive Authority and the requirements for the composition and appointment of the Audit Committee.
Companies ActThe Company reports on the extent of its compliance with the Companies Act in the Compliance Report, as set out on page 157. During the year, the Company took steps to ensure compliance with outstanding provisions of the Companies Act. This included performing a review of the Company’s new Memorandum of Incorporation to align with the provisions of the Act in terms of financial assistance for independent non-executive directors and prescribed officers.
Prescribed officers
The Company’s Memorandum of Incorporation confirmed the definition of ‘prescribed officers' and these were identified as the Group Executive Members. These individuals (see Group Executive for brief profiles) were deemed to exercise or regularly participate in the executive control of the Company as contemplated in the Companies Act and its regulations.
The disclosure on the remuneration of prescribed officers is set out on pages 28 to 30.
Social and Ethics Committee
The Company has established the Social and Ethics Committee referred to as the Remuneration, Social and Ethics Committee in compliance with the Companies Act.
Audit Committee
During the year, the Company continued to comply with the Companies Act’s requirements for the constitution, functioning and reporting of the Audit Committee.
King III
provisions to achieve the overarching principles of sound governance, namely responsibility, accountability, fairness and transparency. It does so substantively and not simply in form, so that its decisions and actions impact positively on the Company and all its stakeholders, including its employees, the communities where it operates, suppliers, customers and the public at large.
Governance instruments
The Company has a number of governance instruments in place, namely:
Memorandum of Incorporation
The Company’s new Memorandum of Incorporation, aligned with the provisions of the Companies Act, was approved by the Shareholder Minister at the annual general meeting on 25 June 2013. The approved Memorandum of Incorporation was subsequently filed with the Companies and Intellectual Property Commission on 1 July 2013. The Company received confirmation from the Companies and Intellectual Property Commission that the Memorandum of Incorporation was ‘Accepted and Filed’ on 25 November 2013.
Delegation of Authority Framework
The Company’s Delegation of Authority Framework is reviewed annually for adequacy and completeness. The current Delegation of Authority Framework was approved by the Board of Directors on 29 May 2013, and
CORPORATE GOVERNANCE FOR THE YEAR ENDED 31 MARCH 2014(continued)

137
came into effect on 1 June 2013. However, the procurement delegations were further amended to support the MDS, and the revised Delegation of Authority came into effect on 1 November 2013.
All the Operating divisions and Specialist Units have cascaded the latest edition of the Delegation of Authority to their respective Executive Committee Members (Extended Executive Committee). There is, however, room to improve the average lead time between the Board of Directors approving the Delegation of Authority Framework and implementing it at Extended Executive Committee level in order to mitigate the inherent risks associated with the outstanding delegated authority. The Group Company Secretariat has recommended that the Delegation of Authority Framework be cascaded within a period of one month from the date of signature by the Group Chief Executive. Accordingly, the Group Company Secretariat will implement measures to achieve this proposal.
The respective governance structures commenced with the review of the proposed Delegation of Authority Framework on 20 February 2014. It is envisaged that the 2015 Delegation of Authority Framework will come into effect on 1 September 2014, after consideration and approval by the Board of Directors at its meeting scheduled for 28 August 2014.
Board of Directors and its Committees mandates
The Board of Directors and its Committees mandates were reviewed to align with the new Memorandum of Incorporation, as well as the provisions of the Companies Act and the Delegation of Authority Framework. The revised mandates were approved by the Board of Directors on 29 August 2013.
The governance structures commenced with the annual review of the mandates on 8 April 2014. It is envisaged that the 2015 mandates will come into effect on 1 September 2014. The proposed amendments resulted from the need to continually review and update the governance instruments in accordance with best practice principles and to align the new Delegation of Authority Framework.
Similarly, the mandates of the Group Executive Committee and its Committees will be reviewed to align with the Delegation of Authority Framework and the mandates of the Board of Directors.
Matters reserved for Board of Directors decision
Memorandum of Incorporation, as well as the PFMA and other applicable legislation.
Financial1. Approval of the strategy, corporate plans, and annual budgets, as well as the borrowing strategy and of
any subsequent material changes in strategic direction.2. Approval of annual financial statements and interim reports, and the declaration of dividends.3. Approval of any significant changes in accounting policies or practices.4. Recommendation to the Shareholder of any increase, reduction or alteration to the share capital of the
Company and the allotment, issue or other disposal of the Company’s shares (except for shares allotted under the Company share incentive scheme, if any).
5. Recommendation for the Shareholder’s approval of the establishment or participation in the establishment of a Company.
6. Recommendation for the Shareholder’s approval of any participation in a significant partnership, trust,
7. Recommendation for the Shareholder’s approval of the acquisition or disposal of a significant shareholding in a company or a significant asset.
8. Recommendation for the Shareholder’s approval of the commencement or cessation of a significant business activity.
9. Recommendation for the Shareholder’s approval of a significant change in the nature or extent of
arrangement.10. Recommendation for the Shareholder’s approval to commit the Company or its subsidiaries to borrowings
which confer rights to a lender to convert debt into shares of any kind.

ANNUAL FINANCIAL STATEMENTS 2014138
11. Recommendation for the Shareholder’s approval to dispose of movable assets (excluding scrap) of a value exceeding limits prescribed by the Shareholder’s Compact or the Significance and Materiality Framework.
12. Recommendation for the Shareholder’s approval to enter into any transaction which exceeds or falls outside the limits prescribed by the Shareholder’s Compact or the Significance and Materiality Framework.
to, and in accordance with, the provisions of the Memorandum of Incorporation.
Statutory and administrative1. Recommend amendments to the Company’s Memorandum of Incorporation to the Shareholder.2. Enter into a Shareholder’s Compact. 3. Ensure that the proposed Shareholder’s Compact for the following financial year is submitted to the
Shareholder by 30 September of the each year.4. Ensure that the Company’s annual budget and Corporate Plan are presented and/or submitted to the
Shareholder by 28 of February each year.5. Ensure that the Company discloses to the Shareholder all changes to terms and conditions of trade
which may result in material impact on the Company.6. Recommend to the Shareholder the appointment, removal or replacement of the Company’s
external auditor.7. Recommend to the Shareholder the appointment of the Company’s Group Chief Executive.8. Make recommendations to the Shareholder on the appointment of the Company’s Group Chief
Financial Officer.9. Appoint responsible persons as may be required in terms of any statute in South Africa or elsewhere in
respect of the Company.10. Approve the rules and amendments to pension and provident funds that have a material effect on the
actuarial liabilities of those funds.11. Grant general signing authorities pursuant to the Company’s Memorandum of Incorporation.12. Appoint and remove the Company Secretary.13. Procure detailed management accounts of the Company and its subsidiaries, inclusive of progress made
against the Corporate Plan. Management accounts shall be prepared on a quarterly basis and submitted to the Shareholder within the month after the end of the quarter in respect of which such accounts are being prepared. Such management accounts shall be circulated on a quarterly basis to each director of the Board of Directors and the Shareholder.
RegulatoryThe Company shall not perform the following duties without the prior written approval of the Shareholder:1. Approve terms and conditions of the Company’s rights issues, public offers, capital issues or issues of
convertible securities, including shares or convertible securities issued for acquisitions. 2. Approve authority to issue circulars to the Company’s Shareholder.3. Approve authority to issue prospectuses, or to place documents, listing particulars, rights offers or
takeover or merger documents.4. Recommend to the Shareholder the approval of any ordinary or special resolutions in respect of
the Company.5. Approve any decision to list the Company’s shares on any stock exchange or to terminate any such listing.
The Shareholder may, after consultation with the Board of Directors, issue directives to the Board of
ComplianceThe Company has an established formal Compliance Function. As is the case with all Company policies, the Company’s Compliance Policy is reviewed bi-annually and updated as and when required. The Compliance Policy forms the foundation of the Company’s Compliance Framework.
CORPORATE GOVERNANCE FOR THE YEAR ENDED 31 MARCH 2014(continued)

139
The Company considers non-compliance with legislative requirements as a key risk, as it not only exposes the Company to fines and civil claims, but can also result in loss of operational authorisations and reputational harm.
The PFMA requires the Board of Directors to ensure that the Company and all its employees comply with the provisions of the PFMA and any other legislation that is applicable to the Company. The compliance function therefore identifies, assesses and monitors critical controls associated with regulatory requirements, statutory licences, codes and standards applicable to the Company. Compliance issues are reviewed both centrally at the Corporate Centre and within the Operating divisions and Specialist Units.
The Audit Committee is charged with managing the Company’s Compliance Plan, which details procedures for identifying regulatory risks and monitoring compliance with applicable regulatory requirements. The Compliance Plan has been aligned with the MDS to mitigate compliance risk exposures emerging from the execution of the MDS.
Management of potential conflicts of interests
The Companies Act codified the fiduciary duties of directors and prohibits the use of position, privileges or confidential information for personal gain or to improperly benefit another person.
In instances where an independent non-executive director or a prescribed officer has any direct or indirect personal or private business interest in a particular matter, that independent non-executive director or prescribed officer must be recused from the proceedings when the matter is considered, unless the Board of Directors, Committee or Group Executive Committee decides that the member’s interest in the matter is trivial or irrelevant.
For all formal meetings, registers for declaration of interests and related-party disclosures are completed by the independent non-executive directors, prescribed officers and attendees. These registers are maintained by the Group Company Secretary. Further, independent non-executive directors, prescribed officers and Extended Executive Committee members are required to complete an annual declaration of interest form and to file it with the Group Company Secretary prior to 1 April. Should the interest change during the course of the year, revised declaration of interest forms are filed and formally noted within various governance structures.
In support of good governance, the Board of Directors and the Group Executive Committee note their respective Annual Declarations Registers. For adequacy and proper monitoring, the Corporate Governance and Nominations and the Remuneration, Social and Ethics Committees performs annual review of the filed declaration of interest forms for the Board of Directors and Group Executive Committee.
In support of innovation – and to alleviate the process of manual filing – the Group Company Secretary has introduced an electronic Declaration of Interests filing system. The electronic system was launched in October 2013 together with the Electronic Gifts Registry System. Quarterly reports are drawn from the Electronic Gifts Registry System and tabled at the Remuneration, Social and Ethics Committee meetings for information purposes.
In addition, the Company requires all employees to sign confidentiality and declaration of interest forms
Policies for Directors and Employees were revised during the year to align with the Companies Act. The amended provisions were approved by the Board of Directors on 29 August 2013 and came into effect on 15 September 2013.
Ethics
The Company’s Code of Ethics (the Code) promotes a culture of entrenched values, principles, standards and norms that guide the behaviour of the Company’s employees. The Code aims to instil a culture of honesty, respect, integrity and overall ethical behaviour in terms of employees’ engagements with internal and external stakeholders. The Code commits the independent non-executive directors and employees to the highest standards of ethical behaviour and all employment contracts make reference to the Code. The Company’s
to extend the scope to independent non-executive directors. It is due for review in 2015. Aspects of the Code are included in fraud and corruption awareness training, and are accessible to all employees on the Company’s intranet.

ANNUAL FINANCIAL STATEMENTS 2014140
In addition to the Code, the Company concludes Integrity Pacts with all bidders and suppliers. Integrity Pacts have replaced Transnet’s Supplier Code of Conduct. Each party agrees to avoid all forms of dishonesty, fraud and corruption, including practices that are anti-competitive in nature, negotiations made in bad faith and underpricing.
Fraud risk management plan 2015Transnet places strong emphasis on an effective anti-fraud programme, which focuses on identifying fraud risk exposures and enhancing controls, processes and procedures to reduce opportunities for employees and third parties to commit fraud.
Transnet’s fraud risk management plan (FRMP) provides mechanisms for the prevention, early detection and investigation of irregularities and provides corrective measures to address control breakdowns and root causes thereof from a fraud and/or corruption perspective.
Subsequent to the introduction of the MDS during the 2013 financial year, there was an inherent requirement to realign the FRMP to the MDS in order to ensure that any potential fraud or corruption risk exposures, resulting from the execution of the MDS, are adequately addressed.
The continuous enhancement of Transnet’s FRMP, in line with its business strategy, is vital to Transnet in ensuring that good corporate governance is upheld and furthermore, that employees are aware of Transnet’s anti-fraud programme and are assured that Transnet has effective mechanisms in place to prevent, detect and report any suspicion of fraud, corruption and other economic crime. As a result, Transnet’s FRMP is updated and enhanced on an annual basis.
Given the emphasis that the MDS places on the Procurement, Human Capital and Information Technology environments, together with the evolving nature of fraud, corruption and other economic crime, the anti-fraud initiatives contained within Transnet’s 2015 FRMP will continue to place in-depth focus on these environments to ensure that any identified fraud and corruption risks are effectively mitigated.
As Transnet approaches the 2015 financial year, its FRMP will focus on the enhancement and execution of forensic data analytics over and above the continuous control monitoring (CCM) analytics executed on a monthly basis, as well as the continued implementation of an Anti-Corruption Compliance Programme.
Forensic data analytics
Fraud triangle analyticsFraud Triangle Analytics involves analysing communication over a period of time for keywords, specifically chosen to identify potential pre-conditions of the fraud triangle ie pressure, rationalisation and opportunity.
through the ongoing analysis of communication data, by means of keyword searches that are congruent with the three conditions/elements of the fraud triangle.
Expenses analytics Expenses analytics comprises a detailed analysis of both expenses and related data including, inter alia, leave records, petrol card transactions, credit card transactions, etc in order to identify potential anomalous behaviour with the processing of expense claims eg expense claim incurred dates match employee leave dates, duplicate expense claims, employees approving their own expense claims, etc.
Anti-corruption compliance programme
Transnet with internationally recognised standards, which can be used as a benchmark to assess and improve
recognised templates that can be appropriately customised, to assist in the implementation of Transnet’s anti-corruption measures.
CORPORATE GOVERNANCE FOR THE YEAR ENDED 31 MARCH 2014(continued)

141
Ongoing awareness of the Tip-Offs Anonymous Hotline forms an integral part of Transnet’s anti-fraud and anti-corruption efforts. The hotline is managed by Transnet internal audit and all reported cases are investigated through an established forensic investigation process.
Tip-Offs Anonymous Hotline statistics
Details
1 April 2013 to
31 March 2014
1 April 2012 to
31 March 2013
Total allegations 1 133 864
Founded 231 157Unfounded 494 471Total in progress 408 236
Total disciplinaries 116 119
Finalised 105 89
Total criminal/civil 16 5
Ongoing fraud awareness campaigns have contributed to the increase in fraud allegations in 2014, by instilling confidence in employees and third parties to report their suspicions of fraud, theft, corruption and other economic crime. The fraud awareness initiatives include fraud and corruption awareness training, hotline and fraud awareness emails, posters, screen savers, the anti-fraud home space, fraud talk articles, wristbands and z-cards.
The number of founded allegations have increased due to national investigator training being conducted, as well as an increase in internal forensic capacity across the Operating divisions. There has been a slight increase in unfounded allegations, as the quality of information received from whistle blowers does not always support successful investigation outcomes.
An Ethics Climate Survey is currently underway within the Company, of which Phases 1 and 2 have been completed. Results are being reported to the relevant management and Board of Directors Committees, and will also inform the development of an Ethics Compliance Programme in the year ahead. Further, an Anti-
through the Transnet approval process. In excess of 4 500 employees were trained during the rollout of the anti-fraud, corruption and ethics awareness training programmes during 2014.
To read more on Transnet’s management approach to instilling and encouraging Group-wide ethical behaviour and professional practices refer to page 18 of the 2014 Sustainability Report.
Structure and composition of governance committeesThe Company’s governance structure is derived from its mandate. The Board of Directors is tasked with
The Board of Directors delegates powers to its Committees, of which Committee members are specialists in their respective fields and areas of governance. The Board of Directors also delegates powers to the Group Chief Executive to direct the business strategically and to provide adequate direction to the Company’s operations to ensure that the strategy is successfully implemented. The Group Chief Executive is assisted by the Group Executive Committee to deliver on specific mandates, based on the Delegation of Authority Framework. The Company further carries out its mandate through Operating divisions and Specialist Units, which receive delegations from the Group Chief Executive.

ANNUAL FINANCIAL STATEMENTS 2014142
The governance structure of the Company is depicted in the diagram below:
Shareholder (Minister of Public
Enterprises)
Shareholder’s Compact
BoardChairperson:
ME Mkwanazi
Delegation of Authority Framework
Group Executive
Committee Chairperson:
B Molefe
Divisional Executive
Committees
Freight Rail
National Ports Authority
Pipelines
Port Terminals
Transnet Engineering
Audit Committee
Chairperson: IB Skosana
Remuneration, Social and
Ethics Committee
Chairperson: NR Njeke
Corporate Governance and
Nominations Committee
Chairperson: ME Mkwanazi
Board Risk Committee
Chairperson: DLJ Tshepe
Board Acquisitions
and Disposals Committee
Chairperson: IM Sharma
Policy and
Regulation
Committee
Chairperson:
KC Phihlela
Finance
Committee
Chairperson:
A Singh
Capital
Investment
Committee
Chairperson:
B Molefe
NMPP
Governance
Steering
Committee
Chairperson:
B Molefe
Risk
Management
Committee
Chairperson:
DC Moephuli
Human
Resources
Committee
Chairperson:
EAN Sishi
Business
Information
Management
Committee
Chairperson:
M Matooane
Group Broad-
Based Black
Economic
Empowerment
Committee
Chairperson
NJ Mabandla
Results
Management
Office Review
Committee
Chairperson:
R Lepule
Property
Committee
Chairperson:
R Lepule
CORPORATE GOVERNANCE FOR THE YEAR ENDED 31 MARCH 2014(continued)

143
Integrated Report elements
The Board of Directors and the Group Executive Committee have respectively established committees to ensure effective management and monitoring of the business and to respond to the elements of the Company’s mandate and strategy. The link between management and the various Board of Directors and Group Executive Committees for each element is indicated below:
Integrated Reporting element Job to be done
Committees of the Board of Directors
Committees of the Group Executive Committee
Stakeholder engagement and relationships
Effective stakeholder engagement and responsiveness.
and Ethics Committee.Economic Empowerment Committee.
Risks and opportunities
Review the adequacy and effectiveness of the risk management function including Enterprise-wide Risk Management, financial risk, commercial risk, regulatory risk, technology risk, market risk, operational risk, environmental, health and safety risks.Effective identification and assessment of material issues.
Management Committee.
Strategy and resource allocation
Appropriate strategic response including:
Advise the Board of Directors on responsible corporate citizenship and sustainability.
Disposals Committee.
and Ethics Committee.
Committee.
Committee.
Review Committee.
Committee.
Performance and outlook
Appropriate performance measurement and management including:
indicators.
accountability and incentivisation.
and Nominations Committee.
and Ethics Committee.
Disposals Committee.
Committee.
Review Committee.
Remuneration Appropriate remuneration structured to align performance against strategy in short-, medium- and long-term incentives.
and Ethics Committee.
Governance Governance and assurance processes to oversee execution of strategy and structures in accordance with policy and regulation.
and Nominations Committee.
Committee.
Committee.

ANNUAL FINANCIAL STATEMENTS 2014144
Board of Directors composition
The Company’s Memorandum of Incorporation provides that there shall not be less than 10 and not more than 14 directors, of whom not less than eight shall be non-executive directors and two executive directors. As at
non-executive, including the Chairperson.
The independent non-executive directors have diverse skills, experience and backgrounds. They are
the business and activities of the Company. All the independent non-executive directors have unrestricted access to the Company’s information, documents, records and property in the interest of fulfilling their responsibilities as independent non-executive directors. The independent non-executive directors contribute
strategy, corporate governance, performance and general leadership, whilst the executive directors provide an operational understanding of the Company.
The independent non-executive directors have direct, unfettered access to the Company’s employees, external auditors, professional advisors and internal auditors.
As far as the Company is concerned, the potential political connections or exposures of the independent non-executive directors is minimal due to the activities of the Board of Directors, its range of governance instruments and the execution of the fiduciary duties of the independent non-executive directors. The independent non-executive directors act in the best interest of the Company at all times.
Mr NK Choubey, an independent non-executive director, retired at the 23rd annual general meeting of the Company held on 25 June 2013 in terms of Clause 17.10.3.1 of the Memorandum of Incorporation.
Roles of the Chairperson and Group Chief ExecutiveThe Chairperson, Mr ME Mkwanazi, is an independent non-executive director. The roles of the Chairperson and the Group Chief Executive are separate, with their individual responsibilities clearly defined. The Chairperson is responsible for leading the Board of Directors and ensuring its effectiveness.
The Group Chief Executive is responsible for the execution of the Company’s strategy and the day-to-day business of the Company, supported by the Group Executive Committee, which he chairs.
Independent non-executive directorsDirectors’ independence is determined according to the definition provided for in the King III Code, which includes the number of years a director has served on the Board of Directors. A review, as provided for in the King III Code, is conducted to ascertain the independence of long-serving non-executive directors, and the Board of Directors agree that none of the serving independent non-executive directors have been in service in that capacity for more than nine years.
May 2006. The Board of Directors will perform an assessment during the 2015 financial year to ascertain her independence.
LENGTH OF TENURE OF INDEPENDENT NON-EXECUTIV E DIRECTORS AS AT 31 M A RCH 2014
3-6 years 8
0-3 years 2
6-9 years 1
DIRECTORS' REPRESENTATION BY R ACE AS AT 31 M A RCH 2014 (INCLUSIV E OF EXECUTIV E DIRECTORS)
Coloured 1
Black African 7
Indian 3
White 2
DIRECTORS' GENDER REPRESENTATION AS AT 31 M A RCH 2014 (INCLUSIV E OF EXECUTIV E DIRECTORS)
Female 6
Male 7
CORPORATE GOVERNANCE FOR THE YEAR ENDED 31 MARCH 2014(continued)

145
Directors' balance of skills and expertiseThe diagram below reflects the balance of skills and expertise to ensure effective discussions in fulfilling the Board of Directors mandate. Details on the individual directors’ skills and expertise are set out on pages 16 to 19 of the 2014 Integrated Report.
Operations
Corporate
governance
MathematicsLegal and
Compliance
Business
leadership and
acumen
Commerce/
economics
Engineering
Marketing
and public
relations
Accounting
Management
Engineering
Procurement
LogisticsIT governance
Risk
management
Legal/
compliance
Accounting/
finance
Strategy
Marketing
Human
resource and
remuneration
EconomicsBOA RD OF DIRECTORS
Group Company Secretariat functionThe Group Company Secretary is responsible for developing systems and processes to enable the Board of Directors to discharge its functions efficiently and effectively. The Group Company Secretary prepares
respective Committees. These Annual Work Plans are approved by the respective governance structures for implementation. The Group Company Secretary advises the Board of Directors on corporate governance issues, the requirements of the Companies Act. The Board of Directors has unfettered access to the services and advice of the Group Company Secretary.
In addition to various statutory functions, the Group Company Secretary provides individual independent non-executive directors and the Board of Directors with induction, guidance on duties, responsibilities and powers, and the impact of regulatory developments. In consultation with the Chairperson, the Group Company Secretary ensures that the contents of the agenda are relevant to the Board of Directors decision-making, and communicates the Board of Directors resolutions throughout the Company in a timely and appropriate manner. A number of instruments have been introduced to ensure that the Board of Directors functions
a tracker for the approved Annual Work Plans. The Group Company Secretary acts as the primary point of contact between the Board of Directors and the Company.

ANNUAL FINANCIAL STATEMENTS 2014146
The Group Company Secretary is qualified to perform the duties in accordance with applicable legislation and is considered by the Board of Directors to be fit and proper for the position.
The Group Company Secretary does not fulfil an executive management function and is not a director. Therefore, the Board of Directors is satisfied that the Group Company Secretary maintained an ‘arm’s length’ relationship with the Group Executive team, and the Board of Directors.
Board of Directors and its Committees report backPurpose of the Board of Directors and its Committees
The purpose of the Board of Directors is to ensure that the Company is sustainable and capable of fulfilling its
control the business of the Company.
Directors owe a fiduciary duty to the Company both under common law and statute – more particularly the PFMA and the Companies Act – and are accountable to the Shareholder: the State of the Republic of South Africa, represented by the Minister of Public Enterprises (the Shareholder Minister).
Directors are also responsible, within the structures of corporate law and legislation, to the other stakeholders of the Company. Directors are required to exercise due care, skill and the utmost good faith in the performance of their duties.
Board of Directors strategy and ‘Deep Dive Sessions’
As part of its ‘Annual Work Plans’, the Board of Directors and the Committees hold strategy workshops and ‘Deep Dive Sessions’ where matters of a strategic nature are addressed in detail to ensure thorough interrogation. During the year, the Board of Directors convened two Strategy Workshops and one ‘Deep Dive Session’.
Board of Directors Summary of Board of Directors mandate:
Chairperson:
Mr ME MkwanaziMembers:Mr B MolefeMr NK Choubey*Mr MA FanucchiMs Y ForbesMr HD GazendamMs N MoolaMs NP Mnxasana
Mr IM SharmaMr A SinghMr IB Skosana
Ms DLJ Tshepe
The Board of Directors primary mandate is to ensure the sustainable and successful continuation of business activities by providing strategic direction to the Company. Non-executive directors are appointed to the Board of Directors by the Shareholder Representative, on a three-year term. The appointments are confirmed annually at the annual general meeting. The Chairperson of the Board of Directors engages continuously with the Shareholder Representative, who is the final arbiter on Board of Directors succession plans and approval of transaction applications in accordance with the provisions of section 54 of the PFMA.
King III imposes specific responsibilities on the Board of Directors. The non-executive directors embrace these and acknowledge that the Board of Directors is primarily responsible for ensuring that the Company’s strategy, risk compliance, performance and sustainability are inseparable. The Board of Directors provides effective leadership based on an ethical foundation of responsibility, accountability, fairness and transparency.
* Retired from the Board of Directors on 25 June 2013.
CORPORATE GOVERNANCE FOR THE YEAR ENDED 31 MARCH 2014(continued)

147
Board of Directors Summary of Board of Directors mandate:
Chairperson:
Mr ME MkwanaziMembers:Mr B MolefeMr NK Choubey*Mr MA FanucchiMs Y ForbesMr HD GazendamMs N MoolaMs NP Mnxasana
Mr IM SharmaMr A SinghMr IB Skosana
Ms DLJ Tshepe
Summary of key activities and key outputs (decisions, approvals, policies and procedures) for 2014
The Board of Directors considered, amongst other, the following during the year:
Approved
NERSA for land rehabilitation purposes.
Ex gratia bonus payment to qualifying members of the TSDBF and TTPF.
the sub-delegation of Procurement Delegation.
business (GFB).
R102 to R3,2 billion.
Key challenges (nature of challenges, responses and continuing challenges):
business plans in respect of volumes and targets. A key strategic outcome has been the Company’s implementation of the Road-to-Rail Strategy to capture market share from road service providers.
continued to engage with the respective regulators on the tariff applications during the year to ensure certainty in the regulatory environment, and to manage any potential adverse impact from Records of Decisions.
Focus areas for 2015:
The two planned Board of Directors Strategic Workshops and ‘Deep Dive Session’ for the 2015 year will focus on the following, amongst others:
* Retired from the Board of Directors on 25 June 2013.

ANNUAL FINANCIAL STATEMENTS 2014148
Board of Directors Summary of Board of Directors mandate:
Audit Committee Summary of Committee mandate:
Chairperson:
Mr IB SkosanaMembers:
Mr MA FanucchiMs NP Mnxasana
The Audit Committee is constituted as a statutory committee of Transnet SOC Ltd in respect of its statutory duties in terms of Treasury Regulation 27.1, executed under section 76(4)(d) under the Public Finance Management Act. The purpose of the Committee is to:
assets and the evaluation of internal control frameworks within the Company.
and other control systems.
effectiveness.
Board of Directors, management and regulators.
requirements.
for fraud.
Summary of key activities and outputs (decisions, approvals, policies, procedures, new controls) for 2014:
The Committee considered, amongst others, the following during the year: Approved
Noted
Key challenges (nature of challenges, responses and continuing challenges):
implementation of the Integrated Assurance Model. A presentation will be made at the Audit Committee meeting scheduled for 19 May 2014.
1 August 2013.
smooth implementation of the functional role of the new Internal Auditor.
CORPORATE GOVERNANCE FOR THE YEAR ENDED 31 MARCH 2014(continued)

149
Board of Directors Summary of Board of Directors mandate:
Remuneration, Social and Ethics Committee
Summary of Committee mandate:
Chairperson:
Members:
Ms N MoolaMr M FanucchiMr HD Gazendam
The Remuneration, Social and Ethics Committee is constituted as a statutory Committee of Transnet SOC Ltd in respect of its statutory duties in terms of section 72(4) and Regulation 43 of the Companies Act, 2008, and as a Committee of the Board of Directors in respect of all other duties assigned to it by the Board of Directors. The purpose of the Committee is to:
ethical relationship between the Company and its stakeholders, both internally and externally. The Committee will manage the Company’s legal and moral obligations for its
Company’s conduct and activities.
standards in the Company’s social and ethics environment, with due regard to all relevant legislation, policies, legal requirements and codes of best practice.
recruitment, motivation and retention of high performance staff at all levels in support of
corporate performance.
approve the remuneration policies and practices recommended by them.
assessment of reward practices and governance processes to be made by stakeholders.
Directors.
– Restructuring of Transnet. – Disposal of assets/part of Transnet’s business. – Acquisition of assets/new business.– Human resources issues.
(other than executive directors) and Extended Executive Committee.
Summary of key activities and key outputs (decisions, approvals, policies and procedures) for 2014:
The Committee considered, amongst others the following during the year:Approved
Committee and Extended Executive Committee).
Group Executive Committee).

ANNUAL FINANCIAL STATEMENTS 2014150
Board of Directors Summary of Board of Directors mandate:
Noted
Key challenges (nature of challenges, responses and continuing challenges):
at the ‘Deep Dive Session’ and thoroughly considered by the Board of Directors for adequacy. The Board of Directors finally approved the Marketing Strategy in February 2014.
Corporate Governance and Nominations Committee
Summary of Committee mandate:
Chairperson:
Mr ME MkwanaziMembers:
Mr NK Choubey*Mr HD GazendamMs Y ForbesMr IM SharmaMs DLJ Tshepe
The Corporate Governance and Nominations Committee is constituted as a Committee of Transnet SOC Ltd in respect of all other duties assigned to it by the Board of Directors. The purpose of the Committee is to:
corporate governance policies and the Corporate Governance Framework.
for appointment to the Committees of the Board of Directors, other than the Audit Committee.
Minister.
approval by the Board of Directors and confirmation by the Shareholder Minister at the annual general meeting or through a written resolution.
executive directors and independent non-executive directors.
Board of Directors (in order of priority), by complying with the ‘Guidelines for the appointment of a Group Chief Executive for a State-owned Enterprise’.
* Retired from the Board of Directors on 25 June 2013.
CORPORATE GOVERNANCE FOR THE YEAR ENDED 31 MARCH 2014(continued)

151
Board of Directors Summary of Board of Directors mandate:
Chairperson:
Mr ME MkwanaziMembers:
Mr NK Choubey*Mr HD GazendamMs Y ForbesMr IM SharmaMs DLJ Tshepe
Summary of key activities and key outputs (decisions, approvals, policies and procedures) for 2014:
The Committee considered, amongst others the following during the year:Approved
financial year.
process.
Noted
Key challenges (nature of challenges, responses and continuing challenges):
Management issued an awareness communique reminding employees that non-adherence to Company policies and procedures would result in consequence management.
Board Risk Committee Summary of Committee mandate:
Chairperson:
Ms DLJ TshepeMembers:
Ms Y ForbesMr HD GazendamMs N MoolaMr IB Skosana
Risk management is, as set out in King III and the PFMA, ultimately the responsibility of the Board of Directors. The Board Risk Committee is constituted as a Committee of Transnet SOC Ltd in respect of all other duties assigned to it by the Board of Directors . The purpose of the Committee is to:
Risk Management Framework (ERM Framework) as approved by the Board of Directors from time to time.
Committee, the Board of Directors, management, and regulators on risk management.
and other operational losses.
impact, and confirm that appropriate action has or is being taken.
* Retired from the Board of Directors on 25 June 2013.

ANNUAL FINANCIAL STATEMENTS 2014152
Board of Directors Summary of Board of Directors mandate:
Summary of key activities and key outputs (decisions, approvals, policies and procedures) for 2014:
The Committee considered, amongst others the following during the year:Approved
Noted
Management System.
Key challenges (nature of challenges, responses and continuing challenges)
Company. Management is continuously engaging the Department of Environmental Affairs and other relevant stakeholders to manage the emerging risk posed by the definition of term ‘ownership’ in the Bill.
the Company of the proposed corporatisation of Pipelines. The resolution provided for an undertaking by management that Pipelines will be ringfenced and that separate accounting statements will be compiled.
Board Acquisitions and Disposals Committee
Summary of Committee mandate:
Chairperson:
Mr IM SharmaMembers:
Ms Y ForbesMr ME MkwanaziMs NP Mnxasana
Ms DLJ Tshepe
The Board Acquisitions and Disposals Committee is constituted as a Committee of Transnet SOC Ltd in respect of all other duties assigned to it by the Board of Directors. The purpose of the Committee is to:
of Directors.
of Directors.
Directors in line with the Delegation of Authority Framework.
CORPORATE GOVERNANCE FOR THE YEAR ENDED 31 MARCH 2014(continued)

153
Board of Directors Summary of Board of Directors mandate:
Chairperson:
Mr IM SharmaMembers:
Ms Y ForbesMr ME MkwanaziMs NP Mnxasana
Ms DLJ Tshepe
Summary of key activities and key outputs (decisions, approvals, policies, and procedures) for 2014:
The Committee considered, amongst others the following during the year:Approved
Saldanha (ETC R1,58 billion).
year.
Strategy (Rail).
Noted
Framework Act Exemption for the 1 064 locomotives transaction.
B-BBEE Codes.
Key challenges (nature of challenges, responses and continuing challenges):
cases prior to submission to the Board of Directors.
management engaged National Treasury for a special dispensation in relation to
Board of Directors and Committee meetings
The graph below indicates the number of meetings held during the period under review.
STATUS MEETINGS CON V ENED IN THE 2014 FINA NCIA L YEA R
Scheduled meeting.
Board of Directors
Audit Committee
Corporate Governance and
Nominations Committee
Remuneration, Social and
Ethics Committee
Board Risk Committee
Board Acquisitions
and Disposals Committee
Special meeting.
3 3
1
1
2
4 5 5
10
4 4

ANNUAL FINANCIAL STATEMENTS 2014154
Special meetings
Board of DirectorsThe special meetings were convened in the financial year to deliberate on the following:
Incorporation.
international fund raising activities, the meeting had to be brought forward by a week to 23 October 2013.
electric locomotives and 60 Class 43 diesel locomotives, and the acquisition of the 1 064 locomotives.
Corporate Governance and Nominations CommitteeThe special meetings were convened in the financial year to deliberate on the following:
annual general meeting.
Shareholder’s Compact targets for the 2015 financial year, Group Chief Executive’s succession plans, matters arising list of the annual general meeting held on 25 June 2013 and the Board of Directors training programme for 2014.
2014 financial year and to finalise management’s response to the KPMG/Nkonki report on tender irregularities.
Remuneration, Social and Ethics CommitteeThe special meetings were convened in the financial year to deliberate on the following:
management (including the Executive Committee and Extended Executive Committee), flowing from the annual general meeting deliberations.
which required management’s attendance, the meeting had to be brought to 24 January 2014.
Board Risk Committee meetingThe special meeting was convened in the financial year to deliberate on the following:
Board Acquisitions and Disposals Committee meetingThe special meetings were convened in the financial year to deliberate on the following:
freight business and the network and telecommunications contract.
CORPORATE GOVERNANCE FOR THE YEAR ENDED 31 MARCH 2014(continued)

155
Schedule of directors’ attendance to Board of Directors and Committee meetings (inclusive of special meetings).
Board of Directors/Committee
Board of Directors
Audit Committee
Corporate Governance
and Nominations
Committee
Remuneration, Social and
Ethics Committee
Board Risk Committee
Board Acquisitions
and Disposals Committee
No of Meetings held 7 5 7 5 6 12
Mr ME Mkwanazi (Chairperson) 7 7 11Mr B Molefe 7Mr NK Choubey* 1 1Mr MA Fanucchi 7 4 4Ms Y Forbes 7 7 6 12Mr HD Gazendam1 6 4 4 6Ms N Moola 6 5 6Ms NP Mnxasana2 5 3 9
6 5 5 10Mr IM Sharma 6 5 12Mr A Singh 6Mr IB Skosana 7 4 5
6 5 5Ms DLJ Tshepe 6 7 6 11
* Retired from the Board of Directors on 25 June 2013.1. Appointed to the Committee on 29 August 2013.2. Appointed to the Committee on 25 April 2013.
Group Executive Committee meetings
STATUS OF ATTENDA NCE OF GROUP EXECUTIV E MEETINGS IN 2014 FINA NCIA L YEA R
Attendance.
Apr 13
13
2
4
0 0
45
32 2
3
1 1
131414
15 15 15 15
111112
11
May 13 Jun 13 Jul 13 Aug 13 Sep 13 Oct 13 Nov 13 Dec 13 Jan 14 Feb 14 Mar 14
Apology.

ANNUAL FINANCIAL STATEMENTS 2014156
Schedule of attendance at Group Executive Committee meetings from 1 April 2013 to 31 March 2014.
Executive 12
Mr B Molefe (Chairperson) 11
Mr SI Gama 10
Mr M Gregg-Macdonald 11
Ms R Lepule 10
Ms NJ Mabandla 11
Ms DC Moephuli 11
Mr CA Möller 12
Mr T Morwe 9
Mr KC Phihlela 9
Ms S Pillay 12
Mr A Singh 12
Ms EAN Sishi 9
Mr KBX Socikwa 10
Ms MA Sukati* 9
Mr R Vallihu 9
Mr R Wolfenden** 4
Ms Matooane*** 4
Notes* Ernst & Young was retired as the Company’s internal auditors with effect from 1 August 2013 (Mr Wolfenden attended the meeting of
26 July 2013 to hand over to Ms Sukati).** Retired from the Executive Committee on 1 August 2013.*** Appointed to the Executive Committee on 1 October 2013.
Assurance and effectiveness of governance structuresInternal Audit corporate governance review
Transnet Internal Audit performed an audit on the Company’s corporate governance structures during the year. The execution of the Board of Directors mandates was comprehensively examined against the minute books. The audit was rated as ‘satisfactory’.
The audit results indicated that the processes and controls pertaining to the administration of governance activities were consistently applied by the Board of Directors. In addition, sufficient reliance can be placed on the operation of internal controls to mitigate and manage risk exposures in the governance processes.
Compliance including PFMA, Companies Act and King III
The Company recognises its accountability to all its stakeholders under the regulatory requirements applicable to its business and is committed to high standards of integrity in the conduct of its business. In view of the importance of complying with the ever-increasing universe of regulatory requirements, and the increased national and international emphasis placed on the supervision thereof, the Board of Directors, Group Executive Management and employees are regularly apprised of the compliance requirements. Further, internal controls are constantly being developed and tested to ensure compliance and continuous training is implemented.
PFMAFor more information relating to PFMA, refer to pages 18 and 19.
CORPORATE GOVERNANCE FOR THE YEAR ENDED 31 MARCH 2014(continued)

157
Companies ActGroup Compliance performed an audit of the status of the Company’s implementation of the provisions of the Companies Act. The audit highlighted the following, amongst others:
Financial assistance to directors and prescribed officers: There was no policy on the granting of financial assistance to directors and prescribed officers. The lack of identification of prescribed officers precludes the Company from applying the mandatory requirements associated with granting of financial services. Directors’ personal interests and disclosure requirements: The current policy has to be amended to refer to ‘persons separated by two degrees of natural or adopted consanguinity or affinity’. Minimum standards of directors’ conduct – Company Secretariat: The applicability of the Code of Ethics should be extended to apply to the independent non-executive directors.
To address the identified shortcomings, the Group Company Secretariat conducted the following activities:1. Defined Prescribed Officers in the Memorandum of Incorporation.2. Revised the Declaration of Interests and Related-party disclosure Policy to align to the provisions of the
Company’s Act.3. Extended the applicability of the Code of Ethics to apply to independent non-executive directors.
King III compliance – governance assessment instrumentThe Company utilised the Institute of Directors South Africa Governance Assessment Instrument (GAI) as the due process to provide assurance that every recommended practice in King III has been considered. Practices are either applied or not applied, with the latter carrying an explanation of a compensating practice, or alternatively the reason for non-application and corrective action to be taken.
Practices that support the ‘75 Principles’ of King III are assessed through the GAI, which confirms the extent to which the Principles are applied by way of a rating as follows:

ANNUAL FINANCIAL STATEMENTS 2014158
Assurance of the accuracy and validity of these results is provided through the review performed by the Group Executive Committee, the Corporate Governance and Nominations Committee and the Board of Directors. The King III chapter summary follows below.
King III governance register at: 11 April 2014AAA Highest application AA High application BB Moderation application C Application to be improved L Low application
Transnet SOC Ltd – 1990/000900/30IoDSA GAI
scoreApplied/partially
applied/not applied
+Chapter 1: Ethical leadership and corporate citizenship AAA Applied
+Chapter 2: Boards and directors AAA Applied
+Chapter 3: Audit committees AAA Applied
+Chapter 4: The governance of risk AAA Applied
+Chapter 5: The governance of information technology AAA Applied
+Chapter 6: Compliance with laws, rules, codes and standards AAA Applied
+Chapter 7: Internal audit AAA Applied
+Chapter 8: Governing stakeholder relationships AAA Applied
+Chapter 9: Integrated reporting and disclosure AAA Applied
Overall score AAA Powered by IoDSA GAI
Disclaimer:The assessment criteria of the IoDSA web-based tool, the governance assessment instrument (GAI) have been based on the practice recommendations of the King III report. These criteria are intended to assess quantitative aspects of corporate governance only and not qualitative governance. As such, the results are proposed to serve as an indication of the structures, systems and processes in place and are not intended to include an indication of the governance culture of an entity.
The responsibility for the input of data in order to attain a result through the use of this is that of the user and the entity in respect of which the user licence has been granted (licencee). The results based on the use of the GAI may be based on the subjective opinion of the licencee or the representative user(s) and may not be true reflection of the actual state of the governance structures, systems and processes at the entity.
The IoDSA makes no warranty or representation as to the accuracy or completeness of either the assessment criteria or the results. Neither the IoDSA nor any of its affiliates nor the software developer shall be held responsible for any direct, indirect, special, consequential or other damage of any kind suffered or incurred, as a result of reliance on the results produced through the use of the GAI.
For the detailed King III Governance Register, please visit Transnet’s website by following this link: http://www.iodsa-gai.co.za/Reports/Public/ApplicationRegisterPractice.aspx?L=e456f2ed-5c6e-43b3-aea6-e44417af01f0.
CORPORATE GOVERNANCE FOR THE YEAR ENDED 31 MARCH 2014(continued)

159
Independent performance evaluation of the Board of Directors, its Committees and individual directors
An annual independent Board of Directors evaluation is conducted to assess the effectiveness of the Board of Directors and the individual contributions of the directors. The process is managed by independent service providers. Three evaluation processes were performed during the 2014 financial year. The first evaluation sought to measure the performance of individual directors based on their general contribution and their involvement and participation in meetings, while the second aimed to review the overall functioning and performance of the Board of Directors as a unit. The third evaluation measured the effectiveness of the various Committees. The findings of these evaluations were considered by the Board of Directors in May 2014 and were compared to the previous year’s assessment, with appropriate action plans being formulated.
The KPMG/Nkonki team indicated that the overall 2014 performance was perceived to be generally acceptable in all categories. Interviews were conducted with Company representatives, and respondents were encouraged to provide further information regarding their responses and comments to the questionnaires. There was overall satisfaction in terms of the Board of Directors dynamics. There was notable improvement in all areas.
The following areas were identified for future improvement:
throughout the Company.
non-executive directors.
throughout the Company.

ANNUAL FINANCIAL STATEMENTS 2014160
ABBREVIATIONS
AND ACRONYMS
$/R
ACSA Airports Company of South Africa
AFD Agence Française de Developpement – French Development Bank
AfDB African Development Bank
HIV/Aids Acquired immune deficiency syndrome
AUS Australian Dollar
bp basis point
CGT capital gains taxation
Copex capitalised operating expenditure
DCT Durban Container Terminal
DEA Department of Environmental Affairs
DIFR
DMTN Domestic Medium-Term Note
DOT Department of Transport
DPE Department of Public Enterprises
EBIT earnings before interest and taxation
EBITDA earnings before interest, taxation, depreciation and amortisation
ECA Export Credit Agency
EIMS Enterprise Information Management Services
Finco Group Finance Committee
GBP Pound Sterling
GCH gross crane moves per hour
GMTN Global Medium-Term Note
HR human resources
IAS International Accounting Standards
IASB International Accounting Standards Board
ICM Act Integrated Coastal Management Act, No 24 of 2008
IFRIC International Financial Reporting Interpretations Committee
IFRS International Financial Reporting Standards
JBIC Japan Bank for International Cooperation
JPY Japanese Yen
King III King III Report on Governance for South Africa – 2009
LTI long-term incentive scheme
MDS Market Demand Strategy
ml/km million litres per kilometre
mt million tons
NERSA National Energy Regulator of South Africa
NGP New Growth Path
Ports Act National Ports Act, No 12 of 2005
Prasa Passenger Rail Agency of South Africa
PSP Private Sector Participation
RFD Reasons for decision
ROTA return on total average assets
SADC Southern African Development Community
SATS South African Transport Services
SOC State-owned Company
STAT ship turnaround time
STI short-term incentive scheme
STS ship-to-shore
TEU twenty-foot equivalent unit
TSDBF Transnet Second Defined Benefit Fund
TTPF Transport Pension Fund: Transnet Sub-Fund
USA United States of America
USD US Dollar
WACC weighted average cost of capital
WACD weighted average cost of debt
ZAR South African Rand

161
GLOSSARY
OF TERMS
Asset turnover (times)Revenue divided by total assets (total assets excluding capital work-in-progress).
Average total assetsTotal assets, where ‘average’ is equal to the total assets at the beginning of the reporting period plus total assets at the end of the reporting period, divided by two.
Cash interest cover (times)Cash generated from operations after working capital changes, divided by net finance costs (net finance costs includes finance costs, finance income and capitalised borrowing costs from the cash flow statement).
DebtInterest-bearing borrowings (short- and long-term), post-retirement benefit obligations, derivative financial liabilities plus overdraft, less short-term investments and net cash and cash equivalents.
EBITDAProfit/(loss) from operations before depreciation, amortisation, profit on sale of interest in businesses, impairment of assets, dividend received, post-retirement benefit obligation income/(costs), fair
net finance costs.
EBITDA margin Profit/(loss) from operations before depreciation, amortisation, profit on sale of interest in businesses, impairment of assets, dividend received, post-retirement benefit obligation income/(costs), fair
and net finance costs expressed as a percentage of revenue.
EquityIssued capital, reserves and minority interests.
Debt (for gearing calculation)Long-term borrowings, short-term borrowings, employee benefits, derivative financial liabilities plus overdraft less other short-term investments, less derivative financial assets and less cash and cash equivalents.
GearingDebt expressed as a % of the sum of debt and Shareholder’s equity.
Headline earningsAs defined in Circular 3/2009, issued by the South African Institute of Chartered Accountants, separates from earnings all items of a capital nature. It is not necessarily a measure of sustainable earnings.
Operating profitProfit or loss from operations after depreciation and amortisation but before profit on sale of interest in businesses, impairment of assets, dividends received, post-retirement benefit obligation income/(costs),
and net finance costs.
Operating profit marginOperating profit expressed as a percentage of revenue.
Profit/(loss)Profit or loss after taxation and minority interests.
Return on average total assets Operating profit expressed as a percentage of average total assets (average total assets exclude capital work-in-progress).
Return on net assetsProfit before taxation expressed as a percentage of net assets.
Shareholder value addEBITA less the cost of capital. Cost of capital is the average total assets, excluding capital work-in-progress, multiplied by the weighted average cost of capital.
Total assetsNon-current and current assets.
Total debtNon-current and current liabilities.
Total debt-to-equity ratioTotal debt expressed as a ratio to equity.

ANNUAL FINANCIAL STATEMENTS 2014162
CORPORATE
INFORMATION
Executive directorsB Molefe (Group Chief Executive), A Singh (Group Chief Financial Officer).
Independent non-executive directors
ME Mkwanazi (Chairperson), MA Fanucchi, Y Forbes,
NK Choubey retired from the Board on 25 June 2013.
Group Company SecretaryMs ANC Ceba
47th Floor, Carlton Centre 150 Commissioner StreetJohannesburg, 2001.PO Box 72501Parkview, 2122South Africa.
Transnet SOC Ltd47th Floor, Carlton Centre150 Commissioner StreetJohannesburg2001
Incorporated in the Republic of South Africa.Registration number 1990/000900/30.
AuditorsSizweNtsalubaGobodo Inc. 20 Morris Street East Woodmead Johannesburg, 2191.
With effect from 1 August 2013, the Company’s internal audit function has been outsourced to SekelaXabiso (Pty) Ltd, Nkonki Inc. and KPMG Services (Pty) Ltd.
SekelaXabiso (Pty) Ltd has its business address at:1st Floor Building 22BThe Woodlands Office Park20 Woodlands DriveWoodmeadJohannesburg
Nkonki Inc. has its business address at: 3 Simba RoadSunninghillJohannesburg
KPMG Services (Pty) Ltd has its business address at:85 Empire RoadParktownJohannesburg

163
NOTES

ANNUAL FINANCIAL STATEMENTS 2014164
NOTES

165
9 1 9

i
20
SUSTAINABILITY REPORT
2014

Transnet’s reporting for 2014 consists of three reports
Volume 1
Volume 2
Volume 3
20 2014INTEGRATED REPORT
20
SUSTAINABILITY REPORT
2014
The Integrated Report 2014 is the Company’s primary report to all stakeholders.
The Annual Financial Statements 2014 including reports of the independent auditor’s, directors and the corporate governance report.
The Sustainability Report 2014 documents Transnet’s economic, social and environmental dividends.
20 2014ANNUAL FINANCIAL STATEMENTS
Throughout the reports, readers are referred to places where they can find more detail on particular topics, using these pointers:
Refers to Volume 1 for further information
Refers to Volume 2 for further information
Refers to Volume 3 for further information
TRANSNET’S APPLICATION OF THE UNGC PRINCIPLES IS FLAGGED IN THE SR 2014 BY THE UNGC ICON.
ENVIRONMENTAL DIVIDENDS
SOCIAL DIVIDENDS
ECONOMIC DIVIDENDS
FINANCIAL SUSTAINABILITY
HUMAN CAPITAL
VOLUME GROWTH
CAPITAL INVESTMENT
PRODUCTIVITY AND EFFICIENCY
Commentary on the Market Demand Strategy focus areas and sustainability outcomes are indicated by these icons:
CONTENTS
Forward-looking informationAll references to forward-looking information and targets in
the 2014 reports are extracted from the 2014/15 Transnet
Corporate Plan approved by the Board of Directors.
Transnet’s Integrated Report 2014, Annual Financial Statements 2014 and Sustainability Report 2014 are available in PDF on www.transnet.net and via this QR code on mobile devices.
Follow us on:
Sustainability at Transnet Our sustainability context 1Board statement and approval 2Executive statement 3
About the Sustainability Report Reporting philosophy and approach 4Reporting frameworks 4Suite and interaction between reports 4
About Transnet Who we are 5Where we operate and what we do 5Our support processes 8Our supply chain 8Our business model 10Conditions under which we operate 16Governance and assurance 17Ethics and integrity 18
Material Issues Material issues determination process 19Material issues as disclosed in the Integrated Report 2014 27
Sustainability Performance Review Economic dividends 30Social dividends 54Environmental dividends 65
Appendix AExternal Assurance Statement 75
Appendix BUnited Nations Global Compact table 78
Appendix CGlobal Reporting Initiative table 81
Appendix DCorrelation between the Transnet Sustainability Framework and the Material Issues 89
Appendix ETransnet Sustainability Framework Material Aspects’ Boundaries 90
Abbreviations and Acronyms 91
Corporate Information IBC

1
Our sustainability contextTransnet SOC Ltd (Transnet or the Company) is a State-owned Company (SOC) which has a strong developmental mandate to support economic growth and job creation in South Africa. We have a Sustainability Framework that defines our long-term developmental focus into economic, social and environmental dividends. Our performance report back for the year under review is structured in terms of these dividends, and for ease of navigation, we show where readers can obtain the relevant information in the Sustainability Report 2014 (SR 2014).
Transnet’s sustainability maturity process reflects the wider business context in which we operate and the dividends are evaluated to respond to changes in this context. We are alert to the global systemic and inter-connected risks that arise from rapid economic, environmental, geopolitical, societal and technological shifts taking place around the world. Unprecedented access to data on such trends is encouraging integrated thinking about the role that large companies play in shaping a sustainable future.
Since adopting our Sustainability Framework in Transnet, we are systematically instituting policies, measurement methods, process controls, data systems, targets, reporting and assurance throughout the Company to embed sustainability into infrastructure planning, project management, operations, supply chain management and risk management. We will update our Sustainability Framework as this work matures.
Transnet is an active participant in a number of industry initiatives that advance sustainability leadership in South African business practice. Transnet is a signatory of the United Nations Global Compact (UNGC) and is represented on the UNGC’s Local Network Advisory Committee. Transnet is a member of the National Business Initiative; the Integrated Reporting Committee; the Energy Intensive Users Group; the Energy Efficiency Leadership Network (EELN); the Industry Task Team on Climate Change; the Network for Business Sustainability-SA; and the National Biodiversity and Business Network. Transnet sponsors the Transnet Programme in Sustainable Development at the Gordon Institute of Business Science, and is a sponsor to the local programme of the Cambridge Institute for Sustainability Leadership.
Transnet Sustainability Framework
ECONOMIC
DIVIDENDS
Cost-effective freight logistics infrastructure ahead of demand. (page 31)
Reliable and efficient rail, port and pipeline services. (page 34)
Skilled human resources aligned to infrastructure and services. (page 45)
Local supplier industry development. (page 49)
Job creation. (page 45)
Rural development. (page 63)
Regional integration. (page 5)A financially stable business, able to raise and service debt, reinvest revenues and pursue agreements with private parties to optimise investment and services. (page 31)
SOCIAL
DIVIDENDS
Good governance, accountability and transparency. (page 17)
Zero tolerance of fraud and corruption. (page 18)
A representative workforce. (page 55)
Safety. (page 59)
Staff wellness. (page 62)
Broad-based black economic empowerment. (page 55)
Corporate social investment. (page 63)
Community benefits. (page 63)
Proactive stakeholder engagement. (page 21)
Modal shift from road-to-rail, lowering South Africa’s carbon emissions. (page 71)
Energy efficiency. (page 67)
Climate change mitigation. (page 67)
Climate change adaptation. (page 72)
Water use efficiency. (page 72)
Waste management optimisation. (page 73)
Biodiversity enhancement. (page 74)
EN VIRONMENTAL
DIVIDENDS
Refer to Appendix B for UNGC table
SUSTAINABILITY
AT TR ANSNET

SUSTAINABILITY REPORT 20142
The Remuneration, Social and Ethics Committee (REMSEC) reviewed the SR 2014 and the external assurance statement as a reflection of Transnet’s sustainability performance and initiatives, and the Board has duly approved this report for publication.
As the Board Committee charged with, amongst other matters, oversight of the Company’s moral obligations for its economic, social and natural environment, REMSEC is satisfied that Transnet is making progress in embedding sustainability into business practice. We continue to uphold the UNGC’s 10 universal principles on human rights, labour, the environment and anti-corruption.
Sustainability is a maturing process in the Company and over the last three years of reporting, the emphasis has shifted from environmental compliance to sustainability at the core of our business strategy. For this we are proud and we remain committed to promoting sustainable growth through long-term economic, social and environmental value creation.
Looking ahead, our strategic focus areas for 2014/15 include:
across Transnet through policies, measurement methodologies, target-setting, process controls, data systems intelligence, reporting and assurance.
environmental dividends (outcomes) for the Shareholder’s Compact from 2015/16.
value-drivers into long-term infrastructure planning, capital investment decisions, the supply chain and enterprise risk management.
sustainability initiatives, continuing the focus on energy management and innovation while increasing visibility on water management.
We trust that the past year’s sustainability performance reflected in the SR 2014 will further encourage our valued stakeholders to continue working with Transnet as we progress on our sustainability journey.
Nunu Njeke
Chairperson: Remuneration, Social and Ethics Committee
BOARD STATEMENT AND APPROVAL

3
As we look back on the second year of implementing our Market Demand Strategy (MDS), we are acutely aware of the profound responsibility we carry to be stewards of economic growth, social development and the natural environment. Notable sustainability achievements have been made by Transnet in the last year, particularly in long-term network capacity expansion, acquisitions of new locomotives and port equipment, procurement from local suppliers, skills development, safety and energy management.
Transnet’s mandate to its stakeholders runs deeper than sound financial and operational performance. We are required to build a stronger economy and a more equitable society while protecting our natural environment. The Company therefore holds itself accountable, not only to Government as Shareholder; but to lenders who help finance our business; to customers who depend on our services every day; and to society at large.
‘Promoting sustainable growth’ is one of the strategic focus areas of our Shareholder’s Compact with the Shareholder Minister represented by the Minister of Public Enterprises, and forms the cornerstone of the MDS. Our Sustainability Framework enables us to drive and monitor outcomes, which are our focus for long-term value creation. By integrating sustainability value drivers into our strategy, operations and performance measures, we are confident that Transnet will not only deliver long-term benefits for South Africa and the region, but will be more resilient as a company to global and local risks.
I am proud to report that since 2011, Transnet has made progress in embedding sustainability into core business. We included ‘sustainability in all we do’ in the Company’s vision statement; incorporated Social and Ethics oversight functions
into the Board’s mandate; adopted a Sustainability Framework; established a Company-wide Sustainability Forum; assigned sustainability responsibilities to a Group Executive member and to General Managers across the business; set up a research and development team; drove new Company-wide initiatives in energy and carbon management, social impact measurement, and stakeholder engagement; signed up to the UNGC; and adopted Integrated Reporting (IR), Global Reporting Initiative (GRI), AccountAbility (AA) 1000 and Carbon Disclosure Project (CDP) reporting standards.
Transnet’s SR 2014 provides our stakeholders with information on the material sustainability initiatives that are underway in Transnet and reflects our sustainability performance of the past year. We also highlight our sustainability commitments ahead. Importantly, the SR 2014 includes assurance by external assurance providers on key sustainability indicators.
Transnet continues to embed sustainability into the culture and day-to-day decision-making of all aspects of business practice. This is being pursued throughout our Corporate Centre functions, Operating Divisions and Specialist Units.
I am grateful to the Board of Directors, under the Chairpersonship of Mafika Mkwanazi, for the steadfast sustainability leadership which is provided to the Group Executive Committee. As a SOC, explicitly committed to the developmental needs of South Africa, we continue to drive execution of the MDS in a way that builds lasting economic, social and environmental value.
Brian MolefeGroup Chief Executive
EXECUTIVE STATEMENT

SUSTAINABILITY REPORT 20144
Reporting philosophy and approach The SR 2014 provides our stakeholders with a view of Transnet’s sustainability performance for the financial year 1 April 2013 to 31 March 2014. The SR 2014 describes how we deliver sustainable outcomes through our five Operating Divisions: Transnet Freight Rail (Freight Rail), Transnet Engineering (Engineering), Transnet National Ports Authority (National Ports Authority), Transnet Port Terminals (Port Terminals) and Transnet Pipelines (Pipelines); as well as in the Transnet Corporate Centre and three Specialist Units: Transnet Foundation, Transnet Capital Projects and Transnet Property.
The SR 2014 builds on Transnet’s report of 31 March 2013. There have been no significant changes in scope or aspect boundaries during the reporting period. Where any restatements or changes in measurement methods have taken place, these are described in the relevant report section.
The boundary of this report is largely the Transnet legal entity. There are instances where reporting extends to other entities or groups of entities outside of Transnet. This is disclosed for the relevant material aspects in the report. For more detail refer to the aspect boundary matrix at Appendix E.
As part of our maturing sustainability pathway, Transnet has engaged an external sustainability assurance provider to provide assurance on specific indicators (read more at Appendix A).
Reporting frameworksTo date, Transnet’s sustainability reporting has been informed by the GRI G3 guidelines. GRI G4 was published in May 2013. This year, Transnet has decided to apply the new GRI G4 guidelines for Core reporting as far as possible in order to begin to align our future reporting standards to global best practice. The SR 2014 contains Standard Disclosures from the GRI G4 Sustainability Reporting Guidelines (refer Appendix C for a list of standard disclosures and their location in the report).
Our sustainability reporting is also responsive to a number of other globally accepted frameworks, including the UNGC (read more at Appendix A) to which we have been a signatory for the last two years; the CDP which informs our reporting on carbon emissions; and the AA 1000 Stakeholder Engagement Standard.
Suite and interaction between reportsTransnet undertakes its annual reporting across three reports: the Integrated Report (IR 2014), the Annual Financial Statements (AFS 2014) and the SR 2014.
The SR 2014 and the IR 2014 were prepared using the GRI G4 and International Integrated Reporting Council’s (IIRC’s) Integrated Reporting Framework v1.0 respectively. Both reporting standards use the principle of ‘materiality’ to inform report content. We note that GRI G4 and the Integrated Reporting Framework are not fully aligned with regard to materiality. Developments in reporting standards will be monitored to enhance our reporting over time.
The SR 2014 complements the IR 2014 by providing more detail disclosures on Transnet’s sustainability performance. Certain topics, such as the approach and outcomes from stakeholder engagement, are disclosed in more detail in the SR 2014. Throughout the suite of reports, we provide reference to where further detail can be obtained.
The SR 2014, including the GRI Content Index, is available on Transnet’s website as a downloadable document on www.transnet.net
Transnet welcomes feedback on the SR 2014 to ensure that we continue to disclose information that is pertinent. For queries or suggestions contact the General Manager: Public Policy and Sustainability: [email protected].
ABOUT THE
SUSTAINABILITY R EPORT

5
Who we are Transnet is a SOC of the Government of the Republic of South Africa and the custodian of the country’s freight railway, ports and pipelines. Transnet’s primary business is freight logistics services.
In line with Government’s New Growth Path (NGP) and the National Development Plan (NDP), SOCs are required to contribute to economic growth through the provision of world-class infrastructure and technologies; expansion of economic infrastructure; job creation and skills development; as well as industrial capacity building through a strategic approach to procurement and operations.
Transnet has a responsibility to unlock economic, social and environmental value through executing its mandate whilst building a commercially viable business enterprise.
Transnet’s mandate, vision and mission reflect the Minister of Public Enterprises’ objectives:
Mandate
To assist in lowering the cost of doing business in South Africa, enabling economic growth and ensuring security
of supply through providing appropriate port, rail and pipeline infrastructure in a cost-effective and efficient manner, within acceptable benchmarks.
Vision
To meet customer demand for reliable freight transport and handling through:
of its unique set of assets;
sustainability in all we do.
Mission
To enable the competitiveness, growth and development of the South African economy by delivering reliable freight transport and handling services that satisfy customer demand.
Where we operate and what we doTransnet has a coordinating Corporate Centre located in Johannesburg, South Africa and five Operating Divisions with operations spread across the Republic of South Africa. In future, Transnet plans to expand operations further into the African continent. Currently, Transnet has four satellite offices in the region.
Geographic location of the Transnet Corporate Centre and Operating Divisions
CA PE TOW N
SA LDA NH A
M A PU TO
R ICH A R DS BAY
SISHEN
DUR BA N
NGQUR A
PORT ELIZ A BETH
EAST LONDON
MOSSEL BAY
BEITBR IDGE
NORTH WEST
NORTHERN CAPE
EASTERN CAPE
WESTERN CAPE
LIMPOPO
MPUMALANGA
KWAZULU-NATALFREE STATE
GAUTENG
Rail
Transnet Corporate Centre (Johannesburg)
Ports and TerminalsPipelines
Engineering (Koedoespoort, Germiston, Bloemfontein, Durban, Uitenhage, Salt River)
ABOUT
TR ANSNET

SUSTAINABILITY REPORT 20146
Freight Rail, the largest of the five Operating Divisions, operates 20 500km of rail network across South Africa which transports bulk, break-bulk and containerised freight. The Freight Rail network and rail services provide strategic links between mines, production hubs, distribution centres and ports; and connects with the cross-border railways of the region. Shifting rail-friendly freight off roads and onto rail reduces logistics costs, impacts positively on the road network and has many indirect benefits for the country including a reduction in transport sector carbon emissions.
Engineering provides maintenance and refurbishment services of rolling stock and specialised equipment to Freight Rail, National Ports Authority, Port Terminals and Pipelines and is integral to Transnet achieving optimal use of equipment in conducting its core business.
South African ports owned by the National Ports Authority facilitate 98% of South Africa’s global trade and service the shipping feeder network connecting the west and east coasts of Africa. Approximately 31% of South Africa’s Gross Domestic Product (GDP) is derived from exports and around 33% of GDP is derived from imports1.
Port Terminals operates all of South Africa’s container and automotive port terminals and some bulk and break-bulk terminals.
Pipelines transports fuel from coastal refineries and crude oil imports to the inland market. Transnet has installed a New Multi-Product Pipeline (NMPP) enabling an increase in volume throughput to meet forecast market demand.
ABOUT
TR ANSNET (continued)
1 South African Reserve Bank national income and production accounts of South Africa: Summary of GDP, expenditure and national disposable income, Quarterly Bulletin, March 2014.

7
Total headcount
54 671Total revenue
R56,6BN
Total rail volumes
210,4MT
Total container volumes
4,6M TEUs
Total petroleum volumes
16,6BL
REV ENUE PER COMMODIT Y (R BILLION)
General freight – 19 619
Export coal – 8 909
Bulk – 4 171
Export iron ore – 4 961
Piped products – 2 862
Break-bulk – 1 141
Maritime containers – 7 924
Other – 7 019
HEA DCOUNT (EMPLOYEES) R AIL VOLUMES (MT)
Freight Rail – 29 225
Engineering – 12 428
Port Terminals – 6 624
National Ports Authority – 3 823
Pipelines – 621
Capital Projects – 720
Property – 555
Group services – 675
General Freight Business – 87,9
Export Coal – 68,2
Export Iron Ore – 54,3
2 General freight includes: containerised cargo, local manganese, minerals, local coal, local iron ore, chrome and ferrochrome, agricultural products, iron and steel, fertilisers, cement, fast-moving consumer goods, bulk liquids, wood and wood products, industrial chemicals, intermediate products and automotive products.
3 Petroleum products includes: crude oil, refined petroleum products, aviation turbine fuel and methane-rich gas products.
Transnet employs a total of 54 671 employees.
Transnet’s customers are principally large mining, shipping, manufacturing, agricultural, industrial, retail and energy contributors to the South African economy.
Transnet’s services are both outbound (South African businesses moving products to markets) and inbound (bringing products to South African markets). The commodities transported in the most significant volumes are: mining exports, General freight2 and petroleum products3. The sectors that Transnet provides services to include:• Mining;• Ironandsteel;• Cement;• Agriculture;
• Automotive;• Industrialandagri-chemicals;• Woodandwoodproducts;• Petrochemicals;• Shipping;• Retail;and• Intermediaries.
ThewayinwhichTransnetsourcesandutilises assets, people and skills, finances and natural resources, carries significant responsibility. This is because the quality and sustainability of Transnet’s infrastructure and services impacts the short-,medium-andlong-termprospectsof thousands of companies, tens of thousands of employees, investors, all spheres of Government, and communities across the country.

SUSTAINABILITY REPORT 20148
Our support processesTransnet’s core business of freight logistics services (performed by the Freight Rail, National Ports Authority, Port Terminals and Pipelines Operating Divisions) is underpinned by the support process provided by Engineering, Transnet Corporate Centre and the Specialist Units. These support processes respond to risks and opportunities and focus on achieving the Company’s targeted outcomes. (Refer to Transnet’s business model on page 10).
Engineering provides a pivotal support process in maintenance, repair, upgrade and manufacturing services; the greatest focus being support to Freight Rail, but support is also provided to the other Operating Divisions. Engineering also houses the Company’s Research and Development (R&D) unit to capture opportunities for technology innovation.
Transnet’s Corporate Centre provides the following support processes:
control;
private sector participation;
Transnet’s Specialist Units are tasked with the following supporting roles:
large infrastructure capacity expansion projects on behalf of, and with input from, the Operating Divisions.
non-core property portfolio comprising commercial and residential properties (approximately 13% of the total Transnet property portfolio).
Company’s corporate social investment projects.
Our supply chainTransnet’s supply chain has an extensive reach into the manufacturing and services sectors of South Africa and draws on international sources where required. Our service to customers is linked to the quality of these suppliers and their products, and our product choices in turn affect the environment in which we operate. Furthermore, we recognise the important role that Transnet’s purchasing power plays in the local economy.
In line with the material issues identified for our 2014 sustainability performance review, we highlight here two key features of our supply chain: Procurement practice and Energy suppliers.
Procurement practice
To effect our strategic objectives and achieve wider economic, social and environmental value, Transnet recognises that procurement practice must go beyond sourcing inventory and logistics. It must be supported by an outcomes strategy, with internal policy and governance measures to drive success. To this end, Transnet’s Supplier Development Plan (SDP) 2012 – 2015 is being executed. As procurement systems have matured, increasing focus has been placed on holistic and integrated Supply Chain Management (iSCM), with our sphere of influence extending through the upstream supply chain to Enterprise Development (ED). Our Enterprise and Supplier Development is thus increasingly supporting small, medium and micro-enterprises (SMMEs) with a focus on education and awareness, innovation and technology advancement, the roll-out of
and entrepreneurship.
The adoption of the Platinum Standard in the Supply Chain model aims to transform Transnet’s procurement to an end-to-end management function, encompassing demand management, sourcing, supplier development, inventory, logistics, contract development and management as well as disposal. Transnet also recognises that
ABOUT
TR ANSNET (continued)

9
its procurement strategy is integral to the growth of a green economy in South Africa, in which the adoption and development of efficient and resilient technologies, along with increasing use of rail for freight transport, will lower business costs and stimulate economic activity.
Transnet’s manufactured capital inputs, specifically infrastructure and equipment requirements, are large-scale and technologically and intellectually intensive. Our approach to sourcing in this context is to pursue suppliers both locally and globally, complementary to our in-house manufacturing capabilities.
Guided by the SDP and managed through rigorous procurement procedures, we enter into contracts with Original Equipment Manufacturers (OEMs) with specific targets for local skills development, local job creation, local content purchasing and localisation of assembly and fabrication. These are achieved in collaboration between the OEMs and Engineering, whose factories and depots are strategically located across South Africa to service the critical freight rail and ports sites.
Transnet’s objective is to increase South African industrialisation and entrepreneurship through localisation, technology transfer, skills development, job creation and local supplier development. As we implement our SDP, procurement lead-times are improving and market interaction is benefiting. In time, Transnet aims to become an OEM.
Energy suppliers
Energy is a strategic risk to our business in respect of supply, pricing and carbon emissions. Our railway, ports and pipelines operations are particularly vulnerable to business interruption caused by power outages, rising energy costs and uncertainty about electricity supply to meet demand. We are also mindful of the environmental costs of greenhouse gas
In South Africa, the SOC Eskom is the primary supplier of electricity. Eskom is however, operating under severely constrained generating capacity while new plants are being built. It generates approximately 82% of its supply at emissions-intensive coal-fired power stations and relies on diesel turbines for power-generation back-up. Regulated electricity prices have risen approximately 60,9% over the last three years, and Government is set to introduce carbon pricing in the form of a carbon tax from 2016, which will further raise energy prices. Although Transnet consumes approximately 1,3% of Eskom’s total annual electricity sales, Transnet is one of Eskom’s top 20 largest single electricity users. At the same time, Eskom is a key Transnet customer, receiving some of its coal deliveries to power stations by rail.
Diesel is a critical input to Transnet operations, due to the use of diesel locomotives in the fleet and, to a lesser extent, diesel fuelled mobile and stationary handling equipment in the ports and other operational sites. Transnet is sensitive to volatile diesel prices, the associated foreign exchange risk and carbon pricing, but fuel supply is not currently identified as a critical constraint. To ensure sufficient fuel supplies to the approximately 53 traction diesel fuel depots across the rail networks, diesel is managed as a critical input and contracts are in place to ensure supply.
In 2013, Transnet adopted an Energy Security and Carbon Mitigation strategy to address its energy risks over the short, medium and long term. This is further elaborated on under ‘Sustainability Performance Review: Energy’ (read more about this on page 67).

SUSTAINABILITY REPORT 201410 11 12
ABOUT TR ANSNET (continued)
coal iron ore manganese chrom
e ferrochrome steel cement agricultural products fertilisers forestry products chemicals aggregate automotives fast-moving consumer goods containerised cargo
c
rude
oil
ref
ined
pet
role
um p
rodu
cts
avi
atio
n tu
rbin
e fu
el
met
hane
-ric
h ga
s
HOW TRANSNET CREATES VALUE
ECONOMIC DIVIDENDS
SOCIAL DIVIDENDS
ENVIRONMENTAL DIVIDENDS
OUTCOMESTo build sustainable value
NA
TIONAL PORTS AUTHORITY
PORT TERMINALS
FREIGHT RAIL
E
NGINEERING
PIPELINES
FREIGHT RAIL20 500km railway including
1 500km heavy haul
1 888 locomotives, 71 075 wagons in service
R99,7bn total assets
29 225 employees
NATIONAL PORTS AUTHORITYOwns and manages 8 commercial ports
R72,5bn total assets
3 823 employees
ENGINEERING132 depots and 6 factories
Manufacture and maintenance of locomotives, wagons, coaches and provision of engineering services
to ports and harbours
R11,2bn assets
12 428 employees
PORT TERMINALS
5 container terminals
3 auto terminals
3 bulk terminals
5 break-bulk terminals
R19,0bn total assets
6 624 employees
PIPELINES3 800km pipelines transporting refined petroleum, crude oil, jet
fuel, and gas
R32,3bn total assets
621 employees
Capital investment R312,2 billion by 2021.Volumes by 2021
Rail: 343,9mt per annum.Ports: 6,1m TEUs per annum.Pipelines: 18,5Ml per annum.
Financial stabilityGearing <50%.Cash interest cover >3,0 times.Investment grade credit ratings.
Regulatory certainty.Productivity and efficiency
Rail reliability – 10% improvement.Port efficiency – 8,5% improvement.Pipeline delivery to order – 95%.
Human capital by 2021Permanent employees 65 785.Skills investment 4% of payroll per annum.
Economy-wide jobs 494 891.Local supplier industry development.Private sector participation.Rural development support.Regional logistics integration.
Mature governance.Zero tolerance for fraud and corruption.Zero harm: safety and security vigilance to protect employees, customers, communities and assets.Employment equity, with focus on women and people with disabilities.B-BBEE Level 1 by 2017/18.Corporate social investment. Proactive stakeholder engagement to build common value.
Modal shift from road to rail (35% market share), lowering transport sector carbon emissions.Energy efficiency.Climate change mitigation.Climate change adaptation.Water use efficiency.Waste management optimisation.Biodiversity enhancement.
Infrastructure investment
Volume growth
Productivity and efficiency
Volume growth
Financial stability
Regulatory Safety, health, environment and
quality (SHEQ)
Human capital development
– South Africa’s National Development Plan– Global and domestic economic conditions– Volatile commodity markets– Unemployment and inequality– Skills shortages– Technology advances– Regulation
CO
NT
EX
TR
ISK
SO
PP
OR
TU
NIT
IES
– Regulatory uncertainty– Capital projects on time, on budget– Volumes and revenue growth– Business interruption and incident
management– Funding and liquidity– Energy security– Human resource capability– ICT utilisation– Suppliers and customers– Environmental and social sustainability
– Collaboration with customers and logistics service providers
– Small business advancement– Supplier development– Skills development– Regional integration– African markets– Technology applications– Diversification of electricity suppliers– Private sector partnerships
INPUTSValue deployed in 2014
FINANCIAL CAPITAL– Share Capital R12,7 billion– Long- and short-term borrowings
R90,4 billion– Cash generated from operations
R24,0 billion
MANUFACTURED CAPITAL– Property, plant and equipment
R207,3 billion– Investment property R8,6 billion
HUMAN CAPITAL– 54 671 permanent headcount– Training spend R621 million
INTELLECTUAL CAPITAL– Custodian of the country’s freight
railway, ports and pipelines, infrastructure and technologies
– R100 million invested in R&D
SOCIAL AND RELATIONSHIP CAPITAL– Customers– Government and regulators– Employees– Funders– Suppliers– Organised labour– Communities– Pensioners
NATURAL CAPITALConsumed:– 3,6TWh coal-fired electricity– 256 million litres diesel– Water, air, ecosystems

SUSTAINABILITY REPORT 2014 SUSTAINABILITY REPORT 201413 14 15
ABOUT TR ANSNET (continued)
– Revenue increased by 12,8% to R56,6 billion.
– EBITDA increased by 12,3% to R23,6 billion.
– Cash generated from operations after working capital changes increased by 11,6% to R25,3 billion.
– Gearing at 45,9% and cash interest cover at 3,7 times, well within targets.
Capital investment increased by 15,6% to R31,8 billion.
– R13,3 billion invested in expanding infrastructure and equipment.
– R18,5 billion invested to maintain capacity.
– R50 billion, 1 064 locomotive contract signed, R4,9 billion invested in current period.
– Rail: Freight volumes increased by 1,3% to 210,4mt.
– Ports: TEU volumes increased by 5,4% to 4,64 million TEUs.
– Pipelines: Petroleum product volumes increased by 4,4% to 16,6 billion litres.
– R621 million invested in skills development (3% of payroll).
– 3 340 apprentices and 483 engineering bursars in the talent pool.
2014
Transnet has persisted in the execution of its counter-cyclical investment strategy of R312,2 billion over seven years. Despite continued economic volatility and regulatory uncertainty in 2014, the Company reports strong financial performance, purchase of new equipment, rail market share growth in general freight, skills investment, an improved safety record, black-economic empowerment and local supplier development through procurement spend, and energy efficiency gains.
FREIGHT RAIL
R34,4bn – RevenueR25,1bn – Capital investment
1,3% – Volume growth to 210,4mt9,7% – ROTA0,82 – DIFR
ENGINEERING
R13,4bn – RevenueR1,0bn – Capital investment6,4% – ROTA0,61 – DIFR
PORT TERMINALS
R8,5bn – RevenueR1,7bn – Capital investment4 503 (000 TEUs) – Total container volumes5,4% – ROTA0,53 – DIFR
PIPELINES
R3,1bn – Revenue
R3,4bn – Capital investment
16,6bl – Total volume of petroleum products8,6% – ROTA0,39 – DIFR
NATIONAL PORTS AUTHORITY
R9,9bn – RevenueR1,2bn – Capital investment4 641 (000 TEUs) – Total container volumes8,0% – ROTA0,17 – DIFR
Transnet Operating divisions’ steady results indicate resilience in the face of economic slowdown, labour unrest, inclement weather conditions, customer and own operational challenges, regulatory uncertainty, electricity outages and depressed commodity prices. Opportunities were seized by Freight Rail for volume growth in the container and automotive sectors, while Engineering increased revenue by pursuing new over-border markets. Sluggish Port and Pipeline volumes reflect the slow pace of economic activity.
R40,9 billion gross value added– R44,0% reinvested.– 14,4% to lenders.– 41,6% to employees.
Recognised B-BBEE spend of R38,8 billion or 94,4% of total measured procurement spend.
R10,9 billion supplier development contracted.
– DIFR performance of 0,69 – better than the target of 0,75.
– R174 million spent on Corporate social investment across South Africa.
– Total electricity consumption reduced 0,2%.
– Electricity regenerated by new locomotives: 176 185MWh for the year.
– Traction energy efficiency improved 2,4%.
– Road-to-rail gains reduced transport sector carbon emissions by 835 670tCO2e.
GROUP HIGHLIGHTS
OPERATING DIVISIONS HIGHLIGHTS

SUSTAINABILITY REPORT 201416
Conditions under which we operateTransnet’s mandate to balance commercial and developmental objectives requires both prudent planning and bold action, particularly in volatile global and local economic conditions. Transnet’s infrastructure and services are intended to benefit South Africa as a whole, facilitating economic activity.
While the Company is State-owned, we receive no financial transfers from the South African Government’s revenue funds. We raise debt on the capital markets without Government guarantees. Transnet pays corporate tax under the same laws applicable to private and listed companies in South Africa. This year saw no significant changes in the way Transnet is owned, structured or functions.
Tariffs charged by Transnet’s National Ports Authority and Pipelines Operating Divisions are determined by independent economic regulators, the Ports Regulator and the National Energy Regulator of South Africa (NERSA). The Company operates in compliance with over 400 regulations established through statute.
The MDS provides the strategic direction for the Company and entails deploying significant planned capital, in the short- and medium-term, to expand the country’s freight railway, ports and pipeline infrastructure and improve operational effectiveness of the freight logistics system.
There is clear recognition by the Shareholder, Board and management that logistics productivity and reliability are determining factors shaping South Africa’s ability to compete in global trade. Transnet must therefore find ways to invest counter-cyclically – through the peaks and troughs of economic cycles – in order to both stimulate and support periods of higher growth.
Advancing the strategic objective of further integrating South Africa into the region and the rest of the continent and improving country competitiveness, many initiatives are underway to build Transnet’s organisational capability and to embed a high-performance culture. Transnet has a robust business model and business practices and harnesses its capitals to realise value for stakeholders. (Read more about this on page 10).
Critical challenges are recognised and are being addressed. External challenges include: regulatory uncertainty, particularly in respect of regulated tariff determination; sluggish economic growth, both global and domestic, which impacts freight volumes and revenues; volatile commodity markets; skills constraints; and energy vulnerability. Internal challenges include: operational efficiencies and customer satisfaction; skills constraints; efficiency of capital execution; and information systems enablement. (Read more about this on page 10).
ABOUT
TR ANSNET (continued)
New ship-to-shore cranes at Cape
Town Container Terminal

17
Governance and assuranceGovernance in the context of sustainability at Transnet
With the adoption of the Sustainability Framework in 2011/12, a Company-wide Sustainability Forum was established comprising representatives from the Operating Divisions, Corporate Centre functions and Specialist Units. The Sustainability Forum meets quarterly and is tasked with developing sustainability Key Performance Indicators (KPIs) for the Corporate Plan; analysing sustainability performance; structuring and providing inputs to the Sustainability Report (SR); recommending the SR to the Group Executive Committee for REMSEC review and approval; facilitating sustainability learning and training; and driving Company-wide sustainability initiatives. The Sustainability Forum is underpinned by Sustainability Committees in the Operating Divisions, adding impetus to the sustainability maturity processes which are currently underway within Transnet.
The Sustainability Forum reports to the Group Executive Committee, which reports in turn to REMSEC. REMSEC advises the Board of Directors, as the highest governance body, on those issues pertaining to responsible corporate citizenship and sustainability. It oversees the Company’s legal and moral obligations for its economic, social and natural environment, including the objectives and standards of the Company’s conduct and activities.
Other committees within the Transnet governance structure, whose responsibilities impact upon economic, social and environmental matters include:
The Audit Committee is constituted as a statutory committee and is charged with reviewing and assessing the integrity and effectiveness of the accounting, financial, compliance and other control systems. The committee reviews financial information to ensure that it provides a balanced view and engages with external assurance providers to provide assurance on the information, including sustainability. The committee also reviews the expertise, resources and experience of the Company’s finance function and discloses the results in the Integrated Report (IR). It recommends the Company Fraud Risk Management Plan (FRMP) to the Board of Directors for approval after consultation with the Board Risk Committee.
The Board Risk Committee reviews the adequacy and effectiveness of the Company’s risk management function. It considers the Enterprise Risk Management (ERM) Framework and ensures that market risk, operational risk, environmental, health and safety risks amongst others are formally reviewed on an annual basis. It recommends the Company’s Risk Appetite Statement to the Board of Directors.
The Corporate Governance and Nominations Committee ensures that all the committees of the Board are properly resourced to enable them to fulfil their mandates. The committee nominates potential committee members for consideration by the Board of Directors and appointment by the Minister of Public Enterprises.
The Board Acquisitions and Disposals Committee ensures that procurement and provisioning policies are fair, equitable, transparent and cost-effective.
BOARD
REMUNER ATION SOCIAL AND
ETHICS COMMITTEE
AUDIT COMMITTEE
GROUP EXECUTIVE COMMITTEE
SUSTAINABILITY FORUM
OPERATING DIVISIONS’ EXECUTIVE COMMITTEES
SUSTAINABILITY COMMITTEES
Board Risk Committee
Corporate Governance and Nominations Committee
Board Acquisitions and Disposals
Committee
Sustainability governance

SUSTAINABILITY REPORT 201418
The committee approves tenders and contracts up to the maximum of the investment decision. It monitors trends in supplier development spend and progress on plans including support of the Government’s economic policies, Competitive Supplier Development Programme (CSDP), local supplier development, preferential procurement and ED.
Assurance for sustainability indicators2014 marks the first year that Transnet has included an external assurance statement on certain information reported in the SR. SizweNtsalubaGobodo (SNG) was appointed on 20 February 2012 as Transnet’s external assurance providers through an open tender process. The assurance statement by SNG (refer to Appendix A) provides assurance over specified key performance indicators.
Financial information included in this report has been extracted from the AFS audited by SNG, which includes an unmodified audit opinion on page 4 of the AFS.
Ethics and integrityTransnet’s Code of Ethics (the Code) allows for a culture of entrenched values, principles, standards and norms that guide the behaviour of Transnet employees. The Code aims to instil a culture of honesty, respect and integrity and overall ethical behaviour in employees in their engagements with both internal and external stakeholders. The Code commits the executive directors and employees to the highest standards of ethical behaviour and all Transnet employment contracts make reference to the Code. Transnet’s service providers, suppliers and trade partners are also subject to the Code. The Group Company Secretary is responsible for the development, review and implementation of the Code. The Code was reviewed in 2013 to extend the scope to independent non-executive directors. It is due for review again in 2015. Aspects of the Code are included in fraud and corruption awareness training; and the Code is available and accessible to all Transnet employees on the Company’s intranet.
In addition to the Code, Transnet concludes Integrity Pacts with all bidders and suppliers. Integrity Pacts have replaced Transnet’s Supplier Code of Conduct. Each party agrees to avoid all forms of dishonesty, fraud and corruption including
practices that are anti-competitive in nature, negotiations made in bad faith and under-pricing by following a system that is fair, transparent and free from any influence/unprejudiced dealings prior to, during and subsequent to the currency of the contract to be entered into. The aim is to:
desired contract at a reasonable and competitive price in conformity to the defined specifications of the works, goods and services; and
or participating in any corrupt practice in order to secure a contract.
for reporting concerns about unethical or unlawful behaviour. The hotline is managed by Internal Audit and all reported cases are investigated through an established forensics investigation process. Cases reported are managed through an automated case management tool and allocated to the relevant Operating Division for investigation. Operating Divisions’ Fraud Working Groups are mandated to monitor the investigation of allegations reported. The hotline is available 24 hours a day, seven days a week and the call centre agents are able to converse in all 11, official South African languages. Details of the hotline are communicated to all employees through various awareness and education mechanisms such as annual fraud and awareness education, information cards, tender documents, invoices and other marketing material. Transnet employees are protected from victimisation by the Transnet Whistle Blowing Policy in so far as reporting is undertaken in line with the Protected Disclosures Act.
Looking ahead to 2014/15, the development of an Ethics Compliance Programme is prioritised. An Ethics Climate Survey is currently underway in the Company, of which phase one and two have been completed and results are being reported to the relevant management and Board Committees. The results of this survey will be instrumental in developing the programme. In addition, an Anti-Corruption Policy is currently being taken through the Labour Forum for consultation, thereafter it will go through the Transnet approval process. In excess of 4 500 employees were trained during the rollout of the Anti-Fraud, Corruption and Ethics Awareness training during 2013/14.
ABOUT
TR ANSNET (continued)
Refers to page 4
1 April 2012 to
31 March 2013
1 April 2013 to
31 March 2014
TIP-OFFS A NON YMOUS HOTLINE STATISTICS 2013/14
Total founded
Total unfounded
Total allegations
725
494
231
628
471
157

19
Material issues determination processTransnet defines materiality for its reporting as: issues4 that substantively affect Transnet’s ability to create and sustain value over the short, medium and long term.
Transnet’s material issues were determined through a structured process of identifying relevant issues and prioritising those that are material, using a number of sources, including:
to Transnet by the Minister of Public Enterprises and the annual Compact that Transnet signs with the Minister;
strategic risks;
Transnet operates; and
This was complemented by a review of Transnet’s coverage in the external media. The material issues were reviewed in a materiality workshop of senior management. This process has informed both the SR and IR content as well as reporting boundaries (refer Appendix E for the boundary matrix).
It should be noted that GRI G4 requires that sustainability reporters define the ‘material aspects’ influencing their organisation. As far as possible, we have therefore matched the dividends in our Sustainability Framework with GRI G4 ‘material aspects’. We also used our Sustainability Framework as part of the process to determine ‘material issues’ as required for Integrated Reporting. Appendix D illustrates the correlation between Transnet’s Sustainability Framework, ‘material aspects’ and ‘material issues’. Some issues not determined as ‘material’ are reported for completeness against the Transnet Sustainability Framework.
Statement of Strategic Intent and Shareholder’s Compact
The Statement of Strategic Intent issued by the Shareholder, represented by the
Minister of Public Enterprises outlines five objectives for Transnet:
percentage of transportable GDP;
maximising the role of rail in the national transport task;
provision of both infrastructure and operations where required;
and the rest of the continent; and
of all interventions undertaken by the Company in the achievement of these objectives.
The annual Compact that Transnet signs with the Shareholder sets out specific annual targets to achieve the strategic outcomes required. These targets are set every year to inform Transnet’s annual Corporate Plan.
Transnet Sustainability Framework
Transnet’s Sustainability Framework is aligned to the Minister’s Statement of Strategic Intent and the Shareholder’s Compact to ensure that Transnet accounts for long-term economic, social and environmental outcomes.
Enterprise Risk Management
The issues that affect Transnet’s ability to create value in the short, medium and long term can be grouped into three categories:
are managed daily through implementing policies and process controls;
could significantly affect Transnet’s ability to implement its strategy, but could be mitigated if they are understood and proactively addressed; and
which affect nations and companies globally; some of which could be mitigated by localised efforts or through collective or multilateral actions.
Transnet’s strategic risk profile is generated from the Transnet ERM Strategy Framework, based on ISO 31000:2009.
4 With the multitude of terms used in the IR Framework and GRI G4 guidelines guiding Transnet’s reporting, Transnet uses the word ‘issue’ to refer to matters, topics, and aspects. Not all ‘issues’ will necessarily be ‘material issues’. Transnet’s material issues, as disclosed in the IR 2014, are included in the SR 2014 on page 27 and reflected in the performance review (page 29). See also Appendix D.
MATERIAL
ISSUES

SUSTAINABILITY REPORT 201420
MATERIAL
ISSUES (continued)
1 Changes in regulatory environment (ie economic, technical and compliance) – spending on capex based on assumptions that may be negatively impacted by subsequent changes in regulation
2 Inability to deliver on the capex plan due to the ineffective application of current capital and procurement operating methodology
3 Inability to attract additional volumes as new capacity is created and to protect current volumes against new entrants
4 Operational and business interruption due to derailments, safety incidents, cable theft, lack of effective application of information technology (ICT) and natural disasters
5 Credit rating downgrade leading to funding and liquidity risks – loans being recalled
6 Security of energy supply – inability to ensure sustainable supply
7 People management, talent attraction and skills development to operate the newly acquired assets
8 ICT infrastructure and technological risks to broader business enablement
9 Counterparty risk certainty of delivery by suppliers/customers. Commodity and Concentration Risks (Third-Party Supplier Risks)
10 Environmental activism increased pressure to be a sustainable
organisation
Strategic residual risks heat map
Priority I risk – Transnet Group CE and Board level Priority II risk – Operating Divisions’ CEO’s level Priority III risk – General Managers’ level Priority IV risk – Managers’ level Priority V risk – Employees’ level
Lik
elih
ood
rati
ng
Consequence rating
E99%
D>50%
C>20%
B>1%
A<1%
7 6 5 4 3 2 1
43
21
5 6
10
9 7 8
A strategic risk profile is generated for each Operating Division, and updated regularly for emerging risks. The output from risk assessments is held in risk registers and risk treatment plans that are stored in the risk information management system. Risks are allocated to specific risk owners for monitoring and review. The risk treatment actions are allocated to task owners to track and monitor completion thereof.
The results of the risk assessment reviews are presented to Operating Divisions or Specialist Unit’s Risk Management Committees and to the Transnet Risk Management Committee.
Key Risk Indicators are developed for all significant and strategic risks. The potential exposure is determined in Rand value for all significant risks. The process
involves relevant stakeholders and is collaborative.
Priority I risks requires management to take action to reduce residual risk or to tolerate the exposure at current residual levels, with authorisation by the Group Chief Executive and the Board of Directors. Priority II risks requires management to take action to reduce residual risk or manage risk reduction through the business plan.
The Board of Directors has delegated the quality, integrity and reliability of the Group’s risk management to the Board Risk Committee.
The key medium-term issues derived from the ERM analysis, which support the material issues disclosed in the next section, are as follows:
Business environment
Slow rates of global and local economic growth, volatile commodity markets, widening social inequality, structural unemployment, technology advances, skills shortages, and the demand for natural resources characterise the business environment within which Transnet operates. These factors have a direct impact on Transnet’s customers, funders, employees and suppliers. The freight systems’ ability to effectively respond to these trends is integral to Transnet’s
business sustainability. The MDS recognises this, positioning the Company to meet demand, pursue developmental outcomes, and build a sustainable enterprise.
South Africa’s NDP, endorsed by Government in 2012, aims to eliminate poverty and reduce inequality by 2030. The long-term structural reforms outlined in the NDP are complemented by the nearer-term goals set out in the NGP; regular updates to the Industrial Development Plan; and the work of the

21
Presidential Infrastructure Coordinating Commission (PICC). The NDP’s focus areas are: the economy and employment; economic infrastructure; transition to a low-carbon economy; South Africa in the region and the world; human settlements; education, training and innovation; healthcare; social protection; safe communities; a capable state; fighting corruption and enhancing accountability; and transforming society and unifying the country.
These NDP focus areas constitute Government’s framework of policy and planning priorities. They are all relevant to the scope of Transnet’s mandate, highlighting the complex socio-economic challenges within which the Company operates.
Public sector investment in economic infrastructure is a key component of South Africa’s economic growth path. The share of the public sector in overall fixed investment rose from under 30% of GDP in 1994 to 38% in 2013, while SOCs, especially Transnet and Eskom, accounted for approximately half of all public investment in 20135. South Africa’s economic infrastructure nevertheless still lags demand and much more is required to stimulate the levels of growth which are needed to create and sustain employment and to reduce poverty and inequality.
The key issues derived from this business environment, which support Transnet’s material issues outlined later in this section, are as follows:
operations;
performance, including safety;
investment.
Stakeholder engagements
Our stakeholders are those individuals or groups of individuals or organisations where we have a legal, financial or operational responsibility; those who are
directly affected by Transnet’s operations; and those who are likely to directly influence Transnet’s performance.
Transnet is streamlining business processes to improve shared value creation through stakeholder engagement. In 2013, we concluded a stakeholder engagement analysis to determine the quality of engagements and to identify ways to improve. A number of improvement areas were identified in respect of our policy, process controls and reporting, and the following steps were taken in 2013/14 to institute a more systematic management approach to stakeholder engagement:
aturity assessment of stakeholder engagements has been concluded, identifying the need to standardise systems.
been developed to guide, streamline and embed the Company’s stakeholder engagement approach based on values of reciprocity, dignity and respect.
development to facilitate policy implementation through auditable processes.
being established within a sustainability data system to record and monitor engagements.
relationships have been conducted in pilot areas of the business.
The Board of Directors has overall responsibility for stakeholder engagement and day-to-day engagements are largely decentralised in the Operating Divisions. The Board of Directors has delegated authority to the Group Chief Executive who reports to the Board of Directors on all material stakeholder issues, and take responsibility for incorporating these into business strategy and risk management.
Transnet identifies, prioritises and maps its material stakeholders based on:
Transnet’s ability to successfully implement strategies and achieve its objectives; and
products and services on stakeholders.
5 The Presidency, Republic of South Africa, 2014: Twenty Year Review South Africa. <http://www.thepresidency-dpme.gov.za/news/Pages/20-Year-Review.aspx>.

SUSTAINABILITY REPORT 201422
We have summarised below the way in which we engage with each identified stakeholder group, their expectations, key concerns and our response. These stakeholder concerns have been identified through the Operating Divisions and Corporate functions day-to-day interactions with their key stakeholders.
Customers
Our customers expect a reliable, efficient and price competitive service which keeps up with their demand. We engage with our customers through regular business meetings; annual customer conferences; monthly service level agreements; and through our social and networking platforms as and when required. Our customers’ key concerns and how we have responded to these are described below:
Customer concerns Our response
Shortage of skills and execution capacity required to meet customer demand.
We share long-term plans and formulate mutually beneficial strategies with customers. This enables us to build execution capacity. We have extensive skills development programmes for our staff.
Inefficient services. We closely monitor service level agreements, and our productivity ratios to improve management and efficiency.
Poor customer service. We engage with our customers on a regular basis to obtain performance feedback. We conduct customer satisfaction surveys, and are implementing many of the recommendations.
Property maintenance and onerous historic leases.
We have improved the commercialisation of leases and the maintenance of our properties.
Potential customers (emerging miners) are concerned that they cannot easily access our infrastructure for their business activities.
We are finding mechanisms to ensure that emerging miners have access to our infrastructure.
Employees
Our employees expect that they will be fairly remunerated, provided opportunities to develop and improve their skills, be treated with dignity and respect and have access to safe working conditions. We engage with our employees through regular meetings, roadshows and team-building sessions; as well as through annual management conferences and strategic planning sessions. Employees’ key concerns and how we have responded to them are described below:
Employee concerns Our response
Being treated with dignity and respect, irrespective of level of occupation.
We have developed a Dignity and Respect Programme, and are in the process of developing an Anti-Bullying Policy.
We have aligned our Operating Division Recognition Awards with the Group Chief Executive Performance Excellence Recognition Programme. These reward virtuous behaviours and instil a culture of high performance.
Access to a safe working environment, which doesn’t impose on the health of employees.
We rolled out our Safety Culture Programme in all Operating Divisions through our safety leagues. Safety awareness was also heightened through our Safety Culture Programme.
The availability of the wellness programmes.
We improved awareness about employee health and wellness through a communication campaign.
Employees want to know more about their expected role and contribution to the MDS.
We implemented a change management strategy which outlines employees’ expected role and contribution in the implementation of the MDS.
MATERIAL
ISSUES (continued)

23
Shareholder Representative – Ministry of Public Enterprises
Our Shareholder Representative expects Transnet to stimulate economic growth and job creation, align infrastructure capital investment plans with Government plans, perform in line with the Shareholder’s Compact, lower the cost of doing business and optimise economic, social and environmental impacts. We engage with our Shareholder through scheduled meetings between the Minister and the Board Chairman, quarterly bilateral meetings between the Department of Public Enterprises (DPE) and Transnet’s Executive Management, through quarterly reports to the DPE; and through our annual Corporate Plan. The Shareholder’s key concerns and our responses are described below:
Shareholder concerns Our response
Possible negative impact of some policies which affect Transnet’s operating environment (eg National Ports Act, Integrated Coastal Management Act Amendment Bill, Preferential Procurement Policy Framework Act (PPPFA), Rail Reform, Infrastructure Development Bill and Safety Permit Fees).
We have developed joint policy positions with the Shareholder to address policy and regulatory risks.
We are working with the Shareholder to engage with the relevant departments.
Transnet’s productivity and ability to deliver on the capital investment plan on target.
We have established and enhanced the Group Capital Integration (GCI) function within Group Finance as well as the Group Results Management Office (RMO) function which are aimed at better management of the Capital Investment Plan and Transnet’s ability to implement and achieve the MDS.
Lack of information about business opportunities for SMMEs. Centre and additional hubs will be rolled out in all
the provinces in the future.
We report on the SDP on a quarterly basis, and proactively participate in the Shareholder’s visits to the communities sharing business opportunities for SMMEs.
The impact of global economic conditions on business performance.
We provide quarterly briefings to the DPE highlighting our performance and broader economic outlook and the actions we consider taking in case of any negative impact on our performance.
Misalignment between Government infrastructure plans and Transnet’s planning.
We proactively participate in the PICC Strategic Infrastructure Programmes (SIPs) and convene SIP 2. Transnet adopted an approach of engaging DPE early in its project planning to ensure more alignment.

SUSTAINABILITY REPORT 201424
Investors
Our investors, bond-holders and rating agencies, expect improved business performance and competitive returns. We engage our investors through quarterly investor briefings, bi-annual reporting, and a report is provided to the National Treasury on a monthly basis. Investors’ key concerns and our responses are described below:
Investor concerns Our response
Policy and regulatory uncertainties and the impact on Transnet’s operating environment especially Integrated Coastal Management Act, National Ports Act, impending Rail Reform and tariffs approval by economic regulators.
We provide our investors with updates on our ongoing policy and regulatory engagements with the relevant policy making authorities.
Overall business performance (corporate financial ratios) and efficiency, and security of their investment.
We provide our investors with regular updates on our business performance (financial and operational performance).
We implement prudent financial risk and funding policy.
Transnet’s ability to fund and execute its capital expansion programme.
The robust funding plans are approved by the relevant authorities (Shareholder and National Treasury).
We implement a flexible capital expenditure execution plan that responds to a challenging environment.
We established the GCI and RMO (see elaboration under Shareholder Representative).
Liquidity constraints associated with large capital expenditure programme increasing debt burden.
We have sufficient back-up committed facilities, nurture good relationships with the banks and have strong credit standing in financial markets.
Our debt is mostly in Rand currency and foreign risk exposure is hedged.
Economic outlook that might negatively impact commodity demand, potential social unrest and strikes and security of energy supply.
We have developed and implemented plans to address:
National, Provincial and Local Government and Regulators
The three spheres of Government and regulatory bodies including NERSA, the Rail Safety Regulator (RSR) and the Ports Regulator, expect alignment of freight investments with local plans and priorities, the creation of local jobs and skills, lowering of the cost of doing business and compliance with regulations. We engage with Government and Regulators through regular applications processes, meetings, monthly and quarterly joint planning sessions, scheduled strategic planning sessions, and when required through written comments and workshops. The Government and Regulators’ key concerns, and how we have responded to them, are described below:
Government and Regulators
concerns Our response
Containment of costs and tariff increases, although rail safety permit fees are being raised exponentially by RSR.
We engage regulators to try to reach consensus on tariff methodologies and pricing (Ports Regulator including NERSA) and permit fees (RSR).
Misalignment between Government infrastructure plans and Transnet’s planning.
We proactively participate in the PICC SIPs and convene SIP 2. We also proactively participate in Strategic Planning Forums with provincial and local Government to share our long-term plans.
MATERIAL
ISSUES (continued)

25
Government and Regulators
concerns Our response
The National and Provincial Department of Environmental Affairs raised concerns about waste and biodiversity management.
We collaborate with policy-makers to proactively address waste management. We actively participate in policy-making through comments on draft policies and regulations. We comply with relevant legislation through Environmental Impact Assessments (EIAs), the development
air quality management plans to address both historical, current and future waste and biodiversity concerns.
Suppliers
Our suppliers expect fair and efficient procurement practices, localisation of procurement, local skills development, black economic empowerment as well as empowerment through the CSDP. We engage with our suppliers through monthly and quarterly meetings as well as scheduled supplier summits. Our suppliers’ key concerns, and how we have responded to them, are described below:
Supplier concerns Our response
Implications of the PPPFA on CSDP, particularly for small suppliers.
We engaged with the National Treasury and our Shareholder to develop a PPPFA framework that will allow for case-by-case exemptions from the negative impact of this legislation to small suppliers.
Operational inefficiencies within supply chain management, particularly for procurement and payment turnaround times.
We have introduced short payment turnaround times for SMMEs and enforced adherence to the contractual obligations to improve efficiencies.
Transformation requirements for international suppliers.
We have introduced localisation thresholds into major contracts to increase localisation and empowerment of the South African supply base. We engage with our OEMs on the development of downstream suppliers, and introduced a Broad-based Black Economic Empowerment (B-BBEE) improvement plan for suppliers, which we are monitoring closely.
Lack of information about business opportunities for SMMEs.
hubs will be rolled out in all the provinces in the future. We have also conducted supplier development education campaigns aimed at SMMEs, and established enterprise development funds, eg Godisa – an agreement between Transnet, Anglo American and Government which will focus on the development of black-owned SMMEs in Transnet’s procurement value chain.
Organised Labour
Organised labour expects transparency and trust, fair remuneration, skills development of employees and safe working conditions. We engage with organised labour through regular meetings with union representatives at local, regional and national levels. Transnet’s recognition agreement provides for each Operating Division to engage with organised labour on a monthly or quarterly basis. We also have a bargaining council where collective bargaining with recognised trade unions is held on a regular basis. Organised labour’s key concerns and our responses are described below:
Organised labour concerns Our response
Emerging trade unions seeking recognition within Transnet.
We engage with trade unions in accordance with the respective legislative requirements for recognising trade unions.
There should be a balance between improving Transnet employees’ skills and broader societal skills set.
We have undertaken tailored skills identification processes to assess what skills are required to implement the MDS and to identify training needs.
Transnet might have too many policies that constrain employees’ daily activities.
We engage with organised labour in collective bargaining processes to reach agreement on organisational policies.

SUSTAINABILITY REPORT 201426
Public
This stakeholder group expects social and economic benefits from Transnet, skills development and improved environmental and safety management at Transnet’s operations. We engage with communities, civil society and media through regular meetings and workshops, communication and engagement campaigns, roadshows, career expos and through the implementation of our Corporate Social Investment (CSI) projects. The public’s key concerns and our responses are described below:
Public (communities, civil society
concerns and media) concerns Our response
Negative impacts of Transnet’s operations eg environmental impacts and safety concerns.
We have implemented various community safety awareness campaigns across our Operating Divisions. We also implement various projects to mitigate environmental impacts.
Land and/or property owned by Transnet which appears to be unused.
We are engaging with relevant authorities to share plans around our assets because some of them are held for long-term strategic programmes.
Inadequate public engagement of communities in the planning phases of infrastructure development.
We have created an integrated development framework that will allow public engagement at early phases of projects.
Local job creation, skills development and rural development.
All our projects, including capital projects are geared towards creation of decent jobs, skills development in the communities and enablement of rural development.
In addition, the Transnet Foundation has invested in five priority community social development areas:
rural communities;
support programme;
African Police Services (SAPS) and communities; and
De Aar and Langa).
The key issues derived from the stakeholder engagement analysis, which support the material issues disclosed later in this section, are as follows:
MATERIAL
ISSUES (continued)

27
Material Issues as disclosed in the Integrated Report 2014The material issues, context of the issues and strategic response, identified through the materiality determination process are as follows (in order or prioritisation):
Material issue Why is this material to Transnet Potential impact on Transnet Strategic response
1. Regulatory
uncertainty regulation by the Ports Regulator for the annual approval of National Ports Authority tariffs.
NERSA’s annual determination of Pipelines revenue.
corporatisation of National Ports Authority.
for Port Terminals at Port of Ngqura.
National Ports Act for provision of new port services.
future port infrastructure affixed to the seabed arising from provisions of the Integrated Coastal Management Act.
charged by the Rail Safety Regulator.
funding and capital
investment planning.
sheet will affect loan
covenants and future funding.
funding for investment are
based on regulatory, revenue
and costs assumptions that
can change significantly
though administrative action.
licences affects deployment
of resources and investment.
port infrastructure affects
investment.
Ongoing
engagements with
the Shareholder,
Government policy
departments and
regulators.
2. Capital
projects on
time and
within budget
technical skills and experience needed
to deliver capital projects to plan.
projects based on demand projections,
business cases and expected growth
opportunities.
delays affect revenues,
reputation, funding and
investment sequencing.
economy.
Enhance and further
embed project
lifecycle process
methodology,
rigorous feasibility
gate reviews and
project risk
management.
Capital approvals
optimisation.
3.
revenue
growth
freight logistics services is dependent
on volume and revenue growth to
finance investments.
import/export markets affects volumes
and revenues.
and revenues affects capital
allocations and timing.
customers where Transnet
capacity falls short.
and attract new customers.
Focus on customer
responsiveness and
satisfaction.
Rigorous capital
planning and
execution.
Implement
Marketing strategy.
Ensure take-or-pay
agreements are
implemented for all
export channels.
4. Business
interruption
and incident
management
Adverse impacts of:
negatively impact on
operational systems, resource
allocations, volumes,
revenues, reputation.
economy.
Risk management.
Operational
efficiency and
productivity.
Safety systems.
Security systems.
Maintenance.
Energy management.
Contract
management.

SUSTAINABILITY REPORT 201428
MATERIAL
ISSUES (continued)
Material issue Why is this material to Transnet Potential impact on Transnet Strategic response
5. Funding and
liquidity cash in the short, medium and long term
and attract cost effective funding.
negatively impact the
Company’s going concern
status and impact on its credit
rating, cost of funds and
investment plans.
cash interest cover.
the country influence
Transnet’s ability to attract
investors.
Finance and funding
strategy.
Engagements with
providers of
financial capital.
6. Energy
security electricity supply at a reasonable price
in order to operate the railways, ports
and pipelines.
resilience by improving energy
management and efficiency,
and adopting alternative
energy solutions
Energy
management,
energy efficiency
measures,
investigation of
alternative
supplies.
Engagement with
Eskom.
7.
resources
capability
mature management to deliver on MDS. management constraints limit
Transnet’s ability to
effectively deliver on
infrastructure plans and
operating efficiency
improvements.
strategy for
performance and
talent management
and skills
development.
8 ICT utilisation
asset losses and disruptions.
infrastructure.
reduce asset losses and
business disruptions.
of new technologies to
improve efficiencies.
ICT strategy.
Investment in
research and
development and
adoption of
appropriate
technology.
9. Suppliers and
customers disruptions.
wider base of companies, including new
entrants.
chains and the nature of
customer’s operations impact
on capital projects,
operational systems, volumes,
revenues and reputation.
Contract
management.
Customer relations.
Capital planning
and execution.
10. Environmental
and social
sustainability
customers are developing new mines.
uncertainty.
mitigation and adaptation in design.
measures factored into project plans.
is part of Transnet’s mandate.
infrastructure for industries
which may not be sustainable.
risk.
Transnet invests and operates
are integral to lasting
business solutions.
Sustainability
strategies and risk
analysis. Feasibility
gate reviews and
project risk
management.

29
ECONOMIC DIVIDENDS
SOCIAL DIVIDENDS
ENVIRONMENTAL DIVIDENDS
SUSTAINABILITY
PER FOR MANCE R EVIEW

SUSTAINABILITY REPORT 201430
Transnet is intently focused on being a primary catalyst for economic
growth and job creation in South Africa. Our railways, ports and
pipelines carry the productivity and consumption activities of the
nation from origin to destination, connecting the country to local and
international trade. It is Transnet’s single-minded determination to
deliver exceptional economic dividends to society through appropriate
infrastructure investment, operational efficiencies, skills development,
localisation, job creation, and sound business discipline.
Transnet’s material economic dividends highlighted in this 2014
sustainability performance review are:
Cost-effective freight logistics infrastructure ahead of demand and a
financially stable business, able to service debt, reinvest revenues and
purse agreements with private parties;
Reliable and efficient rail, port and pipeline services;
Skilled human resources aligned to infrastructure and services; and
Local supplier industry development.
value created by the activities of a business and its employees.
To unlock sustainable value for all stakeholders, the execution of strategy results in value created by the activities of the business and its employees.
Value added 2013/14
Reinvested 44,0%
Employees 41,6%
Capital providers 14,0%
Value added 2012/13
Reinvested 44,6%
Employees 40,0%
Capital providers 15,3%
Government 0,1% Government 0,0%
Refer to Value Added
Statement (Annexure A)
Gross value-add resulting from Transnet capital and operating expenditure 2013/14
R40,9 billionR36,2 billion
ECONOMIC
DIVIDENDS

31
Cost-effective freight logistics infrastructure ahead of demand and a financially stable business, able to raise and service debt, reinvest revenues and pursue agreements with private parties to optimise investment and servicesWhere Transnet’s infrastructure meets demand and our operations are reliable, business output is mobile, on time, and at scale – and our economy grows.
Why it is important to TransnetAs the custodian of ports, rail and pipelines, Transnet has a responsibility to ensure optimal development of the national freight logistics system. One of the key performance areas for Transnet as defined by the Shareholder is to ‘ensure the provision of critical logistics infrastructure and capacity in the short term that is aligned to a long-term national plan geared towards meeting the growing demands of the total national economy’.
The MDS aims to meet unsatisfied demand and to create capacity ahead of demand.
Our management approachKey enablers of the implementation of the MDS specifically relating to cost-effective freight logistics ahead of demand and a financially stable business are the Long-term Planning Framework; Capital Investment Plan and the Private Sector Participation Strategy.
Long-term Planning Framework
The Long-term Planning Framework (LTPF) is updated annually. It provides a 30-year planning framework within which the long-term development of South Africa’s freight transportation network and the expansion of Transnet’s operational footprint can be executed.
Driven by 30-year freight demand projections, the LTPF provides the capacity development and investment plans that are needed to ensure rail, port and pipeline capacity is provided ahead of unconstrained demand.
The ongoing development of the LTPF in consultation with key planning authorities at National, Provincial and Local Government level aims to ensure
that Transnet’s future development plans are integrated with the socio-economic development plans of the Government.
Capital Investment Plan
The substantial increase in capacity that the MDS targets, will be achieved through a combination of efficiency improvements and capital expenditure. The Capital Investment Plan targets expenditure of R312,2 billion over the next seven years to create the capacity required to deliver 343,9mt of railable freight per annum by 2020/21.
Consideration has been given to strategic, financial, operational and engineering requirements. The plan takes into account affordability and funding.
One-third of the capital investment needs to be funded externally and two-thirds through cash flows generated by operations. Transnet’s borrowings do not carry Government guarantees, but are based on the strength of Transnet’s balance sheet. Investors provide funding based on a financially stable business and prospects for growth. Cash interest cover and gearing ratios are key indicators of stability monitored by investors.
The Capital Excellence Programme was developed to:
portfolio with transparency and visibility of projects and programmes in the capital pipeline;
resources to programmes that have the greatest alignment to Transnet’s strategic objectives;
scrubbing teams, whose purpose is to guarantee Platinum Standard business cases by collaborating with the project teams in a Project Factory setting;
ensuring projects achieve cost, schedule and quality targets;
mitigation of key project risks; and
the organisation to execute programmes in a coordinated manner.
The following risks have been identified, accompanied by mitigation actions:
– Continuous capital scrubbing and prioritisation;

SUSTAINABILITY REPORT 201432
Cape corridorExpansion – R30 million
Sustaining – R264 million
Saldanha corridorExpansion – R629 million
Sustaining – R1 429 million
Maputo
Richards Bay corridorExpansion – R1 749 millionSustaining – R1 476 million
Sishen
Durban corridorExpansion – R3 305 millionSustaining – R1 157 million
Ngqura
Port Elizabeth
East London
Mossel Bay
Beitbridge
NORTH WEST
NORTHERN CAPE
EASTERN CAPE
WESTERN CAPE
LIMPOPO
MPUMALANGA
KWAZULU-NATALFREE STATE
Rail
Ports and TerminalsPipelines
South corridorExpansion – R1 071 million
Sustaining – R714 million
NATIONAL – COUNTRYWIDE INVESTMENTSExpansion – R7 503 millionSustaining – R13 188 million
GAUTENG
Capital investment 2013/14
– Entering into ‘take-or-pay’ contracts to secure revenue streams;
– Demand validation exercises; and
– Flexibility of the capital budget to defer, cancel or reprioritise projects if necessary.
– Diversification of revenue base;
– Cost optimisation in all Operating Divisions;
– Focus on operational efficiencies; and
– Implementation of the Platinum Standard.
– Front-end loading (FEL) studies and gate reviews;
– Flexibility of the capital budget to defer, cancel or reprioritise projects when required;
– Detailed execution strategies for the roll-out of capital projects; and
– Fixed price capital construction contracts for certain projects to limit unplanned cost increases.
Private Sector Participation Strategy
Formalised in 2012 and accompanied by the Private Sector Participation (PSP)
Policy approved by the Board of Directors in 2013, the PSP Strategy applies to Transnet as a whole and is driven by a dedicated PSP unit within the Corporate Centre.
The strategy outlines the requirement for future capacity to be offered to the open market in order to broaden the base of participation in South Africa’s freight system and leverage private sector funding in its development.
The PSP portfolio’s six focus areas are:
manganese);
to-rail migration);
offered under the National Ports Act); and
Project selection is predicted either through the National Ports Act, or the Transnet PSP Policy, which identifies infrastructure and capacity required to support national logistics development imperatives, but not already included within Transnet’s core strategies and corporate funding capability.
ECONOMIC
DIVIDENDS (continued)

33
Our performanceDespite depressed global and local economic conditions, a challenging operating environment characterised by miningstrikes,thedowngradingofSouthAfrica’s credit rating and increased input costs,theCompanycontinuedwiththeimplementationoftheMDSduring2013/14inlinewithitscommitmenttoinvestthrough economic cycles.
Capital investment 2013/14TheyearunderreviewsawTransnet’scapital investment increase to R31,8billion,a15,6%increasefromR27,5billionin2012/13,andR22,3billionin2011/12.R13,3billionwasinvestedinthe expansion of current infrastructure andequipment,whileR18,5billionwasinvested in maintaining existing capacity.
Financial performance 2013/14Transnet’s financial performance over the past year reflects resilience despite macro-economicchallenges,enablingtheCompanytomaintainastrongfinancialposition.• Totalassetsasat31March2014amountedtoR240,1billion.
• CashgeneratedfromoperationsamountedtoR24,0billion(2012/13:R22,6billionand2011/12:R20,6billion)anincreaseof6,1%,evidenceofthe ability to generate sustainable cashflows.
• Thecashinterestcoverratioremainsstrongat3,7times(2012/13:3,7timesand2011/12:4,2times).
• Totalfundingraisedfor2013/14amountedtoR22,4billion(2012/13:R14,6billionand2011/12:R11,1billion)despitetheuncertain global financial market and the economicgrowthoutlookbothlocallyandinternationally.Fundingfortheyearwasprimarilymadeupofthefollowing:– GMTNBondissueofR5,0billion;– R2,7billionofcommercialpaperissuance;
– DomesticbondissueofR5,8billion;– R1,1billionofUSExim;– R4,0billionofcallloans;– R2,1billionofKfW;and– R1,7billionfromAfricanDevelopmentBank.
• Thegearingratiodeterioratedto45,9%asat31March2014.Thislevelremainsbelowthetargetrangeof50%reflectingthe significant capacity available to fund future capital expenditure. The gearing ratio is not expected to exceed the targetratiogoingforward.
• Thefundingrequirementfor2014/15amountstoR15,1billionandtheCompanyisconfidentthatitwillbeabletoaccessthe capital markets for the year ahead.
On30October2013,FitchRatingsupgradedTransnet’screditratingto‘BBB’from‘BB+’endorsingtheCompany’seffortsinstrengtheningitsbusinessandfinancial position.
TheupgradeconfirmedthatTransnet’sMDSreflectsarobustexecutionplanandappropriatemitigationstrategiesforitsinvestmentplan.ItalsoaffirmedTransnet’sabilitytoraisefundsinthemarketonthestrengthofitsbalancesheetwithoutGovernment guarantees.
Announcingtheupgrade,FitchRatingssaid“thestableoutlookincorporatesourexpectationsthatTransnet’soperationswillremainstrong,despitepossibleweakeninginimprovingexportmarkets,andthatmanagementwouldscalebackitscapexincaseofweakerdemandexpectationstomaintaintheCompany’sfinancialprofileinlinewithstatedtargets.”
FITCH UPGR ADES TR ANSNET’S CR EDIT R ATING BY T WO NOTCHES TO BBB
Total capital investment in 2013/14
was invested in the expansion of infrastructure and equipment
was invested in maintaining existing capacity
R31,8BN
R9,5BN
R22,3BN

SUSTAINABILITY REPORT 201434
Reliable and efficient rail, port and pipeline servicesKey to ensuring long-term business growth is the ability to provide reliable and efficient services to our customers. Achieving operational efficiencies enables Transnet to reduce the cost of logistics for domestic and external companies that rely on freight services and improve the competitiveness of South Africa.
Why it is important to TransnetImproving performance, productivity and operational efficiencies is a strategic focus area for Transnet. By improving the competitiveness of the freight logistics system, specifically through increased reliability and efficiency, Transnet’s customers and suppliers will be positively impacted , supporting South Africa’s economic growth.
Transnet’s strategic risks include: inability to attract and retain additional volumes as new capacity is created; and operational and business interruption due to safety
and security incidents.
Our management approachIn order for Transnet to deliver reliable and efficient rail, port and pipeline services, numerous initiatives have been implemented in the Operating Divisions; the iSCM strategy has been enhanced; safety is prioritised; and security has been improved.
Operating Divisions’ initiatives
Freight Rail
planning into an Integrated Train Plan.
National Command Centre.
programme.
efficiencies and reduce human error.
Kings Rest and Kazerne Container Terminals.
Distribution Model.
Engineering
with the aim of enhancing skills and know how.
improving operational efficiencies by concentrating on availability and reliability of rolling stock.
engineers, technicians and artisans.
National Ports Authority
performance standards.
management system.
performance.
Port Terminals
across vessels.
lift capacity.
dropping containers at the nearest available crane.
identify and close efficiency gaps.
Pipelines
at Tarlton.
three routes with Freight Rail.
with clients.
fuel
maintaining the Durban-Johannesburg Pipeline (DJP) while the NMPP nears completion and successfully operate the NMPP as full multi-product pipeline.
Integrated supply chain management
Supply chain management aims to increase efficiency and effectiveness with seamless delivery to internal customers. This involves demand management, optimisation of warehouse capacity and inventory levels, integrated strategic
ECONOMIC
DIVIDENDS (continued)

35
sourcing and supplier development, while observing good governance.
The iSCM Policy was approved by the Transnet Board in order to carry out procurement in a cost-effective manner, while meeting commercial, regulatory and socio-economic goals, and ensuring good governance.
In order to enhance key areas within the strategy, the iSCM Platinum Standard development and benchmarking exercise has been initiated. This focuses on an in-depth review of each of the iSCM functional areas relative to best practice with a view to identifying key initiatives that can be implemented to improve the integration and functioning of the iSCM.
Of the six iSCM strategic initiatives, the following three are the most relevant to reliable and efficient rail, port and pipeline services:
capital procurement planning will support effective and efficient sourcing and will ensure timely delivery of the planned capital acquisitions;
an optimised inbound logistics function will enable faster and more efficient outbound revenue generating services; and
productivity – enhancing the reliability of the Transnet supply chain will enable more efficient and effective outbound services.
Safety management
Safety incidents have the potential to severely impact operations. There are numerous strategies, policies and initiatives to effectively manage safety. These are detailed on page 59.
Integrated security management
Theft of copper, overhead cable and goods in transit, as well as vandalism of the tracks impact our ability to deliver freight reliably and efficiently. Delayed trains, and late or non-delivery of goods not only means increased costs for Transnet, but also impacts on jobs, the families that rely on those jobs and the ability to create jobs. It also results in poor customer service and negative reputation.
Transnet has an Integrated Security Management Strategy which aims to protect Transnet’s customers, employees, assets, income and infrastructure. Implementation takes place through centralised command and control and decentralised execution and reporting.
The Transnet School of Security trains security officials for the protection of Transnet’s assets.
Transnet security officers patrolling
railway lines

SUSTAINABILITY REPORT 201436
Our performanceWe highlight here, the key achievements, challenges and targets in operational performance for each major commodity business sector in Transnet.
General Freight Business
Freight Rail transported 87,9mt in 2013/14 in the General Freight Business (GFB) compared to 82,6mt in 2012/13 (2011/12: 81,0mt) reflecting a positive growth rate of 6%.
During the year under review, R20 865 million was invested in assets to support the planned growth in GFB traffic. New locomotives assisted in the drive for improved efficiencies, while the increased fleet size coupled with lower than expected volume throughput, led to improvements in locomotive efficiency. On-time train departures improved significantly to 212,7 minutes while on-time arrivals improved to 340,0 minutes. On route system failures remain a challenge.
General Freight Business
Key performance area Unit of
measureActual
2012Actual
2013Actual
2014
Freight Rail
Million tons 81,0 82,6 87,9
Capital investment R million 9 966 12 962 20 865
Locomotive efficiency Gtkm/Ntkm nm nm 1,54
On-time departures Minutes from schedule
284,0 280,0 212,7
On-time arrivals Minutes from schedule
357,0 356,0 340,0
Engineering
Train cancellations due to traction
% nm nm 4,0
Traction delays % nm nm 6,0nm not measured
ECONOMIC
DIVIDENDS (continued)
Refer to Operating Divisions’
Performance Reports
Electric locomotive

37
Export coal
69,2mt in 2012/13 to 68,2mt in 2013/14. Stronger growth was curtailed by labour unrest within the coal mining industry and depressed coal prices which led some coal customers to decrease export volumes. The fourth quarter saw a loss of 2,2mt of coal due to an unexpected municipal cable failure that resulted in a prolonged power outage at Richards Bay Coal Terminal (RBCT).
Capital investment for the coal line amounted to R3 235 million. The introduction of the Shongololo train
contributed to efficiency improvements on the coal line. Export coal on-time departures improved impressively from 206,0 minutes in 2012/13 to 42,9 minutes in 2013/14, while on-time arrivals improved from 332,0 minutes in 2012/13 to 133,6 minutes in 2013/14. These improvements are attributed to the Train Execution Monitoring System that continues to monitor deviations from scheduled departures and arrivals.
Ship turnaround time at RBCT was introduced to monitor export coal efficiencies in 2012/13 and positive benefits have been realised in 2013/14.
Export coal
Key performance area Unit of
measureActual
2012Actual
2013Actual
2014
Freight Rail
Million tons 67,7 69,2 68,2
Capital investments R million 2 914 3 303 3 235
Locomotive efficiency Gtkm/Ntkm nm nm 1,57
On-time departures Minutes from schedule
209,0 206,0 42,9
On-time arrivals Minutes from schedule
375,0 332,0 133,6
Engineering
Train cancellations due to traction
% nm 6,0 4,0
Traction delays % nm 40,0 6,0
National Ports Authority
Ship turnaround time (RBCT) nm 47,0 45,0nm not measured
Refer to Operating Divisions’ Performance Reports
Coal destined for Richards Bay Coal
Terminal

SUSTAINABILITY REPORT 201438
Export iron ore
Export iron ore volumes declined from 55,9mt in 2012/13 to 54,3mt in 2013/14. The low performance was due to production constraints and other supply factors.
Export iron ore on-time departures improved substantially from 73,0 minutes in 2012/13 to 8,9 minutes in 2013/14.
On-time arrivals improved from 140,0 minutes in 2012/13 to 128,7 minutes in 2013/14.
Engineering continued to support rail operations through the supply of timely and reliable locomotives and wagons.
Targeted port efficiency, measured through ship turnaround time at Saldanha was achieved.
Export iron ore
Key performance areaUnit of
measureActual
2012Actual
2013Actual
2014
Freight Rail
Million tons 52,3 55,9 54,3
Capital investments R million 1 913 2 011 1 015
Locomotive efficiency Gtkm/Ntkm nm nm 1,39
On-time departuresMinutes from
schedule 67,0 73,0 8,9
On-time arrivalsMinutes from
schedule 133,0 140,0 128,7
Engineering
Train cancellations due to traction % nm nm 4,0
Traction delays % nm nm 6,0
National Ports Authority
Ship turnaround time (Saldanha) nm 55,0 47,0
nm not measured
ECONOMIC
DIVIDENDS (continued)
Refer to Operating Divisions’
Performance Reports
Iron ore stockpiles at Saldanha

39
Maritime containers (Ports)
The year-on-year growth in container volumes grew substantially from 4,403 million Twenty-foot Equivalent Units (TEUs) in 2012/13 to 4,641, million TEUs in 2013/14 indicates an increase of 5,4%. Overall performance was supported by the operational efficiencies that ensued from the resolution of the Navis system.
The ports of Durban, Cape Town and Port Elizabeth performed significantly above target in terms of anchorage waiting time while the Port of Ngqura declined compared to prior year levels mainly due to severe inclement weather. Average ship turnaround times at Cape Town and
Port Elizabeth improved but declined at Durban and Richards Bay.
Durban Container Terminal (DCT) Pier 1, Cape Town and Richards Bay improved truck turnaround time while DCT Pier 2 and Ngqura declined.
Transnet Port Terminals gross crane moves
of 24, 28 and 32 respectively. Ngqura’s
did not have the landside equipment to support additional cranes that were brought to the terminal in expectation of increased volumes.
Maritime containers (Ports)
Key performance areaUnit of
measure 2011/12 2012/13Actual
2013/14
Transnet National Port AuthorityVolumes
Containers ‘000 TEUs 4 352 4 403 4 641
Productivity
Anchorage waiting time
Durban nm 61 57
Cape Town nm 53 35
Port Elizabeth nm 56 25
Richards Bay nm 71 70
Ngqura nm 44 57
Average ship turnaround time
Durban nm 53 58
Cape Town nm 44 30
Port Elizabeth nm 31 26
Richards Bay nm 51 70
Ngqura nm nm 44
Transnet Port TerminalsProductivity
Moves per gross crane hour
DCT Pier 1 27 23 24
DCT Pier 2 21 28 25
CTCT 28 31 34
Ngqura 30 32 26
Service delivery
Truck turnaround time
DCT Pier 1 Minutes 45 47 44
DCT Pier 2 Minutes 46 32 38
CTCT Minutes nm 21 20
Ngqura Minutes nm 33 35
Richards Bay Minutes nm 26 21
nm not measured
Refer to Operating Divisions’ performance Reports

SUSTAINABILITY REPORT 201440
Petroleum (Pipelines)
The total volume of petroleum products increased by 4,4% from 15,7 billion litres in 2012/13 to 16,6 billion litres in 2013/14.
Pipelines
Key performance areaUnit of
measureActual
2012Actual
2013Actual
2014
Pipelines
Billion litres 17,3 15,7 16,6
Ordered versus delivered volumes % 95 100 99
Planned versus actual delivery time % 80 77 82
Operating cost per mℓ.km Rand 78 89 99
NMPP actual usage (mℓ/week) Ratio 40% 51:84 51:84nm not measured
ECONOMIC
DIVIDENDS (continued)
Refer to Operating Divisions’
Performance Reports
Pipelines – Tarlton

41
infrastructure in 2013/14 to build capacity and improve efficiencies in services.
In order to boost capacity and increase operational efficiencies, Transnet’s locomotive renewal programme is aimed at introducing new locomotives for coal, iron ore, and GFB over a five-year period (2010-2015) as follows:
Locomotive classes
Year 110x19E 44x15E 32x15E 100xD43 43xD43 95x20E
2010 6
2011 42 28
2012 46 16
2013 16 14 62 20
2014 18 23 10
2015 85
Total 110 44 32 100 43 95
The introduction of new, more powerful and energy efficient 15E and 19E locomotives to the export lines, and the deployment of designated 7E and 10E locomotives to General Freight flows contributed to improvements in locomotive efficiency on the heavy haul lines during 2013/14. At the same time, General Freight took delivery of the Class 43 diesel locomotives, which are being deployed to specific corridors as part of the philosophy of standardising locomotives to corridors. The process is expected to yield positive results in terms of efficiency gains and ultimately an increase in volumes, as evidenced by improved adherence to the Scheduled Railway philosophy in the corridors where these locomotives have been deployed.
LOCOMOTIVES BOOST CAPACITY
Class 19E Coal line locomotive Class 15E Ore line locomotive Class 43 Diesel locomotive

SUSTAINABILITY REPORT 201442
During 2013/14, CTCT was named one of the world’s top 120 container ports by the 2013 Container Management Report. The report rates international container ports according to terminal volumes and competitiveness. This global recognition attests to the fact that the terminal is reaping the benefits of its R4,2 billion expansion, upgrade and construction programme. Key to the expansion programme is the increasing of capacity of both the Port of Cape Town and CTCT to improve productivity and efficiency.
The first of two phases of the upgrade are complete. The first phase included the 10 metre extension of the quay wall at a depth of 15,5 metres over the full 1 137 metre length of the quay, enabling the terminal to receive and service 8 000 TEU vessels. Further investment into CTCT includes the acquisition of six new super post Panamax ship-to-shore gantry cranes and the construction of 2 700 reefer plug points resulting in a total of 3 752 points. Major dredging, deepening and refurbishment work has been completed.
GLOBAL RECOGNITION FOR CAPE TOWN CONTAINER TERMINAL
ECONOMIC
DIVIDENDS (continued)
Port of Cape Town

43
On 5 November 2013, President Jacob Zuma launched Transnet’s new generation automotive rail wagons at Engineering’s Uitenhage plant. The wagons were designed, engineered and manufactured at Engineering’s wagons facility in Uitenhage and are a direct response to customer demands, changing requirements and Freight Rail’s plans to move 170mt of freight to rail by 2018/19 in line with the MDS.
The new wagons feature an enclosed interior, ensuring protection of cars in transit against environmental damage, vandalism and theft. The new car carrier has the
and safer environment. Another significant improvement is internal lighting that has made it possible to load the wagons during the day and night. This has enabled Freight Rail to implement 24 hour shifts to meet customer’s needs.
A total of 350 wagons have been completed and are operational primarily on the route between Kaalfontein, Johannesburg, Port Elizabeth and Durban. The additional wagons have enabled Transnet to not only run longer trains, with the average train length being increased to 45 wagons from 25, but also to realise the Government’s goal to move rail-friendly cargo off the roads. These wagons are testament to Transnet’s improving turnaround and efficiency of the Company’s manufacturing processes, thereby cutting costs and improving service to customers.
NEW STATE-OF-THE-ART AUTOMOTIVE R AIL WAGONS
At the launch event: President Jacob Zuma and Minister of Public Enterprises Malusi Gigaba
Transnet’s new generation automotive rail wagons

SUSTAINABILITY REPORT 201444
On 13 May 2013, Public Enterprises Minister Malusi Gigaba unveiled seven new state-of-the-art ship-to-shore cranes at the Durban Container Terminal’s Pier 2. The cranes are part of Port Terminal’s accelerated crane fleet acquisition programme targeted at replacing its ageing fleet and aimed at increasing efficiency and productivity, especially at Pier 2 which has in the past experienced significant productivity challenges due to ageing equipment.
The new equipment could simultaneously handle two 12 metre containers or four six metre containers and lift up to a maximum of 80 tons. The cranes are the biggest in Africa and can handle new generation vessels with 24 containers stowed across the deck. Through further innovation and optimum planning, the terminal will be able to stretch the cranes’ capability to carry four 12 metre empty containers simultaneously through vertical twin lift.
NEW TANDEM LIFT SHIP-TO-SHORE CR ANES FOR DURBAN
“These capabilities will see a massive jump in productivity with GCH – a key
measure of terminal efficiency and how well equipment is used – jumping
from the current 26 to 33 GCH over the next three years. This is a 27%
improvement.”
– Malusi Gigaba, Minister of Public Enterprises, 13 May 2013
ECONOMIC
DIVIDENDS (continued)
New ship-to-shore cranes at Durban Container Terminal

45
Skilled human resources aligned to infrastructure and servicesOne of the biggest challenges Transnet faces is the availability of skilled human capital.
Why it is important to TransnetTransnet requires skilled human resources to deliver MDS infrastructure and services. Aligned to this, is the developmental imperative to create both direct and indirect jobs through the MDS. Growing unemployment and skills shortages are persistent challenges. Unemployment, particularly of the youth, is both a global and national crisis. Structurally high unemployment is ranked by the World Economic Forum as the second highest global risk for 2014. In South Africa, the unemployment rate is approximately 24%. A coordinated effort between industry and Government is thus required to achieve the national targets for employment.
Key skills shortages exist within Transnet for project management, engineering (sector-specific) and technical skills, and the following risks have been identified:
capability to provide the right skills at the right time for the business.
skills, especially amongst women and People with Disabilities.
of the workforce is semi-skilled and unskilled, indicative of low skills density levels and limited literacy.
Our management approach
plans to ensure recruitment, development and retention of the best quality employees in all employment groups. It has been formulated after careful consideration of the organisation’s vision and mission, MDS objectives, pertinent legislation and best practice in human resources.
The following key initiatives are utilised:
Strategic workforce planning
Transnet is currently using strategic workforce planning supply and demand tools to provide a detailed analysis of business needs, skills requirements and to identify skills gaps, which allows for responses to be designed to mitigate skills gaps/shortages. This entails:
or groupings of similar skills and experience and determining how long it will take, if possible, for an employee to move from one skill level to another;
calculated based on fluctuation parameters such as retirement age, normal attrition rate and early retirement;
Training at Transnet Engineering
– Koedoespoort

SUSTAINABILITY REPORT 201446
resource needs in response to fluctuations in operating model;
plan to derive strategies to correct shortages or surpluses as highlighted in the heat map; and
within the corporate planning and budgeting cycle to ensure that human resource needs are met.
The Transnet Youth Development Strategy:
sets out specific plans to ensure the development of young people across Transnet to fulfil skills development objectives aligned to the MDS.
Capacity development and feeder pipeline approach:
Strategy and other skills development initiatives, as well as ensure governance and a standardised approach to skills development. Examples include: the Capacity Building Policy, On-the-Job Training Policy, Performance Management Policy, and Recruitment and Selection Policy.
Initiatives
Transnet provides training across the business to up-skill employees at different levels:
skills training in the rail and marine environments to obtain Transnet specific qualifications;
training – to ensure compliance with regulatory requirements;
leadership capabilities within Transnet; includes programmes focusing on women managers;
training;
training;
administration training, part time bursaries, short skills programmes and security; and
refers to supervisory, managerial and Operating Division specific leadership training.
The aforementioned training conducted by Transnet Academy through its five schools of excellence (School of Rail, School of Engineering, Maritime School, Pipeline School and School of Security).
We engage with employees and organised labour through forums, meetings and reports to ensure our strategy, implementation, monitoring and reporting is adequately informed.
The feeder pipeline is integrated into the following initiatives:
provided;
experience – assisting student graduates, and to be admitted, and/or registered in various professions in prioritised areas;
to school learners up to Grade 12 in the areas of Mathematics and Science; and
Transnet also conducts career guidance and exhibitions, provides study aids to employees to assist with the further development of their knowledge and skills, and through technology (SAP Learning Solution) ensures sound and credible data management of training and development data. Coaching and mentoring programmes also exist.
ECONOMIC
DIVIDENDS (continued)

47
TR AINING ACHIEVEMENTS IN 2013/14
Actual 2011/12
Actual 2012/13
Target 2013/14
Actual 2013/14
Projection2014/15
Apprentices new intake 854 866 1 550 1 552 605
Technicians learners new intake 120 315 330 339 363
Engineer bursars new intake 60 122 132 138 232
New entries sector-specific 2 340 2 160 1 980 1 569 2 178
Protection officers new intake n/a 815 880 46 968
% training spend 4,1 4,4 4,6 3,0 4,0
Leadership development 1 372 4 660 1 013 3 862 2 249
All training 62 701 43 582 36 960 40 435 38 763
n/a not applicable.
Transnet continues to afford opportunities for workplace experience through its Graduate-in-Training (GIT) programme. During 2013/14, 89 new GITs participated and an increase of 10% is anticipated for 2014/15. On average, 60% of GITs are placed within Transnet per annum.
Transnet’s ageing workforce poses a challenge to the Company’s skill base. The current average age of a Transnet employee is 38 years. There has, however, been a steady increase from 2012/13 in younger employees (25 to 35 age bracket) in order to address this skills challenge.
With respect to job creation, in 2013/14 Transnet’s total headcount decreased to 64 122 from 64 910 in 2012/13. This comprises 54 671 permanent employees and 8 893 fixed term employees. Transnet’s macro-economic Impact Model, 2013 calculates that Transnet has created 10 503 indirect jobs in 2013/14.
Our performanceTransnet invested 3,0% of the wage bill (R621 million) in skills development during 2013/14 in comparison to 4,4% (R846 million) in 2012/13 and 3,9% (R652 million) in 2011/12. A total of 40 435 employees participated in training initiatives against the target of 33 800.
2013/14 saw Transnet achieve most of its targets for the feeder pipeline and sector-specific skills targets. Transnet achieved its engineering (138) and technicians (339) targets with a total of 483 engineer bursars in the system. The intention is to increase the engineering
feeder pipeline intake of new recruits from 132 to 220, and the technician feeder pipeline intake of new recruits from 330 to 363 in 2014/15.
Transnet aims to have 3 000 apprentices undergoing training at any given time. 1 500 new recruits were targeted in 2013/14, with a total of 1 552 entering the programme. Sector-specific skills development will continue to focus on marine, rail and cargo handling with 1 569 learners taken on in 2013/14. Increased targets are projected at 10% in alignment with employment growth.
Training of 46 protection officers in 2013/14 as part of the School of Security.
Total spend on skills development
Employees trained
R621m
40 435
Apprentices intake
1 552
Engineers intake
138
Technicians intake
339
89
Graduates acquiring workplace experience

SUSTAINABILITY REPORT 201448
the National Skills Fund (NSF) and other SOCs, Transnet is playing its part in the training of 1 000 artisans over a period of three years. This initiative, proposed in 2011, is aimed at optimising SOC training facilities to cater for additional artisans in support of the country’s NGP. Learners will have a wide range of options to choose from to qualify: amateur welders, blacksmiths, diesel electrical fitters, electricians, millwrights, platers, vehicle builders, wagon fitters.
The programme commenced in October 2013 with the enrolment of learners from primarily disadvantaged areas. Engineering’s Koedoespoort and Durban facilities will accommodate 250 learners; Uitenhage, Germiston and Salt River will house 100 learners respectively; while Bloemfontein will train the remaining 200 learners.
Black WhitePeople with Disabilities
Site Male Female Male Female Male Female Total
Germiston 58 17 19 6 1 1 100
Koedoespoort 147 41 48 14 2 1 250
Durban 147 41 48 14 2 1 250
Bloemfontein 116 34 38 12 1 1 200
Salt River 58 17 17 6 1 1 100
Uitenhage 58 17 17 6 1 1 100
Grand total 584 167 167 58 8 6 1 000
Currently, Transnet has invested in funding 2 000 training apprentices together with the 1 000 additional learners being funded by the NSF – providing capital of R175 million.
SOCS’ NATIONAL STUDENT FUNDING PROJECT
“Given the colossal skills crises and high unemployment rate in South Africa, skills development is
a critical vehicle for economic growth and human social progress. SOCs should play a pivotal role
and serve as a platform and catalyst for advancing the skills development initiatives and sustaining
human capital.”
– Malusi Gigaba, Minister of Public Enterprises, Budget Speech, 2013
ECONOMIC
DIVIDENDS (continued)
Transnet Engineering – Koedoespoort

49
Local supplier industry developmentTransnet aims to transform its supplier base by engaging in targeted supplier development initiatives to support localisation and industrialisation. This will be achieved through applying creative approaches to procurement and influencing strategic partners to enhance the capability, capacity and efficiency of local suppliers.
Why it is important to TransnetLocal supplier development is a national focus, and is important to Transnet from a business perspective. The aim is to address the historical lack of investment in infrastructure, decline in local industry and a large proportion of the population being unable to participate meaningfully in the economy. By leveraging procurement spend, we aim to increase local content through the development of skills, job creation and technology transfer. Through investing in local supplier development, Transnet complies with the Department of Trade and Industry (DTI) Codes of Good Practice and benefits by:
services through increased supplier competitiveness and/or reduced logistics costs; and
supply versus imports such as:
– Reduced exposure to foreign currency fluctuations;
– Lower stock level requirements;
– Greater responsiveness;
– Ease of communication; and
– Shorter delivery times.
organisations and securing demand for goods and services from local supplier industry poses some risks, including:
industry – where domestic demand is not sufficient to warrant the development of such an industry; and
development objectives and goals are difficult to meet as the PPPFA does not allow for preferential treatment of local markets.
While there are risks in local supplier development, it also offers the opportunity for Transnet to collaborate with fellow SOCs and private business to identify shared demands and ensure the development and sustainability of local industries.
Our management approachIn 2010, Transnet developed a comprehensive SDP. This plan is guided by the DPE’s CSDP, which involves ‘procuring in such a way as to increase the competitiveness, capacity and capability of the local supply base, where there are comparative advantages and potential competitive advantages of local supply’. The CSDP focuses on OEMs through contractually binding SD Plans.
In managing local supplier development we take into account the perspectives of our key stakeholders: the DTI, the Shareholder, National Treasury and black-owned suppliers.
Additional management tools include a Procurement Policy which provides clear direction on how SD must be incorporated into procurement practices. During the year under review, a monitoring and evaluation unit was created to monitor the progress of SD obligations, manage the SD contracts and detect any possible corruption in the implementation of SD. Importantly, all SD contracts include penalty clauses for default and fraud. An ED Procedure Manual has also been developed detailing the procedure for implementing ED for Transnet practitioners and how enterprises can be developed.
We also ensure local supplier development is embedded across the organisation through training. In 2013, training on ED, SD, preferential procurement and amendments to the B-BBEE codes, was done across all Operating Divisions.
Other initiatives undertaken during 2013/14 included:
together with DPE and Eskom;
Industrialisation Supplier Development (ISD), which aims to provide local industrial manufacturing suppliers access to information, tools, services and stakeholders that will enhance their performance and enable them to compete so that they can access national and global procurement opportunities;

SUSTAINABILITY REPORT 201450
Ownership Promote economic empowerment through the active participation of black people in management.
Management control
Promote economic empowerment through the active participation of black people in management.
Employment equity
The redressing of previous disparities in employment by taking into account historical social inequalities.
Preferential procurement
The procurement of goods and services from historically disadvantaged
companies with compliant B-BBEE levels.
Enterprise development
Provision of financial and non-financial support to develop small enterprises.
Social-economic development
Recognise companies’ contributions to initiatives
access to the economy.
Skills development Development of industry specific skill sets for sector development.
Industrialisation Development of industries through machinery, equipment and buildings spend resulting in globally leading capabilities.
Localisation and export potential
Capability building through the procurement of local goods and services will increase South Africa’s exports.
Technology transfer
Skills and knowledge transfer to the local industry through manufacturing related technologies.
Job creation/preservation
The preservation and creation of jobs to achieve labour absorption.
Develop industry specific skills
Development of industry specific skill sets for sector development.
Enterprise development
Provision of financial and non-financial support to develop small enterprises.
Rural integration The use of rural labour and businesses in order to achieve rural development/local economic development.
Economic growth objectives
Transformation and empowerment
Supplier Development
Transnet’s Supplier Development Plan incorporates both growth and transformation
objectives
Minister of Public Enterprises; and
opportunities for port equipment.
Our performanceSince the inception of Transnet’s SD programme, total contract value has been R29,4 billion with SD obligations concluded with suppliers of R10,9 billion or 37% of contract value. To date, R5,9 billion or 54% (2012/13: R4,0 billion or 55,5% and 2011/12: R3,0 billion or 55%) of these supplier development obligations have been met.
Transnet has progressed significantly in transforming its supplier base towards a B-BBEE supplier base. Actual B-BBEE spend for 2013/14 amounts to R38,8 billion or 94,4% (2012/13: R33,4 billion or 88% and 2011/12: R2,8 billion or 80%) of total measurable procurement spend of
R41,0 billion (2012/13: 37,9 billion and 2011/12: R32,2 billion). In terms of the DTI Codes of Good Practice, Transnet’s B-BBEE spend in 2013/14 is as follows:
(2012/13: R5,5 billion and 2011/12: R4,0 billion);
R1,5 billion (2012/13: R2,0 billion and 2011/12: R2,2 billion);
R1,9 billion (2012/13: R2,2 billion and 2011/12: R2,2 billion); and
R3,6 billion (2012/13: R3,2 billion and 2011/12: R2,9 billion).
ECONOMIC
DIVIDENDS (continued)
B-BBEE spend
of total measurable procurement spend on B-BBEE
R38,8bn
94,4%

51
On 6 August 2013, Transnet launched its
entrepreneurs and potential suppliers to Transnet offering the following services: business development, business registration, procurement advisory services, tax registration and compliance, financial support and guidance on black economic empowerment requirements.
suppliers to Transnet, entrepreneurs receive advice on a broad range of issues for their business ventures.
South African Revenue Service, Gauteng Enterprise Propeller, National
Enterprise Development Agency,
DTI’s Companies Intellectual Property Commission. Transnet provides the majority of funding, while the partners provide advice and expertise in their respective areas. The partnership is expected to create strategic relationships between Transnet, provincial and national economic development institutions, and provide small businesses access to financial and non-financial support.
Transnet is in the process of launching four more hubs, in Mdantsane (Eastern Cape), Saldanha Bay (Western Cape) is already operational, De Aar (Northern Cape) and Tubatse (Limpopo).
ONE-STOP-SHOP FOR SMALL BUSINESS
“Our aim is to increase the participation
of small businesses in the mainstream
economy, as they have been identified as
being key to unlocking economic growth.
More than 12 million South Africans rely
directly on small businesses for their
livelihood. Small enterprises in South
Africa employ between 60% and 70% of the
employable population. I therefore believe
that it is our responsibility as Government to
harness this opportunity.”
– Malusi Gigaba, Minister of Public Enterprises, 6 August 2013
“We have identified the need to create an enabling environment for small players to take full
advantage of the economic opportunities presented by our investment programme. Additionally, our
intention is to assist black-owned entities that struggle to build their businesses into sustainable
and profitable entities.”
– Brian Molefe, GCE, 6 August 2013
At the launch event: Transnet Chairperson Mafika Mkwanazi, Transnet GCE Brian Molefe, Minister of Public Enterprises Malusi Gigaba and iSCM Executive Manager Mmadiboka Chokoe
The Hub – Carlton Centre, Johannesburg

SUSTAINABILITY REPORT 201452
On 5 December 2013, the Minister of Public Enterprises, Malusi Gigaba announced the awarding of a R15,5 billion contract for the supply of fuel to nine black women-owned companies. The contract was awarded for a period of five years. Eight of the nine suppliers are 100% black-owned and five of them are more than 80% women-owned. The companies are: Afric Oil, Borutho Gas Supply, Gulfstream Energy, KZN Oils, Mzumbe Oil, NRW Trading and Logistics, Tlhokaina 21, Women of Africa Fuels
The companies will supply Transnet with homebase fuel in tanks installed in Transnet facilities across the country for vehicles and road equipment, diesel traction for all diesel locomotives for fuelling at Transnet sites nationally, and marine diesel for port equipment including dredgers and tugboats.
The successful bidders were assessed on price, supplier development, B-BBEE and technical ability. In addition, Transnet conducted a thorough assessment of short-listed bidders to ensure that they all had the required capability and capacity to service Transnet’s operational requirements.
The award contributes significantly to Transnet’s supplier and enterprise development goals, targets and ambitions especially in relation to skills development, job creation and technology transfer.
R15,5 BILLION FUEL CONTR ACT FOR BL ACK AND WOMEN-OWNED FUEL SUPPLIERS
“When the President announced
Transnet’s MDS in his State of the
Nation address in 2012, he said it
was intended to revitalise South
Africa’s transport and logistics
infrastructure which Transnet has
custody of. Further, he challenged
us to use programmes like these to
create employment, develop skills
and pioneer the creation of a new
class of industrialists – especially
among black people. Transnet has
successfully met the challenge”.
– Malusi Gigaba, Minister of Public Enterprises, 5 December 2013
ECONOMIC
DIVIDENDS (continued)
Minister of Public Enterprises Malusi Gigaba, Transnet GCE Brian Molefe and Transnet Chief Financial Officer Anoj Singh with the successful fuel suppliers

53
On 17 March 2014, Transnet announced that it had awarded a R50 billion contract for the building of 1 064 locomotives to four global OEMs. China South Rail (CSR) Zhuzhou Electric Locomotive and Bombardier Transportation South Africa had been awarded contracts for the supply of 599 electric locomotives, while General Electric South Africa Technologies and China North Rail (CNR) Rolling Stock South Africa (Pty) Ltd would build and supply 465 diesel locomotives.
The award has stringent local content, skills development and training commitments as dictated by the SD Programme. All the locomotives except 70 will be built at Engineering’s plants in Koedoespoort, Pretoria and Durban. Engineering’s role in the agreement has been defined to ensure that it transforms into an OEM over time. It will share approximately 16% of the total build programme – about one third of which will be outsourced to local emerging engineering and manufacturing firms. This will enable Engineering to create export capability for locomotives and related products. In total, the localisation elements are expected to contribute over R90 billion to the economy. The suppliers have complied with and exceeded the minimum local content criteria for rolling stock of 60% for electric locomotives and 55% for diesel locomotives.
L ARGEST EVER LOCOMOTIVE SUPPLY CONTR ACT IN SOUTH AFRICA’S HISTORY
“This marks a significant milestone in the
Company’s history together with substantial
socio-economic benefits for South Africa.
This drive to modernise our fleet is intended
to improve reliability and availability of
locomotives. This will improve customer
satisfaction, ultimately leading to our
crucial goal of road-to-rail migration of
cargo in line with Government’s objectives.”
– Brian Molefe, GCE, 17 March 2014
“This transaction is intended to transform
the South African rail industry by growing
existing small businesses and creating new
ones. We are going to create and preserve
approximately 30 000 jobs.”
– Brian Molefe, GCE, 17 March 2014
At the signing ceremony: General Manager of CNR Rolling Stock South Africa, Wang Gang and Transnet’s GCE Brian Molofe

SUSTAINABILITY REPORT 201454
SOCIAL
DIVIDENDS
South Africa is a resilient, resourceful and culturally rich society where
human potential for excellence is evident every day and where civil
society’s voice is never silent. However, its society is profoundly inequitable,
borne of a past where access to economic resources and social services were
determined by race. In 2014 the country celebrates 20 years of its robust
democracy but still faces challenges of equality, unemployment, inadequate
healthcare and poverty. This is the society in which Transnet exists, invests
and operates. Our railways, ports and pipelines are located in communities,
towns and cities. Our people and our customers have families and live in
neighbourhoods and villages across the land.
Transnet’s long-term social value creation lies in being committed to the
transformation of our society through employment equity and black
economic empowerment; enabling our employees to achieve their full
potential and providing them with safe working conditions; and responding
with compassion to the needs of communities within which we operate.
Transnet’s material social dividends highlighted in this 2014 sustainability
performance review are:
A representative workforce; and
Safety of all people who come into contact with our operations.
We also report highlights of our performance and prospects with respect to:
Staff wellness; and
Support to the communities in which we operate.

55
Operating Division/Specialist Unit B-BBEE contributor status level
Charter applied
Issue date June 2011 July 2012 May 2013 December 2013
Verified period 2009/10
Total points 2010/11
Total points 2011/12
Total points 2012/13
Total points
Transnet SOC Ltd
5 60,41 4 70,62 3 76,75 3 84,34 Generic transport
public sectorPipelines 6 53,44 5 62,75 4 65,11 4 72,94
Capital Projects
5 60,64 5 62,35 4 66,76 3 82,27
Freight Rail 4 68,58 3 80,04 3 78,89 2 87,64 Rail Charter
Engineering 5 62,00 4 66,65 3 81,61 3 84,53
Port Terminals
4 65,69 4 64,94 4 67,06 3 84,88 Maritime Charter
National Ports Authority
6 54,25 6 51,01 5 57,30 4 66,01
Property 8 32,38 6 47,12 6 52,02 5 56,78 Property Charter
A representative workforceWe view employment equity as an important part of our business strategy. A fair working environment contributes to a motivated workforce, ultimately adding to the success of our business in a competitive global economy. We are also committed to upholding the principles of the UNGC on labour practice and human rights.
Why it is important to TransnetTransnet is committed to the principles of equity and anti-discrimination. We seek to create an organisation that reflects the diversity of South African society and that contributes to maximising the potential of our employees. Being one of South Africa’s largest single employers with a workforce of 54 671 permanent employees, Transnet has a responsibility to align to the country’s national goals and support Government initiatives aimed at addressing the socio-economic legacy of the past. Transnet has dedicated itself to providing employment for all demographics, not just for the sake of diversity, but to better empower designated groups.
Through B-BBEE practices, we have the opportunity to shape the future of the multitude of sectors we operate in. Transnet has a B-BBEE rating of Level 3.
Currently our biggest internal risk is employee disputes related to the interpretation of the company’s equity principles and objectives. This is being addressed through improved consultation, engagement and training of employees.
Our management approach Policies and regulations
Representation in the workforce is guided by Transnet’s internal Employment Equity (EE) Policy which is aligned to the Employment Equity Act, 1998 (Act No 55 of 1998). The policy became effective in January 2008. It outlines Transnet’s commitment to EE principles and sets out principles that govern the development of EE plans within Transnet. We adhere to: The Promotion of Equality and Prevention of Unfair Discrimination Act, 2000 (Act No 4 of 2000), The Labour Relations Act, 1995 (Act No 65 of 1995), and The Skills Development Act, 1998 (Act No 97 of 1998).
Transnet B-BBEE rating*
* Denotes B-BBEE rating for calendar year ended December 2013.

SUSTAINABILITY REPORT 201456
Transnet has both a B-BBEE Policy and Strategy. These are indicative of the Board and management’s commitment to transformation and ensures that a uniform message is communicated and understood throughout the Company. Further, it ensures consistency in how B-BBEE is managed and defines initiatives that will be implemented. These are regularly reported to the respective Governance Committees.
Initiatives
Transnet implements multiple measures to ensure equitable representation for all designated groups across all occupational levels.
Transnet aims to increase representation of the following designated groups: African (as per the DTI Codes of Good Practice definition), women and People with Disabilities. As a highly operational environment, the attraction of women into skilled technical jobs continues to pose a significant challenge.
The following initiatives have been undertaken to create and maintain diversity:
include ‘preference for designated groups’ is expected to increase the representation of women and People with Disabilities. Additional policies that have an impact on EE such as our Recruitment Policy or Performance Management Policy are being revised to align with the EE Act.
which includes succession planning is effective from 31 March 2014.
agencies and offers internship programmes to provide People with Disabilities with a minimum of Matric, exposure to the business environment and permanent placement when positions become available.
safety risk are ringfenced to ensure employment of People with Disabilities.
dedicated to ongoing improvement of our work environment and facilities for women and People with Disabilities.
reasonable accommodation are aimed at People with Disabilities.
Training
campaigns and training to educate employees and encourage a positive and conducive work environment for women and People with Disabilities. Examples include: The Dignity and Respect Programme; Safety League Programme; and Zero Tolerance Campaign on
addressing the integration of People with Disabilities into the workplace. The People with Disabilities Ambassador Network, in particular, assists with employee engagement, sensitisation and disclosure.
awareness campaigns are conducted, covering all elements of the scorecard, regulatory requirements, and identification and implementation of control measures to ensure compliance. The training and awareness targets Exco members, B-BBEE Steering Committee, Operating Divisions’ B-BBEE Forum members and all employees.
Internal stakeholders impacted/influenced by employment equity are represented at Group and EE forums which meet quarterly. B-BBEE stakeholders in Government are engaged through the Shareholder and other industry forums, through reports, correspondence, meetings and media.
Our performance With respect to black employees, representation is below that of the National Employment Action Plan (NEAP) with black employees representing 81,4% of the workforce compared to the NEAP target of 87,7%. Despite not meeting the NEAP targets, Transnet exceeded its targets for black employees across all
there is a significant over representation of black male employees at semi-skilled and unskilled levels. This is primarily due to the operational environment of the business.
SOCIAL
DIVIDENDS (continued)

57
Actual
Occupational level 2011/12
(Male)2012/13
(Male)2013/14
(Male)2011/12
(Women)2012/13
(Women)2013/14
(Women)Targets2014/15
Top management 24 32 57 22 26 43 123
Senior management 155 235 404 81 104 192 980
Professional 1 115 1 364 2 171 712 940 1 307 5 978
Skilled 7 540 8 635 11 027 3 646 4 496 5 555 26 218
Semi-skilled 10 817 12 887 14 639 2 619 3 636 4 180 23 371
Unskilled 4 918 3 890 4 260 1 061 657 701 5 656
Total 24 569 27 043 32 558 8 141 9 859 11 978 62 326
Black employees 2013/14
With respect to women employees, representation is below that of the NEAP with women employees representing 24,4% of the workforce compared to the NEAP target of 47,0%. Women representation, although substantially below the NEAP, has shown a steady and incremental improvement. The challenge remains the attraction and retention of women in a highly operational environment.
Women representation is growing steadily with top, senior, professional and skilled technical representation above 28,0%. Areas for improvement include the semi-skilled and unskilled levels where representation is currently 21,0% and 14,0% respectively.
African Coloured Indian White
Occupational
level 2011/12 2012/132013/14 2011/12 2012/132013/14 2011/12 2012/132013/14 2011/12 2012/132013/14
Top management 22 26 33 2 2 3 6 7 7 8 7 6
Senior
management 81 104 135 21 23 23 26 32 34 31 33 30
Professional 712 940 1 026 117 127 137 118 138 144 191 190 192
Skilled technical 3 646 4 496 4 723 522 587 630 183 202 202 884 900 912
Semi-skilled 2 619 3 636 3 699 340 398 409 66 76 72 224 245 208
Unskilled 1 061 657 637 91 69 62 12 2 2 22 22 16
Total 8 141 9 859 10 253 1 093 1 216 1 216 411 457 461 1 360 1 397 1 364
Women employees 2013/14
As a signatory to the UNGC, Transnet is committed to upholding the elimination of discrimination in respect of employment and occupation. Although representation of People with Disabilities has improved substantially to 1,6% (877 employees), achieving the target of 2,0% has been a challenge, and improving the representation of People with Disabilities will continue to form a key focus area for Transnet’s transformation agenda.

SUSTAINABILITY REPORT 201458
The EE plan for 2014/15 will continue to focus on Transnet’s commitment to EE principles namely, the elimination of unfair discrimination and implementation of affirmative action measures to achieve a workforce that reflects the national economically active population of South Africa across all occupational levels. Targets for 2014/15 for black employees, women and People with Disabilities are:
Category
Target 2012/13
(%)
Actual 2012/13
(%)
Target 2013/14
(%)
Actual 2013/14
(%)
Target 2014/15
(%)
African 75,0 80,5 76,0 81,5 80,0
Women at Group executive committee 50,0 41,7 50,0 50,0 50,0
Women at extended executive committee
50,0 37,3 50,0 40,0 50,0
Women below extended executive committee
30,0 23,8 35,0 24,4 35,0
People with Disabilities 1,3 1,4 2,0 1,6 2,0
Looking ahead to 2014/15, EE objectives include:
(semi- and unskilled levels).
As part of human capital transformation, Freight Rail has continued on its targeted recruitment of People with Disabilities over the past year. This resulted in a total of 551 People with Disabilities employed in comparison to the prior year total of 337, and 194 in 2011/12.
Certain positions have been ringfenced to ensure the employment of People with Disabilities. Through Freight Rail’s Disability Forum, employees are engaged, sensitised and voluntary declaration is increasing. Initiatives to improve access to Freight Rail buildings over the past year include: ramps for wheelchair access to buildings, entrance doors modified to open automatically once access card is swiped, restrooms customised for wheelchair access, and parking bays.
FREIGHT R AIL CHAMPIONS PEOPLE WITH DISABILITIES
YEAR-ON-YEAR TOTA LS OF PEOPLE WITH DISA BILITIES
2013/142012/132011/12
337
194
551
SOCIAL
DIVIDENDS (continued)

59
Safety of all people who come into contact with our operationsThe health and safety of our employees, contractors, business partners, customers and the general public is a social responsibility we consider vital to uphold.
Why it is important to TransnetThe nature of our business means we operate across inherently high risk environments that have the potential to negatively impact our employees, contractors, business partners, customers and the general public. While Transnet has a legal responsibility to ensure the health and safety of its employees and those affected by its business operations, Transnet considers safety a core value and a business imperative, and therefore will not settle for basic compliance. We strive to maintain the highest safety standards and a zero harm environment.
Our management approachTransnet’s safety management is guided
applies to all employees (permanent and non-permanent), stakeholders and contractors in Transnet. This policy outlines our philosophy that safety is everyone’s responsibility and defines the strategic intent and principles that provide a framework for action. Group Risk Management is responsible for the development, facilitation of implementation, maintenance and review of the policy.
Other management approaches include:
undertaken through the Golden Safety League programme and the Transnet Culture Charter.
understand their safety concerns, and develop solutions based on best practice. Stakeholders include: the RSR, the Department of Labour, organised labour, employees and the Shareholder.
Transnet has entered into recognition agreements with its two recognised trade unions. The recognition agreements ensure enforcement of the Labour Relations Act, but do not specifically
the agreement is backed by policies, standards, procedures and rules that seek to ensure a safe working environment. Topics such as working hours, conducting risk assessments, lock outs, substance abuse testing, exposures (both health and safety), training, and Personal Protective Equipment, are discussed at various structures where trade unions are key stakeholders.
System (TOMS)
TOMS hosts all information regarding incidents, which includes safety, across Transnet.
Annual Safety Competition Day

SUSTAINABILITY REPORT 201460
policies, standards, procedures and guidelines
We have developed and implemented policies, standards, procedures and guidelines that will improve safety management and performance across the business, such as:
Management Policy;
– An Integrated Emergency Management Service; and
– An Integrated Clinic Strategy.
Safety audits offer an opportunity to evaluate the effectiveness of our policies, procedures, and guidelines. Internal and external audits are conducted annually. Risk management has an integrated internal assurance plan, and external audits are conducted by accredited auditors and the RSR.
The Board of Enquiry is an independent body managed through the incidents investigation processes. All safety incidents deemed significant (level one and two incidents) are investigated by the Board, resulting in findings and recommendations.
Each Operating Division operates in a unique environment, and thus safety challenges and appropriate responses differ, accordingly. The Operating Divisions’ Chief Executive Officers are responsible and accountable for their
accountability for safety performance lies with the Group Chief Executive.
The following processes and initiatives assist in more effective safety management in the Operating Divisions:
operational activities are identified, assessed, addressed and monitored
They are a platform through which our employees can actively engage in the implementation of occupational health and safety. Approximately 247 formal joint management-worker health and safety committees have been established within Transnet based on the geographical layout and work area of every business unit.
total workforce) ensure all employees
Safety committees.
Training is conducted through the School of Rail, whereby safety training is built into functional training. It is also conducted through external service providers contracted to provide specific safety training such as first aid
incident management training and risk management training.
Awareness campaigns are conducted on specific safety issues, for example the ‘5 S Programme’, which focuses on supervision.
The Seven Golden Safety Actions
I will not perform unsafe work and put myself and
others in danger
If I don’t understand and if I have a problem, I speak up and say so
I take responsibility myself and my team
I don’t blame other
I always prepare, check and report unsafe acts
and conditions
I rest well and work safely
I know the standard operating procedures and safety rules, follow them and don’t take shortcut
SOCIAL
DIVIDENDS (continued)
No matter what my level, I contribute to improving safety

61
assessments
Every Operating Division has its own risk management methodology which informs the type and frequency of risk assessments.
safety is on the agenda
These include daily safety tasks and
Forums; symposiums and local and national business committees.
Safety challenges and responses
Safety challenges exist across the organisation at different levels. Freight Rail has the highest health and safety risk as it accounts for the majority of occupational injuries and illnesses. Across the organisation, the following significant challenges have been identified:
the standard operating procedures and are not fully integrated into the safety culture of Transnet. This is addressed through targeted training and development, and engagement on safety culture.
third parties significantly affects Transnet drivers. While Transnet has very limited control over these incidents, we send our drivers on advanced driving courses.
equipment and copper cable leads to derailments and resulting injuries.
greatest challenge to public safety in our operations.
Freight Rail accounts for 83% of all occupational illnesses, the majority of which are noise-induced hearing loss caused by continuous exposure to train operations and heavy machinery. This is closely monitored and managed through annual medicals. All exposed employees are required to wear Peltor ear muffs, which allow for effective communication whilst providing hearing protection. Specific training and awareness is implemented throughout Freight Rail.
Our performanceSafety performance is measured against industry recognised indicators such as the disabling injury frequency rate (DIFR), fatalities, loss incidents and derailments.
Transnet has experienced a general decrease in the DIFR over the past year from 0,74 in 2012/13 to 0,69 in 2013/14. On average, the ratio has been below 0,75 for the past five years.
Tragically, the Company reported seven employee fatalities. This compares to nine fatalities in 2012/13. Most of the 2013/14 fatalities were as a result of non-adherence to Standard Operating Procedures. Fatalities occurring in road accidents outside Transnet operations are no longer recorded as fatalities.
Public fatalities are lower than 2012/13 with 106 public fatalities reported for 2013/14 compared to 125 reported in 2012/13.
In collaboration with local municipalities, schools, the SAPS and other relevant stakeholders, Freight Rail continued with its Level Crossing Awareness Campaign in 2013/14 educating communities, the public and children about the dangers of living close to or next to the railway lines. Level-crossing accidents for 2013/14 total 82, down from 87 in 2012/13. Trespassers into the rail reserve account for 83% of public fatalities – a challenge that Freight Rail has with the encroachment of informal settlements in the railway reserve. Other challenges include fencing and access control.
There has been a notable increase in the number of loss incidents for 2013/14, with a total of 1 622 compared to 1 737 in 2012/13 indicating a drop of 6,6%. The total estimated cost of these incidents is R618 million compared to R572 million in 2012/13. The severity per incident has thus increased by 7,4% compared to the levels of the comparative period.
Running line derailments have increased from 85 in 2012/13 to 116 in 2013/14. Shunting derailments declined year-on-year from 267 to 242.
Ms Ayanda Dlamini 29 April 2013
Mr Musawenkosi Dlamini 10 May 2013
Mr Daniel Motshabi Matshidiso 14 May 2013
Ms Promise Fikile Cele 20 July 2013
Mr Mzukisi Nanto 23 July 2012
Mr Philemon Mudau 17 September 2013
Mr Cecil Wentzel 3 November 2013
On average, DIFR below 0,75 for past five years
WE REMEMBER
0,69

SUSTAINABILITY REPORT 201462
Level-crossing accidents pose a major challenge to Freight Rail operations. In collaboration with local municipalities, schools, the SAPS and other relevant stakeholders, Freight Rail continued with its Level-Crossing Awareness Campaign in 2013/14 educating communities, the public and children about the dangers of living close to or next to railway lines.
As part of the campaign, Freight Rail’s Container and Automotive Business Unit (CAB) Corporate Affairs and Safety Office organised the Natcor Line safety inspection in January 2014. The purpose of this exercise was to identify safety threats along the line and develop a proactive plan of action. Findings included:
the line;
A programme of action has been developed to address these challenges. Some require immediate action as part of the campaign such as the schools close to the line and old signage while others will require a longer-term programme of action for example, provision of overhead bridges for pedestrians; structural modifications of some level crossings; negotiations with farmers and local stock owners; and negotiations with local government authorities for the relocation of informal settlements next to the line.
R AISING LEVEL-CROSSING AWARENESS
Staff wellnessStaff wellness forms an integral part of Transnet’s overall human resources strategy ensuring that employees are productive, engaged in their jobs and present at work. If not managed, this could impact the Company’s overall efficiency and performance, pose a safety risk, as well as a cost to the Company as a result of absenteeism.
There has been a general decline in absenteeism for the period under review, from 413 191 days lost in 2012/13 to 377 632 days lost in 2013/14. This can be attributed to the integration with the Safety Culture Programme which has assisted in raising awareness and providing managers and supervisors with the necessary skills to proactively manage absenteeism.
Staff wellness days are conducted on a regular basis and form the basis for awareness and training amongst employees.
The Employee Assistance Programme is focused on providing psycho-social counselling services; education and awareness on various wellness-related topics; health risk assessments and
assessments; and safety risk assessments. Team health issues are becoming more prominent with the need to assist in resolving team conflict, leadership coaching, and process re-engineering of structures and systems.
Projects supporting the business have also become a feature of the wellness programme. The Marine Cadet Life Skills project equips individuals to be away from home for extended periods. The ‘Leave a Legacy’ project aims to prepare first time job seekers, to adjust to the world of work.
SOCIAL
DIVIDENDS (continued)

63
Value for communities in which we operateTransnet’s commitment to social transformation finds expression in its community development programmes that aim to empower and uplift those who are most vulnerable in society, focusing on areas of greatest need. Rural areas in South Africa are particularly vulnerable in terms of access to services, infrastructure and economic opportunities. In support of Government’s socio-economic development objectives, Transnet’s total spend on CSI for 2013/14 was R174 million which contributed to the achievement of an overall B-BBEE score of Level 3.
The Transnet Foundation is Transnet’s Specialist Unit responsible for managing the Company’s CSI programme. Its mandate is aligned to the MDS, with a strong focus on touching rural communities along the rail network, and investing in those projects with a strong community impact. Transnet’s flagship community investment
programmes are focused primarily on health interventions, promoting education, and enabling effective asset utilisation to provide much needed infrastructure solutions. Flagship programmes include:
providing primary healthcare through Transnet’s Phelophepa I and II trains to rural communities in the Eastern Cape, Northern Cape, North West, Limpopo, Free State and KwaZulu-Natal provinces.
On average, Phelophepa treats 1 500 patients per week, offering medical services and medication at a very low price. This affordable healthcare is managed by health professionals and supported by student doctors who live on the train; as well as volunteers. Four out of five South Africans depend on public healthcare but access to hospitals and clinics remains difficult for many people living outside of city centres. Phelophepa helps to bridge this gap in rural communities.
Transnet Foundation’s most recent Phelophepa project was the ‘cataract camp’ held in the Northern Cape from 29 April 2013 to 3 May 2013. In partnership with the
Foundation performed life-changing cataract operations for the underprivileged. The camp secured the services of three highly acclaimed Indian ophthalmologists to perform the surgeries. Cataracts are one of the most common causes of avoidable blindness and are a particular cause for concern in the Northern Cape as the province has only three eye surgeons for a population of over one million people.
THE GIFT OF SIGHT
Phelophepa is
affectionately
known as the ‘train
of hope’ in the rural
communities in
which we operate.
Phelophepa II
was engineered
and built by
Engineering in
2012 at a cost of
R82 million.
Phelophepa is the
first South African
CSI initiative to
receive the United
Nations Public
Service Award
(June 2011).
Total CSI spend 3,4% net profit after tax
R174 million
Interesting
FACTS
Phelophepa health train visiting Northern Cape Phelophepa’s ‘cataract camp’

SUSTAINABILITY REPORT 201464
Phelophepa services include: dental, optometry, pharmacy, oral and
health education and psychological counselling. In addition, the train offers South African and international final year professional health students practical experience in nursing, dentistry, optometry, psychology and pharmaceuticals.
Transnet’s partner sponsors are Roche and Colgate-Palmolive South Africa.
Since its inception in 1994, the programme has reached over 5,5 million people.
focusing on basic education specifically, teacher development and learner support.
Since its inception in 1999, 350 qualified educators have received supplementary training in Maths, Science and English, and 50 student educators were enrolled in tertiary institutions. The following regions are targeted: Makana (Eastern Cape), Motheo (Free State), Moretele (North West), Mtubatuba and Durban South (KwaZulu-Natal).
A new programme focusing on orphaned youth was launched in 2012/13. The programme is aimed at giving equal access to education to orphaned youth. Transnet Foundation pays school fees, boarding, school amenities, clothes, and gives the learners a monthly allowance. Once they complete Grade 12 in 2015, Transnet will pay for their university studies and eventually assist them in finding employment opportunities. Ten youth (seven females and three males) from KwaZulu-Natal, North West and Mpumalanga have been enrolled in the programme to date.
converts old freight containers into infrastructure for rural communities.
The Foundation’s collaboration with SAPS and the Provincial Departments of Social Development to address infrastructure backlogs using old recycled containers has resulted in the reduction of crime and increased access to social services in a number of rural towns and villages.
Since the programme’s inception in 2001, the Foundation (together with Freight Rail and Engineering who are responsible for the conversion of the containers) has built 20 satellite police stations, 10 classrooms, three community centres and 18 multi-purpose centres. Approximately R27 million has been invested in the CAP and approximately 27 000 jobs have been created by erecting these structures and staffing the container centres.
Some of the most successful CAP projects include:
Northern Cape): This remote cluster of rural villages now has access to a range of social services as well as income-generating projects.
(Mpumalanga): This isolated community now has immediate access to an impressive 19 social workers.
Natal): 30 000 people in 14 rural villages now have access to a police station in a high crime area.
station (Northern Cape): An impact study shows that the streets in this area are safer since the opening of this facility.
(near Richards Bay, KwaZulu-Natal): Approximately 24 000 people who used to have to travel 30km to report a crime, now have immediate access to police services.
SOCIAL
DIVIDENDS (continued)

65
CONTAINER BAKERIES PROJECT
Together with Umnyakazo Development (Pty) Ltd, Transnet is funding and supporting the establishment of 30 community-owned containerised bakeries in 15 rural district municipalities across KwaZulu-Natal (10), Eastern Cape (10) and North West (10). Each bakery will create a minimum of 15 jobs, while 30 bakery containers will create 450 jobs.
The objectives of this project include:
for rural families;
community;
confectionary products;
Umnyakazo Development (Pty) Ltd is a 100% black women-owned food and beverages company that aims to provide a platform for development, growth and sustainable programmes. The bakeries will be owned and operated by black women-owned cooperatives in the identified rural areas, and will include tuck shops, clinics, and school feeding schemes.
Currently, the project is in the implementation phase. Funds have been disbursed for the first phase of the project in the Eastern Cape and Transnet has purchased containers and commenced refurbishment.
Transnet container bakery

SUSTAINABILITY REPORT 201466
ENVIRONMENTAL
DIVIDENDS
We understand Transnet’s environmental context, impact and
responsibilities in five key respects:
waters, over mountains, rivers, wetlands, semi-deserts, valleys, forests, fynbos and veld. Through these systems, we build infrastructure, operate equipment, and handle large volumes of cargo. Every day, our employees, contractors, suppliers and customers have an impact on the natural environment and depend on it for their livelihoods. Our responsibility is to mitigate this impact and protect our invaluable natural heritage.
Electricity, Transnet’s primary source of energy, is supplied by South Africa’s coal-
contributing to global warming. Diesel, imported from oil-extracting countries and
the environment, both in climate change and localised air quality. We use water, but have not yet quantified how much we can save. We comply with waste management regulations, but have not yet pursued deliberate recycling strategies.
coal every year to power stations and export facilities, and continues to invest in new railway capacity to meet the relentless demand for coal from growing economies both locally and abroad. We are mindful that this is both a value proposition and a long-term risk as the world seeks renewable forms of energy to sustainably support burgeoning populations.
vulnerable to erratic and violent weather events, particularly coastal storms and floods.
Our infrastructure planning is being adapted accordingly. Water scarcity adaptation measures are also needed.
Transnet’s material environmental dividends highlighted in this 2014 sustainability performance review are:
emissions and for future growth.
We also report highlights of our performance and prospects with respect to:

67
Access to secure and affordable energy which allows for reduction in our GHG emissionsWhy it is important to TransnetTransnet is an energy-intensive business, exposing the Company to significant energy security risks. Transnet’s primary energy sources are electricity (62%) and diesel (31%), with the remainder constituting distillate fuel oil, petrol and other sources. This year, energy costs constituted 18% of Transnet’s total operating costs, an increase of 2% from 2012/2013. Based on expected volume growth in rail, port and pipeline freight until 2040, Transnet forecasts that the base rate energy requirements are to increase by 3,9% per annum.
Transnet is fully reliant on Eskom for the provision of base-load electricity to power its operations, and on municipal electricity distribution systems in many areas. This poses a number of concerns, including:
over the short to medium term;
distribute electricity to rail operations over the short to medium term;
systems to supply reliable electricity to areas where Transnet operates; and
These risks are particularly prevalent for Freight Rail, which consumes more than 70% of Transnet’s total electricity usage.
Mineral diesel and distillate fuel oil is supplied by various South African oil refining companies. Currently fuel price volatility and exchange rate exposure is a concern while the security of fuel supply is not high risk.
Transnet is responsible for enabling the competitiveness, growth and development of the South African economy through delivering reliable freight transport and handling services that satisfy customer demand. In terms of the NDP and the DPE Climate Change Policy Framework for SOCs, Transnet is also required to assist South Africa in transitioning to
an environmentally sustainable, climate change resilient and low carbon economy
Our management approachIn 2013, Transnet developed an Energy Security and Carbon Mitigation Strategy for the period up to 2040, based on an assessment of:
of energy supply, energy costs and environmental impact;
(2018), medium- (2025) and long-term (2040) energy requirements; and
energy demand.
The strategy is currently being implemented throughout the organisation and aims to minimise security of energy supply risks, energy costs and emissions from energy use. An Energy Policy has been developed and is due for adoption in 2014.
Our participation in the CDP ensures our approach to managing emissions year-on-year. A Climate Change Policy has been developed and is due for adoption in 2014.
Understanding our environment

SUSTAINABILITY REPORT 201468
Initiatives
While many solutions exist to enhance security of energy supply, reduce energy costs and reduce emissions from energy use across Transnet, the following actions have been identified as the most significant.
Excellence in energy management
The ISO 50001 energy management system is currently being implemented across all Operating Divisions and Transnet Property. This provides a formal structure to enable the effective implementation of energy efficiency initiatives and alternative energy supplies.
Energy efficiency initiatives
A number of energy efficiency initiatives are being implemented across the Operating Divisions.
The following sustainable energy options for Transnet equipment use are currently being explored by the R&D unit in Engineering which focuses on the operationalisation of new, relevant technologies:
locomotives and port equipment;
locomotives and other equipment;
energy sources;
through drag effects; and
and re-using heat from exhaust systems.
Engineering R&D commenced a fuel cell feasibility study in October 2013 to explore the use of fuel cells in locomotives.
On the mobile side, fuel cell applications are mostly focused on integrating this power source as a mover on board the locomotive, replacing the existing diesel engine on a diesel locomotive. Routes have been analysed for energy and power requirements and several preliminary design cases have been explored. Regenerative braking energy storage on board the locomotive for re-use is also being considered in order to increase the overall efficiency of the locomotive.
On the stationary side, four cogeneration applications have been investigated for increased efficiency. The different application categories considered are back up power, base load power, peak power shaving, load shifting and/or an appropriate combination of these sources. Steam plants for cleaning rail vehicles and distillation plants for separation of intermixture in pipeline operations are two key cogeneration applications being considered, as they require high quality, high temperature heat which fuel cells can provide.
Part of the study that overlaps the two distinct branches is the fuel type, availability and distribution. Fuel cells are fuel flexible and only one kind of fuel cell can use current hydrocarbon fuels such as diesel and petrol for operation. Fuels such as ammonia, hydrogen (compressed and liquefied), natural gas (compressed and liquefied), methanol, ethanol, reversible metal hydrides, and dimethyl ether are being investigated. Their current production and the location of distribution networks are being considered. For both mobile and stationary applications, it is important that fuel cells that are in the vicinity are used. The possibility for using fuel cells for both applications will be investigated.
The study will be completed in 2014.
ENGINEERING’S FUEL CELL STUDY
ENVIRONMENTAL
DIVIDENDS (continued)
Transnet’s ‘Every Watt Counts’ campaign.

69
Total fuel consumption
Total electricity consumption
Decrease in electricity consumption since 2011/12
255,9 mega litres
3 548 522MWh
7,0%
The largest financial and technical resources have been allocated to developing energy efficiency in Freight Rail where the largest challenge is reducing the traction requirements for our rail network. We have multiple initiatives including:
techniques of operating locomotives;
train; and
A significant opportunity to offset energy consumption is through new locomotive technology specifically, regenerative braking capability. The deployment of the new class 19E and 15E locomotives on the coal and iron ore export lines has resulted in improved energy efficiency gains.
Freight Rail’s regenerated electricity is used in the locomotive themselves and where possible, any excess electricity is transmitted back into the Eskom grid.
As Transnet continues to increase the volumes it transports year on year, the best measure of whether the energy efficiency initiatives are effective is to measure the gross ton kilometres (train weight x distance) travelled per unit of fuel consumed – electricity (kWh) for the electrical lines and diesel (litres) for the diesel lines.
Freight Rail has an Energy Efficiency Forum which meets every two months. This forum monitors performance and evaluates whether the measures adopted for energy efficiency are effective.
For the medium to long term, Transnet is actively investigating alternative energy supply opportunities, including: natural gas, second generation biofuels, wind and solar.
We engage with Eskom, NERSA, National Treasury, the Shareholder, the Department of Energy, industry associations, OEMs, fuel suppliers, and customers on energy issues.
Training
Collaborative energy training is undertaken in conjunction with the EELN. Training is conducted for energy managers and engineers for implementation of the ISO 50001 energy management system.
Our performanceTransnet’s total electricity consumption for 2013/14 was 3 548 522MWh, down 0,2% from 3 555 674MWh6 in 2012/13 while volumes of freight have increased by 4,0% giving a net energy efficiency gain.
Since 2011/12 (baseline year for reporting when energy efficiency measures were instituted) total electricity consumption has decreased by 7,0% from 3 798 908MWh.
TOTA L ELECTRICIT Y CONSUMP TION (MWh)
2013/142012/132011/12
7,0%
3 79
8 90
8
3 55
5 67
4
3 54
8 52
2
74,0% of electricity in 2013/14 was used for Freight Rail traction, and the remainder in Transnet’s properties, ports, pipelines and engineering operations.
Transnet’s total fuel consumption for 2013/14 was 255,9 mega litres, an increase of 7,0% from 239,7 mega litres7 in 2012/13. Since 2011/12, which represents our base year, total fuel consumption has increased by 10,0% from 231,7 mega litres. This increase can be attributed to the move to diesel powered freight movement on some operating sections. Of the total fuel consumption figure: 73,3% of this was used for Freight Rail diesel traction; 11,9% on road vehicles; 11,1% on home-based fuel; and 3,7% for marine diesel.
TOTA L FUEL CONSUMP TION (LITRES)
2013/142012/132011/12
+10,0%
231,
7
239,
7
255,
9
6 Adjusted figure as a result of double accounting between Freight Rail and Engineering.
7 Adjusted figure as a result of year-end consolidation of data.

SUSTAINABILITY REPORT 201470
Electricity efficiency performance
Targets 2013/14 Performance 2013/14
Operating
Division Measurement
Target
gain on PY Target Actual
Energy
efficiency
gain on PY
Freight Rail traction
Gtk/kWh
1% 65,2 66,1 2,4%
Freight Rail real estate
kWh 2% 229 109 403 225 762 069 3%
Transnet Property kWh 5% 63 785 635 68 473 089 (2%)
Pipelines Mℓkm/MWh 1% 34,8 36,0 4%
Port Terminals Ton/kWh 2% 0,6 0,6 5%
National Ports Authority
Employee/MWh
4% 1,2 1,3 14%
Engineering Man hour/MWh
4% 185,3 204,5 16%
Fuel efficiency performance
Freight Rail Traction
Gtk/ℓ 1% 206,5 175,6 (14%)
Port Terminals Ton/ℓ 2% 5,5 5,3 (1%)
Engineering Man hour/ℓ 4% 9,2 9,5 8%
ENVIRONMENTAL
DIVIDENDS (continued)
We have calculated our carbon footprint using the Greenhouse Gas Protocol (a Corporate Accounting and Reporting Standard) and the Intergovernmental Panel on Climate Change guidelines for National Greenhouse Gas Inventories, 2006. Our consolidation approach for calculating our emissions is operational control.
With respect to Transnet’s carbon emissions for 2013/14, there was an increase of 0,9% to 4,24mtCO
2e in
comparison to 4,1mtCO2e in 2012/13. This
increase can be attributed to the following:
Transnet Scope 1 emissions amounted to 693 422tCO
2e up from 648 660tCO
2e in
2012/13. Scope 1 emissions covers diesel locomotives, vehicles, long-term leased vehicles, onsite combustion of fuels and refrigerants. Freight Rail is responsible for 82,8% of Scope 1 emissions.
Scope 2 emissions decreased by 0,2% to 3 531 548tCO
2e due to improved electricity
efficiencies throughout the business. Scope 2 emissions are generated from purchased electricity. Freight Rail accounts for 80,6% of Scope 2.
Scope 3 covers employee rental cars and air travel, amounting to 10 531tCO
2e
which is down 9,2% from 11,596tCO2e in
2012/13. This is largely due to cost-cutting transport measures and expanded use of video conferencing.
A total of 176 185MWh of electricity regeneration was recorded in Freight Rail in 2013/14; an improvement of 16,6% on the previous year:
coal line regenerated 27,0% of energy consumed on a round trip between Ermelo and Richards Bay. This resulted in 76 682MWh (14,0%) energy regeneration in 2013/14.
ore line regenerated 28,0% of energy consumed on a round trip from Sishen to Saldanha. This resulted in 99 502MWh (24,0%) energy regeneration in 2013/14.
Significant energy efficiency gains have been made across the business, with annual targets being exceeded in most cases. Looking ahead to 2014/15, further energy efficiency targets have been set for each Operating Division and Transnet Property.
Total regenerated electricity
Freight Rail Traction Energy Efficiency Gain (74,0% of total electricity consumption)
176 185MWh
2,4%
TOTA L CA RBON EMISSIONS (tCO2E)
2013/14
Scope 3Scope 2Scope 1
Total: 4,24mtCO2e
3 53
1 54
8
10
53
1
69
3 4
22

71
Modal shift from road-to-rail, lowering South Africa’s carbon emissionsIt is globally known that rail transport is three to four times more efficient than road transport. In addition, rail offers cleaner, safer, cheaper and more reliable freight mobility through improved road safety, reduced road congestion and pollution, and a lower cost of doing business.
Government’s National Climate Change Response White Paper, 2011 identifies a modal shift from road-to-rail as a flagship carbon mitigation programme for South Africa. As the owner and operator of the country’s rail freight network, Transnet has undertaken to increase its rail market share to 35% by 2018/19, and to demonstrate the carbon emissions saving achieved annually through its growing market share.
Freight Rail is making a meaningful environmental contribution in the form of carbon emissions reduction in the South African transport sector. In 2013/14, Freight Rail gained market share in a number of commodity groups where there is strong competition with road hauliers. This rail tonnage gain amounts to ‘volumes
off road’. The carbon emissions savings in the top 10 road-to-rail volume gains in 2013/14 amount to 835,670tCO
2e8.
Top 10 road-to-rail volume gains for
2013/14 (April 2013 to March 2014)
Commodities
Volumes gains (tons)
Emissions avoided
(tCO2e)
Manganese
(Export Durban) 16 063 198
Coal (Eskom) 1 323 767 36 436
Chrome and
ferrochrome 618 218 70 090
Iron ore (Domestic) 566 561 134 980
Manganese
(Domestic) 108 354 38 068
Mineral mining 2 006 556 250 414
Iron and steel 107 685 26 055
Fertiliser 10 338 2 485
Intermodal
(Container) 1 734 678 276 303
Automotive 15 397 642
Total 6 507 617 835 670
8 In 2013/14, adjustments were made to the Transnet carbon calculation methodology using UCT’s Energy Research Centre’s report ‘Quantifying the energy needs of the transport sector for South Africa: A bottom-up model’ instead of the United Kingdom’s DEFRA road freight emission factor, used in 2012/13.
A carbon calculator
application has
been developed by
Transnet to assist
our customers
to calculate the
carbon emissions
benefit of moving
specific tonnages
of cargo in South
Africa by rail
instead of road.
The calculator
applies the
relevant rail
tractive power
(electric or diesel)
of each route to
calculate the
carbon footprint
of tonnage.
On 4 October 2013, Freight Rail and Imperial Logistics ratified a Memorandum of Understanding (MOU) committing to moving freight from road to rail. The partnership will facilitate the joint development of multimodal logistics services in support of Transnet’s road-to-rail strategy. This initiative will combine Freight Rail’s long-haul transportation capacity with Imperial’s road freight logistics, distribution and end-to-end value chain management. The intermodal transport strategy will concentrate chiefly on bulk commodities, a market which would be new to Imperial. Freight Rail’s Chief Executive, Siyabonga Gama said at the signing of the MOU that this initiative was aimed at benefiting the wider economy by reducing transport costs, improving safety and lowering carbon emissions. In turn, Imperial would benefit from incorporating Freight Rail’s long haul service offering into their end-to-end logistics solution.
On 22 October 2013, Freight Rail signed another MOU with Barloworld Logistics to further accelerate the implementation of shifting rail-friendly cargo from road to rail. During the signing ceremony the CEO of Barloworld Logistics stressed that it made sense in light of the ‘enormous’ distances that goods needed to travel in South Africa to reach areas of demand, and that by moving the right product onto rail, significant costs savings would be achieved.
ROAD-TO-R AIL ALLIANCES
Top 10 road-to-rail carbon emissions savings gains
835 670tCO2e
Total trucks kept off road per day (by Pipelines) between Durban and Gauteng
400

SUSTAINABILITY REPORT 201472
Reducing our risk exposure to adverse climate impacts
Climate change is predicted to affect South Africa in different ways, from increased frequency and severity of extreme weather events to changes in rainfall patterns and increased temperatures. These will influence the way that Transnet operates in the future. Transnet is therefore analysing where, how and to what degree climate change will impact its operations, and what measures can be taken to limit its vulnerability.
Transnet is in the process of developing an integrated adaptation plan to include:
vulnerabilities to current and planned operations, property and infrastructure.
and downstream markets to identify possible supply chain and customer impacts.
pathways into Transnet planning and decision-making to ensure resilience, allow for incremental transitions and where necessary to initiate change.
The adaptation plan will be aligned to and incorporated into the LTPF, risk management, capital projects, supply chain management, human resources and operational planning.
Other current initiatives include:
approach to mature sustainability
management of energy, water, biodiversity, waste and greening supply chains.
Transnet’s risk management approach.
As we are still in the process of developing the adaptation strategy, specific challenges, solutions, targets and indicators are being considered. Awareness of climate change is resulting in Transnet giving engineering design attention to climate change adaptation requirements in capital projects.
A Climate Change Policy (including both mitigation and adaptation) has been developed and is due for adoption in 2014.
Water in our value chainTransnet acknowledges that South Africa is a water scarce country and that we need to use water efficiently and effectively throughout our operations.
In 2012/13, Transnet committed to conduct water audits across all Operating Divisions. This process is still underway. In addition, internal water assessments are being conducted across Transnet and these should be concluded in 2014/15. The findings from the audits and internal assessments will inform the water management strategy to be employed by the business.
A Water Policy has been developed and is due for adoption in 2014.
ENVIRONMENTAL
DIVIDENDS (continued)
Understanding our environment

73
Looking ahead, the following water efficiency initiatives are underway:
facilities;
for consumption reading and quick leak detections;
and
repair leaks.
We continue to identify water-related risks and opportunities in our operations going forward.
Waste managementTransnet’s operations generate a variety of waste materials as by-products. These can be recovered, re-used, recycled, and disposed of if no other use can be found. Transnet acknowledges that disposal of waste is the final option in waste
management and as such, is committed to developing sustainable ways to implement waste management.
Transnet is currently focusing on ‘legacy asbestos’ and ‘hydrocarbon’ clean-ups, as follows:
Asbestos clean-up:
high risk areas continues country-wide.
undertaken at 11 high risk asbestos contaminated sites. The results are used for prioritisation of clean-up and erection of signage.
into an asbestos waste landfill site is at the Public Participation Stage of the Environmental Impact Assessment.
been cleaned up since the inception of the initiative in 2012.
major asbestos contaminated sites have been obtained.
Freight Rail is currently finalising an Environmental Impact Assessment to convert the De Aar quarry into an asbestos waste landfill site. The process is being reviewed by the public before the Environmental Impact Report is submitted to the Department of Environmental Affairs for a decision. In order to manage the potential asbestos exposure, while a suitable disposal site is explored, an ad hoc clean-up process is underway to manage resurfacing of buried asbestos fibres to prevent or minimise personnel and public exposure to the fibres. A total of 1 394 tons of asbestos had been cleaned up through this initiative since 2012.
During 2013/14, an approved asbestos inspection authority was contracted to undertake asbestos air quality assessments at 11 high risk asbestos contaminated sites. A total of 96 air samples were analysed and 176 high volume static air samples were analysed. The results indicated the presence of asbestos fibres in only 9,7% (17 samples) of the total samples (176 samples). The concentration of asbestos in
ℓ and below the South African Occupational Exposure Limit of 0,2f/mℓ.
Looking ahead to 2014/15, asbestos removal waste licences have been obtained for all major contaminated sites and these sites will be cleared once the De Aar quarry landfill site is approved and operational.
FREIGHT R AIL’S ASBESTOS CLEAN-UP PROJECT

SUSTAINABILITY REPORT 201474
Freight Rail identified various railway tracks, staging areas and fuel handling facilities that are contaminated with hydrocarbon pollution from aged locomotives, faulty fuel handling
Pollution Elimination Programme was initiated during 2012/13. To date, 68 sites have been cleaned up and rehabilitated, while three are in the process of being
Managing our biodiversity impacts Transnet acknowledges our impacts on biodiversity and the need to proactively manage and wherever possible, mitigate these impacts. In Transnet’s capital infrastructure programme, particularly mega infrastructure projects, focus is therefore placed on addressing biodiversity concerns in a strategic, systematic manner throughout the Project Lifecycle Process and strict controls are imposed.
Transnet recognises the need to initiate biodiversity investigations at an early stage during project planning.
In its plans to develop the old Durban International Airport site into a new proposed dig-out port, the Transnet team identified the need to assess the potential biodiversity implications and opportunities after an environmental sensitivity study was conducted during the conceptual phase of the project. Significant investments have been made into biodiversity investigations on the proposed site, and these will proceed as the project progresses through the project lifecycle process. Investigations which have already been initiated include:
rehabilitated. 5 200 absorbent mats have been deployed countrywide.
Pipelines reported five spills for 2013/14. The Mooi River incident occurred near a wetland and caused surface water pollution. Pipelines is currently completing the rehabilitation process to minimise negative environmental impacts of the spills.
of biodiversity on site including functionality, habitat condition, degree of alien infestation;
species on site;
community mapping; and
and refuge areas for species of special concern.
The detail of investigation relating to biodiversity at such an early stage in project planning is testimony to Transnet’s commitment and improved understanding of the organisation’s impacts on biodiversity and acknowledgement that such impacts need to be assessed as an inherent component of the project lifecycle process.
These principles will continue to be applied in the development and roll out of our infrastructure development portfolio in upholding Transnet’s vision to have due consideration for sustainability in everything that we do.
Date Location Product Volume (ℓ) Cause
3 July 2013 Ladysmith depot Refined 30 000* Operational
10 September 2013
Mooi River – Arrochar Farm Petrol 480 000 Third party
2 October 2013 Stilfontein Diesel 260 000 Third party
22 December 2013 Alrode Diesel 80 000 Mechanical failure
19 March 2014 Magdala Diesel 54 603 Pipeline integrity
* Approximate – < 1% of actual flow.
Details of Pipeline spills 2013/14
ENVIRONMENTAL
DIVIDENDS (continued)

75
APPENDIX A:
EXTER NAL ASSUR ANCE STATEMENT
Independent assurance provider’s report to the Directors of Transnet on selected key performance indicators disclosed in the Sustainability Report prepared in accordance with the Global Reporting Initiative (GRI) G4 guidelines
1. IntroductionWe have undertaken an independent limited assurance engagement for Transnet SOC Ltd (Transnet) on selected sustainability information reported in Transnet’s Sustainability report (the report) as described below for the year ended 31 March 2014. The King Code advocates that sustainability reporting and disclosure should be independently assured. SizweNtsalubaGobodo (SNG) provided limited assurance on selected sustainability key performance indicators outlined in section 3 of this report and this is reported in accordance with the terms of engagement of the scope change letter.
2. Independence, expertise and quality controlWe have complied with the Code of Ethics for Professional Accountants issued by the International Federation of Accountants (IFAC), which includes comprehensive independence and other requirements founded on fundamental principles of integrity, objectivity, professional competence and due care, confidentiality and professional behaviour. Our engagement was conducted by a multi-disciplinary team of health, safety, social, environmental and assurance specialists with extensive experience in sustainability reporting.
SNG maintains a comprehensive system of quality control including documented policies and procedures regarding compliance with ethical requirements, professional standards and applicable legal and regulatory requirements.
3. Subject matter and assurance We were required to provide limited assurance that the following selected sustainability key performance indicators were prepared in accordance with the GRI G4 guidelines:
Economic dividends:
investment, capital amount invested in the expansion of infrastructure and equipment, capital amount invested in maintaining existing capacity) (page 33);
(total spend on skills development as a percentage of the wage bill) (page 47);
cash generated from operations, cash interest cover ratio, gearing ratio) (page 33);
a percentage of total measurable procurement spend; B-BBEE spend on black-owned enterprises) (page 50).
Social dividends:
statistics (total allegations, total unfounded, total founded) (page 18);
as a percentage of the workforce; female employees as a percentage of the workforce; people with disabilities as a percentage of the workforce) (page 56);
frequency rate (DIFR), employee and public fatalities; loss incidences, derailments) (page 61);
(page 63);
Environmental dividends:
diesel traction fuel consumption; on road vehicle fuel consumption; home based fuel (page 69);
2 emissions
(page 70).
4. Directors’ responsibilitiesThe directors are responsible for the selection, preparation and presentation of the sustainability information. This responsibility includes the identification and stakeholder requirements, for

SUSTAINABILITY REPORT 201476
APPENDIX A:
EXTER NAL ASSUR ANCE STATEMENT(continued)
determination of material issues, for commitments with respect to sustainability performance and for the design, implementation and maintenance of internal control systems from which the reported information is derived, to ensure that the preparation of the report is free from material misstatement, whether due to fraud or error.
5. Our responsibilityOur responsibility is to express an independent assurance conclusion on the selected key performance indicators based on the procedures we have performed and the evidence we have obtained. We conducted our limited assurance engagement in accordance with the International Standard on Assurance Engagements (ISAE) 3000, Assurance Engagements other than Audits or Reviews of
issued by the International Auditing and Assurance Standards Board. This Standard requires that we plan and perform our engagement to obtain limited assurance about whether the selected key performance indicators are free from material misstatement.
A limited assurance engagement undertaken in accordance with ISAE 3000 involves assessing the suitability in the circumstances of Transnet’s use of the GRI G4 guidelines as the basis of preparation for the selected key performance indicators, assessing the risks of material misstatement of the selected key performance indicators whether due to fraud or error, responding to the assessed risks as necessary in the circumstances, and evaluating the overall presentation of the selected key performance indicators. Our procedures included the understanding of risk assessment procedures, internal control, and the procedures performed in response to the assessed risks. The procedures we performed were based on our professional judgement and included enquiries, observation of processes performed, inspection of documents,
analytical procedures, evaluating the appropriateness of quantification methods and reporting policies, and agreeing or reconciling with underlying records.
6. Summary of work performedGiven the circumstances of the engagement, in performing the procedures listed above we:
senior executives to obtain an understanding of the internal control environment, risk assessment process and information systems relevant to the sustainability reporting process;
corroborate the statements obtained from management and senior executives in our interviews;
has in place for determining material selected key performance indicators to be included in the report;
to generate, collate, aggregate, monitor and report on the selected key performance indicators;
documentation on a sample basis and performed analytical procedures to evaluate the data generation and reporting processes against the reporting criteria;
appropriateness of significant estimates and judgments made by management in the preparation of the key performance indicators;
undertook visits to Transnet Freight Rail, Transnet Engineering, Transnet Pipelines, Transnet Port Terminals,
Kinross, City Deep Inland Container Terminal;
performance indicators presented in the report is consistent with our overall knowledge and experience of sustainability management and performance at Transnet.

77
7. ConclusionIn our opinion, based on the procedures we have performed and the evidence we have obtained, nothing has come to our attention that causes us to believe that the selected key performance indicators as set out in the subject matter paragraph for the year ended 31 March 2014 are not prepared, in all material respects, in accordance with GRI G4 guidelines.
8. Comparability No assurance procedures were performed on the previous sustainability report. The information relating to the prior reporting periods has not been subject to assurance procedures.
9. Other matters Our report does not extend to any disclosures or assertions relating to future performance plans and/or strategies disclosed in the report.
The maintenance and integrity of the Transnet’s website is the responsibility of Transnet’s management. Our procedures did not involve consideration of these matters and accordingly we accept no responsibility for any changes to either the information in the report or our independent assurance report that may have occurred since the initial date of presentation on the Transnet website.
10. Restriction of liabilityOur work has been undertaken to enable us to express the conclusions on the selected sustainability information to the directors of Transnet in accordance with the terms of our engagement and for no other purpose. We do not accept or assume liability to any party other than Transnet, for our work, for this report, or for the conclusion we have reached.
Collins Mashishi
15 May 2014

SUSTAINABILITY REPORT 201478
TransnetbecamesignatorytotheUNGCon6July2012committingtheCompanytothe10universalprinciplesoftheUNGCandreflectingtheimportancethattheTransnetBoardandExecutiveplaceongoodcorporatecitizenship. Transnet is committed to upholding fundamental human rights, ensuring fair labour practices, workingagainstcorruptioninallitsforms,andprotectingthenaturalenvironmentwithinwhichitoperates.Furtherpoliciesarebeingdevelopedwherenecessarytoconfirmandenhancetheapplicationofthesecommitments.
UNGC principle Transnet’s support of UNGC’s principles
HUMAN RIGHTSPrinciple 1
Businessesshouldsupportand respect the protection of internationally proclaimedhumanrights;and
Principle 2
Makesurethattheyarenot complicit in human rights abuses.
TransnetsupportstheUniversalDeclarationofHumanRights.HumanrightsconstitutethecornerstoneofSouthAfrica’sdemocracy.TransnetisboundbytheConstitutionoftheRepublicofSouthAfricawhichcontainstheBillofRightsandalllawsreflectthis.TransnetasaSOC,isconsciousoftheimportanceofhumanrightsandtheneedtoensurethatworkpractices,rulesandpoliciessupporttheprotectionoftheserights.
ThroughTransnet’sCodeofEthics(theCode),respectforhumanrightsisupheldbothinternallyandexternallywithstakeholders.AllemployeesareboundbytheCodeandareguided in the honesty, respect and integrity of their behaviour. Transnet’s service providers,suppliersandtradepartnersarealsoboundbytheCode.TheCodewasreviewedin2013toextendthescopetoNon-executiveDirectors.Transnet’sCultureCharterfurtherentrencheshumanrightsintheCompanythroughitsfocusondignityand respect.
Transnetiscommittedtotheprinciplesofequityandanti-discrimination,andisfurthercommitted to providing employment for all demographics, not just for the sake of diversity,buttobetterempowerdesignatedgroups.TransnetiscommittedtoimprovedemploymentequityparticularlyforwomenandPeoplewithDisabilitieswherethelatterhasshownasignificantimprovementfrom0,8%in2011/12to1,6%in2013/14.
Transnetaimstotransformitssupplierbasethroughitsprocurementspendwith94,4%oftotalmeasurableprocurementspendonB-BBEEfor2013/14.
ThroughitsCSIprogramme,morespecificallythePhelophepahealthtrains,TransnetisassistingSouthAfricaachievetheMillenniumDevelopmentGoalsofreducingchildmortality,improvingmaternalhealth,andcombattingHIV/Aids,malariaandotherdiseases.Inaddition,theOrphanedYouthProgrammeisaimedatgivingequalaccesstoeducation to orphaned youth.
LABOURPrinciple 3
Businessesshouldupholdthe freedom of association and the effective recognition of the right to collectivebargaining;
Principle 4
The elimination of all forms of forced and compulsorylabour;
Principle 5
The effective abolition of childlabour;and
Principle 6
The elimination of discrimination in respect of employment and occupation.
Transnet practices freedom of association and recognises the right to collective bargainingasprescribedintheConstitutionoftheRepublicofSouthAfricaandsetoutspecificallyintheSouthAfricanLabourRelationsAct,1995(ActNo66of1995).Transnetemployees’rightstocollectivebargainingareregulatedbytheTransnetRecognitionAgreementwhichdefines,amongstotherissues,unionrights;thresholdsforunionrecognition;disputeresolution;shopstewardrepresentation;rolesandrights;andconsultativestructures.TransnethaswellestablishedpracticesofcollectivebargainingintheTransnetBargainingCouncilwhichhasitsownconstitutiondefiningtheprocedurestobefollowedforcollectivebargaining.
SouthAfricaisasignatorytotheInternationalLabourOrganisation(ILO)convention,asapplicable to fair labour practices, and South Africa has a plethora of labour legislation thatreflectstheILOstandards.Transnethumanresourcespoliciesandpracticesreflecttheselegislativeprovisions.SouthAfricanlawprohibitsforced,compulsoryandchildlabour.
The right to fair labour practice is articulated in various human rights policies, guidelines andworkplacepracticesthatclearlydefineandarticulatethevariousaspectsthatenableandcreateafairworkplaceenvironment.Humanresourcespolicies,theprimarymanagementtool,areregularlyreviewedandexpandedtoensurethatemployeerightsintheworkplacearefairlyandobjectivelymanaged.Managementandtheunionsengageonalldraftpolicies,amendmenttopoliciesandtheidentificationofareaswhereemployeerightsarenotclearlydefinedoreffectivelyprotected.Variousmechanismsfortheidentification of potential violation of employee rights are in place.
APPENDIX B: UNITED NATIONS GLOBAL COMPACT TABLE

79
UNGC principle Transnet’s support of UNGC’s principles
LABOUR (continued) Transnet, through its Employment Equity Plan, is committed to employment equity principles namely, the elimination of unfair discrimination and implementation of affirmative action measures to achieve a workforce that reflects the national economically active population of South Africa across all occupational levels. Transnet adheres to The Promotion of Equality and Prevention of Unfair Discrimination Act, 2000 (Act No 4 of 2000), and the Skills Development Act, 1998 (Act No 97 of 1998). Transnet has both a B-BBEE Policy and Strategy. Transnet exceeded its targets for black employees across all occupational levels in 2013/14 while women representation is growing steadily with top, senior, professional and skilled technical representation well above 28%. Transnet invested a total of 3% of the wage bill (R621 million) in the training of employees during 2013/14.
Through its staff wellness programme, Transnet assists employees with health risk
awareness; and safety risk assessments. For medically uninsured employees who test
ENVIRONMENTPrinciple 7
Businesses should support a precautionary approach to environmental challenges;
Principle 8
Undertake initiatives to promote greater environmental responsibility; and
Principle 9
Encourage the development of diffusion of environmentally friendly technologies.
Transnet complies with all environmental regulations prescribed in terms of the National Environmental Management Act, 1998 (Act No. 107 of 1998), including the diligent execution of environmental impact assessments in all capital projects, air quality control, pollution control, waste management and coastal environmental management.
During 2013/14, Transnet made progress with respect to climate change mitigation. An Energy Security and Carbon Mitigation Strategy for the period up to 2040 was developed and is currently being implemented throughout the organisation. The aim is to minimise security of energy supply risks, energy costs and emissions from energy use. Focus on modal shift from road-to-rail delivered carbon emissions savings of 835 670tCO
2e in the
top 10 road-to-rail volume gains. A carbon calculator was developed to measure the carbon emissions benefit of moving specific tonnages of cargo from specific origins to destinations in South Africa by rail instead of road.
Since 2011/12 (baseline year indicating when energy efficiency measures were instituted) total electricity consumption has decreased by 7,0% from 3 798 908kWh to 3 554 529kWh in 2013/14. The ISO 50001 energy management system is currently being implemented across all Operating Divisions and Transnet Property. This provides a formal structure to enable the effective implementation of energy efficiency initiatives and alternative energy supplies. Significant energy efficiency gains of 176 185MWh were achieved through regenerative braking in new locomotives.
Sustainable energy options for Transnet equipment is currently being explored by the R&D unit in Engineering which focuses on the operationalisation of new, relevant technologies. Options include: second generation biofuels for diesel locomotives and port equipment; natural gas as a fuel source for locomotives and other equipment; fuel cells on locomotives; wagon covers to reduce energy loss through drag effects; and harnessing wasted energy by capturing and re-using heat from exhaust systems.

SUSTAINABILITY REPORT 201480
UNGC principle Transnet’s support of UNGC’s principles
ANTI-CORRUPTIONPrinciple 10
Businesses should work against corruption in all its forms, including extortion and bribery.
Transnet supports the United Nations Convention against Corruption and is committed to the highest standards of corporate governance as espoused in King III, the Companies Act, and the Public Finance Management Act. Transnet is committed to zero tolerance of all forms of fraud and corruption, including extortion and bribery. This commitment is reflected in the following:
Company representatives engaging with external parties.
the Board, which requires the disclosure of personal financial interests, direct or indirect personal or private business interests on an annual basis. All employees sign confidentiality and ‘declaration of interest’ forms when adjudicating on procurement panels.
ensures that effective mechanisms are in place to prevent, detect and report instances of fraud and corruption.
and anti-corruption efforts. The hotline is managed by Internal Audit and all reported cases are investigated through an established forensics investigation process. Transnet employees are protected from victimisation by the Transnet Whistle Blowing Policy.
replaced Transnet’s Supplier Code of Conduct. Each party agrees to avoid all forms of dishonesty, fraud and corruption including practices that are anti-competitive in nature, negotiations made in bad faith and under-pricing by following a system that is fair, transparent and free from any influence/unprejudiced dealings prior to, during and subsequent to the currency of the contract to be entered into.
APPENDIX B:
UNITED NATIONS GLOBAL COMPACT TABLE(continued)

81
General Standard Disclosures Reference Page
Strategy and analysis
G4-1
Provide a statement from the most senior decision-maker of the organisation (such as CEO, chair, or equivalent senior position) about the relevance of sustainability to the organisation and the organisation’s strategy for addressing sustainability.
Sustainability at Transnet – Executive statement and approval
2-3
Organisational profile
G4-3
Report the name of the organisation.
Sustainability at Transnet – Our sustainability context
1
G4-4
Report the primary brands, products, and services.
About Transnet – Who we are
5
G4-5
Report the location of the organisation’s headquarters.
About Transnet – Who we are
5
G4-6
Report the number of countries where the organisation operates, and names of countries where either the organisation has significant operations or that are specifically relevant to the sustainability topics covered in the report.
About Transnet – Where we operate and what we do
5-6
G4-7
Report the nature of ownership and legal form.
About Transnet – Who we are
5
G4-8
Report the markets served (including geographic breakdown, sectors served, and types of customers and beneficiaries).
About Transnet – Where we operate and what we do
5
About Transnet – Conditions under which we operate
16
About Transnet – Our business model: Group
11
G4-9
Report the scale of the organisation, including:
(for public sector organisations)
(for private sector organisations)
About Transnet – Where we operate and what we do
7
About Transnet – Our Business Model-Operating Divisions
11
Integrated Report 49
AFS 12
G4-12
Describe the organisation’s supply chain
About Transnet – Our business model: Group
11
About Transnet – Our Supply Chain
8
APPENDIX C:
GLOBAL R EPORTING INITIATIVE TABLE

SUSTAINABILITY REPORT 201482
General Standard Disclosures Reference Page
G4-13
Report any significant changes during the reporting period regarding the organisation’s size, structure, ownership, or its supply chain.
About Transnet – Conditions under which we operate
16
G4-15
List externally developed economic, environmental and social charters, principles, or other initiatives to which the organisation subscribes or which it endorses
About the sustainability report – Reporting frameworks
4
G4-16
List memberships of associations (such as industry associations) and national or international advocacy organisations in which the organisation:
dues
This refers primarily to memberships maintained at the organisational level.
Sustainability at Transnet – Our sustainability context
1
Identified material aspects and boundaries
G4-17
(a) List all entities included in the organisation’s consolidated financial statements or equivalent documents.
(b) Report whether any entity included in the organisation’s consolidated financial statements or equivalent documents is not covered by the report.
Appendix E: Transnet Sustainability Framework material aspects’ boundaries (notes)
91
G4-18
(a) Explain the process for defining the report content and the aspect boundaries.
(b) Explain how the organisation has implemented the reporting principles for defining report content.
Material issues – Material issues determination process
19-28
About the sustainability report
4
Appendix D: Correlation between the Transnet Sustainability Framework and the material issues identified
90
Appendix E: Transnet Sustainability Framework material aspects’ boundaries
91
G4-19
List all the material aspects identified in the process for defining report content.
Material issues – Material issues determination process
19-28
Appendix D: Correlation between the Transnet Sustainability Framework and the material issues identified
90
Appendix E: Transnet Sustainability Framework material aspects’ boundaries
91
APPENDIX C:
GLOBAL R EPORTING INITIATIVE TABLE(continued)

83
General Standard Disclosures Reference Page
G4-20
For each material aspect, report the aspect boundary within the organisation, as follows:
organisation
organisation (as described in G4-17), select one of the following two approaches and report either 1). The list of entities or groups of entities included in G4-17 for which the aspect is not material or 2). The list of entities or groups of entities included in G4-17 for which the Aspect is material
outside the organisation.
Appendix E: Transnet Sustainability Framework material aspects’ boundaries
91
G4-21
For each material aspect, report the aspect boundary outside the organisation, as follows:
organisation
the entities, groups of entities or elements for which the aspect is material. In addition, describe the geographical location where the aspect is material for the entities identified
outside the organisation.
Appendix E: Transnet Sustainability Framework material aspects’ boundaries
91
G4-22
Report the effect of any restatements of information provided in previous reports, and the reasons for such restatements.
About the sustainability report – Reporting philosophy and approach
4
G4-23
Report significant changes from previous reporting periods in the scope and aspect boundaries.
About the sustainability report – Reporting philosophy and approach
4
Stakeholder engagement
G4-24
Provide a list of stakeholder groups engaged by the organisation.
Material issues – Stakeholder engagement
21
G4-25
Report the basis for identification and selection of stakeholders with whom to engage.
Material issues – Stakeholder engagement
21
G4-26
Report the organisation’s approach to stakeholder engagement, including frequency of engagement by type and by stakeholder group, and an indication of whether any of the engagement was undertaken specifically as part of the report preparation process.
Material issues – Stakeholder engagement
21
G4-27
Report key topics and concerns that have been raised through stakeholder engagement, and how the organisation has responded to those key topics and concerns, including through its reporting. Report the stakeholder groups that raised each of the key topics and concerns.
Material issues – Stakeholder engagement
21-26

SUSTAINABILITY REPORT 201484
General Standard Disclosures Reference Page
Report profile
G4-28
Reporting period (such as fiscal or calendar year) for information provided.
About the Sustainability Report – Reporting philosophy and approach
4
G4-29
Date of most recent previous report (if any).
About the Sustainability Report – Reporting philosophy and approach
4
G4-30
Reporting cycle (such as annual, biennial).
About the Sustainability Report – Suite and interaction between reports
4
G4-31
Provide the contact point for questions regarding the report or its contents.
About the Sustainability Report – Suite and interaction between reports
4
G4-32
(a) Report the ‘in accordance’ option the organisation has chosen
About the Sustainability Report – Reporting Frameworks
Transnet has not fulfilled all the requirements of Core ‘in
this report contains standard disclosures from the GRI Reporting Guidelines
4
(b) Report the GRI Content Index for the chosen option Appendix C: Global Reporting Initiative Table
82
(c) Report the reference to the External Assurance Report Appendix A: External Assurance Statement
76
G4-33
(a) Report the organisation’s policy and current practice with regard to seeking external assurance for the report.
About the Sustainability Report – Reporting philosophy and approach
4
(b) If not included in the assurance report accompanying the sustainability report, report the scope and basis of any external assurance provided.
Scope and basis of external assurance provided is referred to in Appendix A: External Assurance Statement
76
(c) Report the relationship between the organisation and the assurance providers.
The assurance provider is an Independent external assurance provider. Refer to Appendix A: External Assurance Statement
76
(d) Report whether the highest governance body or senior executives are involved in seeking assurance for the organisation’s sustainability report.
About Transnet-Governance and assurance – Governance in the context of sustainability at Transnet
17
APPENDIX C:
GLOBAL R EPORTING INITIATIVE TABLE(continued)

85
General Standard Disclosures Reference Page
Governance
G4-34
Report the governance structure of the organisation, including committees of the highest governance body. Identify any committees responsible for decision-making on economic, environmental and social impacts.
About Transnet-Governance and Assurance: Governance in the context of sustainability at Transnet
17
Integrated Report 16
AFS 138
Ethics and Integrity
G4-56
Describe the organisation’s values, principles, standards and norms of behaviour such as codes of conduct and codes of ethics.
About Transnet-Ethics and integrity
18
G4-58
Report the internal and external mechanisms for reporting concerns about unethical or unlawful behaviour, and matters related to organisational integrity, such as escalation through line management, whistleblowing mechanisms or hotlines.
About Transnet-Ethics and integrity
18
Note: There were no omissions for general standard disclosures.
There was no external assurance of general standard disclosures.

SUSTAINABILITY REPORT 201486
Specific Standard Disclosures
Material aspects DMA and Indicators Reference Omission
External
assurance
Section Page Assured
Economic
G4–EC1Direct economic value generated and distributed
Sustainability Performance Review – Economic Dividends
30
Integrated Report 132
Cost-effective freight logistics infrastructure ahead of demand
DMA Sustainability Performance Review– Economic Dividend: Cost-effective freight logistics and infrastructure ahead of demands and a financially stable business, able to raise and service debt, reinvest revenues and pursue agreements with private parties to optimise investment and services
31
Transnet Specific Indicator: Total Capital Investment
33
A financially stable business, able to raise and service debt, reinvest revenues and pursue agreements with private parties to optimise investment and services
DMA 31
Transnet Specific Indicator: Financial Performance
– Total assets
– Cash generated from operations
– Total cash interest cover ratio
– Total funding raised
– Gearing ratio
– Funding requirement
33
Reliable and efficient rail, port and pipeline services
DMA Sustainability Performance Review – Economic Dividend: Reliable and efficient rail, port and pipeline services
34
Transnet Specific Indicator: General Freight BusinessTFR:
– Capital Investment
– Locomotive efficiency
– On-time departures
– On-time arrivals
TE:– Train cancellations due to traction
– Traction days
36
Transnet Specific Indicator: Export CoalTFR:
– Capital Investment
– Locomotive efficiency
– On-time departures
– On-time arrivals
TE:– Train cancellations due to traction
– Traction days
TNPA:– Ship turnaround time (RBCT)
37
Transnet Specific Indicator: Export Iron OreTFR:
– Capital Investment
– Locomotive efficiency
– On-time departures
– On-time arrivals
TE:– Train cancellations due to traction
– Traction days
TNPA:– Ship turnaround time (Saldanha)
38
APPENDIX C:
GLOBAL R EPORTING INITIATIVE TABLE(continued)
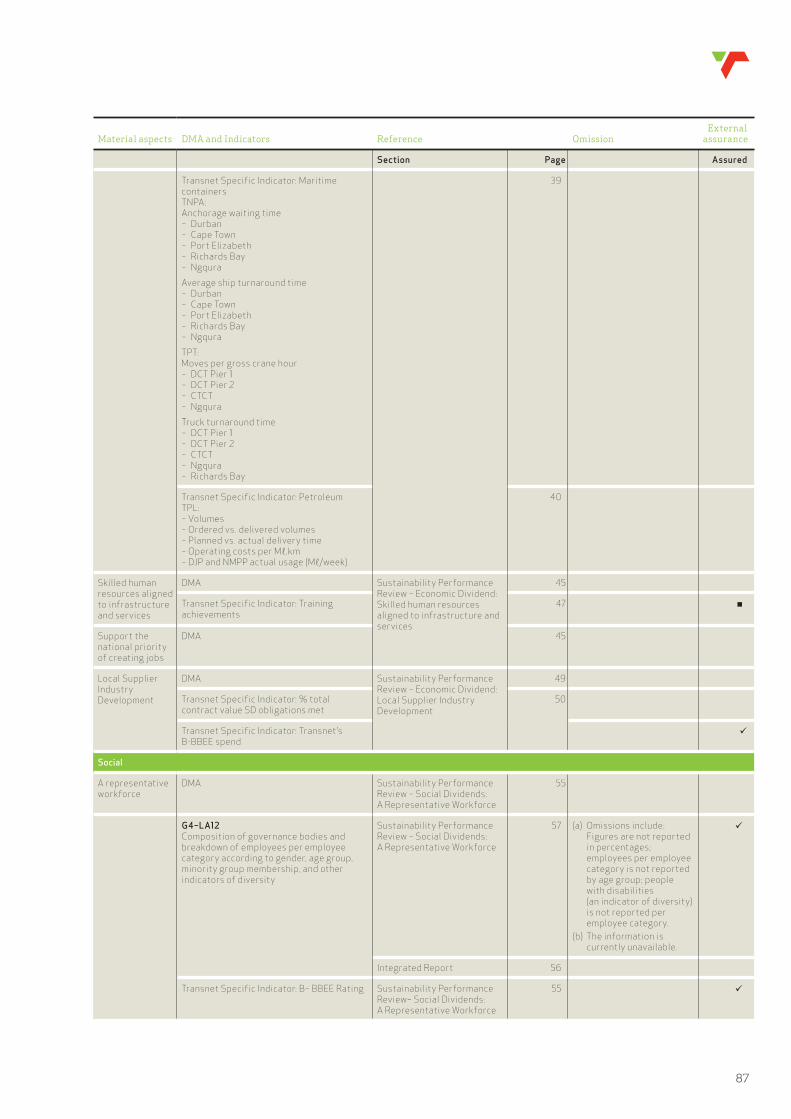
87
Material aspects DMA and Indicators Reference Omission
External
assurance
Section Page Assured
Transnet Specific Indicator: Maritime containersTNPA:Anchorage waiting time– Durban– Cape Town– Port Elizabeth– Richards Bay– Ngqura
Average ship turnaround time– Durban– Cape Town– Port Elizabeth– Richards Bay– Ngqura
TPT:Moves per gross crane hour– DCT Pier 1– DCT Pier 2– CTCT– Ngqura
Truck turnaround time– DCT Pier 1– DCT Pier 2– CTCT– Ngqura– Richards Bay
39
Transnet Specific Indicator: PetroleumTPL:
– Ordered vs. delivered volumes– Planned vs. actual delivery time– Operating costs per M .km– DJP and NMPP actual usage (M /week)
40
Skilled human resources aligned to infrastructure and services
DMA Sustainability Performance Review – Economic Dividend: Skilled human resources aligned to infrastructure and services
45
Transnet Specific Indicator: Training achievements
47 ¬
Support the national priority of creating jobs
DMA 45
Local Supplier Industry Development
DMA Sustainability Performance Review – Economic Dividend: Local Supplier Industry Development
49
Transnet Specific Indicator: % total contract value SD obligations met
50
Transnet Specific Indicator: Transnet’s B-BBEE spend
Social
A representative workforce
DMA Sustainability Performance Review – Social Dividends: A Representative Workforce
55
G4–LA12Composition of governance bodies and breakdown of employees per employee category according to gender, age group, minority group membership, and other indicators of diversity
Sustainability Performance Review – Social Dividends: A Representative Workforce
57 (a) Omissions include: Figures are not reported in percentages; employees per employee category is not reported by age group; people with disabilities (an indicator of diversity) is not reported per employee category.
(b) The information is currently unavailable.
Integrated Report 56
Transnet Specific Indicator: B– BBEE Rating Sustainability Performance Review– Social Dividends: A Representative Workforce
55

SUSTAINABILITY REPORT 201488
Material aspects DMA and Indicators Reference Omission
External
assurance
Section Page Assured
Safety of all people who come into contact with our operations
DMA Sustainability Performance Review– Social Dividend: Safety of all people who come into contact with our operations
59
G4–LA5Percentage of total workforce represented in formal joint management–worker health and safety committees that help monitor and advise on occupational health and safety programmes
60
G4–LA6Type of injury and rates of injury, occupational diseases, lost days, and absenteeism, and total number of work– related fatalities, by region and by gender
61 (a) Omissions include: While Injury rate and work– related fatalities are reported they are not reported by region and gender, and are not reported for contractors; Types of injury, occupational diseases rate, lost day rate and absentee rate is not reported for employees or contractors.
(b) The information is currently unavailable.
¬
G4–LA7Workers with high incidence or high risk of diseases related to their occupation
61
G4–LA8
agreements with trade unions
60-61
Transnet Specific Indicator: Public fatalities 61
Transnet Specific Indicator: Loss incidents 61
Transnet Specific Indicator: Derailments 61
Environmental
Access to secure and affordable energy, which allows for a reduction in our
and for future growth
DMA Sustainability Performance Review– Environmental: Access to secure and affordable energy, which allows for a reduction in our
growth
66
G4–EN3Energy consumption within the organisation
69-70 (a) Omissions include: total fuel consumption from renewable fuel sources; total heating, cooling and steam consumption; total electricity, heating, cooling and steam sold; the standards, methodologies and assumptions used; and the source of the conversion factors. Fuel data is not reported in joules.
(b) Parts of this indicator are not applicable to Transnet. No fuel is sourced from renewable sources. Electricity (sold), heating, cooling and steam (sold and consumed) does not apply to Transnet or their primary products and services. Parts of the indicator the require information that is currently unavailable.
¬
APPENDIX C:
GLOBAL R EPORTING INITIATIVE TABLE(continued)

89
Material aspects DMA and Indicators Reference Omission
External
assurance
Section Page Assured
G4–EN15
(Scope 1)
70 (a) Omissions include: gases included in the calculation; biogenic emissions; chosen base year (including rational for choosing one); standards, source of emission factors.
(b) The biogenic emissions have been excluded as they do not apply to Transnet as there is no combustion of biologically based material in the production and delivery of their products and services. The other information required by this indicator is not currently available.
G4–EN16
emissions (Scope 2)
70 (a) Omissions include: gases included in the calculation; chosen base year (including rational for choosing one); source of emission factors.
(b) The information required by this indicator is not currently available.
G4–EN17
emissions (Scope 3)
70 (a) Omissions include: gases included in the calculation; biogenic emissions; other indirect emissions categories; chosen base year (including rational for choosing one); source of emission factors.
(b) The biogenic emissions and other indirect emissions categories have been excluded as they do not apply to Transnet. The other information required by this indicator is not currently available.
Transnet Specific Indicator: Regenerated electricity
70
Transnet Specific Indicator: Electricity and fuel efficiency
70
indicator has been externally assured by SNG¬ part of indicator has been externally assured by SNG

SUSTAINABILITY REPORT 201490
Transnet Sustainability Framework
Alignment to:
GRI G4 aspects
Transnet issue (where not directly
covered by G4)
Material issues as
disclosed in IR 2014
Economic dividends
Cost-effective freight logistics infrastructure ahead of demand
G4 aspect: indirect economic impacts
Reliable and efficient rail, port and pipeline services
Transnet issue: reliable and efficient rail, port and pipeline services and incident
management
Skilled human resources aligned to infrastructure and services
Transnet issue: skilled human resources aligned to infrastructure and services and within budget
Local supplier industry development G4 aspect: procurement practices
Job creation G4 aspect: economic performance and indirect economic impacts capability
Rural development G4 aspect: indirect economic impacts
Regional integration Transnet issue: regional integration
A financially stable business, able to raise and service debt, reinvest revenues and pursue agreements with private parties to optimise investment and services
G4 aspect: economic performance and indirect economic impacts
and within budget
capability
Social dividends
Good governance, accountability and transparency
Transnet issue: good governance, accountability and transparency
Zero tolerance of fraud and corruption G4 aspect: anti-corruption
A representative workforce G4 aspect: diversity and equal-opportunitycapability
Safety G4 aspect: occupational health and safetyand incident management
Staff wellness G4 aspect: occupational health and safety
Broad-based black economic empowerment Transnet issue: broad-based black economic empowerment
Corporate social investment G4 aspect: economic performance and indirect economic impacts
Community benefits Transnet issue: community benefits
Proactive stakeholder engagement Transnet issue: proactive stakeholder engagement
Environmental dividends
Modal shift from road to rail, lowering South Africa’s carbon emissions
Transnet issue: modal shift from road to rail, lowering South Africa’s carbon emissions
Energy efficiency G4 aspect: energyand incident management
Climate change mitigation G4 aspect: emissionsand incident management
Climate change adaptation G4 aspect: economic performance
Water use efficiency G4 aspect: water
Waste management optimisation G4 aspect: effluents and waste
Biodiversity enhancement G4 aspect: biodiversity
APPENDIX D: COR R ELATION BETWEEN THE TR ANSNET SUSTAINABILITY FR AMEWOR K AND THE MATERIAL ISSUES IDENTIFIED

91
The material issues determination process (refer page 19 for detail of this process) informed the selection of material aspects and defined the following entities which can materially impact Transnet’s performance on the material aspects.
Transnet Sustainability Framework material aspect
Material to
Transnet Group$
Material to External Entities
Customers# Suppliers#
Business Partners# Communities# Environment#
Economic dividends
Cost-effective freight logistics infrastructure ahead of demand
Reliable and efficient rail, port and pipeline services
Skilled human resources aligned to infrastructure and services
Local supplier industry development*
Job creation*
A financially stable business, able to raise and service debt, reinvest revenues and pursue agreements with private parties to optimise investment and services
Social dividends
A representative workforce*
Safety*
Environmental dividends
Energy efficiency*
Climate change mitigation*
Notes Aspect is material to entity if the entity can materially impact Transnet’s performance.
* Specific limitation to reporting on aspect within external boundary due to lack of information from stakeholders.# Stakeholders may also be located internationally.$ Transnet Group denotes the five Operating Divisions and three Specialist Units. Transnet SOC Ltd also has holdings in local subsidiaries, international subsidiaries,
joint ventures and associates. For a list of all entities included in the organisation’s financial statements refer to the publically available financial statements for the financial year ending 31 March 2014.
APPENDIX E: TR ANSNET SUSTAINABILITY FR AMEWOR K MATERIAL ASPECTS’ BOUNDARIES

SUSTAINABILITY REPORT 201492
AA AccountAbility
B-BBEEBroad-based Black Economic Empowerment
CABContainer and Automotive Business Unit
CAP Container Assistance Programme
CAPEX Capital Expenditure
CDP Carbon Disclosure Project
CNR China North Rail
CSDPCompetitive Supplier Development Programme
CSI Corporate Social Investment
CSR China South Rail
CTCT Cape Town Container Terminal
DCT Durban Container Terminal
DIFR Disabling Injury Frequency Rate
DJP Durban-Johannesburg Pipeline
DPE Department of Public Enterprises
DTI Department of Trade and Industry
ED Enterprise Development
EE Employment Equity
EELNEnergy Efficiency Leadership Network
EIA Environmental Impact Assessment
ERM Enterprise Risk Management
FEL Front-end Loading
FRMP Fraud Risk Management Plan
GCE Group Chief Executive
GCH
GCI Group Capital Integration
GDP Gross Domestic Product
GFB General Freight Business
GHG Greenhouse Gas
GRI Global Reporting Initiative
HDI
IR Integrated Report
iSCM Integrated Supply Chain Management
ISDIndustrialisation Supplier Development
KPI Key Performance Indicator
KWh Kilowatt hour
LTPF Long-term Planning Framework
MDS Market Demand Strategy
MOU Memorandum of Understanding
mt million tonnes
mtCO2emillion tonnes of Carbon Dioxide equivalent
MWh Megawatt hour
NDP National Development Plan
NER SANational Energy Regulator of South Africa
NGP National Growth Path
NMPP New Multi-product Pipeline
NSF National Skills Fund
OEM Original Equipment Manufacturer
PCM Process Control Manual
PICCPresidential Infrastructure Coordinating Commission
PPPFAPreferential Procurement Policy Framework Act
PSP Private Sector Participation
RCBT Richards Bay Coal Terminal
R&D Research and Development
REMSECRemuneration, Social and Ethics Committee
RMO Results Management Office
RSR Railway Safety Regulator
SAPS South African Police Services
SD Supplier Development
SDP Supplier Development Plan
SHEQ
SIP Strategic Infrastructure Project
SMMESmall, Medium and Micro-enterprises
SNG SizweNtsalubaGobodo
SOC State-owned Company
SR Sustainability Report
tCO2eTonnes of Carbon Dioxide equivalent
TEU Twenty-foot Equivalent Unit
TOMSTransnet Occurrence Management System
TTT Truck Turnaround Time
UNGC United Nations Global Compact
ABBR EVIATIONS AND ACRONYMS

Executive directorsB Molefe (Group Chief Executive), A Singh (Group Chief Financial Officer).
Independent non-executive directorsME Mkwanazi (Chairperson), MA Fanucchi,
N Moola, NR Njeke, IM Sharma, IB Skosana, ZE Tshabalala, DLJ Tshepe.
Group Company SecretaryMs ANC Ceba
47th Floor, Carlton Centre 150 Commissioner StreetJohannesburg, 2001.
PO Box 72501Parkview, 2122South Africa.
AuditorsSizweNtsalubaGobodo Inc. 20 Morris Street East Woodmead Johannesburg, 2191.
With effect from 1 August 2013, the Company’s internal audit function has been outsourced to SekelaXabiso (Pty) Ltd, Nkonki Inc. and KPMG Services (Pty) Ltd.
SekelaXabiso (Pty) Ltd has its business address at:
1st Floor Building 22BThe Woodlands Office Park20 Woodlands DriveWoodmeadJohannesburg
Nkonki Inc. has its business address at:
3 Simba RoadSunninghillJohannesburg
KPMG Services (Pty) Ltd has its business address at:
85 Empire RoadParktownJohannesburg
Transnet SOC Ltd47th Floor, Carlton Centre
150 Commissioner Street
Johannesburg2001
Incorporated in the Republic of South Africa.
Registration number 1990/000900/30.
COR POR ATE INFOR MATION
9 1 9

WWW.TRANSNET.NET