2014 telecommunications market survey report …...overall satisfaction across ict services base:...
TRANSCRIPT

9 FEBRUARY 2015
2014 TELECOMMUNICATIONS MARKET SURVEY REPORT –
BUSINESS RESULTS

2
Copyright © 2010 The Nielsen Company. Confidential and proprietary.
2
Copyright © 2011 The Nielsen Company. Confidential and proprietary.
DISCLAIMER
• TRA does not make any representations or warranties, either express or implied, that:
• the information is free from inaccuracies, errors or omissions;
• the information is exhaustive;
• the information is of merchantable quality and fitness for a particular purpose.
• TRA, including its officers, board members, employees, agents and contractors, is not liable for:
• any inaccuracy, error or omission in the information contained in this document; nor
• any loss, damage, cost or expense whether direct, indirect, consequential or special, incurred by, or arising by reason
of, any person using or relying on the information and whether caused by reason of any inaccuracy, error, omission
or misrepresentation in the information or otherwise.
• TRA notes that the information contained in this report is based on a survey of a sample of 252 business consumers and
as such may not necessarily represent the market or the population as a whole.
• This survey is wide in scope, and because of the reliance on third-party data we cannot always fully guarantee the
accuracy of data. We have carried out comprehensive checks as far as is reasonably possible and have acted to ensure
that the data in this survey are comprehensive and the most accurate currently available
• The information set out in this survey does not represent any conclusion or proposal by the TRA in respect of the current
or future definition of markets, nor does it represent any conclusion or proposal about the assessment of significant
market power for the purpose of the Telecommunications Law of the Kingdom of Bahrain.
• This survey fulfills the requirement to undertake research and publish information as set out in Article 54 of the Law. It
also fulfills the requirement of Article 25 to provide information to the Regulator as set out in the Individual Licenses
granted to the Operators mentioned in this survey

3
3
Copyright © 2014 The Nielsen Company. Confidential and proprietary.
3
TABLE OF CONTENTS 1. Introduction
a. Research Background 5
b. Research Objectives 6
3. Telecom Services
b. Fixed Line Service 19
c. Mobile Phone Service 31
e. Internet Service 48
4. TRA Awareness
a. Awareness & Knowledge Of TRA Services 60
d. International Calls 42
5. Conclusion 65
2. Key Research Findings 7
a. Telecommunication services for businesses 14
6. Appendix 69

Research Background Research Objectives
Introduction

5
Copyright © 2010 The Nielsen Company. Confidential and proprietary.
5
Copyright © 2011 The Nielsen Company. Confidential and proprietary.
BACKGROUND
• The Telecommunications Regulatory Authority of Bahrain (TRA) was formed in October
2002. TRA is an independent body which has a direct responsibility to ensure effective
liberalization of the telecommunications market.
• TRA has commissioned Nielsen to conduct a market research study in 2014 with the
objective of better understanding the demand for telecommunications services in Bahrain.
This includes usage of and access to telecom services across various users as well as
consumer awareness of TRA and its role. It also outlines numerous areas of progress in
the telecommunications sector in Bahrain
• The telecom users are divided into two broad segments (Residential and Business), thus
two separate modules were conducted to collect the required information.
• This report presents the results of business survey which was based on 252 face to face
interviews.
• TRA also conducted a similar survey in 2007 and 2011. The results of these surveys can
be found at: http://www.tra.org.bh/en/media/consumer-and-business-surveys/

6
Copyright © 2010 The Nielsen Company. Confidential and proprietary.
6
Copyright © 2011 The Nielsen Company. Confidential and proprietary.
RESEARCH OBJECTIVES
• The key objectives of this phase of the study are to understand the following :
Detailed Access to and Usage of Telecom
Services in Bahrain - Fixed Line, Mobile
and Internet
Satisfaction with Various Services and
Switching Behavior
Awareness of TRA and Its Activities
• Where appropriate the results of the 2014 survey have been compared with the results
from the 2007 and 2011 surveys to identify the key trends during this period.

Copyright © 2014 The Nielsen Company. Confidential and proprietary.
KEY RESEARCH FINDINGS

8
Copyright © 2010 The Nielsen Company. Confidential and proprietary.
8
Copyright © 2011 The Nielsen Company. Confidential and proprietary.
USAGE OF TELECOMS SERVICES IN BAHRAIN
Average Number of National Calls From Fixed Line (on a daily basis)
Base: All Respondents 2014 (n=252), 2011(n=250), 2007( n=159)
Average Number of National Calls From Mobile Phone (on a daily basis)
Base: All Respondents 2014(n=172) 2011(n=250), 2007( n=159)
58 52
to Fixed to Mobile
201444 39
34
to Mobile onnet
to Mobile offnet
to fixed
2014
Q15. Please see this card tell me how many calls are made approximately on a daily basis from fixed line? Q34. how many calls are made approximately on a daily basis from mobile?
- Average number of national calls made from fixed line is slightly greater than average number of national calls made from mobile phone.
KEY FINDINGS 2014 SURVEY

9
Copyright © 2010 The Nielsen Company. Confidential and proprietary.
9
Copyright © 2011 The Nielsen Company. Confidential and proprietary.
0%
22%
63%
15% 11%
26%
36%
27%
Less than 1 minute 1 to 3 minutes More than 3 minutes up to 10minutes
More than 10 minutes
From fixed Line
From Mobile line
USAGE OF TELECOMS SERVICES IN BAHRAIN
Duration of National Calls from fixed line
Base: All Respondents 2014 (n=250)
Q16. Could you please tell me the approximate average length in minutes of national (local) calls you would make from your organization’s fixed line? Q36. Could you please tell me the approximate average length in minute of national (local) calls that are made from your organization’s mobile phone? [Q15] Please see this card tell me how many calls are made approximately on a daily basis? [Q34] Now I would like to know the number of calls made through mobile.As I read out each type please see this card tell me how many calls are made approximately on a daily basis?
- 78% of businesses make a fixed line call with a duration of more than 3 minutes while 63% of businesses make a mobile phone call with a duration more than 3 minutes.
- Average number of national calls made from fixed line are higher than average number of national calls made from mobile phone.
KEY FINDINGS 2014 SURVEY
Average number of calls made from: Fixed Line – 54 Mobile Phone – 38

10
Copyright © 2010 The Nielsen Company. Confidential and proprietary.
10
Copyright © 2011 The Nielsen Company. Confidential and proprietary.
AVERAGE MONTHLY SPEND
Fixed Line Monthly Spend (Average BD)
Base: All Respondents 2014 (n=250) 2011(n=250), 2007 (n=159)
Mobile Phone Monthly Spend (Average BD)
530 413
326
2007 2011 2014
Base: All Respondents 2014 (n=172) 2011(n=250), 2007( n=159)
425 298 288
2007 2011 2014
380
179 176
2007 2011 2014
Internet s Monthly Spend
(Average BD)
Base: All Respondents 2014 (n=250) 2011(n=250), 2007( n=159)
Q23 Could you please tell me what is your average monthly spend on Fixed Line (including fax) on National Calls Q41 On average, how much does your organization spend each month on mobile phone services (for mobile connections owned by the organization?) Q71 On average, how much does your organization spend each month on internet Services?
- With a reduction in the number of calls made from fixed line, the average monthly spend for fixed line services has decreased since 2011.
- Spend for data services has remained almost same whereas there has been a slightly decreased in spend on mobile phones.
KEY FINDINGS 2014 SURVEY

11
Copyright © 2010 The Nielsen Company. Confidential and proprietary.
11
Copyright © 2011 The Nielsen Company. Confidential and proprietary.
INTERNET ACTIVITIES
Q68 For which of the following activities did your organization use the Internet during the last 12 months?
- Overall, the proportion of businesses engaging in internet related activities has grown compared to 2011. In
particular, providing customer services and delivering products online have become more prominent in 2014
(68% and 49% respectively) compared to (34% and 13% respectively) in 2011.
- Sending or receiving email remains the main internet activities among businesses (98% in 2014 and 77% in 2011)
77%
34%
27%
46%
26%
44%
13%
29%
21%
22%
17%
14%
98%
76%
68%
59%
54%
54%
49%
46%
45%
44%
35%
27%
Sending or receiving e-mail
Getting information about goods or services
Providing customer services
Getting information from general government organizations
Submitting information as part of an administrative procedure to…
Interacting with general government organizations
Delivering products online
Internet banking
Accessing other financial services
Submitting proposal in public electronic tender system
Placing orders over the internet
Receiving orders over the internet
2011
2014
Main Internet Activities
Base: All Respondents 2014 (n=250)
KEY FINDINGS 2014 SURVEY

12
Copyright © 2010 The Nielsen Company. Confidential and proprietary.
12
Copyright © 2011 The Nielsen Company. Confidential and proprietary.
KEY FINDINGS – SATISFACTION WITH TELECOMS SERVICES
Q29 How satisfied are you with the following elements of your fixed line service? Q46 How satisfied are you with the following elements of your mobile service?[ Q75 How satisfied are you with the following elements of your internet service?
3% 8% 1%
8% 1%
10% 6% 2% 9%
13%
1% 9%
12%
2%
15% 20%
2%
55%
50%
63% 57%
62%
63%
38% 38%
62%
33% 23%
36% 33%
15%
34% 32% 37% 35%
2007 2011 2014 2007 2011 2014 2007 2011 2014
OverallFixed
service
Overallmobileservice
Overallinternetservice
Not very satisfied Neither satisfied nor dissatisfied Fairly Satisfied Very Satisfied
Overall Satisfaction across ICT services
Base: All Respondents 2014 (n=250) 2011 (n=250) Base: 2014 (n=172) 2011 (n=250) Base: All Respondents 2014 (n=250) 2011 (n=250)
- The majority of businesses are satisfied with their telecommunications services with 99% of businesses are
satisfied with their fixed line services, 97% of businesses are satisfied with their mobile services and 97% of
businesses are satisfied with their internet services.
KEY FINDINGS 2014 SURVEY

Copyright © 2014 The Nielsen Company. Confidential and proprietary.
Telecommunication Services for Business Fixed Line Mobile Phone Service International Calls Internet Service
TELECOM SERVICES

14
Copyright © 2010 The Nielsen Company. Confidential and proprietary.
14
Copyright © 2011 The Nielsen Company. Confidential and proprietary.
IMPORTANCE OF TELECOMMUNICATIONS SERVICES
Importance of Telecommunications for Business
Q1. Please see this card and tell me on an overall level how important are telecommunications to the running of your business?
Less than 20 employees
20-99 employees
100+ employees
2011
Base 113 73 64
Indispensable 35% 37% 47%
2014
Base 134 71 47
Indispensable 35% 35% 53%
Base: All Respondents 2014 (n=252) , 2011 (n=250) , 2007 (n=159)
- Telecommunications services are critical to running many businesses. The majority of businesses, telecoms is an integral part of their operations.
- The importance of telecom services is same for small and medium-size businesses (35%), but it increases for larger businesses in 2014 (53%).
0% 2% 1%
65% 59% 61%
35% 38% 38%
2007 2011 2014
Indispensable
Important,Quite/veryimportant
Not veryimportant

15
Copyright © 2010 The Nielsen Company. Confidential and proprietary.
15
Copyright © 2011 The Nielsen Company. Confidential and proprietary.
IMPORTANT FACTORS FOR SELECTING TELECOM SERVICES PROVIDER
Important Factors For Telecom Service Provider (2014)
Q3 Companies look at different parameters while selecting a new service provider for Telecommunications. We have put some of these on this card. Please rate them as per their importance for your company
Base: All Respondents 2014 (n=252) ,
0% 1% 5% 2% 1% 3%
52% 46% 45%
54% 55%
42% 52% 54%
43% 44%
Brand /reputation
Range ofbusinessservicesavailable
Quality ofservices
Customer /account care
Tariffs /charges
Extremely Important
Important
Neither Important notunimportant
Not Important
Not at all Important
- Quality of services and range of business services available are the most important considerations for businesses when selecting a telecom service provider.

16
Copyright © 2010 The Nielsen Company. Confidential and proprietary.
16
Copyright © 2011 The Nielsen Company. Confidential and proprietary.
PURCHASING METHOD & TENDER PROCESS
Purchasing Method Holding Tendering Process
Base: All Respondents 2014(n=252)
No. of bids received in one tender process
Base: Those who hold tender process 2014 (n=30)2011 (n=21*) Base: All Respondents 2014(n=252)
Q4 Considering the overall purchase decision-making of telecom services, do you purchase all together as a ‘bundled’ purchase where one telecom provider supplies all services as part of a single contract, or do you purchase separate services from multiple providers such as fixed services from one provider and mobile services from another and so on. Q5. Do you hold competitive tendering process for telecom services you consider purchasing and invite service providers to submit relevant bids? Q6.. How many bids do you typically receive from different suppliers in one tender process?
5%
19% 24%
5%
49%
0%
43%
77%
10%
23%
1 Bid 2 bids 3 bids 4 bids 5+ bids
2011 2014
80%
20%
61%
39%
Bundled purchasefrom one provider
Separate purchasesfrom multiple providers
2011 2014
8%
92%
12%
88%
Yes No
2011 2014
- The majority of businesses still purchase their telecom services as a bundled purchase from one single
provider. However, this percentage has decreased from 80% in 2011 to 61% in 2014.
- 12% of businesses hold a tendering process for telecom services in 2014 compared to 8% in 2011.

17
Copyright © 2010 The Nielsen Company. Confidential and proprietary.
17
Copyright © 2011 The Nielsen Company. Confidential and proprietary.
RECRUITMENT OF EMPLOYEES WITH ICT SKILLS
Having Difficulties in Recruiting ICT-Skilled Staff
Base: All Respondents 2014 (n=252)
Q2. Do you have difficulties in recruiting employees with ICT skills?
22%
78%
1%
99%
Yes No
2011 2014
Less than 20
Employees
20-99 Employees
100+ Employees
2011
Base: 113 73 64
Those who have difficulty in recruiting employees with ICT Skills
19% 25% 25%
2014
Base: 134 71 47
Those who have difficulty in recruiting employees with ICT Skills
1% 0% 0%
- In 2014, it has become much easier recruiting ICT-skilled staff, with 99% of businesses reporting no difficulties in recruiting ICT-skilled staff compared with 78% in 2011.
- The 1% of businesses who have difficulties in recruiting ICT-skilled business are found in small-size businesses.
Copyright © 2014 The Nielsen Company. Confidential and proprietary.
Telecommunication Business Services Fixed Line
Mobile Phone Service International Calls Internet Service
TELECOM SERVICES

19
Copyright © 2010 The Nielsen Company. Confidential and proprietary.
19
Copyright © 2011 The Nielsen Company. Confidential and proprietary.
FIXED LINE SERVICE PROVIDERS
Q14 From which of these do you currently subscribe fixed lines from?[
Base: All Respondents 2011 (n=250), 2014 (n=250)
Service Provider - Current Usage
88%
6% 4% 2% 1%
94%
5% 3%
Batelco Mena Zain/Wimax Lightspeed Kalaam
2011 2014
- Batelco is still extensively used by businesses in comparison with other fixed line services providers with 94% of businesses subscribing to their fixed line services from Batelco compared to 88% in 2011.

20
Copyright © 2010 The Nielsen Company. Confidential and proprietary.
20
Copyright © 2011 The Nielsen Company. Confidential and proprietary.
47%
79%
92%
35%
11%
5% 18% 5%
3% 5%
2007 2011 2014
Don’t know
Definitely/Willswitch
Neither likely norunlikely
Definitelynot/Wont switch
SWITCHING INTEREST
Likeliness To Switch
Base: All Respondents 2014 (N=240) , 2011 (n=250) , 2007 (n=159)
Q20Now tell me on a 5 point scale where 5 means 'definitely switch' and 1 means 'definitely not switch' , how likely is your company to switch to another telecom service provider for Fixed Line? Q21 You mentioned that your organization is likely to switch fixed line service provider. Please give the most important reason for the switch
* Low Base
- The proportion of businesses who are not likely to switch from their current fixed line provider has increased gradually from 47% in 2007 to 79% in 2011 and then to 92% in 2014.
- The main reason for not switching in 2014 is still because businesses are happy with their current service provider.
2007 2011 2014
Top two reasons for switching to another provider
Base: Who are likely to
switch 28
Base: Who are likely to
switch 11*
Base: Who are likely to
switch 7 *
Cheaper Price 50% Cheaper Charges
27% Cheaper Charges
86%
Better Service 43% More
promotions 18%
More Promotions
14%
Top two reasons for not switching Base: Who
are likely not to switch
75 Base: Who
are likely not to switch
199 Base: Who
are likely not to switch
222
Don’t want to change the
number 36%
Happy with current
provider 63%
Happy with current
provider 92%
Satisfied with Batelco
27%
Difficult to switch to
other provider
30%
Difficult to switch to
other provider
6%

21
Copyright © 2010 The Nielsen Company. Confidential and proprietary.
21
Copyright © 2011 The Nielsen Company. Confidential and proprietary.
TYPE OF FIXED LINE CONNECTIONS
Average No of Lines
Total Less than 20 Employees
20-99 Employees 100 & +
Employees
Base: 250 113 73 64
Fixed Voice lines 10 2 3 27
Fax lines 5 1 2 14
Average No of Lines
Total Less than 20 employees
20-99 employees 100+ employees
Base 159 66 65 28*
Fixed Voice lines 4 2 4 11
Fax lines 2 1 2 4
2011
2007
Average No of Lines
Total Less than 20 Employees
20-99 Employees 100 & +
Employees
Base: 250 132 71 47
Fixed Voice lines 10 6 7 28
Fax lines 3 1 2 7
2014
Q13. Please Specify how many of the following do you have? Fixed voice
- Fixed Voice and Fax lines are the most commonly used type of connection by businesses.
- As expected the average number of lines increases with the size of businesses.

22
Copyright © 2010 The Nielsen Company. Confidential and proprietary.
22
Copyright © 2011 The Nielsen Company. Confidential and proprietary.
PRIVATE NETWORK (LAN) TO MAKE NATIONAL CALLS
Usage of Private Network (LAN) to make national calls
Base: All Respondents 2014 (n=250) , 2011 (n=250) , 2007 (n=159)
24%
9%
22%
64% 68%
58%
73%
81%
45% 42%
51%
43%
Total Less than 20 Employees 20-99 Employees 100 & + Employees
2007 2011 2014
Q17 Does your organization use a LAN to make national calls between offices/sites within Bahrain?
- Usage of Private Network (LAN) for making National calls has decreased from 68% in 2011 to 45% in 2014, in particular among large businesses.

23
Copyright © 2010 The Nielsen Company. Confidential and proprietary.
23
Copyright © 2011 The Nielsen Company. Confidential and proprietary.
63%
25%
71% 70%
23%
75%
15%
16%
15% 13%
28%
13%
22%
53%
15% 17%
41%
9% 3% 3% 3%
2007 2011 2014 2007 2011 2014
Fixed to fixed Fixed to Mobile
upto 50 calls 51-100 calls 100+ calls Don’t know
NUMBER OF NATIONAL CALLS MADE
Number of National Calls
Base: All Respondents 2014 (n=250) , 2011 (n=250) , 2007 (n=159)
Average number of National calls
Total Less than 20 Employees
20-99 Employees
100 & + Employees
Base-2014 250 132 71 47
Fixed to Fixed 58 37 61 110
Fixed to Mobile 52 35 50 100
Base-2011 250 113 73 64
Fixed to Fixed 133 93 136 192
Fixed to Mobile 124 90 124 177
Base-2007 159 66 65 28
Fixed to Fixed 74 30 90 135
Fixed to Mobile 66 35 65 140
Q15Please see this card tell me how many calls are made approximately on a daily basis?[[
- The number of national calls has decreased since 2011, with the proportion of businesses making more than 100 fixed to fixed calls per day decreasing from 53% in 2011 to only 15% in 2014
- On average businesses made only 58 fixed to fixed national calls per day in 2014 (down from 133 calls in 2011) and 52 fixed to mobile national calls per day in 2014 (down from 124 calls in 2011).

24
Copyright © 2010 The Nielsen Company. Confidential and proprietary.
24
Copyright © 2011 The Nielsen Company. Confidential and proprietary.
DURATION OF NATIONAL CALLS MADE FROM FIXED LINES
Q16 Could you please tell me the approximate average length in minutes of national (local) calls you would make from your organization’s fixed line?
Average scores across respondents
1% 9%
44% 26%
22%
46%
35% 63%
9%
30%
15%
2007 2011 2014
More than 10 minutes
More than 3 minutes up to 10 minutes
1 to 3 minutes
Less than 1 minute
Base: All Respondents 2014 (n=250) , 2011 (n=250) 2007 (n=159)
National Call Duration
- In 2014 78% of businesses make national calls from their fixed line with a duration of 3 minutes or more
compared to 65% in 2011 and 55% in 2007.

25
Copyright © 2010 The Nielsen Company. Confidential and proprietary.
25
Copyright © 2011 The Nielsen Company. Confidential and proprietary.
FIXED LINE EXPENDITURE
Q23. Now I would like to talk to you about the expenses on telecom services. Could you please tell me what is your average monthly spend on Fixed Line (including fax) on National Calls? Q25. Please tell us approximately what % of your fixed line spend are National calls and International Calls?
Average Monthly
Expense on Fixed Line
Total Less than 20 Employees
20-99 Employees
100+ Employees
Base-2014 250 132 71 47
(BD)-Mean 326 114 268 1,003
Base-2011 250 113 73 64
(BD)-Mean 413 220 382 744
Base-2007 159 66 65 28
(BD)-Mean 530 200 625 1,100
22% 16%
2011 2014
International Calls Expense
National Calls Expense
Base: All Respondents 2014 (n=250)
Fixed line expenditure
- For businesses, national calls still represent a significant proportion of fixed line expenditure. In 2014 84% of
total fixed line expenditures was on national calls, compared to 78% in 2011.

26
Copyright © 2010 The Nielsen Company. Confidential and proprietary.
26
Copyright © 2011 The Nielsen Company. Confidential and proprietary.
SATISFACTION LEVELS - FIXED LINE SERVICE
Q29. How satisfied are you with the following elements of your fixed line service?[
Base: All Respondents 2014 (n=250) , 2011 (n=250), 2007 (n=159)
7% 8% 7% 6% 6% 3%
8%
4%
3%
4%
6% 5%
16%
1%
31% 13%
1% 9%
13%
1%
11% 10%
1%
13% 10%
3%
23%
23%
5%
23%
9%
5%
55%
50%
63% 43%
65%
60%
51% 45%
58%
44%
40%
63%
27%
60%
62%
33% 23%
36% 42%
13%
38% 32% 32%
39% 28%
14%
31% 19%
11%
30%
2007 2011 2014 2007 2011 2014 2007 2011 2014 2007 2011 2014 2007 2011 2014
Overall service level Range of services provided Quality of service Customer care Charges for National Calls
Don’t Know Not satisfied Neither satisfied nor dissatisfied Fairly Satisfied Very Satisfied
Satisfaction with Fixed Line
- Satisfaction levels among businesses towards fixed line service s has significantly increased.
- In 2014 more than 90% of businesses are satisfied with their overall fixed line service, range of services provided,
quality of service, customer care and charges for national calls

27
Copyright © 2010 The Nielsen Company. Confidential and proprietary.
27
Copyright © 2011 The Nielsen Company. Confidential and proprietary.
IMPROVEMENT SUGGESTIONS FOR FIXED LINE
0 0 0 0
Very Important (It is essential for business) Important Not Important No response
Q30. Could you please tell me if there are any suggestions you would like to make to help serve you better in the future for fixed line?
Improvement suggestions (2014) 47% 46%
19% 18%
1% 1% 1%
Reduce charges Improve the qualityof customer service
when there isproblem with the
service
Improve the qualityof fixed line services
Improve the rangeof services available
from fixed phone
Improve the speedand service
Reduce internationalcharges
Landline to Landlinefree
Base: All Respondents who have access to fixed line telephone 2014 (n=250),
- Although more than 90% of businesses are satisfied with their fixed line services, some businesses have
improvements suggestions regarding their fixed line services.
- Reduction in charges and improving the quality of customer service are the most common improvements suggested
by businesses (46% and 47% respectively).

28
Copyright © 2010 The Nielsen Company. Confidential and proprietary.
28
Copyright © 2011 The Nielsen Company. Confidential and proprietary.
COMPLAINTS MADE TO FIXED LINE PROVIDER
[Q26] Complaint made regarding Fixed Line services in last 12 Months [Q27] Reason to complaint about Fixed Line services [Q28] Satisfaction with the resolution of complaint for Fixed Line services
Complaint Made to Fixed Line Provider in Last 12 Months
Details On Complaints Made to Fixed Line Provider
Satisfaction With Resolving of Complaint
12%
88%
Yes No
52%
32%
16%
10%
Quality ofservice like
network…
Billing error
Line faults
Cost of service3%
10%
32%
52%
3%
Satisfaction
HighlySatisfiedSomewhatSatisfiedNiether/nor
Notsatisfied
Base: All Respondents who have access to fixed line telephone (n=250) Base: All Respondents who Complained (n=31)
Base: All Respondents who Complained (n=31)
- 12% of businesses made a complaint to their fixed line service provider in the last 12 months.
- Of those who made a complaint, 52% of businesses complained about the quality of service.
- 55% of those who made a complaint were satisfied with the complaint resolution.

29
Copyright © 2010 The Nielsen Company. Confidential and proprietary.
29
Copyright © 2011 The Nielsen Company. Confidential and proprietary.
SUMMARY OF FIXED LINE SERVICE
• The proportion of businesses who are not likely to switch from their current fixed line provider has
increased gradually from 47% in 2007 to 79% in 2011 and then to 92% in 2014 and the main reason
given in 2014 for not switching remains because businesses are happy with their current service.
• Fixed Voice and Fax lines are the most commonly used type of fixed line connection by businesses.
• Usage of Private Network (LAN) for making National calls has decreased from 68% in 2011 to 45% in
2014, in particular among large businesses.
• The number of national calls has decreased since 2011, with the proportion of businesses making more
than 100 fixed to fixed calls per day decreasing from 53% in 2011 to only 15% in 2014. However, In
2014 78% of businesses make national calls from their fixed line with a duration of 3 minutes or more
compared to 65% in 2011 and 55% in 2007.
• Although more than 90% of businesses are satisfied with their fixed line services, some businesses have
suggested improvements regarding their fixed line services, with the reduction in charges and
improving the quality of customer service being the most common improvements suggested by
businesses (46% and 47% respectively).

Copyright © 2014 The Nielsen Company. Confidential and proprietary.
Telecommunication Business Services Fixed Line
Mobile Phone Service International Calls Internet Service
TELECOM SERVICES

31
Copyright © 2010 The Nielsen Company. Confidential and proprietary.
31
Copyright © 2011 The Nielsen Company. Confidential and proprietary.
COMPANY PROVISION OF MOBILE PHONES
Q31a Does your organization provide mobile phones to staff? Q32 Main reasons for organization to use mobile phones
Reasons for providing Mobile Phones
2014 2011 2007
Base: 172 250 159
Mobile Workforce 81% 42% 75%
Can control spending 17% 37% 14%
Availability of additional services 47% 31% 25%
Quality services 40% 23% 31%
64%
85%
68%
36%
15%
32%
2007 2011 2014
Yes No
Provision of mobile phones to employees
- The proportion of businesses who provide mobile phones to employees has decreased to 68% in 2014 compared
to 85% in 2011.
- As expected the proportion of businesses who provide mobile phones to employees increases with the size of
businesses.
- Mobile workforce is still the main reason for using mobile phones in 2014.
2014 Less than 20 Employees
20-99 Employees
100 & + Employees
Base: All Respondents 134 71 47
Provision of Mobiles to Employees (%) 64% 68% 81%
Base: All Respondents 2014 (n=252), 2011(250), 2007 (2007)

32
Copyright © 2010 The Nielsen Company. Confidential and proprietary.
32
Copyright © 2011 The Nielsen Company. Confidential and proprietary.
NATIONAL CALLS MADE FROM MOBILE
Average number of National calls Total Less than 20 Employees 20-99 Employees 100 & + Employees
Base-2014 172 86 48 38
Mobile to Mobile On Net 44 30 52 65
Mobile to Mobile Off Net 39 31 41 57
Mobile to Fixed line 34 26 39 47
Q34. Now I would like to know the number of calls made through mobile. As I read out each type please see this card tell me how many calls are made approximately on a daily basis?
Base: All who have mobile connections in their name 2014 (n=172) , 2011 (n=213) , 2007 (n=102)
77%
35%
85% 77%
32%
88% 77%
33%
85%
12%
20%
8% 11%
29%
7% 13%
19%
5% 10%
43%
7% 10%
36%
6% 9%
46%
4%
2007 2011 2014 2007 2011 2014 2007 2011 2014
Mobile-to-Mobile On Net Mobile-to-Mobile Off Net Mobile-to-Fixed Line
upto 50 calls 51-100 calls 100+ calls
Number of National calls
- There has been a significant decrease in the volume of national calls made per day since 2011.
- The majority of businesses (85%) now make up to 50 national calls per day from their mobile phones.

33
Copyright © 2010 The Nielsen Company. Confidential and proprietary.
33
Copyright © 2011 The Nielsen Company. Confidential and proprietary.
DURATION OF NATIONAL CALLS FROM MOBILE
Q36. Could you please tell me the approximate average length in minute of national (local) calls that are made from your organization’s mobile phone?
1% 9% 11%
48% 25%
26%
43%
34% 36%
8%
32% 27%
2007 2011 2014
More than 10 minutes
More than 3 minutes up to 10 minutes
1 to 3 minutes
Less than 1 minute
National Call Duration
- The duration of national calls made from mobile phones has remained almost similar since 2011, with 63% of
national calls from mobile phone has a duration of more than 3 minutes in 2014 compared to 66% in 2011.
Base: All who have mobile connections in their name 2014 (n=172) , 2011 (n=213) , 2007 (n=102)

34
Copyright © 2010 The Nielsen Company. Confidential and proprietary.
34
Copyright © 2011 The Nielsen Company. Confidential and proprietary.
SWITCHING INCLINATION – MOBILE SERVICES
Ever Switched Mobile Operators
Base: All Respondents 2014 (n=172) 2011(250)
Q37. Now I wanted to know specifically for mobiles, has your organization ever switched between mobile phone operators? Q38. Now tell me on a 5 point scale where 5 means 'definitely switch' and 1 means 'definitely not switch' , How likely is your organization to switch to another mobile phone service provider?[ Q40. You mentioned that your organization is NOT likely to switch mobile phone service provider. Please tell me what is the most important reason for switching to another mobile phone provider
- 28% of businesses have switched between mobile phone operators in 2014 compared to only 3% in 2011.
- 89% of businesses are unlikely to switch from their current mobile service provider in 2014 compared to 84% in
2011.
- Being happy with current provider is still the main reason for not switching (same as 2011).
3%
97%
28%
72%
Yes No
2011 2014
53%
84% 89%
31%
11% 6% 16% 4% 5%
2007 2011 2014
Definitely/Will Switch
Might or might not switch
Definitely not/Wont Switch
24%
41%
71%
21%
97%
2%
Happy with currentprovider
Difficult to switchto other provider
Don’t want to change the numbers
2014 2011 2007
Likeliness to Switch
Base: All provided mobile phone by companies 2014 (n=124) 2011 (n=213) , 2007 (n=102)
Top Two Reasons for Not Switching from Current Mobile Service Provider
Base: Base: Those who would not switch 2014 (n=110) 2011 (n=178) , 2007 (n=54)

35
Copyright © 2010 The Nielsen Company. Confidential and proprietary.
35
Copyright © 2011 The Nielsen Company. Confidential and proprietary.
MOBILE VALUE ADDED SERVICES
Q35 For mobiles owned in your organization’s name, please tell me which value added services does your company use on a regular basis?
50%
41%
15%
21%
3%
31%
42%
22%
28%
44%
20%
70%
47%
37%
16%
7%
6%
SMS
International Roaming
Conference calls
Voicemail
Bulk SMS
SMS Bill Payment
2007
2011
2014
Base: All provided mobile phone by companies 2014 (n=172) 2011 (n=213) , 2007 (n=102)
Mobile VAS used
- SMS (70%), International roaming (47%) and conference calls (37%) are the main value added services used by
businesses in 2014.
- Bulk SMS has decreased significantly from 44% in 2011 to only 7% in 2011.

36
Copyright © 2010 The Nielsen Company. Confidential and proprietary.
36
Copyright © 2011 The Nielsen Company. Confidential and proprietary.
MOBILE EXPENDITURE
Mobile Phone Expense (proportion for Inter/National Calls)
Average Monthly Mobile Spending
Total Less than
20 Employees
20-99 Employees
100+ Employees
Base-2014 172 86 48 38
Average spend (BD)
288 84 231 821
Base-2011 250 113 73 64
Average spend (BD)
298 142 242 586
Base-2007 159 66 65 28
Average spend (BD)
425 200 300 970
Q.42 Thinking about your mobile phone provided by your organization pleasetell me approximately what % of spend are National calls and International Calls?
80%
20%
85%
15%
National Calls International Calls
2011 2014
Base: All provided mobile phone by companies 2014 (n=172) 2011 (n=250)
- National calls still represent the majority of mobile phone expenditure in 2014 (85% of total mobile
expenditure on voice calls by businesses was on notational calls in 2014, up from 80% in 2011).
- Average monthly spend on mobile services is marginally lower than 2011 despite rise in expenditure among
large businesses

37
Copyright © 2010 The Nielsen Company. Confidential and proprietary.
37
Copyright © 2011 The Nielsen Company. Confidential and proprietary.
SATISFACTION WITH MOBILE PHONE SERVICE
Q46. How satisfied are you with the following elements of your mobile service?[
Satisfaction with Mobile Service
- Satisfaction levels among businesses towards mobile phone services has significantly increased.
- The proportion of businesses who are very satisfied with the ability to make calls without being cut off has
significantly increased from 75% in 2011 to 96% in 2014.
1% 8%
1% 8% 7% 2%
26% 15%
3% 16% 12%
3% 9%
12%
2%
20% 16%
2%
19%
12%
8%
23%
15%
12%
90% 77%
97%
72% 75%
96%
55% 70%
89%
61% 81%
85%
2007 2011 2014 2007 2011 2014 2007 2011 2014 2007 2011 2014
Overallmobileservice
Ability to make calls without beingcut off
Price of national calls made frommobile phone
Price of SMS
Not satisfied Neither satisfied nor dissatisfied Satisfied
Base: All provided mobile phone by companies 2014 (n=172) 2011 (n=213) , 2007 (n=102)

38
Copyright © 2010 The Nielsen Company. Confidential and proprietary.
38
Copyright © 2011 The Nielsen Company. Confidential and proprietary.
IMPROVEMENT SUGGESTIONS FOR MOBILE SERVICE
[Q47] Could you please tell me if there are any suggestions you would like to make to help serve you better in the future for mobile phone line?
55%
46%
25%
20%
Reduce charges / tariffs Improve quality of customerservice when there is problem
with the service
Improve the quality of mobilephone services
Improve the range of services /features available for fixed line
2014Improvement suggestions
Base: All Respondents who have access to mobile service 2014 (n=172),
- Although more 90% of businesses are satisfied with their mobile phone services, some businesses had suggested
improvements regarding their mobile phone services.
- Reduction in charges and improving the quality of customer service are the most common improvements
suggested by businesses (55% and 46% respectively).

39
Copyright © 2010 The Nielsen Company. Confidential and proprietary.
39
Copyright © 2011 The Nielsen Company. Confidential and proprietary.
COMPLAINTS MADE TO MOBILE PHONE PROVIDER
[Q43] Complaint made regarding Mobile phone services in last 12 Months [Q44] Reason to complaint about Mobile phone services [Q45] Satisfaction with the resolution of complaint related to Mobile Phone Services
Complaint Made to Mobile phone Provider in Last 12
Months
Details On Complaints Made to Mobile phone Provider
Satisfaction With Resolving of Complaint
6% 94%
Yes No
45%
45%
18%
9%
Billing error
Quality of servicelike network
connectivity etc
Cost of service
Line faults9%
27%
64%
Satisfaction
Highly Satisfied
SomewhatSatisfied
Niether/nor
Not satisfied
Not at allSatisfied
Base: All Respondents who have access to Mobile phone (n=172) Base: All Respondents who Complained (n=11)
Base: All Respondents who Complained (n=11)
- Only 6% of businesses made a complaint to their mobile phone service provider in the last 12 months mainly for
billing error or quality of service.
- 64% of those who made a complaint were satisfied with the resolution of their complaint .

40
Copyright © 2010 The Nielsen Company. Confidential and proprietary.
40
Copyright © 2011 The Nielsen Company. Confidential and proprietary.
- The proportion of businesses who provide mobile phones to employees has decreased from 85% in 2011 to
68% in 2014, with mobile workforce as the main reason for using mobile phones in 2014 (81%).
- There has been a significant decrease in the volume of national calls made per day since 2011 as the majority
of businesses in 2014 (85%) make up to 50 national calls per day from their mobile phones while the
duration of calls remains similar to 2011.
- 28% of businesses have switched between mobile phone operators in 2014 compared to only 3% in 2011. Moreover, the majority of businesses are unlikely to switch, primarily because of satisfaction with their current mobile service provider.
- SMS (70%), International roaming (47%) and conference calls (37%) are the main value added services used
by businesses in 2014.
- National calls still account for the majority of mobile phone expenditure in 2014, with 85% of total mobile
spend by businesses on national calls in 2014, compared to 80% in 2011.
- The majority of businesses are satisfied with their overall level of mobile service. Reducing charges/tariffs and improving quality of customer service are the top suggestions for improvement.
- Only 6% of businesses made a complaint to their mobile phone service provider in the last 12 months mainly for billing error or quality of service.
SUMMARY OF MOBILE PHONE SERVICE
Copyright © 2014 The Nielsen Company. Confidential and proprietary.
Telecommunication Business Services Fixed Line
Mobile Phone Service
International Calls Internet Service
TELECOM SERVICES

42
Copyright © 2010 The Nielsen Company. Confidential and proprietary.
42
Copyright © 2011 The Nielsen Company. Confidential and proprietary.
OPTIONS USED TO MAKE INTERNATIONAL CALLS
Base: All Respondents 2011 (n=250)
92%
78%
47%
44%
31%
31%
30%
28%
Fixed line - direct IDD calls usingyour main service provider
Mobile - direct IDD calls
Fixed line using prepaid callingcards
Mobile - using prepaid calling cards
Fixed line - pre-selected carrier(using another service providerusing an auto dialling facility)
VoIP through a computer,irrespective of how the call is
completed
VoIP through a telephone
IPLC/LAN
[Q48 (A to C)] Now please tell me how many international calls does your organization make approximately every week from
86%
63%
7%
4%
3%
3%
2%
Direct dial using your fixedline,
Direct dial using your mobilephone,
Mobile phone - VoIP (e.g.Skype, tango, viber) overmobile broadband service,
Computer to computer freecalls (e.g. Skype),
Fixed line with carrier pre-selection,
Mobile phone - VoIP (e.g.Skype, tango, viber) over Wi-
Fi
Mobile phone - internationalcalling cards supplied by
your mobile operator,
2011 2014
- Fixed line-Direct IDD (86% of businesses) and Mobile – Direct IDD (63% of businesses) were used extensively to
make international calls in 2014.
- Using prepaid calling cards to make international calls has dropped significantly from 44% in 2011 to 2% in 2014
Base: All Respondents 2014 (n=203)

43
Copyright © 2010 The Nielsen Company. Confidential and proprietary.
43
Copyright © 2011 The Nielsen Company. Confidential and proprietary.
IMPORTANT FACTORS FOR MAKING INTERNATIONAL CALLS
Q49. What factors are most important to your organization when deciding how you will make your international calls?
Base: Total 2014 (203)
0% 0% 0% 0% 0% 0% 4% 4% 3%
58% 53% 46%
37% 41% 49%
Cost of calls Convenience Call quality of Service
Not at all Important [[1]] Not Important [[2]] Neither Important not unimportant [[3]]
Important [[4]] Extremely Important [[5]]
- 49% of businesses ranked call quality of service as an extremely important factor when choosing the method
for making international calls.

44
Copyright © 2010 The Nielsen Company. Confidential and proprietary.
44
Copyright © 2011 The Nielsen Company. Confidential and proprietary.
34% 37%
58% 58%
6% 3% 2% 2%
From Fixed From Mobile
More than 100 calls
51-100 calls
Upto 50 calls
Nil
NUMBER AND DURATION OF INTERNATIONAL CALLS MADE
[Q15] Please see this card tell me how many calls are made approximately on a daily basis? [Q34] Now I would like to know the number of calls made through mobile. As I read out each type please see this card tell me how many calls are made approximately on a daily basis? Q51 What is the approximate average length in minutes you would make of international calls from your organization’s fixed line telephone?
Base: Total 2014 (n=250)
1% 7% 11%
49% 27%
27%
38%
36% 36%
12%
30% 25%
2007 2011 2014
More than 10minutes
More than 3minutes up to 10minutes
1 to 3 minutes
Less than 1minute
Number of International Calls Duration of International Calls
34 31
- 58% of businesses make up to 50 international calls per day with an average of 34 international calls from a
fixed line service and an average of 31 international calls from a mobile phone.
- The duration of international calls made has remained consistent compared to 2011.
Base: Total 2014 (n=172) Base: Total 2014 (n=203)
Average number of calls made

45
Copyright © 2010 The Nielsen Company. Confidential and proprietary.
45
Copyright © 2011 The Nielsen Company. Confidential and proprietary.
84%
73% 73% 73% 75%
61%
52%
34%
53% 48%
27%
39%
49%
30% 30%
41%
10%
26%
2007 2011 2014 2007 2011 2014 2007 2011 2014 2007 2011 2014 2007 2011 2014 2007 2011 2014
UAE KSA India Qatar Kuwait Oman
DESTINATIONS OF INTERNATIONAL CALLS
Top 5 Countries Called
Base: All Respondents 2014 (203), 2011 (250), 2007 (138)
[Q50a] Which countries does your organization regularly call from fixed line? [Q50b] Which countries does your organization regularly call from mobile? [Q50c] Which countries does your organization regularly call from Smart phone applications (i.e. viber; Tango; Line)?
- UAE (73%) followed by KSA (61%) are the most common called countries since 2007.
- However, the proportion of businesses calling KSA has decreased from 75% in 2011 to 61% in 2014.

46
Copyright © 2010 The Nielsen Company. Confidential and proprietary.
46
Copyright © 2011 The Nielsen Company. Confidential and proprietary.
SUMMARY OF INTERNATIONAL CALLS
- Fixed line-Direct IDD (86% of businesses) and Mobile – Direct IDD (63% of businesses) are still
extensively used to make international calls in 2014.
- 49% of businesses ranked call quality of service as extremely important factor when choosing
the method for making international calls.
- 58% of businesses make up to 50 international calls per day with an average of 34
international calls from a fixed line service and an average of 31 international calls from a
mobile phone.
- UAE (73%) followed by KSA (61%) are the most common called countries since 2007.

Copyright © 2014 The Nielsen Company. Confidential and proprietary.
Telecommunication Business Services Fixed Line
Mobile Phone Service International Calls
Internet Service
TELECOM SERVICES

48
Copyright © 2010 The Nielsen Company. Confidential and proprietary.
48
Copyright © 2011 The Nielsen Company. Confidential and proprietary.
ACCESS TO INTERNET
Internet Access In Office
Q55. Did your organization have an internet connection in the last 12 months? Q56. How did your organization connect to the Internet during the last 12 months? (
76%
40%
29%
3%
DSL
Wimax
Mobile broadband
fibre Broadband
Internet Connection Type
Base: All Respondents 2014 (n=250)
87% 99%
74%
99% 97% 100% 98% 100%
13% 1%
26%
1% 0% 0%
2011 2014 2011 2014 2011 2014 2011 2014
Total Less than 20Employees
20-99 Employees 100 & +Employees
Yes No
- Internet is essential for the exchange of information in today’s business environment.
- 99% of businesses have internet access in their offices compared to 87% in 2011. This increase is mainly due
to increased internet access among small size businesses; in 2011 only 74% of small businesses had internet
access whereas in 2014 this proportion had increased to 99%.
- National data services are important to businesses with 76% of businesses having a DSL connection and 40% of
businesses having a WiMax connection, while 29% of businesses use mobile broadband
Base: All Respondents 2014 (n=251) 2011 (n=250)

49
Copyright © 2010 The Nielsen Company. Confidential and proprietary.
49
Copyright © 2011 The Nielsen Company. Confidential and proprietary.
BROADBAND CONNECTIONS
Q 57 What is the advertised speed/s of the below type of internet connection your organization subscribes to?
Base: All Respondents who have access to net (252)
Internet Speed by Connection Type
15% 7%
25%
60% 50%
30% 39%
0% 24%
29%
50%
16% 50%
30% 24% 25% 16%
0%
DSL Wimax Fibre Broadband Mobile broadband(including data
purchased with voice)
other
1 Mbps or less 2Mbps to 5 Mbps 6 Mbps to 10 Mbps More than 10
- Of those who have a DSL connection, 84% have an internet connection speed of more than 2mbps whereas
60% of those who have Mobile Broadband have an internet connection of 1 mbps or less.

50
Copyright © 2010 The Nielsen Company. Confidential and proprietary.
50
Copyright © 2011 The Nielsen Company. Confidential and proprietary.
Base: All having the Internet access 2014 (n= 250)
Ever switched between internet connections
88%
4%
4%
4%
DSL
Dial-up
Mobile broadband
MPLS
Previous Type of Connection
Base: All who have switched operators (n=25)
Yes 10%
No 90%
64%
4%
32%
Wimax
fibre Broadband
Mobile broadband
Current Type of Connection
SWITCHING OF INTERNET TYPE TO MOBILE BROADBAND
- 1 in 10 businesses have switched their internet connection type
- Among those who have switched majority have moved to WiMax and Mobile Broadband
Base: All who have switched operators (n=25)

51
Copyright © 2010 The Nielsen Company. Confidential and proprietary.
51
Copyright © 2011 The Nielsen Company. Confidential and proprietary.
SWITCHING OF INTERNET TYPE TO MOBILE BROADBAND
[Q63] If your current fixed internet monthly expense increased by the following percentages, would you consider switching to a mobile broadband service (e.g. using ‘dongle’ or router) [Q64] What is the main reason for not considering switching to a mobile broadband service?
Base: All having the Internet access 2014 (n= 250)
% rise in cost at which organization will switch to mobile broadband
30%
28%
20%
16%
15%
Speed
Pricing
Quality of service
Because of Organization/Official
Coverage
Reasons for not considering Switching to mobile broadband
Base: All who will not consider switching to mobile broadband (n=183)
- 18% of businesses with a fixed internet services would switch to mobile broadband in response to not more than
10% increase in price.
- 78% of businesses would not consider switching to mobile broadband sue to concerns around speed, pricing and
quality of service
6%
12%
4%
78%
1-5%
6-10%
11-15%
Would not considerswitching to mobile
broadband

52
Copyright © 2010 The Nielsen Company. Confidential and proprietary.
52
Copyright © 2011 The Nielsen Company. Confidential and proprietary.
WEB PRESENCE
Q10 Business has web presence
Business’s Web Presence
- Web presence of business has dropped from 80% in 2011 to 71% in 2014, mainly in medium- size businesses.
- Having a web presence increases with the increasing in the size of businesses; 91% of large businesses have a
web presence; 77% of medium businesses and 60% of small size businesses.
80% 71% 64% 60%
89% 77%
98% 91%
20% 29% 36% 40%
11% 23%
2% 9%
2011 2014 2011 2014 2011 2014 2011 2014
Total Less than 20 Employees 20-99 Employees 100 & + Employees
Yes No
Base: All Respondents 2014 (n=251) 2011 (n=250)

53
Copyright © 2010 The Nielsen Company. Confidential and proprietary.
53
Copyright © 2011 The Nielsen Company. Confidential and proprietary.
INTERNET SECURITY
Internet Security Facilities (Yes)
Base: All Respondents 2014 (n=251) 2011 (n=250)
86%
63%
49%
79%
59%
39%
Virus checking orprotectionsoftware
Firewalls Secure server
2011 2014
2014 Less than 20 Employees
20-99 Employees
100+ Employees
Base 133 71 47
Virus Checking or Protection software
77% 76% 89%
Firewall 49% 65% 79%
Secure Server 34% 41% 49%
Q3. Which of these internet safety facilities are being used in your company?
- Internet security is an important consideration for businesses.
- In 2014, 79% of businesses have “Virus Checking and Protection Software”, 59% of businesses use Firewalls,
and only 39% have secured servers.
- Large businesses are very concerned with internet security as they deal with large volumes of data.

54
Copyright © 2010 The Nielsen Company. Confidential and proprietary.
54
Copyright © 2011 The Nielsen Company. Confidential and proprietary.
INTERNET ACTIVITIES
Q68 For which of the following activities did your organization use the Internet during the last 12 months?
Base: All Respondents who have access to net 2014 (n=250)
- Overall, the proportion of businesses engaging in internet related activities has grown compared to 2011. In
particular, providing customer services and delivering products online have become more prominent in 2014 (68%
and 49% respectively) compared to 2011 (34% and 13% respectively). Sending or receiving email remains the main
internet activities among businesses (98% in 2014 and 77% in 2011)
77%
34%
27%
46%
26%
44%
13%
29%
21%
22%
17%
14%
30%
28%
16%
98%
76%
68%
59%
54%
54%
49%
46%
45%
44%
35%
27%
25%
24%
23%
Sending or receiving e-mail
Getting information about goods or services
Providing customer services
Getting information from general government organizations
Submitting information as part of an administrative procedure…
Interacting with general government organizations
Delivering products online
Internet banking
Accessing other financial services
Submitting proposal in public electronic tender system
Placing orders over the internet
Receiving orders over the internet
Internal or external recruitment
Telephoning over the Internet/VoIP or using videoconferencing
Staff training
2011
2014

55
Copyright © 2010 The Nielsen Company. Confidential and proprietary.
55
Copyright © 2011 The Nielsen Company. Confidential and proprietary.
SATISFACTION WITH INTERNET OPERATOR
6% 2% 2% 2%
28%
1%
29%
1%
20%
2% 11%
2%
42%
4%
9%
4%
38%
62% 50%
59%
18%
62%
54%
62%
37% 35% 34% 37%
11%
33%
6%
33%
2011 2014 2011 2014 2011 2014 2011 2014
Overall internet service Reliability of the internet service Response of your service provider whiledealing with problems
Overall value for money of the internetservice
Not at all satisfied Not satisfied Neither satisfied nor dissatisfied Fairly Satisfied Very Satisfied
Base: All respondents 2014 (n=250)
Q75. How satisfied are you with the following elements of your internet service?
- Satisfaction levels among businesses towards internet services has significantly increased since 2011.
- In 2014 more than 90% of businesses are satisfied with their overall internet service, reliability of the internet
service, response of their service provider while dealing with problems and overall value for money of the
internet service.

56
Copyright © 2010 The Nielsen Company. Confidential and proprietary.
56
Copyright © 2011 The Nielsen Company. Confidential and proprietary.
IMPROVEMENT SUGGESTIONS FOR INTERNET SERVICE
Q76. Could you please tell me if there are any suggestions you would like to make to help serve you better in the future for internet services?
45%
40%
28%
23%
Reduce charges / tariffs Improve quality of customerservice when there is problem
with the service
Improve the quality of fixed lineservice
Improve the range of services /features available for fixed line
Improvement suggestions
Base: All Respondents who have access to 2014 (n=250), 2011 (n=686)
- Reducing charges/tariffs (45%) and Improving quality of customer service (40%) are the top suggestions for
improvement of internet service

57
Copyright © 2010 The Nielsen Company. Confidential and proprietary.
57
Copyright © 2011 The Nielsen Company. Confidential and proprietary.
COMPLAINTS MADE TO INTERNET SERVICE PROVIDER
[Q72] Complaint made regarding Internet services in last 12 Months [Q44] Reason to complaint about Mobile phone services [Q45] Satisfaction with the resolution of complaint related to Mobile Phone Services
Complaint Made to Internet Service Provider in Last 12
Months
Details On Complaints Made to Internet Service Provider
Satisfaction With Resolving of Complaint
11%
89%
Yes No
71%
29%
25%
18%
Quality of servicelike network
connectivity etc
Billing error
Line faults
Cost of service 11%
21%
64%
4%
Satisfaction
Highly Satisfied
Somewhat Satisfied
Niether/nor
Not satisfied
Not at all Satisfied
Base: All Respondents who have access to Internet Service (n=250) Base: All Respondents who Complained (n=28)
Base: All Respondents who Complained (n=28)
- 11% of the businesses made a complaint to their internet service provider in the last 12 months. 71% of the
complaints made were due to the quality of service.
- 68% of those who complained were satisfied with the resolution provided

58
Copyright © 2010 The Nielsen Company. Confidential and proprietary.
58
Copyright © 2011 The Nielsen Company. Confidential and proprietary.
SUMMARY OF INTERNET/DATA SERVICES
- Internet is essential for the exchange of information in today’s business environment, with almost all medium and large businesses having access to the internet. 99% of businesses have internet access in their offices up from 87% in 2011
- National data services are important to businesses with 76% of businesses having a DSL connection and 40% of businesses having a WiMax connection.
- A significant majority of businesses do not regard mobile broadband to be a close substitute for fixed broadband, due to concerns around speed, pricing and quality of service.
- The majority of businesses have a web presence, with 98% of large businesses and 77% of medium business having a website ( a drop from 89% in 2011)
- Internet security is an important concern for businesses for the secure exchange of information. 79% of businesses use “Virus Checking and Protection Software” for internet security (a down from 86% in 2011).
- Usage of internet for business related activities has grown significantly especially for delivering products online, submitting proposals on public electronic tender system and accessing financial services including internet banking.

59
Copyright © 2010 The Nielsen Company. Confidential and proprietary.
59
Copyright © 2011 The Nielsen Company. Confidential and proprietary.
SUMMARY OF INTERNET/DATA SERVICES
- The majority of businesses are satisfied with internet services (i.e. overall services; range of services quality of services and charges)
- 10% have switched their type of internet connection primarily due to speed and cost reasons
- 11% filed a complaint with their service provider mainly due to quality of service

Copyright © 2014 The Nielsen Company. Confidential and proprietary.
Awareness & Knowledge Of TRA Services
TRA AWARENESS

61
Copyright © 2010 The Nielsen Company. Confidential and proprietary.
61
Copyright © 2011 The Nielsen Company. Confidential and proprietary.
TRA - AWARENESS
Awareness of Telecommunication Regulatory Authority (TRA-Bahrain)
Base: Total 2014 (n=252) , Less than 20 employees (n=113), 20-99 employees (n=73), 100 & + employees(64) Total 2011(n=250), Less than 20 employees (n=113), 20-99 employees (n=73), 100 & + employees(64
46% 62%
35%
62% 49% 58% 53%
68%
54% 38%
65%
38% 51% 42% 38%
32%
2011 2014 2011 2014 2011 2014 2011 2014
Total Less than 20 Employees 20-99 Employees 100 & + Employees
Yes No
- 62% of businesses in 2014 are aware of the Telecommunication Regulatory Authority (TRA – Bahrain) compared
to 46% in 2011.
- The awareness level is slightly higher among larger businesses.
[Q81] Have you ever heard about the Telecommunications Regulatory Authority (TRA) in Bahrain?

62
62 62
Copyright © 2014 The Nielsen Company. Confidential and proprietary.
- Newspaper (58%), friends/relatives (39%) and internet (35%) are the major sources of awareness.
Source of awareness
71%
58%
38% 39% 39% 35% 36%
20%
25%
15% 19%
6%
2011 2014 2011 2014 2011 2014 2011 2014 2011 2014 2011 2014
Newspaper Friends & Relatives Internet Billboard Radio TV
Base: Aware of TRA– 2014 (n=156), 2011 (n=116)
TRA AWARENESS – SOURCES
[Q83] Could you please tell me through which source have you heard of the Telecommunications Regulatory Authority (TRA)?

63
63 63
Copyright © 2014 The Nielsen Company. Confidential and proprietary.
TRA LOGO AWARENESS
- Proportion of people recalling the logo has increased to 24% in 2014 compared to 19% in 2011.
[Q82] Please see this card and tell me whether you recall seeing this logo?
Logo Awareness
(2007)
30%
70%
Yes No
Logo Awareness
(2011)
79%
19%
2%
Have not seen this logo
Have seen the logo but not asTRA logoCurrently specified is logo
Logo Awareness
(2014)
24%
76%
Yes No
Base: Total– 2007 (n=159) Base: Total– 2011 (n=250) Base: Total– 2014 (n=252)

64
64 64
Copyright © 2014 The Nielsen Company. Confidential and proprietary.
PERCEIVED ROLE OF TRA
- In 2014, the main role of TRA as recalled by businesses was “To regulate the telecommunications service
providers to follow the rules” compared to “reduce cost” in 2011.
[Q84] What do you think is the main role of Telecommunications Regulatory Authority (TRA)?
Customer say on the role of TRA – 2011
Reduce Cost 35%
Manage the telecom services 31%
Authorization of telecom services 6%
Take decisions of telecoms service 2%
Don’t know much about it 13%
Don’t know 13%
Customer say on the role of TRA – 2014
To regulate the telecommunications service providers to follow the rules
32%
Rules and regulation controller 22%
Controls the right of consumers 21%
It manages the telecom Industry 8%
Customer say on the role of TRA – 2007
To control service /telecom / comm. 35%
Regulate rules of a telecoms companies 31%
It control charges 6%
They take care of our complaints 2%
Don’t know much about it 16%
Don’t know 17%
Base: Aware of TRA– 2014 (n=156), 2011 (n=116), 2007(n=48)

65
65
Copyright © 2014 The Nielsen Company. Confidential and proprietary.
65
SUMMARY OF TRA AWARENESS & ITS ACTIVITIES
- Almost 2/3rd of businesses are aware of the Telecommunications Regulatory Authority
(TRA), up from 48% in 2011
- Newspapers remain the main source of TRA awareness along with internet
- Awareness regarding TRA’s logo has gone up from 19% in 2011 to 24% in 2014
- Respondents perceive regulating telecommunication services in Bahrain as being the
main role of TRA Bahrain

Copyright © 2014 The Nielsen Company. Confidential and proprietary.
CONCLUSION
67
67 67
Copyright © 2014 The Nielsen Company. Confidential and proprietary.
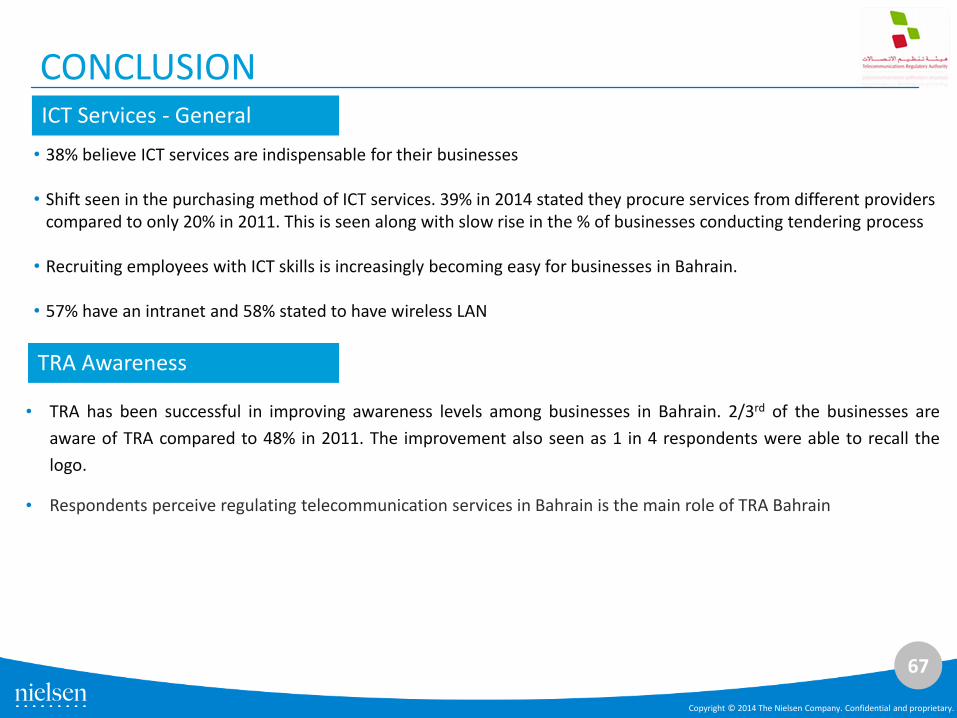
CONCLUSION ICT Services - General
• 38% believe ICT services are indispensable for their businesses
• Shift seen in the purchasing method of ICT services. 39% in 2014 stated they procure services from different providers compared to only 20% in 2011. This is seen along with slow rise in the % of businesses conducting tendering process
• Recruiting employees with ICT skills is increasingly becoming easy for businesses in Bahrain.
• 57% have an intranet and 58% stated to have wireless LAN
TRA Awareness
• TRA has been successful in improving awareness levels among businesses in Bahrain. 2/3rd of the businesses are
aware of TRA compared to 48% in 2011. The improvement also seen as 1 in 4 respondents were able to recall the
logo.
• Respondents perceive regulating telecommunication services in Bahrain is the main role of TRA Bahrain

68
68 68
Copyright © 2014 The Nielsen Company. Confidential and proprietary.
CONCLUSION Fixed Line Services
• The average number of fixed national calls made by businesses has significantly decreased compared with 2011.
• Less interest among businesses to switch as almost all are happy with their current service provider
• For large businesses, average monthly expenditure on fixed line services has increased significantly since 2011.
However, the average monthly spend by small and medium businesses has slightly decreased
• The majority of businesses are satisfied with their overall level of fixed line services.
Mobile Phone Services
• The proportion of businesses that provide mobile phones to employees has decreased by more than 30% since 2011,
with majority of large businesses providing mobiles to their staff.
• The duration of national calls made from mobile phones has remained similar since 2011, with 63% of calls lasting for
more than 3 minutes in 2014 as against 66% in 2011
• SMS (70%), International roaming (47%) and conference calls (37%) are the main value added services used by
businesses.
• Almost 1 in 3 businesses have switched from mobile service provider up from just 3% in 2011 primarily due to value
for money
• Average spend on mobile phone services has increased significantly for large businesses
• The majority of businesses are satisfied with most aspects of their mobile phone service

69
69 69
Copyright © 2014 The Nielsen Company. Confidential and proprietary.
CONCLUSION International Calls
• VOIP is still in its nascent stage among businesses
• 58% of businesses make up to 50 calls on daily basis. UAE (73%) and KSA (61%) are the most commonly called
countries.
• Using mobile phone UAE and India are the top destinations whereas KSA and UAE are the top destinations called
using a fixed line
Internet and Data Services
• Internet is essential for the exchange of information in today’s business environment, with almost all businesses
having access to the internet.
• Of those businesses accessing the internet, the majority (76%) use a DSL service with 84% of them having a
connection of more than 2 mbps
• Sending or receiving emails is the most common internet activity used by businesses.
• Satisfaction with internet services has improved in most areas, with 97% of businesses satisfied with overall service
levels (up from 75% in 2011).
• Only 1 in 10 filed a complaint with their internet service provider primarily due to quality of service

Copyright © 2014 The Nielsen Company. Confidential and proprietary.
APPENDIX

71
Copyright © 2010 The Nielsen Company. Confidential and proprietary.
71
Copyright © 2011 The Nielsen Company. Confidential and proprietary.
RESEARCH DESIGN
Target Respondent
• Responsible for telecoms needs in the organization
(Decision makers or Influencers).
• Following sectors were included in research:
– Agriculture, hunting and forestry
– Manufacturing
– Construction
– Wholesale and retail trade; repair of motor vehicles, motorcycles
and personal and household goods
– Hotels and restaurants
– Transport, storage and communications
– Financial intermediation
– Health and social work
– Other community, social and personal service activities
Research Methodology
• 252 Quantitative face to face interviews
across various industries were conducted
amongst the target respondents using a
structured questionnaire.
• Interviews were conducted in English /
Arabic as convenient to the respondent.
• Interview length was approximately of 25-
30 minutes.
• Field work timing: June/July 2014.

72
Copyright © 2010 The Nielsen Company. Confidential and proprietary.
72
Copyright © 2011 The Nielsen Company. Confidential and proprietary.
NUMBER OF EMPLOYEES SAMPLE SIZE 2014 SAMPLE SIZE 2011 SAMPLE SIZE 2007
Wholesale & Retail 71 85 25
Construction 44 37 23
Manufacturing 37 32 21
Real Estate 25 21
Govt. Org. 19
Other (Social & Personal Services) 9 15
Hotels and restaurants 22 13 32
Transport, IT & Communication 11 7 6
Fishing 6
Financial intermediation 23 5
Education 3
Health and social work 10 2 5
Agriculture 1
Utility 1
Public Administration 1
Extraterritorial organizations and bodies 1
Financial, Insurance, Real estate & Business services 33
Business Services (Ad agencies / Consultants) etc 14
Others 1
TOTAL ESTABLISHMENTS 252 250 159
SAMPLE PROFILE – INDUSTRY-WISE

73
Copyright © 2010 The Nielsen Company. Confidential and proprietary.
73
Copyright © 2011 The Nielsen Company. Confidential and proprietary.
RESPONDENT PROFILE – COMPANY SIZE
NUMBER OF EMPLOYEES SAMPLE
SIZE 2014 SAMPLE
SIZE 2011 SAMPLE
SIZE 2007
Less than 20 Employees Small Businesses 40 113 666
20-99 Employees Medium Businesses 45 73 65
100 & More Employees Large Businesses 55 64 28
TOTAL ESTABLISHMENTS
252 250 159