2014 taxpayer choice model designing digital communication products to reduce phone and mail...
TRANSCRIPT

2014 Taxpayer Choice ModelDesigning Digital Communication Products to Reduce Phone and Mail Inventory
Courtney Rasey and Mackenzie WileyInternal Revenue Service
W&I Research and AnalysisJune 2015
Presentation Overview
Introduction
Purpose of Research
Brief Methodology
Findings
Conclusions
2014 Taxpayer Choice Model | W&I Research & Analysis 2

Introduction2011W&I Research conducted a conjoint survey and created the Taxpayer Choice
Model (TCM) to identify taxpayers’ qualified preference among IRS service
channel options for eight generic service needs.
• Follow-up to 2007 conjoint project for the Taxpayer Assistance Blueprint (TAB) report
2013 & 2014W&I Research worked with IRS’s Compliance and the Taxpayer Digital
Communication (TDC) team to update the 2011 TCM to prioritize and design
digital communication products for tasks not included in the original model.2014 Taxpayer Choice Model | W&I Research & Analysis 3

Purpose of Research
• Understand taxpayers’ service channel preferences
• Identify ways to best migrate taxpayers to less expensive service channels
• Compare how taxpayer segments value different service delivery configurations
• Predict impact of proposed service changes
• Facilitate IRS decisions to prioritize digital communication products
2014 Taxpayer Choice Model | W&I Research & Analysis 4

Brief MethodologyW&I Research used a choice-based conjoint survey for this study
• During a conjoint survey, respondents are not directly asked about the importance of service channel features or their preference
• Instead, respondents are asked to choose a service channel based on the service channel features
Cross-functional workgroup led by Compliance and W&I Research worked together to develop the survey
• Service channels for each service need were chosen based on current offerings and service channels Compliance and Online Services (OLS) are considering for future development
2014 Taxpayer Choice Model | W&I Research & Analysis 5

Configuration
6
Service NeedsSubmit documentation
Status of a case/transaction
Sign a documentGet information about anotice you received/Discuss case detailsSet up a payment plan
Request an extension
Service ChannelsToll -Free Phone, Live AssistorToll -Free Phone, AutomatedFaxIRS Website – Interactive ToolSmartphone ApplicationRegular MailSecure MessageSecure Online ChatAutomatic Email CommunicationAutomatic Text CommunicationLocal IRS Office
Service Channel AttributesTime Required
Confirmation of Receipt
Identification Proofing
Account Required
Account Update Time
The service channels for each service need were chosen based on current offerings and service channels Compliance and OLS are considering for development.
Not all service channels apply to each service need.
2014 Taxpayer Choice Model | W&I Research & Analysis
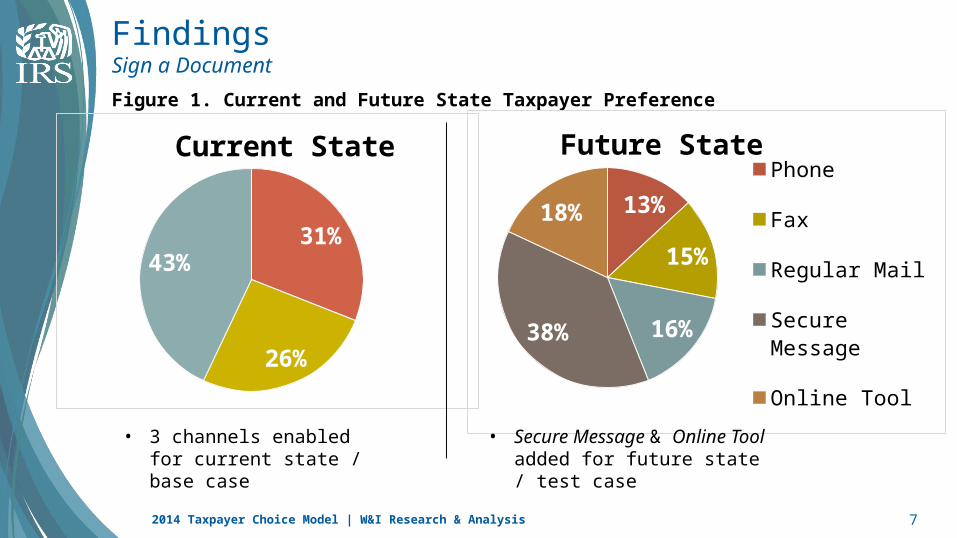
FindingsSign a Document
Figure 1. Current and Future State Taxpayer Preference
2014 Taxpayer Choice Model | W&I Research & Analysis 7
31%
26%
43%
Current State
13%
15%
16%38%
18%
Future StatePhone
Fax
Regular Mail
Secure Message
Online Tool
• 3 channels enabled for current state / base case
• Secure Message & Online Tool added for future state / test case

FindingsSign a Document
• 56% shift away from current channels
*Fax is part of the correspondence stream
2014 Taxpayer Choice Model | W&I Research & Analysis 8
Figure 2. Taxpayer Migration from Traditional Channels
Current Future0%
10%20%30%40%50%60%70%80%
31%
13%
69%
31%
0%
56%PhoneCorrespondence*New Channels

2014 Taxpayer Choice Model | W&I Research & Analysis 9
FindingsStatus of a Case
Figure 3. Future State Taxpayer Preference
11%
8%
19%
12%
12%
27%
11%Future State Phone
Secure Online Chat
Online Tool
Smartphone App
Automatic Email Notification
Automatic Text Notification
Phone (Auto)
• Six channels added for future state / test case
100%
Current State
• Current State only has Phone enabled (100%)
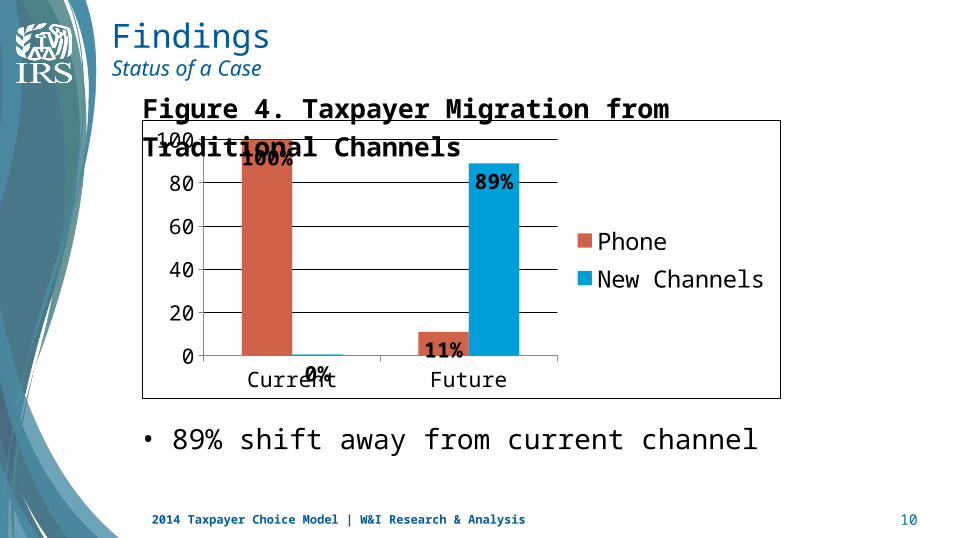
FindingsStatus of a Case
• 89% shift away from current channel
2014 Taxpayer Choice Model | W&I Research & Analysis 10
Current Future0
20
40
60
80
100100%
11%0%
89%
PhoneNew Channels
Figure 4. Taxpayer Migration from Traditional Channels
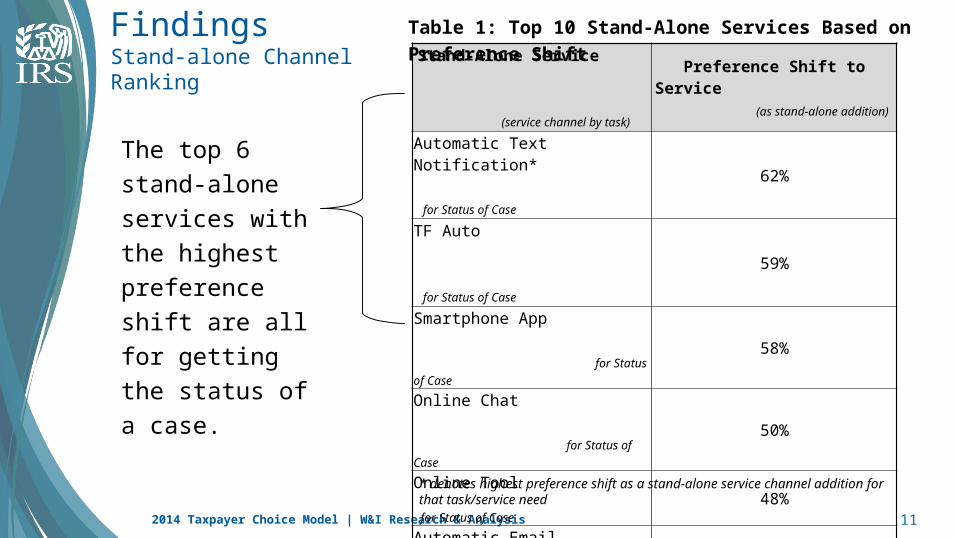
The top 6 stand-alone services with the highest preference shift are all for getting the status of a case.
2014 Taxpayer Choice Model | W&I Research & Analysis 11
Stand-Alone Service (service channel by
task)
Preference Shift to Service (as stand-alone addition)
Automatic Text Notification* for Status of Case
62%
TF Auto for Status of Case
59%
Smartphone App for Status of Case
58%
Online Chat for Status of Case
50%
Online Tool for Status of Case 48%
Automatic Email Notification for Status of Case
48%
Secure Message* for Sign a Document
43%
Secure Message* for Discuss Case Details 39%
Online Tool* for Request Extension
36%
Online Tool for Sign a Document 33%
FindingsStand-alone Channel Ranking
* denotes highest preference shift as a stand-alone service channel addition for that task/service need
Table 1: Top 10 Stand-Alone Services Based on Preference Shift
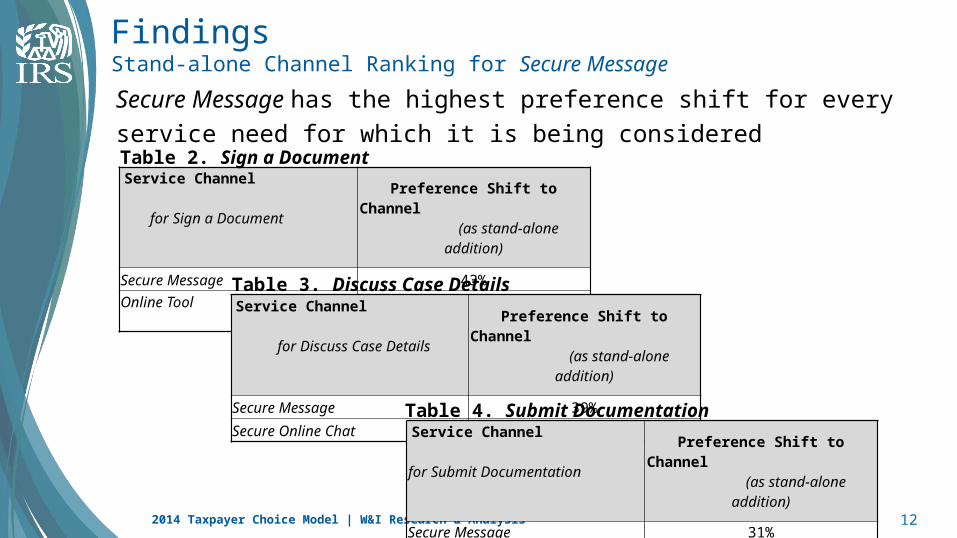
Secure Message has the highest preference shift for every service need for which it is being considered
2014 Taxpayer Choice Model | W&I Research & Analysis 12
FindingsStand-alone Channel Ranking for Secure Message
Service Channel for Sign a Document
Preference Shift to Channel
(as stand-alone addition)
Secure Message 43%
Online Tool 33%
Service Channel for Discuss Case Details
Preference Shift to Channel
(as stand-alone addition)
Secure Message 39%
Secure Online Chat 30%
Service Channel for Submit Documentation
Preference Shift to Channel
(as stand-alone addition)
Secure Message 31%Secure Online Chat 25%
Table 2. Sign a Document
Table 3. Discuss Case Details
Table 4. Submit Documentation
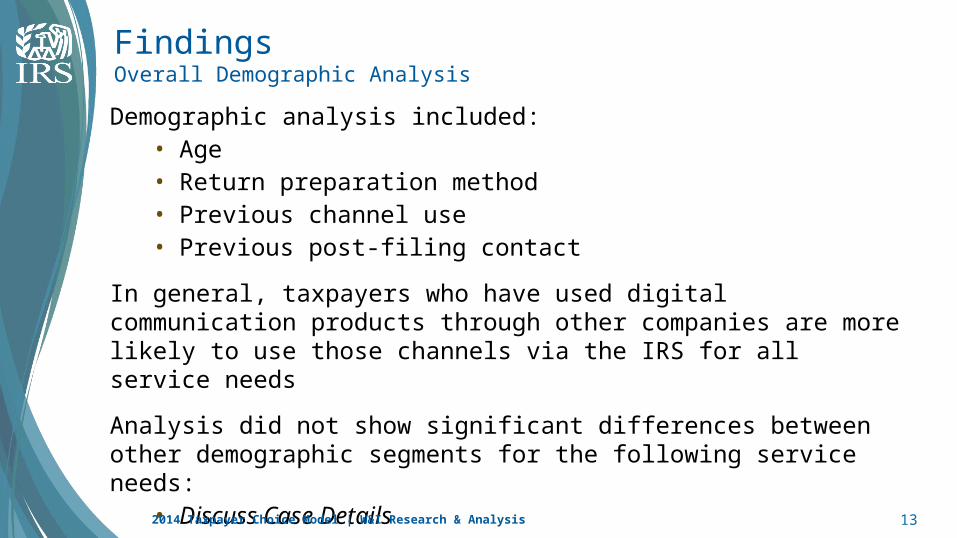
Demographic analysis included:• Age• Return preparation method• Previous channel use• Previous post-filing contact
In general, taxpayers who have used digital communication products through other companies are more likely to use those channels via the IRS for all service needs
Analysis did not show significant differences between other demographic segments for the following service needs:
• Discuss Case Details• Request an Extension2014 Taxpayer Choice Model | W&I Research & Analysis 13
FindingsOverall Demographic Analysis
2014 Taxpayer Choice Model | W&I Research & Analysis 14
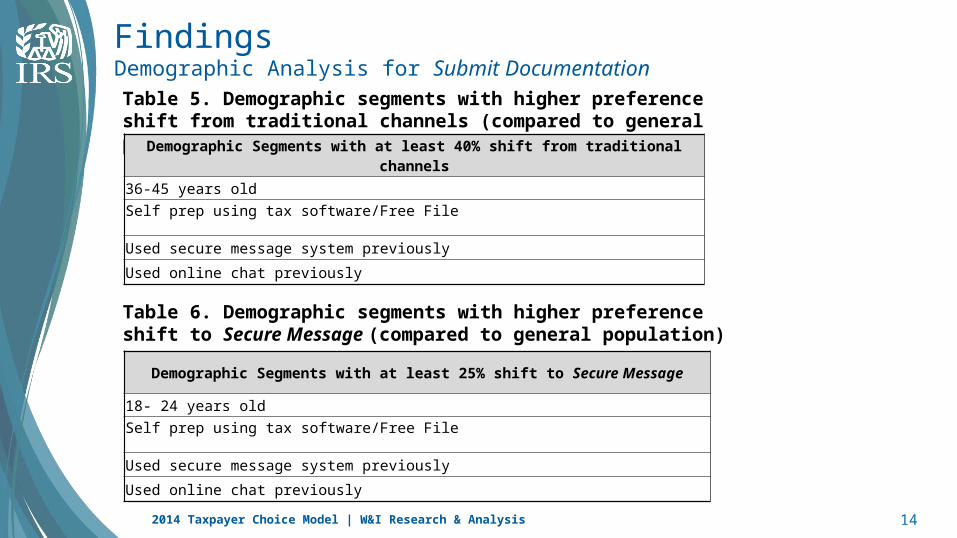
FindingsDemographic Analysis for Submit Documentation
Table 5. Demographic segments with higher preference shift from traditional channels (compared to general population)
Demographic Segments with at least 40% shift from traditional channels
36-45 years old
Self prep using tax software/Free File
Used secure message system previously
Used online chat previously
Table 6. Demographic segments with higher preference shift to Secure Message (compared to general population)
Demographic Segments with at least 25% shift to Secure Message
18- 24 years old
Self prep using tax software/Free File
Used secure message system previously
Used online chat previously
Overall preference shift away from Phone is similar for all demographic groups• 89% for all taxpayers
• Demographic segment range: 81-92%
Demographic segments with higher preference shift to Automatic Text Notification (Top 3)• Post-filing contact (41% preference shift)
• 18-24 years old (36% preference shift)
• 36-45 years old (34% preference shift)
2014 Taxpayer Choice Model | W&I Research & Analysis 15
Findings Demographic Analysis for Status of a Case
Conclusions
Creating alternative service channels for getting the status of a case or transaction could potentially reduce phone contacts.
• High volume of phone contacts for this task• Other research corroborates TCM
Secure messaging has the potential to shift preference from traditional channels.Potential avenues for increasing awareness of new digital communication products:
• Tax software/Free File site• Notice language/inserts (for automatic text notification of status
changes)2014 Taxpayer Choice Model | W&I Research & Analysis 16