2014 power supply assessment
TRANSCRIPT
2014 Power Supply Assessment WECC Staff
September 2014
155 North 400 West, Suite 200
Salt Lake City, Utah 84103-1114
2014 Power Supply Assessment ii
W E S T E R N E L E C T R I C I T Y C O O R D I N A T I N G C O U N C I L
Contents Introduction ...................................................................................................................................... 1
Purpose ............................................................................................................................................ 1
Methodology .................................................................................................................................... 2
Building Block Reserve Margin ............................................................................................................... 2
Case Descriptions .................................................................................................................................... 4
Temperature Adder ................................................................................................................................ 5
Demand ................................................................................................................................................... 6
Generation Resources ............................................................................................................................. 6
Transmission and Capacity Transfers ..................................................................................................... 8
Summary of Assessment Results ....................................................................................................... 8
Study Caveats .......................................................................................................................................... 9
Summary of Assessment Results: WECC – Summer ............................................................................. 11
Summary of Assessment Results: WECC – Winter ............................................................................... 12
Summary of Assessment Results: NWPP – Summer ............................................................................ 13
Summary of Assessment Results: NWPP – Winter ............................................................................... 14
Summary of Assessment Results: RMRG – Summer ............................................................................ 15
Summary of Assessment Results: RMRG – Winter ............................................................................... 16
Summary of Assessment Results: SRSG – Summer .............................................................................. 17
Summary of Assessment Results: SRSG – Winter ................................................................................. 18
Summary of Assessment Results: CA/MX – Summer ........................................................................... 19
Summary of Assessment Results: CA/MX – Winter .............................................................................. 20
Summary of Assessment Results: Cases 9 and 10: 1-in-20 Temperature ............................................ 21
Appendix A – Zonal Topology Diagrams ........................................................................................... 22
2014 Power Supply Assessment 1
W E S T E R N E L E C T R I C I T Y C O O R D I N A T I N G C O U N C I L
Introduction
The 2014 Western Electricity Coordinating Council (WECC) Power Supply Assessment (PSA) is an evaluation of generation resource reserve margins for the WECC summer and winter peak hours for the forecast period 2015 through 2024. The members of the Reliability Assessment Work Group (RAWG) have the responsibility to establish the tools, methodology, and data requirements for conducting the annual PSA. The responsibility, as assigned by the Planning Coordination Committee, is described in detail in the WECC PSA Policy.1
Purpose
The purpose of this report is to present the results of the PSA that was conducted during the third quarter of 2014. The studies cover the summer period from 2015 through 2024 and the winter period from 2015/16 through 2024/25. The input data represent the Loads and Resources (LAR) data submitted in March 2014 by the individual WECC Balancing Authorities (BA).
The capacity assessment identifies subregions within WECC that have the potential for electricity supply shortages for the study period based on reported actual and forecasted demand, existing and forecasted resource, and transmission transfer capability. The ABB/Ventyx modeling tool, Promod IV (Promod),2 was used to conduct the assessment that includes 19 load and generation zones (zone) aggregated into the four subregions modeled for the PSA. The zonal results are aggregated to subregions to maintain load forecast confidentiality in years two and three of the forecast period as required by the WECC Information Sharing Policy.3 The aggregation of zones into subregions is detailed in the Loads and Resources Methods and Assumptions4 document and in Table 1.
Seasonal Planning Reserve Margins (PRM) are reported for each of the four subregions. The PRM is a measure of a subregion’s ability to meet its total load requirements with resources in the subregion and transmission-constrained import capability from other subregions. The PRM is calculated as a percentage of resources (generation and transfers) and load, and is the percentage of capacity greater than demand.5 The calculated PRM is compared to subregional Building Block reserve margins as this
1 WECC Power Supply Assessment Policy: https://www.wecc.biz/Corporate/PSA_Policy.pdf 2 Additional information regarding the Promod Model can be found on the ABB/Ventyx website. http://www.ventyx.com/en/enterprise/business-operations/business-products/promod-iv 3 WECC Information Sharing Policy: https://www.wecc.biz/Corporate/Information Sharing Policy_06-05-14.pdf 4 LAR Methods and Assumptions: https://www.wecc.biz/Reliability/2014LAR_MethodsAssumptions.pdf 5 The PRM calculation indicates sufficient resources when the PRM is equal to or greater than the BBM.
2014 Power Supply Assessment 2
W E S T E R N E L E C T R I C I T Y C O O R D I N A T I N G C O U N C I L
assessment’s indicator of reserve adequacy. These subregional PRMs are reported in the Summary of Assessment Results section, along with the associated Building Block reserve margins.6
Methodology
For purposes of reliability assessments, the WECC Region is divided into 19 zones. The zones are configured around demand centers and transmission hubs. The subregions and their zones are identified in Table 1 on page 3.
A production cost model is used to calculate a supply/demand balance and the associated power transfers among the zones. Resources are allocated to maintain capacity resource adequacy within the individual subregions first. Then available excess capacity is used to meet the needs of other subregions. Data elements needed for the model to calculate the WECC-wide and subregional PRMs are collected from the 38 BAs in WECC. These elements include:
• monthly and annual peak demand and energy forecasts; • expected generation availability; • actual hourly energy output of energy-limited resources; and • a simplified transmission configuration that reflects nominal power transfer capability limits.
The assessment model is designed to measure the supply/demand margins based on the forecasts of monthly peak demands and expected available resources. While peak demand forecasts for future years are readily available from BAs, the forecasts for future resources additions are less certain. Therefore, the certainty associated with the results decreases as one looks further into the future.
Building Block Reserve Margin
The Building Block reserve margins (BBM) were developed under the direction of the Loads and Resources Subcommittee7 to consider four uncertainties that BAs face:
1. Contingency Reserves; 2. Regulating Reserves; 3. reserves for generation forced outages; and 4. reserves for 1-in-10 weather events.
6 The margins identified throughout the assessment are planning reserve margins and firm load would not be disrupted to maintain these margins. Rather, the margins are reference points that indicate areas that have lower reserves and smaller margins. The smaller margins are not forecasts of resource shortages. However, areas with smaller margins have a higher possibility, although not likelihood, of resource shortages associated with extreme events such as record-setting temperature deviations. 7 The Loads and Resources Subcommittee was consolidated with the Reliability Performance Evaluation Work Group into the Reliability Assessment Work Group in March 2014.

2014 Power Supply Assessment 3
W E S T E R N E L E C T R I C I T Y C O O R D I N A T I N G C O U N C I L
Definitions and details of the BBM elements are available in the LAR Methods and Assumptions document.8
The Loads and Resources Subcommittee develops separate BBM values for each BA and then aggregated by subregion using a megawatt-based weighted average. It is important to note that the values for the planning reserve margins used in the PSA are not the requirements used by individual Load-Serving Entities, or their regulators, or local governing boards to evaluate their standards for individual resource adequacy. Moreover, they are not intended to supplant any of those requirements. There is at least one zone that is a competitive wholesale market for which there is no mandated reserve margin.
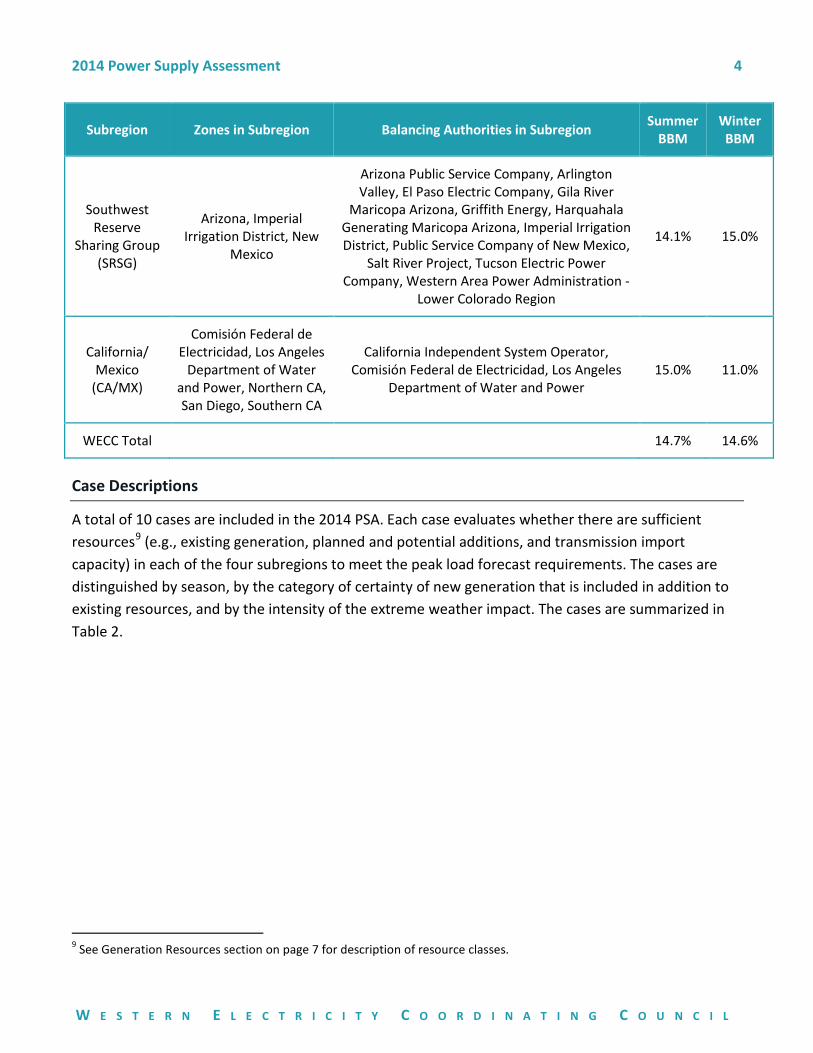
The Building Block reserve margin (BBM) used for each subregion is shown in Table 1.
Table 1 - Subregion Aggregation and Seasonal Margins
Subregion Zones in Subregion Balancing Authorities in Subregion Summer BBM
Winter BBM
Northwest Power Pool
(NWPP)
Alberta, Balancing Authority of Northern
California, British Columbia, Idaho,
Montana, Northern Nevada, Pacific
Northwest, Southern Nevada, Utah, Western
Wyoming
Alberta Electric System Operator, Avista Corporation, Balancing Authority of Northern California, Bonneville Power Administration -
Transmission, British Columbia Hydro and Power Authority, Constellation Energy Control and Dispatch, Idaho Power Company, NaturEner Glacier Wind Energy, NaturEner West Wind,
Nevada Power Company, Northwestern Energy, PacifiCorp - East, PacifiCorp - West, Portland
General Electric Company, PUD No. 1 of Chelan County, PUD No. 2 of Grant County, PUD No. 1
of Douglas County, Puget Sound Energy, Seattle Department of Lighting, Tacoma Power, Turlock
Irrigation District, Western Area Power Administration - Upper Great Plains West
15.5% 16.8%
Rocky Mountain
Reserve Group (RMRG)
Colorado, Eastern Wyoming
Public Service Company of Colorado, Western Area Power Administration - Colorado-Missouri
Region 13.2% 15.0%
8 LAR Methods and Assumptions: https://www.wecc.biz/Reliability/2014LAR_MethodsAssumptions.pdf
2014 Power Supply Assessment 4
W E S T E R N E L E C T R I C I T Y C O O R D I N A T I N G C O U N C I L
Subregion Zones in Subregion Balancing Authorities in Subregion Summer BBM
Winter BBM
Southwest Reserve
Sharing Group (SRSG)
Arizona, Imperial Irrigation District, New
Mexico
Arizona Public Service Company, Arlington Valley, El Paso Electric Company, Gila River
Maricopa Arizona, Griffith Energy, Harquahala Generating Maricopa Arizona, Imperial Irrigation District, Public Service Company of New Mexico,
Salt River Project, Tucson Electric Power Company, Western Area Power Administration -
Lower Colorado Region
14.1% 15.0%
California/ Mexico
(CA/MX)
Comisión Federal de Electricidad, Los Angeles
Department of Water and Power, Northern CA, San Diego, Southern CA
California Independent System Operator, Comisión Federal de Electricidad, Los Angeles
Department of Water and Power 15.0% 11.0%
WECC Total
14.7% 14.6%
Case Descriptions
A total of 10 cases are included in the 2014 PSA. Each case evaluates whether there are sufficient resources9 (e.g., existing generation, planned and potential additions, and transmission import capacity) in each of the four subregions to meet the peak load forecast requirements. The cases are distinguished by season, by the category of certainty of new generation that is included in addition to existing resources, and by the intensity of the extreme weather impact. The cases are summarized in Table 2.
9 See Generation Resources section on page 7 for description of resource classes.

2014 Power Supply Assessment 5
W E S T E R N E L E C T R I C I T Y C O O R D I N A T I N G C O U N C I L
Table 2 - Case Descriptions
Case Season New Resources Margin
1 Summer Class 1 Building Blocks
2 Summer Class 1 and 2 Building Blocks
3 Summer Class 1 through 3 Building Blocks
4 Summer Class 1 through 4 Building Blocks
5 Winter Class 1 Building Blocks
6 Winter Class 1 and 2 Building Blocks
7 Winter Class 1 through 3 Building Blocks
8 Winter Class 1 through 4 Building Blocks
9 Summer Class 1 through 3 All Subregions: 1-in-20 Temperature
10 Winter Class 1 through 3 All Subregions: 1-in-20 Temperature
The common elements used in all of the cases include:
• existing generation as of December 31, 2013; • Class 1 (Under Construction) generation additions10; • scheduled maintenance/inoperable generation; • hydro energy under adverse water conditions; and • total firm and non-firm demand.
Datasheets containing aggregated demand, capacity, and transfers for all cases and subregions are available on the WECC website.11
Temperature Adder
The impacts of a 1-in-20 year temperature demand event were examined in Case 9 for summer and Case 10 for winter. These cases included resources in classes 1, 2 and 3.
10 The term “additions” refers to both generation additions and retirements. 11 PSA datasheets: https://www.wecc.biz/ReliabilityAssessment

2014 Power Supply Assessment 6
W E S T E R N E L E C T R I C I T Y C O O R D I N A T I N G C O U N C I L
The WECC BAs were asked to report their load sensitivity to temperature (megawatts per degree Fahrenheit for both summer and winter), the temperatures on which their reported 1-in-2 demand forecasts were based, and their temperature extremes. Historical temperature data for the Western Interconnection load centers was developed for the period 1990 to 2004 by a consultant at Lawrence Berkeley National Laboratory. Historic temperature data for the period of 2005-2013 was requested in WECC data requests. A statistical process was used to convert the 1-in-2 year weather demand supplied in the data request responses to a 1-in-20 year weather demand condition. This process is described in detail in the Temperature Adders section of the Loads and Resources Methods and Assumptions document.
Demand
BA historical hourly load shapes are averaged and scaled by BA-level peak demand and energy load forecasts (1-in-2 year probability). The scaled BA-level hourly load shapes are aggregated to create region and subregion coincident 1-in-2 year load projections. The BA-level peak demand and energy load forecasts are based on assumed average weather and expected economic conditions. The total internal demands presented in the datasheets12 for this assessment reflect extractions of the demands coincident with the WECC Region seasonal (summer and winter) peak maximum demands.
The non-firm demands include interruptible and load management demands as reported in the LAR data request responses. The BA-level forecast submittals to WECC are generally based on their most recently-approved forecasts. As such, there may be a significant time lapse between expected conditions at the time the forecast preparation was initiated and the expected conditions as of the publication of this assessment. This time-lapse effect may result in over-forecasts during declining economic conditions and under-forecasts during periods of rapid economic expansion.
Generation Resources
Resources represented in the WECC assessment model are limited to generation that is available, or is expected to be available, to serve the forecasted load during the seasonal peaks. Any generation that is not metered by a BA’s energy management system is excluded, as is the load that is being served by that generation. Hence, distributed generation, such as residential rooftop solar facilities and other behind-the-meter generation and its associated load is not included in this assessment. The LAR data request responses contain a list of existing generation as well as planned generation additions, changes, and retirements.13 Below is a description of the generation resource classes.
• Existing Generation is generation that is available (in-service) as of December 31, 2013.
12 PSA datasheets: https://www.wecc.biz/ReliabilityAssessment 13 A detailed list is available in the PSA datasheets.

2014 Power Supply Assessment 7
W E S T E R N E L E C T R I C I T Y C O O R D I N A T I N G C O U N C I L
• New Generation is reported in four classes (reported as of December 31, 2013):
o Class 1: Generation additions/retirements that were reported to be under active construction as of the reporting date of December 31, 2013 and are projected to be in-service/retired prior to January 2019. Class 1 also includes facilities or units that have a firm retirement date within the assessment period14 as a result of regulatory requirements or corporate decisions.
o Class 2: Generation additions/retirements that were reported to have:
1) received regulatory approval or are to undergo regulatory review;
2) a signed interconnection agreement; or
3) an expected on-line/retirement date prior to January 2021.
This class includes resources that were expected to be in-service as early as Class 1 resources, but did not meet the test of being under construction; or have an estimated retirement date within the assessment period.
o Class 3: Generation additions/retirements that were reported and met the North American Electric Reliability Corporation (NERC) criteria for Tier 215 but do not qualify as WECC Class 1 or 2 resources.
o Class 4: Generation additions/retirements that were reported and met the NERC criteria for Tier 3.16
Hydro generation in the model is constrained by annual energy limits. Actual energy production from the year 2003 is modeled to limit Northwest Hydro generation and the actual energy production for the year 2002 is modeled to limit California Hydro generation. These two years were selected by WECC’s Transmission Expansion Planning Policy Committee (TEPPC) Data Work Group as low water years and best reflect adverse hydro conditions.
Inoperable generation and scheduled maintenance are treated as reductions in available capacity. Inoperable generation is reported in the LAR data request responses. The model calculates scheduled maintenance considering seasonal demand peaks to maximize available capacity during the individual subregional peak periods, not for the entire Western Interconnection. The majority of the summer outages are scheduled for generation in the Canada and Northwest subregions. Other areas try to have all their units available for the summer peak. The generation owners in the summer peaking subregions usually schedule their maintenance in the fall or spring.
14 The assessment period is from 2015 through 2024 for summer and from 2015/16 through 2024/25 for winter. 15 Definition included in the NERC Long-Term Reliability Assessment (LTRA): http://www.nerc.com/pa/RAPA/ra/Pages/default.aspx. 16 Ibidem.
2014 Power Supply Assessment 8
W E S T E R N E L E C T R I C I T Y C O O R D I N A T I N G C O U N C I L
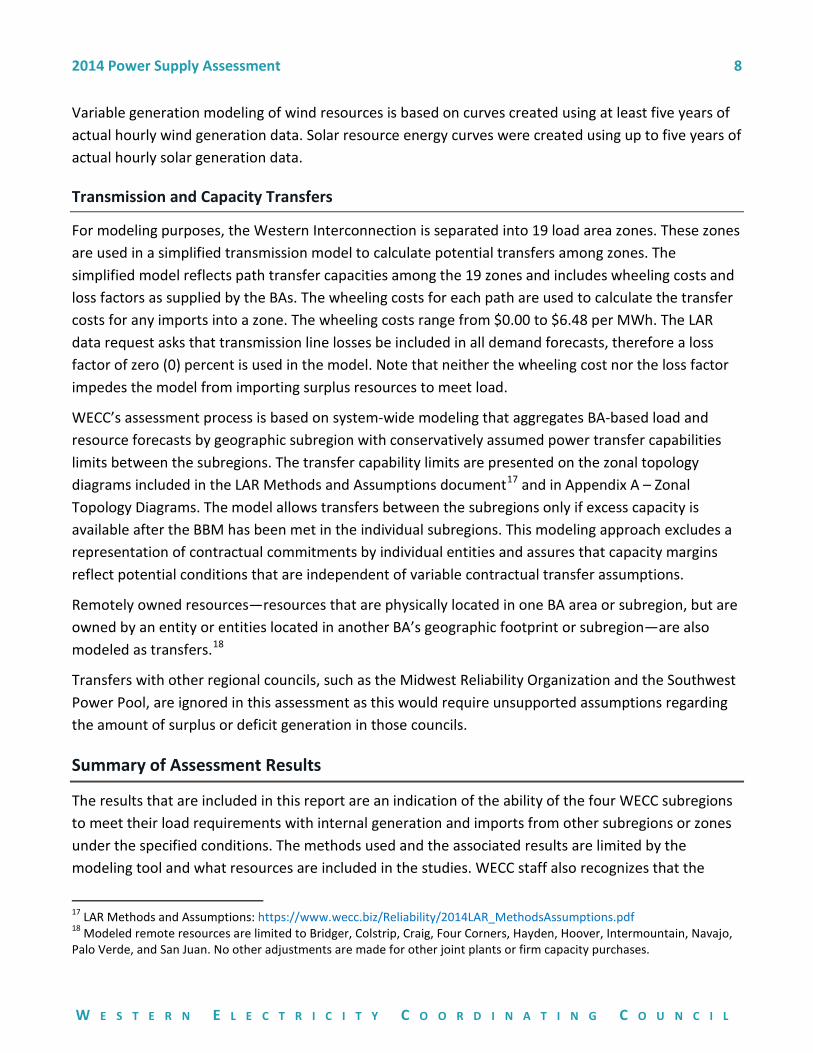
Variable generation modeling of wind resources is based on curves created using at least five years of actual hourly wind generation data. Solar resource energy curves were created using up to five years of actual hourly solar generation data.
Transmission and Capacity Transfers
For modeling purposes, the Western Interconnection is separated into 19 load area zones. These zones are used in a simplified transmission model to calculate potential transfers among zones. The simplified model reflects path transfer capacities among the 19 zones and includes wheeling costs and loss factors as supplied by the BAs. The wheeling costs for each path are used to calculate the transfer costs for any imports into a zone. The wheeling costs range from $0.00 to $6.48 per MWh. The LAR data request asks that transmission line losses be included in all demand forecasts, therefore a loss factor of zero (0) percent is used in the model. Note that neither the wheeling cost nor the loss factor impedes the model from importing surplus resources to meet load.
WECC’s assessment process is based on system-wide modeling that aggregates BA-based load and resource forecasts by geographic subregion with conservatively assumed power transfer capabilities limits between the subregions. The transfer capability limits are presented on the zonal topology diagrams included in the LAR Methods and Assumptions document17 and in Appendix A – Zonal Topology Diagrams. The model allows transfers between the subregions only if excess capacity is available after the BBM has been met in the individual subregions. This modeling approach excludes a representation of contractual commitments by individual entities and assures that capacity margins reflect potential conditions that are independent of variable contractual transfer assumptions.
Remotely owned resources—resources that are physically located in one BA area or subregion, but are owned by an entity or entities located in another BA’s geographic footprint or subregion—are also modeled as transfers.18
Transfers with other regional councils, such as the Midwest Reliability Organization and the Southwest Power Pool, are ignored in this assessment as this would require unsupported assumptions regarding the amount of surplus or deficit generation in those councils.
Summary of Assessment Results
The results that are included in this report are an indication of the ability of the four WECC subregions to meet their load requirements with internal generation and imports from other subregions or zones under the specified conditions. The methods used and the associated results are limited by the modeling tool and what resources are included in the studies. WECC staff also recognizes that the
17 LAR Methods and Assumptions: https://www.wecc.biz/Reliability/2014LAR_MethodsAssumptions.pdf 18 Modeled remote resources are limited to Bridger, Colstrip, Craig, Four Corners, Hayden, Hoover, Intermountain, Navajo, Palo Verde, and San Juan. No other adjustments are made for other joint plants or firm capacity purchases.
2014 Power Supply Assessment 9
W E S T E R N E L E C T R I C I T Y C O O R D I N A T I N G C O U N C I L
specific subregions may have adopted other tools, metrics and study assumptions that could result in different conclusions. For example, the Northwest region, via the Northwest Power & Planning Council, completed an assessment in 2012 that indicates risk (above the adopted regional standard) to resource adequacy if additional dispatchable resources are not built by 2017.
The results, as detailed in in the following sections show sufficient generation resources exist or have been proposed such that all subregions meet the calculated BBM.
Study Caveats
Among the important caveats that should be considered when reviewing these results are:
1. The analysis is based on LAR data submitted in March 2014. The demand forecasts and reported resources for each BA were “locked” as of May 2014. New generation projects announced after the data were “locked” are not included in the resource totals.
2. WECC does not speculate which units may retire due to environmental requirements or financial considerations. Therefore, only generating units that were reported with a planned retirement date are incorporated in these studies.
3. Results of this assessment may differ from the results of similar assessments performed by other parties.
4. Case results are specific to the assumptions used for these studies. The use of different assumptions will produce different results.
5. Transmission constraints apply only between zones. All generation within a zone is deemed deliverable within the zone.
6. Promod IV is an energy planning and analysis software tool that has production cost dispatch model capability. The model transfers resources from areas with surplus generation to deficit areas, considering transfer path constraints and transmission losses. Simultaneous flows, loop flows, and other transfer restrictions are approximated by the restricted transfer limits that were used in the studies, but the model is a transport model, not a power flow model.
7. The Promod model allows WECC staff to capture the Western Interconnection coincidental peak demand. The model uses static hourly demand curves for each BA within WECC. These curves were created by averaging five years of actual hourly demand for each BA. Promod uses an algorithm with the amounts of monthly peak and energy supplied by each BA to modify these curves for each year of the study period. The algorithm “fixes” the monthly peak at the amount supplied by the BA and adjusts the curves up or down to match the demand under the curve to the annual energy reported. This process “flattens” the annual demand curve if the energy load growth rate exceeds the peak demand growth rate. The
2014 Power Supply Assessment 10
W E S T E R N E L E C T R I C I T Y C O O R D I N A T I N G C O U N C I L
process also “peaks” the annual curve if the energy load growth rate is less than the peak demand growth rate.
8. For hydro plants in the Northwest and California, the model employs an algorithm that shapes the available hydro energy based on the shape of the area’s energy load. This means there can be hydro capacity that is unavailable because it is constrained by the available energy in the hydro system.
9. Variable generation modeling of wind resources is based on curves created using at least five years actual hourly wind generation data. The data is averaged into six four-hour blocks for each day of each week of the year. Solar resource energy curves were created using up to five years actual hourly solar generation data. The data is averaged into three-block curves for each day of each week of the year. The use of average generation removes the hourly peaks and valleys in wind and solar generation while maintaining a reasonable representation of variable energy output.
10. As utilities adjust their procurement processes to rely on renewable resources in compliance with various state Renewable Portfolio Standards, and to rely less on highly-visible central station projects, the limitations of the current resource classification process become more visible. The current process may not capture short lead-time projects, such as wind and solar, that are being developed.

2014 Power Supply Assessment 11
W E S T E R N E L E C T R I C I T Y C O O R D I N A T I N G C O U N C I L
Summary of Assessment Results: WECC – Summer
The numbers represented here are a summary from the PSA datasheets and cannot be used independently to replicate the assessment results. For complete information, please access the PSA datasheets posted on the WECC website.
WECC: Case 1 – Existing/Class 1 Resources Summer Results
2015 2016 2017 2018 2019 2020 2021 2022 2023 2024
Net Internal Demand 153,954 153,533 155,872 158,226 160,345 162,172 163,745 165,415 167,175 169,314 Anticipated Internal Capacity 196,764 200,099 200,690 200,332 200,219 199,706 199,012 198,562 198,416 198,011
Wind Expected On-Peak MW 6,697 6,697 6,697 6,697 6,697 6,697 6,697 6,697 6,697 6,697 Percentage of Wind Capacity 32.2% 32.2% 32.2% 32.2% 32.2% 32.2% 32.2% 32.2% 32.2% 32.2% Solar Expected On-Peak MW 2,177 2,177 2,177 2,177 2,177 2,177 2,177 2,177 2,177 2,177 Percentage of Solar Capacity 37.5% 37.5% 37.5% 37.5% 37.5% 37.5% 37.5% 37.5% 37.5% 37.5% Hydro Expected On-Peak MW 40,608 40,608 40,563 40,561 40,561 40,561 40,435 40,435 40,435 40,435 Percentage of Hydro Capacity 62.1% 62.1% 62.1% 62.1% 62.1% 62.1% 62.1% 62.1% 62.1% 62.1%
Anticipated Resource Reserve Margin MW 41,990 44,390 43,010 40,058 38,124 36,858 34,551 32,110 29,489 27,093 Anticipated Resource Reserve Margin % 27.3% 28.9% 27.6% 25.3% 23.8% 22.7% 21.1% 19.4% 17.6% 16.0%
0.0%
5.0%
10.0%
15.0%
20.0%
25.0%
30.0%
35.0%
2015 2016 2017 2018 2019 2020 2021 2022 2023 2024
WECC: Case 1 through 4 - Summer Results
Existing and Class 1
Existing and Class 1 through 2
Existing and Class 1 through 3
Existing and Class 1 through 4
BBM - Summer 14.7%
2014 Power Supply Assessment 12
W E S T E R N E L E C T R I C I T Y C O O R D I N A T I N G C O U N C I L
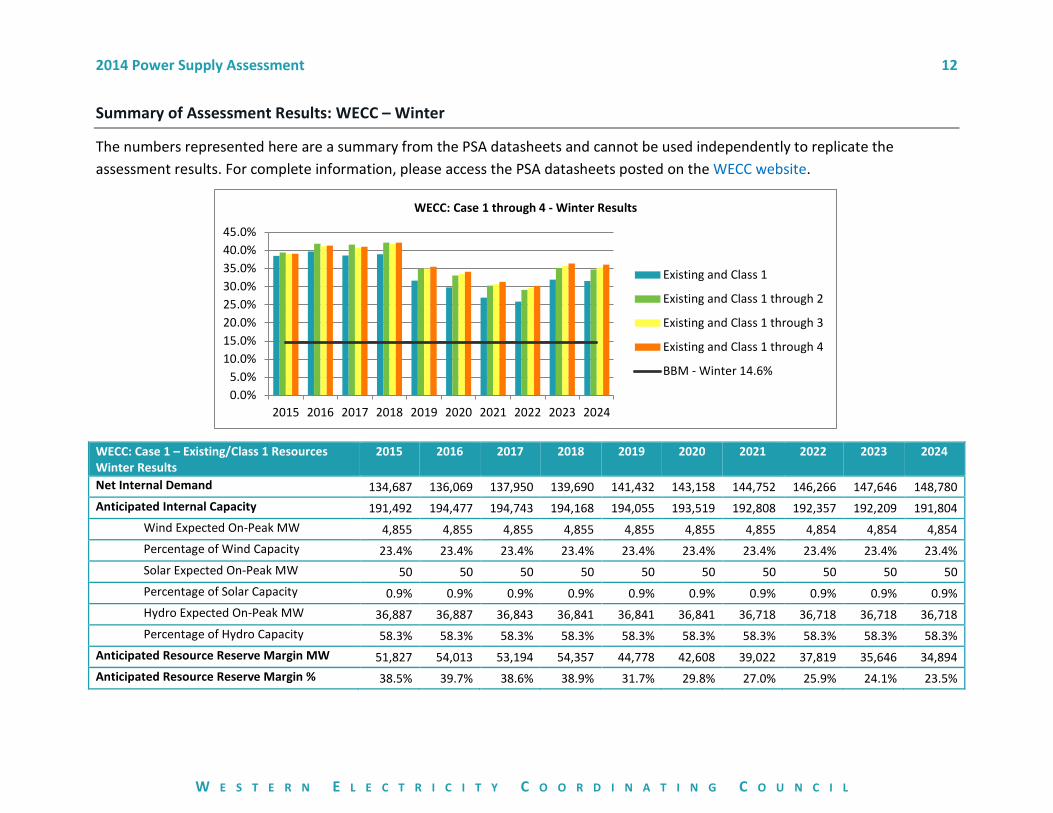
Summary of Assessment Results: WECC – Winter
The numbers represented here are a summary from the PSA datasheets and cannot be used independently to replicate the assessment results. For complete information, please access the PSA datasheets posted on the WECC website.
WECC: Case 1 – Existing/Class 1 Resources Winter Results
2015 2016 2017 2018 2019 2020 2021 2022 2023 2024
Net Internal Demand 134,687 136,069 137,950 139,690 141,432 143,158 144,752 146,266 147,646 148,780 Anticipated Internal Capacity 191,492 194,477 194,743 194,168 194,055 193,519 192,808 192,357 192,209 191,804
Wind Expected On-Peak MW 4,855 4,855 4,855 4,855 4,855 4,855 4,855 4,854 4,854 4,854 Percentage of Wind Capacity 23.4% 23.4% 23.4% 23.4% 23.4% 23.4% 23.4% 23.4% 23.4% 23.4% Solar Expected On-Peak MW 50 50 50 50 50 50 50 50 50 50 Percentage of Solar Capacity 0.9% 0.9% 0.9% 0.9% 0.9% 0.9% 0.9% 0.9% 0.9% 0.9% Hydro Expected On-Peak MW 36,887 36,887 36,843 36,841 36,841 36,841 36,718 36,718 36,718 36,718 Percentage of Hydro Capacity 58.3% 58.3% 58.3% 58.3% 58.3% 58.3% 58.3% 58.3% 58.3% 58.3%
Anticipated Resource Reserve Margin MW 51,827 54,013 53,194 54,357 44,778 42,608 39,022 37,819 35,646 34,894 Anticipated Resource Reserve Margin % 38.5% 39.7% 38.6% 38.9% 31.7% 29.8% 27.0% 25.9% 24.1% 23.5%
0.0%5.0%
10.0%15.0%20.0%25.0%30.0%35.0%40.0%45.0%
2015 2016 2017 2018 2019 2020 2021 2022 2023 2024
WECC: Case 1 through 4 - Winter Results
Existing and Class 1
Existing and Class 1 through 2
Existing and Class 1 through 3
Existing and Class 1 through 4
BBM - Winter 14.6%
2014 Power Supply Assessment 13
W E S T E R N E L E C T R I C I T Y C O O R D I N A T I N G C O U N C I L
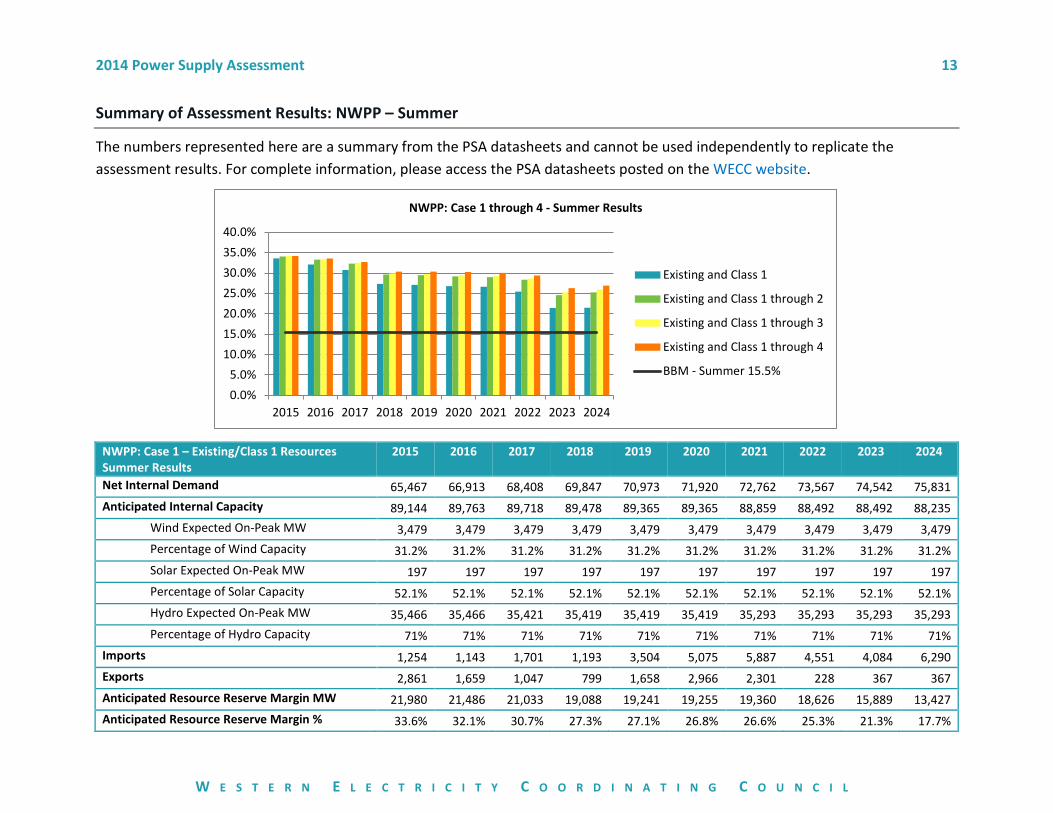
Summary of Assessment Results: NWPP – Summer
The numbers represented here are a summary from the PSA datasheets and cannot be used independently to replicate the assessment results. For complete information, please access the PSA datasheets posted on the WECC website.
NWPP: Case 1 – Existing/Class 1 Resources Summer Results
2015 2016 2017 2018 2019 2020 2021 2022 2023 2024
Net Internal Demand 65,467 66,913 68,408 69,847 70,973 71,920 72,762 73,567 74,542 75,831 Anticipated Internal Capacity 89,144 89,763 89,718 89,478 89,365 89,365 88,859 88,492 88,492 88,235
Wind Expected On-Peak MW 3,479 3,479 3,479 3,479 3,479 3,479 3,479 3,479 3,479 3,479 Percentage of Wind Capacity 31.2% 31.2% 31.2% 31.2% 31.2% 31.2% 31.2% 31.2% 31.2% 31.2% Solar Expected On-Peak MW 197 197 197 197 197 197 197 197 197 197 Percentage of Solar Capacity 52.1% 52.1% 52.1% 52.1% 52.1% 52.1% 52.1% 52.1% 52.1% 52.1% Hydro Expected On-Peak MW 35,466 35,466 35,421 35,419 35,419 35,419 35,293 35,293 35,293 35,293 Percentage of Hydro Capacity 71% 71% 71% 71% 71% 71% 71% 71% 71% 71%
Imports 1,254 1,143 1,701 1,193 3,504 5,075 5,887 4,551 4,084 6,290 Exports 2,861 1,659 1,047 799 1,658 2,966 2,301 228 367 367 Anticipated Resource Reserve Margin MW 21,980 21,486 21,033 19,088 19,241 19,255 19,360 18,626 15,889 13,427 Anticipated Resource Reserve Margin % 33.6% 32.1% 30.7% 27.3% 27.1% 26.8% 26.6% 25.3% 21.3% 17.7%
0.0%5.0%
10.0%15.0%20.0%25.0%30.0%35.0%40.0%
2015 2016 2017 2018 2019 2020 2021 2022 2023 2024
NWPP: Case 1 through 4 - Summer Results
Existing and Class 1
Existing and Class 1 through 2
Existing and Class 1 through 3
Existing and Class 1 through 4
BBM - Summer 15.5%

2014 Power Supply Assessment 14
W E S T E R N E L E C T R I C I T Y C O O R D I N A T I N G C O U N C I L
Summary of Assessment Results: NWPP – Winter
The numbers represented here are a summary from the PSA datasheets and cannot be used independently to replicate the assessment results. For complete information, please access the PSA datasheets posted on the WECC website.
NWPP: Case 1 – Existing/Class 1 Resources Winter Results
2015 2016 2017 2018 2019 2020 2021 2022 2023 2024
Net Internal Demand 70,453 71,461 72,892 74,105 75,165 76,157 77,097 77,995 78,864 79,587 Anticipated Internal Capacity 89,145 89,062 89,018 88,778 88,665 88,665 88,153 87,786 87,786 87,529
Wind Expected On-Peak MW 3,258 3,258 3,258 3,258 3,258 3,258 3,258 3,258 3,258 3,258 Percentage of Wind Capacity 29.2% 29.2% 29.2% 29.2% 29.2% 29.2% 29.2% 29.2% 29.2% 29.2% Solar Expected On-Peak MW 0 0 0 0 0 0 0 0 0 0 Percentage of Solar Capacity 0.0% 0.0% 0.0% 0.0% 0.0% 0.0% 0.0% 0.0% 0.0% 0.0% Hydro Expected On-Peak MW 33,695 33,695 33,652 33,649 33,649 33,649 33,526 33,526 33,526 33,526 Percentage of Hydro Capacity 69% 69% 69% 69% 69% 69% 69% 69% 69% 69%
Imports 4,331 3,840 6,203 9,286 9,512 9,425 13,264 14,022 15,220 15,004 Exports 366 366 366 367 366 228 229 228 367 366 Anticipated Resource Reserve Margin MW 19,575 19,855 20,029 20,301 20,470 20,494 20,664 20,819 20,969 21,138 Anticipated Resource Reserve Margin % 27.8% 27.8% 27.5% 27.4% 27.2% 26.9% 26.8% 26.7% 26.6% 26.6%
0.0%
5.0%
10.0%
15.0%
20.0%
25.0%
30.0%
35.0%
2015 2016 2017 2018 2019 2020 2021 2022 2023 2024
NWPP: Case 1 through 4 - Winter Results
Existing and Class 1
Existing and Class 1 through 2
Existing and Class 1 through 3
Existing and Class 1 through 4
BBM - Winter 16.8%

2014 Power Supply Assessment 15
W E S T E R N E L E C T R I C I T Y C O O R D I N A T I N G C O U N C I L
Summary of Assessment Results: RMRG – Summer
The numbers represented here are a summary from the PSA datasheets and cannot be used independently to replicate the assessment results. For complete information, please access the PSA datasheets posted on the WECC website.
RMRG: Case 1 – Existing/Class 1 Resources Summer Results
2015 2016 2017 2018 2019 2020 2021 2022 2023 2024
Net Internal Demand 10,660 9,533 9,663 9,824 9,966 10,107 10,232 10,281 10,419 10,616 Anticipated Internal Capacity 15,067 15,424 15,424 15,240 15,240 15,156 15,066 15,066 15,066 15,066
Wind Expected On-Peak MW 718 718 718 718 718 718 718 718 718 718 Percentage of Wind Capacity 29.7% 29.7% 29.7% 29.7% 29.7% 29.7% 29.7% 29.7% 29.7% 29.7% Solar Expected On-Peak MW 54 54 54 54 54 54 54 54 54 54 Percentage of Solar Capacity 42.8% 42.8% 42.8% 42.8% 42.8% 42.8% 42.8% 42.8% 42.8% 42.8% Hydro Expected On-Peak MW 778 778 778 778 778 778 778 778 778 778 Percentage of Hydro Capacity 39.6% 39.6% 39.6% 39.6% 39.6% 39.6% 39.6% 39.6% 39.6% 39.6%
Imports 598 558 860 860 860 728 453 98 235 235 Exports 414 414 414 414 414 882 2,380 3,450 3,423 3,053 Anticipated Resource Reserve Margin MW 4,446 5,555 6,151 5,857 5,283 4,895 2,907 1,366 1,401 1,412 Anticipated Resource Reserve Margin % 41.7% 58.3% 63.7% 59.6% 53.0% 48.4% 28.4% 13.3% 13.4% 13.3%
0.0%
10.0%
20.0%
30.0%
40.0%
50.0%
60.0%
70.0%
2015 2016 2017 2018 2019 2020 2021 2022 2023 2024
RMRG: Case 1 through 4 - Summer Results
Existing and Class 1
Existing and Class 1 through 2
Existing and Class 1 through 3
Existing and Class 1 through 4
BBM - Summer 13.2%
2014 Power Supply Assessment 16
W E S T E R N E L E C T R I C I T Y C O O R D I N A T I N G C O U N C I L
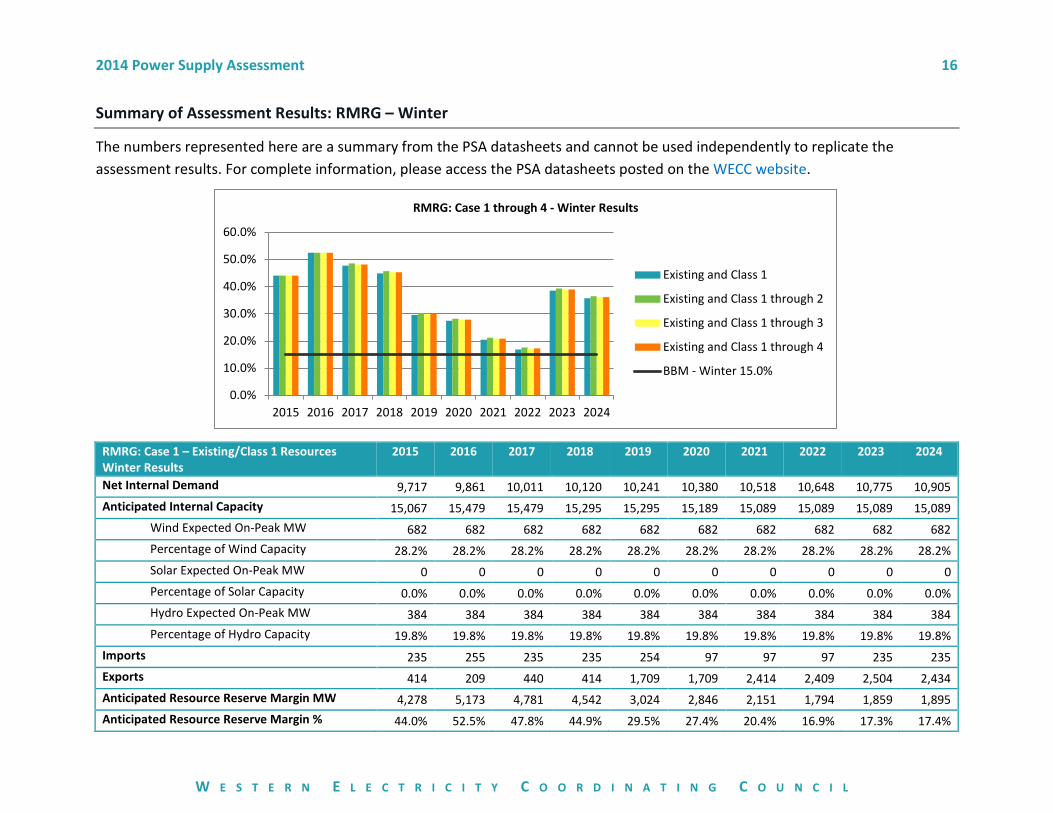
Summary of Assessment Results: RMRG – Winter
The numbers represented here are a summary from the PSA datasheets and cannot be used independently to replicate the assessment results. For complete information, please access the PSA datasheets posted on the WECC website.
RMRG: Case 1 – Existing/Class 1 Resources Winter Results
2015 2016 2017 2018 2019 2020 2021 2022 2023 2024
Net Internal Demand 9,717 9,861 10,011 10,120 10,241 10,380 10,518 10,648 10,775 10,905 Anticipated Internal Capacity 15,067 15,479 15,479 15,295 15,295 15,189 15,089 15,089 15,089 15,089
Wind Expected On-Peak MW 682 682 682 682 682 682 682 682 682 682 Percentage of Wind Capacity 28.2% 28.2% 28.2% 28.2% 28.2% 28.2% 28.2% 28.2% 28.2% 28.2% Solar Expected On-Peak MW 0 0 0 0 0 0 0 0 0 0 Percentage of Solar Capacity 0.0% 0.0% 0.0% 0.0% 0.0% 0.0% 0.0% 0.0% 0.0% 0.0% Hydro Expected On-Peak MW 384 384 384 384 384 384 384 384 384 384 Percentage of Hydro Capacity 19.8% 19.8% 19.8% 19.8% 19.8% 19.8% 19.8% 19.8% 19.8% 19.8%
Imports 235 255 235 235 254 97 97 97 235 235 Exports 414 209 440 414 1,709 1,709 2,414 2,409 2,504 2,434 Anticipated Resource Reserve Margin MW 4,278 5,173 4,781 4,542 3,024 2,846 2,151 1,794 1,859 1,895 Anticipated Resource Reserve Margin % 44.0% 52.5% 47.8% 44.9% 29.5% 27.4% 20.4% 16.9% 17.3% 17.4%
0.0%
10.0%
20.0%
30.0%
40.0%
50.0%
60.0%
2015 2016 2017 2018 2019 2020 2021 2022 2023 2024
RMRG: Case 1 through 4 - Winter Results
Existing and Class 1
Existing and Class 1 through 2
Existing and Class 1 through 3
Existing and Class 1 through 4
BBM - Winter 15.0%
2014 Power Supply Assessment 17
W E S T E R N E L E C T R I C I T Y C O O R D I N A T I N G C O U N C I L
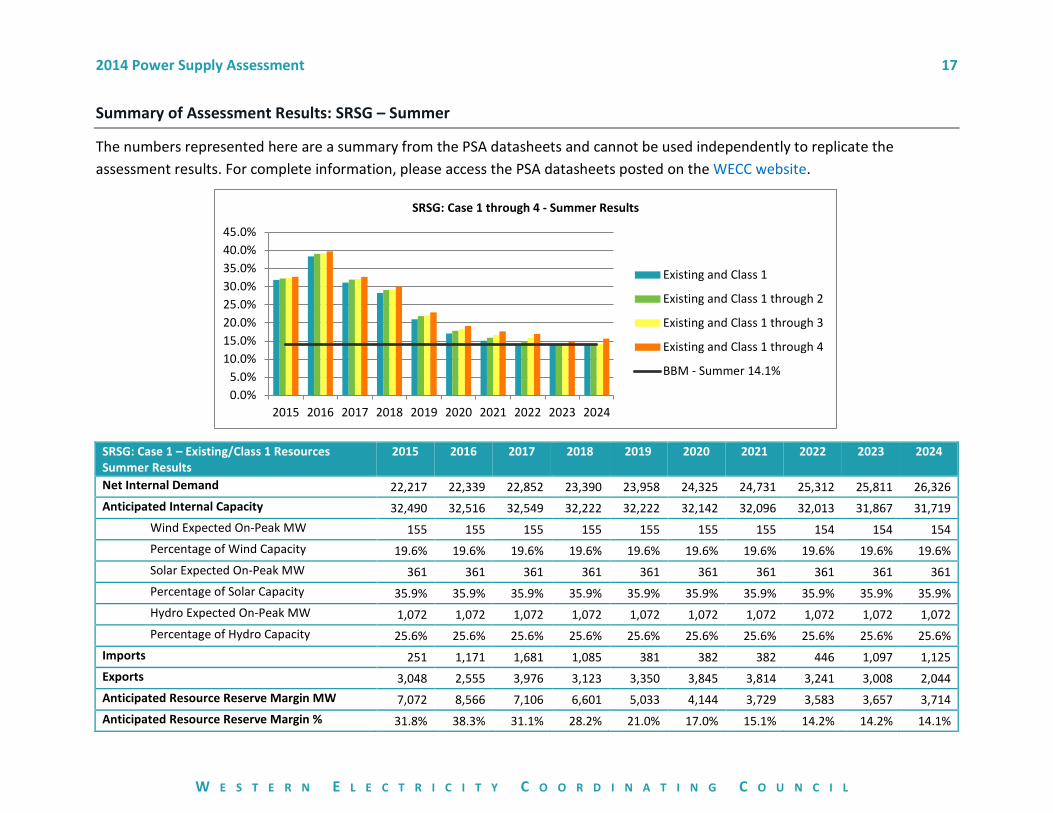
Summary of Assessment Results: SRSG – Summer
The numbers represented here are a summary from the PSA datasheets and cannot be used independently to replicate the assessment results. For complete information, please access the PSA datasheets posted on the WECC website.
SRSG: Case 1 – Existing/Class 1 Resources Summer Results
2015 2016 2017 2018 2019 2020 2021 2022 2023 2024
Net Internal Demand 22,217 22,339 22,852 23,390 23,958 24,325 24,731 25,312 25,811 26,326 Anticipated Internal Capacity 32,490 32,516 32,549 32,222 32,222 32,142 32,096 32,013 31,867 31,719
Wind Expected On-Peak MW 155 155 155 155 155 155 155 154 154 154 Percentage of Wind Capacity 19.6% 19.6% 19.6% 19.6% 19.6% 19.6% 19.6% 19.6% 19.6% 19.6% Solar Expected On-Peak MW 361 361 361 361 361 361 361 361 361 361 Percentage of Solar Capacity 35.9% 35.9% 35.9% 35.9% 35.9% 35.9% 35.9% 35.9% 35.9% 35.9% Hydro Expected On-Peak MW 1,072 1,072 1,072 1,072 1,072 1,072 1,072 1,072 1,072 1,072 Percentage of Hydro Capacity 25.6% 25.6% 25.6% 25.6% 25.6% 25.6% 25.6% 25.6% 25.6% 25.6%
Imports 251 1,171 1,681 1,085 381 382 382 446 1,097 1,125 Exports 3,048 2,555 3,976 3,123 3,350 3,845 3,814 3,241 3,008 2,044 Anticipated Resource Reserve Margin MW 7,072 8,566 7,106 6,601 5,033 4,144 3,729 3,583 3,657 3,714 Anticipated Resource Reserve Margin % 31.8% 38.3% 31.1% 28.2% 21.0% 17.0% 15.1% 14.2% 14.2% 14.1%
0.0%5.0%
10.0%15.0%20.0%25.0%30.0%35.0%40.0%45.0%
2015 2016 2017 2018 2019 2020 2021 2022 2023 2024
SRSG: Case 1 through 4 - Summer Results
Existing and Class 1
Existing and Class 1 through 2
Existing and Class 1 through 3
Existing and Class 1 through 4
BBM - Summer 14.1%
2014 Power Supply Assessment 18
W E S T E R N E L E C T R I C I T Y C O O R D I N A T I N G C O U N C I L
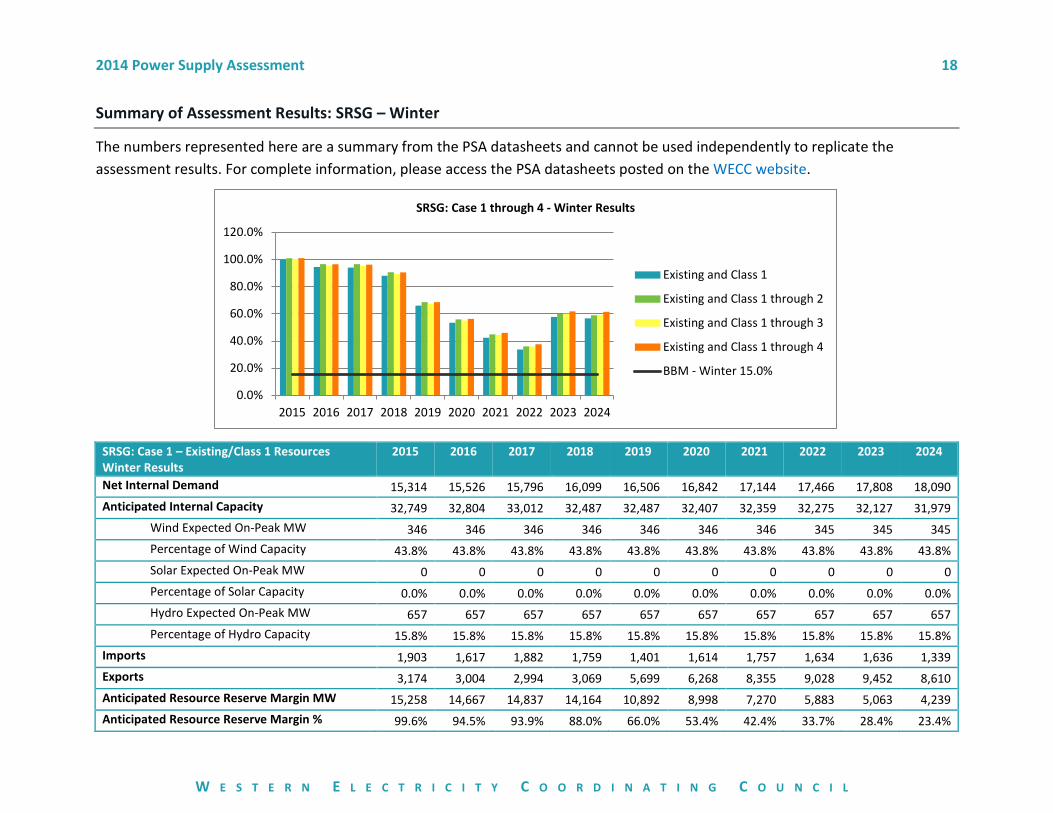
Summary of Assessment Results: SRSG – Winter
The numbers represented here are a summary from the PSA datasheets and cannot be used independently to replicate the assessment results. For complete information, please access the PSA datasheets posted on the WECC website.
SRSG: Case 1 – Existing/Class 1 Resources Winter Results
2015 2016 2017 2018 2019 2020 2021 2022 2023 2024
Net Internal Demand 15,314 15,526 15,796 16,099 16,506 16,842 17,144 17,466 17,808 18,090 Anticipated Internal Capacity 32,749 32,804 33,012 32,487 32,487 32,407 32,359 32,275 32,127 31,979
Wind Expected On-Peak MW 346 346 346 346 346 346 346 345 345 345 Percentage of Wind Capacity 43.8% 43.8% 43.8% 43.8% 43.8% 43.8% 43.8% 43.8% 43.8% 43.8% Solar Expected On-Peak MW 0 0 0 0 0 0 0 0 0 0 Percentage of Solar Capacity 0.0% 0.0% 0.0% 0.0% 0.0% 0.0% 0.0% 0.0% 0.0% 0.0% Hydro Expected On-Peak MW 657 657 657 657 657 657 657 657 657 657 Percentage of Hydro Capacity 15.8% 15.8% 15.8% 15.8% 15.8% 15.8% 15.8% 15.8% 15.8% 15.8%
Imports 1,903 1,617 1,882 1,759 1,401 1,614 1,757 1,634 1,636 1,339 Exports 3,174 3,004 2,994 3,069 5,699 6,268 8,355 9,028 9,452 8,610 Anticipated Resource Reserve Margin MW 15,258 14,667 14,837 14,164 10,892 8,998 7,270 5,883 5,063 4,239 Anticipated Resource Reserve Margin % 99.6% 94.5% 93.9% 88.0% 66.0% 53.4% 42.4% 33.7% 28.4% 23.4%
0.0%
20.0%
40.0%
60.0%
80.0%
100.0%
120.0%
2015 2016 2017 2018 2019 2020 2021 2022 2023 2024
SRSG: Case 1 through 4 - Winter Results
Existing and Class 1
Existing and Class 1 through 2
Existing and Class 1 through 3
Existing and Class 1 through 4
BBM - Winter 15.0%
2014 Power Supply Assessment 19
W E S T E R N E L E C T R I C I T Y C O O R D I N A T I N G C O U N C I L
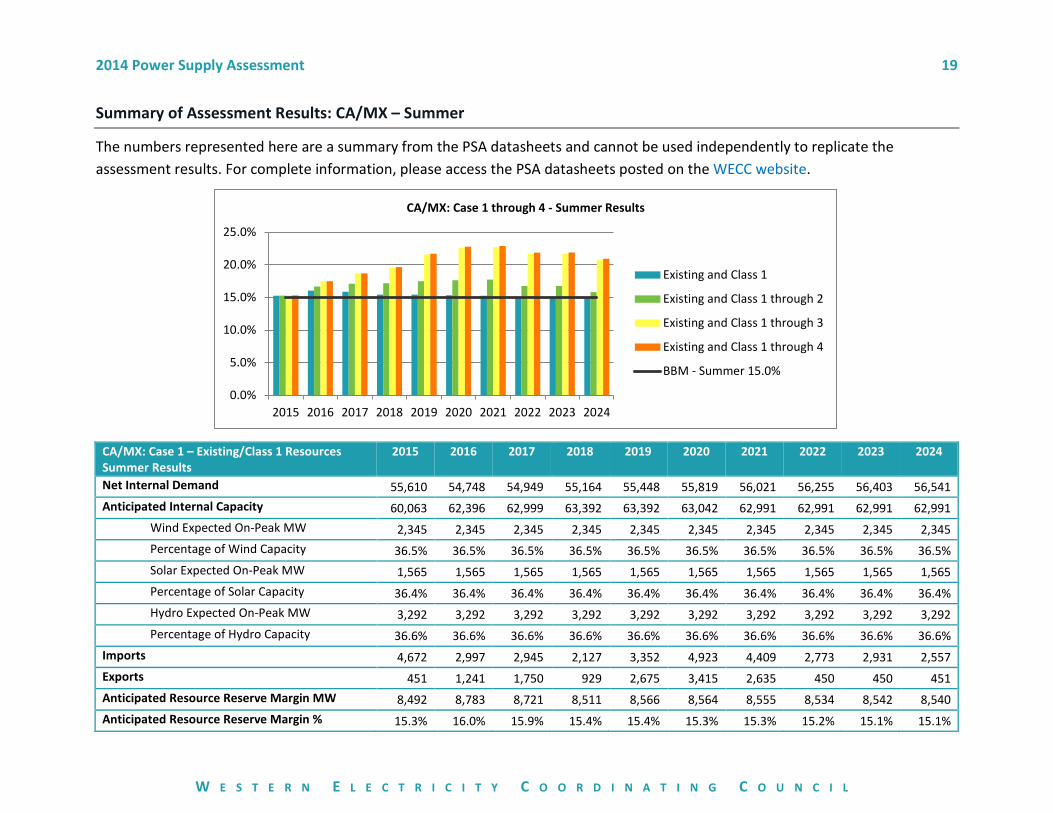
Summary of Assessment Results: CA/MX – Summer
The numbers represented here are a summary from the PSA datasheets and cannot be used independently to replicate the assessment results. For complete information, please access the PSA datasheets posted on the WECC website.
CA/MX: Case 1 – Existing/Class 1 Resources Summer Results
2015 2016 2017 2018 2019 2020 2021 2022 2023 2024
Net Internal Demand 55,610 54,748 54,949 55,164 55,448 55,819 56,021 56,255 56,403 56,541 Anticipated Internal Capacity 60,063 62,396 62,999 63,392 63,392 63,042 62,991 62,991 62,991 62,991
Wind Expected On-Peak MW 2,345 2,345 2,345 2,345 2,345 2,345 2,345 2,345 2,345 2,345 Percentage of Wind Capacity 36.5% 36.5% 36.5% 36.5% 36.5% 36.5% 36.5% 36.5% 36.5% 36.5% Solar Expected On-Peak MW 1,565 1,565 1,565 1,565 1,565 1,565 1,565 1,565 1,565 1,565 Percentage of Solar Capacity 36.4% 36.4% 36.4% 36.4% 36.4% 36.4% 36.4% 36.4% 36.4% 36.4% Hydro Expected On-Peak MW 3,292 3,292 3,292 3,292 3,292 3,292 3,292 3,292 3,292 3,292 Percentage of Hydro Capacity 36.6% 36.6% 36.6% 36.6% 36.6% 36.6% 36.6% 36.6% 36.6% 36.6%
Imports 4,672 2,997 2,945 2,127 3,352 4,923 4,409 2,773 2,931 2,557 Exports 451 1,241 1,750 929 2,675 3,415 2,635 450 450 451 Anticipated Resource Reserve Margin MW 8,492 8,783 8,721 8,511 8,566 8,564 8,555 8,534 8,542 8,540 Anticipated Resource Reserve Margin % 15.3% 16.0% 15.9% 15.4% 15.4% 15.3% 15.3% 15.2% 15.1% 15.1%
0.0%
5.0%
10.0%
15.0%
20.0%
25.0%
2015 2016 2017 2018 2019 2020 2021 2022 2023 2024
CA/MX: Case 1 through 4 - Summer Results
Existing and Class 1
Existing and Class 1 through 2
Existing and Class 1 through 3
Existing and Class 1 through 4
BBM - Summer 15.0%

2014 Power Supply Assessment 20
W E S T E R N E L E C T R I C I T Y C O O R D I N A T I N G C O U N C I L
Summary of Assessment Results: CA/MX – Winter
The numbers represented here are a summary from the PSA datasheets and cannot be used independently to replicate the assessment results. For complete information, please access the PSA datasheets posted on the WECC website.
CA/MX: Case 1 – Existing/Class 1 Resources Winter Results
2015 2016 2017 2018 2019 2020 2021 2022 2023 2024
Net Internal Demand 39,203 39,221 39,251 39,366 39,520 39,780 39,993 40,158 40,199 40,198 Anticipated Internal Capacity 54,531 57,132 57,233 57,608 57,608 57,258 57,207 57,207 57,207 57,207
Wind Expected On-Peak MW 569 569 569 569 569 569 569 569 569 569 Percentage of Wind Capacity 8.9% 8.9% 8.9% 8.9% 8.9% 8.9% 8.9% 8.9% 8.9% 8.9% Solar Expected On-Peak MW 49 49 49 49 49 49 49 49 49 49 Percentage of Solar Capacity 1.1% 1.1% 1.1% 1.1% 1.1% 1.1% 1.1% 1.1% 1.1% 1.1% Hydro Expected On-Peak MW 2,150 2,150 2,150 2,150 2,150 2,150 2,150 2,150 2,150 2,150 Percentage of Hydro Capacity 25.8% 25.8% 25.8% 25.8% 25.8% 25.8% 25.8% 25.8% 25.8% 25.8%
Imports 2,651 2,549 2,559 2,439 1,925 2,330 2,142 2,450 2,460 2,142 Exports 3,167 3,181 3,078 3,120 5,317 5,260 6,287 6,537 7,228 7,309 Anticipated Resource Reserve Margin MW 12,716 14,319 13,548 15,350 10,393 10,270 8,937 9,323 7,755 7,622 Anticipated Resource Reserve Margin % 32.4% 36.5% 34.5% 39.0% 26.3% 25.8% 22.3% 23.2% 19.3% 19.0%
0.0%
10.0%
20.0%
30.0%
40.0%
50.0%
2015 2016 2017 2018 2019 2020 2021 2022 2023 2024
CA/MX: Case 1 through 4 - Winter Results
Existing and Class 1
Existing and Class 1 through 2
Existing and Class 1 through 3
Existing and Class 1 through 4
BBM - Winter 11.0%

2014 Power Supply Assessment 21
W E S T E R N E L E C T R I C I T Y C O O R D I N A T I N G C O U N C I L
Summary of Assessment Results: Cases 9 and 10: 1-in-20 Temperature
The numbers represented here are a summary from the PSA datasheets and cannot be used independently to replicate the assessment results. For complete information, please access the PSA datasheets posted on the WECC website.
Table 3 - Case 9: 1-in-20 Temperature Summer Results
All Subregions: Case 9 Summer – Existing/Class 1 through 3 Resources BBM 2015 2016 2017 2018 2019 2020 2021 2022 2023 2024
NWPP: Summer 16.43% 34.1% 33.4% 32.5% 29.9% 29.7% 29.5% 29.3% 28.6% 24.9% 25.7%
RMRG: Summer 13.90% 41.7% 58.3% 64.1% 60.1% 53.4% 48.9% 28.8% 13.9% 13.9% 13.9%
SRSG: Summer 15.17% 32.4% 39.2% 32.1% 29.2% 22.1% 18.3% 16.6% 15.8% 15.2% 15.2%
CA/MX: Summer 15.28% 15.3% 17.5% 18.7% 19.6% 21.6% 22.6% 22.7% 21.7% 21.7% 20.8%
WECC: Summer 15.65% 27.6% 30.1% 29.5% 28.1% 27.3% 26.6% 25.1% 23.4% 21.6% 21.7%
Table 4 - Case 10: 1-in-20 Temperature Winter Results
All Subregions: Case 10 Winter – Existing/Class 1 through 3 Resources BBM 2015 2016 2017 2018 2019 2020 2021 2022 2023 2024
NWPP: Winter 17.93% 28.5% 29.1% 29.5% 29.6% 29.5% 29.2% 29.1% 29.0% 28.9% 28.8%
RMRG: Winter 15.95% 44.0% 52.5% 48.2% 45.3% 29.9% 27.8% 20.8% 17.2% 38.9% 36.1%
SRSG: Winter 16.06% 100.3% 95.5% 95.3% 89.3% 67.5% 55.1% 44.5% 35.9% 60.0% 59.4%
CA/MX: Winter 11.28% 32.5% 38.7% 37.7% 44.2% 33.2% 34.0% 30.5% 31.4% 37.4% 37.0%
WECC: Winter 15.60% 39.0% 41.1% 40.7% 41.7% 35.0% 33.5% 30.7% 29.6% 35.7% 35.3%

2014 Power Supply Assessment 22
W E S T E R N E L E C T R I C I T Y C O O R D I N A T I N G C O U N C I L
Appendix A – Zonal Topology Diagrams
Figure 1 - Summer Zonal Topology Diagram
8000
2000 02000 250
2000 400500 200
600 3251800 200
4200 300 350 0 14003675 300 185 2200 1400
100 680 3002600 100 775 1002858
2750 360 2352750 650
1920 6501400
8003675 800 1403000 250
350 614300 664
23003883 4727
3750 692 47853750 468
1700 2502814 250692
600 468
1273 600
2440150 255150 163
1655 24001168 2400
4080
British Columbia
PacificNorthwest
NorthernCalifornia
BANC
LADWP
San Diego
Southern California
Alberta
NorthernNevada
Idaho
Montana
Mex ico
Wyoming
Colorado
New Mex ico
Southern Nevada
ArizonaIID
Utah
LegendFor each pair of numbers, the top or left number is the transfer capability (MW) in the direction of the arrow. The bottom or right number is the transfer capability in the opposite direction of the arrow .
MRO
SPP
2014 Power Supply Assessment 23
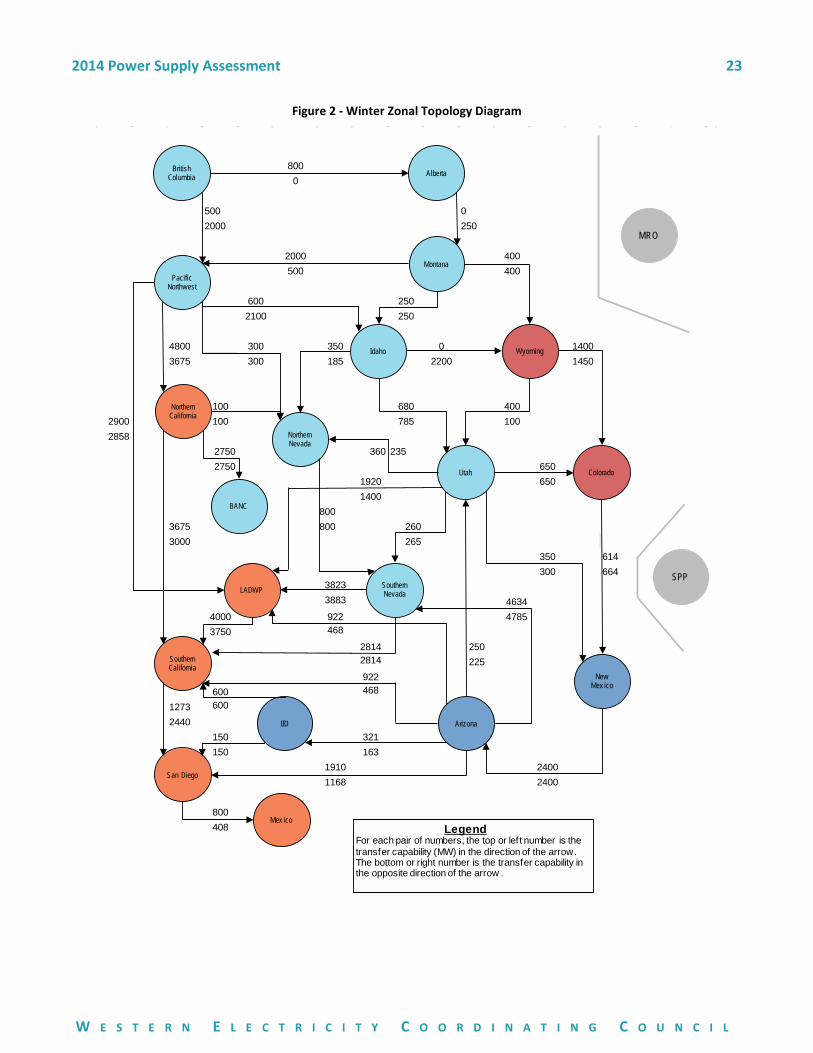
W E S T E R N E L E C T R I C I T Y C O O R D I N A T I N G C O U N C I L
Figure 2 - Winter Zonal Topology Diagram
8000
500 02000 250
2000 400500 400
600 2502100 250
4800 300 350 0 14003675 300 185 2200 1450
100 680 4002900 100 785 1002858
2750 360 2352750 650
1920 6501400
8003675 800 2603000 265
350 614300 664
38233883 4634
4000 922 47853750 468
2814 2502814 225922
600 468
1273 600
2440150 321150 163
1910 24001168 2400
800408
British Columbia
PacificNorthwest
NorthernCalifornia
BANC
LADWP
San Diego
Southern California
Alberta
NorthernNevada
Idaho
Montana
Mex ico
Wyoming
Colorado
New Mex ico
Southern Nevada
ArizonaIID
Utah
LegendFor each pair of numbers, the top or left number is the transfer capability (MW) in the direction of the arrow. The bottom or right number is the transfer capability in the opposite direction of the arrow .
MRO
SPP