2014 integrated resource plan - in.gov integrated resource plan page 1 november 2014 page 1....
TRANSCRIPT

By
SouthernIndianaGasandElectricCompanyd/b/aVectrenEnergyDeliveryofIndiana,Incorporated
November1,2014

2014 Integrated Resource Plan
November 2014

2014 Integrated Resource Plan
Page 1
November 2014
PAGE 1. EXECUTIVE SUMMARY COMPANY BACKGROUND .............................................................................19 THE IRP PROCESS ........................................................................................ 20 VECTREN’S QUANTITATIVE AND QUALITATIVE IRP PROCESS ............... ..21 CHANGES SINCE LAST IRP.......................................................................... ..22 PLAN RESULTS/RECOMMENDATIONS ....................................................... ..25 CONCLUSION ................................................................................................ ..26 2. PLANNING PROCESS INTRODUCTION ............................................................................................. ..31 PLANNING PROCESS ................................................................................... ..31 3. MISO INTRODUCTION ............................................................................................. ..38 MISO OVERVIEW ........................................................................................... ..38 MISO’S GOALS .............................................................................................. ..40 MISO PLANNING PROCESS ......................................................................... ..41 DEMAND RESPONSE .................................................................................... ..47 MISO FORECAST .......................................................................................... ..47 4. ENVIRONMENTAL INTRODUCTION ............................................................................................. ..51 CURRENT ENVIRONMENTAL COMPLIANCE PROGRAMS ........................ ..51 AIR .................................................................................................................. ..51 SOLID WASTE DISPOSAL ............................................................................. ..57 HAZARDOUS WASTE DISPOSAL ................................................................. ..58 WATER ........................................................................................................... ..58 FUTURE ENVIRONMENTAL REGULATIONS ............................................... ..59 CARBON REGULATION ................................................................................ ..59 WASTE DISPOSAL ........................................................................................ ..60 WATER ........................................................................................................... ..61 5. SALES & DEMAND FORECAST INTRODUCTION ............................................................................................. ..66 ELECTRIC LOAD FORECAST OVERVIEW ................................................... ..66 FORECAST RESULTS ................................................................................... ..67 FORECAST INPUTS & METHODOLOGY ...................................................... ..72 CUSTOMER OWNED DISTRIBUTED GENERATION FORECAST ............... ..84 OVERVIEW OF LOAD RESEARCH ACTIVITIES ........................................... ..89 APPLIANCE SATURATION SURVEY & CONTINUOUS IMPROVEMENT .... ..92 OVERVIEW OF PAST FORECASTS .............................................................. ..93

2014 Integrated Resource Plan
Page 2
November 2014
PAGE 6. ELECTRIC SUPPLY ANALYSIS INTRODUCTION ........................................................................................... .. 99 TECHNOLOGY ASSESSMENT .................................................................... .. 99 NEW CONSTRUCTION ALTERNATIVE SCREENING ................................ .108 PURCHASED POWER ALTERNATIVES ..................................................... .111 CUSTOMER SELF-GENERATION ............................................................... .112 RENEWABLE TECHNOLOGIES .................................................................. .112 7. RENEWABLES and CLEAN ENERGY CURRENT PROJECTS ................................................................................ .116 RENEWABLE ENERGY CREDITS ............................................................... .116 ADDITIONAL RENEWABLE AND CLEAN ENERGY CONSIDERATIONS .. .117 8. DSM RESOURCES INTRODUCTION ........................................................................................... .121 HISTORICAL PERFORMANCE .................................................................... .121 EXISTING DSM RESOURCES AND PROGRAMS ...................................... .122 FEDERAL AND STATE ENERGY EFFICIENCY DEVELOPMENTS ............ .129 VECTREN DSM STRATEGY ........................................................................ .131 DSM PLANNING PROCESS ........................................................................ .132 DSM SCREENING RESULTS ...................................................................... .137 2015 ELECTRIC DSM PLAN – CAUSE NO. 44495 ...................................... .152 IRP DSM MODELING ................................................................................... .171 9. TRANSMISSION AND DISTRIBUTION PLANNING INTRODUCTION ........................................................................................... .175 METHODOLOGY .......................................................................................... .176
SYSTEM INTEGRITY ANALYSIS – 2013 (SEASONAL, ANNUAL, INCLUDES SPRING, SUMMER, FALL, AND WINTER) ............................... .177
SYSTEM INTEGRITY ANALYSIS – 2018 (NEAR TERM-WITHIN 1-5 YEARS) .................................................................................................. .178 SYSTEM INTEGRITY ANALYSIS – 2022 (LONG TERM 6-10 YEARS) ....... .178 TRANSMISSION ADEQUACY SUMMARY TABLE ..................................... .178 RECOMMENDATIONS: 2014-2034 .............................................................. .180 COST PROJECTIONS .................................................................................. .182 10. GENERATION PLANNING INTRODUCTION ........................................................................................... .186 APPROACH .................................................................................................. .186 DISCUSSION OF KEY INPUTS AND ASSUMPTIONS ................................ .188 INTEGRATION ANALYSIS RESULTS .......................................................... .193 SENSITIVITY AND RISK ANALYSIS ............................................................ .202 CONCLUSION .............................................................................................. .211
2014 Integrated Resource Plan
Page 3
November 2014
PAGE 11. ACTION PLAN INTRODUCTION ........................................................................................... .215 SUPPLY-SIDE RESOURCES ....................................................................... .215 DEMAND-SIDE RESOURCES ..................................................................... .215 TRANSMISSION AND DISTRIBUTION ........................................................ .216 IRP Proposed Draft Rule Requirements Cross Reference Table
Rule Reference Rule Description
Report Reference (As Page # or Attachment)
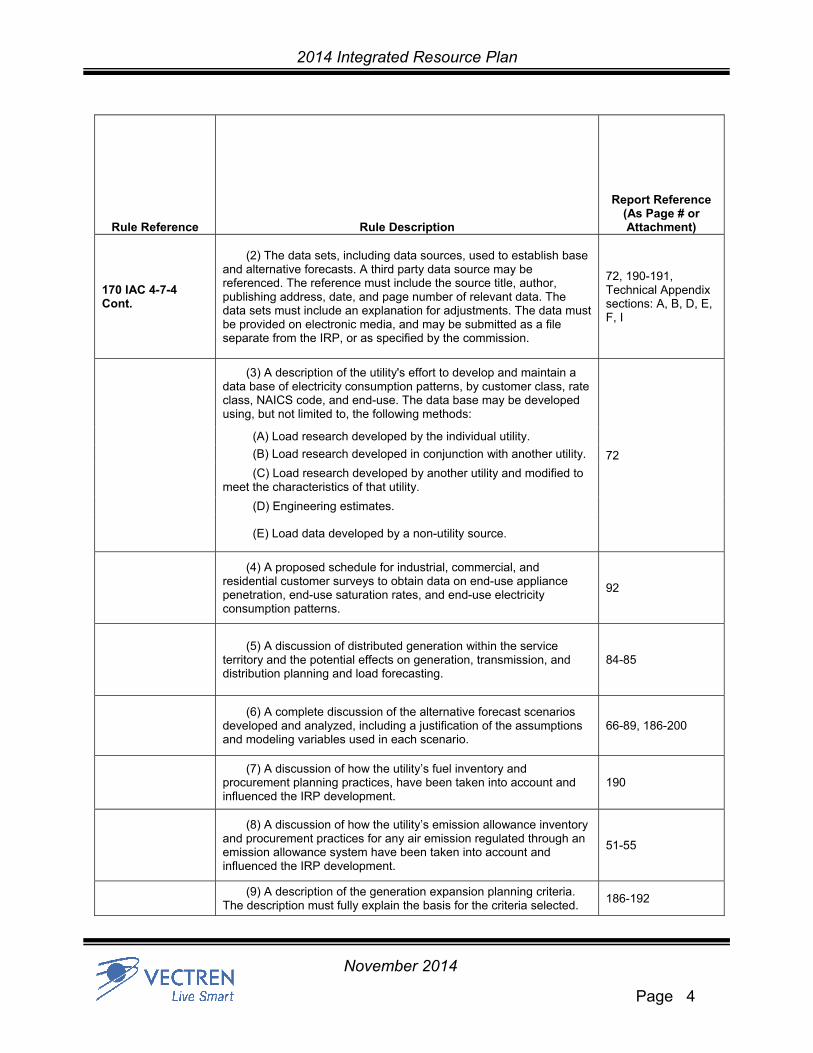
170 IAC 4-7-4 Methodology and documentation requirements
(a) The utility shall provide an IRP summary document that communicates core IRP concepts and results to non-technical audiences.
Technical Appendix J and www.vectren.com/irp
(1) The summary shall provide a brief description of the utility’s existing resources, preferred resource portfolio, short term action plan, key factors influencing the preferred resource portfolio and short term action plan, and any additional details the commission staff may request as part of a contemporary issues meeting. The summary shall describe, in simple terms, the IRP public advisory process, if applicable, and core IRP concepts, including resource types and load characteristics.
(2) The utility shall utilize a simplified format that visually portrays the summary of the IRP in a manner that makes it understandable to a non-technical audience.
(3) The utility shall make this document readily accessible on its website.
(b) An IRP must include the following:
Included throughout the IRP
(1) A discussion of the:
(A) inputs;
(B) methods; and
(C) definitions; used by the utility in the IRP.
2014 Integrated Resource Plan
Page 4
November 2014
Rule Reference Rule Description
Report Reference (As Page # or Attachment)
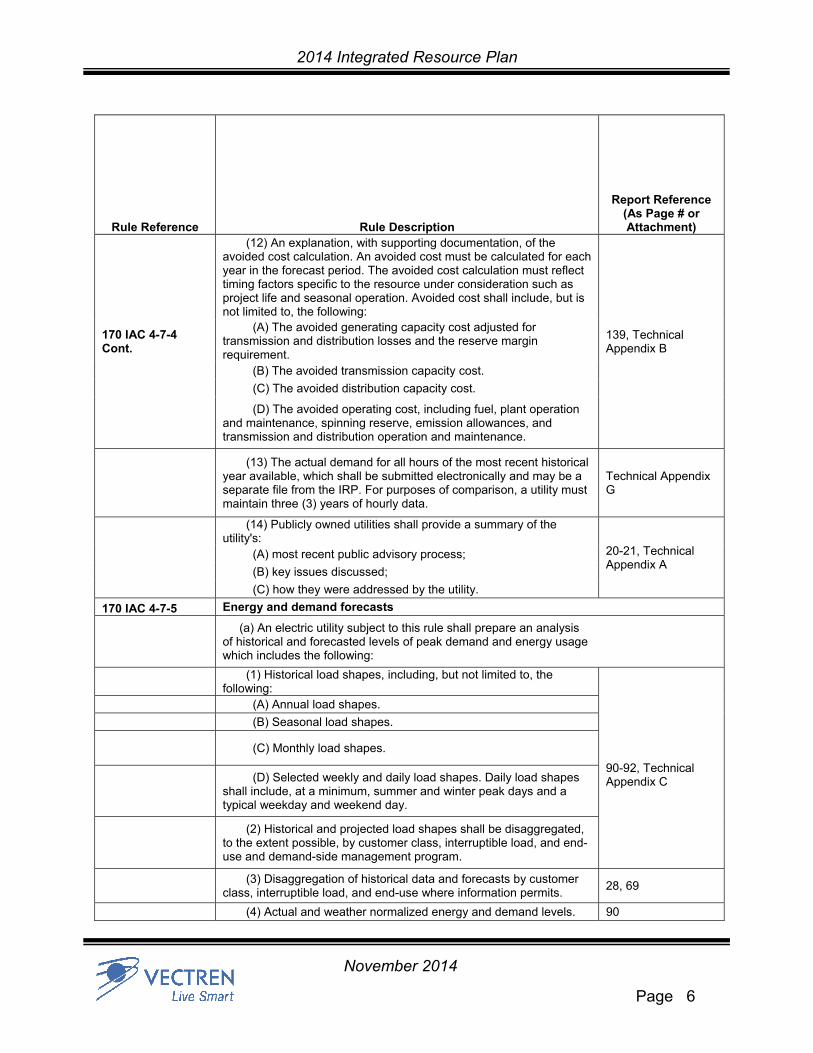
170 IAC 4-7-4 Cont.
(2) The data sets, including data sources, used to establish base and alternative forecasts. A third party data source may be referenced. The reference must include the source title, author, publishing address, date, and page number of relevant data. The data sets must include an explanation for adjustments. The data must be provided on electronic media, and may be submitted as a file separate from the IRP, or as specified by the commission.
72, 190-191, Technical Appendix sections: A, B, D, E, F, I
(3) A description of the utility's effort to develop and maintain a data base of electricity consumption patterns, by customer class, rate class, NAICS code, and end-use. The data base may be developed using, but not limited to, the following methods:
72
(A) Load research developed by the individual utility.
(B) Load research developed in conjunction with another utility.
(C) Load research developed by another utility and modified to meet the characteristics of that utility.
(D) Engineering estimates.
(E) Load data developed by a non-utility source.
(4) A proposed schedule for industrial, commercial, and residential customer surveys to obtain data on end-use appliance penetration, end-use saturation rates, and end-use electricity consumption patterns.
92
(5) A discussion of distributed generation within the service territory and the potential effects on generation, transmission, and distribution planning and load forecasting.
84-85
(6) A complete discussion of the alternative forecast scenarios developed and analyzed, including a justification of the assumptions and modeling variables used in each scenario.
66-89, 186-200
(7) A discussion of how the utility’s fuel inventory and procurement planning practices, have been taken into account and influenced the IRP development.
190
(8) A discussion of how the utility’s emission allowance inventory and procurement practices for any air emission regulated through an emission allowance system have been taken into account and influenced the IRP development.
51-55
(9) A description of the generation expansion planning criteria. The description must fully explain the basis for the criteria selected.
186-192

2014 Integrated Resource Plan
Page 5
November 2014
Rule Reference Rule Description
Report Reference (As Page # or Attachment)
170 IAC 4-7-4 Cont.
(10) A brief description and discussion within the body of the IRP focusing on the utility’s Indiana jurisdictional facilities with regard to the following components of FERC Form 715:
175-183
(A) Most current power flow data models, studies, and sensitivity analysis.
(B) Dynamic simulation on its transmission system, including interconnections, focused on the determination of the performance and stability of its transmission system on various fault conditions. The simulation must include the capability of meeting the standards of the North American Electric Reliability Corporation (NERC).
(C) Reliability criteria for transmission planning as well as the assessment practice used. The information and discussion must include the limits set of its transmission use, its assessment practices developed through experience and study, and certain operating restrictions and limitations particular to it. (D) Various aspects of any joint transmission system, ownership, and operations and maintenance responsibilities as prescribed in the terms of the ownership, operation, maintenance, and license agreement.
(11) An explanation of the contemporary methods utilized by the utility in developing the IRP, including a description of the following:
(A) Model structure and reasoning for use of particular model or models in the utility’s IRP.
66-67, 186-187
(B) The utility's effort to develop and improve the methodology and inputs for its:
32, 186
(i) forecast; 32, 93
(ii) cost estimates; 32, 99, 190-191
(iii) treatment of risk and uncertainty; and 32, 190
(iv) evaluation of a resource (supply-side or demand-side) alternative’s contribution to system wide reliability. The measure of system wide reliability must cover the reliability of the entire system, including:
32
(AA) transmission; and 176-177
(BB) generation. 32
2014 Integrated Resource Plan
Page 6
November 2014
Rule Reference Rule Description
Report Reference (As Page # or Attachment)
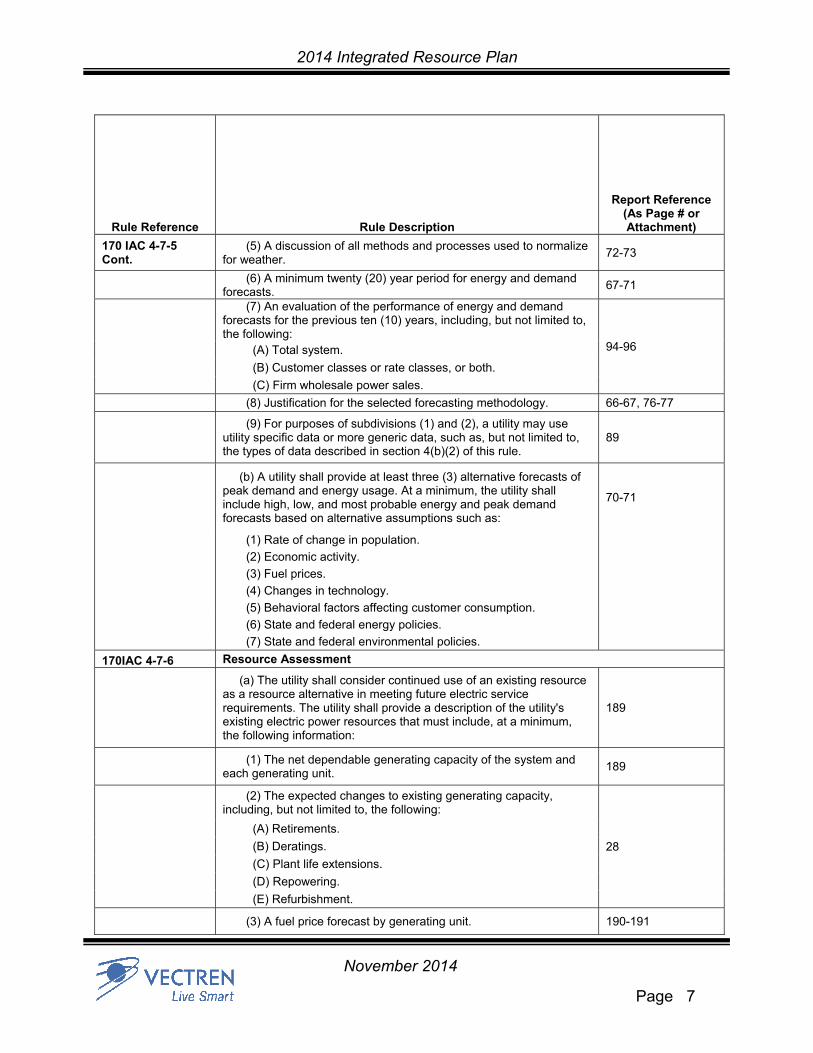
170 IAC 4-7-4 Cont.
(12) An explanation, with supporting documentation, of the avoided cost calculation. An avoided cost must be calculated for each year in the forecast period. The avoided cost calculation must reflect timing factors specific to the resource under consideration such as project life and seasonal operation. Avoided cost shall include, but is not limited to, the following:
139, Technical Appendix B
(A) The avoided generating capacity cost adjusted for transmission and distribution losses and the reserve margin requirement. (B) The avoided transmission capacity cost.
(C) The avoided distribution capacity cost.
(D) The avoided operating cost, including fuel, plant operation and maintenance, spinning reserve, emission allowances, and transmission and distribution operation and maintenance.
(13) The actual demand for all hours of the most recent historical year available, which shall be submitted electronically and may be a separate file from the IRP. For purposes of comparison, a utility must maintain three (3) years of hourly data.
Technical Appendix G
(14) Publicly owned utilities shall provide a summary of the utility's:
20-21, Technical Appendix A
(A) most recent public advisory process;
(B) key issues discussed;
(C) how they were addressed by the utility.
170 IAC 4-7-5 Energy and demand forecasts
(a) An electric utility subject to this rule shall prepare an analysis of historical and forecasted levels of peak demand and energy usage which includes the following:
(1) Historical load shapes, including, but not limited to, the following:
90-92, Technical Appendix C
(A) Annual load shapes.
(B) Seasonal load shapes.
(C) Monthly load shapes.
(D) Selected weekly and daily load shapes. Daily load shapes shall include, at a minimum, summer and winter peak days and a typical weekday and weekend day.
(2) Historical and projected load shapes shall be disaggregated, to the extent possible, by customer class, interruptible load, and end-use and demand-side management program.
(3) Disaggregation of historical data and forecasts by customer class, interruptible load, and end-use where information permits.
28, 69
(4) Actual and weather normalized energy and demand levels. 90
2014 Integrated Resource Plan
Page 7
November 2014
Rule Reference Rule Description
Report Reference (As Page # or Attachment)
170 IAC 4-7-5 Cont.
(5) A discussion of all methods and processes used to normalize for weather.
72-73
(6) A minimum twenty (20) year period for energy and demand forecasts.
67-71
(7) An evaluation of the performance of energy and demand forecasts for the previous ten (10) years, including, but not limited to, the following:
94-96 (A) Total system.
(B) Customer classes or rate classes, or both.
(C) Firm wholesale power sales.
(8) Justification for the selected forecasting methodology. 66-67, 76-77
(9) For purposes of subdivisions (1) and (2), a utility may use utility specific data or more generic data, such as, but not limited to, the types of data described in section 4(b)(2) of this rule.
89
(b) A utility shall provide at least three (3) alternative forecasts of peak demand and energy usage. At a minimum, the utility shall include high, low, and most probable energy and peak demand forecasts based on alternative assumptions such as:
70-71
(1) Rate of change in population.
(2) Economic activity.
(3) Fuel prices.
(4) Changes in technology.
(5) Behavioral factors affecting customer consumption.
(6) State and federal energy policies.
(7) State and federal environmental policies.
170IAC 4-7-6 Resource Assessment
(a) The utility shall consider continued use of an existing resource as a resource alternative in meeting future electric service requirements. The utility shall provide a description of the utility's existing electric power resources that must include, at a minimum, the following information:
189
(1) The net dependable generating capacity of the system and each generating unit.
189
(2) The expected changes to existing generating capacity, including, but not limited to, the following:
28 (A) Retirements.
(B) Deratings.
(C) Plant life extensions.
(D) Repowering.
(E) Refurbishment.
(3) A fuel price forecast by generating unit. 190-191

2014 Integrated Resource Plan
Page 8
November 2014
Rule Reference Rule Description
Report Reference (As Page # or Attachment)
170IAC 4-7-6 Cont.
(4) The significant environmental effects, including:
(A) air emissions;
51-58
(B) solid waste disposal;
(C) hazardous waste; and
(D) subsequent disposal; and
(E) water consumption and discharge; at each existing fossil fueled generating unit.
(5) An analysis of the existing utility transmission system that includes the following:
175-183
(A) An evaluation of the adequacy to support load growth and expected power transfers.
(B) An evaluation of the supply-side resource potential of actions to reduce transmission losses, congestion, and energy costs.
(C) An evaluation of the potential impact of demand-side resources on the transmission network.
(D) An assessment of the transmission component of avoided cost.
(6) A discussion of demand-side programs, including existing company-sponsored and government-sponsored or mandated energy conservation or load management programs available in the utility's service area and the estimated impact of those programs on the utility's historical and forecasted peak demand and energy.
69, 121-131, 152-171
The information listed above in subdivision (a)(1) through subdivision (a)(4) and in subdivision (a)(6) shall also be provided for each year of the planning period.
(b) An electric utility shall consider alternative methods of meeting future demand for electric service. A utility must consider a demand-side resource, including innovative rate design, as a source of new supply in meeting future electric service requirements. The utility shall consider a comprehensive array of demand-side measures that provide an opportunity for all ratepayers to participate in DSM, including low-income residential ratepayers. For a utility-sponsored program identified as a potential demand-side resource, the utility's IRP shall, at a minimum, include the following:
122-129
(1) A description of the demand-side program considered. 153-171
(2) The avoided cost projection on an annual basis for the forecast period that accounts for avoided generation, transmission, and distribution system costs. The avoided cost calculation must reflect timing factors specific to resources under consideration such as project life and seasonal operation.
140
(3) The customer class or end-use, or both, affected by the program.
153-171
(4) A participant bill reduction projection and participation incentive to be provided in the program.
153-171

2014 Integrated Resource Plan
Page 9
November 2014
Rule Reference Rule Description
Report Reference (As Page # or Attachment)
170IAC 4-7-6 Cont. (5) A projection of the program cost to be borne by the participant.
153-171
(6) Estimated energy (kWh) and demand (kW) savings per participant for each program.
153-171
(7) The estimated program penetration rate and the basis of the estimate.
153-171
(8) The estimated impact of a program on the utility's load, generating capacity, and transmission and distribution requirements.
153-171
(c) A utility shall consider a range of supply-side resources including cogeneration and nonutility generation as an alternative in meeting future electric service requirements. This range shall include commercially available resources or resources the director may request as part of a contemporary issues technical conference. The utility's IRP shall include, at a minimum, the following:
109, 112
(1) Identify and describe the resource considered, including the following:
109
(A) Size (MW). 109
(B) Utilized technology and fuel type. 109
(C) Additional transmission facilities necessitated by the resource.
180-182
(2) A discussion of the utility's effort to coordinate planning, construction, and operation of the supply-side resource with other utilities to reduce cost.
N/A
(d) A utility shall consider new or upgraded transmission facilities as a resource in meeting future electric service requirements, including new projects, efficiency improvements, and smart grid resources. The IRP shall, at a minimum, include the following:
175-183
(1) A description of the timing and types of expansion and alternative options considered.
(2) The approximate cost of expected expansion and alteration of the transmission network.
(3) A description of how the IRP accounts for the value of new or upgraded transmission facilities for the purposes of increasing needed power transfer capability and increasing the utilization of cost effective resources that are geographically constrained.

2014 Integrated Resource Plan
Page 10
November 2014
Rule Reference Rule Description
Report Reference (As Page # or Attachment)
(4) A description of how:
38-48
(A) IRP data and information are used in the planning and implementation processes of the RTO of which the utility is a member; and
170IAC 4-7-6 Cont. (B) RTO planning and implementation processes are used in and affect the IRP.
170 IAC 4-7-7 Selection of future resources
(a) In order to eliminate nonviable alternatives, a utility shall perform an initial screening of all future resource alternatives listed in sections 6(b) through 6(c) of this rule. The utility's screening process and the decision to reject or accept a resource alternative for further analysis must be fully explained and supported in, but not limited to, a resource summary table. The following information:
109 (1) Significant environmental effects, including the following:
(A) Air emissions.
(B) Solid waste disposal.
(C) Hazardous waste and subsequent disposal.
(D) Water consumption and discharge.
(2) An analysis of how existing and proposed generation facilities conform to the utility-wide plan to comply with existing and reasonably expected future state and federal environmental regulations, including facility-specific and aggregate compliance options and associated performance and cost impacts.
188
(b) Integrated resource planning includes one (1) or more tests used to evaluate the cost effectiveness of a demand-side resource option. A cost-benefit analysis must be performed using the following tests except as provided under subsection (e):
137-151 (1) Participant.
(2) Ratepayer impact measure (RIM).
(3) Utility cost (UC).
(4) Total resource cost (TRC).
(5) Other reasonable tests accepted by the commission.
(c) A utility is not required to express a test result in a specific format. However, a utility must, in all cases, calculate the net present value of the program impact over the life cycle of the impact. A utility shall also explain the rationale for choosing the discount rate used in the test.
138, 153-154
(d) A utility is required to:
(1) specify the components of the benefit and the cost for each of the major tests; and
137-138
(2) identify the equation used to express the result. 137

2014 Integrated Resource Plan
Page 11
November 2014
Rule Reference Rule Description
Report Reference (As Page # or Attachment)
170 IAC 4-7-7 Cont.
(e) If a reasonable cost-effectiveness analysis for a demand-side management program cannot be performed using the tests in subsection (b), where it is difficult to establish an estimate of load impact, such as a generalized information program, the cost-effectiveness tests are not required.
137-151
(f) To determine cost-effectiveness, the RIM test must be applied to a load building program. A load building program shall not be considered as an alternative to other resource options.
N/A
170 IAC 4-7-8 Resource integration
(a) The utility shall develop candidate resource portfolios from the selection of future resources in section 7 and provide a description of its process for developing its candidate resource portfolios.
186-187
(b) From its candidate resource portfolios, a utility shall select a preferred resource portfolio and provide, at a minimum, the following information:
193-201
(1) Describe the utility's preferred resource portfolio. 193-194, 201
(2) Identify the variables, standards of reliability, and other assumptions expected to have the greatest effect on the preferred resource portfolio.
202-211
(3) Demonstrate that supply-side and demand-side resource alternatives have been evaluated on a consistent and comparable basis.
171-172
(4) Demonstrate that the preferred resource portfolio utilizes, to the extent practical, all economical load management, demand side management, technology relying on renewable resources, cogeneration, distributed generation, energy storage, transmission, and energy efficiency improvements as sources of new supply.
84-89, 109, 112, 122-132, 171-172
(5) Discuss the utility's evaluation of targeted DSM programs including their impacts, if any, on the utility's transmission and distribution system for the first ten (10) years of the planning period.
179, 137-140

2014 Integrated Resource Plan
Page 12
November 2014
Rule Reference Rule Description
Report Reference (As Page # or Attachment)
(6) Discuss the financial impact on the utility of acquiring future resources identified in the utility's preferred resource portfolio. The discussion of the preferred resource portfolio shall include, where appropriate, the following:
N/A
(A) Operating and capital costs.
170 IAC 4-7-8 Cont.
(B) The average cost per kilowatt-hour, which must be consistent with the electricity price assumption used to forecast the utility's expected load by customer class in section 5 of this rule.
(C) An estimate of the utility's avoided cost for each year of the preferred resource portfolio.
(D) The utility's ability to finance the preferred resource portfolio.
(7) Demonstrate how the preferred resource portfolio balances cost minimization with cost effective risk and uncertainty reduction, including the following.
201-212
(A) Identification and explanation of assumptions.
(B) Quantification, where possible, of assumed risks and uncertainties, which may include, but are not limited to: See below.
(i) regulatory compliance;
(ii) public policy;
(iii) fuel prices;
(iv) construction costs;
(v) resource performance;
(vi) load requirements;
(vii) wholesale electricity and transmission prices;
(viii) RTO requirements; and
(ix) technological progress.
(C) An analysis of how candidate resource portfolios performed across a wide range of potential futures.
(D) The results of testing and rank ordering the candidate resource portfolios by the present value of revenue requirement and risk metric(s). The present value of revenue requirement shall be stated in total dollars and in dollars per kilowatt-hour delivered, with the discount rate specified.
Technical Appendix H
2014 Integrated Resource Plan
Page 13
November 2014
Rule Reference Rule Description
Report Reference (As Page # or Attachment)
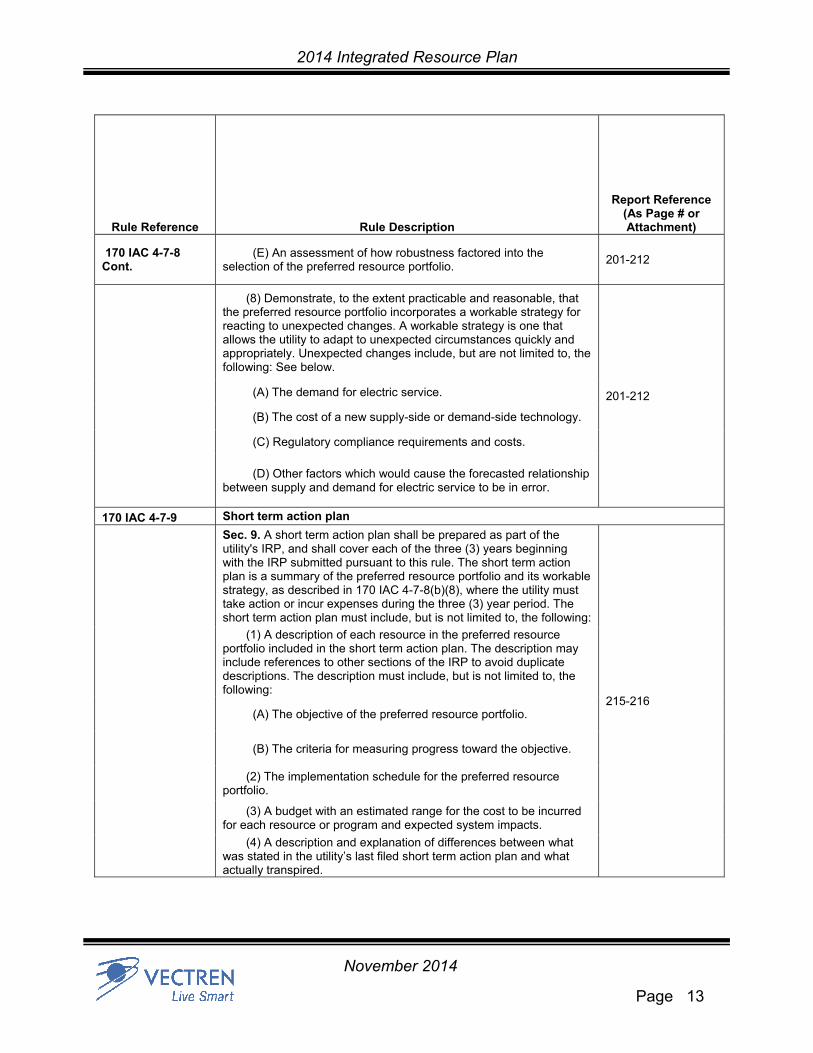
170 IAC 4-7-8 Cont.
(E) An assessment of how robustness factored into the selection of the preferred resource portfolio.
201-212
(8) Demonstrate, to the extent practicable and reasonable, that the preferred resource portfolio incorporates a workable strategy for reacting to unexpected changes. A workable strategy is one that allows the utility to adapt to unexpected circumstances quickly and appropriately. Unexpected changes include, but are not limited to, the following: See below.
201-212 (A) The demand for electric service.
(B) The cost of a new supply-side or demand-side technology.
(C) Regulatory compliance requirements and costs.
(D) Other factors which would cause the forecasted relationship between supply and demand for electric service to be in error.
170 IAC 4-7-9 Short term action plan
Sec. 9. A short term action plan shall be prepared as part of the utility's IRP, and shall cover each of the three (3) years beginning with the IRP submitted pursuant to this rule. The short term action plan is a summary of the preferred resource portfolio and its workable strategy, as described in 170 IAC 4-7-8(b)(8), where the utility must take action or incur expenses during the three (3) year period. The short term action plan must include, but is not limited to, the following:
215-216
(1) A description of each resource in the preferred resource portfolio included in the short term action plan. The description may include references to other sections of the IRP to avoid duplicate descriptions. The description must include, but is not limited to, the following:
(A) The objective of the preferred resource portfolio.
(B) The criteria for measuring progress toward the objective.
(2) The implementation schedule for the preferred resource portfolio.
(3) A budget with an estimated range for the cost to be incurred for each resource or program and expected system impacts.
(4) A description and explanation of differences between what was stated in the utility’s last filed short term action plan and what actually transpired.

2014 Integrated Resource Plan
Page 14
November 2014
List of Acronyms/Abbreviations
AC Air Conditioning ACS American Community Survey AMI Advanced Metering Infrastructure APWR Advanced Pressurized Water Reactor ARRA American Recovery and Reinvestment Act ASPEN-OneLiner Advanced Systems for Power Engineering, Incorporated AUPC Average Use Per Customer B Water Heating Service – Closed to new customers BAGS Broadway Avenue Gas Turbines BPJ Best Professional Judgment BPM MISO’s Business Practice Manual BTU British Thermal Unit CAA Clean Air Act CAC Citizens Action Coalition CAES Compressed Air Energy Storage CAIR Clean Air Interstate Rule CAMR Clean Air Mercury Rule CCGT Combined Cycle Gas Turbine CCR Coal Combustion Residuals CDD Cooling Degree Days CEII Critical Electric Infrastructure Information CFL Compact Fluorescent Lighting CHP Combined Heat and Power CIL Capacity Import Limit CO2 Carbon Dioxide CPP Clean Power Plan CSAPR Cross-State Air Pollution Rule CVR Conservation Voltage Reduction CWA Clean Water Act DA Distribution Automation DGS Demand General Service DLC Direct Load Control DOE United States Department of Energy DR Demand Response DRR-1 Demand Response Resource Type 1 DSM Demand-side Management DSMA Demand Side Management Adjustment EAP Energy Assistance Program ECM Electronically Commutated Motor EDR Emergency Demand Response EEFC Energy Efficiency Funding Component EGU Electric Generating Units EIA Energy Information Administration EISA Energy Independence and Security Act ELGS Effluent Limit Guidelines and Standards EPA U.S. Environmental Protection Agency EPRI Electric Power Research Institute ESP Electrostatic Precipitator EVA Energy Ventures Analysis, Inc. FERC Federal Energy Regulatory Commission FF Fabric Filter FGD Flue Gas Desulfurization GADS Generating Availability Data System GDP Gross Domestic Product GHG Greenhouse Gas GS General Service GWH Gigawatt Hour HAP Hazardous Air Pollutants HCi Hydrochloric Acid
2014 Integrated Resource Plan
Page 15
November 2014
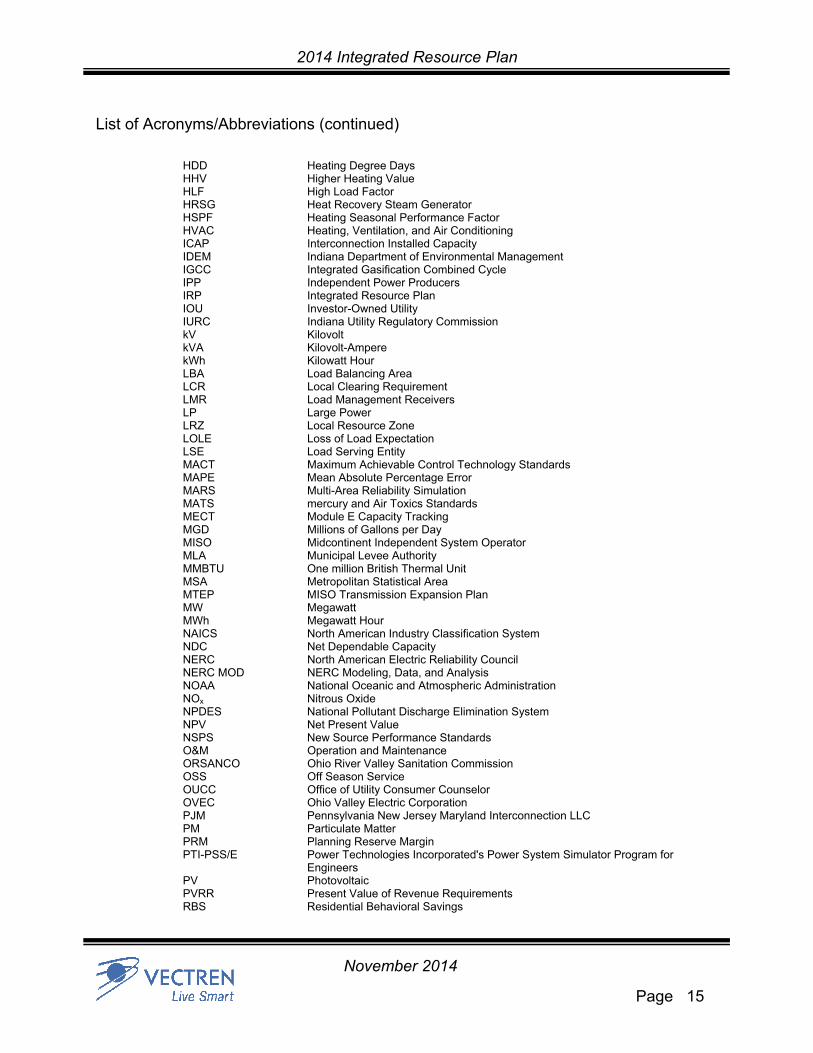
List of Acronyms/Abbreviations (continued) HDD Heating Degree Days HHV Higher Heating Value HLF High Load Factor HRSG Heat Recovery Steam Generator HSPF Heating Seasonal Performance Factor HVAC Heating, Ventilation, and Air Conditioning ICAP Interconnection Installed Capacity IDEM Indiana Department of Environmental Management IGCC Integrated Gasification Combined Cycle IPP Independent Power Producers IRP Integrated Resource Plan IOU Investor-Owned Utility IURC Indiana Utility Regulatory Commission kV Kilovolt kVA Kilovolt-Ampere kWh Kilowatt Hour LBA Load Balancing Area LCR Local Clearing Requirement LMR Load Management Receivers LP Large Power LRZ Local Resource Zone LOLE Loss of Load Expectation LSE Load Serving Entity MACT Maximum Achievable Control Technology Standards MAPE Mean Absolute Percentage Error MARS Multi-Area Reliability Simulation MATS mercury and Air Toxics Standards MECT Module E Capacity Tracking MGD Millions of Gallons per Day MISO Midcontinent Independent System Operator MLA Municipal Levee Authority MMBTU One million British Thermal Unit MSA Metropolitan Statistical Area MTEP MISO Transmission Expansion Plan MW Megawatt MWh Megawatt Hour NAICS North American Industry Classification System NDC Net Dependable Capacity NERC North American Electric Reliability Council NERC MOD NERC Modeling, Data, and Analysis NOAA National Oceanic and Atmospheric Administration NOx Nitrous Oxide NPDES National Pollutant Discharge Elimination System NPV Net Present Value NSPS New Source Performance Standards O&M Operation and Maintenance ORSANCO Ohio River Valley Sanitation Commission OSS Off Season Service OUCC Office of Utility Consumer Counselor OVEC Ohio Valley Electric Corporation PJM Pennsylvania New Jersey Maryland Interconnection LLC PM Particulate Matter PRM Planning Reserve Margin PTI-PSS/E Power Technologies Incorporated's Power System Simulator Program for Engineers PV Photovoltaic PVRR Present Value of Revenue Requirements RBS Residential Behavioral Savings

2014 Integrated Resource Plan
Page 16
November 2014
List of Acronyms/Abbreviations (continued) RCRA Resource Conservation and Recovery Act REC Renewable Energy Credit RECB Regional Expansion Criteria and Benefits RFC Reliability First Corporation RIM Ratepayer Impact Measure RPS Renewable Portfolio Standard RS Residential Service SAE Statistically Adjusted End-use SCADA Supervisory Control and Data Acquisition SCGT Simple Cycle Gas Turbine SCR Selective Catalytic Reduction SEER Seasonal Energy Efficiency Ratio SGS Small General Service SGT Steam Turbine Generator SIP System Integration Plan SMR Small Modular Reactors SO2 Sulfur Dioxide TPA Third Party Administrator TRC Total Resource Cost TVA Tennessee Valley Authority UCAP Unforced Capacity Rating VUHI Vectren Utility Holdings Inc. ZRC Zone Resource Credit

2014 Integrated Resource Plan
Page 17
November 2014
This page intentionally left blank for formatting purposes

2014 Integrated Resource Plan
Page 18
November 2014
CHAPTER 1
EXECUTIVE SUMMARY

2014 Integrated Resource Plan
Page 19
November 2014
COMPANY BACKGROUND
Vectren Corporation is an energy holding company headquartered in Evansville,
Indiana. Vectren’s wholly owned subsidiary, Vectren Utility Holdings, Inc. (VUHI), is the
parent company for three operating utilities: Indiana Gas Company, Inc. (Vectren
North), Southern Indiana Gas and Electric Company (Vectren), and Vectren Energy
Delivery of Ohio (VEDO).
Vectren North provides energy delivery services to more than 570,000 natural gas
customers located in central and southern Indiana. Vectren provides energy delivery
services to over 142,000 electric customers and approximately 110,000 gas customers
located near Evansville in southwestern Indiana. VEDO provides energy delivery
services to approximately 312,000 natural gas customers near Dayton in west central
Ohio.
Vectren’s company-owned generation fleet represents 1,158 megawatts (MW)1 of
unforced capacity (UCAP) as shown in Table 1-1.
Table 1-1 Generating Units
Unit UCAP (MW) Primary fuel Commercial
Date
Northeast 1 9 MW Gas 1963
Northeast 2 9 MW Gas 1964
FB Culley 2 83 MW Coal 1966
Warrick 4 135 MW Coal 1970
FB Culley 3 257 MW Coal 1973
AB Brown 1 228 MW Coal 1979
BAGS 2 59 MW Gas 1981
AB Brown 2 233 MW Coal 1986
AB Brown 3 73 MW Gas 1991
AB Brown 4 69 MW Gas 2002
Blackfoot 3 MW Landfill Gas 2009
1 Blackfoot landfill gas project is considered behind-the-meter and is therefore currently accounted for as a reduction to load and is omitted from the capacity total
2014 Integrated Resource Plan
Page 20
November 2014
In addition to company owned generating resources, Vectren has access to an
additional 30 MW of capacity as a result of its 1.5% ownership interest in Ohio Valley
Electric Corporation (OVEC). Vectren is also contracted to receive 80 MW of nominal
capacity wind energy through two separate long-term purchase power agreements.
The total firm capacity credit for the MISO 2014-2015 planning year for these wind
resources is 7.3 MW. Vectren is interconnected with other utilities at both 345 kV and
138 kV and is able to exchange capacity and energy through the market mechanisms of
the Midcontinent Independent System Operator (MISO).
THE IRP PROCESS
The Integrated Resource Plan (IRP) process was developed to assure a systematic and
comprehensive planning process that produces a reliable, efficient approach to securing
future resources to meet the energy needs of the utility and its customers. The IRP
process encompasses an assessment of a range of feasible supply-side and demand-
side alternatives to establish a diverse portfolio of options to effectively meet future
generation needs.
In Indiana, the IRP is also guided by rules of the Indiana Utility Regulatory Commission
(IURC). Those rules, found in the Indiana Administrative Code at 170 I.A.C. 4-7-4
through 4-7-9, provide specific guidelines for plan contents and filing with the
Commission. On October 14, 2010, the IURC issued an order to commence rulemaking
to revise/update the current Indiana IRP rule. The following summer, Vectren
participated in a stakeholder process to provide input on updating the rule. The
proposed draft rule was sent to stakeholders on October 4, 2012. Although not
finalized, Vectren voluntarily followed the proposed draft rule, which is found in the IRP
Proposed Draft Rule Requirements Cross Reference Table of this IRP.
Vectren modified its processes to meet the proposed draft rule. Most notably, Vectren
incorporated a stakeholder process to gather input from stakeholders and answer
stakeholder questions in an open, transparent process. The proposed rule requires at

2014 Integrated Resource Plan
Page 21
November 2014
least 2 meetings with stakeholders. On March 20, 2014, Vectren met with stakeholders
to discuss the base inputs of the plan, educate stakeholders on IRP related topics, and
review the Vectren process. Based on feedback from stakeholders, Vectren added an
additional meeting on August 5, 2014 to further discuss major assumptions and data
inputs prior to modeling. Finally, on September 24, 2014 Vectren presented a preview
of the plan. A summary of the stakeholder meetings can be found in Chapter 2
Planning Process, and the meeting presentations and Q&A summaries are found in the
Technical Appendix, section A.
Details of the process used by Vectren to develop the recommended plan in this IRP
are found in chapters 2 through 11 of this report. Chapter 11 Action Plan sets forth the
action plan for Vectren over the next three years to achieve the long-term resource
objectives described in this IRP.
Included in the process is an updated demand and energy forecast (detailed in Chapter
5 Sales and Demand Forecast). Table 1–2, shows a summary of the demand and
energy forecast.
VECTREN’S QUANTITATIVE AND QUALITATIVE IRP PROCESS
Historically, Vectren has used modeling to perform the evaluations, screenings, and
assessments of various potential scenarios to arrive at a single plan that represented its
“Resource Plan Additions.” Vectren continues to use the Strategist modeling software
from Ventyx, as it has in its last several IRP studies. This software has traditionally been
used by some of the other Indiana utilities, as well. The submitted plan was the result of
a process that was primarily a quantitative evaluation performed using an industry
standard planning model.
The modeling performed by Vectren provides important information to evaluate future
resource needs. However, Vectren will also continue to monitor developments that
2014 Integrated Resource Plan
Page 22
November 2014
could impact future resource needs. Three developments that Vectren is focusing on
for impacts on the near term are:
1. The Clean Power Plan from the Environmental Protection Agency (EPA) and
Indiana’s approach to implementing this rule.
2. MISO capacity market constraints resulting from the early retirements of coal units
as a response to the EPAs MATS rule.
3. The impacts on Vectren’s load due to the addition of or loss of large customer load.
While Vectren’s models attempt to evaluate the impact those issues may have on its
future load, significant uncertainty remains. Vectren must maintain flexibility to adjust its
plans based on the outcome of these and other unknown factors. In the case of
Vectren, one of the smallest investor-owned electric utilities in the nation, the
ramifications of major capacity decisions are particularly important.
Equally important, Vectren believes one of the major objectives of the Commission’s
reporting and filing requirements regarding the IRP process is to communicate with the
IURC regarding the decision processes, evaluations, and judgments that Vectren uses
to assist in making the resource planning decisions that are in the long-term best
interest of Vectren’s customers and the communities it serves. Vectren understands
that the action plan which results from the IRP process is to be used as a guide by the
Company and the IURC in addressing long-term resource needs, as both attempt to
carry out their respective responsibilities in the most effective manner possible.
CHANGES SINCE LAST IRP
While a number of changes have occurred since Vectren’s last IRP, four specific
changes have had a significant impact on this IRP. First, the IURC’s proposed draft IRP
rules were released after Vectren’s last IRP. Vectren is voluntarily following the new
proposed draft IRP rule, which includes a stakeholder process, non-technical summary,
more robust risk analysis, and attending an annual contemporary issues meeting in
Indianapolis. The IRP Proposed Draft Rule Requirements Cross Reference Table on
2014 Integrated Resource Plan
Page 23
November 2014
page three shows the new proposed draft rule and where Vectren addresses each part
in this IRP.
Second, Vectren engaged a third party consultant with significant experience
conducting IRPs for other parties, Burns & McDonnell, one of the leading engineering
design experts in the United States, to aid its preparation of this IRP. For the 2014 IRP,
Vectren worked closely with Burns and McDonnell to perform Strategist modeling
(including additional DSM modeling). Burns and McDonnell has a great deal of
experience in working with companies across the country on resource modeling. They
also performed the Technology Assessment, detailing costs for potential resource
options. The Technology Assessment can be found in the Technical Appendix, section
B.
Third, the EPA has finalized various federal mandates with respect to further
environmental regulation of Vectren’s generating units and proposed a sweeping
greenhouse gas regulation for existing coal-fired generating sources since Vectren’s
last IRP. As will be discussed in more detail in Chapter 4 Environmental, the EPA
finalized its Mercury and Air Toxics Standard (MATS) in 2012, which set first ever plant-
wide emission limits for mercury and other hazardous air pollutants and has a
compliance deadline of April 2015. MATS has resulted in many announcements of
coal plant retirements across the US. As a result, MISO, Vectren’s Regional
Transmission Operator (RTO), is predicting potential capacity shortfalls in the next few
years. In the next two years Vectren intends to spend $70- $90 million on its
environmental compliance program to meet not only the MATS rule, but also recent
water discharge limits for mercury contained in water discharge permit renewals and
mitigate incremental sulfur trioxide (SO3) emissions resulting from the installation of
Vectren’s selective catalytic reduction technology under an agreement with the EPA.
However, Vectren is projecting to defer recovery of these federally mandated costs until
approximately 2020. The assumptions in the IRP are consistent with Vectren’s
environmental compliance filing.

2014 Integrated Resource Plan
Page 24
November 2014
In addition to the federal mandates referenced above, the EPA released its final rule
regulating cooling water structures under Section 316(b) of the Clean Water Act (CWA)
on August 15, 2014. Section 316(b) requires that intake structures that withdraw > 2
Million Gallons per Day (MGD) of water, including most electric generating units, use
the "Best Technology Available" to prevent and / or mitigate adverse environmental
impacts to shellfish, fish, and wildlife in a water body. This rule applies only to the FB
Culley plant, as the AB Brown plant already utilizes cooling water towers.
Finally, on June 2, 2014, the EPA issued the Clean Air Act Section 111(d) Greenhouse
Gas (GHG) New Source Performance Standards (NSPS) for existing sources, known as
the Clean Power Plan (CPP). The CPP sets state-specific carbon reduction goals
based on a state’s existing generation mix based upon a building block approach and
provides guidelines for the development, submission and implementation of state plans
to achieve the state goals. As yet, there is little clarity on how the state of Indiana will
choose to implement this rule. However, this IRP considers several of the potential
building blocks in its assumptions: Demand Side Management (DSM), a potential
renewables portfolio standard, and a price for carbon price beginning in 2020.
Fourth, the Indiana General Assembly passed legislation in March of 2014 that modified
DSM requirements in Indiana. Senate Enrolled Act No. 340 (“SEA 340”) removed
requirements for mandatory statewide “Core” DSM programs and energy savings goals
effective December 31, 2014. SEA 340 also allows large Commercial and Industrial
(C&I) customers who meet certain criteria to opt-out of participating in utility sponsored
DSM programs.
Vectren continues to support DSM related energy efficiency efforts as a fundamental
part of the services that are provided to customers in order to help them manage their
energy bills. Vectren believes that a cost effective level of DSM energy efficiency may
be supported by policy considerations beyond the IRP’s focus on planning for future
2014 Integrated Resource Plan
Page 25
November 2014
resources. Consistent with this belief, Vectren’s base sales forecast includes a base
level of DSM at a targeted level of 1% eligible annual savings for 2015 – 2019 and 0.5%
annually thereafter for customer load that has not opted-out of DSM programs.
Vectren also modeled whether incremental DSM energy efficiency programs would be
selected as a resource when competing with supply side options, to meet future electric
requirements. Vectren’s approach attempts to balance its commitment to a level of
cost-effective DSM to help customers manage their energy bills, while evaluating
additional DSM resources consistent with least cost planning.
Note that since the last IRP was performed, Broadway Unit 1 (BAGS 1) has quit
performing up to specifications. The unit has been on a long-term outage. Therefore,
Vectren currently does not get credit for the unforced capacity (UCAP) amount, and it
was not included in the analysis as shown in Table 1-1. BAGS 1 is a natural gas
peaking unit, and in the past was typically good for approximately 40 MW on a UCAP
basis.
PLAN RESULTS / RECOMMENDATIONS
The IRP indicates that Vectren does not need any incremental generation resources or
purchase power agreements during the planning horizon. Although the IRP does not
project incremental resource needs, Vectren proposes to continue offering DSM
programs to help customers use less energy, thus lowering their total bill. The IRP
forecasts that there may be some marginal economic benefit to retiring FB Culley 2 in
2020 under certain scenarios. This retirement evaluation is influenced by Vectren’s
load forecast, carbon costs, and fuel costs. Vectren will continue to evaluate the impact
of these components on Culley Unit 2 in successive IRPs to evaluate the optimal time to
retire Culley Unit 2.
As mentioned above and discussed in further detail in this IRP, the decision to retire FB
Culley 2 will not be made until major near term uncertainties become more clear, most

2014 Integrated Resource Plan
Page 26
November 2014
notably how the state of Indiana will implement the EPA’s Clean Power Plan (if the plan
survives legal challenges). Additionally, Vectren is actively working to attract new
industrial customers through economic development activities in southwestern Indiana.
If a large customer chooses to locate within the Vectren electric service area, Culley 2
will be required to operate at least in the short term to provide the resources necessary
to serve such a customer. Leaving Culley Unit 2 in operation at this time provides
Vectren maximum flexibility to adapt to such future developments. Economic modeling
does not necessarily account for all such developments that are very possible, and
therefore, judgment must also be part of the analysis. Table 1-2 shows the peak and
energy forecast. Table 1-3 shows that no capacity additions are currently deemed
necessary.
Vectren’s base case scenario assumptions are detailed in Chapter 10 Generation
Planning. In summary, Vectren assumed a minimum planning margin of 7.3%1 for each
year of the study. Energy savings goals of 1% of eligible customer load were
incorporated into the load forecast through 2019. Additionally, incremental energy
savings of .5% per year were assumed beginning in 2020 and were carried throughout
the rest of the planning period. All assumptions are discussed in depth throughout this
IRP.
Sensitivity risk analyses were performed around coal, gas, energy, and carbon pricing,
capital costs, and high environmental regulation cost. These results are shown in
Chapter 10 Generation Planning.
CONCLUSION
Vectren recognizes that the electric utility industry is experiencing a fast-changing time
in terms of potential regulations, environmental mandates, and technology advances.
Given the significant impact of any resource decision on both customers and other
stakeholders, Vectren will continue to actively monitor developments in the regulatory, 1 MISO unforced capacity (UCAP) requirement, further discussed in Chapter 3 MISO
2014 Integrated Resource Plan
Page 27
November 2014
environmental, and technology arenas for both their impact on future generation needs
and existing facilities. Open communication with the IURC and other parties including
the OUCC will be key to Vectren’s ability to make the best decisions for all stakeholders.
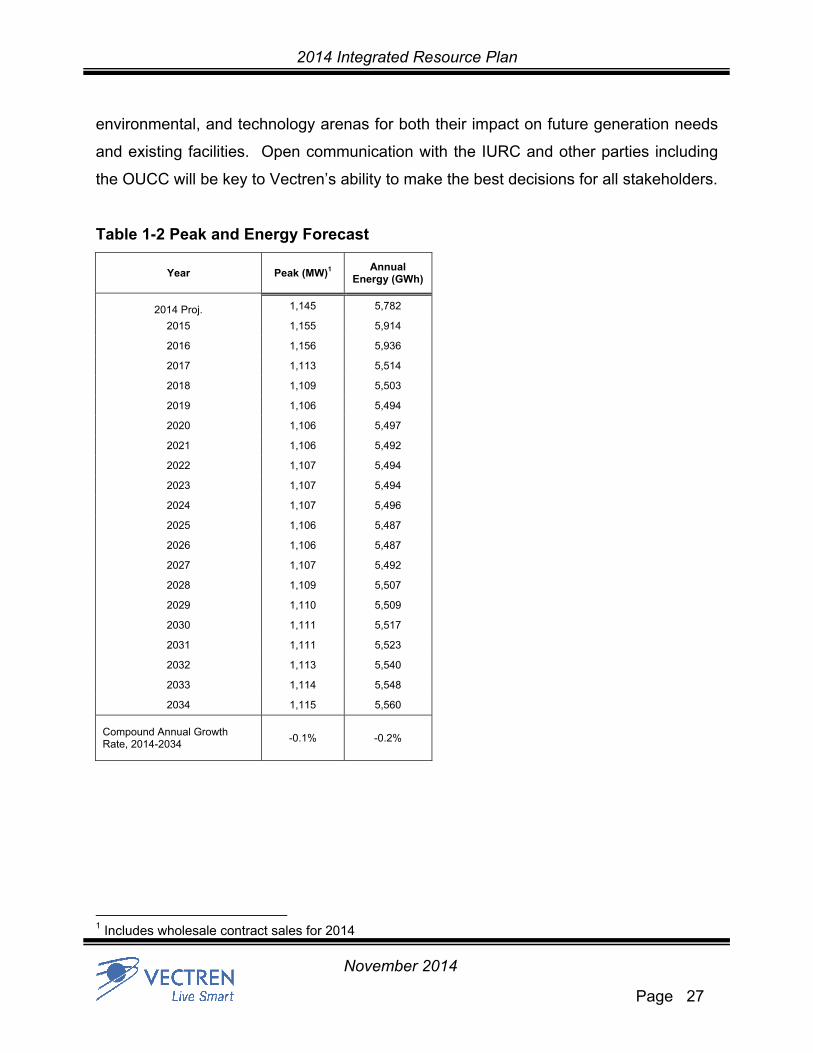
Table 1-2 Peak and Energy Forecast
Year Peak (MW)1 Annual
Energy (GWh)
2014 Proj. 1,145 5,782
2015 1,155 5,914
2016 1,156 5,936
2017 1,113 5,514
2018 1,109 5,503
2019 1,106 5,494
2020 1,106 5,497
2021 1,106 5,492
2022 1,107 5,494
2023 1,107 5,494
2024 1,107 5,496
2025 1,106 5,487
2026 1,106 5,487
2027 1,107 5,492
2028 1,109 5,507
2029 1,110 5,509
2030 1,111 5,517
2031 1,111 5,523
2032 1,113 5,540
2033 1,114 5,548
2034 1,115 5,560
Compound Annual Growth Rate, 2014-2034
-0.1% -0.2%
1 Includes wholesale contract sales for 2014
2014 Integrated Resource Plan
Page 28
November 2014
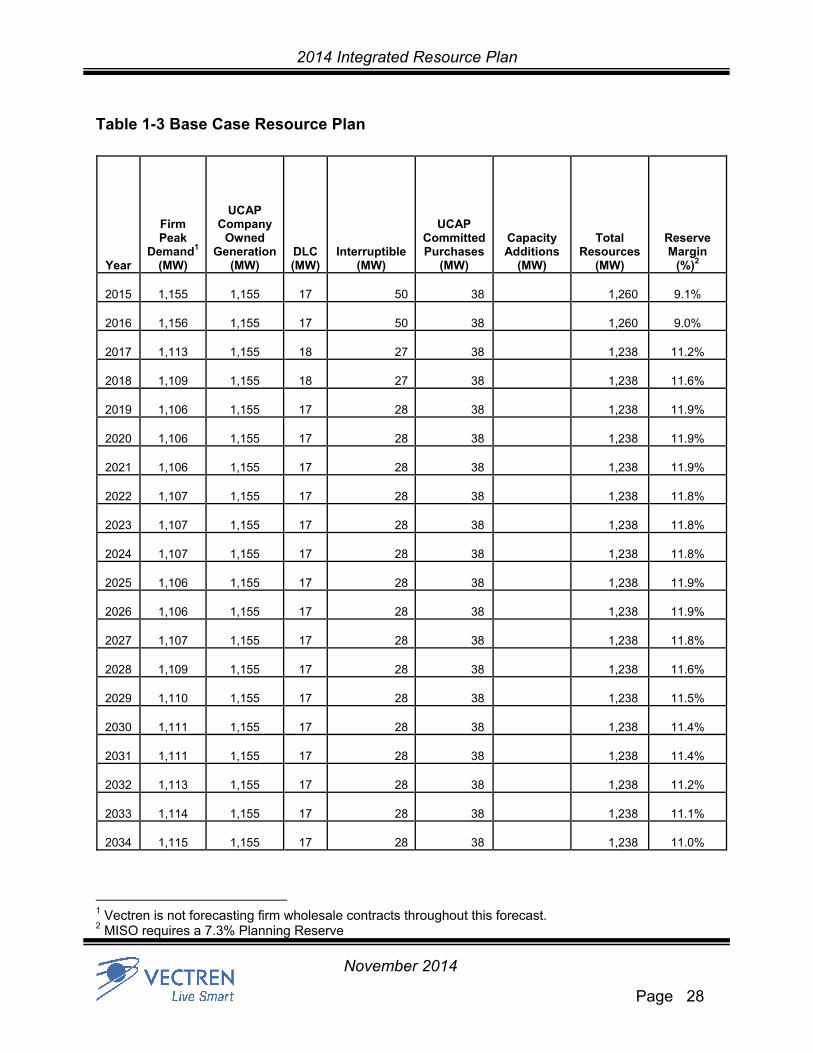
Table 1-3 Base Case Resource Plan
1 Vectren is not forecasting firm wholesale contracts throughout this forecast. 2 MISO requires a 7.3% Planning Reserve
Year
Firm Peak
Demand1 (MW)
UCAP Company
Owned Generation
(MW) DLC (MW)
Interruptible (MW)
UCAP Committed Purchases
(MW)
Capacity Additions
(MW)
Total Resources
(MW)
Reserve Margin
(%)2
2015
1,155
1,155
17 50 38
1,260 9.1%
2016
1,156
1,155
17 50 38
1,260 9.0%
2017
1,113
1,155
18 27 38
1,238 11.2%
2018
1,109
1,155
18 27 38
1,238 11.6%
2019
1,106
1,155
17 28 38
1,238 11.9%
2020
1,106
1,155
17 28 38
1,238 11.9%
2021
1,106
1,155
17 28 38
1,238 11.9%
2022
1,107
1,155
17 28 38
1,238 11.8%
2023
1,107
1,155
17 28 38
1,238 11.8%
2024
1,107
1,155
17 28 38
1,238 11.8%
2025
1,106
1,155
17 28 38
1,238 11.9%
2026
1,106
1,155
17 28 38
1,238 11.9%
2027
1,107
1,155
17 28 38
1,238 11.8%
2028
1,109
1,155
17 28 38
1,238 11.6%
2029
1,110
1,155
17 28 38
1,238 11.5%
2030
1,111
1,155
17 28 38
1,238 11.4%
2031
1,111
1,155
17 28 38
1,238 11.4%
2032
1,113
1,155
17 28 38
1,238 11.2%
2033
1,114
1,155
17 28 38
1,238 11.1%
2034
1,115
1,155
17 28 38
1,238 11.0%

2014 Integrated Resource Plan
Page 29
November 2014
This page intentionally left blank for formatting purposes

2014 Integrated Resource Plan
Page 30
November 2014
CHAPTER 2
PLANNING PROCESS

2014 Integrated Resource Plan
Page 31
November 2014
INTRODUCTION
Vectren's IRP objectives are based on the need for a resource strategy that provides
value to its customers, communities, and shareholders. In addition, this strategy must
accommodate the ongoing changes and uncertainties in the competitive and regulated
markets. Specifically, Vectren's IRP objectives are as follows:
Provide all customers with a reliable supply of energy at the least cost
reasonably possible
Develop a plan with the flexibility to rapidly adapt to changes in the market while
minimizing risks
Provide high-quality, customer-oriented services which enhance customer value
Minimize impacts of Vectren’s past and current operations on local environments
PLANNING PROCESS
The planning process is driven by the characteristics of Vectren's markets and the
needs of its customers. These elements serve to define the utility's objectives and help
establish a long-term forecast of energy and demand.
Using the forecast as a baseline, the IRP process entails evaluation of both supply-side
and demand-side options designed to address the forecast. These options serve as
input into a formal integration process that determines the benefits and costs of various
combinations of supply-side and demand-side resources. Because the IRP modeling
process requires significant amounts of data and assumptions from a variety of sources,
a process is needed to develop appropriate inputs to the models.
The process criteria for inputs include:
Maintain consistency in developing key assumptions across all IRP components
Incorporate realistic estimates based on up-to-date documentation with
appropriate vendors and available market information, as well as internal
departments

2014 Integrated Resource Plan
Page 32
November 2014
Consideration of impacts and experiences gained in prior IRP processes and
demand-side program efforts
Vectren follows an integrated resource plan process that is very similar to other utilities
throughout the country. In order to stay current with IRP methodologies and techniques,
Vectren works with consultants, attends integrated resource planning conferences, and
attends the annual contemporary issues meeting (hosted by the IURC). The diagram
below illustrates the general process.
Vectren’s objective is to serve customers as reliably and economically as possible,
while weighing future risks and uncertainties. Vectren begins the process by
forecasting customers’ electric demand for 20 years. The electric demand forecast
considers historical electric demand, economics, weather, appliance efficiency trends
(driven by Federal codes and standards), population growth, adoption of customer
owned generation (such as solar panels), and Vectren DSM energy efficiency programs
(such as appliance rebates). A base, low, and two high peak load forecasts were
developed.
Identify objectives, metrics and risk perspectives
Establish baseline and alternative future assumptions
Determine resource options
Identify ideal portfolios under various alternative futures (Scenarios)
Expose portfolios to sensitivities and evaluate other risks
Select “best” portfolios
Portfolio recommendations consistent with objectives
2014 Integrated Resource Plan
Page 33
November 2014
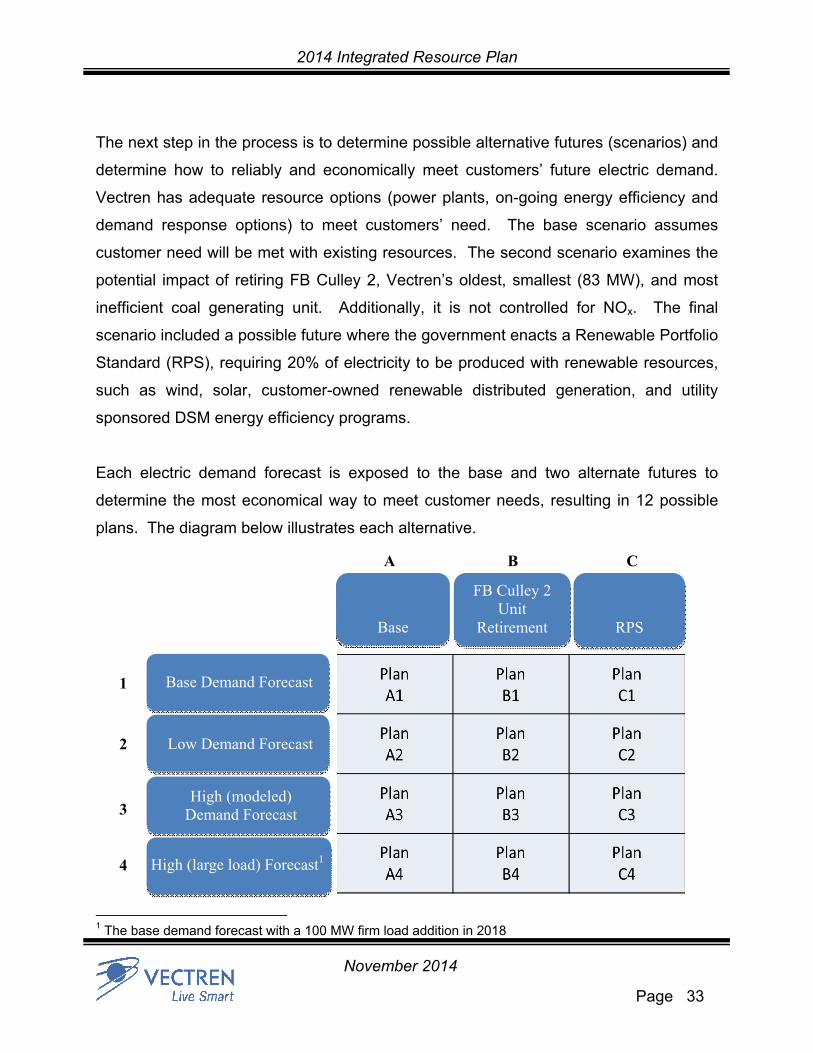
The next step in the process is to determine possible alternative futures (scenarios) and
determine how to reliably and economically meet customers’ future electric demand.
Vectren has adequate resource options (power plants, on-going energy efficiency and
demand response options) to meet customers’ need. The base scenario assumes
customer need will be met with existing resources. The second scenario examines the
potential impact of retiring FB Culley 2, Vectren’s oldest, smallest (83 MW), and most
inefficient coal generating unit. Additionally, it is not controlled for NOx. The final
scenario included a possible future where the government enacts a Renewable Portfolio
Standard (RPS), requiring 20% of electricity to be produced with renewable resources,
such as wind, solar, customer-owned renewable distributed generation, and utility
sponsored DSM energy efficiency programs.
Each electric demand forecast is exposed to the base and two alternate futures to
determine the most economical way to meet customer needs, resulting in 12 possible
plans. The diagram below illustrates each alternative.1
1 The base demand forecast with a 100 MW firm load addition in 2018
FB Culley 2 Unit
Retirement
Base
A
High (large load) Forecast1
1
Low Demand Forecast
C
4
RPS
3
2
B
Base Demand Forecast
High (modeled) Demand Forecast
2014 Integrated Resource Plan
Page 34
November 2014
Each plan represents the lowest-cost option to meet customer demand. Several
resource options were considered in the analysis to meet customer demand, including
various (types and sizes) natural gas powered generation options, additional energy
efficiency programs beyond what is already included in the electric demand forecasts,
renewables (wind and solar generation), and short-term market capacity purchases.
All model inputs and assumptions are loaded into a modeling tool called Strategist,
which is used by many utilities throughout the country. The modeling tool optimizes for
the lowest-cost plan to meet customer demand, plus a 7.3% UCAP planning reserve
margin.
Each plan was then subjected to additional risk sensitivities to determine which plan is
the lowest cost over a wide range of possible future risks. As previously mentioned,
resource modeling requires a large number on inputs and assumptions: forecasts for
natural gas prices, coal prices, market energy prices, CO2 prices, costs of resource
options, and potential costs for regulations. If the costs of any of these risk factors vary
significantly from the base forecasts, the results of the analysis could potentially be
different. Each plan (A1-C4) was subjected to varying costs (most often +/- 20%) for the
risk factors mentioned above to determine the impact to each plan from the possible
future sensitivities.

2014 Integrated Resource Plan
Page 35
November 2014
The remainder of this IRP is organized as follows:
MISO Chapter 3 - Discusses Vectren’s participation in MISO and the implications for
resource planning Environmental Chapter 4 - Discusses current and pending environmental issues and
regulations and the potential considerations for resource decisions Forecast Chapter 5 - Contains the electric sales and demand forecast
Supply-Side Chapter 6 - Describes the electric supply analysis including a review and
screening of the various electric supply options Chapter 7 - Describes the viability and application of renewable and clean
energy technologies and renewable energy credits (RECs) Chapter 9 - Contains a discussion of Vectren's transmission and distribution
expansion plan forecast
Demand-Side Chapter 8 - Presents a discussion of DSM resources including screening
results and program concept development
Integration Chapter 10 - Details the formal integration process which includes conducting
sensitivity analyses and obtaining the final resource plan Short term Action Plan Chapter 11 - Contains action plans designed to implement the resource plan
over the next three years

2014 Integrated Resource Plan
Page 36
November 2014
This page intentionally left blank for formatting purposes

2014 Integrated Resource Plan
Page 37
November 2014
CHAPTER 3
MISO
2014 Integrated Resource Plan
Page 38
November 2014
INTRODUCTION
Vectren was an original signer of the Transmission Owners Agreement, which
organized the Midwest Independent Transmission System Operator, now known as the
Midcontinent Independent System Operator (MISO) and under which authority the
MISO administers its Open Access Transmission, Energy and Operating Reserve
Markets Tariff (MISO Tariff). As a vertically integrated utility with the responsibility and
obligation for serving load within the MISO footprint, Vectren has integrated many
functions with the operating procedures of MISO. This integration involves the
coordinated operation of its transmission system and generating units, and the functions
range from owning and operating generation and transmission, to complying with
certain reliability standards. These standards include planning and operation of
resources to meet the needs of loads in the future and are set by the North American
Electric Reliability Corporation (NERC) and the regional reliability entity Reliability First
Corporation, both of which are overseen by the Federal Energy Regulatory Commission
(FERC).
MISO OVERVIEW
MISO, headquartered in Carmel, Indiana, with additional offices in Egan, Minnesota,
was approved as the nation's first regional transmission organization in 2001. Today,
MISO manages one of the world’s largest energy and operating reserves markets; the
market generation capacity was 175,436 MW as of May 1, 2014. This market operates
in 15 states and one Canadian province.
2014 Integrated Resource Plan
Page 39
November 2014
Key Dates
February 1, 2002 - Transmission service began under MISO Open-Access
Transmission Tariff with Vectren as a full Transmission Owning Member
April 1, 2005 - Midwest markets launch
April 16, 2008 - NERC certified MISO as Balancing Authority
January 6, 2009 - Ancillary Services Markets began and MISO became the
region’s Balancing Authority
December 19, 2013 – Added South Region
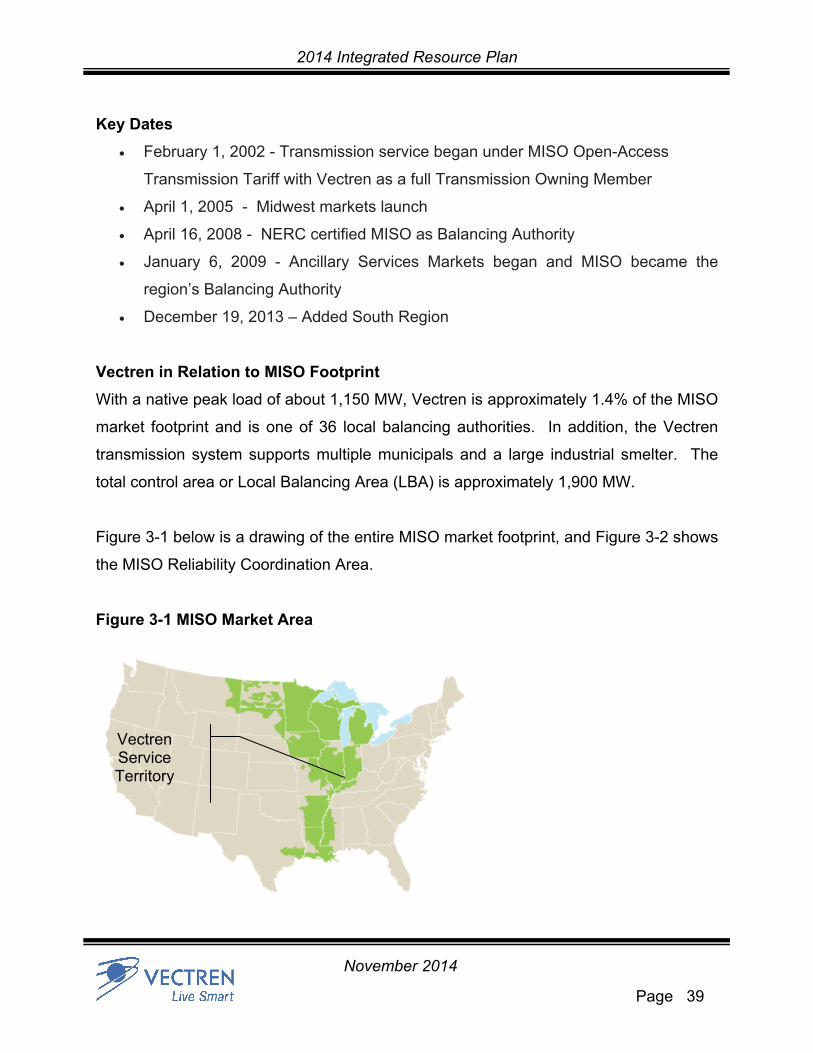
Vectren in Relation to MISO Footprint
With a native peak load of about 1,150 MW, Vectren is approximately 1.4% of the MISO
market footprint and is one of 36 local balancing authorities. In addition, the Vectren
transmission system supports multiple municipals and a large industrial smelter. The
total control area or Local Balancing Area (LBA) is approximately 1,900 MW.
Figure 3-1 below is a drawing of the entire MISO market footprint, and Figure 3-2 shows
the MISO Reliability Coordination Area.
Figure 3-1 MISO Market Area
Vectren Service Territory

2014 Integrated Resource Plan
Page 40
November 2014
Figure 3-2 MISO Reliability Coordination Area
MISO’s GOALS
The goal of MISO’s regional
transmission planning process
is the development of a
comprehensive expansion
plan that meets both reliability
and economic expansion
needs. This process identifies
solutions for reliability issues
that arise from the expected
dispatch of network resources.
These solutions include
evaluating alternative costs
between capital expenditures
for transmission expansion projects and increased operating expenses from
redispatching network resources or other operational actions.
The MISO Board of Directors has adopted six planning principles to guide the MISO
regional plan:
1. Make the benefits of an economically efficient energy market available to
customers by identifying transmission projects which provide access to electricity
at the lowest total electric system costs.
2. Provide a transmission infrastructure that upholds all applicable NERC and
Transmission Owner planning criteria and safeguards local and regional reliability
through identification of transmission projects to meet those needs.
3. Support state and federal energy policy requirements by planning for access to a
changing resource mix.

2014 Integrated Resource Plan
Page 41
November 2014
4. Provide an appropriate cost allocation mechanism that ensures the costs of
transmission projects are allocated in a manner roughly commensurate with the
projected benefits of those projects.
5. Analyze system scenarios and make the results available to state and federal
energy policymakers and other stakeholders to provide context and to inform
choices they face.
6. Coordinate transmission planning with neighboring planning regions to seek
more efficient and cost-effective solutions.1
MISO is designated as Vectren’s Planning Authority, under the NERC reliability
standards, and in FERC Order 1000, MISO has additional regional planning
responsibilities.
MISO PLANNING PROCESS
MISO Transmission Planning Process
MISO’s transmission planning process begins with the models for the current planning
cycle and includes opportunities for stakeholder input on the integration of transmission
service requests, generator interconnection requests, and other studies to contribute to
the development of an annual MISO Transmission Expansion Plan (MTEP) report.
The 2013 MTEP recommended $1.48 billion in 317 new projects across the MISO
footprint through the year 2023. MISO MTEP process has recommended $17.9 billion
total investment since its 2003 inception through the first 10 years.
1 These Guiding Principles were initially adopted by the Board of Directors, pursuant to the recommendation of the System Planning Committee, on August 18, 2005, and reaffirmed by the System Planning Committee in February 2007, August 2009, May 2011, and March 2013.

2014 Integrated Resource Plan
Page 42
November 2014
MISO’s role in meeting Vectren’s requirements as a member of ReliabilityFirst for
a Planning Reserve Margin
As a result of the Energy Policy Act of 2005, regional entities were delegated authority
by FERC to establish standards to provide for reliable operation of the bulk-power
system. Vectren is a member of regional entity ReliabilityFirst, and so must comply with
regional entity Reliability First standards, including the Planning Resource Adequacy
Analysis and the Assessment and Documentation Standard BAL-502-RFC-02. This
assessment and documentation standard requires planning coordinators to perform
annual resource adequacy analyses. This includes calculating a planning reserve
margin (PRM) that will result in the sum of the probabilities for loss of load for the
integrated peak hour for all days of each planning year equal to a one day in 10 year
criterion. This PRM requirement also includes documenting the projected load,
resource capability, and PRM for the years under study, and other particular criteria.
The first planning year the Reliability First Planning Reserve Standard was in effect
(June 2008-May 2009), Vectren complied with the ReliabilityFirst Planning Resource
Adequacy standard by participating in the Midwest Planning Reserve Sharing Group.
The calculated required PRM for Vectren was 14.3% on an installed capacity basis. For
planning year June 2009-May 2010 and beyond, Vectren and all other MISO utilities
have delegated their tasks assigned to the Load Serving Entities (LSEs) under BAL-
502-RFC-02 to MISO. The specific section of the MISO Tariff that addresses planning
reserves is Module E-1 Resource Adequacy. Vectren is complying with the
ReliabilityFirst Planning Resource Adequacy standard by meeting the MISO Module E
individual LSE required PRM. This PRM (UCAP) is 7.3% for planning year June 2014 -
May 2015.
MISO’s Module E-1
As previously mentioned, Module E-1- Resource Adequacy is the portion of the MISO
Tariff which requires MISO to determine the Planning Reserve Margin Requirement, on

2014 Integrated Resource Plan
Page 43
November 2014
an unforced capacity (UCAP) basis, that would result in 1 day in 10 Loss of Load Event
reliability standard. Module E-1 and its associated business practice manual lays out the
mandatory requirements to ensure access to deliverable, reliable and adequate
planning resources to meet peak demand requirements on the transmission system.
To perform these calculations, MISO requires entities to utilize their Module E Capacity
Tracking Tool (MECT) to submit a forecast of demand and list their qualified resources.
This same tool is then leveraged to accept offers into MISO’s annual Planning Resource
Auction (PRA).
Loss of Load Expectation and Determination of Planning Reserve Margins
MISO used a Loss of Load Expectation1 (LOLE) of 1 day in 10 years as the probabilistic
method to determine expected number of days per year for which available generating
capacity is insufficient to serve the daily peak demand (load). This LOLE, along with
other LSE-specific data, is used to perform a technical analysis on an annual basis to
establish the PRM UCAP for each LSE. The PRM analysis considers other factors such
as generator forced outage rates of capacity resources, generator planned outages,
expected performance of load modifying resources, forecasting uncertainty, and system
operating reserve requirements.
For this year, an unforced capacity planning reserve margin of 7.3% applied to the
MISO system Coincident Peak Demand has been established for the planning year of
June 2014 through May 2015. This value was determined by MISO through the use of
the GE Multi-Area Reliability Simulation (MARS) software for Loss of Load analysis.
Effect of Load Diversity
Within Module E-1, individual LSEs maintain reserves based on their Coincident Peak
Demand, which is the LSE’s demand at the time of the MISO peak. MISO no longer
calculates a Load Diversity Factor for LSE’s, as this would be different for each LSE.
However, each LSE peaks at a different time, and for reference, an LSE can determine 1 Included in the Technical Appendix, section I

2014 Integrated Resource Plan
Page 44
November 2014
what the PRM UCAP would be when accounting for load diversity by multiplying the
PRM UCAP times the ratio of LSE Coincident Peak Demand divided by LSE peak
Demand.
Forecast LSE Requirements
LSEs must demonstrate that sufficient planning resources are allocated to meet the
LSE Coincident Peak Demand multiplied by one plus the PRM and one plus
transmission losses. The submission of this forecast follows MISO’s prescribed
processes.
LSEs must report their peak demand forecasts for each month of the next two planning
years and for each summer period (May-October) and winter period (November-April)
for an additional eight (8) planning years for the NERC MOD standards.
Forecasted demand in MISO reflects the expected “50/50” LSE Coincident Peak
Demand and includes the effect of all distribution and transmission losses. This means
there is a 50% chance that actual demand will be higher and a 50% chance that actual
demand will be lower than the forecasted level.
LSEs must also report their Net Energy for Forecasted Demand for the same time
periods: monthly for the next two planning years and for each summer period (May-
October) and winter period (November-April) for an additional eight (8) planning years
for the NERC MOD standards.
LSEs register demand side management into the MECT tool separate from their
demand forecasts. These resources are explicitly modeled on the supply side in
determination of the PRM.
2014 Integrated Resource Plan
Page 45
November 2014
Resource Plan Requirements
LSEs are obligated to provide MISO with resource plans demonstrating that Zonal
Resource Credits (ZRC) will be available to meet their resource adequacy
requirements. Generally, the Planning Reserve Margin Requirement (PRMR) is the
forecast LSE Peak Demand multiplied by one plus MISO PRM UCAP and one plus
transmission losses, unless the state utility commission establishes a PRM that is
different from MISO’s. Additionally LSEs must meet a Local Clearing Requirement
(LCR) for the Local Resource Zone (LRZ) for which the LSE resides, Vectren is in LRZ
six. The LCR is equal to the Local Reliability Requirement (LRR) less the Capacity
Import Limit (CIL) into that zone. The LRR is established so that the LRZ can also meet
the 1 day in 10 LOLE reliability standard by clearing the necessary resources within the
LRZ.
If a state utility commission establishes a minimum PRM for the LSEs under their
jurisdiction, that state-set PRM will be adopted by MISO for affected LSEs in such state.
If a state utility commission establishes a PRM that is higher than the MISO established
PRM, the affected LSE’s must meet the state-set PRM.1 Indiana does not have a
stated minimum planning reserve margin; therefore, Vectren must meet the PRM of
MISO.
Qualification of Resources, Including Unforced Capacity Ratings (UCAP),
Conversion of UCAP MW to Zonal Resource Credits
To comply with MISO Resource Adequacy provisions, LSEs must submit data for their
eligible resources for MISO to determine the total installed capacity that the resource
can reliably provide, called Unforced Capacity Rating (UCAP).
1 From MISO BPM-011-r13 Resource Adequacy Section 3.5.5 State Authority to set PRM
2014 Integrated Resource Plan
Page 46
November 2014
MISO will calculate unforced capacity for all generation resources interconnected to the
MISO Transmission System while respecting the interconnection study results and the
results of the aggregate deliverability analysis.
The first step is to compare a Generation Resource Net Dependable Capacity (NDC) to
the tested capacity from the interconnection process to determine the total installed
capacity that the generation resource can reliably provide, which is the Total
Interconnection Installed Capacity (ICAP). A unit’s NDC for the Planning Year is
determined by averaging the NDC data that is entered into MISO’s Generating
Availability Data System (GADS) database. The UCAP rating represents the MW’s that
are eligible to be converted into ZRCs.
Evaluation and Reporting
MISO will maintain databases and will “..provide to states, upon request, with relevant
resource adequacy information as available…” per section 69 of the MISO Tariff during
relevant time periods, subject to the data confidentiality provisions in section 38.9 of the
MISO Tariff.
Vectren’s approach to the Voluntary Capacity Auction
Due to the long lead time generally required to build capacity resources, Vectren does
not consider MISO’s annual Planning Resource Auction an appropriate means to meet
the needs of the 20 year Integrated Resource Plan and continues to pursue more
traditional means of ensuring adequate resources.
Future of MISO’s Module E
MISO proposed Capacity Market
MISO is currently evaluating whether the annual summer based resource adequacy
construct contains gaps that prevent it from achieving resource adequacy during all
periods of the year. MISO is working to identify seasonal or other changes that will close
any identified gaps.

2014 Integrated Resource Plan
Page 47
November 2014
Footprint Changes
On Dec. 19, 2013 MISO began coordinating all RTO activities in the newly combined
footprint consisting of all or parts of 15 states with the integration of the MISO south
entities which include the LBAs of Entergy Arkansas, Inc., Entergy Texas, Inc., Entergy
Mississippi, Inc., Entergy Louisiana, LLC, Entergy Gulf States Louisiana, L.L.C., Entergy
New Orleans, Inc., Cleco Power LLC, Lafayette Utilities System, Louisiana Energy &
Power Authority, South Mississippi Electric Power Authority and Louisiana Generating,
LLC.
DEMAND RESPONSE
Demand response is an integral part of a utility’s system, operations, and planning, and
helps Vectren meet the obligation to serve all customers. Effective July 1, 2011 and
pursuant to Commission order in Cause 34566 MISO 4, Vectren filed Rider DR, which
provides qualifying customers the optional opportunity to reduce their electric costs by
participating in the MISO wholesale energy market. This rider helps the Company’s
efforts to preserve reliable electric service through customer provision of a load
reduction during MISO high price periods and declared emergency events. This initial
Rider DR offers two programs, Emergency Demand Response (EDR) and Demand
Response Resource Type 1 (“DRR-1”) energy programs.
MISO FORECAST
Based on analysis of load forecasts and planned resources derived from survey
responses provided by the load serving entities in its footprint, MISO has created
several iterations of resource adequacy forecasts that indicate beginning in 2016,
several zones within the footprint may lack the capacity required to meet reserve
requirements. MISO continues to assess the accuracy of this analysis and appears to
concede that state regulatory commissions remain confident that adequate reserves
exist in the near term. However, such studies do highlight the potential reliability issues
created by the EPA emissions restrictions, and in particular, the potential for numerous
base load coal plant retirements driven by the EPA’s Clean Power Plan. Questions
2014 Integrated Resource Plan
Page 48
November 2014
regarding available capacity, as well as local reliability concerns will be factored into the
Company's planning processes.
Vectren’s Approach to Resource Adequacy
Vectren will continue to comply with MISO’s Module E requirements, which includes the
possibility for varying amounts of planning reserves.

2014 Integrated Resource Plan
Page 49
November 2014
This page intentionally left blank for formatting purposes
2014 Integrated Resource Plan
Page 50
November 2014
Chapter 4
ENVIRONMENTAL
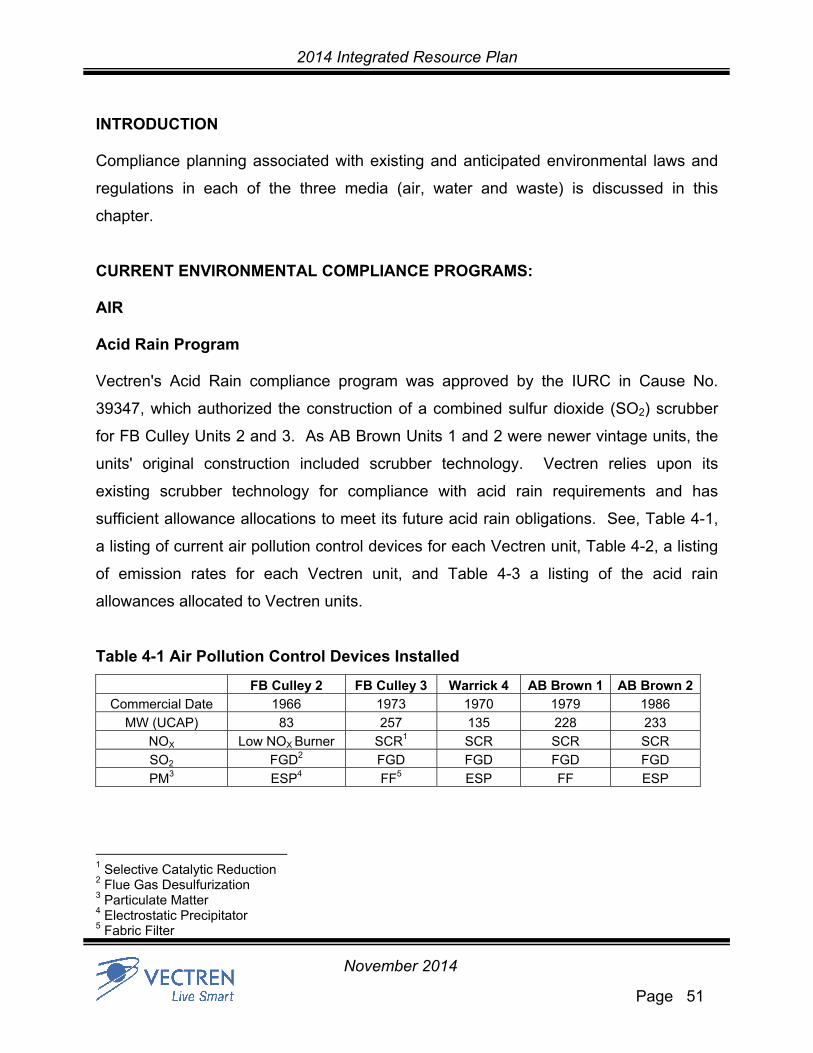
2014 Integrated Resource Plan
Page 51
November 2014
INTRODUCTION
Compliance planning associated with existing and anticipated environmental laws and
regulations in each of the three media (air, water and waste) is discussed in this
chapter.
CURRENT ENVIRONMENTAL COMPLIANCE PROGRAMS:
AIR
Acid Rain Program
Vectren's Acid Rain compliance program was approved by the IURC in Cause No.
39347, which authorized the construction of a combined sulfur dioxide (SO2) scrubber
for FB Culley Units 2 and 3. As AB Brown Units 1 and 2 were newer vintage units, the
units' original construction included scrubber technology. Vectren relies upon its
existing scrubber technology for compliance with acid rain requirements and has
sufficient allowance allocations to meet its future acid rain obligations. See, Table 4-1,
a listing of current air pollution control devices for each Vectren unit, Table 4-2, a listing
of emission rates for each Vectren unit, and Table 4-3 a listing of the acid rain
allowances allocated to Vectren units.
Table 4-1 Air Pollution Control Devices Installed
FB Culley 2 FB Culley 3 Warrick 4 AB Brown 1 AB Brown 2Commercial Date 1966 1973 1970 1979 1986
MW (UCAP) 83 257 135 228 233
NOX Low NOX Burner SCR1 SCR SCR SCR
SO2 FGD2 FGD FGD FGD FGD
PM3 ESP4 FF5 ESP FF ESP
1 Selective Catalytic Reduction 2 Flue Gas Desulfurization 3 Particulate Matter 4 Electrostatic Precipitator 5 Fabric Filter

2014 Integrated Resource Plan
Page 52
November 2014
Table 4-2 Current (2013) Emission Rates (lbs./mm Btu)
Units SO2 Annual NOX Ozone Season
NOX AB Brown 1 0.6400 0.1510 0.1464
AB Brown 2 0.3610 0.1160 0.1091
AB Brown 3 0.0006 0.1800 0.1710
AB Brown 4 0.0006 0.0310 0.0214
FB Culley 2/3 0.1700 0.1190 0.1312
Warrick 4 0.1800 0.2400 0.2740
BAGS 2 0.0006 0.2226 0.2111
Table 4-3 SO2 Acid Rain Allowances Allocated to Vectren Units (per year)
Plant Name Percent
Ownership 2013 2014-2041
AB Brown 100% 10,546 10,546
FB Culley 100% 9,922 9,922
Warrick 41 50% 5,122 5,122
For purposes of compliance year 2014, acid rain allowances will continue to be used for
compliance with the SO2 emission reductions requirements of the Clean Air Interstate
Rule (CAIR). As detailed more fully below, the Cross-State Air Pollution Rule (CSAPR)
which was originally slated to become effective in two phases during 2012 and 2014,
was stayed by the Court in December 2011 and vacated in August 2012. Through a
series of appeals, it was reviewed by the US Supreme Court who issued judgment on
April 29, 2014 to reverse the lower Court decision and upheld CSAPR. The stay was
lifted on October 23, 2014 but an implementation schedule and reallocation of
allowances has not been determined at this time. Due to the timing of this recent
decision, Vectren is unable to state when CSAPR will go into effect and what the final
allowance levels will be for each of its units. Neither the CAIR rule nor CSAPR
supersedes the Acid Rain program. Facilities will still be required to annually surrender
acid rain allowances to cover emissions of SO2 under the existing Acid Rain program.
1 Number of allowances shown are for Vectren’s portion of Warrick 4
2014 Integrated Resource Plan
Page 53
November 2014
NOx SIP Call
Vectren's NOx SIP Call compliance plan was approved by the IURC in Cause Nos.
41864 and 42248, which authorized Vectren to retrofit selective catalytic reduction
(SCR) technology on Culley Unit 3, Warrick Unit 4, and Brown Units 1 and 2. Vectren
relies upon its existing SCR technology for compliance with the seasonal NOx
reductions required in the NOx SIP Call. When CAIR was finalized in March of 2005,
the EPA included a seasonal NOx emission reduction requirement, which incorporated,
and in most cases, went beyond the seasonal NOx emission reductions required under
the NOx SIP Call. For purposes of compliance year 2014, CAIR NOx seasonal
allowances will continue to be used for compliance with the seasonal NOx emission
reductions requirement under the current CAIR rule. CAIR and CSAPR are discussed
more fully below.
CAIR and CSAPR
On March 10, 2005, the US Environmental Protection Agency (EPA) finalized its
determination in the CAIR rule that emissions from coal-burning Electric Generating
Units (EGUs) in certain upwind states result in the transport of fine particles (PM2.5) and
ozone that significantly contribute to nonattainment of the applicable ambient air quality
standards for those pollutants in downwind states. The CAIR rule required revisions to
state implementation plans in twenty eight states, including Indiana, requiring further
reductions of NOx and SO2 from EGUs beyond those required in the NOx SIP Call and
Acid Rain programs. Emissions reductions under the CAIR rule were to be
implemented in two phases, with requirements for first phase reductions in 2009 (NOx)
and 2010 (SO2), and second phase reductions starting in 2015. The Warrick 4 scrubber
was constructed to comply with the CAIR regulation and approved in Cause No. 42861.
The CAIR rule provided a federal framework for a regional cap and trade system, and
those allowances allocated to the Vectren units under the CAIR rule are being used for
compliance in 2014 and until the EPA reinstates CSAPR (see below).

2014 Integrated Resource Plan
Page 54
November 2014
On July 6, 2010, the EPA proposed its Clean Air Transport Rule ("Transport Rule") in
response to the court's remand of CAIR. In an effort to address the court's finding that
CAIR did not adequately ensure attainment of ozone and PM2.5 air quality standards in
certain Eastern states due to unlimited trading and banking of allowances, the Transport
Rule proposal dramatically reduced the ability of facilities to meet the required emission
reductions through interstate allowance trading. Like CAIR, the Transport Rule
proposal set individual state caps for SO2 and NOx; however, unlike CAIR, individual
unit allowance allocations were set out directly in the Transport Rule proposal.
Interstate allowance trading was severely restricted and limited to trading within a zonal
group. On July 7, 2011, the EPA finalized the Transport Rule proposal and renamed
the program the Cross State Air Pollution Rule (CSAPR). CSAPR sets individual
allowance allocations for Vectren's units directly in the rule. Table 4-4 shows a listing of
individual unit allowance allocations under the original CSAPR. Under the original
version of CSAPR, any excess CAIR allowances (vintage 2011 or older) that were not
needed for compliance in 2011 could not be used for compliance with CSAPR, which
was scheduled to become effective January 1, 2012. It is not yet known how, or when,
the EPA will revise the effective dates in the reinstated version of the rule. Given the
stringent state emission caps, the limited allowance trading available under the CSAPR,
and the unknown implementation timing due to the recent lifting of the court ordered
stay on October 23, 2014 it is virtually impossible to predict with any certainty the
availability of excess allowances for compliance and the costs of those allowances
under a reinstated CSAPR.

2014 Integrated Resource Plan
Page 55
November 2014
Table 4-4 CSAPR Allowances Allocated to Vectren Units
SO2 Allocation Annual NOX Seasonal NOX
2012 2014 2012 2014 2012 2014
AB Brown 1 3,761 2,080 1,393 1,376 595 586
AB Brown 2 3,889 2,151 1,440 1,422 601 591
AB Brown 3 1 1 19 19 14 14
AB Brown 4 0 0 6 6 4 4
BAGS 2 0 0 26 26 18 8
FB Culley 2 1,488 925 619 612 268 264
FB Culley 3 2,923 2,799 1,874 1,851 792 780
Warrick 4 2,802 1,550 1,037 1,025 444 437
Vectren's original multi-pollutant compliance plan was approved under IURC Cause No.
42861. While Vectren's original multi-pollutant planning focused on compliance with the
CAIR regulation which was in place at the time, the successful execution of the
approved multi-pollutant plan would enable Vectren to comply with the SO2 and NOx
emission caps in the original CSAPR allocation without further significant capital
investment; however, while currently well controlled, Vectren will incur increased
Operating and Maintenance (O&M) costs attributable to a new regulation, such as an
increase in chemical costs to achieve the lower emission targets. With the completion
of the Warrick 4 scrubber pursuant to the approved order in Vectren's multi-pollutant
proceeding, Vectren's generating system is 100% scrubbed for SO2 and has selective
catalytic reduction technology on all but one unit (FB Culley Unit 2). See Table 4-1. As
such, Vectren will be well-positioned to comply with the new, more stringent SO2 and
NOx caps that are required by a re-instated CSAPR, without reliance on a highly
uncertain allowance market or further significant capital expenditures. It is important to
note that CSAPR stay was just recently lifted on October 23, 2014, and final
implementation dates are still unknown.
2014 Integrated Resource Plan
Page 56
November 2014
Mercury and Air Toxics Rule
The 1990 Amendments to the Clean Air Act (CAA or Act) required that the EPA
determine whether EGUs should be required to reduce hazardous air pollutants,
including mercury, under § 112 of the Act. In December of 2000, the EPA officially
listed coal-fired EGUs as subject to CAA § 112 Maximum Achievable Control
Technology (MACT) Standards for mercury, thus lifting a previous exemption from the
air toxics requirements. On March 15, 2005, the EPA finalized its Clean Air Mercury
Rule (CAMR) which set "standards of performance" under CAA §111 for new and
existing coal-fired EGUs and created a nation-wide mercury emission allowance cap
and trade system for existing EGUs which sought to reduce utility emissions of mercury
in two phases. The first phase cap would have started in 2010, except the CAMR rule
was similarly vacated by a reviewing court in March of 2008. Thus, like the CAIR rule,
utilities were preparing for compliance with a finalized CAMR regulation that was
ultimately found to be deficient by a reviewing court. The reviewing court directed the
EPA to proceed with a MACT rulemaking under CAA § 112 which would impose more
stringent individual plant-wide limits on mercury emissions and not provide for
allowance trading.
On March 16, 2011, the EPA released its proposed MACT for utility boilers. The final
rule, known as the Mercury and Air Toxics Standards (MATS) was published in the
Federal Register on February 16, 2012. The rule sets plant-wide emission limits for the
following hazardous air pollutants (HAPs): mercury, non-mercury HAPs (e.g. arsenic,
chromium, cobalt, and selenium), and acid gases (hydrogen cyanide, hydrogen
chloride, and hydrogen fluoride). The EPA established stringent plant-wide mercury
emission limits (1.2 lb/TBtu for individual unit or 1.0 lb/TBtu for plant average) and set
surrogate limits for non-mercury HAPs (total particulate matter limit of .03 lb/MMBtu)
and acid gases (HCL limit of .002 lb/MMBtu). The surrogate limits can be used instead
of individual limits for each HAP. Compliance with the new limits will be required by
April 16, 2015. The Indiana Department of Environmental Management (IDEM), the
state permitting authority, has the discretion to grant a compliance extension of up to

2014 Integrated Resource Plan
Page 57
November 2014
one year on a case by case basis if a source is unable to install emission controls or
make fuel conversions prior to the April 2015 deadline. Vectren was granted a 1-year
extension for the AB Brown Unit 2, contingent upon the need for injection of a
secondary mercury treatment chemical. The need for the secondary chemical will not
be known until after the primary system is operational at the end of 2014. Vectren
currently has a MATS Compliance plan before the Commission (IURC Cause 44446) for
approval that includes organo sulfide injection at the baseload units (AB Brown 1, AB
Brown 2, FB Culley 3, and Warrick 4) with the possibility of an additional HBr injection at
AB Brown 2 if needed.
SOLID WASTE DISPOSAL
Scrubber by-products from AB Brown are sent to an on-site landfill permitted by IDEM.
During the fall of 2009, Vectren finalized construction of a dry fly ash silo and barge
loading facility that would allow for the beneficial reuse of Vectren generated fly ash.
Since February 2010, the majority of AB Brown fly ash has been diverted to the new dry
ash handling system and sent for beneficial reuse to a cement processing plant in St.
Genevieve, Missouri, via a river barge loader and conveyor system. The remainder of
the A B Brown fly ash and bottom ash is sluiced to an on-site pond. This major
sustainability project will serve to mitigate negative impacts from the imposition of a
more stringent regulatory scheme for ash disposal. The majority of Vectren's coal
combustion materials are now being diverted from the existing ash pond structures and
surface coal mine backfill operations and transported offsite for recycling into a cement
application.
Fly ash from the FB Culley facility is similarly transported off-site for beneficial reuse in
cement. Until mid-2009, fly ash from the FB Culley facility was sent to the Cypress
Creek Mine for backfill pursuant to the mine's surface coal mine permit. In May 2009,
FB Culley began trucking fly ash to the St. Genevieve cement plant. Upon completion
of the barge loading facility at the AB Brown facility in late 2009, FB Culley's fly ash is
now transported to the AB Brown loading facility and shipped to the cement plant via

2014 Integrated Resource Plan
Page 58
November 2014
river barge. The FB Culley facility sends its bottom ash to one of two on-site ponds via
wet sluicing. The ponds are seven and eighteen acres in size. Scrubber by-product
generated by the FB Culley facility is also used for beneficial reuse and shipped by river
barge from FB Culley to a wallboard manufacturer. In summary, the majority of
Vectren's coal combustion material is no longer handled on site, but is being recycled
and shipped off-site for beneficial reuse.
HAZARDOUS WASTE DISPOSAL
Vectren’s AB Brown and FB Culley plants are episodic producers of hazardous waste
that may include paints, parts washer fluids, or and other excess or outdated chemicals.
Both facilities are typically classified as Conditionally Exempt Small Quantity
Generators.
WATER
AB Brown and FB Culley currently discharges process and cooling water to the Ohio
River under National Pollutant Discharge Elimination System (NPDES) water discharge
permits issued by the IDEM. AB Brown utilizes cooling towers while FB Culley has a
once through cooling water system.
The Ohio River Valley Sanitation Commission (ORSANCO) regional water quality standards
were most recently revised in 2012 and are more restrictive than current EPA standards.
ORSANCO is a regional state compact focused on water quality issues for the Ohio River
and governs water discharges that enter the Ohio River. Under Vectren’s most recent
NPDES permits issued in late 2011, Vectren must meet more restrictive mercury limits at its
river outfall to comply with the ORSANCO mercury limit of 12 ppt monthly average. To meet
the limits, Vectren chose to install two chemical-precipitation water treatment systems at AB
Brown and one at FB Culley. The new water treatment systems are included in the pending
environmental compliance proceeding before the IURC (Cause No. 44446), and began
operation in third quarter 2014.
2014 Integrated Resource Plan
Page 59
November 2014
FUTURE ENVIRONMENTAL REGULATIONS
CARBON REGULATION
On June 2, 2014, the EPA issued the CAA Section 111(d) Greenhouse Gas (GHG) New
Source Performance Standards (NSPS) for existing sources, known as the Clean
Power Plan (CPP). The CPP sets state-specific carbon reduction goals based on a
state’s existing generation mix and provides guidelines for the development, submission
and implementation of state plans to achieve the state goals. The EPA asserts that the
state reduction goals will result in a 30% decrease in CO2 emissions from 2005 levels
by 2030. To insure each state is making adequate progress towards the 2030 goal, an
interim emission rate goal for 2020-2029 has also been established.
Indiana’s state specific emission rate goals are 1,607 lb CO2/MWh for the interim period
and 1,531 lb CO2/MWh for a final goal. This equates to a 20% reduction in CO2
emission rates from 2012 levels. The EPA determined the state specific goals through
a portfolio approach that includes improving power plant heat rates, dispatching lower
emitting fuel sources more frequently and increasing utilization of renewable energy
sources and energy efficiency programs. Specifically, each state’s goals were set by
taking 2012 emissions data and applying four “building blocks” of emission rate
improvements that the EPA has determined are achievable by that state.
The four building blocks used by the EPA to calculate state goals are as follows:
1) Coal fleet heat rate improvement of 6%.
2) Increased dispatch of existing baseload natural gas generation sources to 70%.
For Indiana this also includes announced new natural gas combined cycle plants.
3) Renewable energy portfolio of 5% in the interim and 7% in the final stage.
4) Energy efficiency reductions of 1.5% annually starting in 2020.
While individual state goals were based on the EPA’s application of the building blocks
to 2012 emission rates, states have flexibility through their state implementation plan to

2014 Integrated Resource Plan
Page 60
November 2014
implement the building blocks in part or not at all to reach the listed goal, or enter a
regional trading program. Since the state plan may include a variety of options, many of
which are outside the fence line and control of a power plant, the interim and final CO2
emission rates will not necessarily apply to individual generating plants or companies
within the state. It is yet to be determined how the CPP will directly affect Vectren’s
generating units.
The final rule is scheduled for June 2015, with individual state implementation plans due
by June 2016. States have the option to seek a one year extension, or up to two years
if part of a regional or multi-state plan. After the submittal of the state or regional plan,
the first annual reporting begins in 2022. This timeline represents the earliest emission
reductions will be required, as it is almost certain that this rule will be heavily litigated.
Vectren will continue to work with the state of Indiana to ensure that the State’s
compliance plan is the least cost to Indiana consumers.
WASTE DISPOSAL
Over the course of the last twenty years the EPA has conducted numerous studies and
issued two reports to Congress on the management of coal combustion by-products
(primarily fly ash, bottom ash, and scrubber by-product), concluding both times that
these materials generally do not exhibit hazardous waste characteristics and can be
managed properly under state solid waste regulations. In response to the Tennessee
Valley Authority’s (TVA's) catastrophic ash pond spill in December of 2008, the EPA
revisited its regulatory options for the management of coal combustion by-products. On
June 21, 2010, the EPA published three options for a proposed rule covering Coal
Combustion Residuals (CCRs). Two options would regulate combustion by-products as
solid waste under the Resource Conservation and Recovery Act (RCRA) Subtitle D,
with the only significant difference being whether existing ponds are retrofitted or closed
within five years, or whether utilities will be permitted to continue to use an existing pond
for its remaining useful life. The third option would regulate combustion by-products as
hazardous waste under RCRA Subtitle C. Under all three options, certain beneficial re-

2014 Integrated Resource Plan
Page 61
November 2014
uses of coal combustion residuals, such as cement and wallboard applications, will
continue to be allowed. The EPA has set December 19, 2014 as the deadline for
issuing the final rule.
Uncertainties remain until the rule is finalized. For example, under the Subtitle D
proposed rule, unlined ash ponds would have to be closed within five years and
groundwater monitoring installed within one year. The proposal, however, did not
define whether the term “close” means to cease receiving new material or to have the
site completely capped and grass covered within five years. The proposal also failed to
take into account site specific circumstances such as size of the pond and the
percentage filled when establishing the five year closure timeframe. A majority of the
final closure obligation and compliance costs will be focused on historic material that is
already in the ponds so a change in future generation will not negate the obligation to
comply with the CCR regulation when it is issued. However, as a result of Vectren’s
previous investments in dry fly ash handling and beneficial reuse activities, the volume
of new material added to the ponds since 2009 has been significantly decreased.
As a direct result of the TVA spill referenced above, the EPA undertook to inspect all
surface impoundments and dams holding combustion by-products. The EPA conducted
site assessments at Vectren's AB Brown and FB Culley facilities and found the facilities'
surface impoundments to be satisfactory and not posing a high hazard.
WATER
There are multiple regulatory rulemakings that could, when finalized, require more
stringent limits for power plant discharges.
The EPA is developing new Effluent Limit Guidelines and Standards (ELGS) for the Steam
Electric Power Generating Point Source Category. A draft was issued June 7, 2013, with a
final rule scheduled for September 2015. The draft rule requested comment on 8 different
options for treatment standards and compliance locations that ranged from no change of
2014 Integrated Resource Plan
Page 62
November 2014
current standards to a requirement for full zero liquid discharge. Of the eight options, the
EPA identified four “preferred” options. For the preferred options, the size of Vectren’s units
would drop the plants out of the requirement for specific treatment and discharge limits for
Flue Gas Desulfurization (FGD) waste water or bottom ash transport water in 2 of the 4
options. Instead, IDEM would apply Best Professional Judgment (BPJ) which takes into
consideration site specific factors. While Vectren acknowledges that the EPA’s final ELGs
could further alter discharge parameters and limits, it is not possible at this time to predict
the outcome of the final rule. Vectren believes its chosen treatment systems are the most
cost effective option for meeting its current permits while limiting potential stranded costs
when new regulations take effect.
The EPA released its final rule regulating cooling water structures under Section 316(b)
of the Clean Water Act (CWA) on August 15, 2014. Section 316(b) requires that intake
structures that withdraw > 2 MGD of water, including most electric generating units, use
the "Best Technology Available" to prevent and / or mitigate adverse environmental
impacts to shellfish, fish, and wildlife in a water body. The rule lists separate sampling
and study programs to minimize entrainment (pulling small organisms into the intake
structure) and impingement (trapping or pinning fish against the exterior of the intake
structure). In addition, three additional studies are required that look at technical
feasibility and treatment costs, cost benefits evaluation, and non-water quality
environmental impacts of the potential treatment option. These studies, combined with
the results of the in-river fish sampling will help determine potential treatment options.
Seven options were identified as pre-approved methods for complying with
impingement mortality standards. While cooling towers are listed as an option, they are
not mandated for existing facilities. Vectren does not believe cooling tower retrofits will
be required at FB Culley due to its size and location on the Ohio River. The EPA
acknowledges that for many facilities, the process of conducting the studies,
determining the best treatment option, constructing the selected option, and confirming
the adequacy of the treatment may take a minimum of 8 years from the time the rule

2014 Integrated Resource Plan
Page 63
November 2014
becomes effective. Vectren's FB Culley units currently use a "once through" cooling
water intake system and are affected by this proposed regulation. Vectren's AB Brown
units use a closed cooling water system. However, under the final rule Vectren would
still be required to submit documentation and study reports to confirm the existing
cooling water tower mitigates impingement and entrainment.

2014 Integrated Resource Plan
Page 64
November 2014
This page intentionally left blank for formatting purposes

2014 Integrated Resource Plan
Page 65
November 2014
CHAPTER 5
SALES & DEMAND FORECAST
2014 Integrated Resource Plan
Page 66
November 2014
INTRODUCTION
The electric energy and demand forecasts provide the basis for evaluation of supply-
side and demand-side options to meet the electric needs of Vectren’s customers.
These forecasts reflect local and regional economic impacts, the effects of past,
present, and proposed Demand Side Management / Demand Response (DSM/DR)
programs, mandated efficiency standards, and the effects of normal market forces on
electricity sales.
Overview of Vectren’s Customers
Vectren provides delivery services to approximately 142,000 electric residential, general
service (commercial), and large (primarily industrial) customers with electricity in
southwestern Indiana. A high proportion of Vectren’s sales are made to electric-
intensive general service and large customers. In 2013, about 29% of Vectren’s annual
retail electric energy sales were consumed by residential customers, 23% of sales were
consumed by General Service (GS), and 48% of sales were consumed by more than
100 large customers. Less than 1% served other load (street lights). Significant general
service and large load creates complexity in load forecasting. These customers have
the ability to significantly impact Vectren’s demand for electricity, as economic factors
affect their businesses’ success.
ELECTRIC LOAD FORECAST OVERVIEW
Vectren developed low, base, and high forecasts of annual energy sales and
requirements (e.g. sales plus related delivery losses) and peak loads (e.g. demand plus
losses) for the purposes of its IRP. These forecasts, and the activities undertaken to
develop them, are described in this section.
Development of the Vectren system-wide long-term electric load forecast involves the
aggregation of multiple models. Vectren uses statistically adjusted end use (SAE)
modeling and econometric modeling to forecast customer needs for the future. Vectren
has investigated the use of pure end-use modeling for forecasting purposes but

2014 Integrated Resource Plan
Page 67
November 2014
believes that a combination of statistically adjusted end-use and econometric modeling
best accommodates its forecasting needs. End-use modeling involves building and
maintaining a detailed end-use database to capture appliance and thermal shell
characteristics, as well as end-use consumption information. The basic structure of an
end-use model is households multiplied by appliance saturation and unit energy
consumption. Each component of the end-use model is modeled separately. For these
reasons, end-use modeling is very expensive to develop and maintain. It is meant
primarily for long-term modeling (5-20 years). Often, a separate short term forecast is
necessary, which is hard to integrate with the long-term forecast. Vectren utilizes
statistically adjusted end-use models to forecast residential and general service loads.
Large customer needs are forecasted with an econometric linear regression model,
while street lighting load is forecasted with a simple trend model. The detail of
Vectren’s forecasting methodology is discussed later in this chapter.
FORECAST RESULTS
The base case forecasts of annual energy requirements and peak loads for the 2014 -
2034 planning period are provided in Tables 5-1 and 5-2. Annual energy requirements
are projected to have a -.2% compound annual growth rate over the twenty year
planning period. Peak requirements are projected to have a compound annual growth
rate of -.1% over the twenty year planning period.
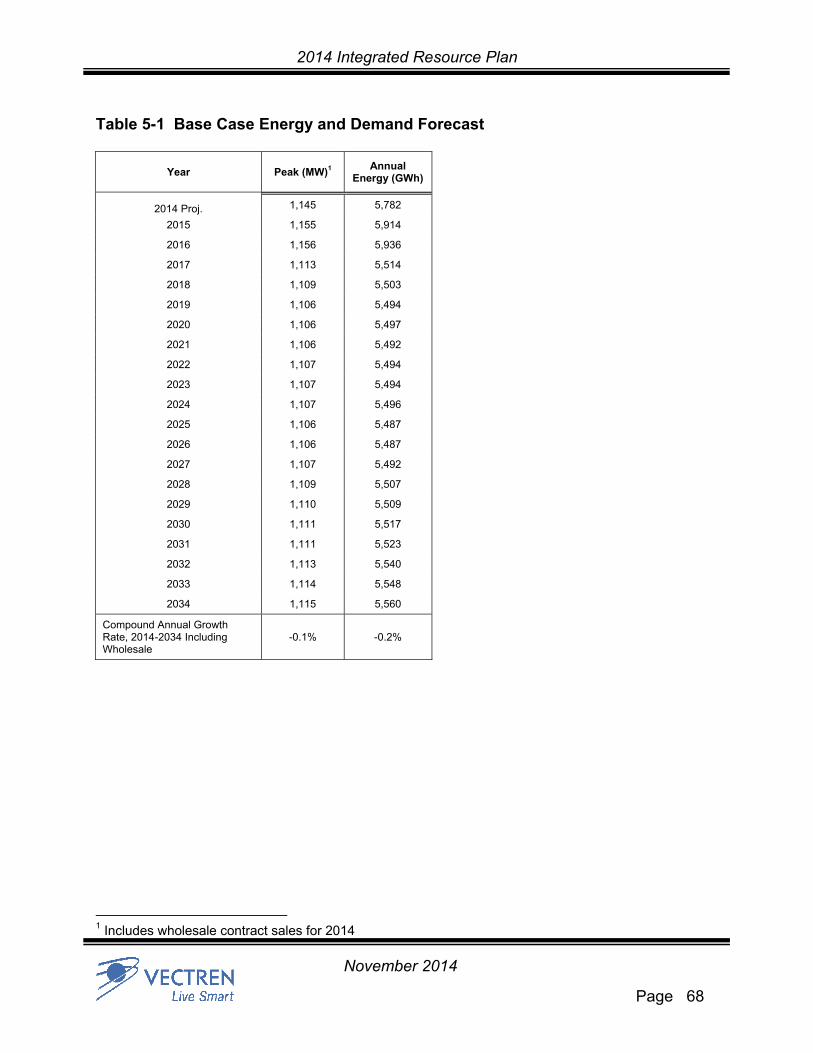
2014 Integrated Resource Plan
Page 68
November 2014
Table 5-1 Base Case Energy and Demand Forecast
Year Peak (MW)1 Annual
Energy (GWh)
2014 Proj. 1,145 5,782
2015 1,155 5,914
2016 1,156 5,936
2017 1,113 5,514
2018 1,109 5,503
2019 1,106 5,494
2020 1,106 5,497
2021 1,106 5,492
2022 1,107 5,494
2023 1,107 5,494
2024 1,107 5,496
2025 1,106 5,487
2026 1,106 5,487
2027 1,107 5,492
2028 1,109 5,507
2029 1,110 5,509
2030 1,111 5,517
2031 1,111 5,523
2032 1,113 5,540
2033 1,114 5,548
2034 1,115 5,560
Compound Annual Growth Rate, 2014-2034 Including Wholesale
-0.1% -0.2%
1 Includes wholesale contract sales for 2014

2014 Integrated Resource Plan
Page 69
November 2014
Table 5-2 Base Case Energy Forecast by Customer Class
Year Residential
(GWh)
General Service (GWh)
Large (GWh)
Other (GWh)
Net DSM (GWh)
DG (GWh)
Wholesale (GWh)
Losses (GWh)
Total Requirements
(GWh)
2013 Calendar
1,435 1,294 2,744
21 61 267 5,822
2014 Proj. 1,444 1,300 2,739 20 (47) (1) 61 265 5,782
2015 1,444 1,327 2,926 20 (72) (1) 0 271 5,914
2016 1,448 1,351 2,945 20 (98) (2) 0 272 5,936
2017 1,451 1,354 2,563 19 (123) (3) 0 253 5,514
2018 1,458 1,357 2,567 19 (148) (3) 0 252 5,503
2019 1,469 1,363 2,569 19 (173) (5) 0 252 5,494
2020 1,475 1,370 2,574 19 (186) (7) 0 252 5,497
2021 1,480 1,373 2,577 19 (199) (9) 0 252 5,492
2022 1,490 1,380 2,579 19 (211) (12) 0 252 5,494
2023 1,500 1,386 2,579 18 (224) (17) 0 252 5,494
2024 1,514 1,395 2,578 18 (237) (23) 0 252 5,496
2025 1,523 1,398 2,579 18 (250) (32) 0 251 5,487
2026 1,534 1,404 2,579 18 (263) (37) 0 251 5,487
2027 1,547 1,413 2,581 18 (276) (42) 0 252 5,492
2028 1,562 1,427 2,584 18 (289) (48) 0 252 5,507
2029 1,572 1,436 2,588 18 (302) (55) 0 252 5,509
2030 1,586 1,445 2,593 18 (316) (62) 0 253 5,517
2031 1,599 1,455 2,598 18 (329) (71) 0 253 5,523
2032 1,616 1,473 2,604 18 (343) (81) 0 254 5,540
2033 1,628 1,486 2,611 18 (356) (93) 0 254 5,548
2034 1,644 1,501 2,619 18 (370) (106) 0 255 5,560
Compound Annual Growth Rate for (2014-2034)
0.6% 0.7% -0.2% -0.7% -0.2%
Low and high energy and demand forecasts were developed by modifying the
assumptions around conservation, distributed generation adoption, economic drivers,
population projections, and large customer additions. The difference between the two
high growth cases is slow steady growth or a large step up. In the high growth
(modeled) forecast, economic growth was increased from approximately 1% to 2%, and
population growth was increased from about .3% to .5%. The high growth (large load)
case is the same as the base case, with the addition of a large customer in 2018. The
results are shown in Table 5-3 and 5-4.
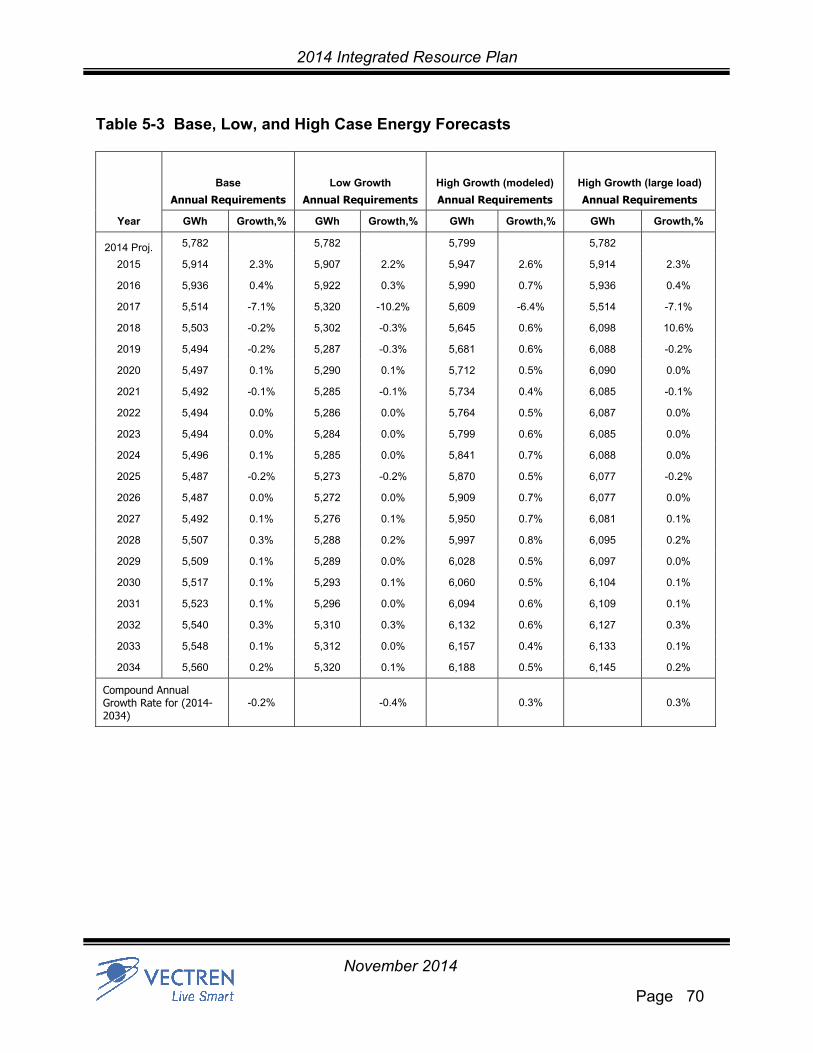
2014 Integrated Resource Plan
Page 70
November 2014
Table 5-3 Base, Low, and High Case Energy Forecasts
Base Low Growth High Growth (modeled) High Growth (large load)
Annual Requirements Annual Requirements Annual Requirements Annual Requirements
Year GWh Growth,% GWh Growth,% GWh Growth,% GWh Growth,%
2014 Proj. 5,782 5,782 5,799 5,782
2015 5,914 2.3% 5,907 2.2% 5,947 2.6% 5,914 2.3%
2016 5,936 0.4% 5,922 0.3% 5,990 0.7% 5,936 0.4%
2017 5,514 -7.1% 5,320 -10.2% 5,609 -6.4% 5,514 -7.1%
2018 5,503 -0.2% 5,302 -0.3% 5,645 0.6% 6,098 10.6%
2019 5,494 -0.2% 5,287 -0.3% 5,681 0.6% 6,088 -0.2%
2020 5,497 0.1% 5,290 0.1% 5,712 0.5% 6,090 0.0%
2021 5,492 -0.1% 5,285 -0.1% 5,734 0.4% 6,085 -0.1%
2022 5,494 0.0% 5,286 0.0% 5,764 0.5% 6,087 0.0%
2023 5,494 0.0% 5,284 0.0% 5,799 0.6% 6,085 0.0%
2024 5,496 0.1% 5,285 0.0% 5,841 0.7% 6,088 0.0%
2025 5,487 -0.2% 5,273 -0.2% 5,870 0.5% 6,077 -0.2%
2026 5,487 0.0% 5,272 0.0% 5,909 0.7% 6,077 0.0%
2027 5,492 0.1% 5,276 0.1% 5,950 0.7% 6,081 0.1%
2028 5,507 0.3% 5,288 0.2% 5,997 0.8% 6,095 0.2%
2029 5,509 0.1% 5,289 0.0% 6,028 0.5% 6,097 0.0%
2030 5,517 0.1% 5,293 0.1% 6,060 0.5% 6,104 0.1%
2031 5,523 0.1% 5,296 0.0% 6,094 0.6% 6,109 0.1%
2032 5,540 0.3% 5,310 0.3% 6,132 0.6% 6,127 0.3%
2033 5,548 0.1% 5,312 0.0% 6,157 0.4% 6,133 0.1%
2034 5,560 0.2% 5,320 0.1% 6,188 0.5% 6,145 0.2%
Compound Annual Growth Rate for (2014-2034)
-0.2%
-0.4%
0.3%
0.3%

2014 Integrated Resource Plan
Page 71
November 2014
Table 5-4 Base, Low, and High Case Demand Forecasts
Base Low Growth High Growth (modeled) High Growth (large load)
Annual Requirements Annual Requirements Annual Requirements Annual Requirements
Year MW Growth,% MW Growth,% MW Growth,% MW Growth,%
2014 Proj. 1,145 1,145 1,148 1,145
2015 1,155 0.8% 1,153 0.7% 1,160 1.0% 1,155 0.8%
2016 1,156 0.1% 1,153 -0.1% 1,164 0.3% 1,156 0.1%
2017 1,113 -3.7% 1,088 -5.6% 1,127 -3.2% 1,113 -3.7%
2018 1,109 -0.3% 1,083 -0.5% 1,130 0.3% 1,208 8.6%
2019 1,106 -0.3% 1,079 -0.4% 1,133 0.3% 1,205 -0.3%
2020 1,106 0.0% 1,079 0.0% 1,136 0.3% 1,206 0.0%
2021 1,106 0.0% 1,079 0.0% 1,139 0.3% 1,206 0.0%
2022 1,107 0.1% 1,080 0.0% 1,143 0.3% 1,206 0.0%
2023 1,107 0.0% 1,079 0.0% 1,147 0.4% 1,206 0.0%
2024 1,107 0.0% 1,079 0.0% 1,152 0.4% 1,206 0.0%
2025 1,106 -0.1% 1,077 -0.2% 1,155 0.3% 1,205 -0.1%
2026 1,106 0.0% 1,077 0.0% 1,160 0.4% 1,205 0.0%
2027 1,107 0.1% 1,078 0.1% 1,165 0.4% 1,206 0.1%
2028 1,109 0.2% 1,079 0.1% 1,171 0.5% 1,207 0.1%
2029 1,110 0.1% 1,079 0.0% 1,175 0.3% 1,208 0.0%
2030 1,111 0.1% 1,080 0.0% 1,179 0.3% 1,209 0.1%
2031 1,111 0.0% 1,080 0.0% 1,183 0.3% 1,209 0.0%
2032 1,113 0.2% 1,081 0.1% 1,187 0.4% 1,211 0.1%
2033 1,114 0.1% 1,081 0.0% 1,190 0.2% 1,211 0.1%
2034 1,115 0.1% 1,081 0.0% 1,193 0.3% 1,212 0.1%
Compound Annual Growth Rate for (2014-2034)
-0.1%
-0.3%
0.2%
0.3%

2014 Integrated Resource Plan
Page 72
November 2014
FORECAST INPUTS & METHODOLOGY
Forecast Inputs
Energy Data
Historical Vectren sales and revenues data were obtained through an internal database.
The internal database contains detailed customer information including rate, service,
North American Industrial Classification System (NAICS) codes (if applicable), usage,
and billing records for all customer classes (more than 15 different rate and customer
classes). These consumption records were exported out of the database and compiled
in a spreadsheet on a monthly basis. The data was then organized by rate code and
imported into the load forecasting software.
Economic and Demographic Data
Economic and demographic data was provided by Moody’s Economy.com for the
nation, the state of Indiana, and the Evansville Metropolitan Statistical Area (MSA).
Moody’s Economy.com, a division of Moody’s Analytics, is a trusted source for
economic data that is commonly utilized by utilities for forecasting electric sales. The
monthly data provided to Vectren contains both historical results and projected data
throughout the IRP forecast period. This information is input into the load forecasting
software and used to project residential, GS, and large sales.
Weather Data
The daily maximum and minimum temperatures for Evansville, IN were obtained from
DTN, a provider of National Oceanic and Atmospheric Administration (NOAA) data.
NOAA data is used to calculate monthly heating degree days (HDD) and cooling degree
days (CDD). HDDs are defined as the number of degrees below the base temperature
of 65 degrees Fahrenheit for a given day. CDDs are defined as the number of degrees
above the base temperature of 65 degrees Fahrenheit for a given day. HDDs and
CDDs are averaged on a monthly basis. Normal degree days, as obtained from NOAA,
2014 Integrated Resource Plan
Page 73
November 2014
are based on a thirty year period. Historical weather data1 is imported into the load
forecasting software and is used to normalize the past usage of residential and GS
customers. Similarly, the projected normal weather data is used to help forecast the
future weather normalized loads of these customers.
Equipment Efficiencies and Market Shares Data
Itron Inc. provides regional Energy Information Administration (EIA) historic and
projected data for equipment efficiencies and market shares. This information is used in
the residential average use model and GS sales model. Note that in 2013 an appliance
survey of Vectren’s residential customers was conducted to compare its territory market
share data with the regional EIA data. In order to increase the accuracy of the
residential average use model, regional equipment market shares were altered to reflect
those of Vectren’s actual territory.
Model Overview
Changes in economic conditions, prices, weather conditions, as well as appliance
saturation and efficiency trends drive energy deliveries and demand through a set of
monthly customer class sales forecast models. Monthly regression models are
estimated for each of the following primary revenue classes:
Residential (residential average usage and customer models)
General Service
Large
Street Lighting
In the long-term, both economics and structural changes drive energy and demand
growth. Structural changes are captured in the residential average use and general
service sales forecast models through Statistically Adjusted End-Use (SAE) model
specifications. The SAE model variables explicitly incorporate end-use saturation and
1 The large sales model also includes CDDs.
2014 Integrated Resource Plan
Page 74
November 2014
efficiency projections, as well as changes in population, economic conditions, price, and
weather. End-use efficiency projections include the expected impact of new end-use
standards and naturally occurring efficiency gains. The large sales forecast is derived
using an econometric model that relates large sales mostly to regional manufacturing
Gross Domestic Product (GDP) growth. Street light sales are forecasted using a simple
trend and seasonal model. The results of the sales forecast modes are imported into
the demand forecast model.
The long-term demand forecast is developed using a “build-up” approach. This
approach entails first estimating class and end-use energy requirements and then using
class and end-use sales projections to drive system peak demand. The forecast
models capture not only economic activity and population projections, but also expected
weather conditions, the impact of improving end-use efficiency and standards, and
electricity prices.
The long-term system peak forecast is derived through a monthly peak linear regression
model that relates monthly peak demand to heating, cooling, and base load
requirements. The model variables incorporate changes in heating, cooling, and base-
use energy requirements derived from the class sales forecast models as well as peak-
day weather conditions. Note that the forecast is adjusted to reflect future Vectren
sponsored DSM impacts, expected adoption of customer owned distributed generation,
and expected large customer additions. Figure 5-1 shows the general approach.
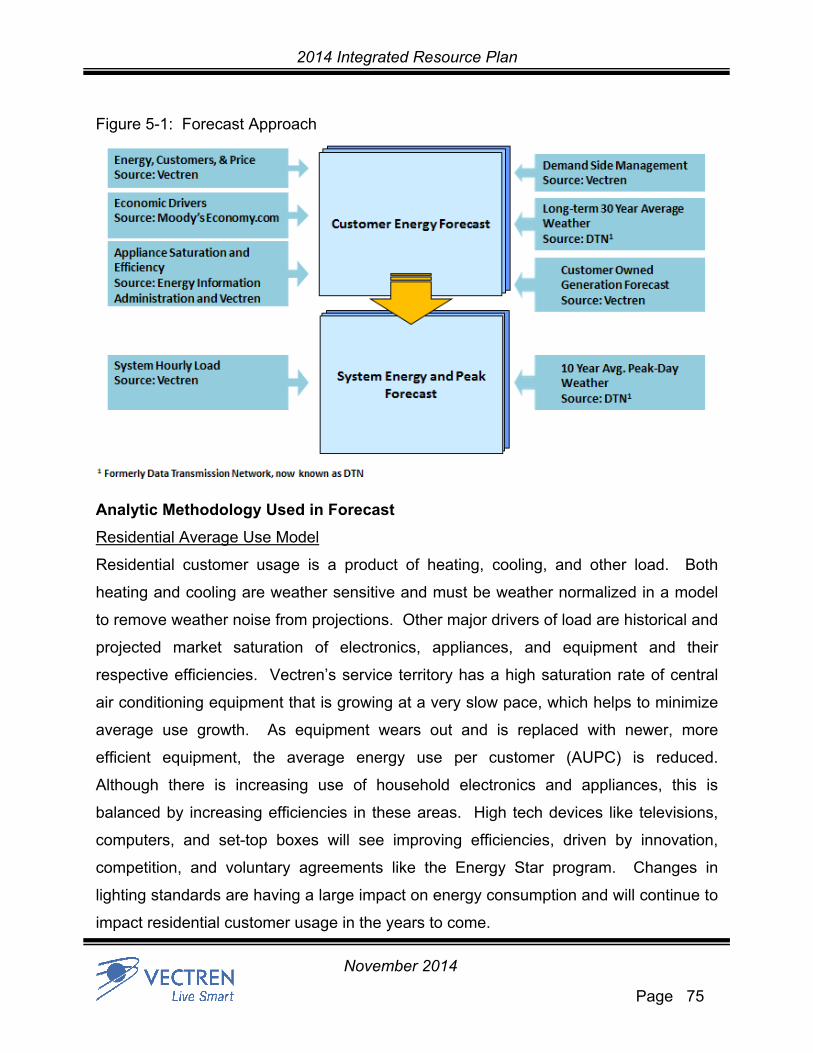
2014 Integrated Resource Plan
Page 75
November 2014
Figure 5-1: Forecast Approach
Analytic Methodology Used in Forecast
Residential Average Use Model
Residential customer usage is a product of heating, cooling, and other load. Both
heating and cooling are weather sensitive and must be weather normalized in a model
to remove weather noise from projections. Other major drivers of load are historical and
projected market saturation of electronics, appliances, and equipment and their
respective efficiencies. Vectren’s service territory has a high saturation rate of central
air conditioning equipment that is growing at a very slow pace, which helps to minimize
average use growth. As equipment wears out and is replaced with newer, more
efficient equipment, the average energy use per customer (AUPC) is reduced.
Although there is increasing use of household electronics and appliances, this is
balanced by increasing efficiencies in these areas. High tech devices like televisions,
computers, and set-top boxes will see improving efficiencies, driven by innovation,
competition, and voluntary agreements like the Energy Star program. Changes in
lighting standards are having a large impact on energy consumption and will continue to
impact residential customer usage in the years to come.

2014 Integrated Resource Plan
Page 76
November 2014
Even before Vectren sponsored DSM program savings, use per customer is largely flat,
increasing only by 0.2% annually through 2024. This is largely due to the continuing
phase-out of the most common types of incandescent light bulbs mandated by the
Energy Independence and Security Act (EISA) and new end-use efficiency standards
recently put in place by the Department of Energy (DOE). Average use begins to
increase at a slightly faster rate in the later years, as the Energy Information
Administration (EIA) baseline intensity projections only include those end-use standards
that are currently law. Note that DOE continues to propose new energy efficiency
standards.
The price of electricity and household income also influence average customer energy
use. In general, there is a positive correlation between household income and usage.
As household income rises, total usage rises. Conversely, there is a negative
correlation between price and usage. As price goes up, average use goes down.
Finally, the size of the home (number of inhabitants and square footage) and the
thermal integrity of the structure affect residential consumption.
The residential average use model is a statistically adjusted end-use (SAE) model that
addresses each of the previously discussed drivers of residential usage. SAE models
incorporate many of the benefits of econometric models and traditional end-use models,
while minimizing the disadvantages of each.
SAE models are ideal for identifying sales trends for short-term and long-term
forecasting. They capture a wide variety of relevant data, including economic trends,
equipment saturations and efficiencies, weather, and housing characteristics.
Additionally, SAE models are cost effective and are easy to maintain and update. In the
SAE model, use is defined by three primary end uses: heating (XHeat), cooling (XCool),
and other (XOther). XHeat, XCool, and XOther are explanatory variables in the model

2014 Integrated Resource Plan
Page 77
November 2014
that explain customer usage. By design, the SAE model calibrates results into actual
sales.
The end-use variables incorporate both a variable that captures short-term utilization
(Use) and a variable that captures changes in end-use efficiency and saturation trends
(Index). The heating variable is calculated as:
Where
The cooling variable is defined as:
Where
XOther captures non-weather sensitive end-uses:
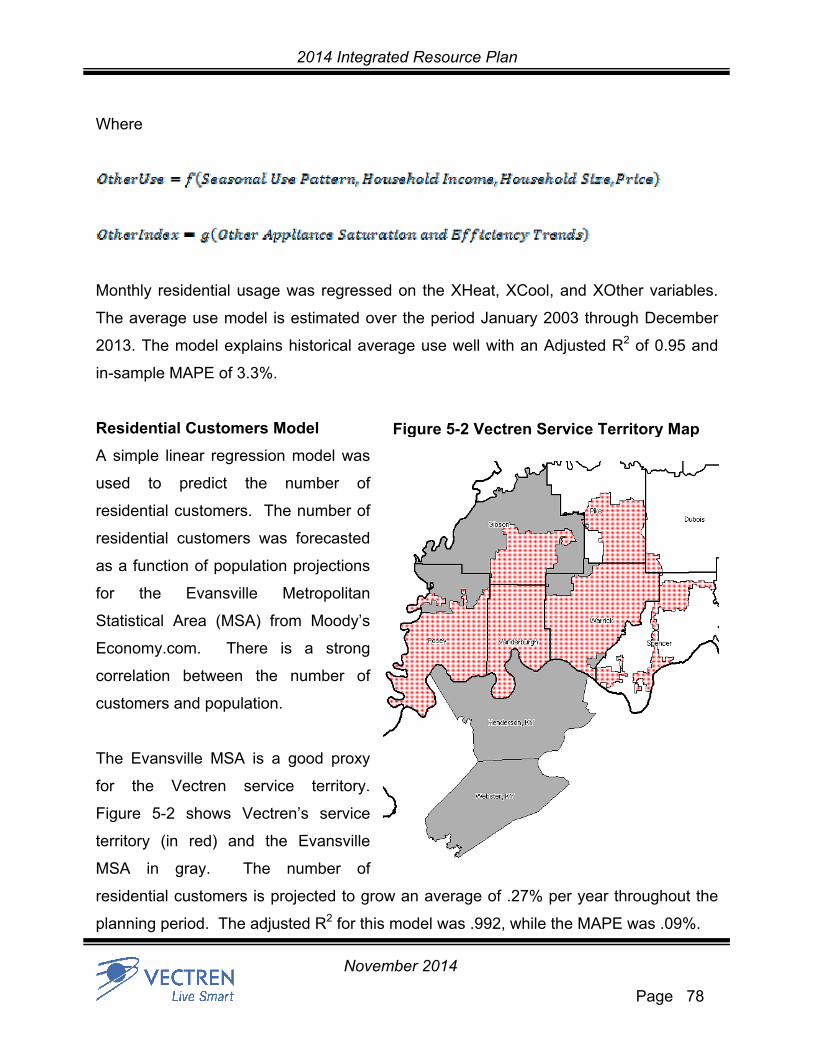
2014 Integrated Resource Plan
Page 78
November 2014
Where
Monthly residential usage was regressed on the XHeat, XCool, and XOther variables.
The average use model is estimated over the period January 2003 through December
2013. The model explains historical average use well with an Adjusted R2 of 0.95 and
in-sample MAPE of 3.3%.
Residential Customers Model
A simple linear regression model was
used to predict the number of
residential customers. The number of
residential customers was forecasted
as a function of population projections
for the Evansville Metropolitan
Statistical Area (MSA) from Moody’s
Economy.com. There is a strong
correlation between the number of
customers and population.
The Evansville MSA is a good proxy
for the Vectren service territory.
Figure 5-2 shows Vectren’s service
territory (in red) and the Evansville
MSA in gray. The number of
residential customers is projected to grow an average of .27% per year throughout the
planning period. The adjusted R2 for this model was .992, while the MAPE was .09%.
Figure 5-2 Vectren Service Territory Map

2014 Integrated Resource Plan
Page 79
November 2014
General Service (GS) Sales Model
Like the residential model, the general service (commercial) SAE sales model
expresses monthly sales as a function of XHeat, XCool, and XOther. The end-use
variables are constructed by interacting annual end-use intensity projections (EI) that
capture end-use efficiency improvements, with non-manufacturing output (GDP) and
employment (ComVarm), real price (Pricem), and monthly HDD and CDD:
The coefficients on price are imposed short-term price elasticities. A monthly forecast
sales model is then estimated as:
Commercial Economic Driver
Output and employment are combined through a weighted economic variable where
ComVar is defined as:
Employment and nonmanufacturing output are weighted equally. The weights were
determined by evaluating the in-sample and out-of-sample model statistics for different
sets of employment and output weights.
The resulting commercial sales model performs well with an Adjusted R2 of 0.95 and an
in-sample MAPE of 2.2%.

2014 Integrated Resource Plan
Page 80
November 2014
Commercial sales growth averages 1.9% per year through 2016, as economic growth
projections are relatively strong through this period. Real output is projected to increase
at 2.2% with employment increasing 1.9%. After 2016, both output and employment
growth slow with output averaging 0.5% growth and employment largely flat through
2024. Commercial sales, in turn, slow averaging 0.4% annually between 2016 and
2024.
Large Sales Model
The industrial sales forecast is based on a generalized monthly regression model where
industrial sales are specified as a function of manufacturing employment, output,
monthly CDD, and monthly binaries to capture seasonal load variation and shifts in the
data. The economic driver is a weighted combination of real manufacturing output and
manufacturing employment. The industrial economic (IndVar) variable is defined as:
The imposed weights are determined by evaluating in-sample and out-of-sample
statistics for alternative weighting schemes. The final model’s Adjusted R2 is 0.65 with
in-sample MAPE of 6.7%. The relatively low Adjusted R2 and relatively high MAPE are
due to the “noisy” nature of industrial monthly billing data.
There are many variables that impact large customer consumption that are not easily
forecasted. These unforeseeable impacts make forecasting GS and large customers’
usage with a high degree of certainty very difficult, as these customers’ usage is
extremely sensitive to economic conditions.
Lighting Sales Model
Street light sales are fitted with a simple seasonal exponential smoothing model with a
trend term. Street lighting sales have been declining and are expected to continue to
2014 Integrated Resource Plan
Page 81
November 2014
decline through the forecast period as increasing lamp efficiency outpaces installation of
new street lights. The model yielded an adjusted R2 of .769 and a MAPE of 5.34%.
Vectren’s total energy requirements include forecasted sales for the four sectors
described above, wholesale contracts, DSM savings, impact of customer owned
distributed generation (DG) and delivery losses. Losses were estimated to be
approximately 4.8 percent of requirements. DSM savings and a forecast of
customer owned DG are highlighted separately in the sales forecast, and the DSM
programs are discussed in detail in Chapter 8 DSM Resources.
Peak Demand Forecast
The Vectren energy forecast is derived directly from the sales forecast by applying a
monthly energy adjustment factor to the monthly calendarized sales forecast. The
energy adjustment factor includes line losses and any differences in timing between
monthly sales estimates and delivered energy (unaccounted for energy). Monthly
adjustment factors are calculated as the average monthly ratio of energy to sales.
The long-term system peak forecast is derived through a monthly peak linear regression
model that relates monthly peak demand to heating, cooling, and base load
requirements:
The model variables (HeatVarm, CoolVarm, and BaseVarm) incorporate changes in
heating, cooling, and base-use energy requirements derived from the class sales
forecast models, as well as peak-day weather conditions.
Heating and Cooling Model Variables
Heating and cooling requirements are driven by customer growth, economic activity,
changes in end-use saturation, and improving end-use efficiency. These factors are

2014 Integrated Resource Plan
Page 82
November 2014
captured in the class sales forecast models. The composition of the models allows
historical and forecasted heating and cooling load requirement to be estimated.
The estimated model coefficients for the heating (XHeat) and cooling variables (XCool)
combined with heating and cooling variable for normal weather conditions (NrmXHeat
and NrmXCool) gives an estimate of the monthly heating and cooling load
requirements. Heating requirements are calculated as:
B1 and C1 are the coefficients on XHeat in the residential and commercial models.
Cooling requirements are estimated in a similar manner. As there is a small amount of
cooling in the industrial sector, industrial cooling is included by multiplying the industrial
model coefficient for the CDD variable by normal monthly CDD. Cooling requirements
are calculated as:
B2 and C2 are the coefficients on XCool in the residential and commercial models and
D2 is the coefficient on CDD in the industrial sales model.
The impact of peak-day weather conditions is captured by interacting peak-day HDD
and CDD with monthly heating and cooling load requirements indexed to a base year
(2005). The peak model heating and cooling variables are calculated as:
2014 Integrated Resource Plan
Page 83
November 2014
Base Load Variable
The peak model base load variable (BaseVarm) derived from the sales forecast models
is an estimate of the non-weather sensitive load at the time of the monthly system peak
demand. The base load variable is defined as:
Base load requirements are derived for each revenue class by subtracting out heating
and cooling load requirements from total load requirements. Using the SAE modeling
framework, class annual base load requirements are then allocated to end-uses at the
time of monthly peak demand. For example, the residential water heating coincident
peak load estimate is derived as:
Where
ResWaterEI = Annual water heating intensity (water use per household)
ResBaseEI = Annual base-use intensity (non-weather sensitive use per household)
ResWaterFrac = Monthly fraction of usage on at peak (estimates are based on Itron’s
hourly end-use load profile database)
End-use load estimates are aggregated by end-use and then revenue class resulting in
the base load variable.
Model Results
The model explains monthly peak variation well with an adjusted R2 of 0.97 and an in-
sample MAPE of 2.5%.

2014 Integrated Resource Plan
Page 84
November 2014
CUSTOMER OWNED DISTRIBUTED GENERATION FORECAST
Vectren has been monitoring national and regional distributed generation trends since
the 2011 IRP. While a number of technologies continue to influence the electric utility
industry, the primary focus is on distributed solar. The present IRP considers the
potential for future customer-owned DG growth, specifically in the area of net metered
distributed solar photovoltaic (PV) adoption. For modeling purposes, distributed PV is
treated as a decrease in demand. A distributed solar forecast was developed using
Vectren and Indiana historical net metering information and 3rd party data and
assumptions. This forecast is presented below in Table 5-5.

2014 Integrated Resource Plan
Page 85
November 2014
Table 5-5 Distributed Solar Growth Forecast
Year Ending
Historic Peak
Planning Capacity
(MW)
Distributed Solar Adoption Forecasts: Contribution to Peak Planning Capacity1 (MW)
LOW CASE HIGH CASE BASE CASE
2006 0.002
2007 0.002
2008 0.003
2009 0.012
2010 0.029
2011 0.051
2012 0.106
2013 0.162
2014 0.2 0.2 0.2
2015 0.3 0.3 0.3
2016 0.4 0.4 0.4
2017 0.5 0.6 0.6
2018 0.7 0.9 0.8
2019 0.9 1.2 1.1
2020 1.3 1.7 1.5
2021 1.7 2.4 2.0
2022 2.3 3.3 2.8
2023 3.0 4.7 3.9
2024 4.1 6.6 5.3
2025 5.5 9.2 7.3
2026 6.2 10.6 8.4
2027 7.0 12.1 9.6
2028 7.8 14.0 10.9
2029 8.9 16.1 12.5
2030 10.0 18.5 14.2
2031 11.3 21.2 16.3
2032 12.7 24.4 18.6
2033 14.3 28.1 21.2
2034 16.2 32.3 24.2
1 Peak planning capacity is 38% of installed capacity.

2014 Integrated Resource Plan
Page 86
November 2014
Because the IRP is concerned with meeting the annual peak demand, the data
presented in Table 5-5 are expressed in terms of megawatts of peak planning capacity,
rather than total direct current (DC) gross capacity or total alternating current (AC)
inverter capacity. The summer peak typically occurs in late afternoon in mid-to-late
summer, whereas maximum solar output is generally at noon in late spring or early
summer. Because optimal solar output does not coincide with the summer peak, a
factor must be applied to estimate the useful solar capacity from a given PV system at
the summer peak. A wide range of peak planning capacity factors have been reported
for distributed solar resources.1 Although MISO has not formally adopted a peak
planning capacity factor, PJM, a regional transmission operator, has recommended a
factor of 38%.2 Because of this PJM reference, Vectren has chosen to use this value.
There may be further refinements on this going forward as the utility & solar industry
further evaluate methodologies for developing this factor, and Vectren may revise this
number in future IRPs.
The historical data column reflects the summer peaking capacity of Vectren’s reported
net metered customer accounts.3 The High, Low, and Base Case forecasts for the
2014 – 2034 planning horizon are derived from the following information & data sets:
Vectren historical growth in net metered inverter-rated capacity,
Indiana historical growth in net metered inverter-rated capacity, and
Navigant Consulting solar capacity future growth rate assumptions for Indiana.4
High Case (applied to the low energy and demand forecast) calculation
methodology is as follows:
Vectren year-end 2013 inverter-rated capacity (426 kW) grows each year in a
compounding manner using Navigant’s Indiana predicted growth rates as follows: 1 Sterling, John, and J. McLaren, M. Taylor, K. Cory. Treatment of Solar Resource Generation in Electric Utility Resource Planning. NREL/TP-6A20-60047. October, 2013. 2 PJM Manual 21: Rules and Procedures for Determination of Generating Capability, revision 11. PJM System Planning Department. March 5, 2014. 3 Vectren’s Customer-Generator Interconnection and Net Metering Report for year ended 12/13/2013. 4 Navigant Consulting, 5/2/2014.

2014 Integrated Resource Plan
Page 87
November 2014
o 2014 – 2025: 40% per year
o 2025 – 2034: 15% per year
Each year’s result is then multiplied by the factor 0.38 to arrive at the peak
planning contribution for distributed solar.
Low Case (applied to the high (modeled) energy and demand forecast) calculation
methodology is as follows:
Vectren year-end 2013 inverter-rated capacity (426 kW) grows each year in a
compounding manner using slower growth rates as follows:
o 2014 – 2025: 34.1% per year
o 2025 – 2034: 12.8% per year
o These growth rates are a modified version of the High Case’s Navigant
Indiana rates based on a derived factor.
This growth “adjustment” factor is derived by taking historical net
metered capacity growth in Vectren territory versus Indiana as a
whole.
Specifically, this adjustment factor takes the simple average growth
rate for Vectren for the years 2010 through 2012 and divides this
result by the simple average growth rate for Indiana over the same
period.
This adjustment factor is 0.852 (or 85.2%). Applying this factor to
Navigant’s Indiana growth rates yields the 34.1% and 12.8% values
given above.
Each year’s result is then multiplied by the factor 0.38 to arrive at the peak
planning contribution for distributed solar.
Base Case (applied the base case and high (large load) energy and demand
forecasts) calculation methodology is as follows:
Takes the simple average of the High and Low cases in each year.
2014 Integrated Resource Plan
Page 88
November 2014
Each year’s result is then multiplied by the factor 0.38 to arrive at the peak
planning contribution for distributed solar.
The overall approach for the High, Low, and Base cases is a reflection of the difference
in the overall net-metered distributed generation customer adoption rates between
Vectren and Indiana. It takes a very high level view of how solar adoption may evolve
over a relatively long planning horizon. Vectren believes that the long term nature of the
IRP process calls for a high level macro approach, and the Navigant assumptions, while
very general in nature, represent the results of expert analysis and therefore are an
appropriate basis for making this forecast. Navigant did suggest an “adjustment factor”
for the Vectren territory because the Vectren service territory is growing at a slower rate
than the state of Indiana, resulting in the use of this in the Low case (and indirect use in
the Base Case). The High Case utilizes the unadjusted, original Navigant growth rates
(where the Vectren growth rate matches the overall state growth rate).
While distributed solar PV, is the most prominent form of distributed generation
anticipated in terms of total numbers of customers, it is not the only DG technology to
be considered. Cogeneration, or Combined Heat and Power (CHP), is also a key
technology category in the context of the IRP. However, because of the case-by-case
nature of these potential resources, and the fact that some could be large enough to be
modeled as a generation and/or capacity resource, these are covered outside this
section on distributed generation.
Additional future technologies in the distributed generation space include:
Small wind turbines
Energy storage
Fuel cells
Micro turbines
Other Micro-CHP (e.g. small advanced engine technologies)

2014 Integrated Resource Plan
Page 89
November 2014
Micro grids (i.e. customer-sited distribution systems that may include generation
and storage technologies)
Each of these technologies will be an important area for the industry to consider in
coming years. At this time, none of these are significant enough (or certain enough) to
be forecasted as customer-sited DG resources in the present IRP. However, Vectren
will continue to monitor and consider how these technologies play into generation
planning going forward.
OVERVIEW OF LOAD RESEARCH ACTIVITIES
Vectren has interval meters installed on a sample of residential and GS customers.
Large customers who have a monthly minimum demand obligation of 300kVA are
required to have interval meters installed. Vectren collects and stores this information
for analysis as needed. Detailed load shapes are used to better understand customers’
usage, primarily for cost of service studies. For this IRP, class load shapes were
borrowed from Itron’s Indiana library to break down Vectren’s hourly load profile by
class. The load shapes were applied to historical peak demand. Graph 5-1 shows daily
class contribution to peak for 2013.

2014 Integrated Resource Plan
Page 90
November 2014
Graph 5-1 Daily Class Contribution to Peak for 2013 (MW)
The following graphs (5-2 through 5-4) show the actual system load by day for 2013, the
actual summer peak day for 2013 by hour, and the winter peak day for 2013 by hour.
Note that these graphs do not include wholesale contract sales. Also additional load
shapes are included in the Technical Appendix, section C.

2014 Integrated Resource Plan
Page 91
November 2014
Graph 5-2 Total System Load for 2013 (MW)
Graph 5-3 Summer Peak 2013 (MW)
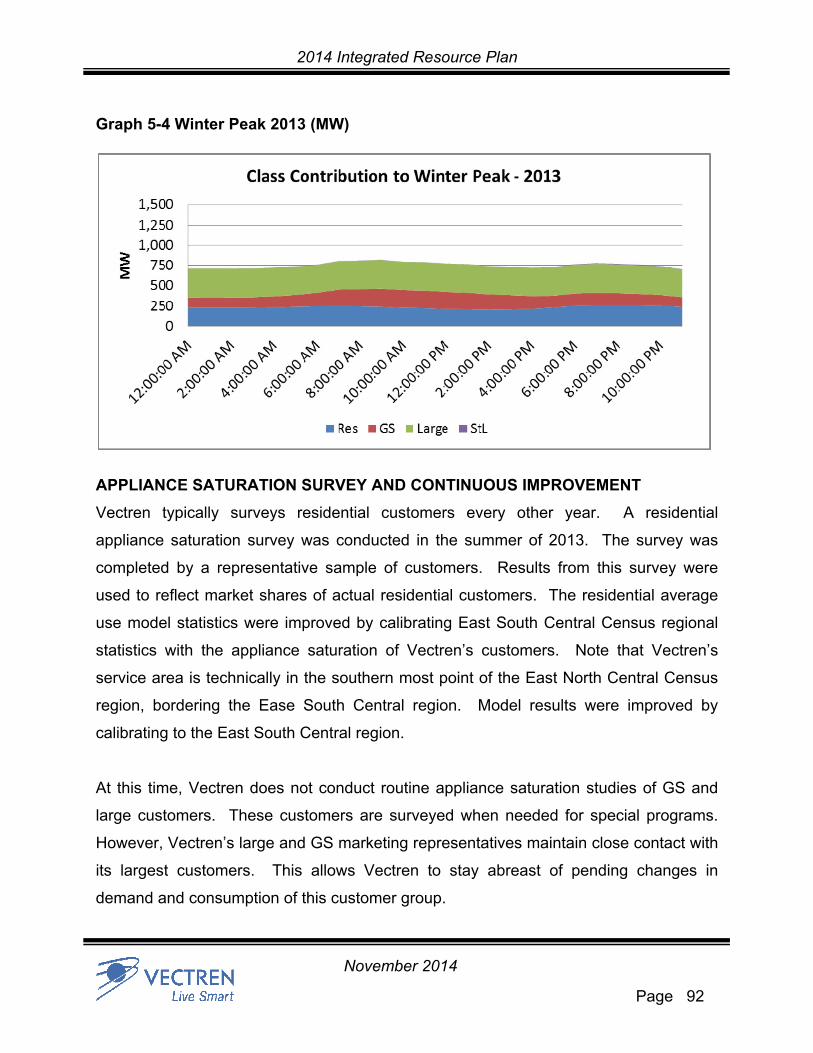
2014 Integrated Resource Plan
Page 92
November 2014
Graph 5-4 Winter Peak 2013 (MW)
APPLIANCE SATURATION SURVEY AND CONTINUOUS IMPROVEMENT
Vectren typically surveys residential customers every other year. A residential
appliance saturation survey was conducted in the summer of 2013. The survey was
completed by a representative sample of customers. Results from this survey were
used to reflect market shares of actual residential customers. The residential average
use model statistics were improved by calibrating East South Central Census regional
statistics with the appliance saturation of Vectren’s customers. Note that Vectren’s
service area is technically in the southern most point of the East North Central Census
region, bordering the Ease South Central region. Model results were improved by
calibrating to the East South Central region.
At this time, Vectren does not conduct routine appliance saturation studies of GS and
large customers. These customers are surveyed when needed for special programs.
However, Vectren’s large and GS marketing representatives maintain close contact with
its largest customers. This allows Vectren to stay abreast of pending changes in
demand and consumption of this customer group.
2014 Integrated Resource Plan
Page 93
November 2014
Vectren continually works to improve our load forecasting process in a variety of ways.
First, Vectren is a member of Itron’s Energy Forecasting Group. The Energy
Forecasting Group contains a vast network of forecasters from around the country that
share ideas and study results on various forecasting topics. Vectren forecasters attend
an annual meeting that includes relevant topic discussions along with keynote speakers
from the EIA and other energy forecasting professionals. The meeting is an excellent
source for end-use forecasting directions and initiatives, as well as a networking
opportunity. Vectren forecasters periodically attend continuing education workshops
and webinars on various forecasting topics to help improve skills and learn new
techniques. Additionally, Vectren discusses forecasts with the State Utility Forecasting
Group and other Indiana utilities to better understand their forecasts. We compare and
contrast our model assumptions and results to these groups to gain a better
understanding of how they interpret and use model inputs.
OVERVIEW OF PAST FORECASTS
The following tables outline the performance of Vectren’s energy and demand forecasts.
Forecasts from previous IRP filings from 2004 through 2013 were compared to actual
values in order to evaluate the reliability of Vectren’s past energy and demand
forecasts. The following tables show the actual and forecasted values for:
Total Peak Demand
Total Energy
Residential Energy
GS Energy
Large Energy
Tables 5-6 through 5-10 present comparisons of actual values versus forecasted values
from previous IRP filings. The percentage deviation of the actual values from the most
recent forecast is shown in the last column of each table. The deviations of the total
energy and total peak forecasts are better than for the individual classes, which is to be
expected. Note that all of the forecasted values are weather-normalized, but the actual
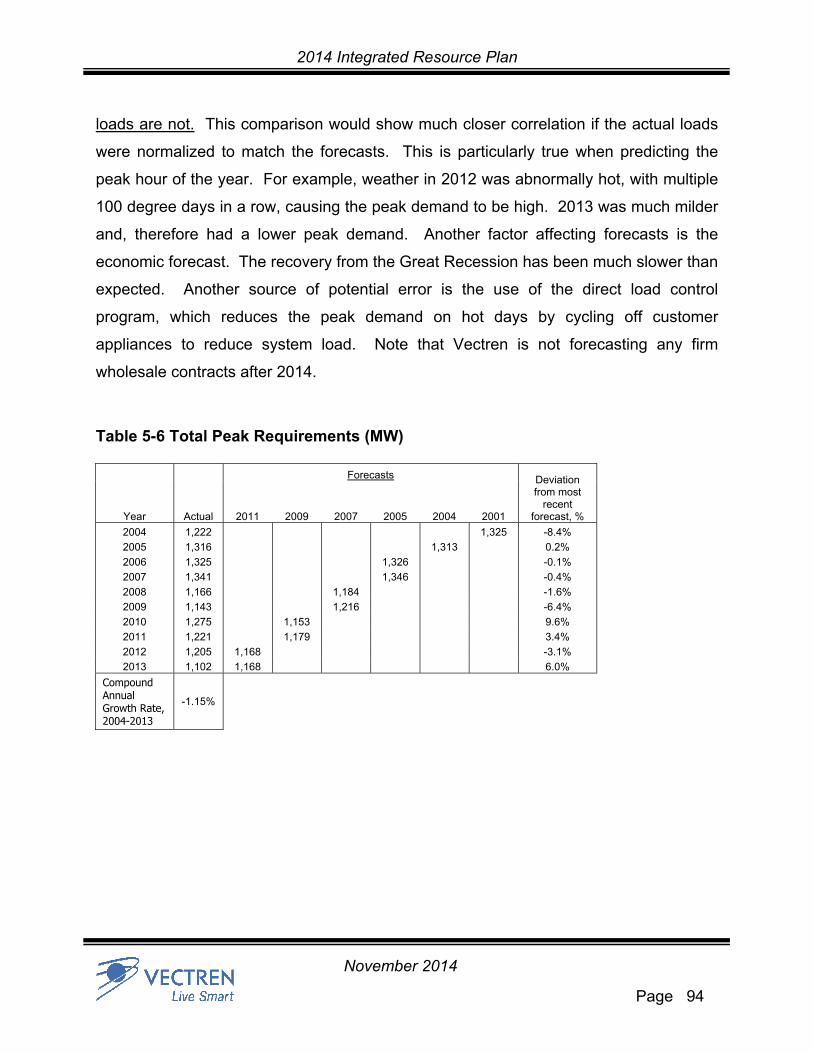
2014 Integrated Resource Plan
Page 94
November 2014
loads are not. This comparison would show much closer correlation if the actual loads
were normalized to match the forecasts. This is particularly true when predicting the
peak hour of the year. For example, weather in 2012 was abnormally hot, with multiple
100 degree days in a row, causing the peak demand to be high. 2013 was much milder
and, therefore had a lower peak demand. Another factor affecting forecasts is the
economic forecast. The recovery from the Great Recession has been much slower than
expected. Another source of potential error is the use of the direct load control
program, which reduces the peak demand on hot days by cycling off customer
appliances to reduce system load. Note that Vectren is not forecasting any firm
wholesale contracts after 2014.
Table 5-6 Total Peak Requirements (MW)
Forecasts Deviation from most
recent forecast, % Year Actual 2011 2009 2007 2005 2004 2001
2004 1,222 1,325 -8.4%
2005 1,316 1,313 0.2%
2006 1,325 1,326 -0.1%
2007 1,341 1,346 -0.4%
2008 1,166 1,184 -1.6%
2009 1,143 1,216 -6.4%
2010 1,275 1,153 9.6%
2011 1,221 1,179 3.4%
2012 1,205 1,168 -3.1%
2013 1,102 1,168 6.0%
Compound Annual Growth Rate, 2004-2013
-1.15%
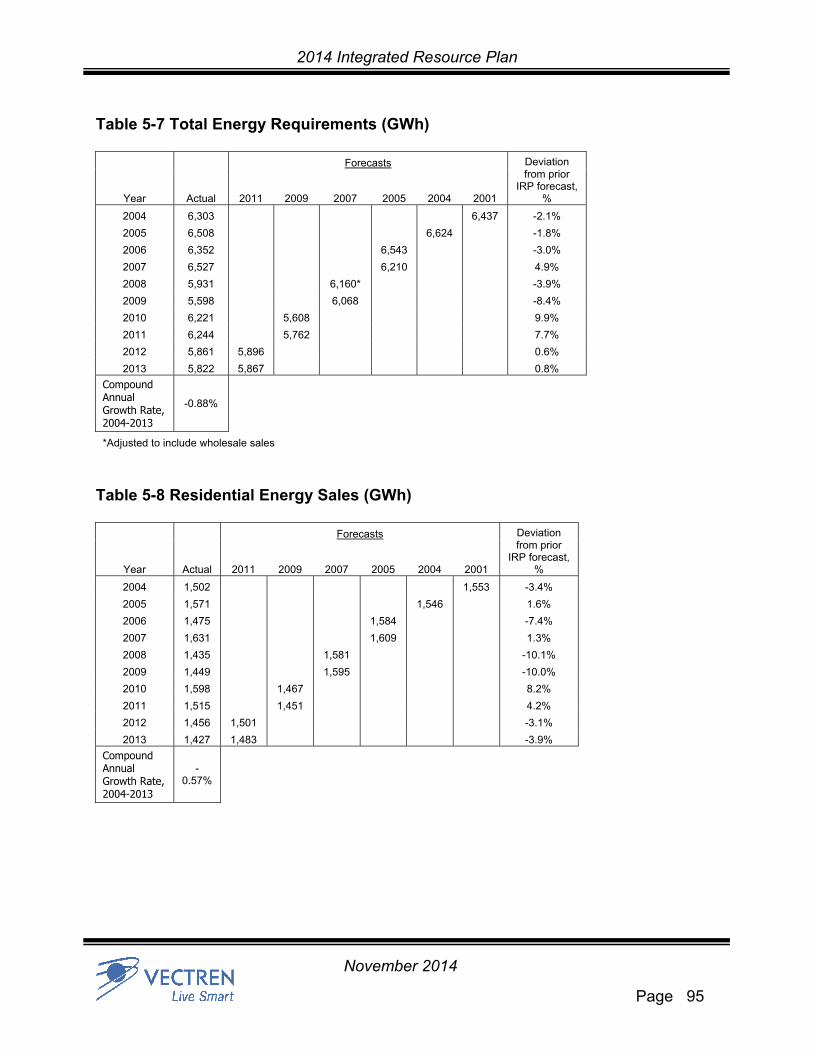
2014 Integrated Resource Plan
Page 95
November 2014
Table 5-7 Total Energy Requirements (GWh)
Forecasts Deviation from prior
IRP forecast, % Year Actual 2011 2009 2007 2005 2004 2001
2004 6,303 6,437 -2.1%
2005 6,508 6,624 -1.8%
2006 6,352 6,543 -3.0%
2007 6,527 6,210 4.9%
2008 5,931 6,160* -3.9%
2009 5,598 6,068 -8.4%
2010 6,221 5,608 9.9%
2011 6,244 5,762 7.7%
2012 5,861 5,896 0.6%
2013 5,822 5,867 0.8%
Compound Annual Growth Rate, 2004-2013
-0.88%
*Adjusted to include wholesale sales
Table 5-8 Residential Energy Sales (GWh)
Forecasts Deviation from prior
IRP forecast, % Year Actual 2011 2009 2007 2005 2004 2001
2004 1,502 1,553 -3.4%
2005 1,571 1,546 1.6%
2006 1,475 1,584 -7.4%
2007 1,631 1,609 1.3%
2008 1,435 1,581 -10.1%
2009 1,449 1,595 -10.0%
2010 1,598 1,467 8.2%
2011 1,515 1,451 4.2%
2012 1,456 1,501 -3.1%
2013 1,427 1,483 -3.9%
Compound Annual Growth Rate, 2004-2013
-0.57%

2014 Integrated Resource Plan
Page 96
November 2014
Table 5-9 General Service Energy Sales (GWh)
Forecasts (GS) Deviation from prior
IRP forecast, % Year Actual 2011 2009 2007 2005 2004 2001
2004 1,502 1,408 6.3%
2005 1,556 1,500 3.6%
2006 1,515 1,566 -3.4%
2007 1,412 1,594 -12.9%
2008 1,294 1,380 -6.6%
2009 1,299 1,384 -6.5%
2010 1,361 1,275 6.3%
2011 1,335 1,285 3.8%
2012 1,315 1,387 -5.5%
2013 1,303 1,409 -8.2%
Compound Annual Growth Rate, 2004-2013
-1.57%
Table 5-10 Large Energy Sales (GWh)
Forecasts (Large) Deviation from prior
IRP forecast, % Year Actual 2011 2009 2007 2005 2004 2001
2004 2,346 2,570 -9.5%
2005 2,389 2,619 -9.6%
2006 2,376 2,379 -0.1%
2007 2,538 2,422 4.6%
2008 2,744 2,591 5.6%
2009 2,251 2,598 -15.4%
2010 2,601 2,281 12.3%
2011 2,744 2,445 10.9%
2012 2,714 2,696 0.7%
2013 2,744 2,714 1.1%
Compound Annual Growth Rate, 2004-2013
1.76%

2014 Integrated Resource Plan
Page 97
November 2014
This page intentionally left blank for formatting purposes
2014 Integrated Resource Plan
Page 98
November 2014
CHAPTER 6
ELECTRIC SUPPLY ANALYSIS

2014 Integrated Resource Plan
Page 99
November 2014
INTRODUCTION
The purpose of the electric supply analysis is to determine the best available
technologies for meeting the potential future supply-side resource needs of Vectren. A
very broad range of supply alternatives were identified in a Technology Assessment
described below. These supply alternatives were screened, and a smaller subset of
alternatives were chosen for the final planning and integration analysis. Demand side
alternatives play a major role in the integrated plan and are discussed in Chapter 8
DSM Resources. The supply-side alternatives which are discussed here fall into two
basic categories:
construction of new generating facilities and
energy and capacity purchases.
Note that additional DSM energy efficiency programs beyond what was included in the
base case energy and demand forecasts were modeled competed with supply-side
options to meet future load requirements. This is discussed further in Chapter 8 DSM
Resources.
TECHNOLOGY ASSESSMENT
For the 2014 Electric IRP process, Vectren retained the services of Burns & McDonnell,
one of the leading engineering design experts in the United States, to assist in
performing a Technology Assessment for generation technologies. The Technology
Assessment can be found in the Technical Appendix, section B. Below are descriptions
of the technologies that were considered from the Technology Assessment.
Natural Gas Technologies
The simple cycle gas turbines (SCGT) utilize natural gas to produce power in a gas
turbine generator. The gas turbine cycle is one of the most efficient cycles for the
conversion of gaseous fuels to mechanical power or electricity. Typically, SCGTs are
used for peaking power due to their fast load ramp rates and relatively low capital costs.

2014 Integrated Resource Plan
Page 100
November 2014
However, the units have high heat rates compared to other technologies. The different
classes of SCGTs are shown below in Table 6-1. Please note that for new natural gas
fired units, the capital costs shown in the table above are higher than the overnight
costs shown in the Technology Assessment document. A 30% contingency for gas
infrastructure siting costs and owner’s costs was added for final modeling purposes.
Table 6-1 SGCT Classes
Simple Cycle Gas Turbine
LM6000 LMS100 E‐Class F‐Class
Base Load Net Output (MW) 49.1 106.4 87.5 212.8
Base Load Net Heat Rate (HHV Btu/kWh) 9,570 8,860 11,480 9,940
Base Project Costs (2014$/kW) $2,047 $1,440 $1,704 $1,228
Fixed O & M Costs (2014$/kW‐yr.) $23.98 $11.18 $16.56 $7.42
The combined cycle gas turbines (CCGT) utilize natural gas to produce power in a gas
turbine which can be converted to electric power by a coupled generator, and to also
use the hot exhaust gases from the gas turbine to produce steam in a heat recovery
steam generator (HRSG). This steam is then used to drive a steam turbine and
generator to produce electric power. The use of both gas and steam turbine cycles in a
single plant to produce electricity results in high conversion efficiencies and low
emissions. For this assessment, a 1x1, 2x1, and 3x1 power block, as shown in Table 6-
2, was evaluated with General Electric (GE) 7F-5 turbines as representative CCGT
technology. A 1x1 means one gas or steam turbine is coupled with one HRSG. A 2x1
means two gas or steam turbines are coupled with one HRSG. A 3x1 follows the same
pattern, meaning that there are three gas or steam turbines coupled with one HRSG.

2014 Integrated Resource Plan
Page 101
November 2014
Table 6-2 CCGT Classes
Combined Cycle Gas Turbine
1x1 F‐Class Unfired
2x1 F‐Class Unfired
3x1 F‐Class Unfired
Base Load Net Output (MW) 405.5 815.5 1227.1
Base Load Net Heat Rate (HHV Btu/kWh) 6,610 6,530 6,500
Base Project Costs (2014$/kW) $1,400 $1,083 $925
Fixed O & M Costs (2014$/kW‐yr) $13.51 $7.62 $5.79
The reciprocating engine is the last of the natural gas alternative technologies
evaluated. The reciprocating, or piston, engine operates on the conversion of pressure
into rotational energy that will fire on natural gas. Fuel and air are injected into a
combustion chamber prior to its compression by the piston assembly of the engine. A
spark ignites the compressed fuel and air mixture causing a rapid pressure increase
that drives the piston downward. The piston is connected to an offset crankshaft,
thereby converting the linear motion of the piston into rotational motion that is used to
turn a generator for power production. The reciprocating engine is shown in Table 6-3.
Table 6-3 Reciprocating Engine
Reciprocating Engine
Base Load Net Output (MW) 100.2
Base Load Net Heat Rate (HHV Btu/kWh) 8,470
Base Project Costs (2014$/kW) $1,677
Fixed O & M Costs (2014$/kW‐yr) $11.79
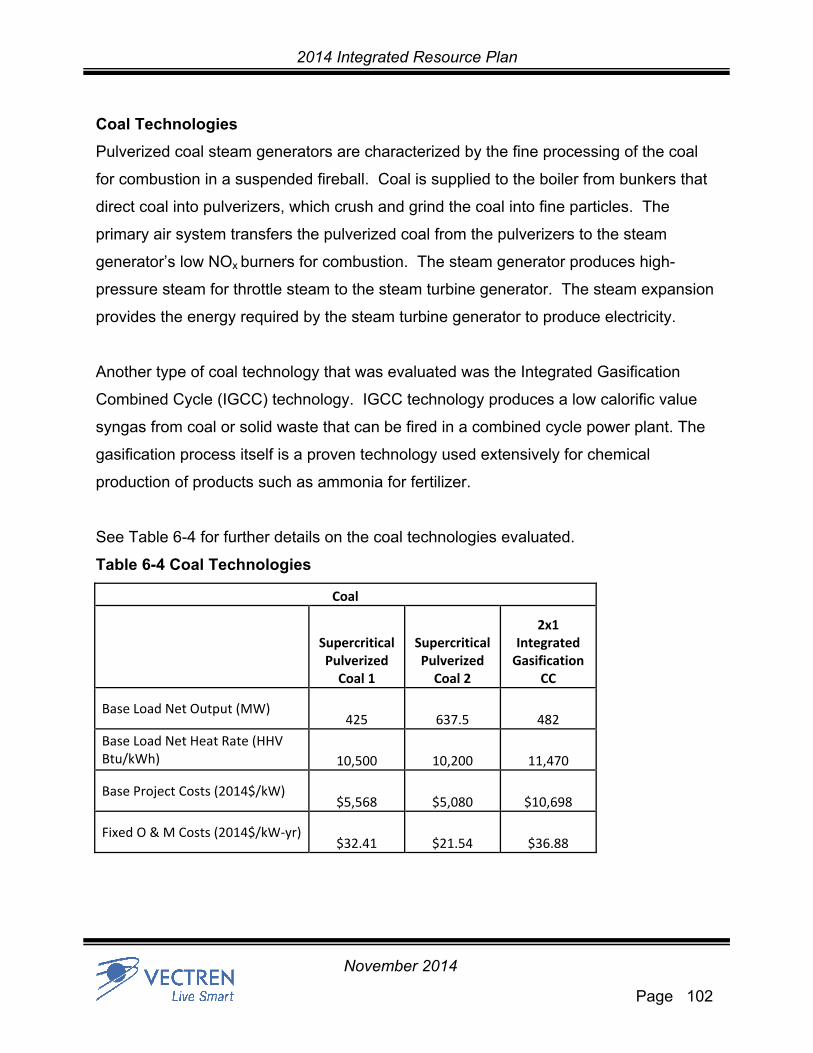
2014 Integrated Resource Plan
Page 102
November 2014
Coal Technologies
Pulverized coal steam generators are characterized by the fine processing of the coal
for combustion in a suspended fireball. Coal is supplied to the boiler from bunkers that
direct coal into pulverizers, which crush and grind the coal into fine particles. The
primary air system transfers the pulverized coal from the pulverizers to the steam
generator’s low NOx burners for combustion. The steam generator produces high-
pressure steam for throttle steam to the steam turbine generator. The steam expansion
provides the energy required by the steam turbine generator to produce electricity.
Another type of coal technology that was evaluated was the Integrated Gasification
Combined Cycle (IGCC) technology. IGCC technology produces a low calorific value
syngas from coal or solid waste that can be fired in a combined cycle power plant. The
gasification process itself is a proven technology used extensively for chemical
production of products such as ammonia for fertilizer.
See Table 6-4 for further details on the coal technologies evaluated.
Table 6-4 Coal Technologies
Coal
Supercritical Pulverized Coal 1
Supercritical Pulverized Coal 2
2x1 Integrated Gasification
CC
Base Load Net Output (MW) 425 637.5 482
Base Load Net Heat Rate (HHV Btu/kWh) 10,500 10,200 11,470
Base Project Costs (2014$/kW) $5,568 $5,080 $10,698
Fixed O & M Costs (2014$/kW‐yr) $32.41 $21.54 $36.88

2014 Integrated Resource Plan
Page 103
November 2014
Waste to Energy Technologies
Stoker boiler technology is the most commonly used waste to energy (WTE) or biomass
technology. Waste fuel is combusted directly in the same way fossil fuels are
consumed in other combustion technologies. The heat resulting from the burning of
waste fuel converts water to steam, which then drives a steam turbine generator for the
production of electricity. The two fuel types evaluated in the IRP was wood and landfill
gas which are represented in Table 6-5.
Table 6-5 Waste to Energy Technologies
Biomass
Wood Stoker
Fired Landfill Gas IC Engine
Base Load Net Output (MW) 50 5
Base Load Net Heat Rate (HHV Btu/kWh) 13,500 10,500
Base Project Costs (2014$/kW) $4,542 $3,261
Fixed O & M Costs (2014$/kW‐yr) $94.49 $182.88
Renewable Technologies
Four renewable technologies were evaluated in the IRP. Those technologies were wind
energy, solar photovoltaic, solar thermal, and hydroelectric. Most of the data evaluated
was taken from the Technology Assessment, but some data used was from updated
studies or real-life examples which will be further discussed below.
Wind turbines convert the kinetic energy of wind into mechanical energy, and are
typically used to pump water or generate electrical energy that is supplied to the grid.
Subsystems for either configuration typically include a blade or rotor to convert the
energy in the wind to rotational shaft energy, a drive train, usually including a gearbox
and a generator, a tower that supports the rotor and drive train, and other equipment,
2014 Integrated Resource Plan
Page 104
November 2014
including controls, electrical cables, ground support equipment and interconnection
equipment. All the data evaluated for wind energy came from the Technology
Assessment.
The conversion of solar radiation to useful energy in the form of electricity is a mature
concept with extensive commercial experience that is continually developing into
diverse mix of technological designs. Solar conversion technology is generally grouped
into Solar Photovoltaic (PV) technology, which directly converts sunlight to electricity
due to the electrical properties of the materials comprising the cell, and Solar Thermal
technology, which converts the radiant heat of the solar energy to electricity through an
intermediary fluid.
Photovoltaic (PV) cells consist of a base material (most commonly silicon), which is
manufactured into thin slices and then layered with positively and negatively charged
materials. At the junction of these oppositely charged materials, a "depletion" layer
forms. When sunlight strikes the cell, the separation of charged particles generates an
electric field that forces current to flow from the negative material to the positive
material. This flow of current is captured via wiring connected to an electrode array on
one side of the cell and an aluminum back-plate on the other.
Solar Thermal technology transfers solar energy to an intermediary liquid (typically
mineral oil or molten sodium and potassium nitrate salts) in the form of heat, which is
then used to boil water and produce steam. That steam is sent to a Steam Turbine
Generator (STG) for the production of electricity. The life expectancy of a solar thermal
power plant is similar to that of any fossil fueled thermal plant as long as preventative
and routing maintenance programs are undertaken.
Vectren recognized that utility scale solar costs are expected to decline over the next
few years and decided to have Burns & McDonnell revisit the solar portion of this
Technology Assessment, which had a static cost for solar. Burns & McDonnell’s
2014 Integrated Resource Plan
Page 105
November 2014
Phoenix office, which has extensive knowledge of the solar industry, developed an
asymptotic curve, beginning at $1,880 per KWac in 2014, and declining to $1,500 per
KWac in 2020 and staying flat in real terms for the remainder of the planning horizon.
The declining cost curve was used for Vectren’s IRP modeling. The costs are
represented in Table 6-6.
Low-head hydroelectric power generation facilities are designed to produce electricity
by utilizing water resources with low pressure differences, typically less than 5 feet head
but up to 130 feet. Specially designed low-head hydro turbines are often current driven,
and therefore operate at low speeds of 100 to 500 rpm in various configurations and
orientations. Since they do not require a large head loss, low-head hydroelectric
facilities can be incorporated in a variety of different applications, including rivers,
canals, aqueducts, pipelines, and irrigation ditches. This allows the technology to be
implemented much more easily than conventional hydropower, with a much smaller
impact to wildlife and environmental surroundings. However, power supply is
dependent on water supply flow and quality, which are sensitive to adverse
environmental conditions such as dense vegetation or algae growth, sediment levels,
and drought. Additionally, low-head hydropower is relatively new and undeveloped,
resulting in a high capital cost for the relatively small generation output.
Vectren utilized a previously performed study that included dams in and around
Vectren’s electric service territory to help provide guidance for this IRP. The study was
titled Hydropower Resource Assessment at Non-Powered USACE Sites and was
prepared by the Hydropower Analysis Center for U. S. Army Corps of Engineers. The
study was finalized in July 2013.1 Since there were no costs in the study, Vectren used
a real-life example from a hydroelectric construction project in the area to gather the
project costs. This data is represented in table 6-6.
1 Vectren referenced page 28 of this analysis.
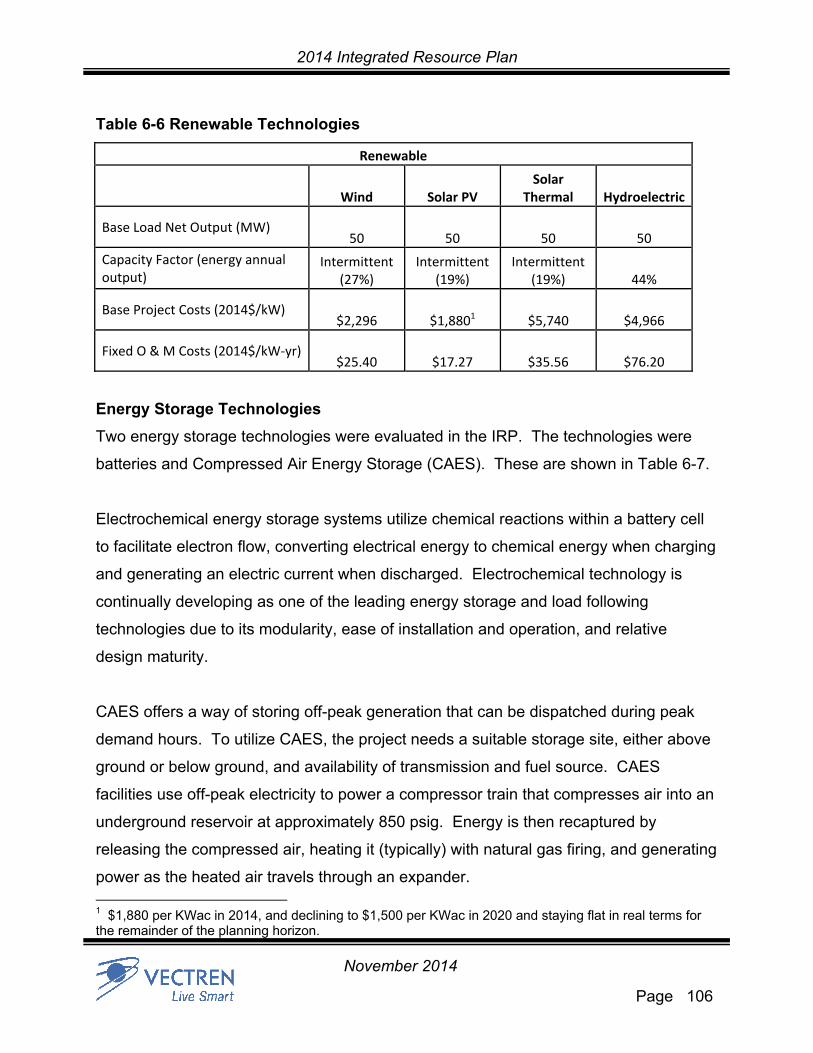
2014 Integrated Resource Plan
Page 106
November 2014
Table 6-6 Renewable Technologies
Renewable
Wind Solar PV Solar
Thermal Hydroelectric
Base Load Net Output (MW) 50 50 50 50
Capacity Factor (energy annual output)
Intermittent (27%)
Intermittent (19%)
Intermittent (19%) 44%
Base Project Costs (2014$/kW) $2,296 $1,8801 $5,740 $4,966
Fixed O & M Costs (2014$/kW‐yr) $25.40 $17.27 $35.56 $76.20
Energy Storage Technologies
Two energy storage technologies were evaluated in the IRP. The technologies were
batteries and Compressed Air Energy Storage (CAES). These are shown in Table 6-7.
Electrochemical energy storage systems utilize chemical reactions within a battery cell
to facilitate electron flow, converting electrical energy to chemical energy when charging
and generating an electric current when discharged. Electrochemical technology is
continually developing as one of the leading energy storage and load following
technologies due to its modularity, ease of installation and operation, and relative
design maturity.
CAES offers a way of storing off-peak generation that can be dispatched during peak
demand hours. To utilize CAES, the project needs a suitable storage site, either above
ground or below ground, and availability of transmission and fuel source. CAES
facilities use off-peak electricity to power a compressor train that compresses air into an
underground reservoir at approximately 850 psig. Energy is then recaptured by
releasing the compressed air, heating it (typically) with natural gas firing, and generating
power as the heated air travels through an expander. 1 $1,880 per KWac in 2014, and declining to $1,500 per KWac in 2020 and staying flat in real terms for the remainder of the planning horizon.
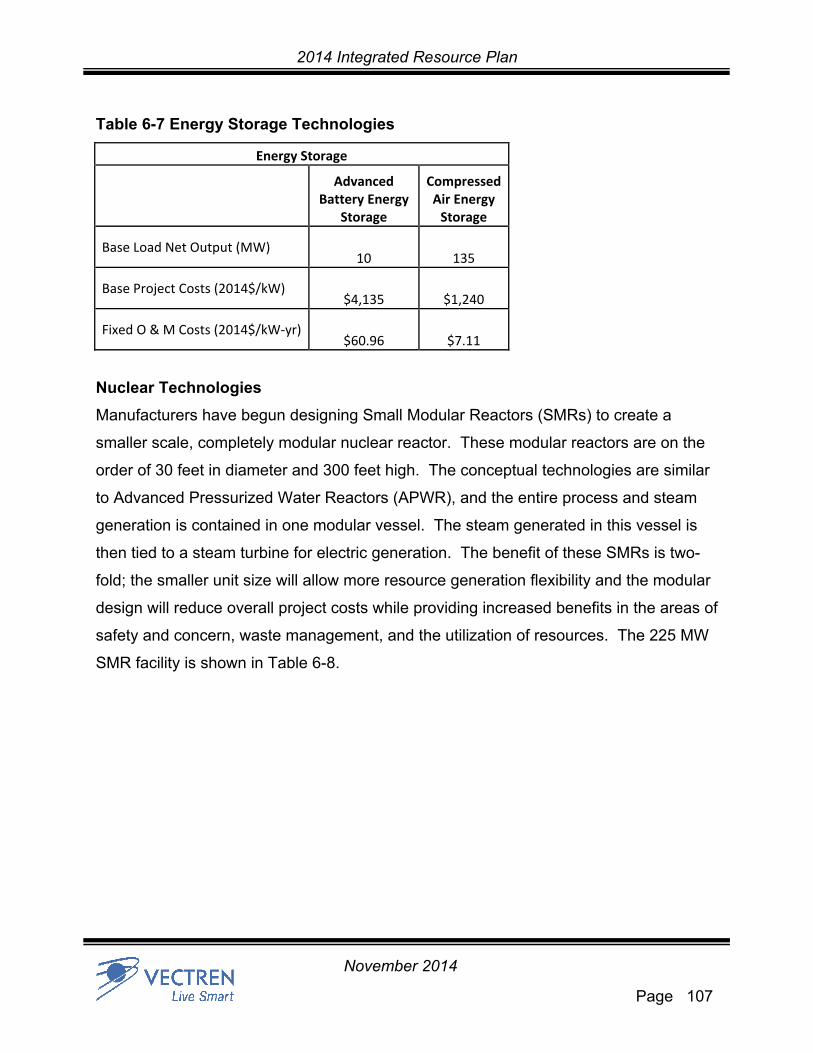
2014 Integrated Resource Plan
Page 107
November 2014
Table 6-7 Energy Storage Technologies
Energy Storage
Advanced Battery Energy
Storage
Compressed Air Energy Storage
Base Load Net Output (MW) 10 135
Base Project Costs (2014$/kW) $4,135 $1,240
Fixed O & M Costs (2014$/kW‐yr) $60.96 $7.11
Nuclear Technologies
Manufacturers have begun designing Small Modular Reactors (SMRs) to create a
smaller scale, completely modular nuclear reactor. These modular reactors are on the
order of 30 feet in diameter and 300 feet high. The conceptual technologies are similar
to Advanced Pressurized Water Reactors (APWR), and the entire process and steam
generation is contained in one modular vessel. The steam generated in this vessel is
then tied to a steam turbine for electric generation. The benefit of these SMRs is two-
fold; the smaller unit size will allow more resource generation flexibility and the modular
design will reduce overall project costs while providing increased benefits in the areas of
safety and concern, waste management, and the utilization of resources. The 225 MW
SMR facility is shown in Table 6-8.
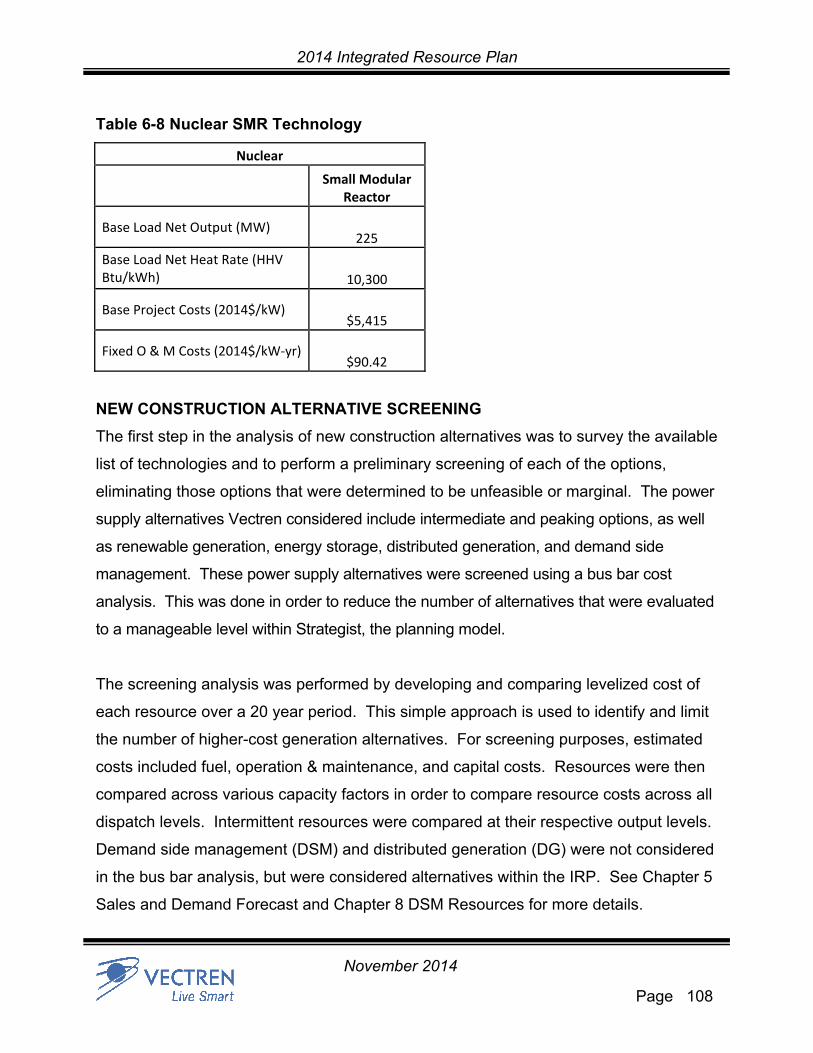
2014 Integrated Resource Plan
Page 108
November 2014
Table 6-8 Nuclear SMR Technology
Nuclear
Small Modular
Reactor
Base Load Net Output (MW) 225
Base Load Net Heat Rate (HHV Btu/kWh) 10,300
Base Project Costs (2014$/kW) $5,415
Fixed O & M Costs (2014$/kW‐yr) $90.42
NEW CONSTRUCTION ALTERNATIVE SCREENING
The first step in the analysis of new construction alternatives was to survey the available
list of technologies and to perform a preliminary screening of each of the options,
eliminating those options that were determined to be unfeasible or marginal. The power
supply alternatives Vectren considered include intermediate and peaking options, as well
as renewable generation, energy storage, distributed generation, and demand side
management. These power supply alternatives were screened using a bus bar cost
analysis. This was done in order to reduce the number of alternatives that were evaluated
to a manageable level within Strategist, the planning model.
The screening analysis was performed by developing and comparing levelized cost of
each resource over a 20 year period. This simple approach is used to identify and limit
the number of higher-cost generation alternatives. For screening purposes, estimated
costs included fuel, operation & maintenance, and capital costs. Resources were then
compared across various capacity factors in order to compare resource costs across all
dispatch levels. Intermittent resources were compared at their respective output levels.
Demand side management (DSM) and distributed generation (DG) were not considered
in the bus bar analysis, but were considered alternatives within the IRP. See Chapter 5
Sales and Demand Forecast and Chapter 8 DSM Resources for more details.

2014 Integrated Resource Plan
Page 109
November 2014
The set of new construction alternatives that was selected for further assessment as a
result of the screening process are presented in Table 6-9. The capital cost and O&M
characteristics of these selected alternatives were assessed and developed in detail.
Table 6-9 New Construction Alternatives
Resource1
Net Operating Capacity
(MW)
Fuel Type
Accepted or Rejected as Resource
Alternative
Reason to Accept or Reject
7FA CCGT 1x1 405.5 Natural Gas Accept Cost Effective Option
7FA CCGT 2x1 815.5 Natural Gas Reject
Exceeds capacity needs. If pursuit of a Combined Cycle was needed, would
consider coordinating with another utility in order to reduce costs.
7FA CCGT 3x1 1227.1 Natural Gas Reject
Exceeds capacity needs. If pursuit of a Combined Cycle was needed, would
consider coordinating with another utility in order to reduce costs.
1xLM6000 49.1 Natural Gas Accept Cost Effective for 50 MW or less
1xLMS100 106.4 Natural Gas Reject Not Cost Effective compared to alternatives
1xE-Class SCGT 87.5 Natural Gas Reject Not Cost Effective compared to alternatives
1xF-Class SCGT 212.8 Natural Gas Accept Cost Effective for low capacity factors
100 MW Recips 100.2 Natural Gas Accept Cost Effective for 100 MW or less
500 MW Supercritical Pulverized Coal
425 Coal Reject Not Cost Effective compared to alternatives
750 MW Supercritical Pulverized Coal
637.5 Coal Reject Not Cost Effective compared to alternatives
2x1 Integrated Gasification Combined Cycle
482 Coal Reject Not Cost Effective compared to alternatives
Wood Stoker Fired 50 Biomass Reject Not Cost Effective compared to alternatives
Landfill Gas IC Engine 5 Biomass Reject Not Cost Effective compared to alternatives
10 MW Adv. Battery Energy Storage
10 Energy Storage
Reject Not Cost Effective compared to alternatives
135 MW Compressed Air Energy Storage
135 Energy Storage
Reject Not Cost Effective compared to alternatives
50 MW Wind Energy Conversion
50 Renewables Accept Cost Effective Renewable Source
50 MW Solar PV 50 Renewables Accept Cost Effective Renewable Source
50 MW Solar Thermal 50 Renewables Reject Not Cost Effective compared to PV
50 MW Low-head Hydro
50 Renewables Reject Not Cost Effective compared to alternatives
Small Modular Nuclear 225 Uranium Reject Not Cost Effective compared to alternatives
1 Resource options could be structured as a PPA or be utility owned
2014 Integrated Resource Plan
Page 110
November 2014
Gas-Fueled Technologies
Two major types of gas-fired power generation technology, representing six
alternatives, were selected for the detailed assessment. These were either simple cycle
or combined cycle technology.
Simple cycle gas turbine (SCGT) technology was evaluated for four levels of
generating capability.
Combined cycle gas turbine (CCGT) technology was evaluated for two levels of
generating capabilities.
Simple cycle alternatives were included in the final integration analysis. With respect to
the combined cycle alternatives, this assumption was made on the basis of capturing
economies of scale and high efficiencies while satisfying the reserve margin and capital
investment constraints.
Renewable Technologies
Two renewable resources were included in the final integration analysis. The
renewable resources were modeled in 50 MW blocks to be evaluated against the other
new construction alternative options. The 50 MW blocks are an installed capacity
(ICAP) or generation nameplate designation. The renewable technologies that were
selected by the bus bar cost analysis included wind and solar photovoltaic (PV). These
renewable resources are intermittent resources, meaning that they are not continuously
available due to some factor outside direct control. Given that this analysis is based on
unforced capacity (UCAP), the resources are converted from the installed capacity to
the unforced capacity based on the percentage of the designated resource. For wind,
9.125% was used to calculate the amount of UCAP available. This effectively makes
every 50 MW block of wind worth 4.56 MW towards meeting the UCAP requirement.
For solar PV, 38% was used to calculate the amount of UCAP available. This makes
every 50 MW block of solar PV worth 19 MW towards meeting the UCAP requirement.
See Chapter 5 Sales and Demand Forecast for more details.

2014 Integrated Resource Plan
Page 111
November 2014
PURCHASED POWER ALTERNATIVES
Another set of options available for assisting in meeting future supply-side resource
requirements is purchased power from the wholesale electric market for both capacity
and/or energy needs. Vectren is a participant in the wholesale electric power market
and is a member of the ReliabilityFirst (RF), a regional reliability organization operating
within the framework of the North American Electric Reliability Council (NERC). Vectren
is also a member of MISO, the independent transmission system operator that serves
much of the Midwest and Canada.
Estimating the future market price for electric energy available for purchase is difficult.
In general, forward market information for "standard" products is available from brokers,
counterparties, and published price indices. However, the liquidity and price
transparency of the forward market is inversely proportional to the proximity of the
delivery date of the product. The forward market becomes much less liquid (less trade
volume) as the delivery date of the product moves further out into the future. Price
discovery is more difficult as the more forward products are traded less and therefore
less transparent.
Capacity prices within MISO are on an upward trend that may last for several years.
Vectren does not foresee a near term need for capacity. In the long run, regional
reserve margins will approach equilibrium due to a combination of load growth and
generation retirements. Capacity prices may converge with replacement build prices as
surplus legacy capacity diminishes through unit retirements and market growth. If at
some future point in time Vectren foresees a projected need for capacity, purchased
power options will be fully and explicitly considered at that time.
2014 Integrated Resource Plan
Page 112
November 2014
CUSTOMER SELF- GENERATION
Customer self-generation or behind the meter generation is likely to increase in the
future. As discussed in in Chapter 5 Sales and Demand Forecast, a future trend of
distributed rooftop solar has been projected and included in all scenarios. Somewhat
more difficult to predict is the industrial adoption of behind the meter generation. One
such facility is planned by a large industrial customer with a proposed implementation in
2017. As these types of projects become known they are incorporated into Vectren’s
forecasts. They are not however a typical trend, and therefore, are not projected beyond
the known projects.
Some large electric customers may be candidates for cogeneration opportunities.
Vectren’s marketing department is in periodic discussions with customers most likely to
participate in such a project. Should such a scenario develop, Vectren would work with
that customer to see if they would benefit Vectren’s customers to participate in such a
project by possibly increasing the output of the cogeneration plant and thus supplying
the Vectren system with the excess. Such a project can only be evaluated on a case by
case basis.
RENEWABLE TECHNOLOGIES
Wind
As will be discussed further in Chapter 7 Renewables and Clean Energy, Vectren has
two separate long-term purchase power agreements for a total of 80 MW of wind name
plate capacity. These agreements were included in all integration analysis cases for the
entire 20 year study period.

2014 Integrated Resource Plan
Page 113
November 2014
Other
Landfill gas projects and biomass are viable renewable sources of energy. However,
due to their typically small relative size and unique site situations required for
development, they weren’t considered explicitly in the Technology Assessment or
included in the integration analysis of this IRP. Vectren believes these technologies
may be considered for viable projects in the future, primarily in the context of distributed
generation as discussed in the following section, and that such projects will be duly
evaluated as they develop.

2014 Integrated Resource Plan
Page 114
November 2014
This page intentionally left blank for formatting purposes
2014 Integrated Resource Plan
Page 115
November 2014
CHAPTER 7
RENEWABLES
and
CLEAN ENERGY
2014 Integrated Resource Plan
Page 116
November 2014
CURRENT PROJECTS
Vectren currently receives renewable energy from three projects: two purchase power
contracts from Indiana wind projects and one landfill methane gas project.
Benton County Wind Farm
The Benton County Wind Farm, located in Benton County, Indiana, began providing
electricity to Vectren in May 2007 under a 20 year purchase power agreement. The
nominal nameplate rating for this contract is 30 MW, and the expected annual energy to
Vectren from this project is 76,500 MWh.
Fowler Ridge II Wind Farm
Vectren began receiving energy from the Fowler Ridge II wind farm, also located in
Benton County, Indiana in December of 2009 under a 20 year purchase power
agreement. The nominal nameplate rating for this contract is 50 MW, and the expected
annual energy to Vectren from this project is 130,500 MWh.
Blackfoot Landfill Gas Project
Vectren owns the Blackfoot Landfill Clean Energy Project located in Pike County,
Indiana. Vectren officially took over ownership of this project on June 22, 2009. This
facility consists of 2 internal combustion engine-generator sets that burn methane gas
collected from the adjacent Blackfoot Landfill. Total nameplate capacity is 3.2 MW
gross combined for the two machines. Vectren projects to produce approximately
15,000 MWh per year from this facility. Pending future expansion of the Blackfoot
landfill and corresponding development of a viable gas field, Vectren may consider
adding an additional generator set to this facility at some point in the future.
RENEWABLE ENERGY CREDITS
In addition to participation in actual renewable energy projects, both through ownership
and purchase power agreements, Vectren will also consider purchasing renewable
energy credits (RECs) to meet future renewable mandates. Vectren will monitor the
2014 Integrated Resource Plan
Page 117
November 2014
market development for RECs over the next several years to determine the soundness
of such a strategy.
ADDITIONAL RENEWABLE AND CLEAN ENERGY CONSIDERATIONS
Vectren modeled generation characteristics for output at time of peak load and capacity
factor based on its geographic footprint. Additional wind generation with characteristics
similar to Vectren’s existing wind PPA’s was also considered. Demand side
management programs were considered as clean energy resource options and
competed directly with other supply side options in the model.

2014 Integrated Resource Plan
Page 118
November 2014
Table 7-1 Clean Energy Projections
Clean Energy Source
Retail Sales before
conservation programs
Wind Generation
Landfill Gas Generation
Conservation Programs
Year-Over-Year Conservation
Increase Customer-Owned DG
Vectren Clean
Energy
Year GWh GWh GWh GWh GWh GWh % of sales
2014 5,832 207.0 15 157 1 7%
2015 5,991 207.0 15 182 26 1 7%
2016 6,040 207.0 15 208 26 2 8%
2017 5,645 207.0 15 233 25 3 9%
2018 5,661 207.0 15 258 25 3 9%
2019 5,680 207.0 15 283 25 5 9%
2020 5,699 207.0 15 296 13 7 9%
2021 5,710 207.0 15 309 13 9 10%
2022 5,729 207.0 15 321 13 12 10%
2023 5,746 207.0 15 334 13 17 10%
2024 5,769 207.0 15 347 13 23 10%
2025 5,782 207.0 15 360 13 32 11%
2026 5,801 207.0 15 373 13 37 11%
2027 5,825 207.0 15 386 13 42 11%
2028 5,860 207.0 15 399 13 48 12%
2029 5,884 207.0 15 412 13 55 12%
2030 5,913 207.0 15 426 13 62 12%
2031 5,942 207.0 15 439 13 71 13%
2032 5,985 207.0 15 453 14 81 13%
2033 6,018 207.0 15 466 14 93 13%
2034 6,060 207.0 15 480 14 106 14%

2014 Integrated Resource Plan
Page 119
November 2014
This page intentionally left blank for formatting purposes

2014 Integrated Resource Plan
Page 120
November 2014
CHAPTER 8
DSM RESOURCES

2014 Integrated Resource Plan
Page 121
November 2014
INTRODUCTION
The demand-side resource assessment process is based on a sequential series of steps
designed to accurately reflect Vectren’s markets and identify the options which are most
reasonable, relevant, and cost-effective. It is also designed to incorporate the guidelines
from the IURC. This chapter presents a discussion of the planning and screening process,
identification of the program concepts, and a listing of the demand-side management
(DSM) options passed for integration. Additionally, IRP DSM modeling is discussed.
HISTORICAL PERFORMANCE
Since 1992, Vectren has utilized DSM as a means of reducing customer load and
thereby providing reliable electric service to its customers. Historically, DSM programs
provided both peak demand and energy reductions. DSM programs were approved by
the Commission and implemented pursuant to IURC orders. These programs were
implemented, modified, and discontinued when necessary based on program
evaluations. Vectren has managed the programs in an efficient and cost effective manner,
and the load reductions and energy savings from the programs have been significant.
Between 2010 and 2013, Vectren DSM programs reduced demand by over 25,000 kW
and provided annual incremental energy savings of over 130,000,000 kWh. It is
anticipated that in 2014, Vectren will save an incremental 58,000,000 kWh of gross
energy savings and approximately 15,000 kW in demand savings.
Vectren also operates a Direct Load Control (DLC) program that reduces residential and
small commercial air-conditioning and water heating electricity loads during summer
peak hours. This demand response program commenced in 1992 and over 27,000
customers are enrolled with approximately 17 MW of peak reduction capacity.

2014 Integrated Resource Plan
Page 122
November 2014
EXISTING DSM RESOURCES and PROGRAMS
Tariff Based Resources
Vectren has offered tariff based DSM resource options to customers for a number of
years. Consistent with a settlement approved in 2007 in Cause No. 43111, the Demand
Side Management Adjustment (“DSMA”) was created to specifically recover all of
Vectren's DSM costs, including (at that time) a DLC Component. The Commission, in its
order in Cause No. 43427, authorized Vectren to include both Core and Core-Plus DSM
Program Costs and related incentives in an Energy Efficiency Funding Component
("EEFC") of the DSMA. The EEFC supports the Company's efforts to help customers
reduce their consumption of electricity and related impacts on peak demand. It is
designed to recover the costs of Commission-approved DSM programs from all
customers receiving the benefit of these programs. In Cause Nos. 43427, 43938, and
44318, the Commission approved recovery of the cost of Conservation Programs via
the EEFC. This rider is available to rate schedule RS, B, SGS, DGS, MLA, OSS, LP,
and HLF customers.
Interruptible Rates
In addition to the DSM programs described in this chapter, Vectren has offered
interruptible rate programs for commercial and industrial customers. Vectren currently has
approximately 47 MW of interruptible load under contract, not including the
DLC Program. In addition to the riders listed below, Vectren has one customer on a
special contract interruptible rate (as approved by the IURC), that makes up approximately
20 MW of the total 47 MW of interruptible load.
Rider IP – 2 Interruptible Power Service
This rider is available to rate schedule DGS, OSS, LP, and HLF customers with an
interruptible demand of at least 200 kW who were taking service under this rider during
September 1997. This rider is closed to new participants. This rider currently has two
customers that represent approximately 6 MW of the total interruptible load.

2014 Integrated Resource Plan
Page 123
November 2014
Rider IC Interruptible Contract Rider
This rider is available to any rate schedule LP or HLF customer electric who can provide
for not less than 1,000 kVa of interruptible demand during peak periods. This rider
currently has two customers that represent approximately 21MW of the total
interruptible load.
Rider IO Interruptible Option Rider
This rider is available to any rate schedule DGS, MLA, OSS, LP, or HLF customer who
will interrupt a portion of their normal electrical load during periods of request from
Vectren. A Customer’s estimated load interruption capability must exceed 250 kW to be
eligible. This rider is not applicable to service that is otherwise interruptible or subject to
displacement under rate schedules or riders of Vectren. Customers currently taking
service under Vectren’s rider IP – 2, which is closed to new business, may apply for
service under this rider, if eligible, for the balance or renewal of the existing contracts.
Direct Load Control (DLC)
The DLC program provides remote dispatch control for residential and small commercial
air conditioning, electric water heating and pool pumps (on existing units only) through
radio controlled load management receivers (LMR). The DLC program was
implemented in April 1992 by Vectren, with the objective of reducing summer peak
demand by direct, temporary cycling of participating central air conditioners and heat
pumps and by shedding connected water heating and pool pump loads. Participating
customers receive credits on their bills during the months of June through September
based on the number and type of equipment participating in the program. The DLC
program was identified, in 2007, as part of Vectren’s DSM Market Assessment study,
prepared by Forefront Economics Inc. and H. Gil Peach & Associates LLC, as “…of high
quality and notable for its participation and program longevity.” Vectren’s customers
have achieved significant benefits from the existing DLC program.

2014 Integrated Resource Plan
Page 124
November 2014
The program consists of the remote dispatch and control of a DLC switch installed on
participating customers’ central cooling units (central air conditioners and heat pumps),
as well as electric water heating units where a DLC switch is also installed on the
central cooling unit. Vectren can initiate events to reduce air-conditioning and water-
heating electric loads during summer peak hours. Vectren can initiate a load control
event for several reasons, including: to balance utility system supply and demand, to
alleviate transmission or distribution constraints, or to respond to load curtailment
requests from the Midcontinent Independent Transmission System Operator, Inc.
(MISO), the regional electricity transmission grid authority. The control of central cooling
units is typically a 50% cycling strategy and involves cycling the compressor off for 15
minutes out of every half hour during the cycling period. The direct load control of water
heating equipment utilizes a shedding strategy. This involves shutting off these units for
the duration of the cycling period. Cycling periods can range between two and six hours
in duration.
Vectren manages the program internally and utilizes outside vendors for support
services, including equipment installation and maintenance. Prospective goals for the
program consist of maintaining load reduction capability and program participation while
achieving high customer satisfaction. Vectren also utilizes an outside vendor, The
Cadmus Group, to evaluate the DLC program and provide unbiased demand and
energy savings estimates.
The DLC system has the capability to obtain approximately 17 MW of peak reduction
capacity from the DLC system. Over time, the operability of the DLC switches can
decline for a variety of reasons, including mechanical failure, contractor or customer
disconnection, and lack of re-installation when customer equipment is replaced. In
order to continue to obtain the peak demand response benefits from the DLC system,
Vectren requested and received Commission approval of a multi-year DLC Inspection &
Maintenance Program in Cause No. 43839. This inspection process began in 2011 with
approximately 25% of the DLC switches inspected annually and this process will be

2014 Integrated Resource Plan
Page 125
November 2014
completed early in 2015. Vectren has proposed in Cause No. 43405 DSMA 12 to
continue ongoing maintenance of DLC switches on a five (5) year cycle with
approximately 20% inspected annually. The work will continue to be conducted by
trained vendors for both the inspection and replacement components of the program.
By investing in the inspection and maintenance of the DLC system, Vectren can
continue its ability to rely on this demand reduction resource as part of its resource
planning.
As of May 2014, Vectren’s DLC Program had approximately 27,040 residential
customers and 530 commercial customers with a combined total of over 36,000
switches. Note that a customer may have more than one switch at a residence or
business.
Cause No. 43839 – Rate Design
In Cause No. 43839, approved by the IURC on May 3, 2011, specific structural rate
modifications were proposed by Vectren to better align Vectren’s rate design to encourage
conservation. These structural changes include:
For all rate schedules, Vectren separated its variable costs from its fixed costs.
These changes are intended, among other things, to provide more clarity and
transparency in the rate schedules as to the variable costs that Vectren
customers can avoid as customers reduce usage.
Combined the customers under Rate A (the "Standard" customers) and Rate EH
(the "Transitional" customers) into a single rate schedule, called Rate RS -
Residential Service. The results of these changes resulted in the elimination of
the Rate A declining block rate design in favor of a single block rate design for the
Rate RS - Standard customer group versus the previous declining block rates.
The transition from a declining block rate design to a flat block rate design has
been recognized as a method to encourage energy conservation.
The availability of Rate RS-Transitional was closed to new customers on May 3,
2012 in order to eliminate the promotion of all-electric space heating. A transition

2014 Integrated Resource Plan
Page 126
November 2014
plan to gradually move the existing Rate RS-Transitional customers to RS-
Standard was to be filed for the Commission’s consideration within two years of
Vectren’s most recent electric rate case on May 3, 2011. Vectren filed with the
Commission a report on the Transition Plan on April 23, 2013 and recommended
that any transition plan be considered in the next base rate case. The
Commission has not yet ruled on this matter.
The availability of the commercial Rate OSS (Off Season Service) was also
closed to new customers on May 3, 2012 in order to eliminate the promotion of
all-electric space heating. A transition plan to gradually move the existing Rate
OSS customers to a comparable Rate DGS was to be filed for the Commission's
consideration within two years of Vectren’s most recent electric rate case on May
3, 2011. Vectren filed with the Commission a report on the Transition Plan on
April 23, 2013 and recommended that any transition plan be considered in the
next base rate case. The Commission has not yet ruled on this matter.
In Vectren’s last electric base rate case, the Company proposed a decoupling mechanism
that would break the link between recovery of fixed costs and energy sales in order to
eliminate the financial harm to the Company caused when customers reduce their electric
usage, thereby supporting the Company’s ability to aggressively promote energy
conservation. The Commission ultimately denied this request in their April 27, 2011 Order.
The rate structure listed above is reflected in the long term sales and demand forecast.
MISO DR Program
Vectren rider DR provides qualifying customers the optional opportunity to reduce their
electric costs through customer provision of a load reduction during MISO high price
periods and declared emergency events. Rider DR currently offers two programs,
emergency demand response (“EDR”) and demand response resource Type 1 (“DRR-1”)
energy programs.

2014 Integrated Resource Plan
Page 127
November 2014
Rider DR is applicable to any customer served under rates DGS or OSS with prior year
maximum demand greater than 70 kW, MLA, LP, or HLF. A customer may participate in
the rider DR only with kVa or kW curtailment load not under obligation pursuant to rider IC
or IO or special contract. Customers must offer Vectren a minimum of one (1) MW of load
reduction, or the greater minimum load reduction requirement that may be specified by the
applicable MISO BPM for the type of resource offered by customer. A customer may
participate in an aggregation as described in the Rider DR in order to meet the minimum
requirement.
Vectren currently does not have any customers participating in rider DR.
Net Metering – Rider NM
Rider NM allows certain customers to install renewable generation facilities and return any
energy not used by the customer from such facilities to the grid. On July 13, 2011 the
Commission published an amended net metering rule, which included additional
modifications to the rules, including eligibility to all customer classes, increase to the size
of net metering facilities (1 MW) and an increase in the amount of net metering allowed
(1% of most recent summer peak load or approximately 11.5 MW). The new rules also
required that at least forty percent (40%) of the amount of net metering allowed would be
reserved solely for participation by residential customers.
Vectren has worked with customers over the past several years to facilitate the
implementation of net metering installations. As of July 1st, 2014, Vectren had 69 net
metering customers with a total nameplate capacity of 474 kW.
Smart Grid Resources
Smart Grid technology has the potential to enable higher levels of reliability, energy
efficiency and demand response, as well as improved evaluation, measurement, and
verification of energy efficiency and demand response efforts. Reliability can be
improved through distribution automation (DA) enhancements. These enhancements
2014 Integrated Resource Plan
Page 128
November 2014
can provide operators with real-time information that allows them to make operational
decisions more quickly to restore customers following an outage or possibly avoiding
the outage completely. Additionally the enhancements can provide automation that can
identify fault location, isolate and restore the customers quickly without operator
intervention. The advanced metering infrastructure (AMI) portion of a Smart Grid
project, as well as new dynamic pricing offerings, enable those customers who decide
to actively manage their energy consumption to have access to significantly more
information via enhanced communication. This provides those customers a better
understanding and more control of their energy consumption decisions and the resulting
energy bills. These improvements can provide benefits toward carbon foot print
reduction as a result of the overall lowered energy consumption. The potential DSM
benefits related to Smart Grid include:
• Peak reductions resulting from enabling Vectren customers to actively participate
in demand response programs via dynamic pricing programs,
• Enhanced load and usage data to the customer to foster increased customer
conservation, and
• Conservation voltage and line loss reductions due to the improved operating
efficiency of the system.
In 2009, as part of the funding available from the United States Department of Energy
(DOE) pursuant to American Recovery and Reinvestment Act (ARRA), Vectren
conducted a business case analysis of the broad benefits of a Smart Grid
implementation. According to the October 27, 2009 DOE announcement, Vectren did
not receive a grant award for the Smart Grid project. Vectren re-evaluated the business
case and determined that it would not be prudent to proceed with a broad Smart Grid
project at this time due to net costs to customers. As part of this initiative Vectren
completed the development of an initial Smart Grid strategy where it identified the need
to invest in some foundational communication and information gathering technology in
order to support future demand response and load management technology. The initial
focus of the strategy is to build out a communication network that will support current
2014 Integrated Resource Plan
Page 129
November 2014
and future Smart Grid technology, such as distribution Supervisory Control and Data
Acquisition (SCADA), AMI, conservation voltage reduction (CVR), and system
automation. Vectren has implemented a fiber optic communication path across its
transmission network, connecting at both primary generating stations. Additional fiber
installations are in progress across the transmission grid. The build out of the
communication system has allowed Vectren to install and monitor additional SCADA
points from its distribution substations. These SCADA installations are fundamental to
the potential implementation of future conservation and voltage management programs,
such as CVR, on the distribution network. Vectren will continue to monitor and evaluate
Smart Grid technologies and customer acceptance of Smart Grid enabled energy
efficiency and demand response.
Vectren recognizes the potential benefits Smart Grid technology programs offer. While
a comprehensive Smart Grid deployment is likely several years in the future, the goal of
any Vectren Smart Grid project will be to improve reliability, reduce outage restoration
times, and increase energy conservation capabilities. The foundational investments
currently being made and those planned over the next few years will enhance Vectren’s
ability to achieve these benefits.
The potential impacts of a robust Smart Grid implementation that would include dynamic
pricing, improved information or conservation voltage reduction have not been explicitly
quantified in this IRP because no specific project of this magnitude has been proposed by
Vectren. We continue to monitor these technologies for potential future implementation
as they become cost effective for our customers.
FEDERAL AND STATE ENERGY EFFICIENCY DEVELOPMENTS
Federal – Codes, Standards and Legislation
Energy efficiency policies are gaining momentum at both the state and Federal level.
Although there are numerous activities going on at the state and Federal level the

2014 Integrated Resource Plan
Page 130
November 2014
following are components of significant legislation that are approaching implementation,
as well as new codes, standards and legislation being considered that will likely have an
impact on energy efficiency in the planning horizon.
On June 2, 2014, the EPA released its Clean Power Plan proposal that, if
implemented, will for the first time regulate carbon dioxide (CO2) emissions
from existing power plants at the U.S. federal level. The rule is designed to
cut carbon pollution from power plants nationwide by 30 percent from 2005
levels. State compliance includes several paths, one of which is end use
energy efficiency. While dependent on the actual state implementation plan,
the proposed plan would require reductions of 0.57% starting in 2017 and
ramping up to 1.5% annually from 2022-2036. By 2030, the EPA is looking for
usage reductions in Indiana of 11.6% in cumulative savings and that number
increases to 12.9% in cumulative savings by 2036. As this rule is developed
and finalized, it is likely to have potential significant impacts on energy
efficiency planning.
The U.S. Department of Energy's Appliances and Equipment Standards
Program develops test procedures and minimum efficiency standards for
residential appliances and commercial equipment. On June 27, 2011,
amended standards were issued for residential central air conditioners and
heat pumps. Central air conditioners and central air conditioning heat pumps
manufactured on or after January 1, 2015 will have minimum requirements for
Seasonal Energy Efficiency Ratios (SEER) and Heating Seasonal
Performance Factors (HSPF).
State – Codes, Standards and Legislation
Since 2009, Indiana has taken several significant steps to enhance energy efficiency
policy in the state.
In 2009, the IURC released the Phase II Generic DSM order. The order
established statewide electric savings goals for utilities starting in 2010 at

2014 Integrated Resource Plan
Page 131
November 2014
0.3% of average sales and ramping to 2% per year by 2019, The Phase II
order also defined a list of five (5) Core DSM programs to be offered by a
statewide Third Party Administrator (TPA) and allowed utilities the option to
offer Core Plus programs in an effort to reach the 2% goal.
As a result, since 2012, a statewide TPA has been running Core DSM
Programs in Indiana. In March 2014, the Indiana General Assembly passed
legislation which modified DSM requirements in Indiana. Senate Enrolled Act
No. 340 (“SEA 340”) removed requirements for mandatory statewide ”Core’
DSM programs and savings requirements established in the Phase II Order.
SEA 340 also allows large C&I customers who meet certain criteria to opt-out
of participation in utility sponsored DSM programs. Furthermore, the statute
goes on to prohibit the Commission from requiring jurisdictional electric
utilities to meet the Phase II Order energy savings targets after December 31,
2014 and prohibits jurisdictional electric utilities from renewing or extending
an existing contract or entering into a new contract with a statewide third party
administrator for an energy efficiency program as established in the Phase II
Order.
As a result of SEA 340, Vectren filed and received approval for a one year
DSM plan for 2015 under Cause No. 44495 with a savings target of 1% of
eligible customer sales.
VECTREN DSM STRATEGY
Vectren has adopted a cultural change that encourages conservation and efficiency for
both its gas and electric customers. Vectren has embraced energy efficiency and
actively promotes the benefits of energy efficiency to its employees and customers.
Vectren has taken serious steps to implement this cultural change starting with its
employees. Vectren encourages each employee, especially those with direct customer
contact, to promote conservation. Internal communications and presentations,
conservation flyers and handouts, meetings with community leaders, and formal training
have all promoted this shift. This cultural shift was a motivating factor in launching a
2014 Integrated Resource Plan
Page 132
November 2014
new Vectren motto of "Live Smart" in order to further emphasize efficiency. Vectren’s
purpose statement is the foundation of the Vectren Strategy related to DSM:
Purpose
With a focus on the need to conserve natural resources, we provide energy and
related solutions that make our customers productive, comfortable and secure.
Customers are a key component of Vectren’s values, and Vectren knows success
comes from understanding its customers and actively helping them to use energy
efficiently.
Vectren will continue to offer cost-effective DSM to assist customers in managing their
energy bills and meet future energy requirements. Vectren will include an on-going level
of Vectren sponsored DSM in the load forecast and will also consider additional DSM as
a source of new supply in meeting future electric service requirements (discussed
further in the IRP DSM modeling section of this chapter). DSM savings levels in the
load forecast include DSM energy efficiency programs available to all customer classes
and a 1% annual savings targets for 2015-2019 and .5% annually thereafter. The 1% of
eligible annual savings target assumes that 70% of eligible large customer load will opt-
out of DSM programs using the provision provided in SEA340.1 The load forecast also
includes an ongoing level of energy efficiency related to codes and standards
embedded in the load forecast projections. Ongoing DSM is also important given the
integration of Vectren’s gas and electric efficiency programs.
DSM PLANNING PROCESS
The following outlines Vectren’s planning process in support of Vectren’s strategy to
identify cost effective energy efficiency resources. In 2006, as a result of a settlement in
1 Vectren assumes that 80% of large customers will opt out of Vectren sponsored DSM programs; however, 70% was selected for large sales modeling to capture large customer energy efficiency projects outside of Vectren sponsored programs.
2014 Integrated Resource Plan
Page 133
November 2014
Cause No. 42861, the DSM Collaborative was formed, including Vectren and the
Indiana Office of Utility Consumer Counselor (“OUCC”) as voting members. The
Collaborative provided input in the planning of Vectren’s proposed DSM programs. The
Oversight Board was formed as a result of Cause No. 43427 and was given authority to
govern Vectren’sElectric DSM Programs. When formed, the Oversight Board included
Vectren and the OUCC as voting members. The Citizens Action Coalition (“CAC”) was
added as a voting member of the Oversight Board in 2013 as a result of Cause No.
44318.
The IURC Phase II Order in Cause No. 42693 issued on December 9, 2009 established
energy saving goals for all jurisdictional utilities in Indiana. The Phase II Order required
all jurisdictional utilities to implement five specified programs, which the Commission
termed Core Programs. The Core Programs were administered by a third party
administrator (TPA) selected through a process involving the Demand Side
Coordination Committee composed of jurisdictional Investor-Owned Utilities (IOU’s) and
other pertinent key stakeholders.
Additionally, the Commission recognized that achieving the goals set out in the Phase II
Order would not be possible with Core Programs alone and encouraged the utilities to
implement Core Plus Programs to assist in reaching the annual savings goals. Core
Plus programs are those programs implemented by the jurisdictional electric utilities in
Indiana designed to fill the gap between savings achieved by the Core programs and
the savings targets established by the Commission in the Phase II Order. To develop its
own set of Core Plus programs, Vectren modified existing programs approved in Cause
No. 43427 and added new programs, which were approved on August 31, 2011 in
Cause No. 43938. During this period, Vectren also proceeded to integrate some of its
electric programs with existing gas DSM programs.
However, with the passage of SEA 340, mandatory statewide ”Core” DSM programs
and savings requirements established in the Phase II Order have been removed as of

2014 Integrated Resource Plan
Page 134
November 2014
December 31, 2014 and large C&I customers who meet certain criteria (“Qualifying
Customers”) are allowed to opt-out of participation in Company sponsored energy
efficiency programs. As a result, Vectren has implemented an opt-out process as
defined in IURC Cause No. 44441 to allow Qualifying Customers to opt-out. This
process includes defined annual opt-out and opt-in periods. The plan that Vectren
initially filed for 2015 in IURC Cause No. 44495 on May 31, 2014 assumed a 50% level
of opt-out. During the initial opt-out period effective July 1, 2014, approximately 71% of
eligible large C&I retail sales opted out of participation in Company sponsored DSM.
The higher than anticipated opt-out required Vectren to adjust the 2015 Plan to reflect
lower spending and lower available savings potential because of the additional portion
of the load that is no longer participating in DSM programs. There is an additional opt-
out period in the fall of 2014 effective January 1, 2015. As a result, Vectren revised the
2015 Plan to adjust for an 80% opt-out level effective January 1, 2015. The revised
plan was approved by the Oversight Board and is still pending Commission approval as
part of Cause No. 44495.
The 2015 Plan was developed during an IRP planning period; therefore, the 2014 IRP
could not serve as a key input into the 2015 Plan. As a result, the avoided cost basis
from the 2011 IRP was used to develop the 2015 Plan. The framework for the 2015
Plan is a continuation of programs offered in 2014, at a savings level of 1.2% of sales
(adjusted for the assumption that 80% of Qualifying Customers will opt-out of the
programs). However, there were many steps involved in developing the 2015 Plan. The
objective of these steps was to develop a plan based on market-specific information for
Vectren, which could be successfully implemented utilizing realistic assessments of
achievable market potential.
The first step in the process was retaining EnerNOC to complete a Market Potential
Study1 (MPS), included in the Technical Appendix, section D. At the end of 2012,
1 Electric Demand Side Management: Market Potential Study and Action Plan, EnerNOC Utility Solutions Consulting, April 22, 2013

2014 Integrated Resource Plan
Page 135
November 2014
Vectren, with guidance from the Vectren Electric Oversight Board, engaged EnerNOC,
Inc. to study its DSM market potential and develop an Action Plan. EnerNOC conducted
a detailed, bottom-up assessment of the Vectren market in the Evansville metropolitan
area to deliver a projection of baseline electric energy use, forecasts of the energy
savings achievable through efficiency measures, and program designs and strategies to
optimally deliver those savings. The study developed technical, economic and
achievable potential estimates by sector, customer type and measure. According to the
MPS, EnerNOC performed the following tasks in completing the study:
1. Conducted onsite energy consumption surveys with 30 of Vectren’s largest
commercial and industrial customers in order to provide data and guidance for
these market sectors that had not formerly received focused DSM program
efforts.
2. Performed a market characterization to describe sector-level electricity use for
the residential, commercial, and industrial sectors for the base year, 2011.
This included using existing information contained in prior Vectren and Indiana
studies, new information from the aforementioned onsite surveys with large
customers, EnerNOC’s own databases and tools, and other secondary data
sources such as the American Community Survey (ACS) and the Energy
Information Administration (EIA).
3. Developed a baseline electricity forecast by sector, segment, and end use for
2011 through 2023. Results presented in this volume focus on the upcoming
implementation years of 2015 through 2019.
4. Identified several hundred measures and estimated their effects in five tiers of
measure-level energy efficiency potential: Technical, Economic, Achievable
High, Achievable Recommended and Achievable Low.
5. Reviewed the current programs offered by Vectren in light of the study
findings to make strategic program recommendations for achieving savings.
6. Created recommended program designs and action plans through 2019
representing the program potential for Vectren, basing them on the potential
analysis and strategic recommendations developed in the previous steps.
2014 Integrated Resource Plan
Page 136
November 2014
The EnerNOC MPS and other study information were used to help guide the plan
design. Study analysis and results details can be found in the MPS and its
appendices. For planning purposes Vectren used the “Recommended Achievable”
scenario as a guide for developing the 2015 Plan.
The second primary step in the planning process was to hire outside expertise to
assist with the plan design and development. Vectren retained Morgan Marketing
Partners to assist with designing the 2015 Plan. Rick Morgan, President of Morgan
Marketing Partners, was the primary planner working with the Vectren team.
The third primary step in the planning process was to obtain input from various
sources to help develop and refine a workable plan. The first group providing input
was Vectren’s DSM Program Managers who have been overseeing current Vectren
programs. In addition, vendors and other implementation partners who operate the
current programs were very involved in the process as well. They provided
suggestions for program changes and enhancements. The vendors and partners
also provided technical information about measures to include recommended
incentives, estimates of participation and estimated implementation costs. These
data provided a foundation for the 2015 Plan based on actual experience within
Vectren’s territory. These companies also bring their experience operating programs
for other utilities.
Other sources of program information were also considered. Current evaluations
were used for adjustments to inputs. In addition, best practices were researched
and reviewed to gain insights into the program design of successful DSM programs
implemented at other utilities. Once the plan was developed, Vectren obtained
feedback and approval from the Oversight Board before finalizing.
2014 Integrated Resource Plan
Page 137
November 2014
DSM SCREENING RESULTS
The last step of the planning process was the cost benefit analysis. Utilizing a cost /
benefit model, the measures and programs were analyzed for cost effectiveness. The
outputs include all the California Standard Practice Manual results including Total
Resource Cost (TRC), Utility Cost Test (UCT), Participant and Ratepayer Impact
Measure (RIM) tests. Inputs into the model include the following: participation rates,
incentives paid, energy savings of the measure, life of the measure, implementation
costs, administrative costs, incremental costs to the participant of the high efficiency
measure, escalation rates and discount rates. Vectren considers the following tests
and ensures that the portfolio passes the TRC test as this test includes the total costs
and benefits to both the utility and the consumer. Table 8-4 below outlines the results of
all tests.
The model includes a full range of economic perspectives typically used in energy
efficiency and DSM analytics. The perspectives include:
Participant Test
Utility Cost Test
Ratepayer Impact Measure Test
Total Resource Cost Test
The cost effectiveness analysis produces two types of resulting metrics:
1. Net Benefits (dollars) = NPV ∑ benefits – NPV ∑ costs
2. Benefit Cost Ratio = NPV ∑ benefits ÷ NPV ∑ costs
As stated above, the cost effectiveness analysis reflects four primary tests. Each
reflects a distinct perspective and has a separate set of inputs reflecting the treatment of
costs and benefits. A summary of benefits and costs included in each cost
effectiveness test is shown below in Table 8-1.

2014 Integrated Resource Plan
Page 138
November 2014
Table 8-1 Vectren Cost Effectiveness Tests Benefits & Costs Summary
Test
Benefits
Costs
Participant Cost Test
Incentive payments Annual bill savings Applicable tax credits
Incremental technology/equipment costs
Incremental installation costs
Utility Cost Test (Program Administrator Cost Test)
Avoided energy costs Avoided capacity costs
All program costs (startup, marketing, labor, evaluation, promotion, etc.)
Utility/Administrator incentive costs
Rate Impact Measure Test
Avoided energy costs Avoided capacity costs
All program costs (startup, marketing, labor, evaluation, promotion, etc.)
Utility/Administrator incentive costs
Lost revenue due to reduced energy bills
Total Resource Cost Test
Avoided energy costs Avoided capacity costs Applicable participant
tax credits
All program costs (not including incentive costs)
Incremental technology/equipment costs (whether paid by the participant or the utility)
The Participant Cost Test shows the value of the program from the perspective of the
utility’s customer participating in the program. The test compares the participant’s bill
savings over the life of the DSM program to the participant’s cost of participation.
The Utility Cost Test shows the value of the program considering only avoided utility
supply cost (based on the next unit of generation) in comparison to program costs.
The Ratepayer Impact Measure (RIM) Test shows the impact of a program on all utility
customers through impacts in average rates. This perspective also includes the estimates
of revenue losses, which may be experienced by the utility as a result of the program.
2014 Integrated Resource Plan
Page 139
November 2014
The Total Resource Cost (TRC) Test shows the combined perspective of the utility and the
participating customers. This test compares the level of benefits associated with the
reduced energy supply costs to utility programs and participant costs.
In completing the tests listed above, Vectren used 7.29% as the weighted average cost of
capital, which is the weighted cost of capital that was approved by the IURC on April 27,
2011 in Cause No. 43839. For the 2015 Plan, Vectren utilized the avoided costs from
Table 8-4 in the 2011 IRP. The avoided costs listed below in Table 8-2 were not yet
available when the 2015 Plan was developed and filed with the Commission. As the 2015
Action Plan is finalized in late 2014, Vectren will use the avoided costs from the table
below and also for any future modeling of DSM programs for 2016 and beyond. Vectren
conducts IRPs every two years. Note that The avoided generating capacity costs are
reflective of the estimated replacement capital and fixed operations and maintenance cost
for an F-class simple cycle gas turbine, as discussed in Table 6-1 SGCT Classes. The
operating and capital costs are assumed to escalate with inflation throughout the study
period. The cost assumptions can be found in the Technical Appendix, section B.
Transmission and distribution capacity are accounted for within the transmission and
distribution avoided cost. Vectren’s planning reserve margin position is not factored into
the avoided capacity cost as presented. Under the base sales forecast, Vectren does not
require additional capacity to meet the planning reserve margin requirement throughout
the study period.
The marginal energy cost are reflective of the modeled Vectren system marginal cost of
energy from the base scenario under base assumptions. This included variable transaction
purchase, emission costs for CO2 starting in 2020, operation and maintenance, and fuel
costs. The marginal system cost reflects the modeled spinning reserve requirement and
adjusted sales forecasts accounting for transmission and distribution losses. The variable
system costs reflected in this calculation can be found in the Technical Appendix, section
B.

2014 Integrated Resource Plan
Page 140
November 2014
Table 8-2 Vectren Avoided Costs
Capacity Surplus / (Deficit)
Generation Avoided
Cost
Transmission/ Distribution Avoided Cost
Total Capacity Avoided
Cost
Marginal Energy
Cost
Marginal Energy
Cost MW $/kW $/kW $/kW $/MWh $/kWh
2015 81 $104.01 $10.40 $114.41 $36.94 $0.03692016 80 $105.67 $10.57 $116.24 $43.32 $0.04332017 102 $107.36 $10.74 $118.10 $45.01 $0.04502018 106 $109.08 $10.91 $119.99 $47.58 $0.04762019 109 $110.82 $11.08 $121.91 $49.42 $0.04942020 109 $112.60 $11.26 $123.86 $63.16 $0.06322021 109 $114.40 $11.44 $125.84 $65.23 $0.06522022 108 $116.23 $11.62 $127.85 $67.44 $0.06742023 108 $118.09 $11.81 $129.90 $69.84 $0.06982024 108 $119.98 $12.00 $131.98 $73.54 $0.07352025 109 $121.90 $12.19 $134.09 $76.04 $0.07602026 109 $123.85 $12.38 $136.23 $79.06 $0.07912027 108 $125.83 $12.58 $138.41 $81.84 $0.08182028 106 $127.84 $12.78 $140.63 $85.11 $0.08512029 105 $129.89 $12.99 $142.88 $89.11 $0.08912030 104 $131.97 $13.20 $145.16 $92.79 $0.09282031 104 $134.08 $13.41 $147.49 $96.21 $0.09622032 102 $136.22 $13.62 $149.85 $100.77 $0.10082033 101 $138.40 $13.84 $152.24 $105.98 $0.10602034 100 $140.62 $14.06 $154.68 $110.93 $0.1109
A review of the benefit/cost results for each of the technologies considered in the
screening analysis is detailed in Table 8-3. Note that measures with a benefit-cost
ration of 0.00 indicates no direct technology costs are applied.
Table 8-3 Vectren DSM Technology Screening Results
Residential Technology Analysis Results
Participant Test RIM Test TRC Test UCT Test
ID Program Name NPV $ BCR NPV $ BCR NPV $ BCR NPV $ BCR
1 30% Infil. Reduction Electric Furnace no CAC V IQW109 $458 N/A $118
1.11 $785
3.17 $785
3.17
2 30% Infil. Reduction Electric Furnace w/ CAC V IQW107 $55,076 N/A $15,424
1.13 $95,634
3.23 $95,634
3.23
3 30% Infil. Reduction Gas Furnace no CAC V IQW111 $55 N/A ($558)
0.18 ($478)
0.21 ($478)
0.21
4 30% Infil. Reduction Gas Furnace w/ CAC $19,901 N/A ($58,161) ($29,178) ($29,178)

2014 Integrated Resource Plan
Page 141
November 2014
Participant Test RIM Test TRC Test UCT Test
ID Program Name NPV $ BCR NPV $ BCR NPV $ BCR NPV $ BCR V IQW110 0.44 0.61 0.61
5 30% Infil. Reduction Heat Pump V IQW108 $6,012 N/A $226
1.02 $8,981
2.63 $8,981
2.63
6 5th Grade Kit- Air Filter Alarm V RES113 $16,471 N/A $8,159
1.29 $31,187
7.34 $31,187
7.34
7 5th Grade Kit- Bathroom Aerator 1.0 gpm V RES110 $5,758 N/A $671
1.07 $7,862
3.52 $7,862
3.52
8 5th Grade Kit- CFL - 13 W V RES111 $40,416 N/A ($28,761)
0.61 $15,287
1.51 $15,287
1.51
9 5th Grade Kit- CFL - 23 W V RES112 $65,788 N/A ($43,510)
0.63 $28,191
1.63 $28,191
1.63
10 5th Grade Kit- Kitchen Flip Aerator 1.5 gpm V RES109 $2,879 N/A ($1,431)
0.79 $2,165
1.65 $2,165
1.65
11 5th Grade Kit- LED Nightlight V RES114 $16,172 N/A ($15,326)
0.50 $4,874
1.46 $4,874
1.46
12 5th Grade Kit- Low Flow Showerhead 1.5 gpm V RES108 $35,128 N/A ($7,034)
0.89 $31,250
2.29 $31,250
2.29
13 Air Source Heat Pump 16 SEER - no gas available REP113 ($7,347)
0.57 ($2,518)
0.77 ($2,546)
0.77 $1,427
1.20
14 Air Source Heat Pump 16 SEER -gas available REP127 ($8,537)
0.50 ($1,328)
0.87 ($2,546)
0.77 $2,617
1.44
15 Air Source Heat Pump 18 SEER - gas available REP129 ($2,249)
0.46 $127
1.05 ($1,032)
0.73 $1,450
2.04
16 Air Source Heat Pump 18 SEER - no gas available REP115 ($2,074)
0.51 ($48)
0.98 ($1,032)
0.73 $1,275
1.81
17 Appliance Recycling Freezers ARC102 $84,943
5.32 ($298)
1.00 $63,369
2.69 $63,612
2.71
18 Appliance Recycling Refrigerators ARC101 $385,674
5.90 ($3,125)
0.99 $269,452
2.67 $268,064
2.64
19 Attic Insulation V IQW112 $3,288 N/A ($13,850)
0.35 ($9,061)
0.46 ($9,061)
0.46
20 Audit Recommendations IQW V IQW114 $11,374 N/A ($40,699)
0.29 ($29,325)
0.36 ($29,325)
0.36
21 Audit Recommendations V HEA116 $28,561 N/A ($69,232)
0.35 ($44,098)
0.45 ($44,098)
0.45
22 Bathroom Aerator IQW V IQW103 $2,874 N/A ($615)
0.90 $3,125
2.21 $3,125
2.21
23 Bathroom Aerator V HEA112 $37,299 N/A $3,890
1.06 $46,598
3.48 $46,598
3.48
24 Central Air Conditioner 16 SEER REP 116 ($21,517)
0.75 ($19,160)
0.73 ($4,056)
0.93 $3,801
1.08
25 Central Air Conditioner 18 SEER REP 117 ($40,415)
0.68 ($11,391)
0.89 ($19,244)
0.83 $28,384
1.43
26 CFL 0-15W RLT104 $611,084
3.01 ($105,148)
0.84 $300,024
2.27 $347,738
2.85
27 CFL 16-20W RLT105 $619,795
3.46 ($77,706)
0.87 $320,977
2.55 $360,400
3.15
28 CFL 21W or Greater RLT106 $591,307
4.09 ($55,275)
0.90 $314,606
2.85 $344,554
3.46
29 Compact Fluorescent Lamps V HEA101 $309,769 N/A ($390,021)
0.45 ($80,547)
0.80 ($80,547)
0.80
30 Compact Fluorescent Lamps IQW V IQW101 $69,004 N/A ($127,952)
0.38 ($49,613)
0.62 ($49,613)
0.62
31 Dual Fuel Air Sourc Heat Pump 16 SEER REP128 ($8,537)
0.50 ($1,328)
0.87 ($2,546)
0.77 $2,617
1.44
32 Duct Sealing Electric Heat Pump REP108 $20,945
1.89 $5,993
1.10 $38,174
2.27 $36,074
2.13
33 Duct Sealing Electric Resistive Furnace REP109 $10,758
4.42 ($1,045)
0.95 $13,411
2.65 $13,131
2.56
34 Duct Sealing Gas Heating with A/C REP107 $1,482
1.02 $49,405
1.46 $77,922
1.99 $101,547
2.84
35 Ductless Heat Pump 17 SEER 9.5 HSPF REP123 $2,469
2.84 ($1,590)
0.73 $1,603
1.61 $1,628
1.63
36 Ductless Heat Pump 19 SEER 9.5 HSPF REP124 $1,819
1.90 ($1,508)
0.74 $1,174
1.37 $1,735
1.67
37 Ductless Heat Pump 21 SEER 10.0 HSPF REP125 $790
1.59 ($904)
0.71 $391
1.21 $765
1.51
38 Ductless Heat Pump 23 SEER 10.0 HSPF REP126 $461
1.27 ($869)
0.73 $165
1.08 $808
1.54

2014 Integrated Resource Plan
Page 142
November 2014
Participant Test RIM Test TRC Test UCT Test
ID Program Name NPV $ BCR NPV $ BCR NPV $ BCR NPV $ BCR
39 Duel Fuel Air Source Heat Pump 18 SEER REP130 ($2,249)
0.46 $127
1.05 ($1,032)
0.73 $1,450
2.04
40 ECM HVAC Motor REP118 $9,831
1.11 ($49,672)
0.56 ($17,936)
0.78 ($8,311)
0.88
41 Energy Star Ceiling Fans RLT112 ($165)
0.74 ($59)
0.84 ($29)
0.91 $172
2.26
42 Energy Star Fixtures RLT111 $4,481
1.15 ($3,400)
0.88 $8,869
1.54 $15,622
2.63
43 Energy Star Reflector CFL V RLT102 $4,738
1.14 ($10,011)
0.65 ($1,997)
0.90 $8,065
1.78
44 Energy Star Reflector LED V RLT103 $4,345
1.72 ($1,530)
0.87 $5,336
2.01 $7,749
3.70
45 Energy Star Specialty CFL V RLT101 $4,738
1.14 ($10,011)
0.65 ($1,997)
0.90 $8,065
1.78
46 Furnace Filter Whistle IQW V IQW106 $20,061 N/A $3,847
1.09 $33,063
3.59 $33,063
3.59
47 Gold Star HERS =<67 All Electric RNC105 $524
1.04 ($8,690)
0.71 ($1,425)
0.94 $7,088
1.49
48 Gold Star HERS =<67 Electric RNC102 $25,046
2.59 ($19,160)
0.78 $24,432
1.55 $26,821
1.64
49 Heat Pump Water Heater REP103 $19,345
1.72 ($19,604)
0.74 $8,378
1.18 $21,083
1.62
50 Kitchen Aerator IQW V IQW102 $1,848 N/A ($592)
0.86 $1,812
1.97 $1,812
1.97
51 Kitchen Aerator V HEA111 $37,299 N/A $3,140
1.05 $45,848
3.35 $45,848
3.35
52 LED 13W RLT109 ($1,754)
0.95 ($5,037)
0.87 $4,357
1.14 $21,940
2.68
53 LED 22W RLT110 $8,841
1.38 $485
1.01 $18,092
1.90 $29,324
4.29
54 LED 7W RLT107 ($2,968)
0.78 ($2,138)
0.82 ($1,314)
0.88 $5,270
2.11
55 LED 9W RLT108 ($5,610)
0.75 ($4,383)
0.77 ($3,977)
0.78 $6,693
1.87
56 LF Showerhead (Whole House) IQW V IQW104 $18,274 N/A ($10,072)
0.75 $10,674
1.53 $10,674
1.53
57 LF Showerhead (Whole House) V HEA113 $99,709 N/A ($36,798)
0.80 $62,816
1.76 $62,816
1.76
58 Opower OPO101 $487,718 N/A ($188,368)
0.79 $299,349
1.73 $299,349
1.73
59 Pipe Wrap (10', 3/4" Wall) IQW V IQW105 $12,656 N/A $1,510
1.05 $19,942
3.21 $19,942
3.21
60 Pipe Wrap (5', 3/4" Wall) V HEA114 $28,728 N/A ($6,586)
0.90 $30,232
2.10 $30,232
2.10
61 Platinum Star- EPAct Tax Credit All Electric RNC106 $591
1.13 ($3,351)
0.71 ($165)
0.98 $2,776
1.50
62 Platinum Star- EPAct Tax Credit Electric RNC103 $10,104
1.60 ($12,332)
0.78 $9,998
1.29 $17,159
1.62
63 Pool Heater REP111 $9,209
1.31 ($3,752)
0.93 $12,595
1.37 $27,184
2.40
64 programmable thermostat REP104 $37,956
4.10 $30,849
1.41 $78,387
3.90 $81,187
4.36
65 Refrigerator Replacement IQW V IQW113 $195,980 N/A ($51,141)
0.91 $245,594
1.98 $245,594
1.98
66 Siver Star HERS =<75 All Electric RNC104 $3,935
2.61 ($4,059)
0.72 $2,951
1.40 $3,588
1.53
67 Siver Star HERS =<75 Electric RNC101 $10,658
3.15 ($7,321)
0.79 $10,766
1.65 $11,274
1.71
68 Smart programmable thermostat REP120 $54,240
2.55 $62,384
1.46 $135,466
3.19 $145,966
3.83
69 Variable Speed Pool Pump REP110 $6,147
1.12 $48,252
1.58 $66,439
2.02 $87,439
2.99
70 Water Heater Tank Wrap HEA117 $31,284 N/A ($35,875)
0.56 ($4,620)
0.91 ($4,620)
0.91 Measures with a benefit-cost ration of 0.00 indicates no direct technology costs are applied.
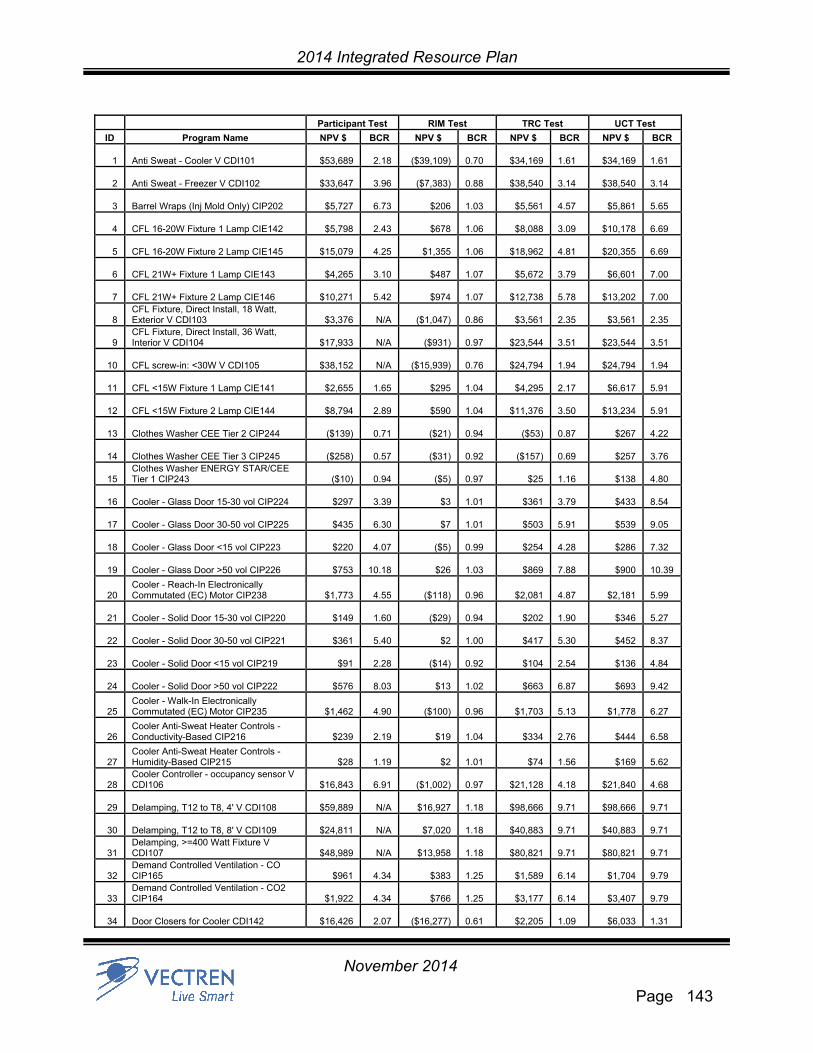
2014 Integrated Resource Plan
Page 143
November 2014
Participant Test RIM Test TRC Test UCT Test
ID Program Name NPV $ BCR NPV $ BCR NPV $ BCR NPV $ BCR
1 Anti Sweat - Cooler V CDI101 $53,689
2.18 ($39,109) 0.70 $34,169
1.61 $34,169
1.61
2 Anti Sweat - Freezer V CDI102 $33,647
3.96 ($7,383) 0.88 $38,540
3.14 $38,540
3.14
3 Barrel Wraps (Inj Mold Only) CIP202 $5,727
6.73 $206 1.03 $5,561
4.57 $5,861
5.65
4 CFL 16-20W Fixture 1 Lamp CIE142 $5,798
2.43 $678 1.06 $8,088
3.09 $10,178
6.69
5 CFL 16-20W Fixture 2 Lamp CIE145 $15,079
4.25 $1,355 1.06 $18,962
4.81 $20,355
6.69
6 CFL 21W+ Fixture 1 Lamp CIE143 $4,265
3.10 $487 1.07 $5,672
3.79 $6,601
7.00
7 CFL 21W+ Fixture 2 Lamp CIE146 $10,271
5.42 $974 1.07 $12,738
5.78 $13,202
7.00
8 CFL Fixture, Direct Install, 18 Watt, Exterior V CDI103 $3,376 N/A ($1,047)
0.86 $3,561
2.35 $3,561
2.35
9 CFL Fixture, Direct Install, 36 Watt, Interior V CDI104 $17,933 N/A ($931)
0.97 $23,544
3.51 $23,544
3.51
10 CFL screw-in: <30W V CDI105 $38,152 N/A ($15,939) 0.76 $24,794
1.94 $24,794
1.94
11 CFL <15W Fixture 1 Lamp CIE141 $2,655
1.65 $295 1.04 $4,295
2.17 $6,617
5.91
12 CFL <15W Fixture 2 Lamp CIE144 $8,794
2.89 $590 1.04 $11,376
3.50 $13,234
5.91
13 Clothes Washer CEE Tier 2 CIP244 ($139)
0.71 ($21) 0.94 ($53)
0.87 $267
4.22
14 Clothes Washer CEE Tier 3 CIP245 ($258)
0.57 ($31) 0.92 ($157)
0.69 $257
3.76
15 Clothes Washer ENERGY STAR/CEE Tier 1 CIP243 ($10)
0.94 ($5)
0.97 $25
1.16 $138
4.80
16 Cooler - Glass Door 15-30 vol CIP224 $297
3.39 $3 1.01 $361
3.79 $433
8.54
17 Cooler - Glass Door 30-50 vol CIP225 $435
6.30 $7 1.01 $503
5.91 $539
9.05
18 Cooler - Glass Door <15 vol CIP223 $220
4.07 ($5) 0.99 $254
4.28 $286
7.32
19 Cooler - Glass Door >50 vol CIP226 $753
10.18 $26 1.03 $869
7.88 $900
10.39
20 Cooler - Reach-In Electronically Commutated (EC) Motor CIP238 $1,773
4.55 ($118)
0.96 $2,081
4.87 $2,181
5.99
21 Cooler - Solid Door 15-30 vol CIP220 $149
1.60 ($29) 0.94 $202
1.90 $346
5.27
22 Cooler - Solid Door 30-50 vol CIP221 $361
5.40 $2 1.00 $417
5.30 $452
8.37
23 Cooler - Solid Door <15 vol CIP219 $91
2.28 ($14) 0.92 $104
2.54 $136
4.84
24 Cooler - Solid Door >50 vol CIP222 $576
8.03 $13 1.02 $663
6.87 $693
9.42
25 Cooler - Walk-In Electronically Commutated (EC) Motor CIP235 $1,462
4.90 ($100)
0.96 $1,703
5.13 $1,778
6.27
26 Cooler Anti-Sweat Heater Controls - Conductivity-Based CIP216 $239
2.19 $19
1.04 $334
2.76 $444
6.58
27 Cooler Anti-Sweat Heater Controls - Humidity-Based CIP215 $28
1.19 $2
1.01 $74
1.56 $169
5.62
28 Cooler Controller - occupancy sensor V CDI106 $16,843
6.91 ($1,002)
0.97 $21,128
4.18 $21,840
4.68
29 Delamping, T12 to T8, 4' V CDI108 $59,889 N/A $16,927 1.18 $98,666
9.71 $98,666
9.71
30 Delamping, T12 to T8, 8' V CDI109 $24,811 N/A $7,020 1.18 $40,883
9.71 $40,883
9.71
31 Delamping, >=400 Watt Fixture V CDI107 $48,989 N/A $13,958
1.18 $80,821
9.71 $80,821
9.71
32 Demand Controlled Ventilation - CO CIP165 $961
4.34 $383
1.25 $1,589
6.14 $1,704
9.79
33 Demand Controlled Ventilation - CO2 CIP164 $1,922
4.34 $766
1.25 $3,177
6.14 $3,407
9.79
34 Door Closers for Cooler CDI142 $16,426
2.07 ($16,277) 0.61 $2,205
1.09 $6,033
1.31
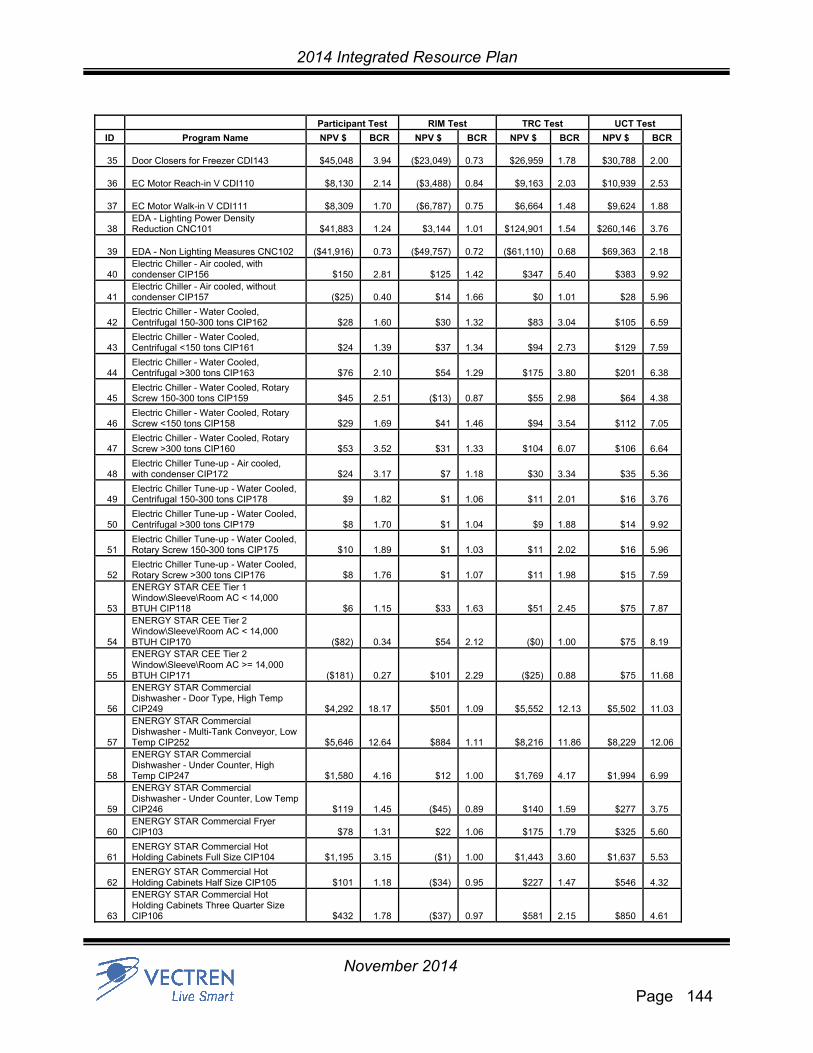
2014 Integrated Resource Plan
Page 144
November 2014
Participant Test RIM Test TRC Test UCT Test
ID Program Name NPV $ BCR NPV $ BCR NPV $ BCR NPV $ BCR
35 Door Closers for Freezer CDI143 $45,048
3.94 ($23,049) 0.73 $26,959
1.78 $30,788
2.00
36 EC Motor Reach-in V CDI110 $8,130
2.14 ($3,488) 0.84 $9,163
2.03 $10,939
2.53
37 EC Motor Walk-in V CDI111 $8,309
1.70 ($6,787) 0.75 $6,664
1.48 $9,624
1.88
38 EDA - Lighting Power Density Reduction CNC101 $41,883
1.24 $3,144
1.01 $124,901
1.54 $260,146
3.76
39 EDA - Non Lighting Measures CNC102 ($41,916)
0.73 ($49,757) 0.72 ($61,110)
0.68 $69,363
2.18
40 Electric Chiller - Air cooled, with condenser CIP156 $150
2.81 $125
1.42 $347
5.40 $383
9.92
41 Electric Chiller - Air cooled, without condenser CIP157 ($25)
0.40 $14
1.66 $0
1.01 $28
5.96
42 Electric Chiller - Water Cooled, Centrifugal 150-300 tons CIP162 $28
1.60 $30
1.32 $83
3.04 $105
6.59
43 Electric Chiller - Water Cooled, Centrifugal <150 tons CIP161 $24
1.39 $37
1.34 $94
2.73 $129
7.59
44 Electric Chiller - Water Cooled, Centrifugal >300 tons CIP163 $76
2.10 $54
1.29 $175
3.80 $201
6.38
45 Electric Chiller - Water Cooled, Rotary Screw 150-300 tons CIP159 $45
2.51 ($13)
0.87 $55
2.98 $64
4.38
46 Electric Chiller - Water Cooled, Rotary Screw <150 tons CIP158 $29
1.69 $41
1.46 $94
3.54 $112
7.05
47 Electric Chiller - Water Cooled, Rotary Screw >300 tons CIP160 $53
3.52 $31
1.33 $104
6.07 $106
6.64
48 Electric Chiller Tune-up - Air cooled, with condenser CIP172 $24
3.17 $7
1.18 $30
3.34 $35
5.36
49 Electric Chiller Tune-up - Water Cooled, Centrifugal 150-300 tons CIP178 $9
1.82 $1
1.06 $11
2.01 $16
3.76
50 Electric Chiller Tune-up - Water Cooled, Centrifugal >300 tons CIP179 $8
1.70 $1
1.04 $9
1.88 $14
9.92
51 Electric Chiller Tune-up - Water Cooled, Rotary Screw 150-300 tons CIP175 $10
1.89 $1
1.03 $11
2.02 $16
5.96
52 Electric Chiller Tune-up - Water Cooled, Rotary Screw >300 tons CIP176 $8
1.76 $1
1.07 $11
1.98 $15
7.59
53
ENERGY STAR CEE Tier 1 Window\Sleeve\Room AC < 14,000 BTUH CIP118 $6
1.15 $33
1.63 $51
2.45 $75
7.87
54
ENERGY STAR CEE Tier 2 Window\Sleeve\Room AC < 14,000 BTUH CIP170 ($82)
0.34 $54
2.12 ($0)
1.00 $75
8.19
55
ENERGY STAR CEE Tier 2 Window\Sleeve\Room AC >= 14,000 BTUH CIP171 ($181)
0.27 $101
2.29 ($25)
0.88 $75
11.68
56
ENERGY STAR Commercial Dishwasher - Door Type, High Temp CIP249 $4,292
18.17 $501
1.09 $5,552
12.13 $5,502
11.03
57
ENERGY STAR Commercial Dishwasher - Multi-Tank Conveyor, Low Temp CIP252 $5,646
12.64 $884
1.11 $8,216
11.86 $8,229
12.06
58
ENERGY STAR Commercial Dishwasher - Under Counter, High Temp CIP247 $1,580
4.16 $12
1.00 $1,769
4.17 $1,994
6.99
59
ENERGY STAR Commercial Dishwasher - Under Counter, Low Temp CIP246 $119
1.45 ($45)
0.89 $140
1.59 $277
3.75
60 ENERGY STAR Commercial Fryer CIP103 $78
1.31 $22
1.06 $175
1.79 $325
5.60
61 ENERGY STAR Commercial Hot Holding Cabinets Full Size CIP104 $1,195
3.15 ($1)
1.00 $1,443
3.60 $1,637
5.53
62 ENERGY STAR Commercial Hot Holding Cabinets Half Size CIP105 $101
1.18 ($34)
0.95 $227
1.47 $546
4.32
63
ENERGY STAR Commercial Hot Holding Cabinets Three Quarter Size CIP106 $432
1.78 ($37)
0.97 $581
2.15 $850
4.61

2014 Integrated Resource Plan
Page 145
November 2014
Participant Test RIM Test TRC Test UCT Test
ID Program Name NPV $ BCR NPV $ BCR NPV $ BCR NPV $ BCR
64
ENERGY STAR Commercial Ice Machine < 500 lb/day harvest rate CIP114 ($123)
0.54 ($42)
0.73 ($110)
0.51 $55
1.94
65
ENERGY STAR Commercial Ice Machine >=1000 lb/day harvest rate CIP116 ($471)
0.53 ($91)
0.84 ($355)
0.58 $323
3.01
66
ENERGY STAR Commercial Ice Machine >=500 and <1000 lb/day harvest rate CIP115 ($4,241)
0.43 ($685)
0.80 ($3,406)
0.45 $1,659
2.54
67 ENERGY STAR Commercial Steam Cookers 3 Pan CIP107 $1,123
1.32 $36
1.01 $2,215
1.72 $4,265
5.14
68 ENERGY STAR Commercial Steam Cookers 4 Pan CIP108 $2,419
1.69 $4
1.00 $3,575
2.13 $5,375
4.96
69 ENERGY STAR Commercial Steam Cookers 5 Pan CIP109 $2,214
2.27 $64
1.01 $2,934
2.79 $3,709
5.28
70 ENERGY STAR Commercial Steam Cookers 6 Pan CIP110 $2,957
2.69 $72
1.01 $3,743
3.22 $4,393
5.23
71 ENERGY STAR Convection Oven CIP111 $564
2.01 $16
1.01 $779
2.52 $1,049
5.31
72 ENERGY STAR Griddles CIP112 $1,348
2.29 $65 1.02 $1,810
2.84 $2,296
5.61
73 ENERGY STAR Window\Sleeve\Room AC < 14,000 BTUH CIP117 $24
2.20 $35
1.70 $67
4.53 $77
9.64
74 ENERGY STAR Window\Sleeve\Room AC >= 14,000 BTUH CIP119 $47
3.35 $58
1.75 $114
6.57 $123
11.69
75 Faucet Aerators-electric V CDI112 $2,777 N/A ($235) 0.95 $3,378
4.33 $3,378
4.33
76 Fluorescent Exit Sign To LED Exit Sign CIE135 $40,257
2.47 ($10,427)
0.87 $44,602
2.78 $48,247
3.25
77 Freezer - Glass Door 15-30 vol CIP232 $611
8.36 ($28) 0.97 $657
6.79 $648
6.31
78 Freezer - Glass Door 30-50 vol CIP233 $1,242
15.97 ($6) 1.00 $1,366
9.56 $1,332
7.90
79 Freezer - Glass Door <15 vol CIP231 $351
5.94 ($21) 0.96 $378
5.44 $385
5.92
80 Freezer - Glass Door >50 vol CIP234 $2,357
12.58 $8 1.00 $2,625
8.63 $2,612
8.33
81 Freezer - Reach-In Electronically Commutated (EC) Motor CIP237 $228
5.57 ($13)
0.96 $266
5.65 $276
6.84
82 Freezer - Solid Door 15-30 vol CIP228 $665
9.01 ($23) 0.97 $720
7.12 $711
6.64
83 Freezer - Solid Door 30-50 vol CIP229 $872
11.50 ($34) 0.97 $932
8.10 $899
6.45
84 Freezer - Solid Door <15 vol CIP227 $262
4.68 ($28) 0.93 $273
4.49 $280
4.92
85 Freezer - Solid Door >50 vol CIP230 $1,497
8.36 ($58) 0.97 $1,620
6.81 $1,608
6.53
86 Freezer - Walk-In Electronically Commutated (EC) Motor CIP236 $916
8.33 ($76)
0.94 $1,020
7.16 $1,020
7.16
87 Freezer Anti-Sweat Heater Controls - Conductivity-Based CIP218 $362
4.62 $23
1.04 $443
4.98 $473
6.82
88 Freezer Anti-Sweat Heater Controls - Humidity-Based CIP217 $249
2.66 ($17)
0.96 $291
3.01 $336
4.37
89 Halogen 120W x3 To CMH 150W - Retrofit CIE134 $14,364
6.00 $2,071
1.10 $19,539
6.90 $19,923
7.80
90 Halogen 120W x3 To CMH 150W - Turnover CIE115 $15,464
5.77 $3,054
1.13 $22,016
6.90 $23,168
9.97
91 Halogen 50W x2 To CMH 20W - Retrofit CIE129 $2,561
1.62 $539
1.07 $4,881
2.32 $7,245
6.41
92 Halogen 50W x2 To CMH 20W - Turnover CIE110 $2,706
1.58 $787
1.09 $5,500
2.32 $8,344
7.28
93 Halogen 50W x2 To MH 20W Track - Retrofit CIE126 $618
1.40 $186
1.07 $1,418
2.05 $2,348
6.59
94 Halogen 50W x2 To MH 20W Track - Turnover CIE107 $3,036
1.40 $912
1.07 $6,959
2.05 $11,527
6.59
95 Halogen 65W x3 To CMH 50W - Retrofit CIE131 $9,293
4.06 $1,395
1.09 $13,093
5.16 $14,083
7.53

2014 Integrated Resource Plan
Page 146
November 2014
Participant Test RIM Test TRC Test UCT Test
ID Program Name NPV $ BCR NPV $ BCR NPV $ BCR NPV $ BCR
96 Halogen 65W x3 To CMH 50W - Turnover CIE112 $9,930
3.90 $2,112
1.13 $14,752
5.16 $16,408
9.68
97 Halogen 75W x2 To CMH 39W - Retrofit CIE130 $4,622
2.27 $739
1.07 $7,264
3.15 $9,049
6.70
98 Halogen 75W x2 To CMH 39W - Turnover CIE111 $5,963
2.27 $954
1.07 $9,372
3.15 $11,676
6.70
99 Halogen 75W x2 To MH 39W Track - Retrofit CIE127 $1,441
1.94 $275
1.08 $2,448
2.75 $3,280
6.79
100 Halogen 75W x2 To MH 39W Track - Turnover CIE108 $8,513
1.94 $1,624
1.08 $14,466
2.75 $19,380
6.79
101 Halogen 75W x3 To CMH 70W - Retrofit CIE132 $8,661
4.27 $1,185
1.09 $12,014
5.33 $12,739
7.21
102 Halogen 75W x3 To CMH 70W - Turnover CIE113 $10,456
4.06 $2,249
1.13 $15,502
5.33 $17,158
9.91
103 Halogen 75W x3 To MH 70W Track - Retrofit CIE128 $2,627
2.83 $433
1.09 $3,936
3.84 $4,589
7.28
104 Halogen 75W x3 To MH 70W Track - Turnover CIE109 $15,521
2.83 $2,559
1.09 $23,256
3.84 $27,117
7.28
105 Halogen 90W x3 To CMH 100W - Retrofit CIE133 $11,327
4.94 $1,481
1.09 $15,438
5.94 $15,981
7.19
106 Halogen 90W x3 To CMH 100W - Turnover CIE114 $12,043
4.72 $2,389
1.13 $17,394
5.94 $18,726
9.56
107 Heat Pump Water Heater 10-50 MBH CIP255 $27,103
3.71 $2,908
1.07 $37,311
4.65 $40,311
6.57
108 HID 101W-175W To T5 Garage 2 Lamp CIE159 ($6,247)
0.73 ($8,549)
0.52 ($10,409)
0.47 ($1,040)
0.90
109 HID 176W+ To T5 Garage 3 Lamp CIE160 $834
1.07 ($6,812)
0.47 ($3,827)
0.61 ($1,792)
0.77
110 HID 75W-100W To T5 Garage 1 Lamp CIE158 ($12,753)
0.46 ($4,919)
0.55 ($13,185)
0.31 $87
1.01
111 HID To Induction Lamp and Fixture 55-100W CIE204 ($616)
0.47 $55
1.08 ($245)
0.75 $574
4.95
112 HID To Induction Lamp and Fixture >100W CIE205 ($27,147)
0.36 $3,072
1.16 ($13,089)
0.62 $18,771
7.30
113 HID >400W to Exterior LED or Induction CIP199 $17
2.10 $5
1.13 $30
3.15 $38
7.61
114 HID >400W to Garage LED or Induction CIP200 $4
2.10 $1
1.13 $8
3.15 $10
7.61
115 High Efficiency Pumps - 1.5hp CIP203 $103
1.29 $45 1.08 $283
1.93 $503
6.85
116 High Efficiency Pumps - 10hp CIP208 $1,846
12.12 $395 1.16 $2,586
11.00 $2,599
11.58
117 High Efficiency Pumps - 15hp CIP209 $2,339
9.00 $541 1.17 $3,350
9.38 $3,444
12.26
118 High Efficiency Pumps - 20hp CIP210 $4,073
5.79 $942 1.16 $5,945
7.03 $6,305
11.07
119 High Efficiency Pumps - 2hp CIP204 $162
1.92 $27 1.07 $271
2.70 $361
6.23
120 High Efficiency Pumps - 3hp CIP205 $471
3.69 $99 1.13 $701
4.92 $781
8.90
121 High Efficiency Pumps - 5hp CIP206 $1,031
7.05 $226 1.15 $1,477
8.00 $1,533
10.92
122 High Efficiency Pumps - 7.5hp CIP207 $1,579
7.34 $370 1.17 $2,284
8.27 $2,384
12.09
123 Incandescent To CFL 16-20W Screw-In CIE139 $5,023
10.61 ($532)
0.91 $3,837
3.82 $3,906
4.03
124 Incandescent To CFL 21W+ Screw-In CIE140 $2,230
8.68 ($369)
0.86 $1,593
3.50 $1,535
3.21
125 Incandescent To CFL <15W Screw-In CIE138 $7,100
7.80 ($960)
0.89 $5,262
3.41 $5,402
3.64
126 Incandescent Traffic Signal To LED Traffic Signal Pedestrian 12" CIE137 $21,726
2.79 ($3,430)
0.91 $21,988
2.81 $28,671
6.25
127 Incandescent Traffic Signal To LED Traffic Signal Round 8" Red CIE136 $4,272
1.59 ($1,197)
0.91 $4,931
1.75 $8,940
4.45
128 Industrial Request for Proposals - Elec CUS109 $8,218
1.75 ($2,373)
0.91 $10,428
1.75 $17,627
3.63
129 Industrial Staffing Grants - Elec CUS108 $8,218
1.75 ($2,373) 0.91 $10,428
1.75 $17,627
3.63
130 Large Industrial Custom Measure - Non $116,770 ($30,687) $145,242 $227,929
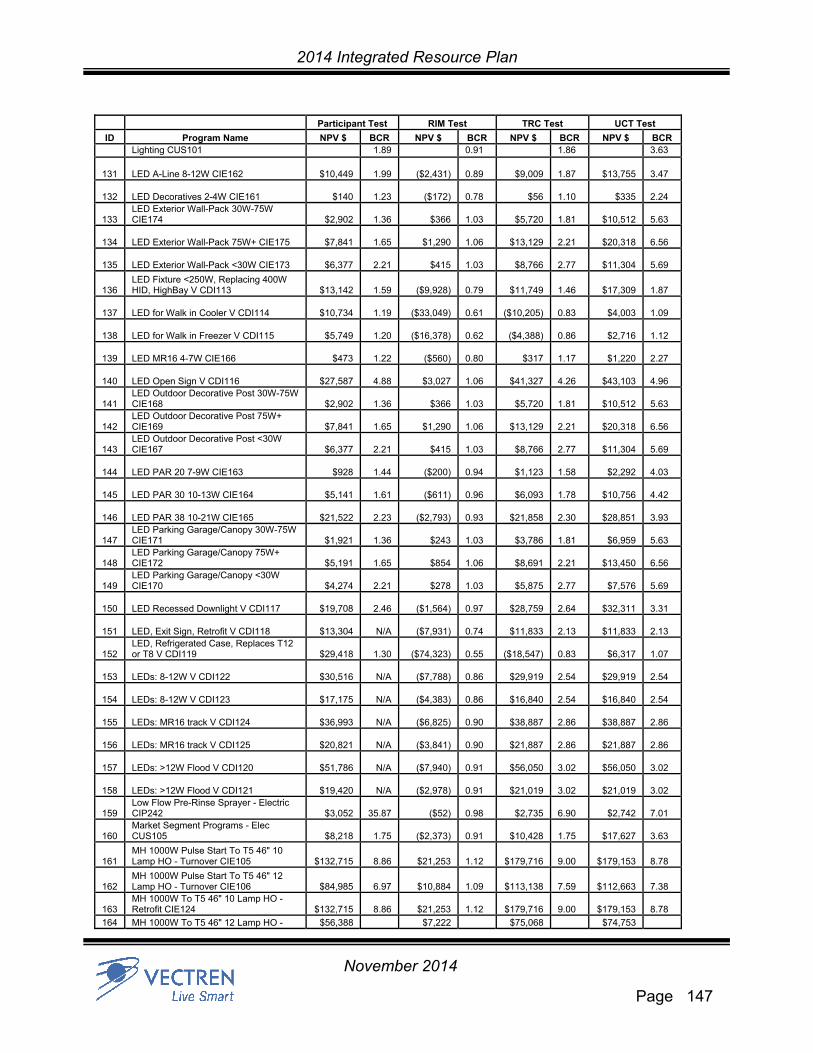
2014 Integrated Resource Plan
Page 147
November 2014
Participant Test RIM Test TRC Test UCT Test
ID Program Name NPV $ BCR NPV $ BCR NPV $ BCR NPV $ BCR Lighting CUS101 1.89 0.91 1.86 3.63
131 LED A-Line 8-12W CIE162 $10,449
1.99 ($2,431) 0.89 $9,009
1.87 $13,755
3.47
132 LED Decoratives 2-4W CIE161 $140
1.23 ($172) 0.78 $56
1.10 $335
2.24
133 LED Exterior Wall-Pack 30W-75W CIE174 $2,902
1.36 $366
1.03 $5,720
1.81 $10,512
5.63
134 LED Exterior Wall-Pack 75W+ CIE175 $7,841
1.65 $1,290 1.06 $13,129
2.21 $20,318
6.56
135 LED Exterior Wall-Pack <30W CIE173 $6,377
2.21 $415 1.03 $8,766
2.77 $11,304
5.69
136 LED Fixture <250W, Replacing 400W HID, HighBay V CDI113 $13,142
1.59 ($9,928)
0.79 $11,749
1.46 $17,309
1.87
137 LED for Walk in Cooler V CDI114 $10,734
1.19 ($33,049) 0.61 ($10,205)
0.83 $4,003
1.09
138 LED for Walk in Freezer V CDI115 $5,749
1.20 ($16,378) 0.62 ($4,388)
0.86 $2,716
1.12
139 LED MR16 4-7W CIE166 $473
1.22 ($560) 0.80 $317
1.17 $1,220
2.27
140 LED Open Sign V CDI116 $27,587
4.88 $3,027 1.06 $41,327
4.26 $43,103
4.96
141 LED Outdoor Decorative Post 30W-75W CIE168 $2,902
1.36 $366
1.03 $5,720
1.81 $10,512
5.63
142 LED Outdoor Decorative Post 75W+ CIE169 $7,841
1.65 $1,290
1.06 $13,129
2.21 $20,318
6.56
143 LED Outdoor Decorative Post <30W CIE167 $6,377
2.21 $415
1.03 $8,766
2.77 $11,304
5.69
144 LED PAR 20 7-9W CIE163 $928
1.44 ($200) 0.94 $1,123
1.58 $2,292
4.03
145 LED PAR 30 10-13W CIE164 $5,141
1.61 ($611) 0.96 $6,093
1.78 $10,756
4.42
146 LED PAR 38 10-21W CIE165 $21,522
2.23 ($2,793) 0.93 $21,858
2.30 $28,851
3.93
147 LED Parking Garage/Canopy 30W-75W CIE171 $1,921
1.36 $243
1.03 $3,786
1.81 $6,959
5.63
148 LED Parking Garage/Canopy 75W+ CIE172 $5,191
1.65 $854
1.06 $8,691
2.21 $13,450
6.56
149 LED Parking Garage/Canopy <30W CIE170 $4,274
2.21 $278
1.03 $5,875
2.77 $7,576
5.69
150 LED Recessed Downlight V CDI117 $19,708
2.46 ($1,564) 0.97 $28,759
2.64 $32,311
3.31
151 LED, Exit Sign, Retrofit V CDI118 $13,304 N/A ($7,931) 0.74 $11,833
2.13 $11,833
2.13
152 LED, Refrigerated Case, Replaces T12 or T8 V CDI119 $29,418
1.30 ($74,323)
0.55 ($18,547)
0.83 $6,317
1.07
153 LEDs: 8-12W V CDI122 $30,516 N/A ($7,788) 0.86 $29,919
2.54 $29,919
2.54
154 LEDs: 8-12W V CDI123 $17,175 N/A ($4,383) 0.86 $16,840
2.54 $16,840
2.54
155 LEDs: MR16 track V CDI124 $36,993 N/A ($6,825) 0.90 $38,887
2.86 $38,887
2.86
156 LEDs: MR16 track V CDI125 $20,821 N/A ($3,841) 0.90 $21,887
2.86 $21,887
2.86
157 LEDs: >12W Flood V CDI120 $51,786 N/A ($7,940) 0.91 $56,050
3.02 $56,050
3.02
158 LEDs: >12W Flood V CDI121 $19,420 N/A ($2,978) 0.91 $21,019
3.02 $21,019
3.02
159 Low Flow Pre-Rinse Sprayer - Electric CIP242 $3,052
35.87 ($52)
0.98 $2,735
6.90 $2,742
7.01
160 Market Segment Programs - Elec CUS105 $8,218
1.75 ($2,373)
0.91 $10,428
1.75 $17,627
3.63
161 MH 1000W Pulse Start To T5 46" 10 Lamp HO - Turnover CIE105 $132,715
8.86 $21,253
1.12 $179,716
9.00 $179,153
8.78
162 MH 1000W Pulse Start To T5 46" 12 Lamp HO - Turnover CIE106 $84,985
6.97 $10,884
1.09 $113,138
7.59 $112,663
7.38
163 MH 1000W To T5 46" 10 Lamp HO - Retrofit CIE124 $132,715
8.86 $21,253
1.12 $179,716
9.00 $179,153
8.78
164 MH 1000W To T5 46" 12 Lamp HO - $56,388 $7,222 $75,068 $74,753

2014 Integrated Resource Plan
Page 148
November 2014
Participant Test RIM Test TRC Test UCT Test
ID Program Name NPV $ BCR NPV $ BCR NPV $ BCR NPV $ BCR Retrofit CIE125 6.97 1.09 7.59 7.38
165 MH 1000W To T8VHO 48" 8 Lamp (2 fixtures) CIP187 $4,072
6.43 ($183)
0.96 $3,880
4.86 $3,855
4.74
166 MH 150W Pulse Start To T5 46" 2 Lamp HO - Turnover CIE101 $5,637
1.24 $2,653
1.08 $17,219
1.83 $32,224
6.73
167 MH 175W To T5 46" 2 Lamp HO - Retrofit CIE120 $17,621
1.74 $2,785
1.06 $30,921
2.45 $43,557
6.05
168 MH 175W To T5 46" 3 Lamp HO - Retrofit CIE121 ($6,991)
0.70 ($3,617)
0.81 ($4,156)
0.79 $8,480
2.21
169 MH 200W Pulse Start To T5 46" 3 Lamp HO - Turnover CIE102 ($131)
0.99 $1,153
1.04 $8,998
1.44 $24,003
5.58
170 MH 200W To LED High Bay 139W CIE118 $317
1.04 ($694)
0.92 $1,096
1.16 $5,740
3.70
171 MH 250W To LED High Bay 175W CIE119 $12,997
1.34 ($4,175)
0.92 $16,097
1.46 $37,432
3.78
172 MH 250W To LED Low Bay 85 W3 CIE116 $10,051
2.30 ($1,166)
0.94 $10,264
2.37 $13,360
4.03
173 MH 250W To T8VHO 48" 4 Lamp CIP184 $2,799
1.93 ($496)
0.92 $2,720
1.95 $4,120
3.82
174 MH 320W Pulse Start To T5 46" 4 Lamp HO - Turnover CIE103 $47,012
2.39 $9,667
1.10 $75,276
3.37 $93,276
7.79
175 MH 350W Pulse Start To T5 46" 6 Lamp HO - Turnover CIE104 $1,046
1.06 ($1,009)
0.95 $5,628
1.39 $14,628
3.72
176 MH 400W To T5 46" 4 Lamp HO - Retrofit CIE122 $108,061
4.20 $12,814
1.08 $147,878
5.21 $155,753
6.72
177 MH 400W To T5 46" 6 Lamp HO - Retrofit CIE123 $36,116
2.07 $3,997
1.05 $56,539
2.83 $72,289
5.78
178 MH 400W To T8VHO 48" 6 Lamp CIP185 $5,930
2.98 ($387)
0.96 $5,849
2.86 $7,049
4.62
179 MH 400W To T8VHO 48" 8 Lamp CIP186 $966
2.29 ($151)
0.92 $911
2.24 $1,211
3.77
180 Network PC Power Management Software CIP214 $306
3.55 ($97)
0.78 $186
2.21 $252
3.89
181 Night Covers V CDI126 $5,769
1.73 ($6,168) 0.64 $651
1.06 $2,640
1.31
182 No controls To Ceiling-Mounted Occupancy Sensors CIE180 $50,987
4.48 ($10,188)
0.85 $43,051
3.54 $48,110
5.04
183
No controls To Ceiling-Mounted Occupancy Sensors >500W Connected CIP190 $5,164
8.82 ($724)
0.88 $4,510
5.46 $4,638
6.25
184 No controls To Central Lighting Controls (Timeclocks) CIE185 $119
1.10 ($395)
0.71 ($55)
0.95 $591
2.60
185 No controls To Central Lighting Controls (Timeclocks) >500W Connected CIP195 $49
1.95 ($20)
0.81 $38
1.77 $69
4.83
186 No controls To Fixture Mounted Daylight Dimming Sensors CIE183 $916
1.66 ($20)
0.99 $1,153
1.90 $1,850
4.15
187
No controls To Fixture Mounted Daylight Dimming Sensors >500W Connected CIP193 $10,648
11.65 $1,487
1.12 $12,210
7.91 $12,210
7.91
188 No controls To Fixture Mounted Occupancy Sensors CIE181 ($1,238)
0.70 ($801)
0.74 ($1,233)
0.65 $1,431
2.65
189
No controls To Fixture Mounted Occupancy Sensors >500W Connected CIP191 $9,148
4.66 ($1,448)
0.88 $8,075
3.72 $9,275
6.25
190 No controls To LED Case Lighting Sensor Controls CIP196 $2,123
2.63 $99
1.03 $2,446
2.85 $3,186
6.44
191 No controls To Remote-Mounted Daylight Dimming Sensors CIE182 $2,597
4.55 $292
1.08 $3,001
4.53 $3,249
6.38
192
No controls To Remote-Mounted Daylight Dimming Sensors >500W Connected CIP192 $1,293
8.96 $186
1.12 $1,496
6.97 $1,526
7.91
193 No controls To Switching Controls for Multi-Level Lighting CIE184 ($5,195)
0.32 ($248)
0.90 ($3,936)
0.37 $1,622
3.23
194
No controls To Switching Controls for Multi-Level Lighting >500W Connected CIP194 $771
2.13 $122
1.08 $1,015
2.52 $1,463
7.63
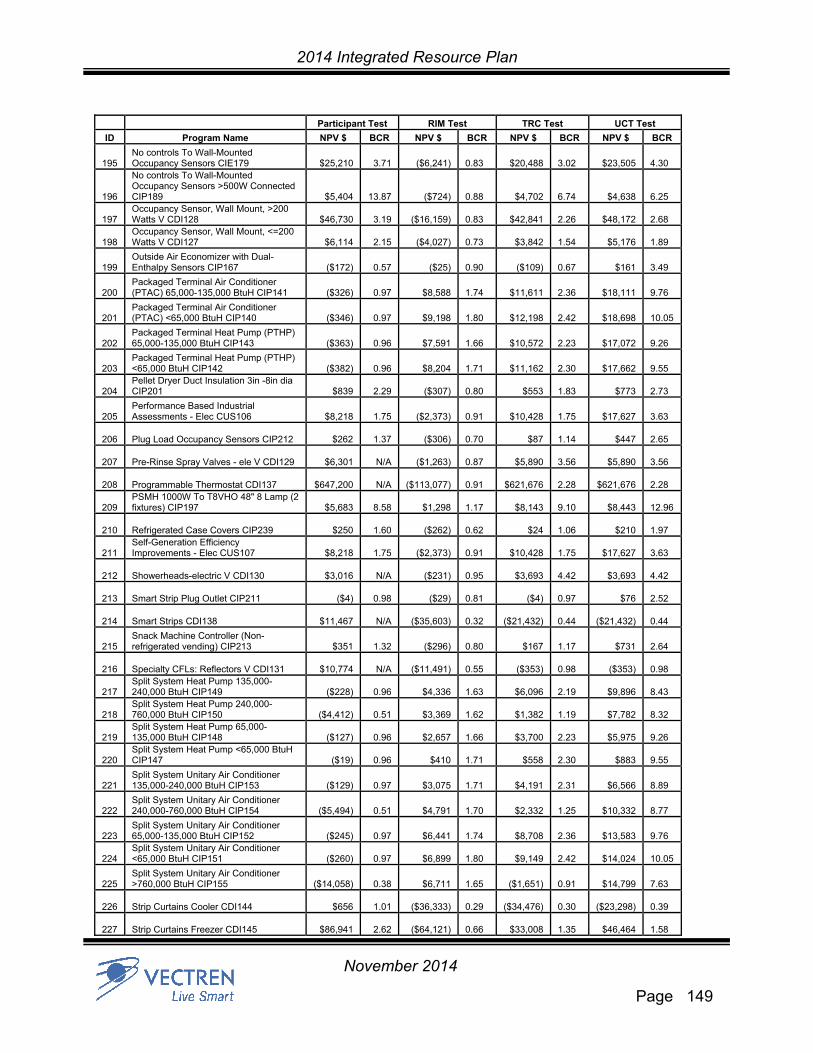
2014 Integrated Resource Plan
Page 149
November 2014
Participant Test RIM Test TRC Test UCT Test
ID Program Name NPV $ BCR NPV $ BCR NPV $ BCR NPV $ BCR
195 No controls To Wall-Mounted Occupancy Sensors CIE179 $25,210
3.71 ($6,241)
0.83 $20,488
3.02 $23,505
4.30
196
No controls To Wall-Mounted Occupancy Sensors >500W Connected CIP189 $5,404
13.87 ($724)
0.88 $4,702
6.74 $4,638
6.25
197 Occupancy Sensor, Wall Mount, >200 Watts V CDI128 $46,730
3.19 ($16,159)
0.83 $42,841
2.26 $48,172
2.68
198 Occupancy Sensor, Wall Mount, <=200 Watts V CDI127 $6,114
2.15 ($4,027)
0.73 $3,842
1.54 $5,176
1.89
199 Outside Air Economizer with Dual-Enthalpy Sensors CIP167 ($172)
0.57 ($25)
0.90 ($109)
0.67 $161
3.49
200 Packaged Terminal Air Conditioner (PTAC) 65,000-135,000 BtuH CIP141 ($326)
0.97 $8,588
1.74 $11,611
2.36 $18,111
9.76
201 Packaged Terminal Air Conditioner (PTAC) <65,000 BtuH CIP140 ($346)
0.97 $9,198
1.80 $12,198
2.42 $18,698
10.05
202 Packaged Terminal Heat Pump (PTHP) 65,000-135,000 BtuH CIP143 ($363)
0.96 $7,591
1.66 $10,572
2.23 $17,072
9.26
203 Packaged Terminal Heat Pump (PTHP) <65,000 BtuH CIP142 ($382)
0.96 $8,204
1.71 $11,162
2.30 $17,662
9.55
204 Pellet Dryer Duct Insulation 3in -8in dia CIP201 $839
2.29 ($307)
0.80 $553
1.83 $773
2.73
205 Performance Based Industrial Assessments - Elec CUS106 $8,218
1.75 ($2,373)
0.91 $10,428
1.75 $17,627
3.63
206 Plug Load Occupancy Sensors CIP212 $262
1.37 ($306) 0.70 $87
1.14 $447
2.65
207 Pre-Rinse Spray Valves - ele V CDI129 $6,301 N/A ($1,263) 0.87 $5,890
3.56 $5,890
3.56
208 Programmable Thermostat CDI137 $647,200 N/A ($113,077) 0.91 $621,676
2.28 $621,676
2.28
209 PSMH 1000W To T8VHO 48" 8 Lamp (2 fixtures) CIP197 $5,683
8.58 $1,298
1.17 $8,143
9.10 $8,443
12.96
210 Refrigerated Case Covers CIP239 $250
1.60 ($262) 0.62 $24
1.06 $210
1.97
211 Self-Generation Efficiency Improvements - Elec CUS107 $8,218
1.75 ($2,373)
0.91 $10,428
1.75 $17,627
3.63
212 Showerheads-electric V CDI130 $3,016 N/A ($231) 0.95 $3,693
4.42 $3,693
4.42
213 Smart Strip Plug Outlet CIP211 ($4)
0.98 ($29) 0.81 ($4)
0.97 $76
2.52
214 Smart Strips CDI138 $11,467 N/A ($35,603) 0.32 ($21,432)
0.44 ($21,432)
0.44
215 Snack Machine Controller (Non-refrigerated vending) CIP213 $351
1.32 ($296)
0.80 $167
1.17 $731
2.64
216 Specialty CFLs: Reflectors V CDI131 $10,774 N/A ($11,491) 0.55 ($353)
0.98 ($353)
0.98
217 Split System Heat Pump 135,000-240,000 BtuH CIP149 ($228)
0.96 $4,336
1.63 $6,096
2.19 $9,896
8.43
218 Split System Heat Pump 240,000-760,000 BtuH CIP150 ($4,412)
0.51 $3,369
1.62 $1,382
1.19 $7,782
8.32
219 Split System Heat Pump 65,000-135,000 BtuH CIP148 ($127)
0.96 $2,657
1.66 $3,700
2.23 $5,975
9.26
220 Split System Heat Pump <65,000 BtuH CIP147 ($19)
0.96 $410
1.71 $558
2.30 $883
9.55
221 Split System Unitary Air Conditioner 135,000-240,000 BtuH CIP153 ($129)
0.97 $3,075
1.71 $4,191
2.31 $6,566
8.89
222 Split System Unitary Air Conditioner 240,000-760,000 BtuH CIP154 ($5,494)
0.51 $4,791
1.70 $2,332
1.25 $10,332
8.77
223 Split System Unitary Air Conditioner 65,000-135,000 BtuH CIP152 ($245)
0.97 $6,441
1.74 $8,708
2.36 $13,583
9.76
224 Split System Unitary Air Conditioner <65,000 BtuH CIP151 ($260)
0.97 $6,899
1.80 $9,149
2.42 $14,024
10.05
225 Split System Unitary Air Conditioner >760,000 BtuH CIP155 ($14,058)
0.38 $6,711
1.65 ($1,651)
0.91 $14,799
7.63
226 Strip Curtains Cooler CDI144 $656
1.01 ($36,333) 0.29 ($34,476)
0.30 ($23,298)
0.39
227 Strip Curtains Freezer CDI145 $86,941
2.62 ($64,121) 0.66 $33,008
1.35 $46,464
1.58

2014 Integrated Resource Plan
Page 150
November 2014
Participant Test RIM Test TRC Test UCT Test
ID Program Name NPV $ BCR NPV $ BCR NPV $ BCR NPV $ BCR
228 System Study CUS102 $47,415
7.16 ($6,819) 0.91 $53,528
4.27 $50,651
3.63
229 T12 18” 1 Lamp To Delamp CIE147 $1,061 N/A $42 1.04 $1,141
16.44 $1,019
6.19
230 T12 24” 1 Lamp To Delamp CIE148 $6,891 N/A $482 1.06 $7,630
16.44 $7,016
7.33
231 T12 36” 1 Lamp To Delamp CIE149 $2,000 N/A $205 1.09 $2,282
16.44 $2,160
8.99
232 T12 46" 1 Lamp To T5 46" 1 Lamp CIE154 $342
1.22 ($106)
0.95 $606
1.45 $1,469
4.00
233 T12 46" 2 Lamp To T5 46" 2 Lamp CIE155 $6,104
2.32 ($79)
0.99 $7,318
2.66 $9,348
4.94
234 T12 46" 3 Lamp To T5 46" 3 Lamp CIE156 $7,448
3.43 $105
1.01 $8,538
3.69 $9,521
5.35
235 T12 46" 4 Lamp To T5 46" 4 Lamp CIE157 $22,669
4.69 $702
1.02 $25,627
4.72 $26,856
5.74
236 T12 48” 1 Lamp To Delamp CIE150 $71,597 N/A $7,541 1.09 $81,894
16.44 $77,671
9.15
237 T12 6' To Refrigerated Display Case Lighting 6' LED - Cooler CIP181 ($2,341)
0.63 ($568)
0.86 ($1,692)
0.68 $2,308
2.82
238 T12 6' To Refrigerated Display Case Lighting 6' LED - Freezer CIP183 ($1,873)
0.63 ($454)
0.86 ($1,354)
0.68 $1,846
2.82
239 T12 60” 1 Lamp To Delamp CIE151 $3,282 N/A $393 1.11 $3,804
16.44 $3,651
10.14
240 T12 72” 1 Lamp To Delamp CIE152 $7,243 N/A $903 1.11 $8,430
16.44 $8,121
10.51
241 T12 96” 1 Lamp To Delamp CIE153 $60,800 N/A $8,362 1.12 $71,570
16.44 $69,651
11.63
242 T8 2 Lamp 4' To LED 1 Lamp Linear 4' CIE178 ($5,043)
0.80 ($1,837)
0.92 ($524)
0.98 $14,434
3.38
243 T8 2L 4', 28W, CEE V CDI132 $16,306
1.18 ($55,730) 0.56 ($25,373)
0.74 ($3,171)
0.96
244 T8 3 Lamp 4' To LED 2 Lamp Linear 4' CIE177 ($2,105)
0.85 ($1,588)
0.88 ($1)
1.00 $8,063
2.97
245 T8 3L 4', 28W, CEE V CDI133 $6,935
1.33 ($12,528) 0.64 ($1,118)
0.95 $4,214
1.23
246 T8 4L 4', 28W, CEE V CDI134 $16,613
1.25 ($40,353) 0.60 ($11,630)
0.84 $4,946
1.09
247 T8 5' To Refrigerated Display Case Lighting 5' LED - Cooler CIP180 ($790)
0.37 ($75)
0.85 ($619)
0.40 $256
2.64
248 T8 5' To Refrigerated Display Case Lighting 5' LED - Freezer CIP182 ($790)
0.37 ($75)
0.85 ($619)
0.40 $256
2.64
249 T8 6L or T5HO 4L Replacing 400-999 W HID V CDI135 $418,460
2.96 ($25,775)
0.97 $564,806
2.87 $618,086
3.48
250 T8 HO 96" 2 Lamp To LED Low Bay 85 W3 CIE117 ($1,674)
0.93 ($3,754)
0.84 ($947)
0.95 $11,873
2.64
251 T8 To 21" Tubular Skylight/Light Tube CIP188 ($513)
0.59 $7
1.01 ($231)
0.78 $644
4.82
252 T8 U-Tube 2 Lamp 2' To LED U-Tube CIE176 ($466)
0.68 ($143)
0.87 ($255)
0.79 $615
2.81
253 Typical Custom Measure - Lighting CUS103 $167,953
1.52 $16,810
1.02 $368,488
1.96 $605,926
5.11
254 Typical Custom Measure - Non-Lighting CUS104 $102,880
1.26 ($88,493)
0.87 $134,708
1.29 $431,727
3.48
255
Vending Machine Occ Sensor - Refrigerated Glass Front Cooler CIE187 $1,682
2.08 ($350)
0.90 $1,379
1.86 $2,260
4.11
256 Vending Machine Occ Sensor - Refrigerated Beverage CIE186 $7,920
2.70 ($1,040)
0.92 $6,757
2.30 $9,401
4.69
257 Vending Miser V CDI136 $16,535
2.75 ($10,318) 0.70 $8,774
1.56 $11,142
1.83
258 VFD CHW Pump 20-100hp - Hospital CIP129 $120,238
37.83 $12,528
1.08 $153,600
14.81 $154,962
16.88
259 VFD CHW Pump 20-100hp - Hotel CIP123 $121,367
38.17 $8,185
1.05 $150,572
14.44 $151,934
16.44
260 VFD CHW Pump 20-100hp - Large Office CIP135 $68,869
22.09 $9,241
1.10 $90,464
12.99 $91,826
15.85
261 VFD CHW Pump <20hp - Hospital $28,808 $2,407 $36,345 $36,591

2014 Integrated Resource Plan
Page 151
November 2014
Participant Test RIM Test TRC Test UCT Test
ID Program Name NPV $ BCR NPV $ BCR NPV $ BCR NPV $ BCR CIE190 21.11 1.06 12.40 13.44
262 VFD CHW Pump <20hp - Hotel CIE195 $14,539
21.30 $682 1.04 $17,809
12.11 $17,932
13.11
263 VFD CHW Pump <20hp - Large Office CIE200 $16,479
12.50 $1,618
1.07 $21,192
10.09 $21,438
11.29
264 VFD Compressor CIE203 $7,653
2.26 ($346) 0.98 $10,538
2.86 $13,879
6.97
265 VFD CW Pump 20-100hp - Hospital CIP131 $34,533
11.58 $5,744
1.12 $47,071
10.07 $49,083
16.45
266 VFD CW Pump 20-100hp - Hotel CIP125 ($1,330)
0.59 $283
1.13 ($173)
0.94 $1,839
3.66
267 VFD CW Pump 20-100hp - Large Office CIP137 $16,492
6.05 $3,448
1.14 $23,755
7.03 $25,767
14.37
268 VFD CW Pump <20hp - Hospital CIE192 $3,405
6.43 $540
1.11 $4,715
7.11 $5,091
13.84
269 VFD CW Pump <20hp - Hotel CIE197 ($155)
0.42 ($14) 0.89 ($105)
0.52 $56
1.96
270 VFD CW Pump <20hp - Large Office CIE202 $1,511
3.41 $299
1.11 $2,267
4.54 $2,643
10.96
271 VFD HW Pump 20-100hp - Hospital CIP130 $101,456
32.07 $15,040
1.12 $134,271
14.66 $135,883
17.53
272 VFD HW Pump 20-100hp - Hotel CIP124 $128,158
40.25 $11,016
1.07 $161,357
14.80 $162,969
17.17
273 VFD HW Pump 20-100hp - Large Office CIP136 $67,034
21.53 $19,781
1.23 $98,908
14.30 $100,520
18.26
274 VFD HW Pump <20hp - Hospital CIE191 $10,579
17.88 $1,369
1.10 $13,871
12.01 $14,058
14.10
275 VFD HW Pump <20hp - Hotel CIE196 $5,735
22.35 $406 1.05 $7,164
12.49 $7,244
14.33
276 VFD HW Pump <20hp - Large Office CIE201 $6,965
12.11 $1,867
1.20 $10,158
11.08 $10,345
13.59
277 VFD Return Fan 20-100hp - Hospital CIP127 $31,961
10.79 $4,648
1.11 $42,994
9.55 $45,106
16.46
278 VFD Return Fan 20-100hp - Hotel CIP121 ($34)
0.99 $113
1.03 $1,184
1.42 $3,296
5.78
279 VFD Return Fan 20-100hp - Large Office CIP133 $22,492
7.89 $4,703
1.15 $32,017
8.33 $34,129
16.12
280 VFD Return Fan <20hp - Hospital CIE188 $7,189
6.02 $947
1.09 $9,799
6.68 $10,657
13.28
281 VFD Return Fan <20hp - Hotel CIE193 ($245)
0.66 ($70) 0.87 ($118)
0.80 $311
2.87
282 VFD Return Fan <20hp - Large Office CIE198 $4,917
4.43 $961
1.12 $7,165
5.57 $8,023
12.30
283 VFD Supply Fan <100hp - Hospital CIP132 $37,387
12.45 $5,784
1.12 $50,452
10.33 $52,564
16.95
284 VFD Supply Fan <100hp - Hotel CIP126 ($1,691)
0.48 ($451) 0.75 ($1,312)
0.51 $800
2.39
285 VFD Supply Fan <100hp - Large Office CIP138 $29,684
10.09 $5,903
1.15 $41,597
9.54 $43,709
16.85
286 VFD Tower Fan 20-100hp - Hospital CIP128 $12,755
4.91 $9,977
1.51 $25,967
8.03 $28,204
20.33
287 VFD Tower Fan 20-100hp - Hotel CIP122 $18,620
6.70 $13,857
1.51 $36,682
9.94 $38,919
21.86
288 VFD Tower Fan 20-100hp - Large Office CIP134 ($1,762)
0.46 $371
1.21 ($552)
0.79 $1,685
4.72
289 VFD Tower Fan <20hp - Hospital CIE189 $2,538
2.77 $2,268
1.47 $5,713
5.06 $6,643
14.95
290 VFD Tower Fan <20hp - Hotel CIE194 $3,946
3.75 $3,200 1.49 $8,284
6.51 $9,214
17.06
291 VFD Tower Fan <20hp - Large Office CIE199 ($946)
0.34 ($37)
0.93 ($652)
0.44 $279
2.19
292 Water Heater Pipe Insulation - 6' CDI139 $286,572 N/A ($43,293)
0.92 $374,055
4.44 $374,055
4.44
293 Water Heater Setback (manual adj) CDI140 $50,942 N/A ($52,784)
0.51 ($122)
1.00 ($122)
1.00
294 Window Film CIP139 $14
1.21 ($9) 0.89 $20
1.35 $47
2.50

2014 Integrated Resource Plan
Page 152
November 2014
2015 ELECTRIC DSM PLAN – CAUSE NO. 44495
Energy efficiency measures considered for the programs were developed using existing
Indiana utility program measures (whenever possible) and measures used in other
programs in the region. It should be noted that in any plan measures within programs
will change and adapt to changing technology and markets. The 2015 Plan shows a
framework of measures and programs that can meet the savings goals; however, it is
expected that new measures and opportunities will become available during this period
and that some measures will phase out as standards change and they are no longer
cost effective.
The technologies listed above were developed as a result of the EnerNOC MPS data
and other study information in order to guide the plan design. Vectren then hired
outside expertise to assist with plan design and development in order to refine the
technologies above into a workable plan. Additionally, input into the plan design was
obtained from various sources, such as current program managers and
implementation partners, in order to establish a solid foundation for the 2015 Plan
that is based on actual experience in Vectren’s territory. Other program information,
such as current evaluations and best practices of other successful DSM programs,
was used for adjustments to inputs. Lastly, Vectren received feedback and approval
from the Oversight Board before finalizing. The result of these efforts, listed in Table
8-4 below, shows the DSM Programs benefit/cost data per the portfolio of programs
filed under Cause No. 44495.

2014 Integrated Resource Plan
Page 153
November 2014
Table 8-4 Program Benefit/Cost Results for 2015 DSM Plan1
Commercial TRC UCT RIM Participant Small Business Direct Install 2.00 2.21 0.83 3.66
Commercial & Industrial Prescriptive 3.75 5.44 1.02 3.25
Commercial & Industrial New Construction 1.09 2.72 0.87 1.00
Commercial & Industrial Custom 1.64 3.82 0.93 1.52
Commercial Sector Portfolio 2.17 3.08 0.90 2.63
Residential TRC UCT RIM Participant Residential Lighting 2.18 2.88 0.85 2.94
Home Energy Assessments 1.02 1.02 0.56 NA
Income Qualified Weatherization 1.14 1.14 0.66 NA
Appliance Recycling 2.52 2.51 0.97 5.79
Residential Schools 1.89 1.89 0.72 NA
Efficient Products 1.51 2.02 1.05 1.13
Residential New Construction 1.28 1.52 0.75 1.89
Residential Behavior Savings 1.64 1.64 0.77 NA
Residential Sector Portfolio 1.49 1.64 0.77 3.36
Total Portfolio 1.86 2.34 0.85 2.89
Table 8-4 Program Benefit/Cost Results for 2015 DSM Plan Cont.2
Commercial Lifetime
Cost/ kWh 1st Year
Cost/ kWh Small Business Direct Install $0.04 $0.32
Commercial & Industrial Prescriptive $0.01 $0.15
Commercial & Industrial New Construction $0.03 $0.36
Commercial & Industrial Custom $0.02 $0.23
Commercial Sector Portfolio $0.03 $0.26
1 Commercial sector includes outreach costs for benefit/cost runs, and residential sector includes outreach and tracking costs for benefit/cost runs 2 Commercial sector includes outreach costs for benefit/cost runs, and residential sector includes outreach and tracking costs for benefit/cost runs

2014 Integrated Resource Plan
Page 154
November 2014
Residential Lifetime
Cost/kWh 1st Year
Cost/kWh Residential Lighting $0.03 $0.07
Home Energy Assessments $0.08 $0.35
Income Qualified Weatherization $0.07 $0.78
Appliance Recycling $0.04 $0.16
Residential Schools $0.04 $0.23
Efficient Products $0.06 $0.67
Residential New Construction $0.04 $0.92
Residential Behavior Savings $0.06 $0.07
Residential Sector Portfolio $0.05 $0.18
Total Portfolio $0.03 $0.21
Commercial TRC NPV $ UCT NPV $
Participant NPV $
RIM NPV $
Small Business Direct Install $2,116,270 $2,319,485 $2,311,703 ($888,566)
Commercial & Industrial Prescriptive $3,072,637 $3,419,025 $2,406,007 $76,945
Commercial & Industrial New Construction $40,071 $305,069 ($32) ($71,053)
Commercial & Industrial Custom $726,468 $1,376,727 ($26,798) $695,808
Commercial Sector Portfolio $5,805,446 $7,270,305 $5,193,787 ($1,181,366)
Residential TRC NPV $ UCT NPV $
Participant NPV $
RIM NPV $
Residential Lighting $929,179 $1,121,826 $1,838,832 ($307,982)
Home Energy Assessments $15,690 $15,690 $572,651 ($572,019)
Income Qualified Weatherization $115,688 $115,688 $416,861 ($468,781)
Appliance Recycling $320,800 $319,656 $470,616 ($15,444)
Residential Schools $113,569 $113,569 $182,611 ($94,479)
Efficient Products $352,915 $524,039 $82,526 $53,200
Residential New Construction $39,816 $61,965 $50,858 ($61,654)
Residential Behavior Savings $274,885 $274,885 $487,718 ($212,832)
Residential Sector Portfolio $1,992,542 $2,377,317 $4,102,673 ($1,849,991)
Total Portfolio $7,797,988 $9,647,622 $9,296,460 ($3,031,357)
The following programs were filed in the 2015 Plan in Cause No. 44495.

2014 Integrated Resource Plan
Page 155
November 2014
School Energy Efficiency Program
Program
The Energy Efficient Schools Program is designed to impact students by teaching them
how to conserve energy and to produce cost effective electric savings by influencing
students and their families to focus on conservation and the efficient use of electricity.
The program consists of a school education program for 5th grade students attending
schools served by Vectren. To help in this effort, each child that participates will receive
a take-home energy kit with various energy saving measures for their parents to install
in the home. The kits, along with the in-school teaching materials, are designed to
make a lasting impression on the students and help them learn ways to conserve
energy.
Eligible Customers
The program will be available to selected 5th grade students/schools in the Vectren
electric service territory.
Energy/Demand Savings
The proposed savings are attributed to the take-home kits provided to the elementary
school children for parents to install. For modeling purposes, the energy savings
estimate is 216 kWh per participant and .020 kW.

2014 Integrated Resource Plan
Page 156
November 2014
Table 8-5 School Energy Efficiency Program Data
Market ProgramNumber of
Participants
Energy Savings
kWh
Peak Demand kW
Total Program Budget $
Residential Residential Schools2015 2,600 560,786 52 128,033$
Per Participant Avg Energy Savings (kWh) 216Per Participant Avg Demand Savings (kW) 0.020Participant Incremental Cost -$ Weighted Avg Measure Life 7Net To Gross Ratio 96%
Residential Lighting Program
Program
The Residential Lighting Program is a market-based residential DSM program designed
to reach residential customers through retail outlets. The program design consists of a
buy-down strategy to provide the incentive to consumers to facilitate their purchase of
energy-efficient lighting products. This program is justified based on direct energy
savings targets, but also has a significant market transformation opportunity.
The program not only empowers customers to take advantage of new lighting
technologies and accelerate the adoption of proven energy efficient technologies, but
also allows the customers to experience the benefits of energy efficiency and decrease
their energy consumption.
Eligible Customers
Any residential customer who receives electric service from Vectren is eligible.
Energy/Demand Savings
The program is designed to provide an incentive for the purchase and installation of
CFL bulbs. For modeling purposes, the savings estimates per bulb are 32 kWh
annually with demand savings of 0.004 kW.
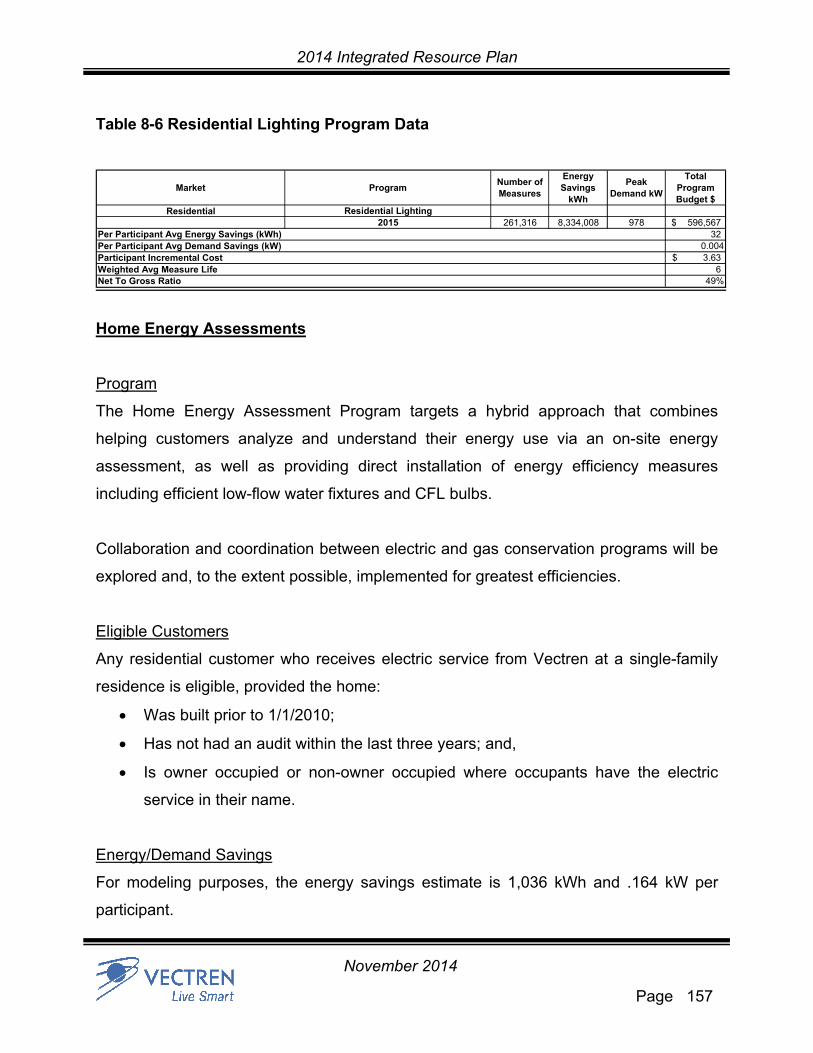
2014 Integrated Resource Plan
Page 157
November 2014
Table 8-6 Residential Lighting Program Data
Market ProgramNumber of Measures
Energy Savings
kWh
Peak Demand kW
Total Program Budget $
Residential Residential Lighting2015 261,316 8,334,008 978 596,567$
Per Participant Avg Energy Savings (kWh) 32 Per Participant Avg Demand Savings (kW) 0.004Participant Incremental Cost 3.63$ Weighted Avg Measure Life 6Net To Gross Ratio 49%
Home Energy Assessments
Program
The Home Energy Assessment Program targets a hybrid approach that combines
helping customers analyze and understand their energy use via an on-site energy
assessment, as well as providing direct installation of energy efficiency measures
including efficient low-flow water fixtures and CFL bulbs.
Collaboration and coordination between electric and gas conservation programs will be
explored and, to the extent possible, implemented for greatest efficiencies.
Eligible Customers
Any residential customer who receives electric service from Vectren at a single-family
residence is eligible, provided the home:
Was built prior to 1/1/2010;
Has not had an audit within the last three years; and,
Is owner occupied or non-owner occupied where occupants have the electric
service in their name.
Energy/Demand Savings
For modeling purposes, the energy savings estimate is 1,036 kWh and .164 kW per
participant.

2014 Integrated Resource Plan
Page 158
November 2014
Table 8-7 Home Energy Assessments Program Data
Market ProgramNumber of
Participants
Energy Savings
kWh
Peak Demand kW
Total Program Budget $
Residential Home Energy Assessments2015 2,000 2,072,900 328 716,163$
Per Participant Avg Energy Savings (kWh) 1,036 Per Participant Avg Demand Savings (kW) 0.164Participant Incremental Cost -$ Weighted Avg Measure Life 6Net To Gross Ratio 88%
Income Qualified Weatherization
Program
The Low Income Weatherization program is designed to produce long-term energy and
demand savings in the residential market. The program will provide weatherization
upgrades to low income homes that otherwise would not have been able to afford the
energy saving measures. The program will provide direct installation of energy saving
measures, educate consumers on ways to reduce energy consumption, and identify
opportunities for additional weatherization measures.
Collaboration and coordination between gas and electric low income programs along
with state and federal funding, is recommended to provide the greatest efficiencies
among all programs.
Eligible Customers
The Residential Low Income Weatherization Program targets single-family homeowners
and tenants, who have electric service in their name with Vectren and with a total
household income up to 200% of the federally-established poverty level. Priority will be
given to:
a. Single parent households with children under 18 years of age living in dwelling.
b. Households headed by occupants over 65 years of age.
c. Disabled homeowners as defined by the Energy Assistance Program (EAP).
d. Households with high energy intensity usage levels.

2014 Integrated Resource Plan
Page 159
November 2014
Energy/Demand Savings
For modeling purposes, the energy savings estimate is 1,822 kWh per participant
annually with demand savings of 0.453 kW.
Table 8-8 Income Qualified Weatherization Program Data
Market ProgramNumber of
Participants
Energy Savings
kWh
Peak Demand kW
Total Program Budget $
Residential Income Qualified Weatherization2015 564 1,027,651 256 798,474$
Per Participant Avg Energy Savings (kWh) 1,822 Per Participant Avg Demand Savings (kW) 0.453Participant Incremental Cost -$ Weighted Avg Measure Life 15Net To Gross Ratio 100%
Appliance Recycling
Program
The Residential Appliance Recycling program encourages customers to recycle their
old inefficient refrigerators and freezers in an environmentally safe manner. The
program recycles operable refrigerators or freezers so the appliance no longer uses
electricity and is recycled instead of being disposed of in a landfill. An older refrigerator
can use as much as twice the amount of energy as new efficient refrigerators. An
incentive of $50 will be provided to the customer for each operational unit picked up.
Eligible Customers
Any residential customer with an operable secondary refrigerator or freezer receiving
electric service from Vectren is eligible.
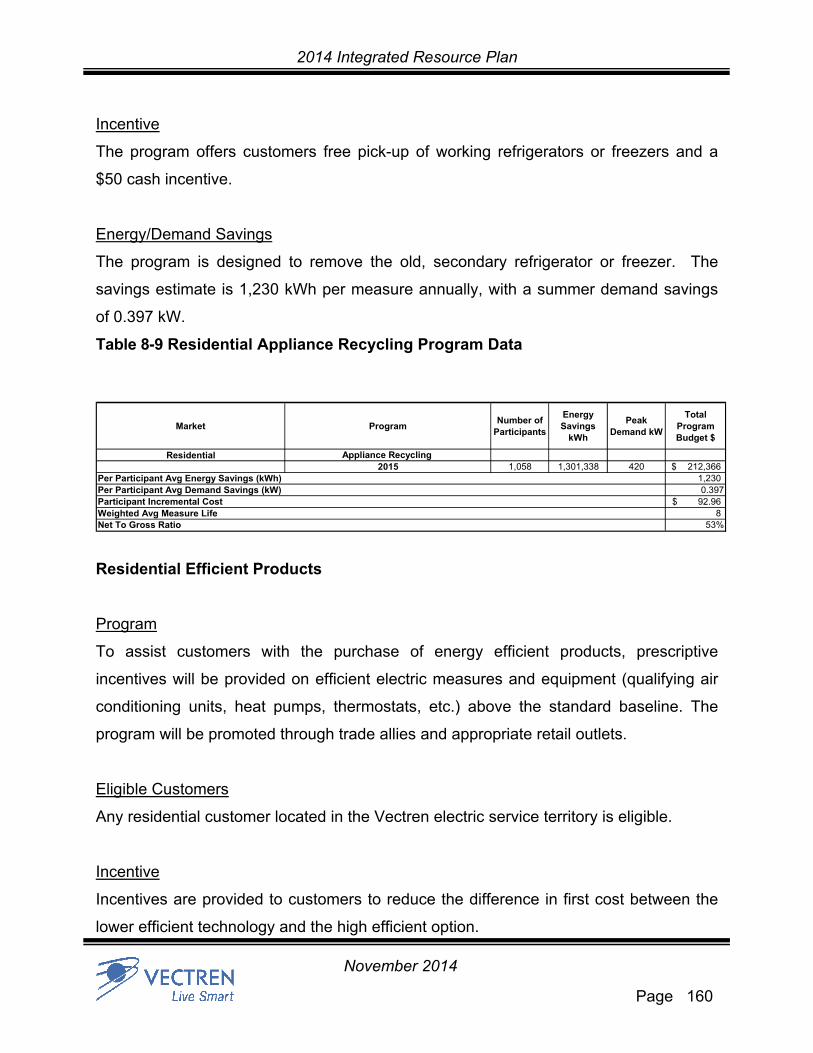
2014 Integrated Resource Plan
Page 160
November 2014
Incentive
The program offers customers free pick-up of working refrigerators or freezers and a
$50 cash incentive.
Energy/Demand Savings
The program is designed to remove the old, secondary refrigerator or freezer. The
savings estimate is 1,230 kWh per measure annually, with a summer demand savings
of 0.397 kW.
Table 8-9 Residential Appliance Recycling Program Data
Market ProgramNumber of
Participants
Energy Savings
kWh
Peak Demand kW
Total Program Budget $
Residential Appliance Recycling 2015 1,058 1,301,338 420 212,366$
Per Participant Avg Energy Savings (kWh) 1,230 Per Participant Avg Demand Savings (kW) 0.397Participant Incremental Cost 92.96$ Weighted Avg Measure Life 8Net To Gross Ratio 53%
Residential Efficient Products
Program
To assist customers with the purchase of energy efficient products, prescriptive
incentives will be provided on efficient electric measures and equipment (qualifying air
conditioning units, heat pumps, thermostats, etc.) above the standard baseline. The
program will be promoted through trade allies and appropriate retail outlets.
Eligible Customers
Any residential customer located in the Vectren electric service territory is eligible.
Incentive
Incentives are provided to customers to reduce the difference in first cost between the
lower efficient technology and the high efficient option.
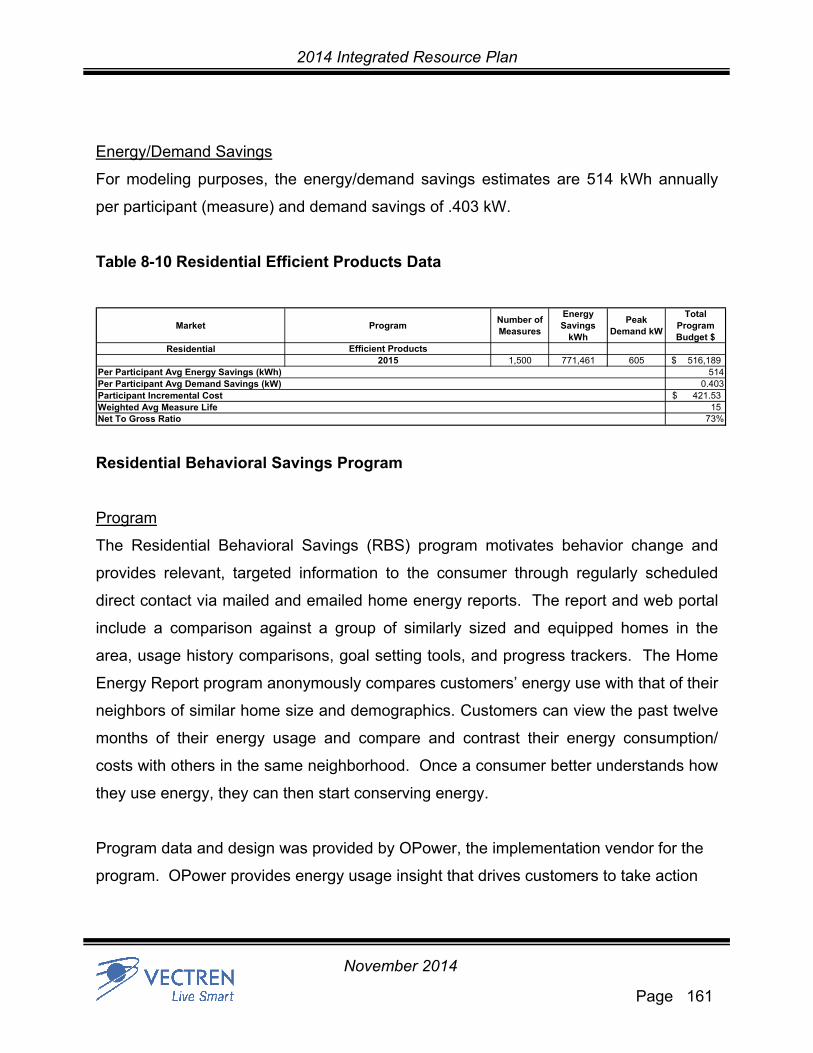
2014 Integrated Resource Plan
Page 161
November 2014
Energy/Demand Savings
For modeling purposes, the energy/demand savings estimates are 514 kWh annually
per participant (measure) and demand savings of .403 kW.
Table 8-10 Residential Efficient Products Data
Market ProgramNumber of Measures
Energy Savings
kWh
Peak Demand kW
Total Program Budget $
Residential Efficient Products2015 1,500 771,461 605 516,189$
Per Participant Avg Energy Savings (kWh) 514Per Participant Avg Demand Savings (kW) 0.403Participant Incremental Cost 421.53$ Weighted Avg Measure Life 15Net To Gross Ratio 73%
Residential Behavioral Savings Program
Program
The Residential Behavioral Savings (RBS) program motivates behavior change and
provides relevant, targeted information to the consumer through regularly scheduled
direct contact via mailed and emailed home energy reports. The report and web portal
include a comparison against a group of similarly sized and equipped homes in the
area, usage history comparisons, goal setting tools, and progress trackers. The Home
Energy Report program anonymously compares customers’ energy use with that of their
neighbors of similar home size and demographics. Customers can view the past twelve
months of their energy usage and compare and contrast their energy consumption/
costs with others in the same neighborhood. Once a consumer better understands how
they use energy, they can then start conserving energy.
Program data and design was provided by OPower, the implementation vendor for the
program. OPower provides energy usage insight that drives customers to take action

2014 Integrated Resource Plan
Page 162
November 2014
by selecting the most relevant information for each particular household, which ensures
maximum relevancy and high response rate to recommendations.
Eligible Customers
Residential customers who receive electric service from Vectren are eligible.
Energy/Demand Savings
To identify the measurable savings, Vectren proposes to have a set of customers who
receive the letter with energy tips and suggestions and a set of control customers who
do not receive the letter. The energy consumption of the 2 groups will be compared to
determine the measurable savings. For modeling purposes, the annual energy savings
was estimated at 126 kWh per participant with demand savings of .041 kW.
Table 8-11 Residential Behavioral Savings Program Data
Market ProgramNumber of
Participants
Energy Savings
kWh
Peak Demand kW
Total Program Budget $
Residential Behavioral Savings2015 50,400 6,350,400 2,051 432,202$
Per Participant Avg Energy Savings (kWh) 126Per Participant Avg Demand Savings (kW) 0.041Participant Incremental Cost -$ Weighted Avg Measure Life 1Net To Gross Ratio 100%
Residential New Construction
Program
The Residential New Construction Program will provide incentives and encourage home
builders to construct homes that are more efficient than current building codes. The
Residential New Construction Program will work closely with builders, educating them
on the benefits of energy efficient new homes. Homes may feature additional
insulation, better windows, and higher efficiency appliances. The homes should also be
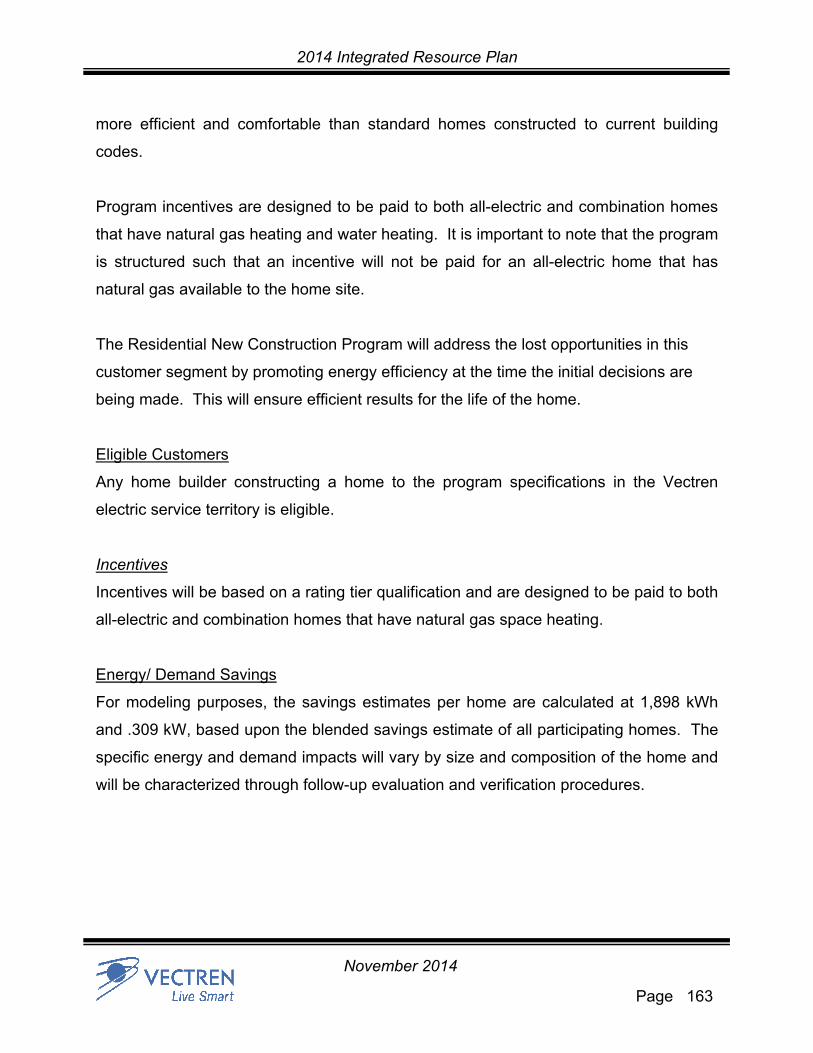
2014 Integrated Resource Plan
Page 163
November 2014
more efficient and comfortable than standard homes constructed to current building
codes.
Program incentives are designed to be paid to both all-electric and combination homes
that have natural gas heating and water heating. It is important to note that the program
is structured such that an incentive will not be paid for an all-electric home that has
natural gas available to the home site.
The Residential New Construction Program will address the lost opportunities in this
customer segment by promoting energy efficiency at the time the initial decisions are
being made. This will ensure efficient results for the life of the home.
Eligible Customers
Any home builder constructing a home to the program specifications in the Vectren
electric service territory is eligible.
Incentives
Incentives will be based on a rating tier qualification and are designed to be paid to both
all-electric and combination homes that have natural gas space heating.
Energy/ Demand Savings
For modeling purposes, the savings estimates per home are calculated at 1,898 kWh
and .309 kW, based upon the blended savings estimate of all participating homes. The
specific energy and demand impacts will vary by size and composition of the home and
will be characterized through follow-up evaluation and verification procedures.
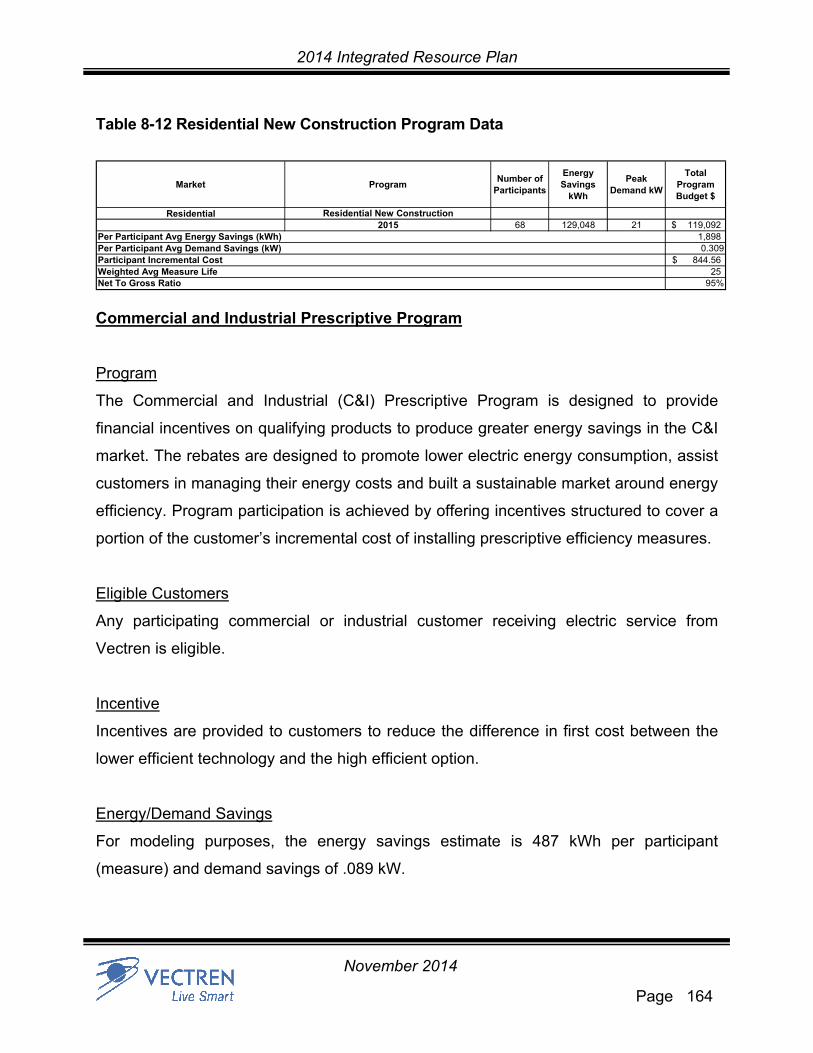
2014 Integrated Resource Plan
Page 164
November 2014
Table 8-12 Residential New Construction Program Data
Market ProgramNumber of
Participants
Energy Savings
kWh
Peak Demand kW
Total Program Budget $
Residential Residential New Construction2015 68 129,048 21 119,092$
Per Participant Avg Energy Savings (kWh) 1,898 Per Participant Avg Demand Savings (kW) 0.309Participant Incremental Cost 844.56$ Weighted Avg Measure Life 25Net To Gross Ratio 95%
Commercial and Industrial Prescriptive Program
Program
The Commercial and Industrial (C&I) Prescriptive Program is designed to provide
financial incentives on qualifying products to produce greater energy savings in the C&I
market. The rebates are designed to promote lower electric energy consumption, assist
customers in managing their energy costs and built a sustainable market around energy
efficiency. Program participation is achieved by offering incentives structured to cover a
portion of the customer’s incremental cost of installing prescriptive efficiency measures.
Eligible Customers
Any participating commercial or industrial customer receiving electric service from
Vectren is eligible.
Incentive
Incentives are provided to customers to reduce the difference in first cost between the
lower efficient technology and the high efficient option.
Energy/Demand Savings
For modeling purposes, the energy savings estimate is 487 kWh per participant
(measure) and demand savings of .089 kW.

2014 Integrated Resource Plan
Page 165
November 2014
Table 8-13 Commercial and Industrial Prescriptive Program Data
Market ProgramNumber of Measures
Energy Savings
kWh
Peak Demand kW
Total Program Budget $
Commercial & Industrial Commercial & Industrial Prescriptive2015 10,470 5,103,942 935 769,573$
Per Participant Avg Energy Savings (kWh) 487Per Participant Avg Demand Savings (kW) 0.089Participant Incremental Cost 102.29$ Weighted Avg Measure Life 14Net To Gross Ratio 80%
Commercial and Industrial Audit and Custom Efficiency Program
Program
The Commercial and Industrial Custom Program promote the implementation of
customized energy saving measures at qualifying customer facilities. Incentives
promoted through this program serve to reduce the cost of implementing energy
reducing projects and upgrading to high-efficiency equipment. Due to the nature of a
custom energy efficiency program, a wide variety of projects are eligible.
The technical audit or compressed air system study offers an assessment to
systematically identify energy saving opportunities for customers and provides a
mechanism to prioritize and phase-in projects that best meet customer needs. In turn,
the opportunities identified from the audit can be turned in for the customized efficiency
program. These two components work hand in hand to deliver energy savings to
Vectren commercial and industrial customers.
Eligible Customers
Any participating commercial or industrial customer receiving electric service from
Vectren is eligible.
2014 Integrated Resource Plan
Page 166
November 2014
Incentive
Vectren will provide a customer incentive based on the estimated kWh savings at a
modeled rate of .12 cents per kWh, and is paid based on the first year annual savings
reduction.
Energy/Demand Savings
The custom nature of the program makes it difficult to develop a prototypical example.
Each building will have very site specific projects and impacts. For modeling purposes
the energy/demand savings estimates are 95,248 kWh per participant (measure) and
demand savings of 15.455 kW.
Table 8-14 Commercial and Industrial Audit & Custom Efficiency Program Data
Market ProgramNumber of Projects
Energy Savings
kWh
Peak Demand kW
Total Program Budget $
Commercial & Industrial Commercial & Industrial Custom2015 22 2,095,450 340 488,274$
Per Participant Avg Energy Savings (kWh) 95,248 Per Participant Avg Demand Savings (kW) 15.455Participant Incremental Cost 41,400.96$ Weighted Avg Measure Life 12Net To Gross Ratio 99%
Commercial and Industrial New Construction Program
Program
The Commercial and Industrial New Construction Program provides value by promoting
energy efficient designs with the goal of developing projects that are more energy
efficient than current Indiana building code. Incentives promoted through this program
serve to reduce the incremental cost to upgrade to high-efficiency equipment over
standard efficiency options for Vectren customers. The program includes equipment
with easily calculated savings and provides straightforward and easy participation for
customers.
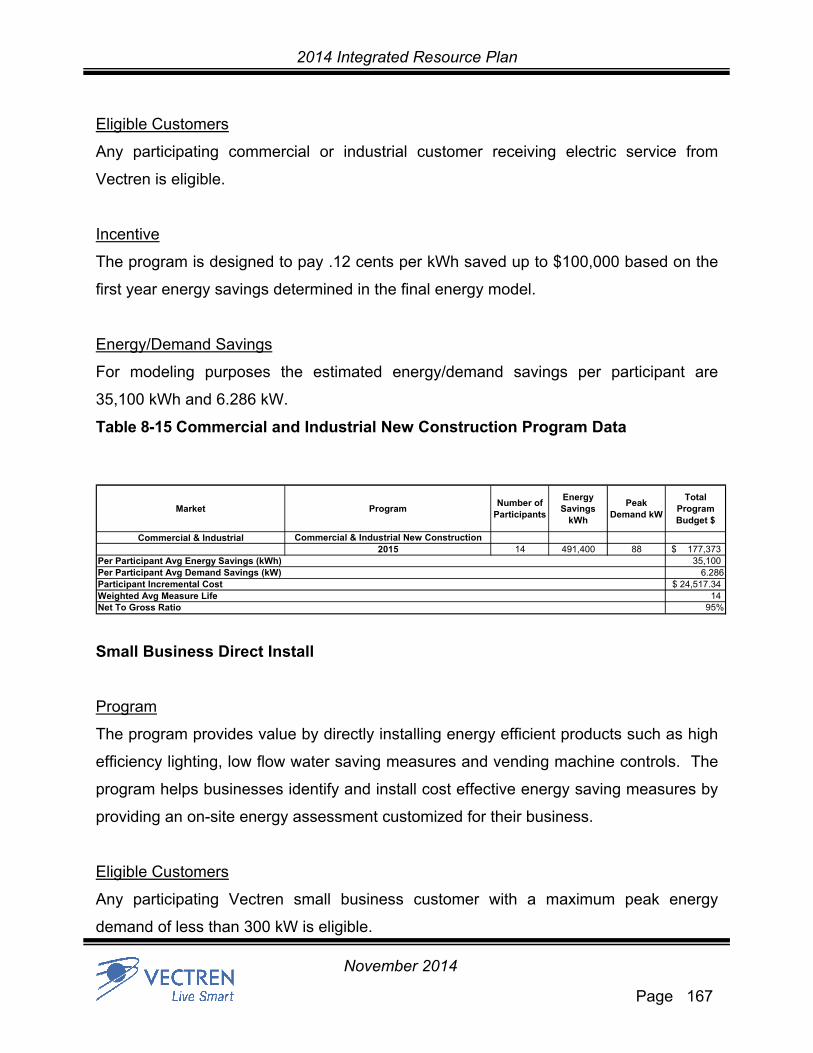
2014 Integrated Resource Plan
Page 167
November 2014
Eligible Customers
Any participating commercial or industrial customer receiving electric service from
Vectren is eligible.
Incentive
The program is designed to pay .12 cents per kWh saved up to $100,000 based on the
first year energy savings determined in the final energy model.
Energy/Demand Savings
For modeling purposes the estimated energy/demand savings per participant are
35,100 kWh and 6.286 kW.
Table 8-15 Commercial and Industrial New Construction Program Data
Market ProgramNumber of
Participants
Energy Savings
kWh
Peak Demand kW
Total Program Budget $
Commercial & Industrial Commercial & Industrial New Construction2015 14 491,400 88 177,373$
Per Participant Avg Energy Savings (kWh) 35,100 Per Participant Avg Demand Savings (kW) 6.286Participant Incremental Cost 24,517.34$ Weighted Avg Measure Life 14Net To Gross Ratio 95%
Small Business Direct Install
Program
The program provides value by directly installing energy efficient products such as high
efficiency lighting, low flow water saving measures and vending machine controls. The
program helps businesses identify and install cost effective energy saving measures by
providing an on-site energy assessment customized for their business.
Eligible Customers
Any participating Vectren small business customer with a maximum peak energy
demand of less than 300 kW is eligible.
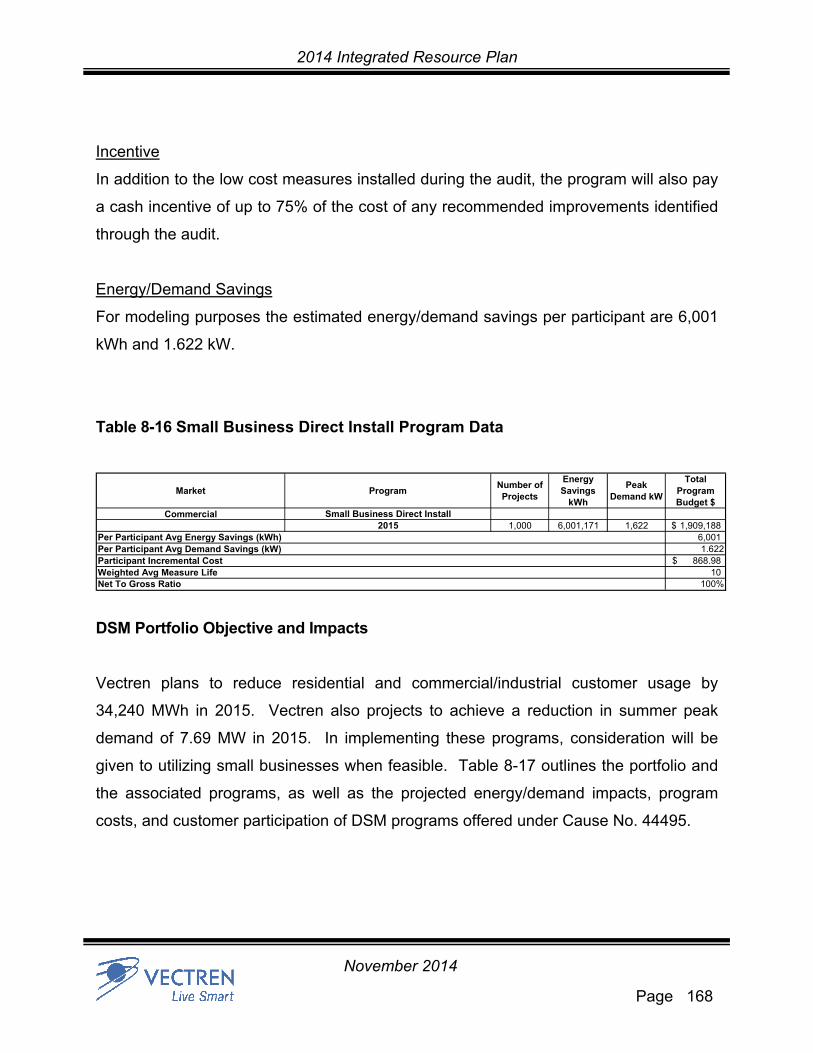
2014 Integrated Resource Plan
Page 168
November 2014
Incentive
In addition to the low cost measures installed during the audit, the program will also pay
a cash incentive of up to 75% of the cost of any recommended improvements identified
through the audit.
Energy/Demand Savings
For modeling purposes the estimated energy/demand savings per participant are 6,001
kWh and 1.622 kW.
Table 8-16 Small Business Direct Install Program Data
Market ProgramNumber of Projects
Energy Savings
kWh
Peak Demand kW
Total Program Budget $
Commercial Small Business Direct Install2015 1,000 6,001,171 1,622 1,909,188$
Per Participant Avg Energy Savings (kWh) 6,001 Per Participant Avg Demand Savings (kW) 1.622Participant Incremental Cost 868.98$ Weighted Avg Measure Life 10Net To Gross Ratio 100%
DSM Portfolio Objective and Impacts
Vectren plans to reduce residential and commercial/industrial customer usage by
34,240 MWh in 2015. Vectren also projects to achieve a reduction in summer peak
demand of 7.69 MW in 2015. In implementing these programs, consideration will be
given to utilizing small businesses when feasible. Table 8-17 outlines the portfolio and
the associated programs, as well as the projected energy/demand impacts, program
costs, and customer participation of DSM programs offered under Cause No. 44495.
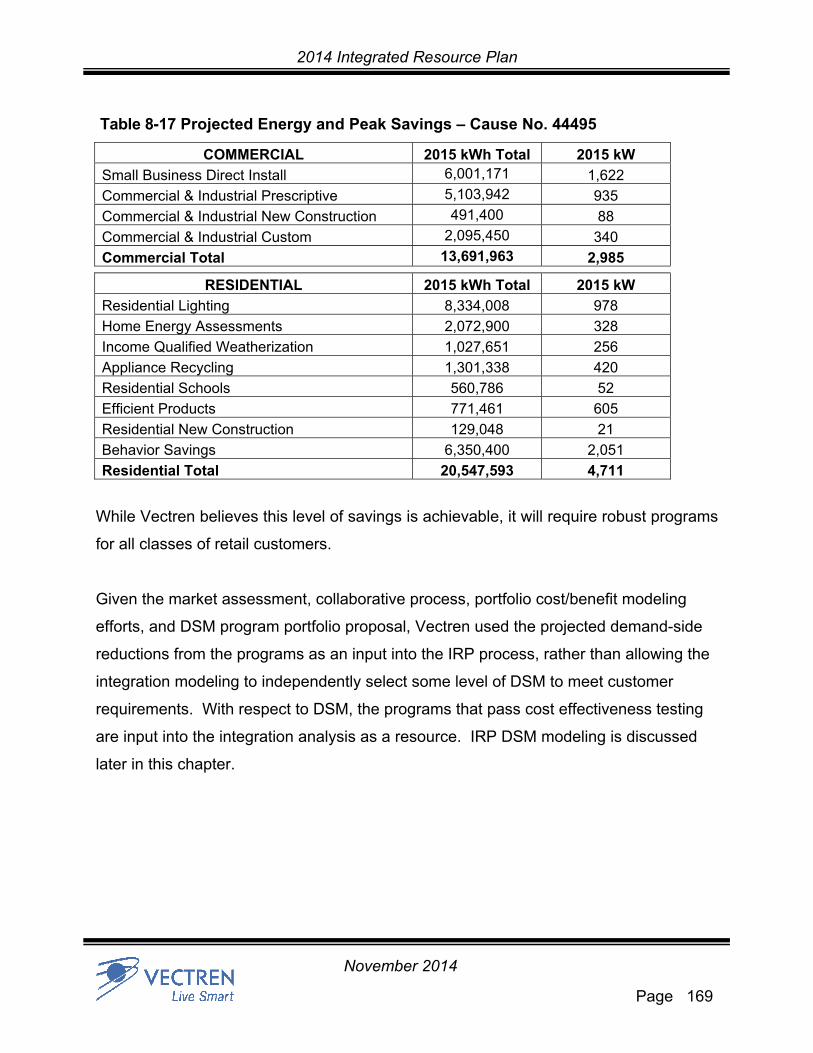
2014 Integrated Resource Plan
Page 169
November 2014
Table 8-17 Projected Energy and Peak Savings – Cause No. 44495
COMMERCIAL 2015 kWh Total 2015 kW
Small Business Direct Install 6,001,171 1,622
Commercial & Industrial Prescriptive 5,103,942 935
Commercial & Industrial New Construction 491,400 88
Commercial & Industrial Custom 2,095,450 340
Commercial Total 13,691,963 2,985
RESIDENTIAL 2015 kWh Total 2015 kW
Residential Lighting 8,334,008 978
Home Energy Assessments 2,072,900 328
Income Qualified Weatherization 1,027,651 256
Appliance Recycling 1,301,338 420
Residential Schools 560,786 52
Efficient Products 771,461 605
Residential New Construction 129,048 21
Behavior Savings 6,350,400 2,051
Residential Total 20,547,593 4,711
While Vectren believes this level of savings is achievable, it will require robust programs
for all classes of retail customers.
Given the market assessment, collaborative process, portfolio cost/benefit modeling
efforts, and DSM program portfolio proposal, Vectren used the projected demand-side
reductions from the programs as an input into the IRP process, rather than allowing the
integration modeling to independently select some level of DSM to meet customer
requirements. With respect to DSM, the programs that pass cost effectiveness testing
are input into the integration analysis as a resource. IRP DSM modeling is discussed
later in this chapter.
2014 Integrated Resource Plan
Page 170
November 2014
Customer Outreach and Education
Program
This program will raise awareness and drive customer participation as well as educate
customers on how to manage their energy bills. The program will include the following
goals as objectives:
Build awareness;
Educate consumers on how to conserve energy and reduce demand;
Educate customers on how to manage their energy costs and reduce their bill;
Communicate Vectren’s support of customer energy efficiency needs; and
Drive participation in the DSM programs.
This annual program will include paid media, web-based tools to analyze bills, energy
audit tools, and energy efficiency and DSM program education and information.
Informational guides and sales promotion materials for specific programs will also be
included.
Vectren will oversee the outreach and education programs for the DSM programs.
Vectren will utilize the services of communication and energy efficiency experts to
deliver the demand and energy efficiency message.
Eligible Customers
Any Vectren electric customer will be eligible.
Energy/Demand Savings
This communications effort differs from typical DSM programs in that there are no direct
estimates of participants, savings, costs, and cost-effectiveness tests. Such estimates
are considered impractical for these types of overarching efforts to educate consumers
and drive participation in other DSM programs. The California Standard Practice
Manual (p. 5) addresses this issue as follows:
2014 Integrated Resource Plan
Page 171
November 2014
“For generalized information programs (e.g., when customers are provided
generic information on means of reducing utility bills without the benefit of on-site
evaluations or customer billing data), cost-effectiveness tests are not expected
because of the extreme difficulty in establishing meaningful estimates of load
impacts.”
This effort is the key to achieving greater energy savings by convincing the families and
businesses making housing/facility, appliance and equipment investments to opt for
greater energy efficiency. The first step in convincing the public and businesses to
invest in energy efficiency is to raise their awareness. It is essential that a broad public
education and outreach campaign not only raise awareness of what consumers can do
to save energy and control their energy bills, but to prime them for participation in the
various DSM programs. The budget is $150,000 each for Residential and Commercial
programs, for a total of $300,000.
Table 8-18 DSM Outreach & Education Program Budget
Customer Outreach Residential Business Total Program
Costs
Outreach $150,000 $150,000 $300,000
IRP DSM MODELING
Vectren continues to support DSM related energy efficiency efforts as a fundamental
part of the services that are provided to customers in order to help them manage their
energy bills. The Market Potential study, developed by EnerNoc on behalf of the
Vectren Oversight Board, illustrated a level of ongoing DSM energy efficiency is cost
effective and Vectren believes the inclusion of the described level of ongoing DSM
energy efficiency is best reflected in the base case sales forecast. DSM energy
efficiency programs included in the base sales forecast are available to all customer
classes at a targeted level of 1% eligible annual savings for 2015 – 2019 and 0.5%
2014 Integrated Resource Plan
Page 172
November 2014
annually thereafter for customer load that has not opted-out of DSM programs. Vectren
believes that a cost effective level of DSM energy efficiency may be supported by policy
considerations beyond capacity planning which are not always captured in the IRP
modeling process.
Vectren did model the option of offering DSM energy efficiency programs designed to
achieve more than the level reflected in the base case sales forecast to determine if it is
selected as a resource to meet future electric requirements. Vectren’s approach
attempts to balance its commitment to a level of cost-effective DSM, while evaluating
additional DSM resources consistent with least cost planning. Below is a list of major
assumptions included in Vectren’s IRP DSM modeling.
Vectren began by creating savings blocks based on 0.5% of eligible sales based on a
projection that 80% of large customers will opt out of Vectren sponsored DSM
programs. The maximum amount of possible additional DSM that could be selected
was 2% (embedded savings + additional modeled blocks) in 2018-2019. Beyond 2019,
the model was limited to selecting 1.5% (embedded + additional modeled blocks) of
total eligible sales, consistent with the proposed Clean Power Plan (111d). Levelized
costs were based on the Market Potential study and Vectren’s 2015 Plan. Consistent
with the Market Potential study, each block cost more than the last and increased over
time. Levelized costs of energy saved began at approximately 3 cents per kWh for the
first available block in 2015 and increased to approximately 6.4 cents for the last
available block in 2034. In order to minimize ramping costs, DSM programs were
required to run for at least 3 consecutive years.
Based on these assumptions, DSM successfully competed with resource alternatives
within the planning model to help meet future load requirements. DSM was selected in
several resource plans as discussed further in Chapter 10 Generation Planning.

2014 Integrated Resource Plan
Page 173
November 2014
This page intentionally left blank for formatting purposes
2014 Integrated Resource Plan
Page 174
November 2014
CHAPTER 9
TRANSMISSION AND DISTRIBUTION PLANNING

2014 Integrated Resource Plan
Page 175
November 2014
INTRODUCTION
In accordance with IURC Rule 170 IAC, Vectren analyzed its transmission and
distribution system's ability to meet future electric service requirements reliably and
economically through the year 2034. This chapter describes the criteria applied in the
analysis and the system conditions studied. The study was conducted to maintain
compliance with the requirements of the Midcontinent Independent System Operator
(MISO), the Reliability First (RF) in conjunction with NERC requirements, as well as
Vectren’s internal planning criteria. Internal Long Range Plans are completed annually.
In addition, Vectren has worked closely with MISO Transmission Expansion Plans
(MTEP) and RF in performing regional studies, which include proposed projects
identified in Vectren studies.
Modeling of the transmission system was conducted with steady-state conditions using
the Power Technologies Inc.’s Power System Simulator Program for Engineers (PTI-
PSS/E). The models and the studies and assessment on these models comply with all
NERC, RF, MISO and IURC requirements, and they include real and reactive flows,
voltages, generation dispatch, load, and facilities appropriate for the time period studied.
The primary criteria for assessing the adequacy of the internal Vectren transmission
system were (1) single contingency outages of transmission lines and transformers
during peak conditions, and (2) selected double and multiple contingencies.
Interconnections were also assessed by examining single, double, and other multiple
contingencies.
In addition, short circuit models were developed and analyzed through the use of
Advanced Systems for Power Engineering, Inc.’s short circuit program (ASPEN-
OneLiner).

2014 Integrated Resource Plan
Page 176
November 2014
Dynamic simulation was also performed using PTI-PSS/E to examine the performance
of the interconnected transmission system to various electrical faults. The Vectren
system remains stable for a variety of faulted conditions.
METHODOLOGY
The distribution system review covers native load as described in previous chapters in
this IRP. The Transmission system review also covers loads connected to Vectren’s
transmission system such as municipals and Independent Power Producers (IPP’s) that
Vectren is not obligated to serve or include in its generation resources. The primary
reason is to determine impacts or limitations in the transmission capacity to serve the
Vectren native load. Vectren adheres to the transmission planning criteria developed
and published by MISO in its document MISO Transmission Expansion Planning;
(MTEP) and by RF through NERC in its Reliability Standards under Transmission
Planning (TPL-001 through TPL-004).
The basis for the selection of RF reliability criteria offers five points for member
recognition.
1. The need to plan bulk electric systems that will withstand adverse credible
disturbances without experiencing uncontrolled interruptions.
2. The importance of providing a high degree of reliability for local power
supply but the impossibility of providing 100 percent reliability to every
customer or every local area.
3. The importance of considering local conditions and requirements in
establishing transmission reliability criteria for the local area power supply
and the need, therefore, to view reliability in local areas primarily as the
responsibility of the individual RFC members. However, local area

2014 Integrated Resource Plan
Page 177
November 2014
disturbances must not jeopardize the overall integrity of the Bulk Electric
System.
4. The importance of mitigating the frequency, duration and extent of major
Bulk Electric System outages.
5. The importance of mitigating the effect of conditions that might result from
events such as national emergencies, strikes, or major outages on other
regional networks.
SYSTEM INTEGRITY ANALYSIS – 2013 (SEASONAL ANNUAL, INCLUDES
SPRING, SUMMER, FALL, AND WINTER)
Based on initial conditions for load, generation, and system topology the following tests
were conducted.
1. Single contingency:
Outage of any line
Outage of any transformer
Outage of any generator
2. Multiple contingencies:
Double outage of any combination of generators, lines and transformers
Double outages of generators
Sensitivity outages: two lines or transformers under different Generation
dispatch scenarios
3. Extreme Contingencies:
Loss of all generation at a plant site
Loss of entire switchyard with associated load, generation and line connectivity
where three or more 100kV or higher voltage lines are connected
2014 Integrated Resource Plan
Page 178
November 2014
As a result of these tests, various system operational or construction improvements
have been postulated. These improvements may be either operator action, (such as
shifting generation or switching lines), or the installation of actual substations, the
construction of transmission lines, or the upgrading of facilities. Required construction
improvements have been prioritized by where they fall in the contingency spectrum.
Improvements that must be made in response to a single line outage have higher
priority than improvements resulting from a more unlikely occurrence.
SYSTEM INTEGRITY ANALYSIS – 2018 (NEAR TERM – WITHIN 1-5 YEARS)
Using updated load and generation forecasts and included planned upgrades, the same
analysis is performed for the 2013 system. Contingency analysis is also the same as
for the 2013 system.
SYSTEM INTEGRITY ANALYSIS – 2022 (LONG TERM – 6-10 YEARS)
Using updated load and generation forecasts and included planned upgrades, the same
analysis is performed for the 2013 system. Contingency analysis is the same as for the
2013 system.
TRANSMISSION ADEQUACY SUMMARY TABLE
Table 9-1 shows the Vectren generation and load resources, as summarized from
previous chapters, as well as the generation and load resources expected to be served
from the transmission system for the entire Vectren Local Balancing Authority (LBA) as
coordinated by MISO.

2014 Integrated Resource Plan
Page 179
November 2014
Table 9-1 Transmission Import Adequacy/Shortfall Assessment
Year
Vectren
Available
Gen (MW)1
IPP’s &
other Gen
(MW)
Vectren Firm
Peak Demand
(MW)2
Muni’s &
Other Load
(MW)
Proj. Inter-
Change (MW)
Trans. System
Import Cap
(MW)
2014 1,155 596 1,145 690 -84 728
2015 1,155 680 1,155 690 -10 802
2016 1,155 680 1,156 690 -11 801
2017 1,155 680 1,113 690 32 844
2018 1,155 680 1,109 690 36 848
2019 1,155 680 1,106 690 39 851
2020 1,155 680 1,106 690 39 851
2021 1,155 680 1,106 690 39 851
2022 1,155 680 1,107 690 38 850
2023 1,155 680 1,107 690 38 850
2024 1,155 680 1,107 690 38 850
2025 1,155 680 1,106 690 39 851
2026 1,155 680 1,106 690 39 851
2027 1,155 680 1,107 690 38 850
2028 1,155 680 1,109 690 36 848
2029 1,155 680 1,110 690 35 847
2030 1,155 680 1,111 690 34 846
2031 1,155 680 1,111 690 34 846
2032 1,155 680 1,113 690 32 844
2033 1,155 680 1,114 690 31 843
2034 1,155 680 1,115 690 30 842
The table reflects that if all available internal generation is on line the expected net
interchange would be negative for years 2014 through 2016 and positive or exporting
for all years beyond 2017. This reliability measure indicates that additional import
transmission capacity is not needed for our generation to serve our load. However, the
table does not reflect several other factors such as potential purchases and sales. The 1 Values from Table 10-1 Characteristics of Existing Generation Resources 2 Values from Table 5-4 Base Case Demand Forecast

2014 Integrated Resource Plan
Page 180
November 2014
table reflects total generation capability and not a reasonable economic dispatch under
all conditions. It is likely that renewable energy resources may be imported using the
transmission system in lieu of running local generation. It is assumed that the gas
peaking turbines would likely not be dispatched during some near peak summer
conditions, in which it is not only possible, but likely that the expected interchange could
be importing 300-400 MW. These values are also supported by actual historical
interchange. In any event, MISO will dispatch the available resources to serve the load
based on N-1 contingency analysis and economics and losses. With the largest
generation resource on the Vectren system at 300 MW, the transmission system
capacity is adequate under reasonable expected resource dispatches and
contingencies and additional growth. Within each PSS/E case, the actual load,
generation dispatch, firm purchases and sales, and expected interchange is appropriate
for the time period.
RECOMMENDATIONS: 2014 - 2034
No transmission facilities were identified specifically due to proposed generation
interconnections, transmission service requests or energy resources in this IRP
process. Since the projected load growth is essentially flat and no new generation
resources or retirements are planned, no new transmission facilities have been
identified. In addition, significant upgrades were constructed in 2012 as a result of the
MISO Regional Expansion Criteria and Benefits (RECB) process. The completed
projects include the construction of a new 345 kV line from the Duke Gibson Station to
the Vectren AB Brown Station to the BREC Reid Station. The Duke Gibson to Vectren
AB Brown to BREC Reid EHV Substation is complete and energized. This project also
included the construction of a 345/138 kV substation at Vectren’s AB Brown Station
which is also complete. A new 138kV line (Z77) from FB Culley Substation to Oak
Grove Substation to Northeast Substation is complete. This facility allows for better
generation dispatch diversity with lower congestion costs under contingencies.
However, recent generation and load changes in the Commonwealth of Kentucky are

2014 Integrated Resource Plan
Page 181
November 2014
expected to impact the Vectren system due to flow through congestion. MISO is
considering Market Congestion Projects for mitigation of the projected congestion costs,
and a project will only move forward if the benefits exceed the costs metric. Multiple
distribution substation upgrades were completed to include Bergdolt and Libbert
Substations. Leonard Rd 69kV Switching substation should be complete in 2014 and
will support a greater number of contingencies for substransmission on Evansville’s
west side. Demand side management and energy conservation is expected to provide
some load reduction on the Vectren system.
Local load growth areas have been identified for potential new business loads. Near
term projections indicate the need for at least 2 more distribution substations tentatively
identified as Roesner Road and Princeton South areas, as well as potentially a new
plant.
The specific projects to be completed in the future years will depend on the load growth,
the location of generation facilities, and/or on the source of purchased power. General
recommendations are as follows:
1. A number of 69 kV transmission upgrades will be needed. An
engineering evaluation will be conducted for upgrading the identified
lines to higher operating temperature and for reconductoring some lines.
2. A number of substations will need to be modified.
3. Several new 138 and 69 kV lines and substations are planned to be
added in this timeframe.
4. New high voltage interconnections with neighboring utilities are being
investigated, including 345 kV facilities, to improve import capability and
improve regional reliability.
5. If new generation capacity is added within the Vectren system,
transmission facilities would also be planned to incorporate the new
power source.

2014 Integrated Resource Plan
Page 182
November 2014
6. If new generation capacity were acquired outside the Vectren system,
additional new interconnections may be needed. These projects would
be investigated and would require involvement of other utilities.
All of these potential transmission projects would be planned with and coordinated
through the MISO.
COST PROJECTIONS:
Vectren is projecting its annual transmission, substation, and distribution expenditures
to remain flat to slightly decrease over the next five years. The primary factors are that
there is not a recommendation to add new generation sources in this IRP that causes
new construction and the existing transmission system is adequate for full deliverability
of the existing generation sources. A reason for part of the decrease is the 345kV
project was completed in 2012 and spending in following years are expected to be
lower. However, the Federal Stimulus Plan funding is expected to force some
transmission and distribution relocations increasing in some areas due to roadway
improvements. Approximately half of these are expected to be reimbursable with the
remaining cost incurred by Vectren. Also, increasing demands for Smart Grid
technology and infrastructure are resulting in some additional expenditure. New
business and load growth forecast is expected to stay relatively flat. The need for
import capability due to generation additions and retirements are expected to remain
mostly unchanged as well. Tables 9-2 and 9-3 reflect both previous annual costs and
projected annual spend:
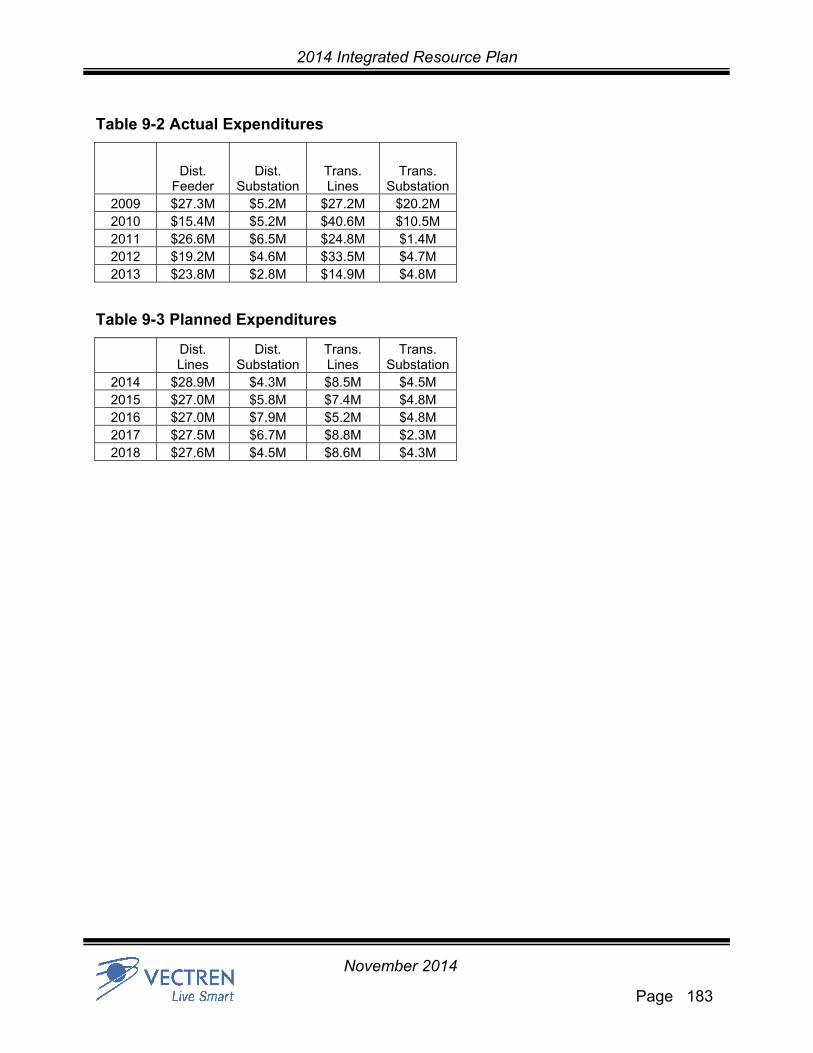
2014 Integrated Resource Plan
Page 183
November 2014
Table 9-2 Actual Expenditures
Dist.
Feeder Dist.
Substation Trans. Lines
Trans. Substation
2009 $27.3M $5.2M $27.2M $20.2M 2010 $15.4M $5.2M $40.6M $10.5M 2011 $26.6M $6.5M $24.8M $1.4M 2012 $19.2M $4.6M $33.5M $4.7M 2013 $23.8M $2.8M $14.9M $4.8M
Table 9-3 Planned Expenditures
Dist. Lines
Dist. Substation
Trans. Lines
Trans. Substation
2014 $28.9M $4.3M $8.5M $4.5M 2015 $27.0M $5.8M $7.4M $4.8M 2016 $27.0M $7.9M $5.2M $4.8M 2017 $27.5M $6.7M $8.8M $2.3M 2018 $27.6M $4.5M $8.6M $4.3M

2014 Integrated Resource Plan
Page 184
November 2014
This page intentionally left blank for formatting purposes

2014 Integrated Resource Plan
Page 185
November 2014
CHAPTER 10
GENERATION PLANNING
2014 Integrated Resource Plan
Page 186
November 2014
INTRODUCTION
The purpose of the generation plan is to develop the optimal strategy for adding the
resources as necessary to reliably meet the future demand requirements of Vectren’s
electric customers. The plan is integrated in that both supply-side and demand-side
alternatives were considered and evaluated. The optimal plan is defined as the best
possible combination of resource additions that result in reliable service at the lowest
cost to customers over the twenty year planning horizon. The optimal resource plan is
determined by evaluating all of the possible resource combinations and choosing the
plan that minimizes the Net Present Value (NPV).
APPROACH
The process of determining the best resource plan was approached as an optimization
problem. Vectren’s consultant, Burns and McDonnell, utilized the Strategist software
tool developed and supported by Ventyx of Atlanta, GA. Strategist is a strategic
planning system that integrates financial, resource, marketing, and customer
information. Strategist allows for addressing all aspects of integrated planning at the
level of detail required for informed decision making. Strategist handles production
costing, capital expenditure and recovery, financial and tax implications, and
optimization all within one software system.
An optimization method has three elements: an objective, constraints, and alternatives.
For the electric integration process, the three elements can be summarized as follows:
Objective
The objective of the integration analysis was to determine the optimal resource plan by
minimizing the NPV. For the purposes of this discussion, the planning period NPV is
defined as the net present value of operating costs including fuel plus capital costs.
Power purchases and sales are also included in the NPV analysis for the 20 year
period, 2015 – 2034. NPV numbers were developed by integrating three scenarios with
four different energy forecasts. The generation options within the scenarios, along with

2014 Integrated Resource Plan
Page 187
November 2014
the alternative generation (discussed in Chapter 6 Electric Supply Analysis and Chapter
7 Renewables and Clean Energy), additional DSM (discussed in Chapter 8 DSM
Resources) and purchasing capacity from the market were compared against the
capacity needs of the four energy forecasts yielding twelve plans of the least cost NPV.
These twelve plans were then vetted against multiple sensitivities to see which plan
would be the most versatile given a wide range of possible outcomes.
Constraints
The primary constraint was to maintain a minimum planning reserve margin (PRM).
MISO has moved to an unforced capacity (UCAP) PRM in the last couple of years. The
UCAP accounts for the amount of installed capacity (ICAP) or nameplate capacity
available at system’s mega-watt peak hour of the peak day after discounting for the time
that the generating facility is not available due to historical outages such as
maintenance and repairs. The UCAP PRM is subject to change each year depending
on MISO’s projected need. For the year 2014, MISO set forth a UCAP PRM of 7.3%.
This means that Vectren must maintain at least 7.3% over the peak demand of its
customers on a UCAP basis. The goal is to determine the minimum planning reserve
margin that would result in the MISO system experiencing less than one loss of load
event every ten years. Other constraints include the project development and build
times for new construction alternatives, transmission import constraints, reliability
considerations, and the characteristics of existing resources and demand.
Alternatives
A broad array of alternative generation and DSM was included in the optimization
analysis. The full range of supply-side resource alternatives were identified and
discussed in Chapter 6 Electric Supply Analysis. Likewise, the demand-side
alternatives were covered in Chapter 8 DSM Resources.

2014 Integrated Resource Plan
Page 188
November 2014
DISCUSSION OF KEY INPUTS AND ASSUMPTIONS
The NPVs were determined by evaluating all of the pertinent costs that could impact
future resource additions. The NPVs include the operating and maintenance (O&M)
costs of existing and new facilities and the financial costs associated with capital
investments. O&M costs include both fixed and variable expenses such as fuel,
production labor, maintenance expenses, and chemical costs for environmental
controls. .
Please note that this analysis does not explicitly include all of Vectren’s Power Supply
and Energy Delivery costs related to serving retail electric customers. Costs that would
be common to all of the potential resource plans (e.g., allocated admin and general
costs, transmission and distribution costs, other embedded costs, etc.) were not
included because they had no impact on the comparative economic analysis. The
considered costs were primarily related to O&M and new capital associated with power
generation activities. Therefore, comparisons between the base case and alternate
scenarios should be viewed within this context.
Electric Demand Forecast
As mentioned in the prior section, the electric peak and energy forecast is discussed in
detail in Chapter 5 Sales & Demand Forecast. The four demand forecast results used
in the optimization analysis are summarized in Table 5-3. The four forecasts consist of a
base, a low, and two separate high demand forecasts.
Characteristics of Existing Generating Resources
The operating characteristics of existing Vectren owned electric generating resources,
as they were simulated for the purposes of the integration analysis are summarized in
Table 10-1. These characteristics were applied to all years of the study period.

2014 Integrated Resource Plan
Page 189
November 2014
Table 10-1 Characteristics of Existing Generating Resources
Resource Name
UCAP (MW)
Primary Fuel
Resource type
EFOR (%)
Estimated Full Load Heat Rate (Btu/kwhn)
AB Brown 1 228 coal steam 4.9 10,800
AB Brown 2 233 coal steam 3.6 10,700
FB Culley 2 83 coal steam 7.4 11,700
FB Culley 3 257 coal steam 4.3 10,400
Warrick 4 135 coal steam 10.2 10,200
AB Brown 3 73 gas combustion
turbine 0.0 12,000
AB Brown 4 69 gas combustion
turbine 3.6 11,700
BAGS 2 59 gas combustion
turbine 3.6 13,000
Northeast 1 9 gas combustion
turbine 2.7 15,000
Northeast 2 9 gas combustion
turbine 2.7 15,000
Blackfoot1 3 landfill
gas IC engine 5.0 9,000
Existing Purchased Power
Vectren has an existing and ongoing firm purchased capacity and energy commitment
with the Ohio Valley Electric Corporation (OVEC). The UCAP of this commitment
equals 30 MW. It was also assumed that this resource would be present throughout the
20-year study period.
Finally, as discussed in Chapter 7 Renewables and Clean Energy, Vectren has two
long-term purchase power agreements for wind energy. These purchases were
assumed to be in place for the entire IRP study period. The UCAP for Vectren’s wind
capacity is approximately 9.1% or 7.3 MW of the 80 MW of wind.
1 Blackfoot is “behind the meter” and is accounted for as a credit to load

2014 Integrated Resource Plan
Page 190
November 2014
Fuel Prices
The cost of fuel is one of the largest cost components of the analysis. Therefore, the
assumptions that are made regarding future fuel prices are a very important variable for
developing a least cost resource plan.
Vectren utilized data from three sources to develop the fuel price forecasts for this IRP.
The natural gas price forecast is an average of U.S. Energy Information Administration
(EIA) Annual Energy Outlook (AEO) 2014 Reference case1, Wood Mackenzie long term
forecast2, and Black & Veatch’s natural gas forecast3. Basis assumptions were applied
to simulate the delivered burner tip gas cost to Vectren generators. To develop the coal
price forecast; Vectren utilized the same three sources and averaged their coal
forecasts together to develop the IRP forecast.
An important factor to consider when developing or analyzing long-term fuel price
forecasts is the impact that the Clean Power Plan (discussed in Chapter 4
Environmental) may have on the forecasts. Another factor to consider is the uncertainty
of markets in the future. The further out the forecast goes the more uncertain the
projection becomes. Market conditions and customer demand are continually evaluated
when procuring fuel for use in Vectren’s electric generation units. Vectren maintains an
adequate supply of coal in physical inventory on the ground at each of plant location to
ensure reliable service to customers as a prudent contingency in the event of
unforeseen supply interruptions due to weather, labor, etc. Table 10-2 shows the
average annual delivered base case fuel price forecasts for coal and natural gas.
1 Included in the Technical Appendix, section E 2 Wood Mackenzie long term forecasts are subscription based and proprietary. 3 Black and Veatch’s long term forecasts are subscription based and proprietary.
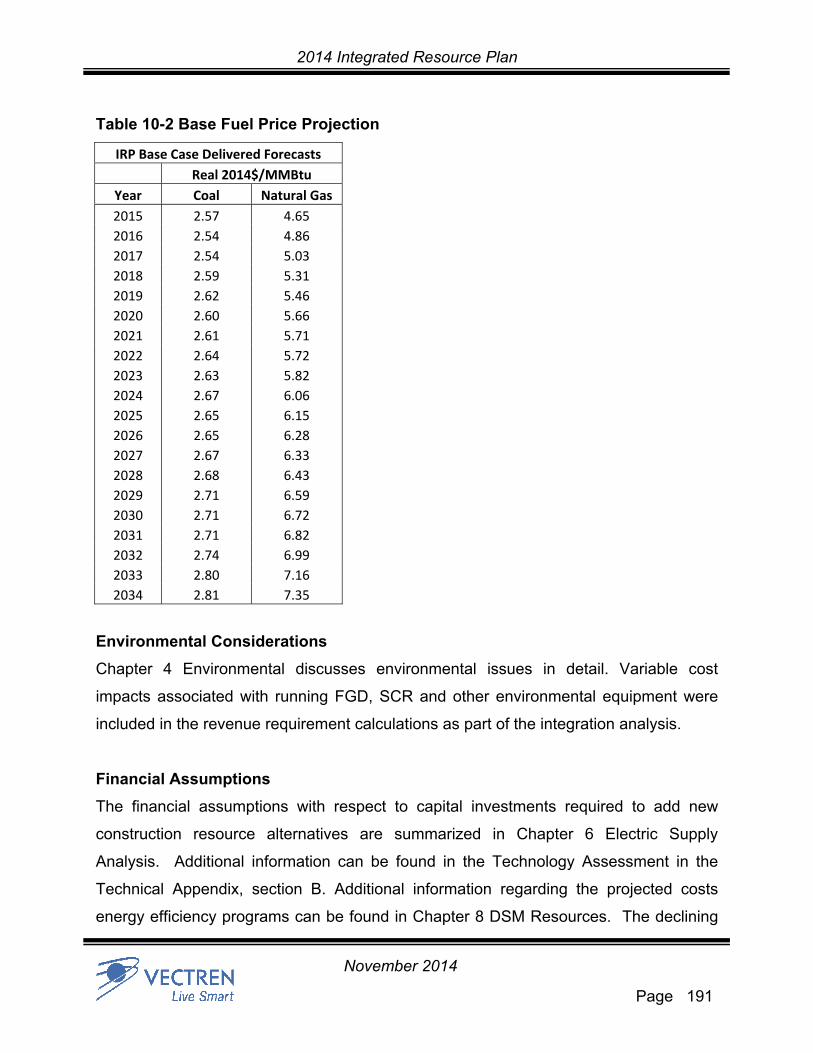
2014 Integrated Resource Plan
Page 191
November 2014
Table 10-2 Base Fuel Price Projection
IRP Base Case Delivered Forecasts
Real 2014$/MMBtu
Year Coal Natural Gas
2015 2.57 4.65
2016 2.54 4.86
2017 2.54 5.03
2018 2.59 5.31
2019 2.62 5.46
2020 2.60 5.66
2021 2.61 5.71
2022 2.64 5.72
2023 2.63 5.82
2024 2.67 6.06
2025 2.65 6.15
2026 2.65 6.28
2027 2.67 6.33
2028 2.68 6.43
2029 2.71 6.59
2030 2.71 6.72
2031 2.71 6.82
2032 2.74 6.99
2033 2.80 7.16
2034 2.81 7.35
Environmental Considerations
Chapter 4 Environmental discusses environmental issues in detail. Variable cost
impacts associated with running FGD, SCR and other environmental equipment were
included in the revenue requirement calculations as part of the integration analysis.
Financial Assumptions
The financial assumptions with respect to capital investments required to add new
construction resource alternatives are summarized in Chapter 6 Electric Supply
Analysis. Additional information can be found in the Technology Assessment in the
Technical Appendix, section B. Additional information regarding the projected costs
energy efficiency programs can be found in Chapter 8 DSM Resources. The declining
2014 Integrated Resource Plan
Page 192
November 2014
costs of utility scale solar (50 MW blocks) were modeled as an asymptotic curve
beginning at $1,880 per KWac in 2014 and declining to $1,500 per KWac in 2020 and
staying flat in real terms for the remainder of the planning horizon.
General Inflation Forecast
The general inflation forecast used in the assumptions is 1.6%. This inflation rate
comes from the Federal Reserve Bank of St. Louis. This is also very close to the
compound annual growth rate used in the EIA AEO 2014 for the years that are covered
in the IRP.
Additional Considerations
The energy industry landscape has been changing at a fast pace, affecting both electric
utilities and their customers. Although there is little clarity on how the state of Indiana
will choose to implement the EPA’s Clean Power Plan, it could drive substantial
changes to the mix of resources available to meet customer electric demand. The
EPA’s MATS rule has resulted in numerous announcements of coal plant retirements
across the US. As a result, MISO is predicting potential capacity shortfalls in the next
few years. With low natural gas prices, some large industrial customers are considering
generating their own electricity, which could affect future energy forecasts. Additionally,
the proportion of residential and commercial customers installing solar panels to
generate electricity continues to rise, which will effectively lower future demand for
energy from the system.
Vectren has taken all of these factors into consideration in the 2014 IRP by either
modeling assumed inputs, as is the case with customer-owned solar panels, or outside
of modeling in the risk analysis. The combination of these factors makes the future very
uncertain. Vectren continues to evaluate these developments and plan for the future
with an emphasis on keeping costs as low and fair as possible for all customers, while
maintaining reliability and meeting regulations.
2014 Integrated Resource Plan
Page 193
November 2014
INTEGRATION ANALYSIS RESULTS
Base Demand Forecast (Growth Scenario 1)
Plans A-1 B-1 and C-1 represent the base demand forecast in combination with the
three basic portfolio themes of “A”- Base (serve customers with existing resources &
DSM), “B” – FB Culley 2 Unit Retirement Scenario and “C” – Renewable Portfolio
Standard. It should be noted that no new capacity is required under this load forecast.
Therefore, the resource additions in plan C-1 are driven by the renewable energy
constraints unique to the renewable portfolio scenario.
This case represents the base set of assumptions and inputs as presented in the
preceding sections of this chapter. For this analysis, no additional constraints were
introduced that would prevent the planning model from selecting the set of future
supply-side or demand side resources that resulted in the lowest NPV.
Table 10-3 shows the resource plan for the base demand forecast and the associated
NPV’s. Plans A-1 and B-1 are essentially the same with only about 0.5 % difference in
the NPV’s. Plan C-1 which is 2.4% higher reflects the capital expense of additional
renewable resources. All three plans are the same through 2019 where a DSM block is
selected in the more expensive plan C-1. This will be re-evaluated in future IRP cycles
as various uncertainty factors are resolved over time.

2014 Integrated Resource Plan
Page 194
November 2014
Table 10-3 Base Demand Forecast (Growth Scenario 1)
Energy Sales Case : Base Demand Forecast
Scenario : Base
FB Culley 2 Unit Retirement RPS1
Plan ID : Plan A1 Plan B1 Plan C1
2015
2016
2017
2018
2019
0.5% DSM2 Block (2019-2034)
2020
Shutdown FB
Culley 2 0.5% DSM Block
(2020-2034)
2021
2022
2023
2024
Solar PV (1x50 MW)
2025
Solar PV3 (4x50 MW)
2026
2027
2028
2029
2030
2031
2032
2033
2034
NPV4 $4,874,614 $4,848,213 $4,991,616
% Difference 0.0% -0.5% 2.4%
1 RPS = Renewable Portfolio Standard 2 DSM = Demand Side Management 3 PV = Photovoltaic 4 Net Present Value inclusive of wholesale adjustment (2014 $)
2014 Integrated Resource Plan
Page 195
November 2014
Low Demand Forecast (Growth Scenario 2)
Plans A-2, B-2 and C-2 represent the low demand forecast in combination with the three
basic portfolio themes of “A”- Base (serve customers with existing resources & DSM),
“B” – FB Culley 2 Unit Retirement Scenario and “C” – Renewable Portfolio Standard. It
should be noted that no new capacity is required under this load forecast. Therefore, the
resource additions in plan C-2 are driven by the renewable energy constraints unique to
the renewable portfolio scenario.
This case represents the base set of assumptions and inputs as presented in the
preceding sections of this chapter. For this analysis, no additional constraints were
introduced that would prevent the planning model from selecting the set of future
supply-side or additional demand side resources that resulted in the lowest NPV.
Table 10-4 shows the resource plan for the base demand forecast and the associated
NPV’s. Plans A-2 and B-2 are essentially the same with only about 0.7 % difference in
the NPV’s. Plan C-2 which is 2.1% higher reflects the capital expense of additional
renewable resources. All three plans are the same through 2017 where a DSM block is
selected in the more expensive plan C-2.

2014 Integrated Resource Plan
Page 196
November 2014
Table 10-4 Low Demand Forecast (Growth Scenario 2)
Energy Sales Case : Low Demand Forecast
Scenario : Base
FB Culley 2 Unit Retirement RPS1
Plan ID : Plan A2 Plan B2 Plan C2
2015
2016
2017
0.5% DSM2 Block (2017-2034)
2018
2019
2020
Shutdown FB
Culley 2 0.5% DSM Block
(2020-2034)
2021
2022
2023
2024
2025
Solar PV3 (4x50 MW)
2026
2027
2028
2029
2030
2031
2032
2033
2034
NPV4 $4,771,789 $4,739,585 $4,871,859
% Difference 0.0% ‐0.7% 2.1%
1 RPS = Renewable Portfolio Standard 2 DSM = Demand Side Management 3 PV = Photovoltaic 4 Net Present Value inclusive of wholesale adjustment (2014 $)

2014 Integrated Resource Plan
Page 197
November 2014
High (modeled) Demand Forecast (Growth Scenario 3)
Plans A-3, B-3 and C-3 represent the High (modeled) demand forecast in combination
with the three basic portfolio themes of “A”- Base (serve customers with existing
resources & DSM), “B” – FB Culley 2 Unit Retirement Scenario and “C” – Renewable
Portfolio Standard. It should be noted that no new capacity is required under this load
forecast as can be seen in case A-3. However, the assumed retirement of Culley unit 2
in 2020 in conjunction with the increase in load drives some capacity additions in case
B-3. The resource additions in plan C-3 are driven by the renewable energy constraints
unique to the renewable portfolio scenario. However, the timing of the resources is
slightly different due to interim renewable constraint in the renewable portfolio scenario.
This case represents the base set of assumptions and inputs as presented in the
preceding sections of this chapter. For this analysis, no additional constraints were
introduced that would prevent the planning model from selecting the set of future
supply-side or additional demand side resources that resulted in the lowest NPV.
Table 10-5 shows the resource plan for the high (modeled) demand forecast and the
associated NPV’s. Plans A-3 and B-3 are essentially the same with only about 0.3%
difference in the NPV’s. Plan C-3 which is 2.1% higher reflects the capital expense of
additional renewable resources. The higher load growth in combination with the
assumed retirement of Culley 2 suggests that more energy efficiency measures should
be implemented soon if that combination of were to occur. However, a mere 0.2%
difference in the NPV’s between plan A-3 and B-3 is not enough to drive such a major
change.
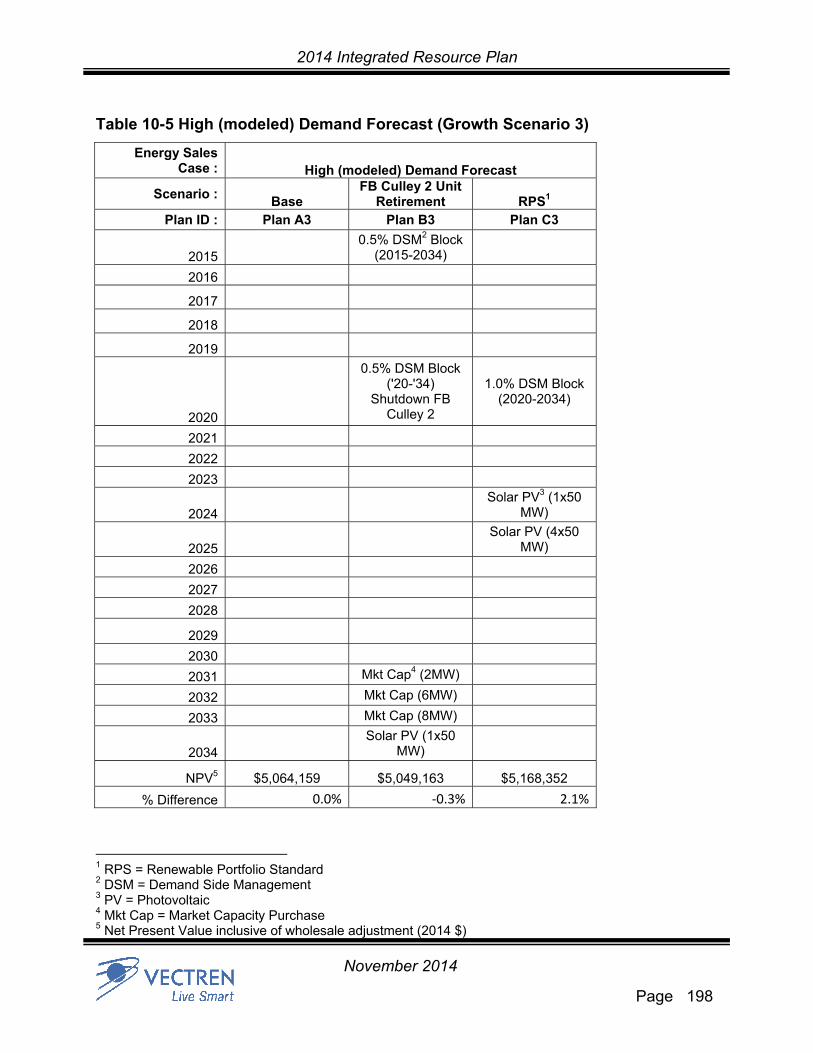
2014 Integrated Resource Plan
Page 198
November 2014
Table 10-5 High (modeled) Demand Forecast (Growth Scenario 3)
Energy Sales Case : High (modeled) Demand Forecast
Scenario : Base
FB Culley 2 Unit Retirement RPS1
Plan ID : Plan A3 Plan B3 Plan C3
2015
0.5% DSM2 Block(2015-2034)
2016
2017
2018
2019
2020
0.5% DSM Block ('20-'34)
Shutdown FB Culley 2
1.0% DSM Block (2020-2034)
2021
2022
2023
2024
Solar PV3 (1x50 MW)
2025
Solar PV (4x50 MW)
2026
2027
2028
2029
2030
2031 Mkt Cap4 (2MW)
2032 Mkt Cap (6MW)
2033 Mkt Cap (8MW)
2034
Solar PV (1x50 MW)
NPV5 $5,064,159 $5,049,163 $5,168,352
% Difference 0.0% ‐0.3% 2.1%
1 RPS = Renewable Portfolio Standard 2 DSM = Demand Side Management 3 PV = Photovoltaic 4 Mkt Cap = Market Capacity Purchase 5 Net Present Value inclusive of wholesale adjustment (2014 $)
2014 Integrated Resource Plan
Page 199
November 2014
High (large load) Demand Forecast (Growth Scenario 4)
Plans A-4, B-4 and C-4 represent the high (large load) demand forecast in combination
with the three basic portfolio themes of “A”- Base (serve customers with existing
resources & DSM), “B” – FB Culley 2 Unit Retirement Scenario and “C” – Renewable
Portfolio Standard. It should be noted that no new capacity is required under this load
forecast as can be seen in case A-4. However, the assumed retirement of Culley unit 2
in 2020 in conjunction with the increase in load drives a capacity addition in case B-4.
The resource additions in plan C-4 are driven by the renewable energy constraints
unique to the renewable portfolio scenario. However, the timing of the resources is
slightly different due to interim renewable constraint in the renewable portfolio scenario.
This case represents the base set of assumptions and inputs as presented in the
preceding sections of this chapter. For this analysis, no additional constraints were
introduced that would prevent the planning model from selecting the set of future
supply-side resources that resulted in the lowest NPV.
Table 10-6 shows the resource plan for the high (large load) demand forecast and the
associated NPV’s. Plan A-4 is the lowest cost plan under this load growth scenario,
beating plans B-4 and C-4 by 1.9% and 2.5% respectively. Plans B-4 and C-4 reflect the
capital expense of additional resources. These scenarios are significantly higher than
plan A-4 in the near term. Note that all three plans are the same through 2018 where a
DSM block is selected in the more expensive plan C-1.

2014 Integrated Resource Plan
Page 200
November 2014
Table 10-6 High (large load) Demand Forecast (Growth Scenario 4)
Energy Sales Case : High (large load) Demand Forecast
Scenario : Base
FB Culley 2 Unit Retirement RPS1
Plan ID : Plan A4 Plan B4 Plan C4
2015
2016
2017
2018
0.5% DSM2 Block (2018-2034)
2019
2020
Block of CCGT3 (200 MW)
Shutdown F.B Culley 2
0.5% DSM Block (2020-2034)
2021
2022
2023
2024
Solar PV4 (2x50 MW)
2025
Solar PV (4x50 MW)
2026
2027
2028
2029
2030
2031
2032
2033
2034
NPV5 $5,156,487 $5,254,385 $5,283,860
% Difference 0.0% 1.9% 2.5%
1 RPS = Renewable Portfolio Standard 2 DSM = Demand Side Management 3 CCGT = Combined Cycle Gas Turbine 4 PV = Photovoltaic 5 Net Present Value inclusive of wholesale adjustment (2014 $)

2014 Integrated Resource Plan
Page 201
November 2014
Integration Analysis Results Summary
As mentioned previously, the Strategist output is the lowest-cost plan for customers.
The plan summary table 10-7 shows the costs for each plan A1-C4. Note that the costs
represent the total present day value of serving Vectren customers under various
portfolio mixes to meet customer demand for each scenario. The costs include capital
for new resources, operating and maintenance costs, etc. for each plan over the 20-
year forecast. Renewable Portfolio Standard (RPS) scenario plans were all the most
expensive because they require new generation to be built and additional energy
efficiency programs, which are paid for by customers, to meet the renewables
requirement. Although no fuel is consumed by renewable resources, there are still costs
associated with building and maintaining facilities. Renewables are intermittent
resources, making them generally more expensive to help meet capacity requirements.
Additionally, retiring FB Culley 2 prematurely, in the event of a large customer addition,
could be very costly to customers. The cost of serving customers with existing
resources, compared to retiring FB Culley 2 in 2020, were essentially the same under
the low, base and high electric forecasts. Due to the risks associated with prematurely
retiring FB Culley 2, discussed below in the Sensitivity and Risk Analysis section of this
report, Vectren plans to serve customers with existing generation, plan A1 (Base
electric forecast and Base scenario) in the near term. Vectren will conduct IRPs in 2016
and 2018. The plans are very similar or identical during the first few years. Therefore,
no immediate action is required. The plans will be re-evaluated in future IRP cycles as
various uncertainty factors are resolved over time.

2014 Integrated Resource Plan
Page 202
November 2014
Table 10-7 Plan Summary Table
SENSITIVITY AND RISK ANALYSIS
Each plan was subjected to additional risk sensitivities to determine which plan is the
lowest cost over a wide range of possible future risks. As previously mentioned,
resource modeling requires a large number of inputs and assumptions over a 20-year
timeframe. It is impossible to precisely predict future prices of commodities such as fuel
and other assumed economic factors such as carbon prices. Therefore, several future
possibilities were considered. The 12 expansion plan scenarios were stress tested in
regard to their sensitivity to variation in natural gas prices, coal prices, electric energy
market prices, carbon prices, and capital costs of new resources. One additional stress
test was added for a high regulation cost uncertainty. The parameters for these stress
tests can be seen in table 10-8. The range of cost sensitivities for natural gas, coal and
electric energy were stressed +/- 20%, which is consistent with the sensitivity

2014 Integrated Resource Plan
Page 203
November 2014
percentages used in the MISO Transmission Expansion Plan 15 (MTEP 15). The large
MISO stakeholder constituency reaches consensus on these ranges; therefore, Vectren
believes that these are reasonable ranges. At the suggestion of some stakeholders,
Vectren used the Synapse 2013 mid case CO2 pricing as the high sensitivity and the
MTEP 15 CO2 mid case as the low sensitivity. Capital costs for new resources were
stressed +30/-10 percent as it is much more common throughout the industry to see
cost underestimates than cost overestimates upon actual project completions. The high
regulation cost was a stress test of adding the capital for a cooling tower at FB Culley in
2022.1
1 1 While Vectren continues to believe that it is unlikely that the state will require a cooling water tower
retrofit at Culley under regulations recently finalized implementing Clean Water Act §316b, Vectren
included this as a high cost sensitivity. Construction costs would commence starting in 2022, after the
required ecological and technological study feasibility period.

2014 Integrated Resource Plan
Page 204
November 2014
Table 10-8 Sensitivity Summary Table (Used For Stress Tests)
1 While Vectren continues to believe that it is unlikely that the state will require a cooling water tower
retrofit at Culley under regulations recently finalized implementing Clean Water Act §316b, Vectren
included this as a high cost sensitivity. Construction costs would commence starting in 2022, after the
required ecological and technological study feasibility period.
Sensitivities High Low Potential Sources
Natural Gas Forecasts
+20% -20% MTEP 15
Coal Forecast +20% -20% MTEP 15
Market Energy Forecast
+20% -20% MTEP 15
CO2 Forecast $15.5/Ton $10.3/Ton
Synapse, MTEP 15
Capital Cost +30% -10% Burns and
McDonnell Tech Assessment
High Regulation Cost*
$40m - Future Regulatory
Scenario1
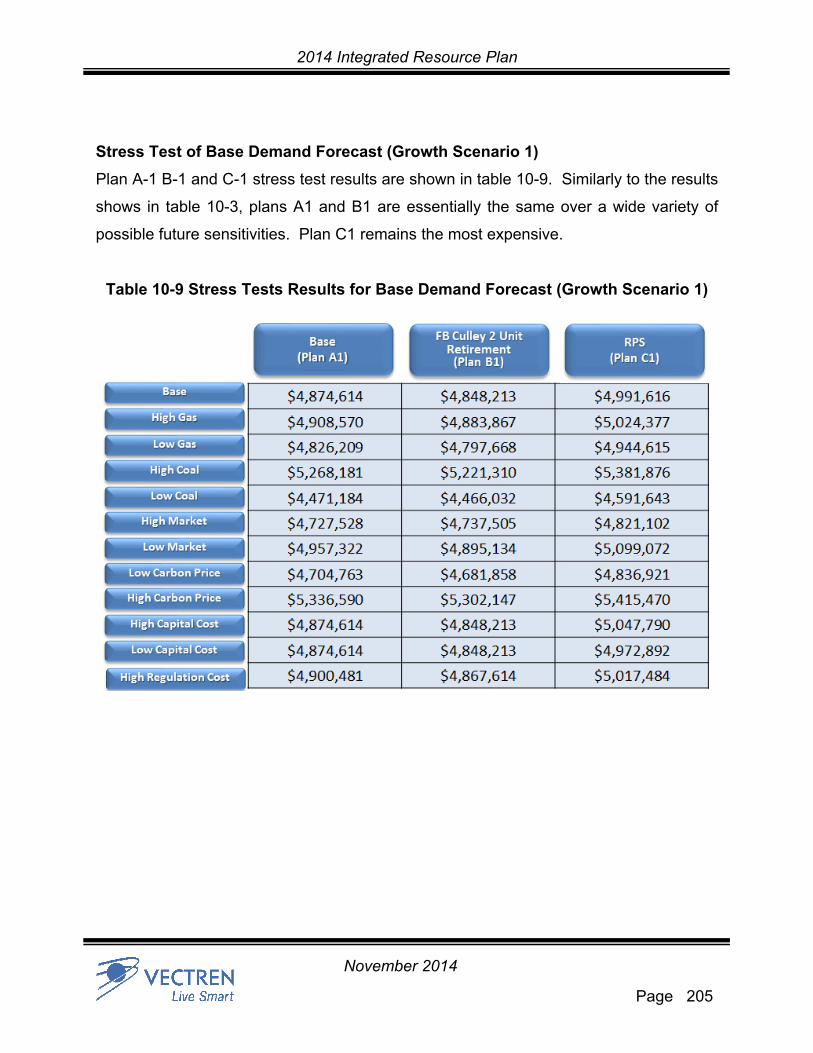
2014 Integrated Resource Plan
Page 205
November 2014
Stress Test of Base Demand Forecast (Growth Scenario 1)
Plan A-1 B-1 and C-1 stress test results are shown in table 10-9. Similarly to the results
shows in table 10-3, plans A1 and B1 are essentially the same over a wide variety of
possible future sensitivities. Plan C1 remains the most expensive.
Table 10-9 Stress Tests Results for Base Demand Forecast (Growth Scenario 1)
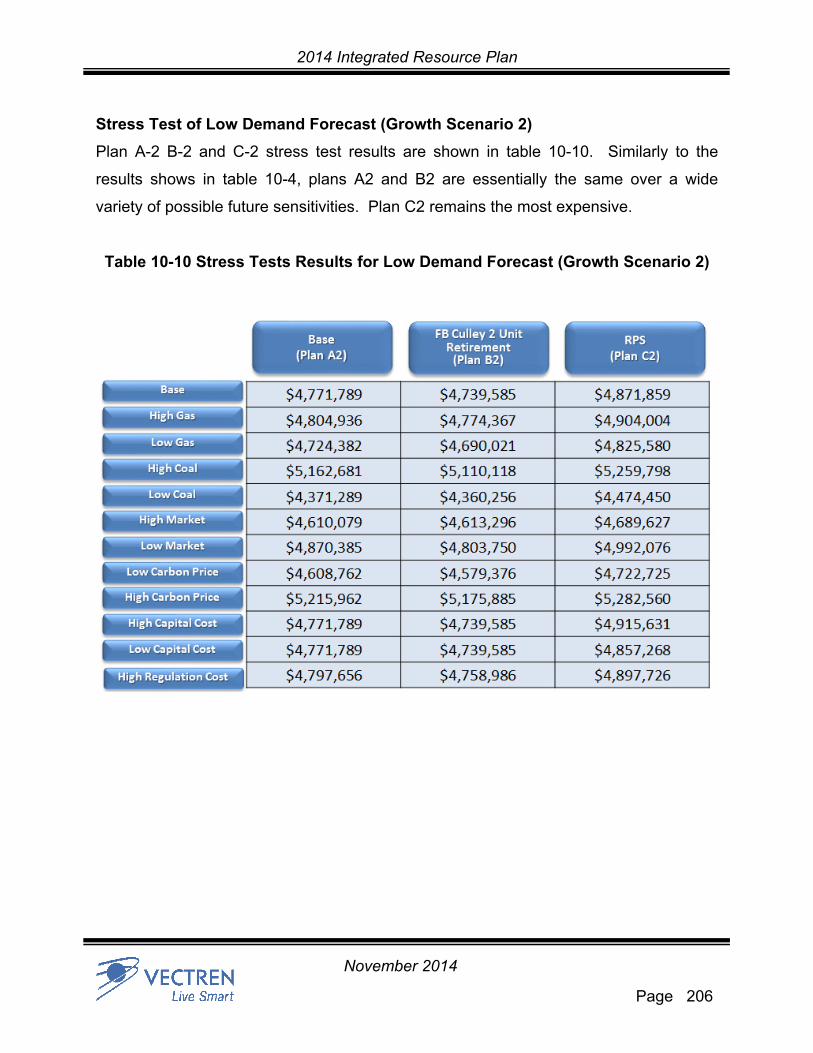
2014 Integrated Resource Plan
Page 206
November 2014
Stress Test of Low Demand Forecast (Growth Scenario 2)
Plan A-2 B-2 and C-2 stress test results are shown in table 10-10. Similarly to the
results shows in table 10-4, plans A2 and B2 are essentially the same over a wide
variety of possible future sensitivities. Plan C2 remains the most expensive.
Table 10-10 Stress Tests Results for Low Demand Forecast (Growth Scenario 2)

2014 Integrated Resource Plan
Page 207
November 2014
Stress Test of High (modeled) Demand Forecast (Growth Scenario 3)
Plan A-3 B-3 and C-3 stress test results are shown in table 10-11. Similarly to the
results shows in table 10-5, plans A3 and B3 are essentially the same over a wide
variety of possible future sensitivities. Plan C3 remains the most expensive.
Table 10-11 Stress Tests Results for High (modeled) Demand Forecast (Growth
Scenario 3)
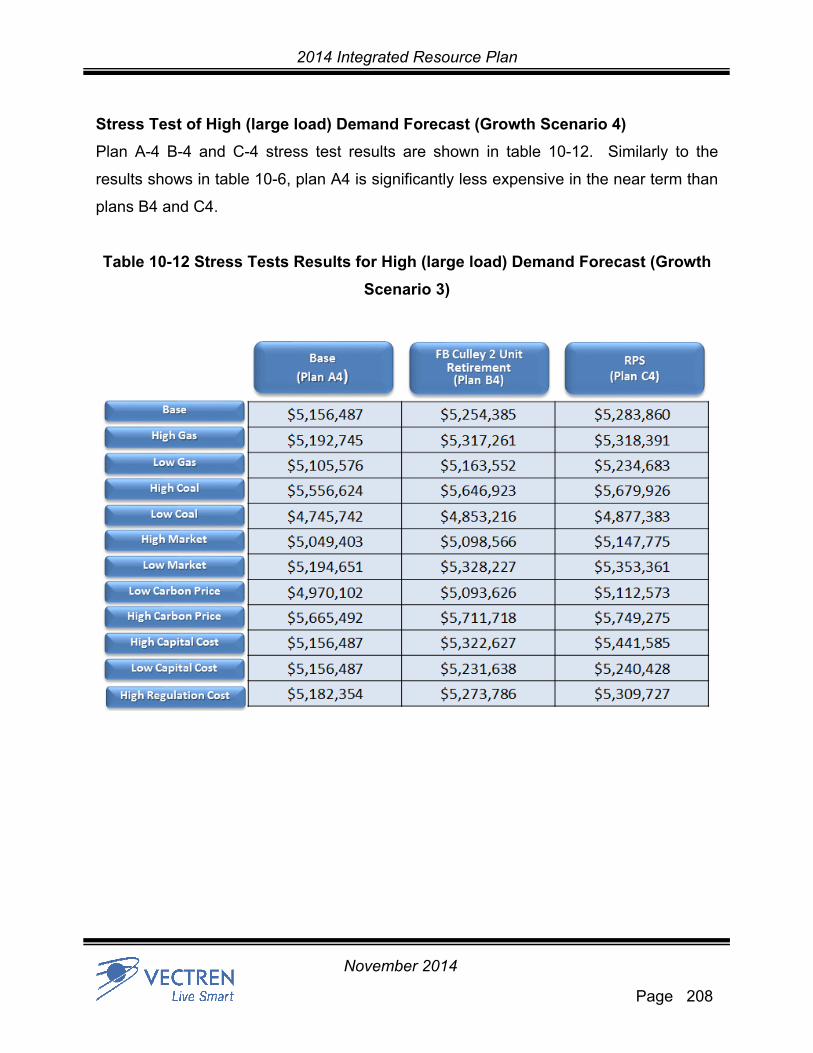
2014 Integrated Resource Plan
Page 208
November 2014
Stress Test of High (large load) Demand Forecast (Growth Scenario 4)
Plan A-4 B-4 and C-4 stress test results are shown in table 10-12. Similarly to the
results shows in table 10-6, plan A4 is significantly less expensive in the near term than
plans B4 and C4.
Table 10-12 Stress Tests Results for High (large load) Demand Forecast (Growth
Scenario 3)

2014 Integrated Resource Plan
Page 209
November 2014
Relative Influence of Stress Test Factors
The relative influence of the stress tests on the net present values can be seen in table
10-13.
Table 10-13 Relative Influence of Stress Tests on Net Present Values
Risk Comparison
Under most risk factors, the cost of continuing operation of FB Culley or retirement in
2020 are essentially the same. As illustrated below in Table 10-14, the cost risk to
customers if Vectren prematurely retires F.B. Culley 2 is potentially large under the high
(large load) demand forecast.
Table 10-14 shows the risk comparison across all sensitivities and sales forecasts for
the base scenario compared to the coal retirement scenario. This graph illustrates that
the differences across three of the four sales forecasts are relatively small compared to
the large savings in the high (large load) demand forecast case. Stated differently, the
positive bars represent the extra cost of not retiring FB Culley 2 under 3 of the 4
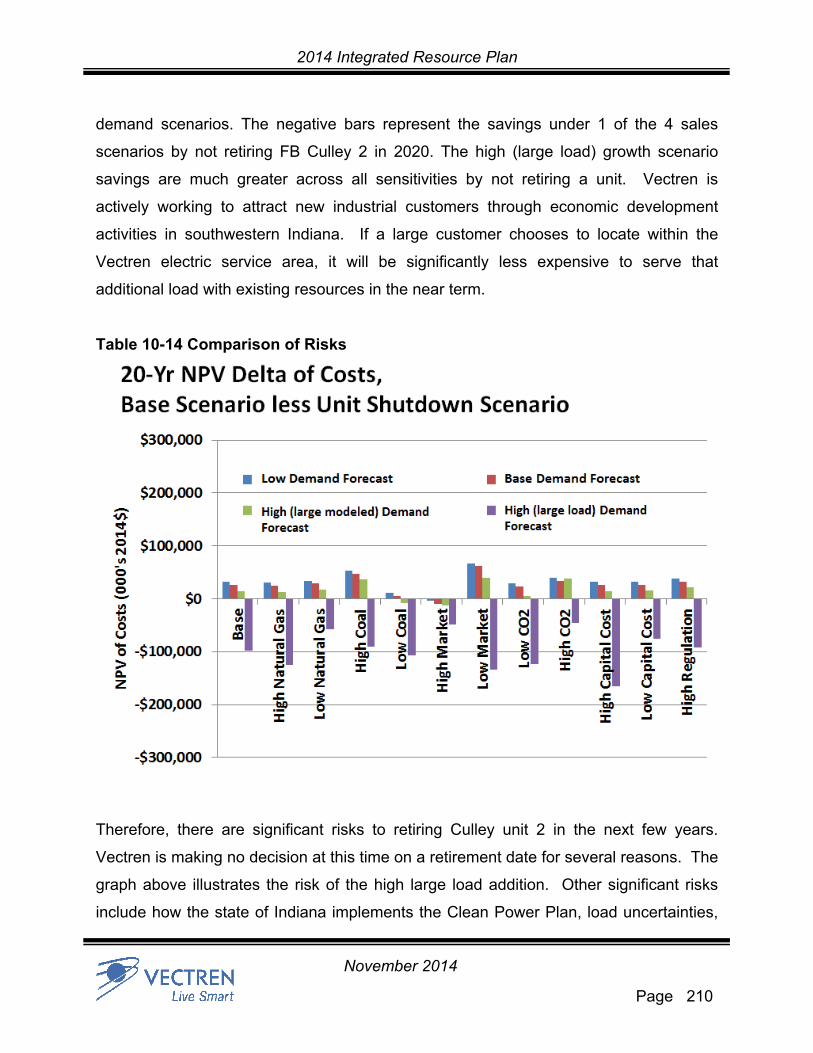
2014 Integrated Resource Plan
Page 210
November 2014
demand scenarios. The negative bars represent the savings under 1 of the 4 sales
scenarios by not retiring FB Culley 2 in 2020. The high (large load) growth scenario
savings are much greater across all sensitivities by not retiring a unit. Vectren is
actively working to attract new industrial customers through economic development
activities in southwestern Indiana. If a large customer chooses to locate within the
Vectren electric service area, it will be significantly less expensive to serve that
additional load with existing resources in the near term.
Table 10-14 Comparison of Risks
Therefore, there are significant risks to retiring Culley unit 2 in the next few years.
Vectren is making no decision at this time on a retirement date for several reasons. The
graph above illustrates the risk of the high large load addition. Other significant risks
include how the state of Indiana implements the Clean Power Plan, load uncertainties,

2014 Integrated Resource Plan
Page 211
November 2014
and potential MISO shortfalls. There is little clarity on how Indiana intends to implement
CO2 guidelines. Depending on the direction that is taken, the plan may vary. Second,
one of Vectren’s largest customers is still finalizing plans for their co-generation unit.
Vectren needs to better understand how this will affect the load forecast. Finally, with
several coal plants shutting down within the MISO market, there is potential that not
enough generation will be available to reliably serve the overall market. A decision
about the assumed retirement of FB Culley 2 in 2020 in scenarios B1-B4 will not be
made until near-term risk factors become clearer.
CONCLUSION
Based on Vectren’s electric demand forecast, which includes cost effective DSM energy
efficiency programs for customers, Vectren does not require additional resources. The
IRP analysis indicates it is essentially the same cost to continue to operate FB Culley 2
or retire it in the near future. The decision to retire this unit is subject to a number of
risks and uncertainties. Vectren is making no decision at this time on a retirement date.
As mentioned in the Risk Analysis section of this report, there are four major risks of
retiring FB Culley 2 in the next few years:
1. How Indiana intends to implement CO2 guidelines, the EPA’s Clean Power Plan
(111d)
2. Uncertainty about customer load due to the installation of a large co-generation
unit
3. The possibility of a new large customer addition
4. Uncertainty around potential capacity shortfalls within the MISO market
Based on the risk associated with retiring FB Culley 2, Vectren will keep plan A-1 as
the plan of choice in the near term, but will continue to evaluate the changing
technology, environmental and regulatory developments, as well as customer costs and

2014 Integrated Resource Plan
Page 212
November 2014
reliability needs. More time and analysis is needed to make a decision on the timing of
retiring FB Culley 2. Note that there will be two more IRPs prepared prior to 2020.

2014 Integrated Resource Plan
Page 213
November 2014
This page intentionally left blank for formatting purposes

2014 Integrated Resource Plan
Page 214
November 2014
CHAPTER 11
ACTION PLAN
2014 Integrated Resource Plan
Page 215
November 2014
INTRODUCTION
These are the next steps the organization will take to achieve a reasonable long-term
cost to retail customers with full consideration of the complex issues facing the industry
in the next few years.
SUPPLY-SIDE RESOURCES
The overall objective of this study and review is to ensure that Vectren is properly
positioned to meet its obligation to serve the needs of its Indiana retail customer base.
Over the next several years, Vectren will continue to monitor changing market factors
and risks including, but not limited to, increased environmental regulations including the
EPA Clean Power Plan, large customer load, fuel price volatility, escalation of capital
costs, increased emphasis on conservation measures, demand response, Smart
Grid/AMI, and RTO related developments, particularly the possibility of MISO shortfalls.
These items will be monitored both for their potential impact on future capacity needs
and their impact on the operation of existing assets.
Vectren projects to have the generating capacity needed to meet the needs of its
customers without adding any additional assets in all scenarios. All 12 plans explored
are very similar or identical during the first few years. No immediate action is required.
Vectren will conduct additional analysis, including another IRP in 2016. A decision
about the assumed retirement of FB Culley 2 in 2020 will not be made until near term
risk factors become clearer.
DEMAND-SIDE RESOURCES
Vectren plans to continue to pursue DSM, energy efficiency, and demand response
opportunities by working through collaborative efforts with the IURC and OUCC.
Vectren will continue to implement the 2015 DSM Plan as filed under Cause No. 44495,
which was recently approved by the Commission. The programs outlined in the 2015
DSM Plan are designed to cost effectively reduce energy use and electric demand by
approximately 1% of eligible retail sales. While Vectren’s current resources are

2014 Integrated Resource Plan
Page 216
November 2014
adequate to meet the needs of its customers, Vectren believes that conservation is in
their customers’ best interest. Helping customers learn to conserve energy will benefit
customers through lower bills, the environment through lower emissions, and rates
through the reduced need for additional system capacity in the future.
Vectren is in the process of developing a three-year Action Plan for 2016-2018 electric
DSM programs. The programs outlined in this three-year Action Plan will be designed to
reduce energy use by approximately 1– 1.5% of eligible retail sales. There are several
variables that currently exist that may have impact on this planning process. The EPA
Clean Power Plan proposal, Federal appliance and equipment minimum efficiency
standards and state legislation relating to energy efficiency could all impact the savings
goals for the next three years. Vectren is currently monitoring such rules and regulations
and will continue to incorporate these factors into this planning process, as required.
Vectren will closely monitor trends regarding Smart Grid/AMI throughout the country.
Vectren will work collaboratively with key stakeholders to determine the appropriate
implementation strategy for Smart Grid/AMI in the Vectren territory.
TRANSMISSION AND DISTRIBUTION
Vectren will work closely with MISO to determine those transmission projects that will
improve overall grid reliability within its service territory and those in the surrounding
area. Vectren will implement system upgrades as needed to ensure reliable service to
its customers. In addition, ongoing internal studies will monitor additions of industrial
and commercial load in different locations within the Vectren service territory.
Detailed budgets for the short-term plan will be developed during Vectren’s
normal budgeting process.