2014 health occupations report - maine.gov report provides an array of data and analyses related to...
TRANSCRIPT

i
2014 Health
OCCUPATIONS
Report
A publication of:
Prepared by: Paul Leparulo, Principal Economic Research Analyst
Issued April 15, 2014

ii | P a g e
Healthcare Occupations Report Series
This is the third in a series of reports on Maine’s health sector and workforce. The reports reflect the importance of having enough health workers in the required locations to ensure the well-being of the population. The aim is to bring together data from a variety of sources in order to foster a broader and deeper understanding of the factors affecting supply and demand in a number of health and social service occupations.
This report compiles data from state and federal databases, including those available at the Maine Department of Labor, the Bureau of Labor Statistics, Census and the National Center for Education Statistics. The objective is to present the available data in a systematic fashion, illustrate how it can be used, and provide a basic framework on which additional data sources can be added in the future, resources permitting.
iii
Preface
In 2005, the Maine Legislature passed "An Act to Ensure an Adequate Supply of a Skilled Health Care Workforce (L.D. Document 892), which requires the Maine Department of Labor (MDOL), in collaboration with the Maine Department of Health and Human Services (DHHS), to compile a healthcare occupations report every four years. The legislation reflects the importance of understanding both the availability of healthcare workers in a wide range of professions and how this availability corresponds to projected needs. This information is vital to protecting the well-being of Maine people.
The challenges associated with developing and sustaining a workforce that will provide services to Maine’s aging and often rural population are significant. Pending retirements of baby boomers will leave a critical gap in skills and experience that will need to be filled; Maine’s shifting industry landscape, in which jobs are gradually becoming more centralized in urban areas, presents challenges to achieving a distributed health workforce; and models of care and delivery are in flux, creating uncertainty in assessing and defining future needs. Understanding these dynamics is fundamental to making effective public policies and developing sound public and private investment strategies. MDOL is committed to ongoing analysis of the issues in helping to chart a more prosperous future for all citizens.
This report provides an array of data and analyses related to Maine’s health workforce. The report draws from a variety of sources including employment, wage and occupational projections data maintained by MDOL, demographic and economic data from the American Community Survey and detailed information on Maine’s health education programs and completers from the National Center of Education Statistics. By combining this data we are able to size the current workforce, analyze projected job openings and measure the state’s capacity to increase supply for a variety of health occupations. We did not have access or resources to utilize all data, including state licensure and adult and continuing education information. A complete listing of data inclusions and important exclusions are noted in the report.
We are pleased to transmit this document in cooperation with Maine’s Health Workforce Forum, which is comprised of health practitioners, employers, educators, administrators and public policy leaders. The Health Workforce Forum was convened by DHHS to review this report and provide guidance on critical workforce issues confronting this vital sector.
Chris Boudreau Director, Center for Workforce Research and Information

iv | P a g e
Acknowledgements
Creation of this report would not have been possible without the contributions of many people. From the Center for Workforce Research and Information (CWRI), Tori Ryan and Merrill Huhtala provided able research assistance and valuable consultation. Layout and design assistance was provided by Tim Sardano. We wish to thank Valerie Landry, Chair of the Maine Health Workforce Forum, Charles Dwyer, Program Officer at Maine Health Access Foundation and Matthew Chandler, Director, Rural Health and Primary Care, Maine CDC for their review, insights and feedback. The Maine Health Workforce Forum (the Forum), as represented by Sally Sutton, Project Director, also provided many important insights into industry and occupational issues and a very helpful review. A variety of industry professionals and Forum members also offered valuable insights on specific occupations. We wish to thank Ann Sossong, Associate Professor of Nursing, University of Maine School of Nursing and Lisa Harvey-McPherson, Vice President Continuum of Care & Chief Advocacy Officer EMHS for their review of the nursing occupations; Ellen Libby, Program Director, EMMC School of Medical Laboratory Science provided valuable feedback on the medical laboratory technologists and technician occupations; Judith Feinstein, Director, Maine CDC Oral Health Program offered important insight on the dental professions, as did Sheila Comerford, Director Maine Psychological Association for psychologists.

v
About this Report Understanding the importance of having a workforce with the skills and abilities necessary to perform complex medical tasks and provide patient care and support functions, the Maine Legislature commissioned a series of health occupations reports. These reports were to provide labor market and education information for each health occupation licensed or registered in Maine, and “an analysis of trends and the current outlook in employment supply and demand, including implications for the state and health care industry.”1 This is the third report in the series; the first was published in 2006 and the second in 2010.
This report compiles an array of data for nearly 60 health and social service occupations. The report is organized into a series of occupational profiles, with each containing a description of the profession, education requirements, employment and wage characteristics, postsecondary program completer data and an employment outlook. In addition, historical employment and trend analyses, demographic and work setting information, county employment data, per population statistics, sensitivity analyses, and a discussion of pertinent issues were included whenever possible. The introduction includes an analysis of employment trends in the sector and the employment outlook for health occupations in aggregate.
Who should use this report?
• Legislators and others seeking to better understand the labor market dynamics, education capacity and employment distribution in a variety of health occupations.
• Administrators, educators and health professionals seeking more information about postsecondary program capacity in a variety of areas of study and how this relates to projected job opportunities.
• Prospective students looking for information on the employment outlook, wages and education requirements for more than 50 health and social service occupations.
• Anyone seeking data and statistics on one of Maine’s largest economic sectors.
How to use this report
This report can be used in different ways. At a minimum, the reader can review the executive summary and a few specific occupational profiles and summary statistic tables. To get the most benefit, it is highly recommended that users also review the section, Data sets and limitations, the introduction and as many profiles as possible, including the first several, which are more detailed than others. While this approach will involve a little more time, it will yield a more complete understanding of the data and how it can be used.
1 Public Law 2005, Chapter 327, available on the Internet at: http://www.mainelegislature.org/legis/statutes/22/title22sec256-A.html

vi | P a g e
Using the Occupational Profiles
For comparability, occupations are grouped into categories (physicians and surgeons, nurses, therapists, technicians, etc.).2 For each group of occupations, a summary statistics table provides important workforce and demographic data for each detailed occupation. By scanning these tables readers can compare and contrast similar occupations across a variety of metrics. The table below displays the characteristics and sources of data.
Summary Statistics Workforce Characteristics Data source:
Employment Occupational Employment Statistics
Employment per 1,000 population Occupational Employment Statistics*, population estimates from Maine Office of Policy and Management
versus U.S. Occupational Employment Statistics, Census Average annual starting wage (Maine) Occupational Employment Statistics Median annual wage (Maine) Occupational Employment Statistics U.S. median annual wage Occupational Employment Statistics Median wage for all occupations in Maine Occupational Employment Statistics Minimum Education Requirement Occupational Employment Statistics Job Growth Projections 2010 - 2020 Employment projections National Median Age Current Population Survey Top Industry of Employment Occupational Employment Statistics Licensing Board Various sources
*Employment projections data was used for a few occupations where self-employment is particularly high.
Following each summary statistics table are a few key points for each group of occupations.
Occupational profiles are organized as seen below. Much of the information provided in these sections is sourced directly from government and state agencies that compile this material. These sources are noted below.
SOC code and Occupation title The SOC code identifies each occupation and is useful when researching occupational information through O*Net, the Occupational Outlook Handbook, America’s Career One-Stop, and other labor market information resources.3
2 The grouping of occupations involves some subjectivity. Some occupations could rightfully go into more than one category.
3 The SOC is a hierarchical system used by federal statistical agencies to classify workers into 840 detailed occupations based on job duties and, in some cases, on skills, education, and/or training. The SOC combines these detailed occupations into 461 broad occupations, 97 minor occupational groups, and 23 major occupational groups.

vii
Occupation description
Occupational descriptions were sourced directly from the 2010 Standard Occupational Classification (SOC) system of the U.S. Bureau of Labor Statistics (BLS). Information on the SOC may be found here: http://www.bls.gov/soc. For some occupations the BLS Occupational Outlook Handbook is also utilized. The OOH is available here: http://www.bls.gov/ooh
Education requirements
Information about education requirements was sourced from the BLS Occupational Outlook Handbook (OOH). Information from the Maine Office of Professional and Occupational Regulation was also utilized.
For nurse practitioners, nurse midwives and nurse anesthetists, academic requirement information was taken from ExploreHealthCareers.org, which is available here: http://explorehealthcareers.org/en/home
Employment & Wages
Employment and wage data is from the Occupational Employment Statistics (OES) program. For occupations with high percentages of self-employed, employment projections data was used, as this includes estimates for the self-employed (but the data is older than what’s available through OES—see this discussion on Data sets and Limitations). OES and employment projections data are available on CWRI’s website: http://www.maine.gov/labor/cwri/data.html
County level employment data was provided for many occupations. As discussed in the following section, Data sets and limitations, OES data are routinely suppressed due to USBLS confidentiality and data quality requirements. In this report, when data is suppressed it is shown as “n/a” for not available.
Demographic, economic and social characteristics of the workforce
CWRI analyzed the 2006-2010 American Community Survey (ACS) for detailed demographic and social characteristics for certain health occupations in Maine. We used pre-tabulated data as well as the Public Use Micro data Sample files (PUMS). ACS data is available from the Census at this site: www.census.gov/acs
ACS data is not provided for all occupations in this report. For many occupations the sample sizes are small, lowering statistical reliability. This section only appears for occupations where ACS data was evaluated.
Schools offering training and number completing
Raw data came from the Integrated Postsecondary Education Data System (IPEDS) and analysis is from the Center for Workforce Research and Information (CWRI). Completer data is for postsecondary education programs that participate in the federal student loan program (programs with IPEDS data will have financial aid options for students). Continuing and adult education programs are not included in IPEDS data or this report.

viii | P a g e
Outlook
Employment projections for each occupation are provided and the broad factors affecting supply and demand are addressed. The discussion on the national employment outlook for each occupation was taken directly from the BLS’ OOH. Discussion of Maine’s employment outlook and other analyses is from CWRI.

1
Contents Preface ...................................................................................................................................... iii
Acknowledgements .................................................................................................................. iv
About this Report ....................................................................................................................... v
Executive Summary ................................................................................................................... 4
Data Sets and Limitations .......................................................................................................... 7
Abbreviations .......................................................................................................................... 11
Introduction ............................................................................................................................. 12
Nursing .................................................................................................................................... 23
29-1141 Registered Nurses .................................................................................................................... 24
29-1171 Nurse Practitioners ................................................................................................................... 40
29-1161 Nurse Midwives ........................................................................................................................ 46
29-1151 Nurse Anesthetists ..................................................................................................................... 48
29-2061 Licensed Practical Nurses ........................................................................................................ 50
Physicians & Surgeons ............................................................................................................ 55
Physician Assistants ................................................................................................................ 66
29-1071 Physician Assistants ................................................................................................................... 66
Dentists, Hygienists, Dental Assistants ................................................................................... 72
29-1021 Dentists, General ...................................................................................................................... 73
29-2021 Dental Hygienists ...................................................................................................................... 82
31-9091 Dental Assistants ....................................................................................................................... 88
Other Doctoral Level Healthcare Practitioners ......................................................................... 92
29-1011 Chiropractors ............................................................................................................................. 93
29-1081 Podiatrists .................................................................................................................................. 95
29-1041 Optometrists .............................................................................................................................. 97
29-1181 Audiologists ............................................................................................................................... 99
Pharmacists & Related ........................................................................................................... 101
29-1051 Pharmacists ............................................................................................................................. 102
29-2052 Pharmacy Technicians ........................................................................................................... 105
Dieticians, Nutritionists & Related ......................................................................................... 109
29-1031 Dieticians and Nutritionists ................................................................................................... 109
29-2051 Dietetic Technicians ............................................................................................................... 113
Therapists & Related .............................................................................................................. 116

2 | P a g e
29-1122 Occupational Therapists ....................................................................................................... 117
31-2011 Occupational Therapist Assistants ...................................................................................... 122
29-1123 Physical Therapists ................................................................................................................ 125
31-2021 Physical Therapist Assistants ................................................................................................ 129
29-1125 Recreation Therapists............................................................................................................ 133
29-1124 Radiation Therapists ............................................................................................................. 136
29-1126 Respiratory Therapists .......................................................................................................... 139
29-2054 Respiratory Therapy Technicians ........................................................................................ 142
29-1127 Speech-Language Pathologists ........................................................................................... 144
Technologists & Technicians .................................................................................................. 148
29-2011 Medical and Clinical Laboratory Technologists ............................................................... 150
29-2012 Medical and Clinical Laboratory Technicians .................................................................. 155
29-2031 Cardiovascular Technologists & Technicians ..................................................................... 158
29-2032 Diagnostic Medical Sonographers ..................................................................................... 161
29-2033 Nuclear Medicine Technologists .......................................................................................... 164
29-2034 Radiologic Technologists ...................................................................................................... 167
29-2041 Emergency Medical Technicians and Paramedics ........................................................... 171
29-2053 Psychiatric Technicians .......................................................................................................... 176
29-2055 Surgical Technologists ........................................................................................................... 179
Direct Care Workers ............................................................................................................... 182
31-1011 Home Health Aides ............................................................................................................... 183
39-9021 Personal and Home Care Aides ......................................................................................... 189
31-1013 Psychiatric Aides .................................................................................................................... 193
31-1014 Nursing Assistants .................................................................................................................. 196
31-1015 Orderlies ................................................................................................................................. 200
Mental Health Professionals .................................................................................................. 201
19-3031 Clinical, Counseling and School Psychologists .................................................................. 202
21-1021 Child, Family and School Social Workers ......................................................................... 209
21-1022 Healthcare Social Workers ................................................................................................. 213
21-1023 Mental Health and Substance Abuse Social Workers .................................................... 217
21-1014 Mental Health Counselors .................................................................................................... 221
21-1011 Substance Abuse and Behavioral Disorder Counselors .................................................. 225
Other Healthcare Occupations ............................................................................................... 228
29-9091 Athletic Trainers ..................................................................................................................... 228
31-9011 Massage Therapists .............................................................................................................. 232

3
29-1199 Health Diagnosing and Treating Practitioners, All Other .............................................. 236
29-2071 Medical Records and Health Information Technicians .................................................... 238
Appendix I ............................................................................................................................. 242

4 | P a g e
Executive Summary The health sector plays a central role in the economy. In addition to being a provider of essential services, the sector represents nearly 106,000 jobs and $4.4 billion in annual payroll, making it the largest segment of the economy in terms of employment and wages. The health sector has also contributed to job growth in a significant and steady fashion. Since 2000, more net jobs were generated than in all other sectors combined; and barring a slight decline in 2010, employment increased every year for two decades. Going forward, an aging population, heightened atten-tion on preventative care and technological innovations should continue to support strong demand for health services.
The employment outlook for healthcare jobs is particularly bright. In Maine, jobs for healthcare practitioners and support workers are projected to grow a combined 17 percent from 2010 to 2020, higher than for all other major occupational groups and well above the six percent increase expected for all occupations. Employment within hospital settings is expected to increase much faster than average and account for the majority of job opportunities. Occupations with the strongest growth prospects—diagnostic sonographers, respiratory therapists and radiologic technologists—are employed primarily at hospitals.
In addition to new growth, employment opportunities will arise from the need to replace those that retire or transition into different occupations. Over the coming decade, nearly one out of five currently working in the health workforce may need to be replaced, and in some occupations—optometry, dietetics and nutrition, psychology, dentistry—approximately one out of three. Given the age structure of the workforce, high replacement needs are not surprising. Two-thirds of dentists and psychologists are above 50 years old, as are nearly half of the practition-ers in a variety of other occupations, including pharmacists, nurse practitioners and licensed prac-tical nurses. Overall, job opportunities due to replacement needs are expected to exceed those resulting from growth.
Responding to strong demand, Maine’s education capacity in health professions increased. In 2011, the number of graduates from postsecondary healthcare programs was 33 percent above the level in 2007. Most of the increase was due to growth in associate’s degrees and certificates awarded, which expanded nearly 40 and 90 percent, respectively. Bachelor and graduate de-grees awarded increased 12 percent, much slower than for other credentials primarily due to lim-ited growth in nursing programs, which were capacity constrained by a dearth of doctoral pre-pared professors. More recently, new pharmacy, medical and dental school programs have be-gun, and these will be an important source of supply of higher level professionals in coming years.
Although overall education capacity increased, some areas of instruction have fewer program completers than projected annual job openings for the corresponding occupation. While job seekers should find these conditions favorable, employers may experience difficulties filling positions. Barring an economic downturn and an associated decline in job opportunities, closing the gap will require strategies for increasing program capacity, retaining existing workers for longer, increasing in-migration, or other means for enhancing supply.
In addition to overall supply, the distribution of practitioners plays a critical role in access to health services. Maine faces a number of challenges on this front. According to the U.S. Depart-ment of Agriculture’s Economic Research Service, 41 percent of the state’s population lives in rural

5
areas that have lower incomes, higher rates of poverty and unemployment, and lower levels of educational attainment. Recruiting and retaining providers in these regions is often challenging. Maine’s urban areas are home to the large hospital systems and a majority of the health work-force. These areas offer better access to services and higher numbers of health workers per population. Cumberland County has 50 percent more health workers per thousand residents than the state average, and Kennebec County 20 percent more. More rural counties—Franklin, Oxford and Washington, in particular—have 20 to 50 percent fewer health workers per population.
Highlights from Select Occupational Profiles Employment of registered nurses (RNs) increased 29 percent from 2000 to 2010 and is projected to increase another 20 percent through 2020. A range of factors including technological advances, an aging population and heightened attention on preventative care are driving growth. While an associate degree is the minimum education requirement for licensure in Maine, demand for nurses with higher levels of educational attainment is expected to grow faster than average as care giving becomes more complex, the range of competencies necessary to master increases, and the role of RNs within the health delivery system expands. To better equip nurses to meet these increased responsibilities the Institute of Medicine recommends that the proportion with bachelor’s degrees be increased to 80 percent by 2020. Recent data indicates that 55 per-cent of Maine’s RNs meet this recommendation.
Growth in the number of nursing graduates has been limited, raising concerns about the future supply of those with a Bachelor of Science in Nursing (BSN) credential. Hospitals represent the majority of RN hiring demand and are large enough to absorb Maine’s entire yearly supply of BSN graduates. A limited pool of doctoral-prepared teaching faculty and steep competition for these professionals from higher paying industry employers has been a barrier to capacity growth. Recruiting and retaining nurse faculty with masters and PhDs has been particularly difficult for Maine’s higher education institutions.
There were an estimated 4,000 physicians and surgeons working in Maine in 2010—an average number for a New England state (per thousand population) but 36 percent higher than that of the nation (per thousand population). Distribution is highly concentrated, with more than 40 percent employed in Cumberland County, leaving a disproportionately low share of practitioners in some rural areas.
Demographics may play an increasingly large role in the supply and availability of physicians and surgeons. Forty-four and 17 percent of practitioners are above 50 and 60 years old, respectively. American Community Survey data indicates that practitioners above 60 years old were less attached to the workforce and worked fewer hours per week compared to younger practitioners. According to current employment projections, 20 percent of the workforce may retire over the ensuring decade. The University of New England’s College of Osteopathic Medicine and the TUSM-MMC medical school program will be important sources of supply, giving newly trained doctors the option to live and practice in the state where they’ve trained. The medical residency programs will also be instrumental in bringing more practitioners to rural and underserved areas. In addition, physician assistants (PAs) and advanced practice nurses could see expanded roles in primary care, particularly as more physicians focus on specialized areas of medicine. Employment of PAs in Maine has already increased 40 percent over the past 10 years.

6 | P a g e
There were nearly 600 dentists practicing in Maine in 2010, which was essentially flat with the level in 2004. Relative to the nation, Maine’s dentist workforce is comparable in size (per thou-sand population) but older. With two-thirds of the workforce over 50 years old—and one-third over 60—there is a sizeable need for a pipeline of practitioners with the skills and education necessary to replace those that may retire in coming years. For Maine, this means recruiting and retaining more than 170 dentists just to fill the gap of those that may exit the workforce in the next decade. The University of New England’s College of Dental Medicine, which is expected to have first graduates in 2017, will be an important source of newly trained practitioners. The pro-gram will also be instrumental in bringing more dentists to rural and underserved areas. Dentists are also increasing the utilization of hygienists, assistants and technology in order to see more pa-tients and enhance productivity.
Technologists and technicians enjoy a particularly bright job outlook. These are among the fastest growing health occupations in Maine and in most cases job opportunities are expected to increase faster here than for the nation. These occupations have a high share of employment within hospitals, which fosters above average rates of growth. Education capacity—as measured by average annual program completers—is below projected job openings in several areas of instruction, including medical and clinical lab technologists, medical and clinical lab technicians and diagnostic medical sonographers.
Direct care workers represent a large and growing segment of the workforce. An aging population and pressure to contain costs of caring for the elderly should drive increased demand for these services. Job prospects for home health and personal care aides are particularly bright. These large and rapidly growing occupations are expected to add many jobs.
The low pay and high emotional and physical demands in direct care occupations can make re-cruiting and retaining employees difficult. Nearly half the workforce has education credentials above the minimum required for the occupations, which may also contribute to turnover. Recruiting and retaining workers may become more difficult during periods of stronger economic growth, as the number of available employment opportunities in other sectors and occupations increases.
In 2010 there were 22 percent fewer clinical, counseling and school psychologists per thousand residents practicing in this state compared to that of the nation. Nearly 70 percent of Maine’s psychologists (all types) were over 50 years old. The number graduating from Maine programs with the doctoral credentials necessary to practice in the field is well below projected job open-ings. Barring an unexpected decline in demand, closing the gap will require recruiting psycholo-gists from other states and developing strategies to retain existing practitioners for longer.
Although the outlook for health occupations in Maine is bright, the national job picture is even stronger. Nationally, health occupational employment is expected to increase 29 percent, well above the 17 percent rate projected for Maine primarily due to higher population growth forecasts, which foster greater overall economic and industry growth.
7
Data Sets and Limitations Data on health occupations is available from a range of sources. The data utilized in preparing this report is from publicly available state and federal data bases from the Maine Department of Labor, Bureau of Labor Statistics, American Community Survey and the National Center for Education Statistics. We did not have access or resources to utilize other important data sets including state licensure information, job vacancy and adult and continuing education data. Accordingly, readers are encouraged to review additional sources of information in conjunction with this report to develop a comprehensive view of the sector and its occupations.
The scope of analysis is a function of the data that was available when the report was prepared. The data sets utilized are designed to provide estimates for the number employed, wages paid and projected job opportunities in a variety of occupations; measure the demographic and eco-nomic characteristics of the population and population sub-groups; and identify the postsecondary institutions offering education programs by area of study and the number completing. From this we are able to size the current workforce, measure the state’s capacity to increase supply for a variety of occupations and compare this with projected annual job openings. We add context to this by evaluating the demographics, hours worked and educational attainment for several occu-pations.
It is critical for users to understand the limitations of each data set. The major data sets used and their pertinent limitations are as follows:
Occupational Employment Statistics (OES)
The Occupational Employment Statistics (OES) program produces employment and wage estimates annually for over 800 occupations. Estimates for Maine are produced by the Center for Workforce Research and Information (CWRI) as a collaborative effort with BLS. These estimates are based on surveys of employers and are available for the nation as a whole, for individual states, and for metropolitan and nonmetropolitan areas. OES data is frequently cited as the most popular labor market information program within the United States and is the best and most current source of wage and employment data. OES data used in this report is primarily from 2012.
Definitions & limitations:
• Employees are part-time and full–time workers who are paid a wage or salary. The data does not indicate whether an employed person is full or part-time. OES data is a count of jobs, not persons, based on place of work (as opposed to residence).
• Self-employed persons are not included in the estimates, nor are owners and partners in unincorporated firms, household workers or unpaid family workers.
• OES data are routinely suppressed due to USBLS confidentiality and data quality requirements. In this report, suppressed it is shown as “n/a” for not available.

8 | P a g e
• OES data is not designed for time series analysis. Changes in occupational definitions, labor force attachment rates and in the timing of the surveys can make comparisons between two different points in time problematic, particularly at the detailed occupational level and for smaller occupations. At the same time, major occupational groups and large occupations have higher degrees of statistical reliability which mitigates some of the concerns. With these factors and caveats in mind, for occupations where the data is more sta-tistically reliable, some trend analysis is provided in order to provide context of the labor market dynamics in a profession.
Employment Projections Data
CWRI produces 10 year employment projections for every Maine industry and over 800 occupations as a collaborative effort with BLS. These forecasts are produced every other year and currently address the 2010 to 2020 period. Occupational projections estimate the number of job openings due to new growth and replacement needs. Also, because these estimates include the self-employed, they can be used to estimate total employment in the base year (2010) for occupations where self-employment is important. The drawback is that this is older data than what is available with OES (2010 vs. 2012).
Readers are encouraged to utilize multiple sources of information, including employment projections data, when assessing potential hiring demand. All data has limitations and by evaluating multiple sources the range of uncertainty may be lowered. Employment projections methodology and important assumptions are highlighted below.
• Projections are made for the total number of job openings expected over the 10 year period, and then spread evenly over each year. In reality, job openings tend to occur in lumps.
• Total annual job openings are considered a minimum number of the workers that need to be trained each year. This is due to the fact that not all who complete training enter the occupation and replacement openings are based on the net as opposed to gross flow of workers in and out of an occupation.
• Projections data is only available at the state level.
• Projections for occupations with a high component of self-employed require more judgment and subjectivity.
• The projection methodology is a top-down process, beginning with macroeconomic assumptions and concluding with industry and occupational estimates through the use of econometric models and analysis of other variables. For healthcare specifically, the projections assume the status quo in terms of the way healthcare is organized, delivered and paid for. The projections do not incorporate assumptions about how the health delivery system may change as a result of the Affordable Care Act (ACA), as the regulations were not complete when the estimates were created.
• Replacement job openings are the number of projected openings resulting from workers retiring from or permanently leaving an occupation. Estimates are based on analysis of U.S. occupational employment data for 13 age cohorts over five-year periods. To the extent that occupational retirement patterns in Maine differ from the
9
nation, a bias may result. In several occupations CWRI provides a sensitivity analysis for users to better understand the impact that higher replacement rates would have on the number of expected job openings in Maine.
American Community Survey (ACS)
The ACS is a survey that provides estimates of the demographic, economic, household and social characteristics of the population. Data is available for states, smaller geographies and population subgroups. In order to produce reliable state and population subgroup information, the ACS combines data collected over three- and five-year periods, which increases statistical reliability.
CWRI analyzed the 2006 – 2010 ACS. This data reflects information collected over the entire five year period and should not be understood as being reflective of a single year (such as the midpoint of the survey). Due to resource constraints, ACS data was analyzed for a limited number of occupations.
Large confidence intervals often result when analyzing occupational data at a state level. This is particularly true for smaller occupations or when data is analyzed by demographic, socio-economic or other household characteristics—which results in smaller sample sizes. High margins of error make interpreting the data more difficult. When large confidence intervals and high margins of error occurred we opted not to publish data in this report.
Current Population Survey (CPS)
The CPS is a monthly survey of households conducted by the Bureau of Census for the Bureau of Labor Statistics. It provides a comprehensive body of data on the labor force, employment, unemployment, persons not in the labor force, hours of work, earnings, and other demographic and labor force characteristics. The CPS was used in this report to identify the national median age for a variety of health occupations.
Census data
Census data was used for national and state population estimates. Maine population estimates and projections were gathered from the Maine Office of Policy and Management.
Integrated Postsecondary Education Data System (IPEDS)
IPEDS—the primary source of postsecondary education data in the United States—was used to determine the education offerings and credentials conferred for different areas of healthcare instruction. The Higher Education Act of 1965 requires schools participating in the federal student loan program submit completer data for programs leading to a formal reward to the National Center of Education Statistics (NCES). This data is available to the public through IPEDS. For this report, IPEDS data was reviewed for the 2007 to 2011 academic years only.
The primary strength of IPEDS data is that schools are compelled by law to submit data to NCES, ensuring a very high response rate. Limitations stem from the fact that schools self-report program and completer data and these statistics are typically not verified IPEDS. Data quality is only as good as that which is submitted by schools.

10 | P a g e
• Each school has the responsibility to self-report for each program that leads to ‘a formal reward.’ While IPEDS reviews data from each institution, they do not review each school’s website to ensure that data is submitted for relevant programs.
• Schools have discretion in choosing which classification of instruction program (CIP) best characterizes their programs of training. In some cases programs may be accidentally misclassified, and in some situations genuine ambiguity exists as to which CIP best characterizes the program. These issues can result in a miscounting of program completers by area of instruction. One example is the Medical Lab Technology program offered at the University of Maine at Augusta (UMA) and Presque Isle (UMPI). Although this is a joint program, each campus submits data to IPEDS using different a CIP. In another case, a radiography program was submitted with the CIP for radiation therapy. Since data is self-reported and not verified, it often requires the help of local educators and people familiar with the programs to make the proper adjustments.
Additional limitations stem from the fact that some programs don’t participate in the federal student loan programs and don’t submit any data to IPEDS. The Maine Medical Center (MMC) School of Surgical Technology is one such program; annual completers from MMC outnumber all other surgical tech programs in Maine, but this data is not in IPEDS. While we made every attempt to capture information from programs such the one at MMC, the school and completer data presented should not be considered exhaustive. Moreover, IPEDS doesn’t include adult and continuing education programs, nor did we have access to this data. Thus, the education data provided in this report represents an important segment of Maine’s health education programs, but not the entire set. The absence of adult and continuing education information results in an incomplete picture of the state’s health education programs.
Exclusions:
Some of the data sources that were not utilized in preparing this document are found below. Readers with access to this data may have different statistics and figures than what is presented in this report.
• State licensure data • Adult and continuing education program data • Financial aid data (while we didn’t have access to financial aid data, readers may
assume that if IPEDS data is available for a program, financial aid is also availa-ble).
• Health Practitioner Shortage Area Statistics • Maine job vacancy survey data • Longitudinal data • Help-wanted job information
Stakeholder demand for additional data is high and broadening the range of information included could enhance future reports. Absent additional resources and better data availability, inclusion of these data may not occur.

11
Abbreviations BLS Bureau of Labor Statistics
MDOL Maine Department of Labor
DHHS Department of Health and Human Services
CWRI Center for Workforce Research and Information
OES Occupational Employment Statistics
ACS American Community Survey
IPEDS Integrated Postsecondary Education Data System
NCES National Center for Education Statistics
SOC Standard Occupational Classification System
OOH Occupational Outlook Handbook (produced by BLS)
CPS Current Population Survey
MMC Maine Medical Center
CMMC Central Maine Medical Center
TUSM-MMC Tufts University School of Medicine - Maine Medical Center
n/a Not available
RN Registered Nurse
BSN Bachelors of Science in Nursing
ADN Associates Degree in Nursing
ACA Affordable Care Act
NP Nurse practitioner
CIP Classification of Instruction Program

12 | P a g e
Introduction Representing 18 percent of statewide employment and 19 percent of wages paid, healthcare is Maine’s largest economic sector, in terms of employment and wages. On this basis, healthcare is larger in Maine than it is for the nation, where it represents 14 and 13 percent of employment and wages, respectively.
Approximately 105,000 people were employed in the sector in 2011—one third at hospitals; 25 percent in ambulatory healthcare services and the remainder at nursing and residential care facilities and in social assistance. These four industries comprise the health sector. Health sector industry employment is classified in more detail in Appendix I.
Healthcare 18%
Healthcare is Maine's largest economic sector Percent of total statewide employment, 2011
Hospitals, 34%
Ambulatory healthcare services
25%
Nursing and residential care facilities 24%
Social Assistance 18%
Healthcare 18%
Maine health sector employment

13
Employment growth has been consistent. With the exception of a few hundred job losses in 2010, employment increased every year since 1990. Few, if any other sectors have a track record of such consistent job creation.
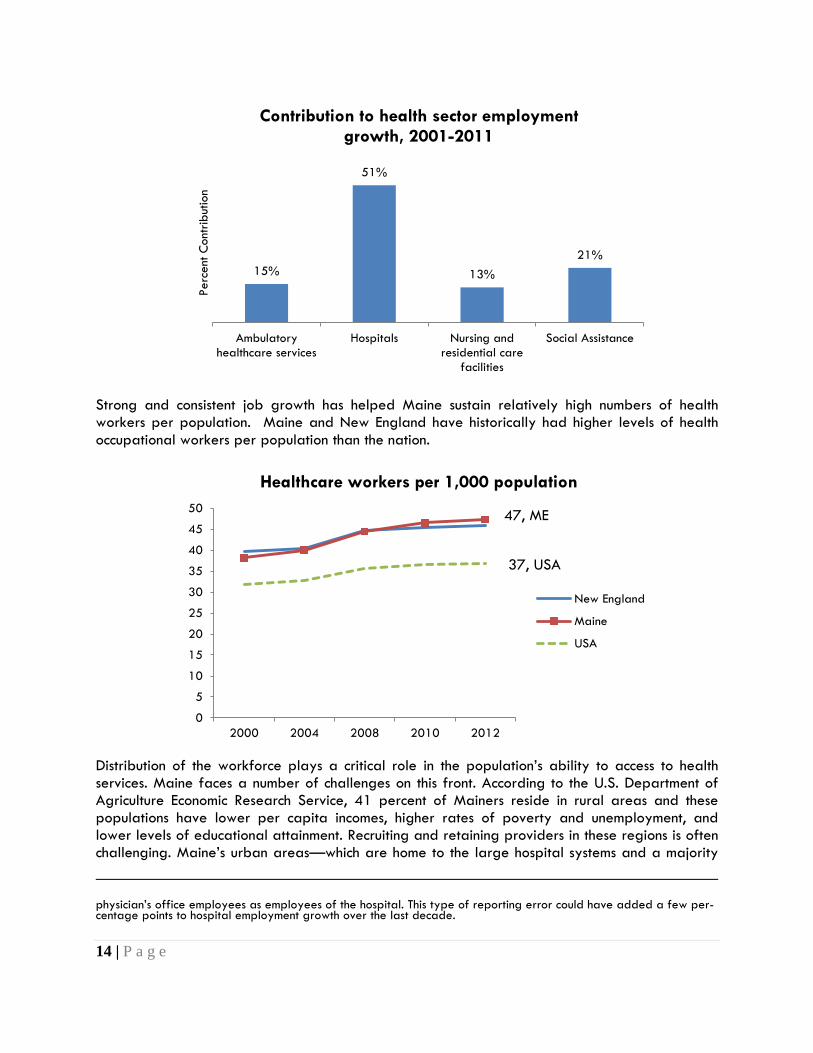
Employment growth has also been significant, increasing 80 percent since 1990 and 19 percent from 2001 to 2011. More net jobs were produced in healthcare over this ten year period than in all other job producing sectors, combined.
The hospital industry has been the primary driver of employment. From 2001 to 2011, hospital employment increased 32 percent and accounted for 50 percent of the total job gains.4
4 These figures may be skewed by the trend in consolidation of physician offices by hospitals. While the ownership structure of physician offices should not change a hospital’s total employment figures (unless the physician’s office is closed and the employees are moved into the hospital setting), it is possible that once acquired, hospitals could report
0
20
40
60
80
100
120
1990 1995 2000 2005 2010
Thou
sand
s of
Job
s
Year
Maine's health sector has been a consistent producer of jobs
-25,000
-20,000
-15,000
-10,000
-5,000
0
5,000
10,000
15,000
20,000
Hea
lthca
re
Adm
inist
rativ
e
Aco
mm
odat
ions
Educ
atio
n sv
cs
Mgt
of
cos
Publ
ic A
dmin
Prof
& T
ech
Svcs
Art
s, En
tert
ainm
ent
Min
ing
Agr
icul
ture
,…
Oth
er
Tran
sp.
Real
Est
ate
Util
ities
Who
lesa
le T
rade
Fina
nce
Info
rmat
ion
Con
stru
ctio
n
Reta
il
Mfg
Change in employment by sector, 2001-2011
14 | P a g e
Strong and consistent job growth has helped Maine sustain relatively high numbers of health workers per population. Maine and New England have historically had higher levels of health occupational workers per population than the nation.
Distribution of the workforce plays a critical role in the population’s ability to access to health services. Maine faces a number of challenges on this front. According to the U.S. Department of Agriculture Economic Research Service, 41 percent of Mainers reside in rural areas and these populations have lower per capita incomes, higher rates of poverty and unemployment, and lower levels of educational attainment. Recruiting and retaining providers in these regions is often challenging. Maine’s urban areas—which are home to the large hospital systems and a majority
physician’s office employees as employees of the hospital. This type of reporting error could have added a few per-centage points to hospital employment growth over the last decade.
15%
51%
13% 21%
Ambulatoryhealthcare services
Hospitals Nursing andresidential care
facilities
Social Assistance
Perc
ent C
ontr
ibut
ion
Contribution to health sector employment growth, 2001-2011
47, ME
37, USA
0
5
10
15
20
25
30
35
40
45
50
2000 2004 2008 2010 2012
Healthcare workers per 1,000 population
New England
Maine
USA

15
of the health workforce—offer better access and higher numbers of health workers per population. As seen in the table below, Cumberland County maintains a disproportionately large share of the workforce (31 percent) relative to its share of the population (21 percent), resulting in 50 percent more health workers per population than the state average, and Kennebec County has 20 percent more. More rural counties—Franklin, Oxford and Washington, in particular—have 20 to 50 percent fewer health workers per population.5
Distribution of Maine's Health Workforce
Total Employment, Health
Practitioners and Support Workers
Pct. (%) of Total
Pct. (%) of Population
Number of Health Workers
per 1,000 Residents
Androscoggin County 5,670 9.0% 8.1% 53
Aroostook County 3,750 6.0% 5.3% 53 Cumberland County 19,770 31.4% 21.4% 70
Franklin County 910 1.4% 2.3% 30
Hancock County 2,220 3.5% 4.1% 41
Kennebec County 6,840 10.9% 9.2% 56
Knox County 1,680 2.7% 3.0% 42
Lincoln County 950 1.5% 2.6% 28
Oxford County 1,450 2.3% 4.3% 25
Penobscot County 8,080 12.8% 11.6% 53
Piscataquis County 870 1.4% 1.3% 50
Sagadahoc County 420 0.7% 2.6% 12
Somerset County 2,380 3.8% 3.9% 46
Waldo County 930 1.5% 2.9% 24
Washington County 1,190 1.9% 2.4% 37
York County 5,080 8.1% 15.0% 26
Total 62,190 98.9%* 100% 47 Employment figures shown here are for healthcare practitioners (SOC 29-0000) and healthcare support workers (SOC 31-0000). *Some data is suppressed per BLS' data quality standards. In disaggregating the workforce by county we are able to account of 98.9% of employment.
5 One caveat of this type of analysis is that residents in counties with a low share of employment may still have good access to health services—if they are living in close proximity to a hospital system in a neighboring county. This is true for residents of Sagadahoc County, or residents in the southern portions of Oxford and Franklin Counties. York County also has a low share of employment; we believe a much higher proportion of the health workforce resides here, but they are employed in neighboring counties and states.

16 | P a g e
Strategies for promoting greater distribution include service conditioned loan forgiveness programs such as the Finance Authority of Maine’s (FAME) Dental Education Loan Repayment Program, which provides loan repayment assistance for those practicing general dentistry in un-derserved areas. Innovative education and training programs that integrate rural practice into course curricula may also result in graduates practicing in rural regions. The Longitudinal Integrated Clerkship (LIC) program at TUSM-MMC places 3rd year students in a rural community or Portland for nine months where they participate in giving care to a core group of patients over time. The University of New England College of Dental Medicine has 4th year students participate in clinical practices in rural locations, and the Central Maine Medical Center (CMMC) Family Medicine Residency prepares young doctors to be a rural family physician. The CMMC program is unique to New England and only one of five in the Eastern U.S. According to data on the CMMC website, 75 percent of Rural Training Track graduates practice in rural areas.
Going forward, the job outlook remains bright. According to MDOL employment projections, which address the period from 2010 to 2020, health sector employment is expected to increase 16 percent, well above the six percent growth projected for all jobs. Within the sector, jobs for healthcare practitioners and support workers are expected to grow 19 and 13 percent, respectively. These growth rates are among the highest for all major occupational groups, as seen in the figure below.
Similar to preceding years, hospitals are expected to contribute the majority of job opportunities. Hospital industry employment is expected to increase 30 percent, well above the rates for the other healthcare industries.
19%
14% 13% 10% 10% 8% 8% 7% 7% 7% 6% 6%
Employment projections for major occupational groups

17
Nationally, the employment outlook for health occupations is even stronger, primarily due to higher population growth forecasts, which foster greater overall economic and industry growth.
In addition to jobs resulting from new growth, employment opportunities will arise from the need to replace those that retire or otherwise permanently exit the occupation. The demographics of Maine’s health workforce are such that nearly one out of five are expected to retire or transition into other occupations by 2020, creating more job openings from replacement needs than from new growth.
8%
30%
10% 10%
Ambulatoryhealthcare
Hospitals Nursing & residentialcare
Social assistance
Employment projections for healthcare industries
0%
8% 6%
14% 16%
34%
17%
29%
Maine U.S.
2010 - 2020 projections: Maine vs. U.S.
Population growth
Total employment, alloccupations
Health sector employment
Health occupationalemployment
18 | P a g e
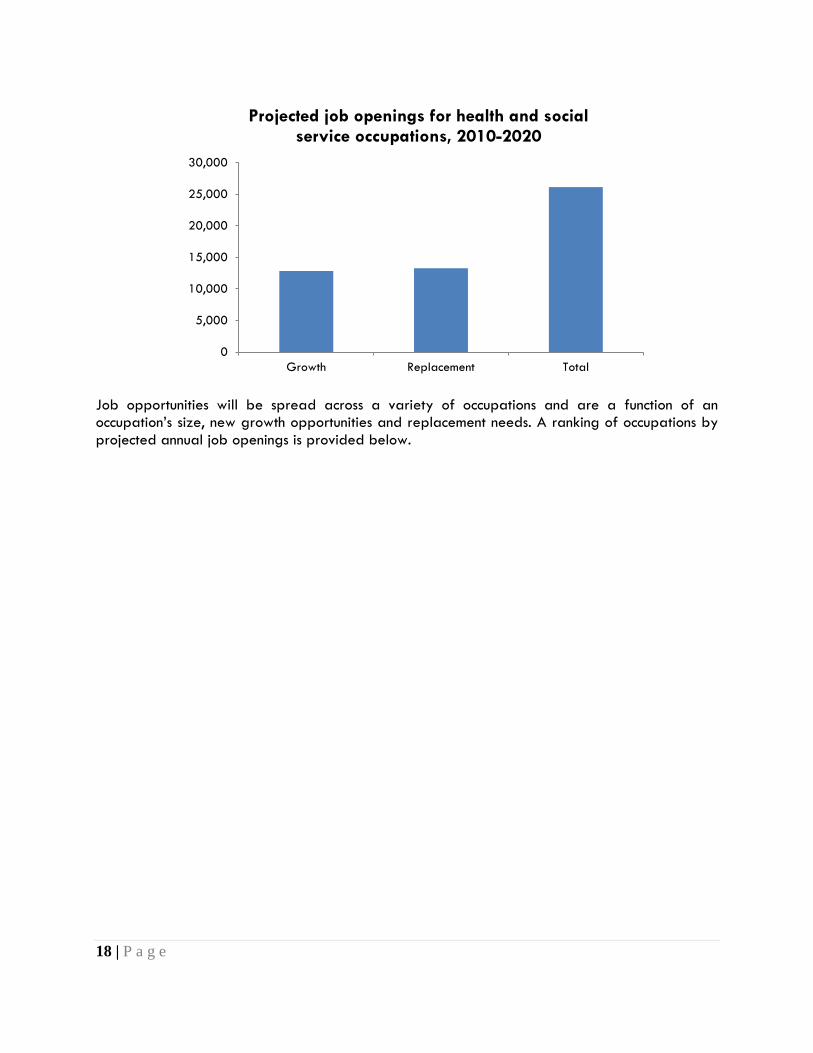
Job opportunities will be spread across a variety of occupations and are a function of an occupation’s size, new growth opportunities and replacement needs. A ranking of occupations by projected annual job openings is provided below.
0
5,000
10,000
15,000
20,000
25,000
30,000
Growth Replacement Total
Projected job openings for health and social service occupations, 2010-2020

19
0 100 200 300 400 500 600 700
Registered NursesNursing Aides, Orderlies, and Attendants
Personal and Home Care AidesHome Health Aides
Physicians and surgeonsEmergency Medical Technicians and Paramedics
Pharmacy TechniciansMedical Assistants
Licensed Practical and Licensed Vocational…Radiologic Technologists and Technicians
PharmacistsMental Health and Substance Abuse Social…
Medical Records and Health Information…Child, Family, and School Social Workers
Physical TherapistsPsychiatric AidesDental Hygienists
Occupational TherapistsRespiratory Therapists
Massage TherapistsDental Assistants
Medical and Public Health Social WorkersHealthcare Support Workers, All Other
Medical and Clinical Laboratory TechniciansPhysician Assistants
Surgical TechnologistsMedical and Clinical Laboratory TechnologistsClinical, Counseling, and School Psychologists
Speech-Language PathologistsDentists, General
Mental Health CounselorsPsychiatric Technicians
Health Technologists and Technicians, All OtherMedical Transcriptionists
Diagnostic Medical SonographersDietitians and Nutritionists
Cardiovascular Technologists and TechniciansMedical Equipment Preparers
Substance Abuse & Behavior Disorder…Occupational Health and Safety Specialists
Physical Therapist AssistantsHealthcare Practitioners and Technical…
Opticians, DispensingPhysical Therapist Aides
Athletic TrainersTherapists, All OtherRadiation Therapists
Nuclear Medicine TechnologistsOccupational Therapist Assistants
ChiropractorsOptometrists
Health Diagnosing and Treating Practitioners,…Dietetic Technicians
Recreational TherapistsRespiratory Therapy Technicians
Pharmacy AidesPodiatrists
Orthotists and ProsthetistsOccupational Health and Safety Technicians
AudiologistsOccupational Therapist Aides
Projected annual job openings by occupation

20 | P a g e
Most of the job opportunities will require at least some college education. Slightly more than 20 percent will require at least a bachelor’s degree.
Looking at the mix of projected annual job openings by minimum education required (the chart immediately above) understates the potential demand for future education capacity. This is due to the fact that labor force participants often pursue education levels beyond the minimum in order to enhance their career opportunities. RNs are a prime example: while an associate degree is the minimum requirement for licensing, most practicing RNs have at least a bachelor’s degree. The following chart looks at recent educational attainment for each health occupation and applies this to projected job openings.6 This shows the potential demand for different credentials if those who fill the jobs of the future have the same education levels as those currently practicing in the field. Measured this way, 39 percent of those filling the jobs of the future will need a bachelor’s degree or higher.
6 This is educational attainment by occupation according to 2005 – 2009 American Community Survey 5 year data (U.S. data).
Less than high school, 14%
High school diploma, 10%
Postsecondary non-degree award, 22%
Associate's degree, 31%
Bachelor's degree, 6%
Graduate or doctoral
degree, 17%
Mix of projected job openings by minimum education requirement
Less than high school
diploma, 5%
High school diploma or equivalent,
16% Some college, no degree,
18%
Associate's degree, 21%
Bachelor's degree, 21%
Master's degree, 8%
Doctoral or professional
degree, 10%
Mix of projected job openings by educational attainment

21
Responding to the health sector’s rapid growth, Maine’s education capacity increased and broadened. According to statistics from the Integrated Postsecondary Education Data System (IPEDS) and analysis from CWRI, there were 3,500 graduates from postsecondary healthcare programs in Maine in 2011, an increase of more than 30 percent from 2007. As noted earlier on the limitations of the data, IPEDS does not include adult and continuing education programs, and the absence of these statistics results in an incomplete picture of the state’s health education programs.
Most of the increase was due to growth in associate’s degrees and certificates awarded, which expanded nearly 40 and 90 percent, respectively. Bachelor and graduate degrees awarded increased 11 percent, much slower than for other programs primarily due to limited growth in nursing programs, which were capacity constrained by a dearth of doctoral prepared professors.
0
1000
2000
3000
4000
2007 2008 2009 2010 2011
Graduates from healthcare related programs (postsecondary)
0
200
400
600
800
1000
1200
1400
1600
1800
2007 2008 2009 2010 2011
Credentials Awarded
Bachelor's, graduatedegrees andpostgrad certificates
Associate's degrees
Certificates ≤ 2 yrs.

22 | P a g e
The near doubling of certificates awarded was primarily due to growth at schools other than community colleges. Certificates awarded from community colleges increased sharply as well, but off a much smaller base.
Other than community colleges includes Beal College, Intercoast Career Institute, Northeast Technical Institute, St. Joseph’s College of Maine, Seacoast Career Schools, University of Maine at Augusta, Spa Tech Institute, Kaplan, and Pierre’s School of Cosmetology.
Although overall education capacity increased, some areas of instruction have fewer program completers than the projected annual job openings for the corresponding occupation. While job seekers should find these conditions favorable, employers may experience difficulties filling positions creating upward pressure on wage rates. For consumers, lower availability of qualified health workers will result in diminished access to health services. Barring an economic downturn and an associated decline in job opportunities, closing the gap in these areas will require strategies for increasing program capacity, retaining existing workers for longer, increasing in-migration, or other means for enhancing supply. In areas of instruction where program completers exceed projected demand, job seekers will find the labor market more competitive while employers will enjoy a broader selection of candidates and less upward pressure on wage rates. Candidates with more education and experience will have an advantage in finding employment, all else equal. These dynamics will vary by region as labor supply and demand are unevenly spread throughout the state. Even with an abundance of program completers statewide, regional shortages may exist.
0
100
200
300
400
500
600
700
2007 2008 2009 2010 2011
Certificates (≤ 2 years) awarded
Other than communitycolleges
Community Colleges

23
Nursing Summary Statistics
Workforce Characteristics Registered Nurse
Nurse Practitioner
Nurse Midwives
Nurse Anesthetist
Licensed Practical Nurse
Employment (2012) 14,260 870 30 130 1,440 Employment per 1,000 population 10.7 0.65 0.02 0.10 1.1
Employment per population vs. U.S. Above avg. Above avg. Average Below avg. Below avg.
Average starting wage (Maine) $48,990 $68,190 $83,150 $124,170 $33,460
Median annual wage (Maine) $59,790 $87,160 $93,230 $163,570 $40,990
U.S. median annual wage $65,470 $89,960 $89,600 $148,160 $41,540 Median wage, all occupations in Maine $32,590 $32,590 $32,590 $32,590 $32,590
Minimum Education Requirement
Associate's degree
Master's degree
Master's degree
Master's degree
Postsecondary non-degree
Job Growth Projections (2010-2020)* 20% 20% 20% 20% 8%
National Median Age 45 45.4 n/a n/a 43.2
Top Industry of Employment Hospitals
Ambulatory health care
services Hospitals Hospitals
Nursing & residential
care facilities
Licensing Board Maine Board of Nursing
Maine Board of Nursing
Maine Board of Nursing
Maine Board of Nursing
Maine Board of Nursing
*Job growth expectations for RNs, nurse anesthetists, practitioners and midwives are grouped together by BLS.
Key points:
• Employment of RNs—Maine’s largest health occupation—is expected to increase 20 percent through 2020. Demand for nurses with a bachelor’s of science degree in nursing (BSN) should grow faster than average.
• Recruiting nurse faculty with masters and PhDs has been particularly difficult for Maine’s higher education institutions, and this has limited the growth in nursing graduates. The number completing RN programs at Maine’s schools has been flat (2007–2011).
• Although the number graduating with RN credentials each year exceeds MDOL’s projected annual job openings, the number graduating with BSNs may be insufficient to meet demand.

24 | P a g e
• The New England region has 30 percent more RNs per thousand residents compared to the nation. Maine has an average number of RNs per population compared to other states in the region (but nearly 30 percent more than that of the nation).
29-1141 Registered Nurses
Occupation description
Assess patient health problems and needs, develop and implement nursing care plans, and maintain medical records. Administer nursing care to ill, injured, convalescent, or disabled patients. May advise patients on health maintenance and disease prevention or provide case management. Licensing is required. Includes Clinical Nurse Specialists. Excludes "Nurse Anesthetists" (29-1151), "Nurse Midwives" (29-1161), and "Nurse Practitioners" (29-1171).
Illustrative examples: Coronary Care Unit Nurse, Hospice Registered Nurse, Psychiatric Nurse
Education requirements
Nationally, registered nurses usually take one of three education paths: a bachelor's of science degree in nursing (BSN), an associate’s degree in nursing (ADN), or a diploma from an approved nursing program. In Maine there are no diploma programs for RNs. Licensure of RNs and advanced practice nurses is governed by the Maine Board of Nursing.
All programs include supervised clinical experience in hospital departments such as pediatrics, psychiatry, maternity, and surgery. Bachelor's degree programs usually include more training in the physical and social sciences, communication, leadership, and critical thinking, which is becoming more important as nursing practice becomes more complex. They also offer more clinical experience in nonhospital settings. A bachelor's degree or higher is often necessary for administrative positions, research, consulting, and teaching.
Employment & Wages
In 2012 there were more than 14,000 RNs employed in Maine earning a median annual wage of nearly $60,000. Although the median wage was less than the national median, this is still a relatively high paying occupation, offering remuneration well above the average for all jobs in this state. Three industries—hospitals, ambulatory health care and nursing and residential care facilities—employed nearly 90 percent of RNs.
2012 Employment & Wage Statistics
Average
Employment Where are they
Employed? What do they Earn (Median)?
Registered Nurses 14,260 $59,790 Hospitals 63% $61,630 Ambulatory Health Care Services 13% $59,110 Nursing and Residential Care Facilities 11% $52,720
Source: 2012 Occupational Employment Statistics, CWRI

25
RN employment increased 34 percent from 2000 to 2012, above the 29 percent increase for all health occupations and well above Maine’s 4 percent population increase. Nationally, the RN workforce increased 27 percent, in-line with the increase for all health occupations and above the 10 percent population increase. In comparing RN employment with prior periods it is important to note that the SOC changed the way RNs are coded in 2012. Prior to 2012, RNs (29-1111) included advance practice nurses (nurse anesthetists, nurse practitioners, nurse midwives). Beginning in 2012 advance practice nurses are classified separately. In order to compare 2012 RN data with previous years, advance practice nurses are added back into 2012 RN employment.
Maine has historically had more RNs per thousand residents than the nation. In 2000, Maine had 17 percent more RNs per thousand residents than the nation; in 2012, 30 percent more. Note: these figures include advance practice RNs.
RNs, 34%
RNs, 27%
All health occupations,
29% All health
occupations, 27%
Population, 4%
Population, 10%
Maine U.S.
Employment and population growth, 2000 - 2012
0.0
2.0
4.0
6.0
8.0
10.0
12.0
14.0
2000 2002 2004 2006 2008 2010 2012
Employed RNs per 1,000 Population (includes advance practice nurses)
Maine
U.S.

26 | P a g e
Excluding advance practice nurses, Maine had 10.7 RNs per thousand residents in 2012, 28 per-cent more than the U.S.
Maine’s relatively high number of nurses per population has a regional context. New England has historically been the U.S. region most reliant on healthcare employment, and this is reflected in higher numbers of nurses per population. As seen in the table below, the number or RNs per thousand residents in Maine are comparable to that of New England.
RNs per 1,000 population, 2012
Employed RNs
Employed RNs per 1,000 residents
Massachusetts 79,570 12.0 Rhode Island 11,840 11.3 Maine 14,260 10.7 Vermont 6,310 10.1 Connecticut 34,820 9.7 New Hampshire 12,530 9.5 New England 159,330 10.9 U.S. 2,633,980 8.4 Source: CWRI analysis of OES & Census data
Maine’s relatively high numbers of RNs also reflect a trend of incorporating better educated and more skilled nurses into patient care within the health delivery system. Whereas other states have more extensively used nurses with lower levels of licensure, namely licensed practical nurses (LPNs), Maine was at the forefront in terms of increasing utilization of RNs. Thus, while RN employment increased rapidly from 2000 to 2012, LPN employment declined 41percent. And while Maine has a higher number of RNs per population, this is balanced by
10.7
8.4
Maine U.S.
RNs per 1,000 population, 2012 (Does not include advance practice RNs)

27
50 percent fewer LPNs (per population). On a combined basis, Maine has 10 percent more nurses (RN and LPN) per thousand residents than the nation.
Distribution of employment
The distribution of RN employment is uneven and concentrated around the state’s large hospital systems. As seen in the following table, Cumberland, Penobscot and Kennebec Counties maintain a disproportionately large share of employment (59 percent) relative to their share of the population (42 percent), resulting in 30 to 60 percent more RNs per population than the state average. More rural counties tend to have a much lower share of employment.7
This concentration of RN employment is part of a larger trend of jobs becoming more geographically centralized in Maine. The decline in manufacturing jobs in many outlying communities has left a lack of economic opportunity in these areas. At the same time, employment and economic activity have become more concentrated in the state’s more densely populated regions. This changing economic landscape presents a challenge to achieving a distributed healthcare workforce.
Distribution of Employment
Number Employed
Pct. (%) Total RN
Employment
Pct. (%) of Total Maine Population
Number Employed per 1,000 Population
Androscoggin County 1,430 10% 8% 13.3 Aroostook County 740 5% 5% 10.4 Cumberland County 4,650 33% 21% 16.4 Franklin County 360 3% 2% 11.8 Hancock County 360 3% 4% 6.6 Kennebec County 1,670 12% 9% 13.7 Knox n/a n/a 3% n/a Lincoln County 180 1% 3% 5.3 Oxford County 340 2% 4% 5.9 Penobscot County 2,020 14% 12% 13.1 Piscataquis County 160 1% 1% 9.3 Sagadahoc County 50 0% 3% 1.4 Somerset County 430 3% 4% 8.3 Waldo County 260 2% 3% 6.7 Washington County 260 2% 2% 8.0 York County 1,070 8% 15% 5.4 Total 14,260 98% 100% 10.7
U.S. 8.4
Source: CWRI analysis of OES & Census data
7 Distribution of employment is not a perfect measure for access to healthcare services, as some counties with a low share of RN employment have good access to hospitals located in neighboring counties. This is true for residents of Sagadahoc County, for example.

28 | P a g e
Knox County data is suppressed per BLS confidentiality standards.
Demographic, economic and social characteristics of the workforce
Demographic profile The RN population in Maine is predominantly female (93 percent) and white (98 percent). For reference, 95 percent of the overall population in Maine is white. The national nursing population has a comparable gender mix (91 percent female) but is more racially diverse (76 percent white).
Demographic Characteristics of the Nurse Population Total Race and Ethnicity
White alone All Other Maine U.S.A. Maine U.S.A. Maine U.S.A. Total 14,215 2,639,750 13,940 1,997,830 275 641,920
Percent 100% 100% 98% 76% 2% 24% Male 7% 9% 7% 6% 0% 3% Female 93% 91% 91% 70% 2% 22%
Source: EEO Tabulation 2006-2010 ACS file, CWRI
Employment status Of the RNs residing in Maine, nearly all (99 percent) were working at the time of survey and 94 percent were working in state (as opposed to other states).
RNs that are working in Maine 13,340 94%
RNs that are 'currently employed' 14,105 99%
RNs Residing in Maine 14,215 100%

Healthcare Occupations Report | P a g e 29
Nearly half of those working out of state resided in York County and were employed in New Hampshire (NH) and Massachusetts (MA). Nearly one out of every five nurses residing in York County was employed in other states. A small number of RNs living in NH and MA—45—were employed in York County.
Age distribution Forty-three and 12 percent of the RN workforce in Maine were above 50 and 60 years, respectively. Nationally, 38 and 10 percent were above 50 and 60 years. The U.S. nursing population has a greater proportion of younger nurses (36 percent below 40 years compared to 27 percent for Maine). Comparing age distribution by gender, Maine has a much higher proportion of male RNs above 50 years than the nation (44 versus 31 percent).
Age Distribution, RNs Working in Maine Total % Male % Female % 16 to 39 years 3,555 27% 290 29% 3,265 26% 40 to 44 years 1,855 14% 95 10% 1,760 14% 45 to 49 years 2,130 16% 155 16% 1,975 16% 50 to 54 years 2,195 16% 100 10% 2,095 17% 55 to 59 years 1,930 14% 185 19% 1,745 14% 60 to 69 years 1,505 11% 140 14% 1,365 11% 70 years and over 170 1% 10 1% 160 1% Total 13,340 100% 975 100% 12,365 100% Source: EEO Tabulation 2006-2010 ACS file, CWRI
Residing and employed in
Maine 94%
Not employed 1%
Residing in Maine,
employed in NH & MA
2% Telecommuting or suppressed
data 3%
RN Residence and Place of Work

30 | P a g e
Age Distribution, RNs Working in U.S.A. Total % Male % Female % 16 to 39 years 899,970 36% 91,430 41% 808,545 35% 40 to 44 years 318,350 13% 32,555 15% 286,095 12% 45 to 49 years 370,355 15% 31,105 14% 339,450 15% 50 to 54 years 393,620 16% 30,950 14% 362,675 16% 55 to 59 years 299,625 12% 23,545 11% 276,080 12% 60 to 69 years 216,920 9% 12,770 6% 204,150 9% 70 years and over 23,950 1% 915 0% 23,035 1% Total 2,522,790 100% 223,270 100% 2,300,030 100% Source: EEO Tabulation 2006-2010 ACS file, CWRI
Average workweek Hours worked per week by Maine’s oldest nurses were in line or above that of younger cohorts. Of the RNs above 55 years old, 40 percent worked between 40 and 49 hours per week, on average.
Num
ber
of R
Ns
Avg. hours worked per week
Hours Worked per Week by Age Group
RN age 19 to 35 yrsRN age 36 - 55 yrsRN age above 55 yrs

Healthcare Occupations Report | P a g e 31
Educational attainment Educational attainment for RNs in Maine is comparable to the U.S. average.8
Educational Attainment, Maine RNs
Total Male Female Not a HS graduate 0% 0% 0% HS graduate
3% 3% 3%
Some college or Associate 45% 49% 44% Bachelor's degree 43% 33% 43% Graduate or professional 10% 15% 10% Total
100% 100% 100%
Source: EEO Tabulation 2006-2010 ACS file, CWRI
Educational Attainment, U.S. RNs Total Male Female Not a HS graduate 0% 0% 0% HS graduate 1% 1% 1% Some college or Associate 44% 39% 45% Bachelor's degree 45% 48% 45% Graduate or professional 10% 12% 10% Total 100% 100% 100%
Source: EEO Tabulation 2006-2010 ACS file, CWRI
Schools offering training and number completing
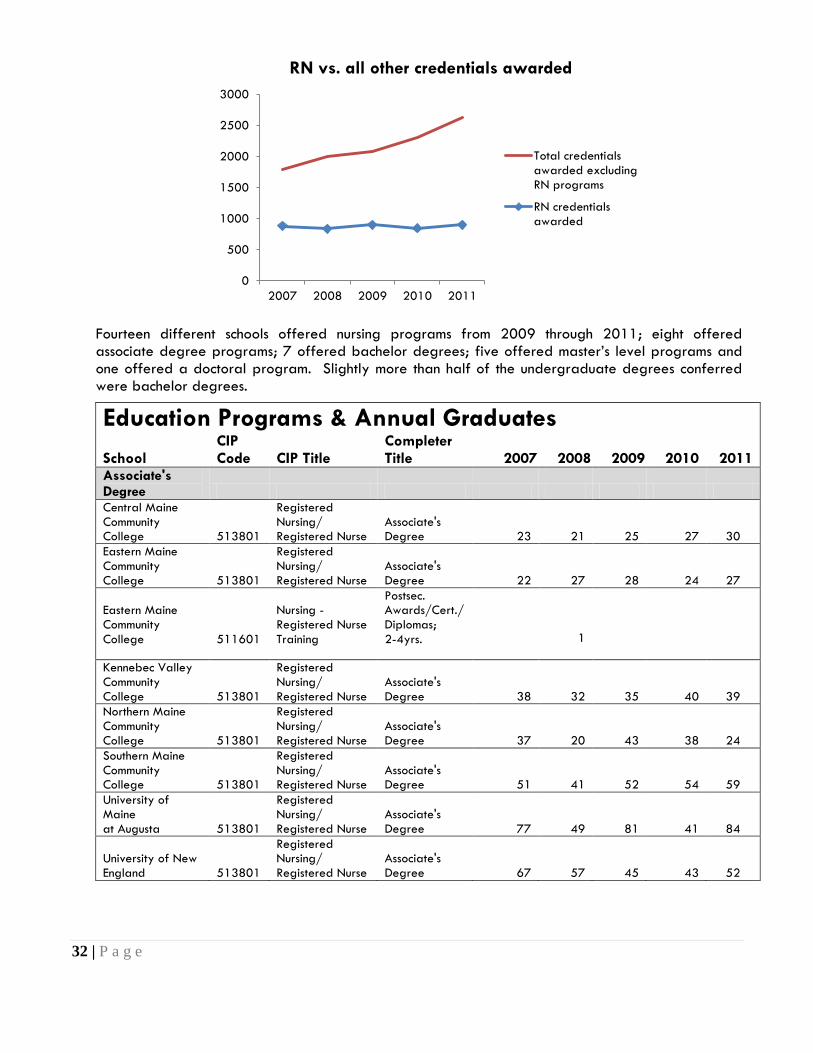
From 2007 through 2011 there were 800 to 900 students graduating from Maine’s nursing programs each year, with nearly half earning bachelor degrees. Overall growth in RN credentials awarded has been flat, in part due to difficulties recruiting masters and doctoral prepared teaching staff. By contrast, all other credentials awarded for postsecondary health related instruction increased nearly 50 percent.
8 These statistics are very similar to nursing workforce survey data made available by OMNE, which show 54 percent of Maine’s RNs as having at least a baccalaureate degree; Update Maine Nursing Workforce Data, OMNE Annual Meeting Oc-tober, 2013, Lisa Harvey-McPherson, Susan Sepples.
32 | P a g e
Fourteen different schools offered nursing programs from 2009 through 2011; eight offered associate degree programs; 7 offered bachelor degrees; five offered master’s level programs and one offered a doctoral program. Slightly more than half of the undergraduate degrees conferred were bachelor degrees.
Education Programs & Annual Graduates School
CIP Code CIP Title
Completer Title 2007 2008 2009 2010 2011
Associate's Degree Central Maine Community College 513801
Registered Nursing/ Registered Nurse
Associate's Degree 23 21 25 27 30
Eastern Maine Community College 513801
Registered Nursing/ Registered Nurse
Associate's Degree 22 27 28 24 27
Eastern Maine Community College 511601
Nursing - Registered Nurse Training
Postsec. Awards/Cert./Diplomas; 2-4yrs.
1
Kennebec Valley Community College 513801
Registered Nursing/ Registered Nurse
Associate's Degree 38 32 35 40 39
Northern Maine Community College 513801
Registered Nursing/ Registered Nurse
Associate's Degree 37 20 43 38 24
Southern Maine Community College 513801
Registered Nursing/ Registered Nurse
Associate's Degree 51 41 52 54 59
University of Maine at Augusta 513801
Registered Nursing/ Registered Nurse
Associate's Degree 77 49 81 41 84
University of New England 513801
Registered Nursing/ Registered Nurse
Associate's Degree 67 57 45 43 52
0
500
1000
1500
2000
2500
3000
2007 2008 2009 2010 2011
RN vs. all other credentials awarded
Total credentialsawarded excludingRN programs
RN credentialsawarded

Healthcare Occupations Report | P a g e 33
Central Maine Medical Center College of Nursing and Health Professions 513899
Registered Nursing, Nursing Administration, Nursing Research and Clinical Nursing, Other
Associate's Degree 42 38 52 41 51
Subtotal
357 286 361 308 366 Bachelor's Degree
Husson University 513801
Registered Nursing/ Registered Nurse
Bachelor's Degree 50 38 39 31 36
Saint Joseph's College of Maine 513801
Registered Nurs-ing/Registered Nurse
Bachelor's Degree 67 71 56 73 57
University of Maine 513801
Registered Nursing/ Registered Nurse
Bachelor's Degree 88 94 90 84 79
University of Maine at Fort Kent 513801
Registered Nursing/ Registered Nurse
Bachelor's Degree 38 52 43 40
University of Maine at Fort Kent 513808 Nursing Science
Bachelor's Degree
59
University of New England 513801
Registered Nursing/ Registered Nurse
Bachelor's Degree
12 14 19 18
University of Southern Maine 513801
Registered Nursing/ Registered Nurse
Bachelor's Degree 145 172 168 165 164
Subtotal
388 439 410 412 413 Post-Baccalaureate Certificate Saint Joseph's College of Maine 513802
Nursing Administration
Post-Baccalaureate Certificates 1
1 1
Subtotal
0 1 0 1 1 Master's Degree
University of Maine 513801
Registered Nursing/ Registered Nurse
Master's Degree 15 3 6 14 6
Saint Joseph's College of Maine 513802
Nursing Administration
Master's Degree 27 41 44 31 27
University of Southern Maine 513803
Adult Health Nurse/Nursing
Master's Degree
6 3
University of Southern Maine 513805
Family Practice Nurse/Nursing
Master's Degree
15 21
University of Southern Maine 513810
Psychiatric/ Mental Health Nurse/Nursing
Master's Degree
12 6
University of Southern Maine 513820
Clinical Nurse Leader
Master's Degree
5 5
University of Southern Maine 511601
Nursing - Registered Nurse Training
Master's Degree 27 28 36
University of New England 511604 Nurse Anesthetist
Master's Degree 32 26 22 22 29
Husson College 511699 Nursing, Other Master's Degree 1

34 | P a g e
Husson University 511605
Family Practice Nurse/Nurse Practitioner
Master's Degree 16 8 6 6 13
Husson University 511610
Psychiatric/ Mental Health Nurse/Nursing
Master's Degree 8
3 3
Subtotal
126 106 117 114 110 Post-Master's Certificates
University of Maine 513801
Registered Nursing/ Registered Nurse
Post-Master's Certificates
1 1
University of Southern Maine 513810
Psychiatric/ Mental Health Nurse/Nursing
Post-Master's Certificates
2 2 1
University of Southern Maine 511605
Family Practice Nurse/Nurse Practitioner
Post-Master's Certificates 1
1 1 1
Husson College 511605
Family Practice Nurse/Nurse Practitioner
Post-Master's Certificates 2
Husson College 511610
Psychiatric/ Mental Health Nurse/Nursing
Post-Master's Certificates 1
Subtotal
4 0 3 4 3 Doctoral Degrees
University of Maine 511601
Nursing Registered Nurse Training
Doctor's Degrees
1
Total 875 832 892 839 893 Source: IPEDS, CWRI
Outlook
Driven by technological advances, an aging population and heightened attention to preventative care, the outlook for RN employment is bright. Nationally, employment of RNs is expected to expand 26 percent from 2010 to 2020, well above the 14 percent growth projected for all occupations. In Maine, RN employment is expected to increase 20 percent, faster than the six percent growth expected for all occupations. Growth is expected to be strong across a variety of employment settings.
The U.S. Bureau of Labor Statistics (BLS) provides the following assessment of major trends affecting employment:
Faster than average growth is expected in traditional hospital settings, as well as in non-hospital settings, such as physician’s offices and home healthcare services.
Growth is expected to be much faster than average in outpatient care centers, where patients do not stay overnight, such as those that provide same-day chemotherapy, rehabilitation, and surgery. Also, an increased number of procedures, as well as more sophisticated procedures once done only in hospitals, are being done in physicians' offices.
The financial pressure on hospitals to discharge patients as soon as possible should mean more people admitted to extended and long-term care facilities and more need for home

Healthcare Occupations Report | P a g e 35
healthcare. As the baby boomers grow older, there will be greater demand for home healthcare.
In addition, because many older people want to be treated at home or in residential care facilities, registered nurses will be in demand in those settings. Job growth is also expected in facilities that provide long-term rehabilitation for stroke and head injury patients, as well as facilities that treat people with Alzheimer's disease (memory loss, dementia).
In Maine, hospitals employ nearly two thirds of RNs and are projected to grow 30 percent. This growth will be a tailwind for nursing employment. Across industries, 580 RN job openings are expected annually, 300 from growth in demand and 280 from the need to replace those retiring or otherwise leaving the occupation. These figures represent the minimum measure for annual training needs.9
Employment of RNs* in Maine, 2010 and Projected 2020 Average
Employment Change in Employment
(2010-2020) Projected Annual Openings Resulting from New Growth
2010 2020 Net Percent
15,335 18,358 3,023 19.7% 302
* Projections include advanced practice nurses Source: CWRI 2010-2020 Employment Projections
These projections assume that the utilization of RNs will increase in most employment settings as organizations seek to contain costs. These assumptions are outlined below.10
9 Total annual job openings are considered a minimum number of the workers that need to be trained each year due to the fact that not all who complete training enter the occupation and replacement openings are based on net as opposed to gross flow of workers in an out of the occupation.
10 These nursing utilization assumptions are based on national estimates. As such, a bias may result due to the extent that Maine’s trends may be different from national trends.
302 278
580
Growth Replacement Total
Projected Average Annual Job Openings for RNs

36 | P a g e
Factors affecting nursing utilization
Offices of physicians A small increase is expected as
registered nurses are increasingly performing tasks of higher paid
workers when appropriate in order to contain costs.
General medical and surgical hospitals; local
General medical and surgical hospitals; private
Home health care services
A small decrease is expected as registered nurses take on other
responsibilities and are replaced with more cost-effective home
health aides.
The projections also assume that 18 percent of the RN workforce will need to be replaced from 2010 to 2020 due to workers retiring or otherwise permanently leaving the occupation. The replacement rate is based on analysis of employment patterns of the U.S. nurse workforce. Since Maine’s RNs are older than the nation’s using a replacement rate that is based on national trends may be too low.
CWRI analyzed the impact that higher replacement rates would have on projected job openings for RNs in Maine. The analysis showed that for every two percentage point increase in the rate of retirements, the estimated number of annual job openings would increase by approximately 30 (a 20 percent replacement ratio equates to 307 replacement job openings per year or 610 total job openings; a 22 percent ratio results in 337 replacement openings for a total of 640 job openings, etc.). Replacement and total job openings resulting from different replacement ratios are provided below. These figures are useful for analyzing different scenarios of supply vs. demand.
Impact of Replacement Rates on Projected RN Job Openings
Replacement Rate
Annual Job Openings due
to Replacement Needs
Annual Job Openings due
to Growth
Total Job Openings
16% 245 302 547 18% 278 302 580 20% 307 302 609 22% 337 302 639 24% 368 302 670
Highlighted area indicates current BLS assumptions.
Finally, it is also important to note that employment projections do not incorporate assumptions about how the health delivery system may change as a result of the Affordable Care Act (ACA), as the regulations were not complete when the estimates were created. For further discussion on the

Healthcare Occupations Report | P a g e 37
limitations of the data, please refer to the section, Data sets and limitations, at the beginning of this report.
Supply vs. Projected Demand As the largest healthcare occupation, RNs play a central role in the delivery of services and care. And reflecting increased utilization and industry growth, robust demand is projected for the coming decade. Maine’s RN education capacity has been flat in recent years, and coupled with the prospect of pending retirements of existing nurses, the issue of whether or not capacity will be sufficient to meet demand is paramount. This is a complex and difficult question to answer given the range of factors that will affect the supply and demand for nurses in coming years including, but not limited to, changes in access, evolving models of care and delivery, changing patterns of net-migration and the willingness of existing practitioners to remain in the workforce.
For a basic framework to assess the issue we used projected annual job openings and average annual program completers (three year average) as proxies for demand and supply. As noted above, projected job openings assume 20 percent growth in demand for RNs and an 18 percent replacement rate, and these estimates do not incorporate assumptions about how the health delivery system may change as a result of the ACA. On the supply side, the more than 800 graduates from Maine’s education programs represent the overwhelming majority of incremental supply each year. For the purposes of this analysis, additional sources of supply including the in-migration of nurses from other states and foreign countries and re-activations of licenses from nurses that let them expire are assumed to offset RNs that leave the state for employment or other reasons. Moreover, the analysis assumes that nurses that train in Maine will seek employment here.11
Given these simplifying assumptions, for all degree programs combined, total capacity for RN education in Maine appears sufficient to meet projected job openings. According to these figures, the annual supply of new entrants would be sufficient to absorb a material increase in retirement rates, a meaningful portion of the graduates leaving the state each year or a substantial increase in job opportunities resulting from stronger than expected economic growth; or some combination of the above. There are limitations to this type of analysis. Not all who are licensed will necessarily seek employment and some only part-time. Also, new entrants typically lack the experience of those retiring. Readers are encouraged to review the limitations of the data as noted in the beginning of this report.
11 Basic sources of supply are new graduates, in-migration of nurses from other states, an influx of foreign trained nurses and re-activations of licenses from nurses that let them expire. The workforce could be depleted by existing nurses or new graduates opting to leave the state for employment or for other reasons, and license expirations due to retirements or departure from the occupation. ACS data reveals that five percent of Maine’s existing RN workforce was employed out of state; for the purposes of this analysis it is assumed that the incremental number of nurses opting to leave Maine each year offsets those coming in as well as license re-activations. Retirement rate assumptions are captured in projected openings. Research indicates that, at least for RNs, the overwhelming majority that graduate from Maine’s programs find employment in this state.
Although the number of new graduates each year is a reasonable proxy for incremental supply, new entrants typically lack the experience of workers they will be replacing. In general, employers prefer to hire experienced nurses; graduates could have difficulties finding employment without the needed experience.

38 | P a g e
Although total program capacity exceeds projected annual job openings, it’s also important to consider supply and demand by credential. As care giving becomes more complex and the role of RNs within the health delivery system expands the need for bachelor trained nurses will increase. To better equip nurses to meet these increased responsibilities the Institute of Medicine recommends that the proportion of nurses with baccalaureate degrees be increased to 80 percent by 2020.12 Approximately 55 percent of RNs in Maine have a bachelor’s degree or higher.13
How does Maine’s BSN program capacity compare to projected demand? MDOL’s employment projections are for RNs of all credential types combined, which makes it difficult to quantify demand for bachelor’s trained nurses specifically. We do know that hospitals are on the leading edge of incorporating better educated nurses into the delivery system and are predisposed toward hiring BSNs over those with associate credentials, all else equal.14 Moreover, given their size and projected growth, hospitals are expected to represent the majority of RN hiring demand in coming years—three out of four RNs hired are expected to be at a hospital. If hospitals opt to fill their nurse vacancies each year only with those that have a BSN, they could absorb the entire supply of graduates from Maine’s schools each year.
12 National Academy of Sciences, Institute of Medicine, The Future of Nursing: Focus on Education, on the Internet at http://www.iom.edu/Reports/2010/The-Future-of-Nursing-Leading-Change-Advancing-Health/Report-Brief-Education.aspx (visited December 03, 2013).
13 Update Maine Nursing Workforce Data, OMNE Annual Meeting October 2013, Lisa Harvey-McPherson, Susan Sepples. The 2006- 2010 ACS shows similar figures.
14 Hospitals seeking magnet status and employers guided by the Institute of Medicine’s objectives—which call for nurses to achieve higher levels of education in order to fill their expanding role within healthcare—may opt to hire more BSNs over those with associate credentials.
874
580
Supply of new entrants (all credentialtypes)
Projected job openings
Annual Nursing Completers vs. Projected Job Openings

Healthcare Occupations Report | P a g e 39
*Estimate assumes the replacement rate for RNs at hospitals is the industry average. RN job opening estimates are
for all forms of RNs.
This perspective indicates a tighter balance between the supply and demand for bachelors prepared nurses. Note that this analysis does not include demand from other industries (e.g., ambulatory clinics, nursing and residential care facilities) that may also utilize BSNs. On the other hand, not all hospitals may seek to hire BSNs disproportionately.
A limited pool of doctoral-prepared teaching faculty and steep competition for these professionals from higher paying industry employers has been a barrier to capacity growth, both locally and nationally. According to an American Association of Colleges of Nursing (AACN) survey of nursing programs at 662 institutions around the country, eight percent of full-time nursing faculty positions and seven percent of part-time positions were vacant during the 2012–2013 academic year.15 Recruiting nurse faculty with masters and PhDs has been particularly difficult for Maine’s higher education institutions.
15 Special Survey on Vacant Faculty Positions, released October 2012 from the American Association of Colleges of Nursing (AACN).
448 412 = BSN
118 = Advance practice RNs
RN job openings at hospitals* Baccalaureate and advance practicegraduates (IPEDS)
Estimated Annual Job Openings for RNs at Hospitals & Supply of Baccalaureate and
Advance Practice Nurses

40 | P a g e
29-1171 Nurse Practitioners
Occupation description
Diagnose and treat acute, episodic, or chronic illness, independently or as part of a healthcare team. May focus on health promotion and disease prevention. May order, perform, or interpret diagnostic tests such as lab work and x rays. May prescribe medication. Must be registered nurses who have specialized graduate education.
Illustrative examples: Gerontological Nurse Practitioner, Family Practice Nurse Practitioner, Cardiology Nurse Practitioner
Education requirements
Nurse Practitioners (NPs) are Registered Nurses with graduate education in nursing. Most NPs have a master’s degree, which requires two years of full-time study beyond the bachelor’s degree in nursing. Also, there is a growing national movement to require all NPs to earn a Doctor of Nursing Practice (DNP) degree. This degree is called a practice doctorate and is similar to the academic credentials earned by dentists (DDS), physicians (MD/DO), clinical psychologists (PsyD or PhD), clinical pharmacists (PharmD) and other health care providers. DNP programs require three to four years study beyond a bachelor’s degree in nursing.
Employment & Wages
In 2012 there were an estimated 870 nurse practitioners employed in Maine earning a median annual wage of nearly $90,000. These wages are comparable to the national average and significantly above the median wage for all jobs in Maine. Nurse practitioners are employed within various outpatient settings and hospitals.
2012 Employment & Wage Statistics
Average Employment Median Annual Salary
Maine 870 $87,160 Industries with Highest Share of Employment (% total) Ambulatory Health Care Services 59% $85,890 Hospitals 29% $89,280 Social Assistance 3% $77,370
Employment of NPs in Maine and the U.S. equate to .65 and .34 nurse practitioners per thousand residents. Accordingly, Maine had nearly twice the number of NPs than the nation on a per population basis.

Healthcare Occupations Report | P a g e 41
Distribution of employment
Similar to RNs, the distribution of NP employment is uneven and concentrated in counties with the state’s largest hospital systems; 64 percent are employed in 3 counties that represent 42 percent of the Maine population (Cumberland, Penobscot and Kennebec).
Distribution of Employment
Number Employed
Pct. (%) total RN
employment
Pct. (%) of total Maine Population
Number employed per
thousand population
Cumberland County
290 33% 21% 1.0
Penobscot County 180 21% 12% 1.2 Kennebec County 90 10% 9% 0.7 Androscoggin County 80 9% 8% 0.7
Aroostook County 60 7% 5% 0.8 York County 50 6% 15% 0.3 Waldo County 40 5% 3% 1.0 Hancock County 30 3% 4% 0.5 Washington County 30 3% 2% 0.9
Oxford County 20 2% 4% 0.3 Maine 870 0.65 USA 0.34 Source: CWRI analysis of OES & Census data Some counties have suppressed data per BLS confidentiality standards.
Demographic, economic and social characteristics of the workforce
NOTE—The ACS combines nurse practitioners and nurse midwives together. The following data is for both occupations combined. All other data provided is only for nurse practitioners unless otherwise stated.
0.65
0.34
Maine U.S.
Nurse Practitioners per 1,000 Population, 2012

42 | P a g e
Demographics Maine’ NP and midwife population is 84 percent female and 99 percent white. The proportion of male nurse practitioners and midwives is more than twice the national average (16 vs. 7 percent).
Demographic Characteristics of the Nurse Practitioner and Midwife Population
Total Race and Ethnicity
Maine U.S.A. White alone All Other Maine U.S.A. Maine U.S.A. Total 730 81,805 720 70,150 10 11,655 Percent 100% 100% 99% 86% 1% 14% Male 16% 7% 16% 6% 0% 1% Female 84% 93% 83% 80% 1% 13% Source: CWRI analysis of ACS 2006-2010 5 year file
Employment status Nearly all of the NPs and midwives were employed at the time of survey. A small portion was working outside of Maine.
Age distribution Fifty and seven percent of Maine’s nurse practitioners and midwives were above 50 and 60 years old, respectively. Nationally, 41 and 12 percent were above 50 and 60 years.
NPs and Midwives that are working in Maine. 680 93%
NPs and Midwives that are 'currently employed.' 705 97%
Nurse Practitioners and Midwives Residing in Maine 730 100%

Healthcare Occupations Report | P a g e 43
Age Distribution, Nurse Practitioners & Midwives
Maine (%) U.S. (%)
16 to 39 years 22.8% 29.6% 40 to 44 years 10.3% 15.2% 45 to 49 years 16.9% 14.0% 50 to 54 years 14.7% 14.6% 55 to 59 years 27.9% 14.4% 60 to 69 years 7.4% 10.9% 70 years and over 0.0% 1.2% Total 100% 100% Source: EEO Tabulation 2006-2010 ACS file, CWRI
Schools offering training and number completing
In 2011 there were 110 nursing graduates with master’s degree from five schools. St. Joseph’s, University of Maine, University of New England, Husson and University of Southern Maine offered graduate level programs in nursing.
126
106
117 114
110
2007 2008 2009 2010 2011
Graduates of Advanced Practice Nursing Programs

44 | P a g e
Education Programs & Annual Graduates School
CIP Code CIP Title Completer Title 2007 2008 2009 2010 2011
Master's Degree
University of Maine 513801
Registered Nursing/Registered Nurse Master's Degree 15 3 6 14 6
Saint Joseph's College of Maine 513802
Nursing Administration Master's Degree 27 41 44 31 27
University of Southern Maine 513803
Adult Health Nurse/Nursing Master's Degree
6 3
University of Southern Maine 513805
Family Practice Nurse/Nursing Master's Degree
15 21
University of Southern Maine 513810
Psychiatric/Mental Health Nurse/Nursing Master's Degree
12 6
University of Southern Maine 513820
Clinical Nurse Leader Master's Degree
5 5
University of Southern Maine 511601
Nursing -Registered Nurse Training Master's Degree 27 28 36
University of New England 511604 Nurse Anesthetist Master's Degree 32 26 22 22 29 Husson College 511699 Nursing, Other Master's Degree 1
Husson University 511605
Family Practice Nurse/Nurse Practitioner Master's Degree 16 8 6 6 13
Husson University 511610
Psychiatric/Mental Health Nurse/Nursing Master's Degree 8
3 3
Subtotal
126 106 117 114 110 Post-Master's Certificates
University of Maine 513801
Registered Nursing/Registered Nurse
Post-Master's Certificates
1 1
University of Southern Maine 513810
Psychiatric/Mental Health Nurse/Nursing
Post-Master's Certificates
2 2 1
University of Southern Maine 511605
Family Practice Nurse/Nurse Practitioner
Post-Master's Certificates 1
1 1 1
Husson College 511605
Family Practice Nurse/Nurse Practitioner
Post-Master's Certificates 2
Husson College 511610
Psychiatric/Mental Health Nurse/Nursing
Post-Master's Certificates 1
Subtotal
4 0 3 4 3 Doctoral Degrees
University of Maine 511601 Nursing -Registered Nurse Training Doctor's Degrees
1
Total 875 831 892 839 893 Source: IPEDS, CWRI

Healthcare Occupations Report | P a g e 45
Outlook
The employment outlook for nursing is bright. In particular, the demand for advanced practice nurses, including nurse practitioners will be high, especially in underserved areas such as rural locations and inner cities.
Detailed occupational employment projections for nurse practitioners are not yet broken out by MDOL—they are part of RN employment projections. For more detail, see the ‘Outlook’ for RNs.
Ambulatory health services and the hospital industry employ 90 percent of NPs and these industries are expected to experience employment gains of 8 and 30 percent, respectively.

46 | P a g e
29-1161 Nurse Midwives
Occupation description
Diagnose and coordinate all aspects of the birthing process, either independently or as part of a healthcare team. May provide well-woman gynecological care. Must have specialized, graduate nursing education.
Illustrative example: Certified Nurse Midwife (CNM)
Education requirements
The Certified Nurse Midwife (CNM)/Certified Midwife (CM) degree is earned by completing a nationally accredited program and then passing the national certification exam. There are currently 42 programs accredited by the American College of Nurse-Midwives (ACNM) in the United States. Four of these are post-baccalaureate certificate programs and 39 are graduate programs. Completion of a graduate degree is required for entry into clinical practice throughout the United States.
Almost all programs require applicants to hold a bachelor’s degree. The majority also require that applicants be a registered nurse (RN), although there are a growing number of programs geared toward students who hold a non-nursing bachelor’s degree. Some, but not all, require that entering RNs hold a bachelor’s degree in nursing (BSN).
If your degree is not in nursing (BA/BS), you will become a certified midwife. If your degree is in nursing (BSN), you will become a certified nurse-midwife. In most cases, RNs who don't have a bachelor's degree are required to complete a bachelor’s degree before attending a CNM program. Some programs offer a flexible option that enables nurses with associate degrees to complete their bachelor’s studies in the course of the CNM program.
The CNM and CM certification is different from the Certified Professional Midwife (CPM) designation, which does not require one to have an advanced degree or be a registered nurse. Whereas CNM programs are accredited by the ACNM, CPM programs are associated with the Midwives Alliance of North America (MANA). Compared to CPMs, CNMs and CMs have a broader and more comprehensive scope of practice. According to the Standard Occupational Classification system, the definition of nurse midwives excludes CPMs. CPMs are classified in another occupational category.16
CNMs are licensed in all 50 states and the District of Columbia. The Maine Board of Nursing governs the licensure of nurse midwives in Maine. CMs must meet the same rigorous standards of practice as CNMs, but because this is a relatively new option for preparation, CMs are only licensed to practice in New York, New Jersey and Rhode Island.
In terms of the clinical services they provide, there is virtually no difference between a CNM and a CM. There also is no significant difference between a certificate- and master’s-prepared CNM.
16 CWRI has yet to see the CPM title from a survey respondent. Coding of CPMs would depend on the primary occupation. If the CPM is an RN or LPN, they would be classified as such. Alternatively they could be grouped into a residual category, such as health diagnosing and treating practitioners, all other (29-1199) or health technologists and technicians, all other (29-2099).

Healthcare Occupations Report | P a g e 47
Employment & Wages
In 2012 there were an estimated 30 nurse midwives employed in Maine earning an annual median wage of $93,000. These wages were comparable to the national average and well above the median wage for all jobs in Maine. Nurse midwives are typically employed by hospital systems.
2012 Employment & Wage Statistics Average Employment Median Annual Salary Maine 30 $93,230
In Maine and the U.S. there are approximately the same number of midwifes per population—0.02 per thousand residents or one for every 50,000 people.
Demographic, economic and social characteristics of the workforce
Note: ACS data for nurse midwives is combined with nurse practitioners. See the nurse practitioner section for the data presentation.
Schools offering training and number completing
There are no nurse midwife (CNM or CM) programs in Maine. The Birthwise Midwifery School, which has had 5 graduates per year on average, offers a CPM credential. As noted above, the CPM is different from the CNM and CM.
Outlook
The outlook for nursing is bright. In particular, the demand for advanced practice nurses is expected to be high, especially in underserved areas such as rural locations and inner cities.
The hospital industry—which is the majority employer of midwives—is expected to be a significant driver of employment growth. Hospital industry employment is expected to increase by 30 percent from 2010 to 2020, well above the mid-single digit growth expected for all industries.
Detailed occupational employment projections for nurse midwives are not yet broken out by MDOL—they are part of RN employment projections. For more detail, see the ‘Outlook’ for RNs.

48 | P a g e
29-1151 Nurse Anesthetists
Occupation description
Administer anesthesia, monitor patient's vital signs, and oversee patient recovery from anesthesia. May assist anesthesiologists, surgeons, other physicians, or dentists. Must be registered nurses who have specialized graduate education.
Illustrative example: Certified Registered Nurse Anesthetist (CRNA)
Education requirements
In order to be accepted into an accredited nurse anesthesia program, one must be a currently licensed RN with a Bachelor of Science in Nursing (BSN) or other appropriate baccalaureate degree and at least one year of experience in an acute care setting. CRNA programs, which lead to a master’s or doctoral degree, take two to three years and include clinical training in university-based or large community hospitals. Following graduation, one must pass the national certification exam before beginning to practice. However, certification is not a one-time accomplishment: In order to maintain their certification standing, CRNAs must obtain a minimum of 40 hours of continuing education every two years.
Employment & Wages
In 2012 there were an estimated 130 nurse anesthetists employed in Maine earning a median annual wage over $160,000, which was 10 percent above the national average and substantially above the median wage for all occupations in this state. Anesthetists are typically employed by hospital systems.
2012 Employment & Wage Statistics
Average Employment
Where are they employed?
What do they earn (median)?
Nurse Anesthetists 130 $163,570
Hospitals 92% $165,280

Healthcare Occupations Report | P a g e 49
Maine has 10 percent fewer nurse anesthetists than the nation, per thousand residents.
Schools offering training and number completing
The University of New England (UNE) offers the only nurse anesthetist program in Maine. The Class of 2011 had 29 graduates.
Outlook
The outlook for nursing in general is bright. In addition, BLS notes the demand for advanced practice nurses, including nurse anesthetists will be high, especially in underserved areas such as rural locations and inner cities.
Hospitals are the majority employer of anesthetists and are expected to experience robust growth. Hospital industry employment is expected to increase by 30 percent from 2010 to 2020, well above the mid-single digit growth expected for all industries.
Detailed occupational employment projections for nurse anesthetists are not yet broken out by MDOL—they are part of RN employment projections. For more detail, see the ‘Outlook’ for RNs.
0.10 0.11
Maine U.S.
Nurse Anesthestists per 1,000 Population, 2012
32
26
22 22
29
2007 2008 2009 2010 2011
Graduates of Nurse Anesthetist Programs, Maine

50 | P a g e
29-2061 Licensed Practical Nurses
Occupation description
Care for ill, injured, or convalescing patients or persons with disabilities in hospitals, nursing homes, clinics, private homes, group homes, and similar institutions. May work under the supervision of a registered nurse. Licensing required.
Illustrative examples: LPN, LVN, Pediatric Licensed Practical Nurse
Education requirements
LPNs must complete an accredited program, which takes about 1 year. These programs are commonly in technical schools and community colleges. They may occasionally be in high schools and hospitals as well. Practical nursing programs combine classroom learning in subjects such as nursing, biology, and pharmacology, with supervised clinical experience. These programs give certificates in practical nursing.
Employment & Wages
In 2012 there were more than 1,400 LPNs employed in Maine earning a median annual wage of nearly $41,000, which was in-line with the national average. The primary industry for LPN employment is the nursing & residential care industry, and to a lesser extent hospitals and ambulatory care. RNs, by contrast, are primarily employed at hospitals and within ambulatory care.
2012 Employment & Wage Statistics
Average Employment
Median Annual Salary
Maine 1,440 $40,990 Industries with Highest Share of Employment (% total)
Nursing and Residential Care Facilities 46% $40,460 Hospitals 26% $42,210 Ambulatory Health Care Services 15% $38,760 Source: 2012 Occupational Employment Statistics, CWRI
Since 2000, LPN employment in Maine has fallen by 40 percent. At the same time, Maine’s population increased four percent. These factors have led to a steady decline in LPNs per thousand residents, as seen in the figures below.

Healthcare Occupations Report | P a g e 51
In 2012, Maine had less than half the LPNs per population compared to the nation.
These employment statistics reflect a trend of RNs being utilized more extensively within Maine’s healthcare system (please see this discussion in the profile for RNs). LPNs still play an important role in the workforce, filling an important niche between CNAs and RNs. The value proposition of LPNs is particularly appealing to nursing and residential care facilities, where many of these nurses are employed.
Distribution of employment
Rural counties tend to have a disproportionately high share of LPN employment. This is particularly true of Aroostook, Franklin and Washington Counties, where the number of LPNs per thousand residents is significantly above the state average. LPNs are in higher demand in these areas, particularly with long term care employers, as they are a lower cost alternative than RNs and more skilled than CNAs.
2,430
1,440
0
200,000
400,000
600,000
800,000
1,000,000
1,200,000
1,400,000
0
500
1,000
1,500
2,000
2,500
3,000
2000 2002 2004 2006 2008 2010 2012
Mai
ne P
opul
atio
n
LPN
Em
ploy
men
t
LPN Employment, Maine Population
LPNs
Population
2.4 2.4 2.5 2.4 2.4
2.3
1.9 1.5 1.4
1.3 1.3 1.1
2000 2002 2004 2006 2008 2010 2012
Employed LPNs per 1,000 Population
U.S.
Maine

52 | P a g e
Distribution of Employment
Number Employed
Pct. (%) total LPN
employment
Pct. (%) of total Maine Population
Number employed per
thousand Population
Androscoggin County 120 8% 8% 1.1 Aroostook County 130 9% 5% 1.8 Cumberland County 490 34% 21% 1.7 Franklin County 60 4% 2% 2.0 Hancock County 50 3% 4% 0.9 Kennebec County 140 10% 9% 1.1 Knox County n/a n/a 3% n/a Lincoln County n/a n/a 3% n/a Oxford County 40 3% 4% 0.7 Penobscot County 170 12% 12% 1.1 Piscataquis County n/a n/a 1% n/a Sagadahoc County n/a n/a 3% n/a Somerset County 70 5% 4% 1.3 Waldo County 60 4% 3% 1.5 Washington County 60 4% 2% 1.8 York County 60 4% 15% 0.3 Maine 1,440 1.1 U.S. 718,800 2.3 Source: CWRI analysis of OES & Census data
Some counties have suppressed data per BLS confidentiality standards.
Demographic, economic and social characteristics of the workforce
Demographic profile Although the gender mix of LPNs in Maine and the nation are similar, the U.S. LPN/LVN population is much more racially diverse.

Healthcare Occupations Report | P a g e 53
Demographic Characteristics of the LPN Population
Total Race and Ethnicity
Maine U.S.A. White alone All Other Maine U.S.A. Maine U.S.A. Total 2,105 680,495 2,020 434,975 85 245,970
Percent 100% 100% 96% 64% 4% 36% Male 3% 7% 2% 4% 1% 3% Female 96% 93% 94% 60% 3% 33% Source: CWRI analysis of ACS 2006-2010 5 year file
Employment status Of the LPNs residing in Maine, 99 percent were employed at the time of survey and 89 percent were working in Maine. 10 percent of the LPNs living in Maine were working outside the state.
Age distribution Forty-seven and 19 percent of Maine’s LPNs are above 50 and 60 years, respectively. The figures below indicate that LPN’s in Maine’s population has a higher median age than that of the national population.
Age Distribution, LPNs Maine Maine (%) U.S. U.S. (%) 16 to 39 years 525 28% 254,060 40% 40 to 44 years 175 9% 78,060 12% 45 to 49 years 290 15% 83,330 13% 50 to 54 years 260 14% 85,805 13% 55 to 59 years 285 15% 73,140 11% 60 to 69 years 260 14% 55,525 9% 70 years and over 85 5% 7,470 1% Total 1,880 100% 637,390 100% Source: EEO Tabulation 2006-2010 ACS file, CWRI
LPNs that are working in Maine 1,880 89%
LPNs that were 'currently employed.' 2,080 99%
LPNs residing in Maine 2,105 100%

54 | P a g e
Educational attainment Educational attainment is comparable for LPNs in Maine and the U.S.
Educational Attainment, LPNs Maine U.S.A.
Not a HS graduate 1% 1% HS graduate 21% 20% Some college or Associate 74% 73% Bachelor's degree 2% 4% Master's degree 1% 1% Doctoral or Professional degree 1% 2% Total 100% 100% Source: EEO Tabulation 2006-2010 ACS file, CWRI
Schools offering training and number completing (IPEDS data)
Central Maine Community College offers the only program for LPNs.
Outlook
Nationally, employment of LPNs and LVNs is expected to grow 22 percent from 2010 to 2020. In Maine, employment of LPNs is forecast to grow 8 percent, below the national pace but still above the 5.5 percent growth expected for all occupations. The nursing and residential care facility industry, which employs nearly half of all LPNs, is expected to be the primary driver of LPN employment in coming years. Job prospects will be bolstered by the large number or retirements that are expected. In fact, three fourths of all LPN job openings are expected to be replacement openings.
Employment of LPNs in Maine 2010 and Projected 2020
Average Employment Change in Employment (2010-2020)
Projected Annual Openings
Resulting from New Growth 2010 2020 Net Percent
1,666 1,804 138 8.3% 14 Source: CWRI 2010-2020 Employment Projections
19
12
6
2
12
2007 2008 2009 2010 2011
Graduates of LPN Programs, Maine

Healthcare Occupations Report | P a g e 55
14
44 58
Growth Replacement Total Job Openings
Projected Annual Job Openings for LPNs

56 | P a g e
Physicians & Surgeons
Summary Statistics Workforce
Characteristics Anesthesiologists Family & General
Practitioners
Internists, general OB/GYN Pediatricians Psychiatrists Surgeons
Physicians & Surgeons, All
other Employment (2012) 80 710 170 10 170 140 220 1,900 Employment per 1,000 population
0.06 0.53 0.13 0.08 0.13 0.11 0.17 1.43
versus U.S. Below avg. Above avg. Below avg. Above avg. Above avg. Above avg. Above avg. Above avg. Average starting wage (Maine) $206,990 $126,170 $136,750 $114,750 $125,590 $180,850 n/a $184,310
Median annual wage (Maine) ≥ $187,199* $168,610 $183,100 ≥ $187,199* $155,120 ≥ $187,199* ≥ $187,199* ≥ $187,199*
U.S. median annual wage n/a $172,020 n/a $216,760 $154,650 $177,520 n/a n/a
Median wage for all occupations in Maine
$32,590 $32,590 $32,590 $32,590 $32,590 $32,590 $32,590 $32,590
Minimum Education Requirement
Doctorate Doctorate Doctorate Doctorate Doctorate Doctorate Doctorate Doctorate
Job Growth Projections n/a 13% 15% 17% 9% 6% 16% 20%
Nat’l Median Age* 46.9 46.9 46.9 46.9 46.9 46.9 46.9 46.9
Top Industry of Employment Hospitals
Ambulatory health care services
Hospitals Hospitals Ambulatory health care services
Ambulatory health care services
Hospitals Ambulatory health care services
Licensure Board
Board of Licensure in Medicine, Board of Osteopathic Licensure
Board of Licensure in Medicine, Board of Osteopathic Licensure
Board of Licensure in Medicine, Board of Osteopathic Licensure
Board of Licensure in Medicine, Board of Osteopathic Licensure
Board of Licensure in Medicine, Board of Osteopathic Licensure
Board of Licensure in Medicine, Board of Osteopathic Licensure
Board of Licensure in Medicine, Board of Osteopathic Licensure
Board of Licensure in Medicine, Board of Osteopathic Licensure
*This wage is equal to or greater than $90.00 per hour or $187,199 per year.

Healthcare Occupations Report | P a g e 57
Key points
• There were an estimated 4,006 physicians and surgeons working in Maine in 2010, including the self-employed. Employment is expected to increase 17 percent through 2020.
• Maine has an average number of physicians and surgeons per population for a New England state—Rhode Island and Vermont have more and New Hampshire and Connecticut have fewer. Compared to the nation, Maine and the New England region have 36 percent more physicians and surgeons per thousand residents.
• Forty-four and 17 percent of the workforce was above 50 and 60 years old, respectively.
• The distribution of employment within Maine is uneven. More than 40 percent of the workforce is employed in Cumberland County.
Occupation descriptions
29-1061 Anesthesiologists: Physicians who administer anesthetics prior to, during, or after surgery, or other medical procedures.
Illustrative example: Obstetrical Anesthesiologist
29-1062 Family and General Practitioners: Physicians who diagnose, treat, and help prevent diseases and injuries that commonly occur in the general population. May refer patients to specialists when needed for further diagnosis or treatment.
Illustrative example: Family Practice Physician
29-1063 Internists, General: Physicians who diagnose and provide non-surgical treatment of diseases and injuries of internal organ systems. Provide care mainly for adults who have a wide range of problems associated with the internal organs. Subspecialists, such as cardiologists and gastroenterologists, are included in "Physicians and Surgeons, All Other" (29-1069). Illustrative example: Internal Medicine Physician
29-1064 Obstetricians and Gynecologists: Physicians who provide medical care related to pregnancy or childbirth and those who diagnose, treat, and help prevent diseases of women, particularly those affecting the reproductive system. May also provide general medical care to women. Illustrative examples: OB/GYN, OB Specialist
29-1065 Pediatricians, General: Physicians who diagnose, treat, and help prevent children's diseases and injuries.
Illustrative examples: Primary Care Pediatrician, Pediatrist
29-1066 Psychiatrists: Physicians who diagnose, treat, and help prevent disorders of the mind.
Illustrative examples: Neuropsychiatrist, Geriatric Psychiatrist, Addiction Psychiatrist
29-1067 Surgeons: Physicians who treat diseases, injuries, and deformities by invasive, minimally-invasive, or non-invasive surgical methods, such as using instruments, appliances, or by manual manipulation. Excludes "Oral and Maxillofacial Surgeons" (29-1022).

58 | P a g e
Illustrative examples: Thoracic Surgeon, Plastic Surgeon, Orthopedic Surgeon, Cardiovascular Surgeon
29-1069 Physicians and Surgeons, All Other: All physicians and surgeons not listed separately.
Illustrative examples: Ophthalmologist, Dermatologist, Gastroenterologist, Cardiologist
Education Requirements
Physicians and surgeons have demanding education and training requirements. Almost all physicians complete at least four years of undergraduate school, four years of medical school, and three to eight years in internship and residency programs, depending on their specialty.
Employment & Wages
In 2012, there were an estimated 3,400 physicians employed in Maine. These figures are taken from OES and do not include the self-employed. According to employment projections data, which include self-employment, there were 4,006 physicians and surgeons in 2010, up 40 percent from 2000. As noted earlier in this report, these estimates do not indicate whether a person is working full or part-time. As such, these figures may overstate physician workforce supply in terms of full-time equivalents. Also, creating estimates for the self-employed involves more subjectivity. Please see the discussion on the limitations of data at the beginning of this report. Readers with access to different data sets may have different statistics.
Source: Employment Projections system, CWRI
2,853 3,197
3,383
3,907 4,053 4,006
2000 2002 2004 2006 2008 2010
Physician & Surgeons practicing in Maine

Healthcare Occupations Report | P a g e 59
From 2000 to 2010, physicians and surgeons per thousand population increased 35 percent to 3.0.
Source: Employment Projections system, Census data, CWRI
In 2010 Maine had 37 percent more physicians and surgeons per 1,000 residents than the nation.
Maine’s relatively high count of practitioners per population is similar to the rest of New England. New England has historically been the region most reliant on healthcare employment in the U.S., and this is reflected in greater concentrations of health workers per population.
Physicians & Surgeons per 1,000 Population, 2010
Number of Practitioners
Practitioners per 1,000 population
New Hampshire 2,885 2.2 Vermont 2,660 4.3 Connecticut 8,140 2.3 Massachusetts 20,510 3.1 Rhode Island 5,040 4.8 Maine 4,006 3.0 New England 43,241 3.0 U.S. 691,000 2.2 Source: Employment projections & Census data
2.2 2.5 2.6 3.0
3.0 3.0
2000 2002 2004 2006 2008 2010
Physicians & Surgeons per 1,000 Population
3.0
2.2
Maine U.S.
Physicians and Surgeons per 1,000 Population, 2010

60 | P a g e
Distribution of Employment
Cumberland County employs a disproportionately large share of Maine’s physicians and surgeons, resulting in practitioner per population figures that are twice the state average. More rural counties tend to have a much lower distribution of employment. Employment figures for a number of other counties are suppressed per BLS confidentiality standards.
An aging population contributes to the trend of centralization in employment—as the population ages more specialty physicians are required and they are typically employed in large hospital centers.
Number Employed
Pct. (%) total Physician
Employment
Pct. (%) of total Maine Population
Employed per 1,000 Population
Cumberland County 1,470 42% 21% 5.2 Kennebec County 240 7% 9% 2.0 Aroostook County 180 5% 4% 2.5 York County 180 5% 15% 0.9 Penobscot County 150 4% 12% 1.0 Androscoggin County 90 3% 8% 0.8 Hancock County 30 1% 4% 0.5 Oxford County 30 1% 4% 0.5 Washington County 20 1% 2% 0.6 Subtotal 2,390 68% 79% Maine 3,500 100% 2.6 U.S. 1.9 OES, CWRI
Some counties have suppressed data per BLS confidentiality and data quality requirements. Counties with suppressed data are not shown.
Mix of employment by occupation
Family and general practitioners represented 20 percent of the workforce and surgeons and internists seven percent.
Anesthesiologis
ts, 6%
Family and General
Practitioners, 20%
Internists, 7%
OB/GYN, 3%
Pediatricians, 4%
Psychiatrists, 3%
Surgeons, 7%
Physicians and Surgeons, All Other, 51%
Mix of Physicians & Surgeons in Maine (2010)

Healthcare Occupations Report | P a g e 61
Source: 2010 Employment Projections, CWRI
Using a different data set (OES) we obtain more recent (2012) and more specific employment data (wages, industry of employment) at the detailed occupational level. These figures do not include estimates for the self-employed.
2012 Employment & Wage Statistics
Average Employment
Where are they Employed?
What do they Earn (Median)?
Anesthesiologists 80 ≥ 187,199 Hospitals 63% n/a Ambulatory Health Svcs. 37% n/a Family & General Practitioners 710 $168,610 Hospitals 39% $179,190 Ambulatory Health Svcs. 59% $162,110 Internists 170 $183,100 Hospitals 53% n/a Ambulatory Health Svcs. 47% $157,760 OB/GYN 110 ≥ 187,199 Hospitals 55% n/a Ambulatory Health Svcs. 45% $117,330 Pediatricians 170 $155,120 Hospitals 29% $175,680 Ambulatory Health Svcs. 76% $146,830 Psychiatrists 140 ≥ 187,199 Hospitals 29% n/a Ambulatory Health Svcs. 64% n/a Surgeons 220 ≥ 187,199 Hospitals 59% n/a Ambulatory Health Svcs. 45% n/a Physicians & Surgeons, all other 1900 ≥ 187,199 Hospitals 29% n/a Ambulatory Health Svcs. 62% n/a Public Administration 6% n/a Source: Occupational Employment Statistics Program, CWRI, BLS
Demographic, economic and social characteristics of the workforce
NOTE: the ACS—from which this data was taken—groups all physician and surgeon occupations together. The following information is for all physicians and surgeons.
Demographic profile Maine’s physician population is predominantly male (71 percent) and white (95 percent). The national physician population has a similar gender mix (68 percent male) but is more racially diverse (69 percent white).

62 | P a g e
Demographic Characteristics of the Physician Population
Total Race and Ethnicity Maine U.S.A. White alone All Other
Maine U.S.A. Maine U.S.A. Total 4,260 834,265 4,025 575,355 235 258,910 Percent 100% 100% 95% 69% 6% 31% Male 71% 68% 67% 49% 4% 19% Female 29% 32% 28% 20% 2% 12% Source: CWRI analysis of ACS 2006-2010 5 year file
Employment status Of the physicians residing in Maine, nearly all were working in this state.
Age distribution Forty-four and 17 percent of Maine’s physician and surgeon workforce were above 50 and 60 years old, respectively. Nationally, 40 and 16 percent were above these age levels.
Age Distribution, Physicians & Surgeons Working in Maine
Total % Male % Female % 16 to 39 years 1,175 28% 710 24% 465 38% 40 to 44 years 520 12% 315 11% 200 16% 45 to 49 years 665 16% 475 16% 190 16% 50 to 54 years 565 13% 375 13% 195 16% 55 to 59 years 600 14% 505 17% 100 8% 60 to 69 years 570 14% 510 17% 60 5% 70 years and over 105 3% 90 3% 15 1% Total 4,200 100% 2,980 100% 1,225 100% Source: EEO Tabulation 2006-2010 ACS file, CWRI
Physicians that are employed in Maine 4,200 99%
Physicians that are 'Currently Employed' 4,240 99.5%
Physicians living in Maine
4,260 100%

Healthcare Occupations Report | P a g e 63
Age Distribution, Physicians & Surgeons Working in U.S.A. Total % Male % Female %
16 to 39 years 274,415 34% 152,730 28% 121,685 47% 40 to 44 years 110,180 14% 71,015 13% 39,165 15% 45 to 49 years 105,645 13% 72,160 13% 33,485 13% 50 to 54 years 105,625 13% 76,670 14% 28,955 11% 55 to 59 years 89,720 11% 69,185 13% 20,530 8% 60 to 69 years 97,825 12% 82,465 15% 15,360 6% 70 years and over 29,150 4% 26,955 5% 2,200 1% Total 812,560 100% 551,180 100% 261,380 100% Source: EEO Tabulation 2006-2010 ACS file, CWRI
Average Workweek Physicians and surgeons tend to work fewer hours per week as they age. Forty-seven percent of practitioners above 60 years old reported to work between 40 and 49 hours per week, and 28 percent reported to work in excess of 50 hours per week. By contrast, an estimated 70 percent of physicians and surgeons younger than 60 years old reported average work weeks in excess of 50 hours.
Educational attainment Educational attainment for physicians in Maine is as one would expect—nearly all declare to have a doctorate.
Schools offering training and number completing
Two medical school programs are available in Maine—the new Maine Medical Center-Tufts University School of Medicine medical school program and the University of New England’s College of Osteopathic Medicine. The MMC-TUSM medical school program is a partnership between Maine Medical Center (MMC) and the Tufts University School of Medicine. The program offers a unique curriculum that emphasizes rural and small town practice and grants doctor of medicine degrees (M.D.). Students also have the option to pursue dual degrees, such as MD/MBA, MD/PHD and MD/MPH. Students spend the first two years
Num
ber
of P
hysi
cian
s
Avg. Hours Worked per Week
Hours Worked per Week by Age Group
Ages 26-35
Ages 36-45
Ages 46-60
Above 60

64 | P a g e
at Tufts and year three and portions of year four at MMC. Twenty of the 36 undergraduate openings each year are reserved for Mainers at subsidized rates. Scholarships will effectively lower the tuition to the equivalent of an in-state public university medical school program. First graduates are expected in 2013.
The UNE College of Osteopathy grants the Doctor of Osteopathy medicine (D.O.) degree. According to the university website, about two thirds or recent graduates have pursued careers in primary care.
Program Completers Number of Completers
School CIP CIP Title Completer Title 2007 2008 2009 2010 2011
University of New England 511901
Osteopathic Medicine/ Osteopathy
First-Professional Degrees 106 126 119 109 113
Source: Integrated Post-Secondary Education Statistics, CWRI
Outlook
Nationally, employment of physicians and surgeons is expected to grow by 24 percent from 2010 to 2020, faster than the average for all occupations. In Maine, jobs for physicians and surgeons are expected to increase by 17 percent.
Job growth will occur due to the continued expansion of healthcare-related industries. The growing and aging population is expected to drive overall growth in the demand for physician services as consumers continue to seek high levels of care that uses the latest technologies, diagnostic tests, and therapies. Many medical schools are increasing their enrollments based on perceived higher demand for physicians.
Although the demand for physicians and surgeons should continue, some factors will likely reduce growth. New technologies will allow physicians to treat more patients in the same amount of time, thereby reducing the number of physicians who would be needed to complete the same tasks. Physician assistants and nurse practitioners can do many of the routine duties of physicians and may increasingly be used to reduce costs at hospitals and outpatient care facilities. For more information, see the profiles on physician assistants and registered nurses.
Furthermore, demand for physicians’ services is sensitive to changes in healthcare reimbursement policies. Consumers may demand fewer physician services if changes to health coverage result in higher out-of-pocket costs for them.
Job prospects should be good for physicians who are willing to practice in rural and low-income areas, because these areas tend to have difficulty attracting physicians. Job prospects also should be good for physicians in specialties dealing with health issues that largely affect aging baby boomers. For example, physicians specializing in cardiology and radiology will be needed because the risks for heart disease and cancer increase as people age.
Job opportunities will also result from the need to replace currently practicing physicians that are expected to retire. In total, nearly 140 job openings per year are anticipated, 74 from replacement needs and 64 from growth in demand.

Healthcare Occupations Report | P a g e 65
Employment and Job Openings for Physicians & Surgeons in Maine in 2010 and Projected 2020
SOC Code Occupation
Average Employment
Change in Employment Average Annual Openings
2010 2020 Net Percent Growth Replacement Total
00-0000 Total, All Occupations 641,551 676,779 35,228 5.5% 4,361 15,146 19,507 ALL Physicians and Surgeons 3,778 4,415 637 16.9% 64 74 138 29-1062 Family and General Practitioners 796 900 104 13.1% 10 16 26 29-1063 Internists, General 290 333 43 14.8% 4 6 10 29-1064 Obstetricians and Gynecologists 118 138 20 16.9% 2 2 4 29-1065 Pediatricians, General 157 171 14 8.9% 1 3 4 29-1066 Psychiatrists 108 114 6 5.6% 1 2 3 29-1067 Surgeons 266 308 42 15.8% 4 5 9 29-1069 Physicians and Surgeons, All Other 2,043 2,451 408 20.0% 41 40 81
Source: CWRI, BLS. Employment figures include estimates for the self-employed. Employment and projections do not include anesthesiologist data as this has been suppressed for confidentiality.
64 74
138
Growth Replacement Total Job Openings
Projected Annual Job Openings for Physicians & Surgeons

66 | P a g e
Physician Assistants
Summary Statistics
Workforce Characteristics Physician Assistants
Employment (2012) 900
Employment per 1,000 population 0.7 versus U.S. Above avg. Average starting wage (Maine) $77,800
Median annual wage (Maine) $93,160
U.S. median annual wage $90,930
Median wage for all occupations in Maine $32,590 Minimum Education Requirement Master's degree Job Growth Projections 15% National Median Age 39.6
Top Industry of Employment Ambulatory Health Services
Licensing Board Board of Licensure in Medicine, Board of Osteopathic Licensure
Key points:
• Physician assistants (PAs) could see an expanded role in primary care, particularly as the population ages and more physicians focus on specialty areas of medicine.
• The number of physician assistants (PAs) employed in Maine is twice the national average (per thousand residents).
• Forty-four percent of the PAs employed in Maine are working in Cumberland County.
29-1071 Physician Assistants
Occupation description
Provide healthcare services typically performed by a physician, under the supervision of a physician. Conduct complete physicals, provide treatment, and counsel patients. May, in some cases, prescribe medication. Must graduate from an accredited educational program for physician assistants. Excludes "Emergency Medical Technicians and Paramedics" (29-2041), "Medical Assistants" (31-9092), "Registered Nurses" (29-1141), “Nurse Anesthetists” (29-1151), “Nurse Midwives” (29-1161), and “Nurse Practitioners” (29-1171).
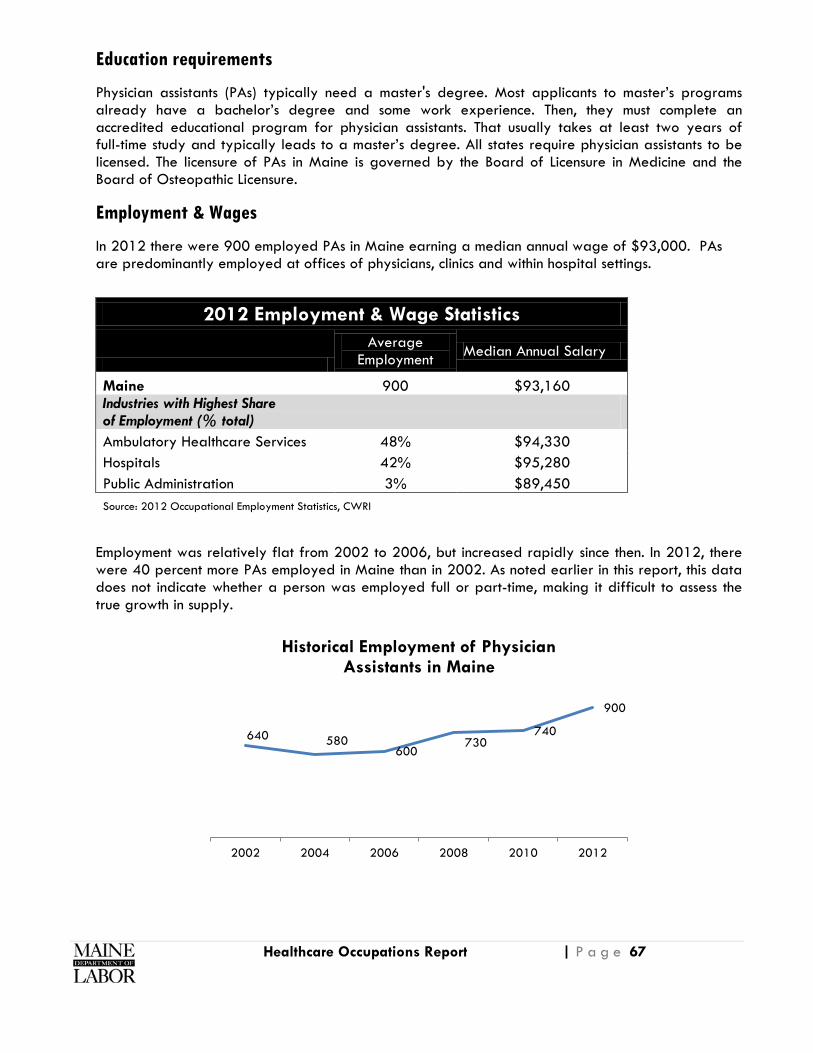
Healthcare Occupations Report | P a g e 67
Education requirements
Physician assistants (PAs) typically need a master's degree. Most applicants to master’s programs already have a bachelor’s degree and some work experience. Then, they must complete an accredited educational program for physician assistants. That usually takes at least two years of full-time study and typically leads to a master’s degree. All states require physician assistants to be licensed. The licensure of PAs in Maine is governed by the Board of Licensure in Medicine and the Board of Osteopathic Licensure.
Employment & Wages
In 2012 there were 900 employed PAs in Maine earning a median annual wage of $93,000. PAs are predominantly employed at offices of physicians, clinics and within hospital settings.
2012 Employment & Wage Statistics
Average Employment Median Annual Salary
Maine 900 $93,160 Industries with Highest Share of Employment (% total) Ambulatory Healthcare Services 48% $94,330 Hospitals 42% $95,280 Public Administration 3% $89,450 Source: 2012 Occupational Employment Statistics, CWRI
Employment was relatively flat from 2002 to 2006, but increased rapidly since then. In 2012, there were 40 percent more PAs employed in Maine than in 2002. As noted earlier in this report, this data does not indicate whether a person was employed full or part-time, making it difficult to assess the true growth in supply.
640 580 600
730 740
900
2002 2004 2006 2008 2010 2012
Historical Employment of Physician Assistants in Maine

68 | P a g e
Maine has more than double the PAs per thousand residents than the nation.
Distribution of employment
Ninety-six percent of Maine’s PAs are employed in eight counties that represent 79 percent of the state’s population. A large share (44 percent) of PAs is employed in Cumberland County. Somerset and Kennebec Counties also have disproportionately high shares of PAs relative to their share of Maine’s population.
The remaining counties for which we do not have data—Franklin, Hancock, Knox, Lincoln, Piscataquis, Sagadahoc, Waldo, Washington—represent 21 percent of Maine’s population and employ only four percent of the PAs in this state.
0.68
0.27
Maine U.S.
Physician Assistants per 1,000 Population

Healthcare Occupations Report | P a g e 69
Distribution of Employment Number
Employed
Pct. (%) total PA
employment
Pct. (%) Maine
Population
Number employed per thousand population
Androscoggin County 50 6% 8% 0.5 Aroostook County 60 7% 5% 0.8 Cumberland County 400 44% 21% 1.4 Franklin County n/a n/a 2% Hancock County n/a n/a 4% Kennebec County 120 13% 9% 1.0 Knox County n/a n/a 7% Lincoln County n/a n/a 1% Oxford County 20 2% 4% 0.3 Penobscot County 120 13% 12% 0.8 Piscataquis County n/a n/a 1% Sagadahoc County n/a n/a 0% Somerset County 60 7% 4% 1.2 Waldo County n/a n/a 3% Washington County n/a n/a 2% York County 30 3% 15% 0.2
Maine 900 96% 100% 0.7 US 83,640 0.3
Source: CWRI analysis of OES and Census data Some counties have suppressed data per BLS confidentiality standards
Schools offering training and number completing
University of New England offers the only physician assistant program in Maine. In 2011 there were 48 graduates, up 26 percent from the level in 2007.
38
45 41
45 48
2007 2008 2009 2010 2011
Physician Assistant Program Completers

70 | P a g e
Education Programs & Annual Graduates
School CIP Code CIP Title
Completer Title 2007 2008 2009 2010 2011
University of New England 510912 Physician
Assistant Master's Degree 38 45 41 45 48
Source: IPEDS, CWRI
Outlook
Nationally, employment of physician assistants is expected to increase 30 percent from 2010 to 2020, much faster than the average for all occupations. In Maine, employment is expected to increase 15 percent, well above the six percent rate expected for all jobs.
As more physicians enter specialty areas of medicine, there will be a greater need for primary healthcare providers, such as physician assistants. Because physician assistants are more cost-effective than physicians, they are expected to have an increasing role in giving routine care.
In addition, employment growth is expected because the large baby-boom generation is getting older. As they age, baby boomers will be increasingly susceptible to ailments and conditions such as heart attack, stroke, and diabetes. Physician assistants are expected to have an increasing role in keeping these people healthy and caring for them when they get ill.
Healthcare providers are also expected to use more physician assistants in new ways as states continue to allow assistants to do more procedures.
Good job prospects are expected. This should be particularly true for physician assistants working in rural and medically underserved areas, as well as physician assistants working in primary care.
From 2010 to 2020, nearly 120 new physician assistant jobs are projected for Maine, or 12 per year. In addition, the need to replace existing PAs that are expected to retire should result in an additional 14 job openings per year through 2020.
Employment of Physicians Assistants in Maine, 2010 and Projected 2020
Average Employment Change in Employment (2010-2020) Projected Annual Openings Resulting
from New Growth 2010 2020 Net Percent 764 882 118 15.4% 12
Source: CWRI 2010-2020 Employment Projections

Healthcare Occupations Report | P a g e 71
12 14
26
Growth Replacement Total
Projected Annual Job Openings, Physicians Assistants

72 | P a g e
Dentists, Hygienists, Dental Assistants Summary Statistics
Workforce Characteristics Dentists, General Dental Hygienists Dental Assistants
Employment (2012) 587* 1,050 1,130 Employment per 1,000 population 0.44 0.79 0.85
versus U.S. Average Above avg. Below avg. Average annual starting wage (Maine) $121,530 $52,610 $29,840
Median annual wage (Maine) $184,260 $67,450 $37,650
U.S. median annual wage $145,240 $70,210 $34,500
Median wage for all occupations in Maine $32,590 $32,590 $32,590
Minimum Education Requirement First professional degree Associate's
degree
Postsecondary non-degree
award Job Growth Projections 4% 14% 9% National Median Age 51.7 41.4 36.5
Top Industry of Employment
Ambulatory Health Services
Ambulatory Health
Services
Ambulatory Health Services
Licensure Board Board of Dental Examiners Board of Dental Examiners
Board of Dental Examiners**
* includes the self-employed ** For expanded function dental assistants (EFDAs)
Key points
• In 2010 there were approximately 600 dentists practicing in Maine, with a high proportion of being self-employed. Compared to the nation, Maine had a comparable number of dentists per thousand residents.
• The dentist workforce is unevenly distributed, with Cumberland, Kennebec and Penobscot Counties maintaining a disproportionately high share of employment (68 percent) relative to their combined share of the population (42 percent).
• Approximately 30 percent of the workforce may need to be replaced over the coming decade due to retirements and those otherwise exiting the occupation. Maine’s workforce is older than that of the nation which could result in even higher retirement rates. Nearly one third of Maine’s dentists are above 60 years old. Nationally, 20 percent are above 60.

Healthcare Occupations Report | P a g e 73
• Dentists are increasing the utilization of hygienists, assistants and technology in order to see more patients and enhance productivity.
• The University of New England’s College of Dental Medicine, the first dental school in northern New England, opened in fall 2013. The inaugural entering dental class (Class of 2017) included 64 students, 24 of which were from Maine.
29-1021 Dentists, General
Occupation description
Examine, diagnose, and treat diseases, injuries, and malformations of teeth and gums. May treat diseases of nerve, pulp, and other dental tissues affecting oral hygiene and retention of teeth. May fit dental appliances or provide preventive care. Excludes "Prosthodontists" (29-1024), "Orthodontists" (29-1023), "Oral and Maxillofacial Surgeons" (29-1022) and "Dentists, All Other Specialists" (29-1029).
Illustrative example: Family Dentist
Education requirements
Dentists must be licensed in all states; requirements vary by state. To qualify for a license in most states, applicants must graduate from an accredited dental school and pass written and practical exams. In Maine, the licensure of dentists is governed by the Maine Board of Dental Examiners and dentists must renew their licenses every two years.
Most dental students need at least a bachelor's degree before entering dental school; requirements vary by school. All dental schools require applicants to have completed certain required science courses, such as biology and chemistry. Majoring in a science, such as biology, might increase the chances of being accepted, but no specific major is required to enter most dental programs.
All nine dental specialties require dentists to complete additional training before practicing that specialty. They must usually complete a one- or two-year (and sometimes longer) residency, in a program related to their specialty. While residencies are not required for those entering general practice many opt into a one- or two-year program.
Employment & Wages
In 2012 there were 340 dentists employed in Maine earning a median annual salary of $185,000, which was 27 percent above the national median. One of the factors contributing to higher than average wages in Maine is the limited use of dental managed care. Also, these employment figures are taken from OES and do not include the self-employed. According to employment projections data, which includes the self-employed, there were nearly 600 dentists practicing in Maine in 2010. As noted earlier in this report creating employment estimates for occupations with high proportions of self-employment involve more subjectivity. Please see the discussion under ‘Data sets and data limitations’ for more detail. The American Community Survey also includes the self-employed and indicates close to 600 dentists practicing in Maine, but this data spans 2006 through 2010. While these data sets are imperfect, they point to a dentist workforce of approximately 600 in 2010. Readers with access to different data sets may have more recent and different statistics.
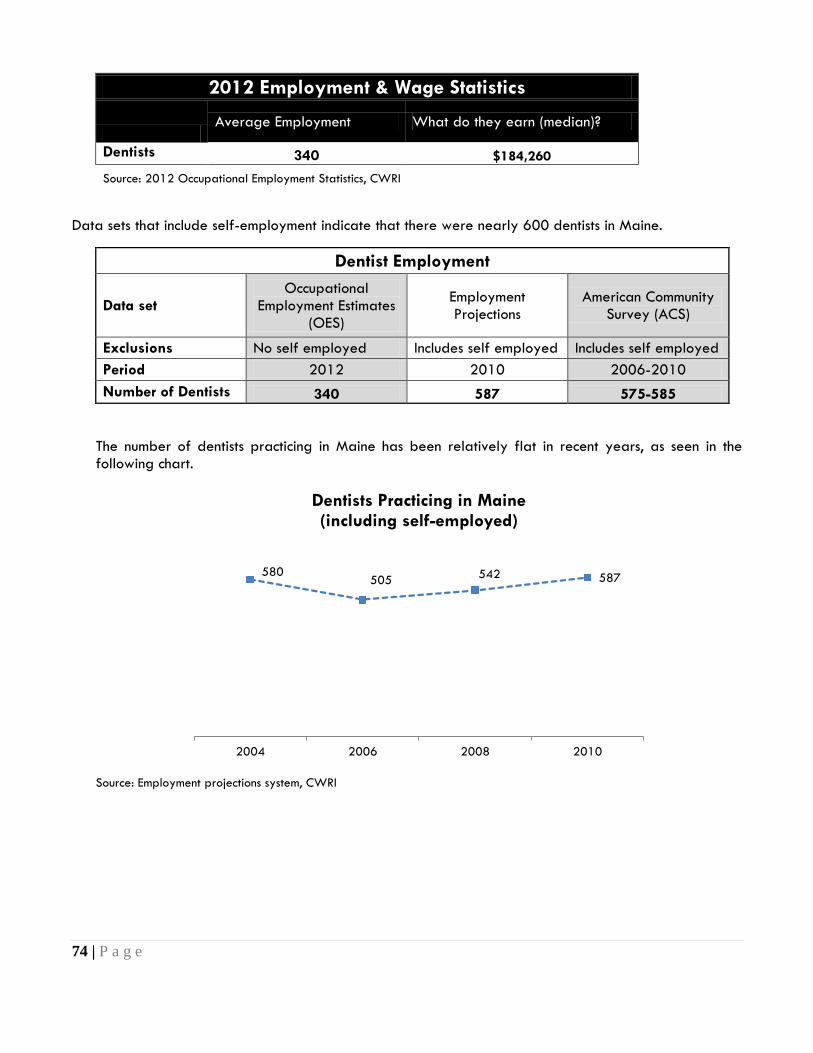
74 | P a g e
2012 Employment & Wage Statistics
Average Employment What do they earn (median)?
Dentists 340 $184,260
Source: 2012 Occupational Employment Statistics, CWRI
Data sets that include self-employment indicate that there were nearly 600 dentists in Maine.
Dentist Employment
Data set Occupational
Employment Estimates (OES)
Employment Projections
American Community Survey (ACS)
Exclusions No self employed Includes self employed Includes self employed Period 2012 2010 2006-2010 Number of Dentists 340 587 575-585
The number of dentists practicing in Maine has been relatively flat in recent years, as seen in the following chart.
Source: Employment projections system, CWRI
580 505 542 587
2004 2006 2008 2010
Dentists Practicing in Maine (including self-employed)

Healthcare Occupations Report | P a g e 75
In 2010, Maine had approximately the same number of dentists per 1,000 residents as the nation (using 2012 OES data, which does not include the self-employed, Maine had .26 dentists per thousand residents, or 27 percent fewer than that of the nation).
As noted earlier in this report, one of the limitations of using the employment estimates discussed above is that they do not indicate whether a person is full or part-time (see Data sets and data limitations for more discussion). Since the majority of Maine’s dentists are in the age range where workers traditionally become less attached to the workforce, these employment estimates m overstate the true level of dentist workforce supply in Maine.
Distribution of employment
CWRI has limited data on dentist employment by county. Using OES data, 74 percent of the 340 employed dentists can be accounted for with county level data (some data is suppressed). For dentists that are self-employed, of which there are approximately 250, county level data is not available. As a result, data on the county of employment is available for less than half of all dentists practicing in Maine.
The table below provides data for dentist employment by county (self-employed are not included). Three fourths of dentists that are employed are working in four counties that represent 50 percent of the statewide population. Kennebec County has a particularly high share of employed dentists relative to its population (0.7 practitioners per 1,000 population versus the state average of 0.26).
0.44 0.42
Maine U.S.A.
Dentists per 1,000 Population, 2010 (Includes self-employed dentists)

76 | P a g e
Distribution of Employment, 2012
Number Employed
Pct. (%) total employment
Pct. (%) of total Maine Population
Number employed per
1,000 population
Androscoggin County 20 6% 8% 0.2 Aroostook County n/a n/a 5% Cumberland County 90 26% 21% 0.3 Franklin County n/a n/a 2% Hancock County n/a n/a 4% Kennebec County 80 24% 9% 0.7 Knox County n/a n/a 3% Lincoln County n/a n/a 3% Oxford County n/a n/a 4% Penobscot County 60 18% 12% 0.4 Piscataquis County n/a n/a 1% Sagadahoc County n/a n/a 3% Somerset County n/a n/a 4% Waldo County n/a n/a 3% Washington County n/a n/a 2% York County n/a n/a 15% Maine 340 74% 100% 0.26 U.S. 0.35 Source: CWRI analysis of OES & Census data; some data suppressed per BLS standards.
Figures represent employed dentists only (self-employed are not included).
Dental hygienists and assistants have relatively minor data suppression issues and lower levels of self-employment, making them good proxies for the distribution of dentists, both employed and self-employed. The table below displays dental hygienist and assistant employment by county. Although data is suppressed for a number of counties, we are nonetheless able to account for 90 and 95 percent of total employment in these occupations, respectively. The data shows that 76 percent of hygienists and 85 percent of dental assistants in Maine are employed in Cumberland, Kennebec, Penobscot and York Counties. The implication is that these are the counties where the significant majority of dentists practice.

Healthcare Occupations Report | P a g e 77
Distribution of Employment by County, 2012
Hygienists % employment
Dental Assistants
% employment
Androscoggin County 90 9% 70 6% Aroostook County 60 6% 40 4% Cumberland County 370 35% 350 31% Franklin County n/a n/a n/a n/a
Hancock County n/a n/a n/a n/a
Kennebec County 120 11% 180 16% Knox n/a n/a n/a n/a
Lincoln County n/a n/a n/a n/a
Oxford County n/a n/a n/a n/a
Penobscot County 150 14% 200 18% Piscataquis County n/a n/a n/a n/a
Sagadahoc County n/a n/a n/a n/a
Somerset County n/a n/a n/a n/a
Waldo County n/a n/a n/a n/a
Washington County n/a n/a n/a n/a
York County 160 15% 230 20% Maine 1,050 90% 1130 95% Source: CWRI, OES; some data suppressed per BLS standards.
Dental hygienists and assistants have relatively minor data suppression issues (we can account for 90 and 95 percent of employment in these occupations, respectively, when we look at county level detail) and low levels of self-employment, making them good proxies for the distribution of employed and self-employed dentists.
Demographic, economic and social characteristics of the workforce
Demographic profile The dentist population in Maine is mostly male (83 percent) and white (93 percent). Nationally, the dentist population has a greater proportion of female dentists (23 percent) and is more racially diverse.
Demographic Characteristics of the Dentist Population Total Race and Ethnicity
White alone All Other Maine U.S.A. Maine U.S.A. Maine U.S.A. Total 585 165,835 545 126,200 40 39,635 Percent 100% 100% 93% 76% 7% 24% Male 83% 77% 81% 63% 2% 14% Female 17% 23% 12% 14% 5% 10% Source: CWRI analysis of ACS 2006-2010 5 year file

78 | P a g e
Employment status Of the dentists residing in Maine, 98 percent reported to be working in state.
Age distribution Sixty-five and 30 percent of the dentist workforce in Maine was over 50 and 60 years old, respectively. Nationally, 50 and 20 percent of dentists are above these age levels. As noted earlier in this report, the small sample sizes that result when analyzing occupational data by state and demographic characteristics can result in high margins of error.
Age Distribution, Dentists
Maine total % U.S. total % 16 to 39 years 90 16% 42,450 26% 40 to 44 years 35 6% 18,650 12% 45 to 49 years 75 13% 20,685 13% 50 to 54 years 65 11% 24,125 15% 55 to 59 years 140 24% 22,700 14% 60 to 69 years 120 21% 25,525 16% 70 years and over 50 9% 7,165 4% Total 575 100% 161,300 100% Source: EEO Tabulation 2006-2010 ACS file, CWRI
Educational attainment Educational attainment is comparable between dentists in Maine and those across the nation—nearly all report having a doctorate.
Dentists working in Maine 575 98%
Dentists that are 'currently employed.' 585 100%
Dentists residing in Maine 585 100%

Healthcare Occupations Report | P a g e 79
Schools offering training and number completing
The University of New England’s College of Dental Medicine opened in fall 2013 and enrolled its inaugural entering dental class (Class of 2017). The dental school is the first in northern New England. The inaugural class of 64 students includes 24 students from Maine, representing 11 counties.
Outlook
Nationally, employment of dentists is expected to grow by 21 percent from 2010 to 2020, faster than the average for all occupations. In Maine, employment of dentists is expected to grow by four percent, below the national rate largely due to lower population growth forecasts for this state (see the introduction of this report for more detail). Also, this forecast for Maine belies much stronger projected growth in self-employment of dentists, which is expected to expand 15 percent.
BLS provides the following assessment of major trends affecting employment of dentists:
Members of the baby-boom generation will need complicated dental work. In addition, because each generation is more likely to keep their teeth than past generations, more dental care will be needed in the years to come. Dentists will continue to see an increase in public demand for their services as studies continue to link oral health to overall health.
Employment of dentists is not expected to keep pace with the increased demand for dental services. There are still areas of the country where patients have little access to dental care. Whether patients seek care is largely dependent on their insurance coverage. People with new or expanded dental insurance coverage will be more likely to visit a dentist than in the past. Cosmetic dental services, such as teeth-whitening treatments, will become increasingly popular. This trend is expected to continue as new technologies allow for less invasive, faster procedures.
Dentists are likely to hire more hygienists and dental assistants to handle routine services. Productivity increases from new technology should allow dentists to reduce the time needed to see each patient. These factors allow the dentist to see more patients when their practices expand.
Dentists will continue to provide care and instruction aimed at promoting good oral hygiene, rather than just providing treatments such as fillings.
In Maine, 19 job openings are expected per year, 2 from new growth and 17 from replacement needs. New growth will be driven by more dentists opening new practices; nearly 3 per year are expected, and this is projected to be somewhat offset by a slight decline in the number of employed dentists.
The projected annual number of job openings due to replacement needs (17) assumes that 30 percent of the workforce will need to be replaced from 2010 to 2020 due to retirements or practitioners otherwise permanently leaving the occupation. This replacement rate is based on analysis of employment patterns of the U.S. dentist workforce. Since Maine’s dentists are older than the nation’s using a replacement rate that is based on national trends may be too low. How would higher retirement rates impact the need for more dentists in Maine? Analysis shows that for every two percentage point increase in the retirement rate for, 12 more job openings would result over the entire 2010 to 2020 period or slightly more than 1 additional replacement opening per year. If the replacement rate is 32 percent, the annual minimum need for dentists would be 21 per year; if

80 | P a g e
replacement rate is 34 percent, the minimum need would be 22 per year; and so on. See the tables below for more detail.
Growth in dentist employment is expected to increase 4 percent through 2020. This figure belies relatively strong growth projections for self-employed dentists, which is expected to increase 15 percent. Growth in self-employed dentists is expected to be offset by a slight decline in the number of employed dentists. Com-pared to the nation, Maine is expected to have significantly lower population growth, and this is a gating factor for employment growth.
Employment of Dentists in Maine, 2010 and Projected 2020
Average Employment Change in Employment (2010 - 2020) Projected Annual Openings
Resulting from New Growth 2010 2020 Net Percent 587 608 21 3.6% 2
Source: CWRI 2010-2020 Employment Projections
In addition to new growth, employment opportunities for dentists will arise from the need to replace those that retire. In Maine, 17 openings per year are expected due to replacement needs. In total, 19 job openings are expected per year.
2
17 19
Growth Replacement Total
Projected Annual Job Openings, Dentists

Healthcare Occupations Report | P a g e 81
Job openings due to replacement needs are based on employment patterns of the U.S. dentist workforce. This creates a bias in the estimates for Maine, since practitioners are older here. Actual replacement needs could be higher (in percentage terms) due to the demographic profile of Maine’s dentist workforce.
Impact of Replacement Rates on Projected Dentist Job Openings
Replacement Rate (%)
Total Replacement
Need 2010-2020
Replacement Openings per Year
Total Job Openings
from Growth 2010-2020
Job Openings from
Growth per year
Total Job Openings
2010-2020
Total Job Openings per year
26% 151 15 21 2 172 17 28% 163 16 21 2 184 18 30% 174 17 21 2 195 19 32% 186 19 21 2 207 21 34% 198 20 21 2 219 22 36% 210 21 21 2 231 23 38% 221 22 21 2 242 24
Yellow highlighted portion indicates base assumption. Source: CWRI
With a significant portion of the dentists approaching the traditional age for retirement, the need to build a pipeline of practitioners with the skills and education necessary to replace those that may leave the workforce is high. The new dental school will be an important part of this process, because it will give newly trained dentists the option to live and practice in the state where they’ve trained. The program will also be instrumental in bringing more dentists to rural and underserved areas.

82 | P a g e
29-2021 Dental Hygienists
Occupation description
Clean teeth and examine oral areas, head, and neck for signs of oral disease. May educate patients on oral hygiene, take and develop x rays, or apply fluoride or sealants.
Illustrative examples: Registered Dental Hygienist, Oral Hygienist
Independent Practice Dental Hygienists (IPDH) licensed by the Maine Board of Dental Examiners may be the proprietor of an independent dental hygiene practice and may provide services without supervision by a dentist to the extent permitted by laws set forth in M.R.S.A. Title 32, Chapter 16 and rules of the Board of Dental Examiners. An IPDH may also be employed by dentists. Only those that are employed are included in OES figures for this occupation.
Education requirements
Dental hygienists typically need an associate’s degree in dental hygiene to enter the occupation. Certificates, bachelor's degrees, and master's degrees in dental hygiene are also available but are less common among dental hygienists. In Maine, both associate and baccalaureate degree programs are offered. More information on Maine’s dental hygienist education programs is available at the end of this profile. Private dental offices usually require a minimum of an associate’s degree or certificate in dental hygiene. A bachelor's or master's degree is usually required for research, teaching, or clinical practice in public or school health programs.
The licensure of dental hygienists (both independent practice dental hygienists and registered dental hygienists) is governed by the Maine Board of Dental Examiners. All hygienists must renew their license every two years and earn 30 hours of continuing education consisting of board-approved courses in the two years preceding renewal.
An IPDH must possess a bachelor's degree from a Commission of Dental Accredited (CODA) dental hygiene program and 2,000 work hours of clinical practice in a private dental practice during the two years preceding the application or possess an associate degree from a CODA accredited dental hygiene program and 6,000 work hours of clinical practice in a private dental practice during the six years preceding the application. They are also required to provide a referral plan to patients in need of additional care by a dentist.17
Employment & Wages
In 2012 there were 1,050 dental hygienists in Maine earning a median annual wage of $67,000. It is estimated that less than two percent of the hygienist workforce is self-employed or practicing independently as an IPDH.
17 Academy of General Dentistry, “Dental Hygienist Duties by State.”

Healthcare Occupations Report | P a g e 83
2012 Employment & Wage Statistics
Average
Employment Where are they
employed? What do they earn
(median)? Dental Hygienists 1,050 $67,450 Ambulatory Healthcare Services 98% $67,620 Source: 2012 Occupational Employment Statistics, CWRI
The following chart shows that employment of dental hygienists experienced solid growth from 2004 through 2008, but more recently experienced modest declines. At the same time, anecdotes from industry professionals point to a challenging labor market for hygienists—many recent graduates cannot find work and those who do are underemployed. Older hygienists have similar problems. Due to limitations in OES data, it’s possible that the modest employment declines displayed in the chart below belie a more challenging labor market for hygienists. As noted in the discussion under Data sets and limitations, OES employment data does not indicate whether a person is employed part or full time. One of the limitations of using this data for time series analysis is that the proportion working part time may change with the economic cycle. In the figure below, it’s possible that the proportion working part time may be increasing over the last few years.
Since 2004 the ratio of hygienists to dentists has increased.
930
840
1120 1120 1050
2004 2006 2008 2010 2012
Dental Hygienist Employment
1.6 1.7
2.1
1.9
2004 2006 2008 2010
Number of Hygienists per Dentist

84 | P a g e
Source: OES, employment projections (for total dentists, employed and self-employed), CWRI
Compared to the nation, Maine has greater numbers of dental hygienists per 1,000 residents.
Distribution of employment
Ninety percent of Maine’s dental hygienists are employed in 6 counties that represent 70 percent of the population. Approximately one third are employed in Cumberland County.
0.79
0.61
Maine USA
Dental Hygienists per 1,000 Population

Healthcare Occupations Report | P a g e 85
Distribution of Employment
Number Employed
Pct. (%) total
employment
Pct. (%) of total Maine Popula-
tion Number employed
per 1,000 population Androscoggin County 90 9% 8% 0.8 Aroostook County 60 6% 5% 0.8 Cumberland County 370 35% 21% 1.3 Franklin County n/a n/a 2% Hancock County n/a n/a 4% Kennebec County 120 11% 9% 1.0 Knox County n/a n/a 3% Lincoln County n/a n/a 3% Oxford County n/a n/a 4% Penobscot County 150 14% 12% 1.0 Piscataquis County n/a n/a 1% Sagadahoc County n/a n/a 3% Somerset County n/a n/a 4% Waldo County n/a n/a 3% Washington County n/a n/a 2% York County 160 15% 15% 0.8 Maine 1,050 90% 100% 0.79
U.S. 0.61 Source: CWRI analysis of OES & Census data
Some counties have suppressed data per BLS confidentiality standards.
Schools offering training and number completing
Two schools in Maine offer dental hygienist programs: University of Maine at Augusta at its Bangor campus and the University of New England at its campus in Portland. Each school offers associates and bachelors programs. Over the last three years, there has been an average of 85 graduates per year.
83
88
84
88
84
2007 2008 2009 2010 2011
Dental Hygienist Program Completers

86 | P a g e
Education Programs & Annual Graduates
School CIP Code CIP Title Completer Title 2007 2008 2009 2010 2011
University of Maine at Augusta 510602
Dental Hygiene/ Hygienist
Associate's Degree 23 22 24 17 17
University of Maine at Augusta 510602
Dental Hygiene/ Hygienist
Bachelor's Degree
2
3 4
University of New England 510602
Dental Hygiene/ Hygienist
Associate's Degree 60 42 41 47 36
University of New England 510602
Dental Hygiene/ Hygienist
Bachelor's Degree 22 19 21 27
Total 83 88 84 88 84
Outlook
Nationally, employment of dental hygienists is expected to increase 38 percent from 2010 to 2020, much faster than the average for all occupations. Ongoing research linking oral health and general health will continue to spur the demand for preventative dental services, which dental hygienists often provide. New and increasingly accurate technologies to help diagnose oral health problems are also expected to increase demand. For example, new tests use saliva samples that a hygienist takes to spot early signs of oral cancer.
As their practices expand, dentists will hire more hygienists to perform preventative dental care, allowing the dentist to see more patients. Also, as the large baby boomer population ages and people keep more of their original teeth than previous generations, the need to maintain and treat these teeth will continue to drive the need for hygienists’ services.
Demand for dental services follows the trends in the economy because the patient or private insurance companies pay for these services. As a result, during slow times in the economy, demand for dental services may decrease. During such times, dental hygienists may have difficulty finding employment or, if they are currently employed, they might work fewer hours.
In Maine, employment of hygienists is expected to grow 14 percent, resulting in 15 new jobs per year. In addition to new job opportunities, an additional 21 job openings are expected to arise each year due to existing workers retiring or exiting the field. In total, 36 job openings per year are expected. For more detailed understanding of employment projections methodology and limitations, please see the section at the beginning of this report, Data sets and limitations.
Employment of Dental Hygienist in Maine, 2010 and Projected 2020
Average Employment Change in Employment (2010-2020) Projected Annual Openings
Resulting from New Growth 2010 2020 Net Percent
1,060 1,207 147 13.9% 15
Source: CWRI 2010-2020 Employment Projections

Healthcare Occupations Report | P a g e 87
15
21
36
Growth Replacement Total
Projected Annual Job Openings for Dental Hygienists

88 | P a g e
31-9091 Dental Assistants
Occupation description
Assist dentist, set up equipment, prepare patient for treatment, and keep records.
Illustrative examples: Orthodontic Assistant, Certified Dental Assistant (CDA)
An Expanded Function Dental Assistant (EFDA) may perform certain reversible intraoral procedures (as specified by the laws and rules pertaining to dentistry in Maine) under the direct supervision of a licensed dentist.
Education requirements
There are several tiers of dental assisting in Maine, each with different education and training requirements and a different scope of practice. Dental assistants provide basic supportive dental assistance under the supervision of a licensed dentist. This level of dental assisting has no education or training requirements. Dental assistants who pass the Dental Assistant National Board earn the Certified Dental Assistant (CDA) certification and are qualified to perform additional functions outlined in the Dental Practice Act. To qualify as an EFDA a person must be 18 years of age or older, hold a certified dental assistant certificate or registered dental hygiene license and have completed training in a school or program approved by the Maine Board of Dental Examiners, or be credentialed by another state or province.
Nationally, there are several possible paths to becoming a dental assistant and the education and training paths vary by state. Some states require assistants to graduate from an accredited program and possibly pass a state exam. In other states, there are no formal educational requirements. Dental assistants who do not have formal education in dental assisting may learn their duties through on-the-job training. The dentist or other dental assistants in the office teach the new assistant dental terminology, the names of the instruments, how to do daily tasks, how to interact with patients, and other activities necessary to help keep the dental office running smoothly. Most states regulate what dental assistants may do, but that varies by state.
Some states require assistants to graduate from an accredited program and pass a state exam. Most programs take about one year to complete and lead to a certificate or diploma and are offered by community colleges. Two-year programs, also offered in community colleges, are less common and lead to an associate’s degree. The Commission on Dental Accreditation (CODA), part of the American Dental Association, approved more than 285 dental-assisting training programs in 2011.
Employment & Wages
In 2012 there were 1,100 dental assistants in Maine or two for every dentist. The median salary was 10 percent above the U.S. median.
2012 Employment & Wage Statistics
Average
Employment Where are they
Employed? What do they Earn
(median)?
Dental Assistants 1,130 $37,650
Ambulatory Healthcare Services 97% $37,670
Source: 2012 Occupational Employment Statistics, CWRI

Healthcare Occupations Report | P a g e 89
In 2012 there were 11 percent fewer dental assistants in Maine per thousand residents than the nation.
Distribution of employment
Cumberland, Kennebec, Penobscot and York Counties have high shares of dental assistant employment relative to their population levels.
Distribution of Employment
Number Employed
Pct. (%) Total Employment
Pct. (%) of total Maine Population
Number Employed per
1,000 Population
Androscoggin County 70 6% 8% 0.7 Aroostook County 40 4% 5% 0.6 Cumberland County 350 31% 21% 1.2 Franklin County n/a 2% Hancock County n/a 4% Kennebec County 180 16% 9% 1.5 Knox n/a 3% Lincoln County n/a 3% Oxford County n/a 4% Penobscot County 200 18% 12% 1.3 Piscataquis County n/a 1% Sagadahoc County n/a 3% Somerset County n/a 4% Waldo County n/a 3% Washington County n/a 2% York County 230 20% 15% 1.2 Maine 1,130 95% 100% 0.85 U.S. 0.96 Source: CWRI analysis of OES & Census data Some counties have suppressed data per BLS confidentiality standards.
0.85 0.96
Maine U.S.
Dental Assistants per 1,000 Population, 2012

90 | P a g e
Schools offering training and number completing
The University of Maine at Augusta (UMA) offers a certificate program in dental assisting. In 2011, UMA also had 2 graduates from an Associate’s degree program in dental assisting. The York County Community College also offers certifications in dental assisting and expanded function dental assisting. These are non-credit courses, however. Data for the York community college programs was not reported to IPEDS as they are non-credit bearing.
Education Programs & Annual Graduates School CIP Code CIP Title Completer Title 2007 2008 2009 2010 2011
Univ. Maine at Augusta 510601
Dental Assisting/ Assistant
Post-sec. Awards/ Cert./Diplomas; 1-2 yrs. 10 12 14 19 15
Univ. Maine at Augusta 510601
Dental Assisting/ Assistant
Associate's Degree
2
Total 10 12 14 19 17
Outlook
Nationally, employment of dental assistants is expected to grow by 31 percent from 2010 to 2020, much faster than the average for all occupations. Ongoing research linking oral health and general health will likely continue to increase the demand for preventive dental services. Dentists will continue to hire more dental assistants to complete routine tasks, allowing the dentist to see more patients in their practice and spend their time on more complex procedures. As dental practices grow, more dental assistants will be needed.
As the large baby-boom population ages, and as people keep more of their original teeth than did previous generations, the need to maintain and treat teeth will continue to increase the need for dental assistants.
In Maine, employment of dental assistants is expected to increase by nine percent from 2010 to 2020. This growth is expected to result in approximately 89 new jobs, or nine job openings per year.
10 12
14
19 17
2007 2008 2009 2010 2011
Dental Assistant Program Completers

Healthcare Occupations Report | P a g e 91
Employment of Dental Assistants in Maine 2010 and Projected 2020
Average Employment Change in Employment (2010-2020)
Projected Annual Openings Resulting from
New Growth 2010 2020 Net Percent
1,008 1,097 89 8.8% 9
Source: CWRI 2010-2020 Employment Projections
In addition, job openings will result from the need to replace workers that retire or otherwise exit the occupation. In total, there are expected to be 300 job openings for dental assistants from 2010 to 2020, or 30 per year.
9
21
30
Growth Replacement Total
Projected Annual Job Openings for Dental Assistants

92 | P a g e
Other Doctoral Level Healthcare Practitioners Summary Statistics
Workforce Characteristics Chiropractors Podiatrists Optometrists Audiologists Employment (2012) 160 30 130 20
Employment per 1,000 population 0.12 0.02 0.10 0.02
versus U.S. Above average Below average Average Below average
Avg. annual starting wage (Maine) $41,850 $104,790 $86,310 $59,930
Median annual wage (Maine) $63,010 $161,390 $111,070 $71,290
U.S. median annual wage $66,160 $116,440 $97,820 $69,720
Median wage for all occupations in Maine $32,590 $32,590 $32,590 $32,590
Minimum Education Requirement Doctoral or professional
degree
Doctoral or professional
degree
Doctoral or professional
degree
Doctoral or professional
degree
Job Growth Projections -2% -4% 3% 17%
National Median Age 47.3 NA NA NA
Top Industry of Employment Ambulatory Health Svcs.
Ambulatory Health Svcs.
Ambulatory Health Svcs. Hospitals
Licensure Board Board of Chiropractic Licensure
Board of Licensure in Podiatric Medicine
Board of Optometry
Board of Examiners on Speech, Audiology and Hearing
Note: Psychologists and pharmacists also require a doctoral degree, but for the purpose of this report these occupations are grouped with other professions. The SOC classifies psychologists under Life, Physi-cal and Social Science occupations (19-0000) as opposed to health practitioners (29-0000). For this re-port the psychologist profile is located under Mental Health professions. The pharmacist profile is grouped with pharmacy technicians in their own category.
Key points
• Job opportunities are limited by the small size of these occupations.
• Employment growth in these fields is expected to be stronger nationally than for Maine, due in part to this state’s lower population growth as well as lower projected growth for the industry.
• It is estimated that 35 percent of optometrists will need to be replaced over the coming decade due to retirements.

Healthcare Occupations Report | P a g e 93
29-1011 Chiropractors
Occupation description
Assess, treat, and care for patients by manipulation of spine and musculoskeletal system. May provide spinal adjustment or address sacral or pelvic misalignment.
Education requirements
Becoming a chiropractor requires earning a Doctor of Chiropractic (D.C.) degree and getting a state license. Doctor of Chiropractic programs take 4 years to complete and require three years of previous undergraduate college education for admission.
Employment & Wages
In 2012 there were 160 chiropractors in Maine, earning a median annual salary of $63,000. These estimates do not include the self-employed. Including the self-employed, there were nearly 240 chiropractors practicing in this state in 2010.
2012 Employment & Wage Statistics
Average Employment
Median Annual Salary
Maine 160 $63,010 Industries with Highest Share of Employment (% total) Ambulatory Healthcare Services 100% $63,010 Source: 2012 Occupational Employment Statistics, CWRI
Maine had 35 percent more employed chiropractors per thousand residents than the nation.
Schools offering training and number completing
No programs in Maine.
0.12
0.09
Maine U.S.
Chiropractors per 1,000 Population, 2012

94 | P a g e
Outlook
Nationally, employment of chiropractors is expected to increase by 28 percent from 2010 to 2020, faster than the average for all occupations.
People across all age groups are increasingly seeking chiropractic care, because most chiropractors treat patients without performing surgery or prescribing drugs. Chiropractic treatment of the back, neck, limbs, and joints has become more accepted as a result of research and changing attitudes about alternative healthcare.
The aging of the large baby-boom generation will lead to new opportunities for chiropractors, because older adults are more likely to experience musculoskeletal and joint problems.
Demand for chiropractic treatment is related to the ability of patients to pay, either directly or through health insurance. Although more insurance plans now cover chiropractic services, the extent of such coverage varies among plans. Chiropractors must educate communities about the benefits of chiropractic care to establish a successful practice.
In Maine, employment of chiropractors is expected to decline by 2 percent from 2010 to 2020, much slower than what’s expected nationally, primarily due to slower population and industry growth expectations.18 Despite the slight decline in employment, job opportunities will arise as currently practicing chiropractors retire.
Employment of Chiropractors in Maine, 2010 and Projected 2020
Average Employment Change in Employment (2010-2020)
Projected Annual Openings Resulting from New Growth 2010 2020 Net Percent
238 233 -5 -2.1% 0
Source: CWRI 2010-2020 Employment Projections
18 Nationally, employment at “offices of all other health practitioners” (which includes offices of chiropractors) is expected to increase 52 percent from 2010 to 2020. In Maine, this industry is projected to grow 12 percent.
0
5 5
Growth Replacement Total
Projected Annual Job Openings for Chiropractors

Healthcare Occupations Report | P a g e 95
29-1081 Podiatrists
Occupation description
Diagnose and treat diseases and deformities of the human foot.
Education requirements
Becoming a podiatrist requires completing an undergraduate college education, a four-year postgraduate degree, and a three-year medical and surgical residency. Podiatrists also must be licensed.
Employment & Wages
In 2012 there were an estimated 30 podiatrists employed in Maine earning a median annual salary of over $160,000. Including the self-employed, there were approximately 50 podiatrists practicing in Maine in 2010.
2012 Employment & Wage Statistics
Average Employment
Median Annual Salary
Maine 30 $161,390 Industries with Highest Share of Employment (% total)
Ambulatory Healthcare Services 100% $162,250 Source: 2012 Occupational Employment Statistics, CWRI
The number of employed podiatrists per thousand residents in Maine was 20 percent below that of the nation.
0.02
0.03
Maine U.S.
Podiatrists per 1,000 Population, 2012

96 | P a g e
Schools offering training and number completing
No programs in Maine.
Outlook
Nationally, employment of podiatrists is expected to increase 20 percent from 2010 to 2020, faster than the average for all occupations.
As the U.S. population ages and increases, the number of people expected to have mobility and foot-related problems will rise. More podiatrists will be needed to provide this care. In addition, podiatrists are increasingly working in group practices along with other healthcare professionals. Continued growth in the use of outpatient surgery will create new opportunities for podiatrists, as all podiatrists complete three years of standardized hospital-based residency training.
In Maine, podiatrist employment is expected to decline four percent through 2020. A primary reason for the lower growth in Maine is slower industry growth as well as a declining ratio of podiatrists to overall industry employment. Due to the small size of this occupation, job opportunities from replacement needs will also be limited.
Employment of Podiatrists in Maine, 2010 and Projected 2020
Average Employment
Change in Employment (2010-2020)
Projected Annual Openings Resulting from New Growth
2010 2020 Net Percent
47 45 -2 -4.3% 0
Source: CWRI 2010-2020 Employment Projections
0
1 1
Growth Replacement Total
Projected Annual Job Openings for Podiatrists

Healthcare Occupations Report | P a g e 97
29-1041 Optometrists
Occupation description
Diagnose, manage, and treat conditions and diseases of the human eye and visual system. Examine eyes and visual system, diagnose problems or impairments, prescribe corrective lenses, and provide treatment. May prescribe therapeutic drugs to treat specific eye conditions. Ophthalmologists are included in “Physicians and Surgeons, All Other” (29-1069).
Education requirements
Optometrists must complete a Doctor of Optometry program and get a state license. Doctor of Optometry programs take four years to complete after earning an undergraduate degree.
Employment & Wages
In 2012 there were 130 employed optometrists in Maine. Including the self-employed, it is estimated there were 150 optometrists in 2010.
2012 Employment & Wage Statistics
Average Employment
Median Annual Salary
Maine 130 $111,070 Industries with Highest Share of Employment (% total) Ambulatory Healthcare Services 100% $111,450 Source: 2012 Occupational Employment Statistics, CWRI
The number of employed optometrists per population in Maine and the nation were comparable.
0.10 0.09
Maine U.S.
Optometrists per 1,000 Population, 2012

98 | P a g e
Schools offering training and number completing
No programs in Maine.
Outlook
Nationally, employment of optometrists is expected to grow by 33 percent from 2010 to 2020, much faster than the average for all occupations.
Because vision problems tend to occur more frequently later in life, more optometrists will be needed to meet the health needs of an aging population. Also, the number of people with chronic diseases, such as diabetes, has increased in recent years. These diseases frequently cause vision problems and require treatment from optometrists. In addition, an increasing number of insurance plans, including Medicare and Medicaid, provide some vision or eye-care insurance coverage.
In Maine, slower economic and industry growth will limit optometrist employment growth to three percent from 2010 to 2020. Despite limited growth in employment in Maine, 35 percent currently practicing optometrists are expected to retire or otherwise exit the field in coming years, creating job opportunities for new entrants. In total, five annual job openings are expected.
Employment of Optometrists in Maine 2010 and Projected 2020
Average Employment
Change in Employment (2010-2020)
Projected Annual Openings Resulting from New Growth
2010 2020 Net Percent
151 156 5 3.3% 0
Source: CWRI 2010-2020 Employment Projections
0
5 5
Growth Replacement Total
Projected Annual Job Openings, Optometrists

Healthcare Occupations Report | P a g e 99
29-1181 Audiologists
Occupation description
Assess and treat persons with hearing and related disorders. May fit hearing aids and provide auditory training. May perform research related to hearing problems.
Education requirements
Doctoral or professional degree.
Employment & Wages
2012 Employment & Wage Statistics
Average Employment
Median Annual Salary
Maine 20 $71,290 Industries with Highest Share of Employment (% total) Hospitals 50% $77,160 Source: 2012 Occupational Employment Statistics, CWRI
Schools offering training and number completing
No programs in Maine.
Outlook
Nationally, employment of audiologists is expected to grow by 37 percent from 2010 to 2020, much faster than the average for all occupations. In Maine, employment of audiologists is expected to increase 17 percent. Due to this occupation’s small size, only five new jobs are expected over the ten
0.02
0.04
Maine U.S.
Audiologists per 1,000 Population

100 | P a g e
year period. The number of projected annual openings resulting from new growth in the figure below is zero due to rounding.
The early identification and diagnosis of hearing disorders in infants also will spur employment growth. Advances in hearing aid design, such as the reduction of feedback and a smaller size, may make the devices more appealing as a means to minimize hearing loss, leading to more demand for the audiologists who provide hearing aids.
Demand for audiologists may be greater in areas with large numbers of retirees, so audiologists who are willing to relocate may have the best job prospects.
Employment of Audiologists in Maine 2010 and Projected 2020
Average Employment
Change in Employment (2010-2020)
Projected Annual Openings Resulting from New Growth
2010 2020 Net Percent
30 35 5 17% 0
Source: CWRI 2010-2020 Employment Projections
No replacement job opportunities are expected in Maine.

Healthcare Occupations Report | P a g e 101
Pharmacists & Related Summary Statistics
Workforce Characteristics Pharmacists Pharmacy Technicians
Employment (2012) 1,330 2,150
Employment per 1,000 population 1.0 1.6
versus U.S. Above avg. Above avg.
Average annual starting wage (Maine) $112,030 $21,910
Median annual wage (Maine) $132,460 $28,160
U.S. median annual wage $116,670 $29,320
Median wage for all occupations in Maine $32,590 $32,590
Minimum Education Requirement Doctoral or Professional degree
High school diploma or equivalent
Job Growth Projections 14% 16%
National Median Age 41.2 NA
Top Industry of Employment Health and personal care stores
Health and personal care stores
Licensure Board Maine Board of Pharmacy Maine Board of Pharmacy
Key points
• In 2012, Maine had 10 percent more pharmacists per thousand residents compared to the nation. Median wages in Maine were 14 percent above the national median.
• Employment of pharmacists in Maine is expected to increase 14 percent from 2010 to 2020. In addition, it is expected that 1 out every 4 currently practicing will need to be replaced due to retirements or those otherwise permanently exiting the field.
• Two new pharmacy schools, The University of New England’s College of Pharmacy and the Husson University School of Pharmacy had their first graduates in May of 2013. UNE graduated 90 and Husson 47.
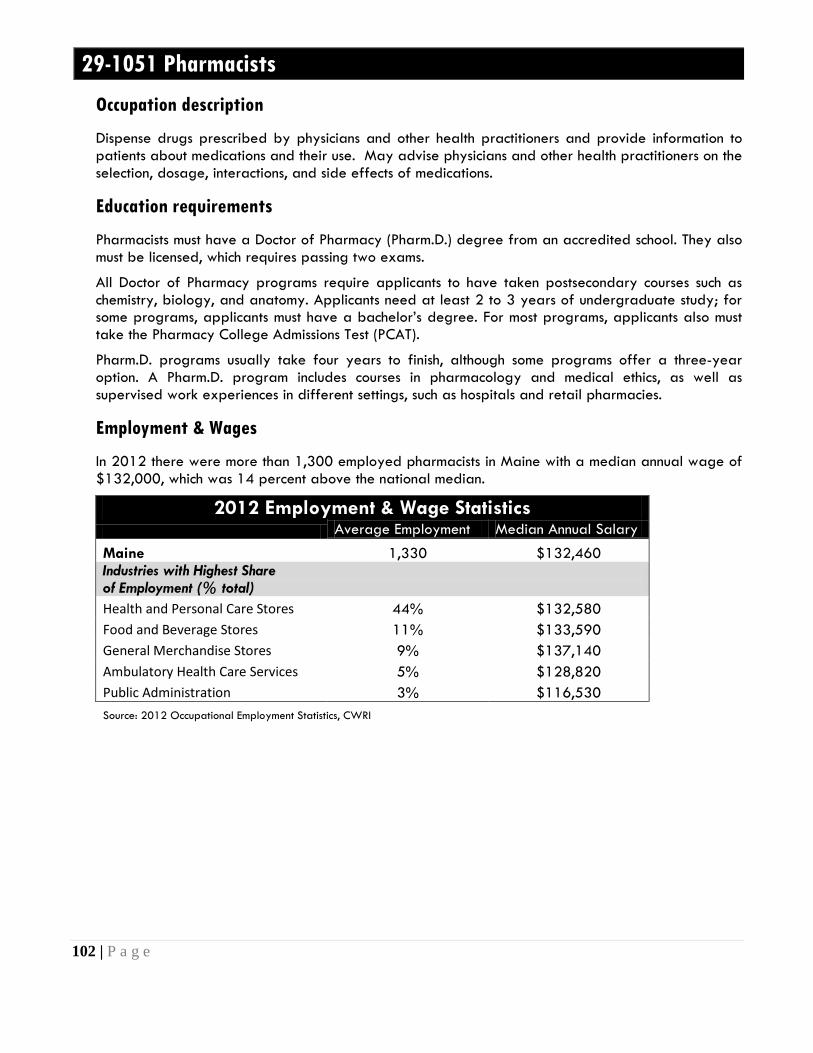
102 | P a g e
29-1051 Pharmacists
Occupation description
Dispense drugs prescribed by physicians and other health practitioners and provide information to patients about medications and their use. May advise physicians and other health practitioners on the selection, dosage, interactions, and side effects of medications.
Education requirements
Pharmacists must have a Doctor of Pharmacy (Pharm.D.) degree from an accredited school. They also must be licensed, which requires passing two exams.
All Doctor of Pharmacy programs require applicants to have taken postsecondary courses such as chemistry, biology, and anatomy. Applicants need at least 2 to 3 years of undergraduate study; for some programs, applicants must have a bachelor’s degree. For most programs, applicants also must take the Pharmacy College Admissions Test (PCAT).
Pharm.D. programs usually take four years to finish, although some programs offer a three-year option. A Pharm.D. program includes courses in pharmacology and medical ethics, as well as supervised work experiences in different settings, such as hospitals and retail pharmacies.
Employment & Wages
In 2012 there were more than 1,300 employed pharmacists in Maine with a median annual wage of $132,000, which was 14 percent above the national median.
2012 Employment & Wage Statistics Average Employment Median Annual Salary
Maine 1,330 $132,460 Industries with Highest Share of Employment (% total) Health and Personal Care Stores 44% $132,580 Food and Beverage Stores 11% $133,590 General Merchandise Stores 9% $137,140 Ambulatory Health Care Services 5% $128,820 Public Administration 3% $116,530 Source: 2012 Occupational Employment Statistics, CWRI

Healthcare Occupations Report | P a g e 103
Distribution of employment
Distribution of Employment
Number Employed
Pct. (%) total employment
Pct. (%) of total Maine Population
Number employed per
thousand population
Androscoggin County 80 6% 8% 0.74 Aroostook County n/a n/a 5% Cumberland County 320 24% 21% 1.13 Franklin County 20 2% 2% 0.65 Hancock County 60 5% 4% 1.10 Kennebec County 200 15% 9% 1.64 KnoxCounty 40 3% 3% 1.00 Lincoln County n/a n/a 3% Oxford County 20 2% 4% 0.35 Penobscot County 190 14% 12% 1.24 Piscataquis County n/a n/a 1% Sagadahoc County n/a n/a 3% Somerset County 30 2% 4% 0.57 Waldo County n/a n/a 3% Washington County 20 2% 2% 0.62 York County 130 10% 15% 0.65 Maine 1,330 83% 100% 1.00 OES, CWRI
Some data is suppressed according to BLS confidentiality and data quality requirements. Suppressed data is shown as “n/a” for not available.
1.0 0.90
Maine U.S.
Pharmacists per 1,000 Population, 2012

104 | P a g e
Schools offering training and number completing
The University of New England’s College of Pharmacy and the Husson University School of Pharmacy began accepting students in the fall of 2009, when their programs were launched. UNE graduated 90 and Husson 47 in May of 2013.
Outlook
Nationally, employment of pharmacists is expected to increase by 25 percent from 2010 to 2020, faster than the average for all occupations. In Maine, pharmacist employment is expected to increase 14 percent.
Several factors are likely to contribute to growth. Scientific advances will lead to new drug products. More people may get insurance coverage for medications. The number of older people is growing, and older people use more prescription medicines than younger people. As healthcare continues to become more complex and as more people take multiple medications, more pharmacists will be needed to counsel patients on how to use their medications safely.
Demand is also likely to increase for pharmacists in physicians' offices, outpatient care centers, and nursing homes.
In addition to new growth, job opportunities will result from currently practicing pharmacists retiring or otherwise exiting the field. Because a significant number of pharmacists are expected to retire in the coming decade (25 percent), new pharmacists should expect good job prospects. In total, over 50 job opportunities are expected per year, with over half from replacement needs.
Employment of Pharmacists in Maine 2010 and Projected 2020
Average Employment
Change in Employment (2010-2020)
Projected Annual Openings Resulting from New Growth
2010 2020 Net Percent
1,322 1,510 188 14.2% 19
Source: CWRI 2010-2020 Employment Projections
19
34
53
Growth Replacement Total
Projected Annual Job Openings, Pharmacists

Healthcare Occupations Report | P a g e 105
29-2052 Pharmacy Technicians
Occupation description
Prepare medications under the direction of a pharmacist. May measure, mix, count out, label, and record amounts and dosages of medications according to prescription orders.
Education requirements
Many pharmacy technicians learn how to perform their duties through on-the-job training. Others attend postsecondary education programs in pharmacy technology at vocational schools or community colleges, which award certificates. These programs typically last 1 year or less and cover a variety of subjects, such as arithmetic used in pharmacies, recordkeeping, methods of dispensing medications, and pharmacy law and ethics. Technicians also learn the names, actions, uses, and doses of medications. Many training programs include internships, in which students get hands-on experience in a pharmacy.
Employment & Wages
In 2012 there were over 2,100 pharmacy technicians employed in Maine earning a median annual salary of $28,000, which was slightly below the national median.
2012 Employment & Wage Statistics
Average Employment
Median Annual Salary
Maine 2,150 $28,160 Industries with Highest Share of Employment (% total) Health and Personal Care Stores 57% $27,500 Hospitals 15% $29,670 Food and Beverage Stores 13% $27,990 General Merchandise Stores 8% $27,340 Ambulatory Health Care Services 3% $31,300 Source: 2012 Occupational Employment Statistics, CWRI
In Maine, there are 1.6 pharmacy technicians employed per pharmacist, well above the national ratio of 1.25.
Maine also had 1.6 pharmacy technicians per thousand residents in 2012. This was 40 percent more than the national average (1.1 per thousand residents).

106 | P a g e
Schools offering training and number completing
According to IPEDs, InterCoast had the only completers in a pharmacy technician/assistant program in 2011. The number of completers has dwindled in recent years. At one point SMCC also had a program offering but there were no completers in 2011 and the program is no longer listed in the SMCC 2013-2014 catalog.
1.6
1.1
Maine U.S.
Pharmacy Technicians per 1,000 Population
15
11
2
4 4
2007 2008 2009 2010 2011
Pharmacy Technician Program Completers

Healthcare Occupations Report | P a g e 107
Education Programs & Annual Graduates
School CIP Code CIP Title
Completer Title 2007
2008
2009
2010 2011
Southern Maine Community Col-lege
510805
Pharmacy Techni-cian/Assistant
Associate's Degree 3 1 1 1
InterCoast-Career Institute -South Portland
510805
Pharmacy Techni-cian/Assistant
Post-Sec. Awards/Cert./ Diplomas;< 1 yr.
12 10 1 3 4
Total 15 11 2 4 4 Source: IPEDS, CWRI
Outlook
Nationally, employment of pharmacy technicians is expected to grow by 32 percent from 2010 to 2020, much faster than the average for all occupations. In Maine, employment is expected to increase 16 percent over the same time frame.
A primary growth driver of industry and occupational employment is an increasing number of prescription medications per person. This is driven in part by advances in pharmaceutical research—which enables diseases to be fought with prescribed medications—and also an aging of the population (older people use more prescription drugs than younger people).
Job prospects should be excellent for pharmacy technicians, particularly those with formal training and those with experience in retail settings.
MDOL projects 70 pharmacy technician job opportunities per year from 2010 to 2020, with approximately half of these coming from new growth.
Employment of Pharmacy Technicians in Maine 2010 and Projected 2020
Average Employment Change in Employment (2010-2020)
Projected Annual Openings Resulting from New Growth 2010 2020 Net Percent
2,055 2,393 338 16.4% 34
Source: CWRI 2010-2020 Employment Projections

108 | P a g e
34 36
70
Growth Replacement Total
Projected Annual Job Openings, Pharmacy Technicians

Healthcare Occupations Report | P a g e 109
Dieticians, Nutritionists & Related Summary Statistics
Workforce Characteristics Dieticians & Nutritionists
Dietetic Technicians
Employment (2012) 240 130 Employment per 1,000 population 0.2 0.1
versus U.S. Average Above avg. Average annual starting wage (Maine) $38,600 $22,980
Median annual wage (Maine) $53,960 $31,450
U.S. median annual wage $55,240 $26,260 Median wage for all occupations in Maine $32,590 $32,590
Minimum Education Requirement Bachelor's degree High school diploma
or equivalent
Job Growth Projections 19% 16%
National Median Age 47.4 NA
Top Industry of Employment Hospitals Hospitals
Licensure Board Board of Licensing of Dietetic Practice
Board of Licensing of Dietetic Practice
Key points
• A growing interest in diet and nutrition and an aging population support relatively strong growth rates for these occupations.
• The national median age of dieticians is 47. According to current BLS projections, thirty-five percent of the workforce may retire or permanently exit the field over the 2010 to 2020 projection period, which is among the highest for all health occupations.
29-1031 Dieticians and Nutritionists
Occupation description
Plan and conduct food service or nutritional programs to assist in the promotion of health and control of disease. May supervise activities of a department providing quantity food services, counsel individuals, or conduct nutritional research.
Illustrative examples: Clinical Dietician, Pediatric Dietician, Public Health Nutritionist

110 | P a g e
Education requirements
Most dietitians and nutritionists have earned a bachelor’s degree and receive supervised training through an internship or as a part of their coursework. Also, many states require dietitians and nutritionists to be licensed. In Maine, licensing of dieticians is governed by the Board of Licensing of Dietetic Practice.
Dietitians and nutritionists typically participate in several hundred hours of supervised training, usually in the form of an internship following graduation from college. However, some programs in dietetics include this training as part of the coursework.
Employment & Wages
In 2012 there were 240 employed dieticians and nutritionists in Maine earning a median salary of $54,000, which was slightly below the national median. More than half were employed at hospitals.
2012 Employment & Wage Statistics
Average Employment
Median Annual Salary
Maine 240 $53,960 Industries with Highest Share of Employment (% total) Hospitals 54% $55,130 Ambulatory Health Care Services 13% $57,040 Nursing and Residential Care Facilities 8% $66,210 Social Assistance 8% $31,610 Public Administration 8% $53,990 Source: 2012 Occupational Employment Statistics, CWRI
0.18 0.19
Maine U.S.
Dieticians & Nutritionists per 1,000 Population

Healthcare Occupations Report | P a g e 111
Distribution of employment
Distribution of Employment
Number Employed
Pct. (%) Total Employment
Pct. (%) of total Maine Population
Number Employed per 1,000 Population
Androscoggin County 30 13% 8% 0.28 Aroostook County 20 8% 5% 0.28 Cumberland County 70 29% 21% 0.25 Franklin County 20 8% 2% 0.65 Hancock County n/a n/a 4% Kennebec County 40 17% 9% 0.33 Knox n/a n/a 3% Lincoln County n/a n/a 3% Oxford County n/a n/a 4% Penobscot County 30 13% 12% 0.20 Piscataquis County n/a n/a 1% Sagadahoc County n/a n/a 3% Somerset County n/a n/a 4% Waldo County n/a n/a 3% Washington County n/a n/a 2% York County 30 13% 15% 0.15 Maine 240 100% 100% 0.18 Source: CWRI analysis of OES & Census data
Some data is suppressed according to BLS confidentiality and data quality requirements. Suppressed data is shown as “n/a” for not available.
Schools offering training and number completing
The University of Maine at Orono offers a B.S. degree in Food Science and Human Nutrition. Concentrations are offered in Food Science, Human Nutrition and Dietetics, Food Management, and Nutrition Science. The Human Nutrition and Dietetics concentration is designed to give professional preparation to students who want to become dietitians, nutrition scientists, nutrition educators or public health nutritionists in commercial, industrial, and public or private food and health care establishments. Graduates are eligible to apply for an American Dietetic Association accredited dietetic internship leading to state licensure and national registration. The department of Food Science and Human Nutrition offers a dietetic internship in conjunction with the Master of Science degree.
Outlook
Nationally, employment of dietitians and nutritionists is expected to increase 20 percent from 2010 to 2020, faster than average for all occupations. In Maine, 19 percent growth is expected to generate 60 new job opportunities over the ten year span, or six openings per year.
In recent years, there has been increased interest in the role of food in promoting health and wellness, particularly as a part of preventative healthcare in medical settings. The importance of diet in

112 | P a g e
preventing and treating illnesses such as diabetes and heart disease is now well known. More dietitians and nutritionists will be needed to provide care for people with these conditions.
An aging population also will increase the need for dietitians and nutritionists in nursing homes.
Job opportunities will also result from the need to replace currently practicing dieticians that are expected to retire. It is estimated that 35 percent of the workforce will retire over the coming decade. In total, 17 job openings per year are projected with the majority resulting from replacement needs.
Employment of Dieticians and Nutritionists in Maine 2010 and Projected 2020
Average Employment Change in Employment (2010-2020)
Projected Annual Openings Resulting from New Growth 2010 2020 Net Percent
322 382 60 18.6% 6
Source: CWRI 2010-2020 Employment Projections
6
11
17
Growth Replacement Total
Projected Annual Job Openings, Dieticians & Nutritionists

Healthcare Occupations Report | P a g e 113
29-2051 Dietetic Technicians
Occupation description
Assist in the provision of food service and nutritional programs, under the supervision of a dietitian. May plan and produce meals based on established guidelines, teach principles of food and nutrition, or counsel individuals.
Illustrative examples: Dietary Technician, Registered Diet Technician
Education requirements
High school diploma or equivalent.
Employment & Wages
2012 Employment & Wage Statistics
Average Employment Median Annual Salary
Maine 130 $31,450 Industries with Highest Share of Employment (% total) Hospitals 54% $29,370 Source: 2012 Occupational Employment Statistics, CWRI
Schools offering training and number completing
SMCC is the only school offering training in this area. In 2011, 12 graduated from the dietetic technician associate degree program at SMCC.
0.10
0.08
Maine U.S.
Dietetic Technicians per 1,000 Population

114 | P a g e
Education Programs & Annual Graduates
School CIP Code CIP Title Completer Title 2007 2008 2009 2010 2011
Southern Maine Community College
513103
Dietetic Technician
Associate's Degree
9
12
13
11
12
Southern Maine Community College
513199
Dietetics and Clinical Nutrition Services, Other
Post-Sec. Awards/ Cert./Diplomas; < 1 yr.
1
1
1
1
Washington County Community College
513104
Dietitian Assistant
Associate's Degree
3
Total 13 13 14 12 12
Source: IPEDS, CWRI
Outlook
In Maine, employment of dietetic technicians is expected to increase 16 percent from 2010 to 2020.
Factors driving employment for dietetic technicians are closely related to those for dietitians and nutritionists. Locally as well as nationally, there has been increased interest in the role of food in promoting health and wellness, particularly as a part of preventative healthcare in medical settings. The importance of diet in preventing and treating illnesses such as diabetes and heart disease is now well known. More dietetic technicians will be needed to assist in providing care for people with these conditions.
13 13
14
12 12
2007 2008 2009 2010 2011
Dietetic Technician (and related) Program Completers

Healthcare Occupations Report | P a g e 115
In total, five job openings are expected each year, two from growth and three from replacement opportunities.
Employment of Dietetic Technicians in Maine 2010 and Projected 2020
Average Employment Change in Employment (2010-2020)
Projected Annual Openings Resulting from New Growth 2010 2020 Net Percent
152 177 25 16.4% 2 Source: CWRI 2010-2020 Employment Projections
2
3
5
Growth Replacement Total
Projected Annual Job Openings, Dietetic Technicians

116 | P a g e
Therapists & Related Summary Statistics
Workforce Characteristics
Occupational Therapists
Occupational Therapist Assistants
Physical Therapists
Physical Therapist Assistants
Recreational Therapists
Radiation Therapists
Respiratory Therapists
Respiratory Therapy
Technicians
Speech-Language
Pathologists Employment (2012) 980 170 1,360 300 80 90 480 30 820 Employment per 1,000 population 0.74 0.13 1.0 0.23 0.06 0.07 0.36 0.02 0.62
versus U.S. Above avg. Above avg. Above avg. Average Average Above avg. Average Below avg. Above avg. Average annual starting wage (Maine)
$47,100 $39,130 $60,990 $40,000 $31,310 $57,680 $45,080 $40,420 $43,080
Median annual wage (Maine) $65,740 $45,760 $74,680 $49,500 $37,300 $72,990 $53,860 $53,390 $57,590
U.S. median annual wage $75,400 $53,240 $79,860 $52,160 $42,280 $77,560 $55,870 $46,760 $69,870
Median wage for all Occupations in Maine
$32,589 $32,590 $32,590 $32,590 $32,590 $32,590 $32,590 $32,590 $32,590
Minimum Education Requirement
Master's degree
Associate's degree
Doctoral or Professional
degree
Associate's degree
Bachelor's degree
Associate's degree
Associate's degree
Associate's degree
Master's degree
Job Growth Projections 13% 12% 15% 18% 12% 27% 41% 18% 10%
National Median Age 41.4 NA 39.9 34.8 NA NA 43.2 NA 41.6
Top Industry of Employment
Ambulatory Healthcare
Svcs.
Social Assistance
Ambulatory Healthcare
Svcs.
Ambulatory Healthcare
Svcs.
Hospitals, Nursing & Residential
Care
Hospitals Hospitals Hospitals Educational Services
Licensure Board
Board of Occupation
Therapy Practice
Board of Occupation
Therapy Practice
Board of Examiners in
Physical Therapy
Board of Examiners in
Physical Therapy
No Licensing
Dept. of Professional & Financial Regulation Office of Licensing
Board of Respiratory
Care Practitioners
Board of Respiratory
Care Practitioners
Board of Examiners in
Speech, Pathology
and Audiology

Healthcare Occupations Report | P a g e 117
Key points
• In 2012, the number of occupational and physical therapists and speech pathologists per thousand residents was substantially higher for Maine than for the nation. The distribution of employment is uneven with many counties having fewer practitioners per population compared to the state average. Employment growth is expected to range from 10 percent for speech pathologists to 15 percent for physical therapists.
• Employment of respiratory therapists is expected to increase 41 percent, the second highest of all health occupations. Respiratory therapists are typically employed in hospital settings, where overall employment is also expected to grow at a rapid clip.
• Radiation therapists also have a strong employment outlook (27 percent growth expected) and work in hospitals. In 2011, there were no graduates from the two radiation therapy programs in Maine. Radiation therapy is a relatively small occupation in Maine, which limits the number of job opportunities.
29-1122 Occupational Therapists
Occupation description
Assess, plan, organize, and participate in rehabilitative programs that help build or restore vocational, homemaking, and daily living skills, as well as general independence to persons with disabilities or developmental delays.
Illustrative examples: Registered Occupational Therapist
Education requirements
Occupational therapists need a master’s degree from an accredited occupational therapy program. Occupational therapists must also be licensed. In Maine, licensing is governed by the Board of Occupation Therapy Practice.
Employment & Wages
In 2012 there were an estimated 980 employed occupational therapists in Maine with a median annual wage of $66,000, which was 13 percent below the national median. Occupational therapists are employed in a variety of settings, including clinics, hospitals and schools.

118 | P a g e
2012 Employment & Wage Statistics
Average Employment
Median Annual Salary
Maine 980 $65,740 Industries with Highest Share of Employment (% total) Ambulatory Health Care Services 33% $70,060 Hospitals 22% $67,930 Educational Services 17% $47,530 Social Assistance 12% $62,690 Nursing and Residential Care Facilities 10% $73,940 Source: 2012 Occupational Employment Statistics, CWRI
According to 2012 OES data, Maine has more than twice the occupational therapists per thousand residents than that of the nation.
0.74
0.34
Maine U.S.
Occupational Therapists per 1,000 Population, 2012

Healthcare Occupations Report | P a g e 119
Distribution of employment
Distribution of Employment
Number Employed
Pct. (%) Total
Employment
Pct. (%) of Total Maine Population
Number Employed per
1,000 population
Androscoggin County 80 8% 8% 0.74 Aroostook County 50 5% 5% 0.71 Cumberland County 330 34% 21% 1.16 Franklin County n/a n/a 2% Hancock County n/a n/a 4% Kennebec County 80 8% 9% 0.66 Knox County n/a n/a 3% Lincoln County n/a n/a 3% Oxford County 20 2% 4% 0.35 Penobscot County 80 8% 12% 0.52 Piscataquis County n/a n/a 1% Sagadahoc County n/a n/a 3% Somerset County n/a n/a 4% Waldo County n/a n/a 3% Washington County n/a n/a 2% York County 70 7% 15% 0.35 Maine 980 72% 100% 0.74 Source: CWRI analysis of OES & Census data
Some data is suppressed according to BLS confidentiality and data quality requirements.
Schools offering training and number completing
Two schools offered degrees in occupational therapy: UNE and USM. According to IPEDs data, the number of UNE graduates dropped significantly in 2011.

120 | P a g e
Education Programs & Annual Graduates
School CIP Code CIP Title
Completer Title 2007 2008 2009 2010 2011
Husson University 512306 Occupational Therapy/Therapist
Master's Degree 6 12 14 9 16
University of New England 512306 Occupational
Therapy/Therapist Master's Degree 12 23 32 29 4
University of Southern Maine 512306 Occupational
Therapy/Therapist Master's Degree 9 15 14 15 21
Total 27 50 60 53 41 Source: IPEDS, CWRI
Outlook
Nationally, employment of occupational therapists is expected to increase 33 percent from 2010 to 2020, much faster than the average for all occupations. In Maine, occupational therapist employment is projected to increase 13 percent, below the national rate in part due to lower population growth rates for this state.
Occupational therapy will continue to be an important part of treatment for people with various illnesses and disabilities, such as Alzheimer’s disease, cerebral palsy, autism, or the loss of a limb. The need for occupational therapists will increase as the large baby-boom population ages and people remain active later in life. Specifically, occupational therapists help senior citizens maintain their independence by recommending home modifications and strategies that make daily activities easier.
Occupational therapists also play a large role in the treatment of many conditions commonly associated with aging, such as osteoarthritis and Parkinson’s disease. Patients will continue to seek noninvasive outpatient treatment for long-term disabilities and illnesses, either in their homes or in residential care environments. In addition, medical advances now enable more patients with critical problems to survive—patients who ultimately may need extensive therapy.
Job opportunities should be good for licensed occupational therapists in all settings, particularly in acute hospital, rehabilitation, and orthopedic settings because the elderly receive most of their
27
50
60 53
41
2007 2008 2009 2010 2011
Occupational Therapist Program Completers

Healthcare Occupations Report | P a g e 121
treatment in these settings. Occupational therapists with specialized knowledge in a treatment area also will have increased job prospects. In Maine, more than 30 job openings per year are expected with more than half resulting from the need to replace existing therapists that may retire or otherwise exit the occupation.
Employment of Occupational Therapists in Maine 2010 and Projected 2020
Average Employment
Change in Employment (2010 - 2020) Projected Annual Openings
Resulting from New Growth 2010 2020 Net Percent
1,004 1,135 131 13.0% 13
Source: CWRI 2010-2020 Employment Projections
13
19
32
Growth Replacement Total
Projected Annual Job Openings, Occupational Therapists

122 | P a g e
31-2011 Occupational Therapist Assistants
Occupation description
Assist occupational therapists in providing occupational therapy treatments and procedures. May, in accordance with State laws, assist in development of treatment plans; carry out routine functions, direct activity programs, and document the progress of treatments. Generally requires formal training.
Illustrative examples: Certified Occupational Therapy Assistant, Licensed Occupational Therapist Assistant
Education requirements
An associate’s degree is required to become an occupational therapy assistant. They must also be licensed in most states. Occupational therapy aides typically have a high school diploma or equivalent. In Maine, an occupational therapist assistant must renew their license annually. According to the Board of Occupation Therapy Practice, a Certified Occupational Therapy Assistant is one who has passed the certification examination of the National Board for Certification in Occupational Therapy for an occupational therapy assistant or who was certified as an Occupational Therapy Assistant prior to June 1977 and who is licensed to practice Occupational Therapy under the supervision of an Occupational Therapist.
Employment & Wages
2012 Employment & Wage Statistics
Average Employment
Median Annual Salary
Maine 170 $45,760 Industries with Highest Share of Employment (% total) Social Assistance 35% $46,290 Hospitals 24% $44,060 Ambulatory Health Care Services n/a $50,670 Nursing and Residential Care Facilities n/a $42,620 Source: 2012 Occupational Employment Statistics, CWRI

Healthcare Occupations Report | P a g e 123
Schools offering training and number completing
According to IPEDS data, Kennebec Valley Community College (KVCC) is the only school offering training for occupational therapist assistants. This is an associate’s degree program.
Education Programs & Annual Graduates
School CIP Code CIP Title Completer Title 2007 2008 2009 2010 2011
Kennebec Valley Community College
510803
Occupational Therapist Assistant
Associate's Degree
15
16
12
12
23
Source: IPEDS, CWRI
0.13
0.09
Maine U.S.
Occupational Therapists Assistants per 1,000 Population
15 16
12 12
23
2007 2008 2009 2010 2011
Occupational Therapist Assistant Program Completers

124 | P a g e
Outlook
Nationally, employment of occupational therapy assistants is expected to increase 43 percent from 2010 to 2020, much faster than the average for all occupations. In Maine, employment is expected to increase 12 percent.
Demand for occupational therapy is expected to rise significantly over the coming decade in response to the health needs of the aging baby-boom generation and a growing elderly population. Older adults are especially prone to conditions such as arthritis that affect their everyday activities. Occupational therapy assistants will be needed to assist occupational therapists in caring for these people. Occupational therapy will also continue to be used for treating children and young adults with developmental disabilities like autism.
Demand for occupational therapy assistants is also expected to come from occupational therapists employing more assistants to reduce the cost of occupational therapy services. After the therapist has evaluated a patient and designed a treatment plan, the occupational therapy assistant can provide many aspects of the treatment that the therapist prescribed.
Occupational therapy assistants and aides with experience working in an occupational therapy office or other healthcare setting should have the best job opportunities. In addition to overall employment growth, job openings will also result from the need to replace occupational therapy assistants and aides who leave the occupation.
In Maine, five job opportunities are expected each year; two from new growth and three from replacement needs.
Employment of Occupational Therapy Assistants in Maine 2010 and Projected 2020
Average Employment Change in Employment (2010 - 2020)
Projected Annual Openings Resulting from New Growth 2010 2020 Net Percent
176 197 21 11.9% 2
Source: CWRI 2010-2020 Employment Projections
2
3
5
Growth Replacement Total
Projected Annual Job Openings, OT Assistants

Healthcare Occupations Report | P a g e 125
29-1123 Physical Therapists
Occupation description
Assess, plan, organize, and participate in rehabilitative programs that improve mobility, relieve pain, increase strength, and improve or correct disabling conditions resulting from disease or injury.
Illustrative examples: Geriatric Physical Therapist, Physiotherapist, Pulmonary Physical Therapist
Education requirements
Physical therapists are required to have a postgraduate professional degree. Physical therapy programs usually award a Doctor of Physical Therapy (DPT) degree, although a small number award a Master of Physical Therapy (MPT) degree. Doctoral programs typically last three years; MPT programs require two to three years of study. Most programs, either DPT or MPT, require a bachelor’s degree for admission, and many require specific prerequisites, such as anatomy, physiology, biology, and chemistry.
According to the Maine Board of Physical Therapy, an applicant for license must be a graduate of an accredited program for the physical therapist. Accreditation must be by an agency recognized by the United States Commissioner of Education or the Council on Post-Secondary Accreditation, or both, and approved by the board. Applicants from other countries must present evidence of graduation from an accredited school of physical therapy and must be proficient in English, both written and spoken.
Employment & Wages
In 2012 there were nearly 1,400 physical therapists (PTs) in Maine earning a median wage of $75,000. PTs are employed in a range of industries including ambulatory care, hospitals, social assistance and education.
2012 Employment & Wage Statistics
Average Employment
Median Annual Salary
Maine 1,360 $74,680 Industries with Highest Share of Employment (% total) Ambulatory Health Care Services 54% $74,980 Hospitals 27% $72,480 Nursing and Residential Care Facilities 7% $78,970 Social Assistance 7% $84,300 Educational Services n/a $42,420 Source: 2012 Occupational Employment Statistics, CWRI
In Maine and the U.S., the number of physical therapists per thousand residents in 2012 was 1.0 and .61, respectively.

126 | P a g e
Distribution of employment
Distribution of Employment
Number Employed
Pct. (%) Total Employment
Pct. (%) of Total Maine Population
Number Employed per 1,000 Population
Androscoggin County 80 6% 8% 0.74 Aroostook County 40 3% 5% 0.56 Cumberland County 530 39% 21% 1.87 Franklin County n/a n/a 2% Hancock County n/a n/a 4% Kennebec County 100 6% 9% 0.82 Knox County n/a n/a 3% Lincoln County 30 2% 3% 0.88 Oxford County 30 2% 4% 0.52 Penobscot County 140 10% 12% 0.91 Piscataquis County n/a n/a 1% Sagadahoc County n/a n/a 3% Somerset County 40 3% 4% 0.77 Waldo County n/a n/a 3% Washington County 20 1% 2% 0.62 York County 150 11% 15% 0.75 Maine 1,360 84% 100% 1.0 Source: CWRI analysis of OES & Census data
Some data is suppressed according to BLS confidentiality and data quality requirements. Suppressed data is shown as “n/a” for not available.
1.0
0.61
Maine U.S.
Physical Therapists per 1,000 Population

Healthcare Occupations Report | P a g e 127
Schools offering training and number completing
Two schools offer programs for physical therapists—Husson University and UNE. Graduates from each program have been rising, as seen below.
Education Programs & Annual Graduates
School CIP Code CIP Title
Completer Title 2007 2008 2009 2010 2011
Husson University
512308
Physical Therapy/ Therapist
First-Professional Degrees 49 53
Husson University
512308
Physical Therapy/ Therapist Unidentified 19 16
Husson University
512308
Physical Therapy/ Therapist Master's Degree 17 22 1
University of New England
512308
Physical Therapy/ Therapist
First-Professional Degrees 7 23 39 42 48
Total 24 64 56 91 101
Outlook
Nationally, employment of physical therapists is expected to increase 39 percent from 2010 to 2020, much faster than the average for all occupations. In Maine, employment of physical therapists is expected to increase 15 percent.
Demand for physical therapy services will come, in large part, from the aging baby boomers, who are staying active later in life than previous generations did. Older persons are more likely to suffer heart attacks, strokes, and mobility-related injuries that require physical therapy for rehabilitation.
24
64 56
91 101
2007 2008 2009 2010 2011
Physical Therapist Program Completers

128 | P a g e
Advances in medical technology have increased the use of outpatient surgery to treat a variety of injuries and illnesses. Physical therapists will continue to play an important role in helping these patients recover more quickly from surgery.
Medical and technological developments also are expected to permit a greater percentage of trauma victims and newborns with birth defects to survive, creating additional demand for rehabilitative care. In addition, the incidence of chronic diseases, such as diabetes, has increased in recent years, and more physical therapists will be needed to help patients manage the effects of these diseases.
Job opportunities will likely be good for licensed physical therapists in all settings. Job opportunities should be particularly good in acute hospitals, skilled nursing, and orthopedic settings, where the elderly are most often treated. Job prospects should be especially favorable in rural areas because many physical therapists live in highly populated urban and suburban areas.
Across industries, 37 job opportunities are expected each year, with more than half of these resulting from new growth.
Employment of Physical Therapists in Maine 2010 and Projected 2020
Average Employment Change in Employment (2010-2020)
Projected Annual Openings Resulting from New Growth 2010 2020 Net Percent
1,397 1,604 207 14.8% 21 Source: CWRI 2010-2020 Employment Projections
21 16
37
Growth Replacement Total
Projected Annual Job Openings, Physical Therapists

Healthcare Occupations Report | P a g e 129
31-2021 Physical Therapist Assistants
Occupation description
Assist physical therapists in providing physical therapy treatments and procedures. May, in accordance with State laws, assist in the development of treatment plans, carry out routine functions, document the progress of treatment, and modify specific treatments in accordance with patient status and within the scope of treatment plans established by a physical therapist. Generally requires formal training.
Illustrative examples: Licensed Physical Therapy Assistant, Physiotherapy Assistant
Physical therapist assistants compared to physical therapist aides
The Occupational Outlook Handbook draws the following distinctions between physical therapist assistants and aides:
Both physical therapist assistants and physical therapist aides work under the direction of physical therapists. They help patients who are recovering from injuries, illnesses, and surgeries regain movement and manage pain. Physical therapist assistants are involved in the direct care of patients. Physical therapist aides often do tasks that are indirectly related to patient care, such as cleaning and setting up the treatment area, moving patients, and clerical tasks.
Physical therapist assistants typically do the following:
• Observe patients before and during therapy, noting their status and reporting to a physical therapist
• Help patients do specific exercises
• Use a variety of techniques, such as massage and stretching, to treat patients
• Use devices and equipment, such as walkers, to help patients
• Educate a patient and family members about what to do after treatment
Physical therapist aides typically do the following:
• Clean treatment areas and set up therapy equipment
• Help patients move to or from a therapy area
• Do clerical tasks, such as answering phones or helping patients with insurance paperwork
Physical therapist assistants help physical therapists provide care to patients. Under the direction and supervision of physical therapists, they give therapy through exercise; therapeutic methods, such as electrical stimulation, mechanical traction, and ultrasound; massage; and gait and balance training. Physical therapist assistants record patients’ responses to treatment and report the results of each treatment to the physical therapist.
Physical therapist aides help make therapy sessions productive, under the direct supervision of a physical therapist or physical therapist assistant. They usually are responsible for keeping the treatment area clean and organized and for preparing for each patient's therapy. They also help patients who need assistance moving to or from a treatment area.

130 | P a g e
Education requirements
Most states require physical therapist assistants to have an associate’s degree from an accredited physical therapist program. With the exception of Hawaii, all states require physical therapist assistants to be licensed. In Maine, applicants for licensure must be a graduate of an accredited physical therapist assistant program that is approved by the Maine Board of Examiners in Physical Therapy. Applicants trained in another country must present evidence of graduation from a school of physical therapy approved or accredited in the country where the school is located and have educational credentials equivalent to those of the United States trained physical therapist assistant. Proficiency in written and spoken English must also be demonstrated.19 Licenses renew annually.
Employment & Wages
2012 Employment & Wage Statistics
Average Employment
Median Annual Salary
Maine 300 $49,500 Industries with Highest Share of Employment (% total) Ambulatory Health Care Services 37% $49,210 Hospitals 30% $49,030 Social Assistance 23% $49,900 Nursing and Residential Care Facilities n/a $52,320 Source: 2012 Occupational Employment Statistics, CWRI
19 From the Maine Office of Professional and Occupational Regulation.
0.23 0.22
Maine U.S.
Physical Therapist Assistants per 1,000 Population

Healthcare Occupations Report | P a g e 131
Schools offering training and number completing
KVCC offers an associate’s degree program for physical therapy assistants. This is the only offering in Maine.
Education Programs & Annual Graduates
School CIP Code CIP Title
Completer Title 2007 2008 2009 2010 2011
Kennebec Valley Community College
510806
Physical Therapy Technician/Assistant
Associate's Degree
5
4
14
15
13
Source: IPEDS, CRWI
Outlook
Nationally, employment of physical therapist assistants is expected to increase 46 percent from 2010 to 2020, much faster than the average for all occupations. In Maine, employment of physical therapist assistants is expected to increase 18 percent.
Employment of physical therapist assistants is projected to grow faster than that of aides, as assistants deliver therapy services directly.
Demand for physical therapy services is expected to increase in response to the health needs of an aging population, particularly the large baby-boom generation. This group is staying more active later in life than previous generations.
However, baby boomers also are entering the prime age for heart attacks and strokes, increasing the demand for cardiac and physical rehabilitation. Older people are particularly vulnerable to chronic and debilitating conditions that require therapeutic services. These patients often need additional help in their treatment, making the roles of assistants and aides vital.
Medical and technological developments should permit an increased percentage of trauma victims and newborns with birth defects to survive, creating added demand for therapy and rehabilitative services.
5 4
14 15
13
2007 2008 2009 2010 2011
Physical Therapist Assistant Program Completers

132 | P a g e
Physical therapists are expected to increasingly use assistants and aides to reduce the cost of physical therapy services. Once the physical therapist has evaluated a patient and designed a treatment plan, the physical therapist assistant can provide many parts of the treatment, as directed by the therapist.
In addition, changes to restrictions on reimbursements for physical therapy services by third-party payers will increase patient access to services and increase demand.
Opportunities for physical therapist assistants are expected to be very good. With help from physical therapist assistants, physical therapists can manage more patients.
However, physical therapy aides may face keen competition from the large pool of qualified people.
Job opportunities should be particularly good in acute hospitals, skilled nursing, and orthopedic settings, where the elderly are most often treated. Job prospects should be especially favorable in rural areas, as many physical therapists cluster in highly populated urban and suburban areas.
In Maine, nine job opportunities are expected per year, half resulting from new growth and half from the need to replace those that may retire.
Employment of Physical Therapist Assistants in Maine 2010 and Projected 2020
Average Employment Change in Employment (2010 - 2020)
Projected Annual Openings
Resulting from New Growth 2010 2020 Net Percent
257 304 47 18.3% 5 Source: CWRI 2010-2020 Employment Projections
5 4
9
Growth Replacement Total
Projected Annual Job Openings, Physical Therapist Assistants

Healthcare Occupations Report | P a g e 133
29-1125 Recreation Therapists
Occupation description
Plan, direct, or coordinate medically-approved recreation programs for patients in hospitals, nursing homes, or other institutions. Activities include sports, trips, dramatics, social activities, and arts and crafts. May assess a patient condition and recommend appropriate recreational activity. Excludes “Recreation Workers” (39-9032).
Illustrative examples: Certified Recreational Therapist, Drama Therapist, Therapeutic Recreation Specialist
Education requirements
Recreational therapists typically need a bachelor’s degree. Though less common, associate’s, master’s, or doctoral degrees are also available. Most employers require therapists to be certified by the National Council for Therapeutic Recreation Certification (NCTRC).
Therapeutic recreation programs include courses in assessment, human anatomy, medical and psychiatric terminology, characteristics of illnesses and disabilities, and the use of assistive devices and technology. Bachelor’s degree programs usually include an internship.
Certification and Licenses
Most employers prefer to hire certified recreational therapists. Hospitals and other clinical settings often require certification by the NCTRC. The council offers the Certified Therapeutic Recreation Specialist (CTRS) credential to candidates who pass a written certification exam and complete a supervised internship of at least 480 hours.
NCTRC also offers specialty certification in five areas of practice: geriatrics, behavioral health, physical medicine/rehabilitation, developmental disabilities, or community inclusion services. Although therapists typically need at least a bachelor’s degree in recreational therapy, in some cases therapists may qualify for certification with an alternate combination of education, training, and experience.
Some states require recreational therapists to be licensed; requirements vary by state. Recreational therapists are not licensed in Maine. As of 2010, only Oklahoma, North Carolina, Utah, and New Hampshire required recreational therapists to hold a license. Most employers require therapists to be certified by the National Council for Therapeutic Recreation Certification (NCTRC).
Employment & Wages
2012 Employment & Wage Statistics
Average Employment
Median Annual Salary
Maine 80 $37,300 Industries with Highest Share of Employment (% total) Hospitals 38% $37,370 Nursing and Residential Care Facilities 38% $34,480 Source: 2012 Occupational Employment Statistics, CWRI

134 | P a g e
Schools offering training and number completing
In 2011, two schools had graduates, with the overwhelming majority coming from USM.
Education Programs & Annual Graduates
School CIP Code CIP Title
Completer Title 2007 2008 2009 2010 2011
Unity College 512309
Therapeutic Recreation/Recreational Therapy
Bachelor's Degree 5 1 5 2 1
University of Southern Maine
512309 Therapeutic Recreation/Recreational Therapy
Bachelor's Degree 9 8 14 12 12
University of Southern Maine
512309 Therapeutic Recreation/Recreational Therapy
Associate's Degree 2 1 1 1
Total 16 10 20 15 13 Source: IPEDS, CWRI
0.06 0.06
Maine U.S.
Recreational Therapists per 1,000 Population
16
10
20
15 13
2007 2008 2009 2010 2011
Recreational Therapist Program Completers

Healthcare Occupations Report | P a g e 135
Outlook
Nationally, employment of recreational therapists is expected to grow by 17 percent from 2010 to 2020, about as fast as the average for all occupations. In Maine, employment is expected to grow 12 percent, twice the average that is expected for all occupations.
As the large baby-boom generation ages, they will need recreational therapists to help treat age-related injuries and illnesses, such as strokes. As people age, their declines in general physical ability, and sometimes mental ability, may also be treated with recreational therapy.
Legislation requiring federally-funded services for disabled students will continue to shape the need for recreational therapists in education settings.
Additionally, third party payers will continue to use therapists’ services as a way to cut costs in patients’ recoveries from injuries or illnesses, moving treatment to outpatient settings rather than more costly hospital settings.
Job prospects will be best for recreational therapists with both a bachelor’s degree and certification. Therapists who specialize in working with the elderly or who earn certification in geriatric therapy may have the best job prospects. Nursing and residential care facilities employ more than a third of recreational therapists. As the percentage of older adults continues to grow, employment in nursing and residential care facilities industry will grow as a whole, increasing the need for these workers.
Since this is a small occupation in Maine, most of the job opportunities will arise from replacement needs as opposed to new growth.
Employment of Recreational Therapists in Maine, 2010 and Projected 2020
Average Employment Change in Employment (2010 - 2020)
Projected Annual Openings Resulting from New Growth 2010 2020 Net Percent
94 105 11 11.7% 1
Source: CWRI 2010-2020 Employment Projections
1
3
4
Growth Replacement Total
Projected Annual Job Openings, Recreational Therapists

136 | P a g e
29-1124 Radiation Therapists
Occupation description
Provide radiation therapy to patients as prescribed by a radiologist according to established practices and standards. Duties may include reviewing prescription and diagnosis; acting as liaison with physician and supportive care personnel; preparing equipment, such as immobilization, treatment, and protection devices; and maintaining records, reports, and files. May assist in dosimetry procedures and tumor localization.
Illustrative examples: Dosimetrist, Radiation Therapy Technologist
Education requirements
Radiation therapists need to complete formal education programs. Most programs lead to a bachelor’s degree or associate’s degree in radiation therapy. Radiation therapists must be licensed in most states; requirements vary by state. In Maine, the licensing of radiation therapists is governed by the Department of Professional and Financial Regulation Office of Licensing.
Although candidates may qualify by completing a 12-month certificate program, employers usually prefer to hire applicants who have an associate’s or bachelor's degree in radiation therapy.
Employment & Wages
This is a relatively small occupation, with 90 employed statewide. The median wage in 2012 was $73,000, six percent below the national median wage but well above the median wage for all jobs in Maine. Radiation therapists work for hospitals.
2012 Employment & Wage Statistics Average Employment Median Annual
Salary
Maine 90 $72,990 Industries with Highest Share of Employment (% total) Hospitals 100% $72,990 Source: 2012 Occupational Employment Statistics, CWRI
0.07 0.06
Maine U.S.
Radiation Therapists per 1,000 Population

Healthcare Occupations Report | P a g e 137
Schools offering training and number completing
Southern Maine Community College and St. Joseph’s College offer radiation therapy programs and there were no graduates in 2011. USM offered a bachelor of science in radiation therapy—which required students to transfer in with an associate’s degree, but no completers were reported to IPEDS and the program is no longer listed in their course catalog.
Education Programs & Annual Graduates
School CIP Code CIP Title
Completer Title 2007 2008 2009 2010 2011
Southern Maine Community College
510907
Medical Radiologic Technology/Science – Radiation Therapist
Associate's Degree
10
5
Saint Joseph's College of Maine
510907
Medical Radiologic Technology/Science – Radiation Therapist
Bachelor's Degree
10
3
Total 10 13 0 5 0 Source: IPEDS, CWRI
Outlook
Nationally, employment of radiation therapists is expected to grow by 20 percent between 2010 and 2020, faster than the average for all occupations. In Maine, employment of radiation therapists is expected to increase 27 percent, well above the six percent growth expected for all occupations. Although the growth rate is high, because this is a small occupation, the number of job opportunities will be limited. A total of 50 job opportunities—five per year—are expected.
The risk of cancer increases as people age, so an aging population will increase demand for radiation therapists. Early diagnosis and the development of more sophisticated treatment techniques will also increase employment.
10
13
0
5
0 2007 2008 2009 2010 2011
Radiation Therapy Program Completers

138 | P a g e
Employment of Radiation Therapists in Maine, 2010 and Projected 2020
Average Employment Change in Employment (2010-2020)
Projected Annual Openings Resulting from New Growth 2010 2020 Net Percent
96 122 26 27% 3 Source: CWRI 2010-2020 Employment Projections
3
2
5
Growth Replacement Total
Projected Annual Job Openings, Radiation Therapists

Healthcare Occupations Report | P a g e 139
29-1126 Respiratory Therapists
Occupation description
Assess, treat, and care for patients with breathing disorders. Assume primary responsibility for all respiratory care modalities, including the supervision of respiratory therapy technicians. Initiate and conduct therapeutic procedures; maintain patient records; and select, assemble, check, and operate equipment.
Illustrative examples: Inhalation Therapist, Oxygen Therapist, Registered Respiratory Therapist
Education requirements
Respiratory therapists need at least an associate’s degree, but employers look favorably on applicants who have more education. Many colleges and universities, vocational-technical institutes, and the Armed Forces offer training. Most programs award an associate’s or bachelor’s degree. The Board of Respiratory Care Practitioners governs the licensure of respiratory therapists in Maine.
Employment & Wages
2012 Employment & Wage Statistics
Average Employment Median Annual Salary
Maine 480 $53,860 Industries with Highest Share of Employment (% total) Hospitals 94% $53,690
Schools offering training and number completing
Two schools offer associate’s degree programs—SMCC and KVCC. In 2011 there were 25 graduates that were nearly evenly split among the programs.
0.36 0.37
Maine U.S.
Respiratory Therapists per 1,000 Population

140 | P a g e
Education Programs & Annual Graduates
School CIP Code CIP Title
Completer Title 2007 2008 2009 2010 2011
Southern Maine Community College
510908
Respiratory Care Therapy/Therapist
Associate's Degree
18
12
15
11
12
Kennebec Valley Community College
510908
Respiratory Care Therapy/Therapist
Associate's Degree
9
10
6
14
13
Total 27 22 21 25 25
Source: IPEDS, CWRI
Outlook
Nationally, employment of respiratory therapists is expected to grow by 28 percent from 2010 to 2020, faster than the average for all occupations. In Maine, this occupation is expected to increase 41 percent, significantly above the 6 percent increase expected for all occupations.
Growth in the middle-aged and elderly population will lead to an increased incidence of respiratory conditions such as emphysema, chronic bronchitis, and pneumonia, respiratory disorders that permanently damage the lungs or restrict lung function. These factors will lead to an increased demand for respiratory therapy services and treatments, mostly in hospitals and nursing homes. In addition, advances in preventing and detecting disease, improved medications, and more sophisticated treatments will increase the demand for respiratory therapists. Other conditions affecting the general population, such as smoking, air pollution, and respiratory emergencies, will continue to create demand for respiratory therapists.
Respiratory therapists with certification or a bachelor’s degree will have the best job prospects. Thirty-one job opportunities are expected each year; 21 from new growth and 10 from replacement needs.
27
22 21
25 25
2007 2008 2009 2010 2011
Respiratory Therapist Program Completers

Healthcare Occupations Report | P a g e 141
Employment of Respiratory Therapists in Maine 2010 and Projected 2020
Average Employment Change in Employment (2010 - 2020)
Projected Annual Openings Resulting from New Growth
2010 2020 Net Percent
504 711 207 41% 21 Source: CWRI 2010-2020 Employment Projections
21
10
31
Growth Replacement Total
Projected Annual Job Openings, Respiratory Therapists

142 | P a g e
29-2054 Respiratory Therapy Technicians
Occupation description
Provide respiratory care under the direction of respiratory therapists and physicians.
Education requirements
Associate’s degree. Respiratory care technicians are licensed in Maine by the Board of Respiratory Care Practitioners.
Employment & Wages
2012 Employment & Wage Statistics
Average Employment Median Annual Salary
Maine 30 $53,390 Industries with Highest Share of Employment (% total) Hospitals 100% $53,170 Source: 2012 Occupational Employment Statistics, CWRI
Schools offering training and number completing
Programs at KVCC and SMCC may provide instruction for technicians. SMCC notes that their program produces respiratory therapists.
Outlook
In Maine, employment of respiratory therapy technicians is expected to increase 18 percent from 2010 to 2020. The size of this occupation will limit the number of job opportunities. Two job openings are expected per year.
0.02
0.04
Maine U.S.
Respiratory Therapy Technicians per 1,000 Population

Healthcare Occupations Report | P a g e 143
Employment of Respiratory Therapy Technicians in Maine 2010 and Projected 2020
Average Employment Change in Employment (2010 - 2020)
Projected Annual Openings Resulting from New Growth
2010 2020 Net Percent
44 52 8 18% 1 Source: CWRI 2010-2020 Employment Projections
1 1
2
Growth Replacement Total
Projected Annual Job Openings, Respiratory Therapy Technicians

144 | P a g e
29-1127 Speech-Language Pathologists
Occupation description
Assess and treat persons with speech, language, voice, and fluency disorders. May select alternative communication systems and teach their use. May perform research related to speech and language problems.
Illustrative examples: Public School Speech Therapist, Speech Clinician, Speech Therapist
Education requirements
The standard level of education for speech-language pathologists is a master’s degree. Although master’s programs do not specify a particular undergraduate degree for admission, certain courses must be taken before entering the program. Required courses vary by institution. Graduate programs often include courses in age-specific speech disorders, alternative communication methods, and swallowing disorders. These programs also include supervised clinical practice in addition to coursework. The Board of Examiners in Speech, Pathology and Audiology govern the licensing of speech pathologists in Maine.
Employment & Wages
2012 Employment & Wage Statistics
Average
Employment Median Annual
Salary Maine 820 $57,590
Industries with Highest Share of Employment (% total) Educational Services 45% $53,060 Ambulatory Health Care Services 27% $56,530 Hospitals 15% $73,600 Nursing and Residential Care Facilities 4% $77,350 Source: 2012 Occupational Employment Statistics, CWRI
0.62
0.39
Maine U.S.
Speech Pathologists per 1,000 Population
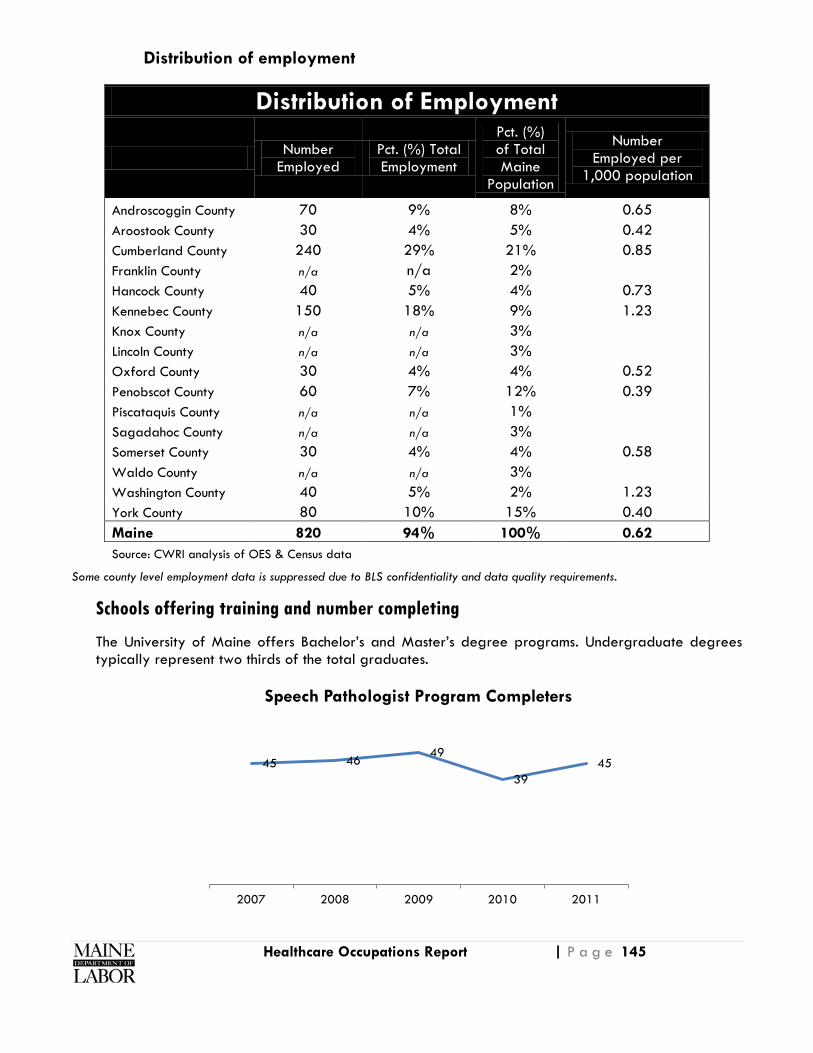
Healthcare Occupations Report | P a g e 145
Distribution of employment
Distribution of Employment
Number Employed
Pct. (%) Total Employment
Pct. (%) of Total Maine
Population
Number Employed per
1,000 population
Androscoggin County 70 9% 8% 0.65 Aroostook County 30 4% 5% 0.42 Cumberland County 240 29% 21% 0.85 Franklin County n/a n/a 2% Hancock County 40 5% 4% 0.73 Kennebec County 150 18% 9% 1.23 Knox County n/a n/a 3% Lincoln County n/a n/a 3% Oxford County 30 4% 4% 0.52 Penobscot County 60 7% 12% 0.39 Piscataquis County n/a n/a 1% Sagadahoc County n/a n/a 3% Somerset County 30 4% 4% 0.58 Waldo County n/a n/a 3% Washington County 40 5% 2% 1.23 York County 80 10% 15% 0.40 Maine 820 94% 100% 0.62 Source: CWRI analysis of OES & Census data
Some county level employment data is suppressed due to BLS confidentiality and data quality requirements.
Schools offering training and number completing
The University of Maine offers Bachelor’s and Master’s degree programs. Undergraduate degrees typically represent two thirds of the total graduates.
45 46 49
39 45
2007 2008 2009 2010 2011
Speech Pathologist Program Completers

146 | P a g e
Education Programs & Annual Graduates
School CIP Code CIP Title
Completer Title 2007 2008 2009 2010 2011
University of Maine
510201
Communication Sciences and Disorders, General
Bachelor's Degree
26
36
35
25
30
University of Maine
510201
Communication Sciences and Disorders, General
Master's Degree
19
10
14
14
15
Total 45 46 49 39 45 Source: IPEDS, CWRI
Outlook
Nationally, employment of speech-language pathologists is expected to grow by 23 percent from 2010 to 2020, faster than the average for all occupations. In Maine, employment is expected to grow 10 percent.
As the large baby-boom population grows older, there will be more instances of health conditions that cause speech or language impairments, such as strokes and hearing loss. These increases are expected to add to the number of speech and language disorders in the population and require more speech-language pathologists to treat these patients.
Increased awareness of speech and language disorders, such as stuttering in younger children should also lead to a need for more speech-language pathologists who specialize in treating that age group. In addition, medical advances are improving the survival rate of premature infants and victims of trauma and strokes, many of whom need help from speech-language pathologists.
A number of job opportunities for speech pathologists will arise as those currently practicing exit the workforce. A total of 22 job opportunities per year are expected, 8 from new growth and 14 from replacement needs.
Employment of Speech Pathologists in Maine 2010 and Projected 2020
Average Employment Change in Employment (2010 - 2020)
Projected Annual Openings
Resulting from New Growth 2010 2020 Net Percent
759 838 79 10% 8 Source: CWRI 2010-2020 Employment Projections

Healthcare Occupations Report | P a g e 147
8
14
22
Growth Replacement Total
Projected Annual Job Openings, Speech Pathologists

148 | P a g e
Technologists & Technicians
Summary Statistics
Workforce Characteristics
Medical Clinical Lab
Technologists
Medical Clinical Lab Technicians
Cardiovascular Technologists & Technicians
Diagnostic Medical
Sonographers
Nuclear Medicine
Technologists
Radiologic Technologists
Psychiatric Technicians
EMTs & Paramedics
Surgical Technologists
Employment (2012) 570 730 240 240 120 940 430 1870 590
Employment per 1,000 population 0.43 0.55 0.18 0.18 0.09 0.71 0.32 1.41 0.44
versus U.S. Below avg. Above avg. Above avg. Average Above avg. Above avg. Above avg. Above avg. Above avg.
Average annual starting wage (ME) $44,040 $28,100 $34,800 $56,870 $58,420 $42,780 $19,020 $22,090 $33,770
Median annual wage (ME) $54,540 $42,320 $56,370 $69,680 $71,110 $54,590 $25,330 $30,580 $39,950
U.S. median annual wage $57,580 $37,240 $52,070 $65,860 $70,180 $54,620 $30,050 $31,020 $41,790
Median wage for all occupations in ME $32,590 $32,590 $32,590 $32,590 $32,590 $32,590 $32,590 $32,590 $32,590
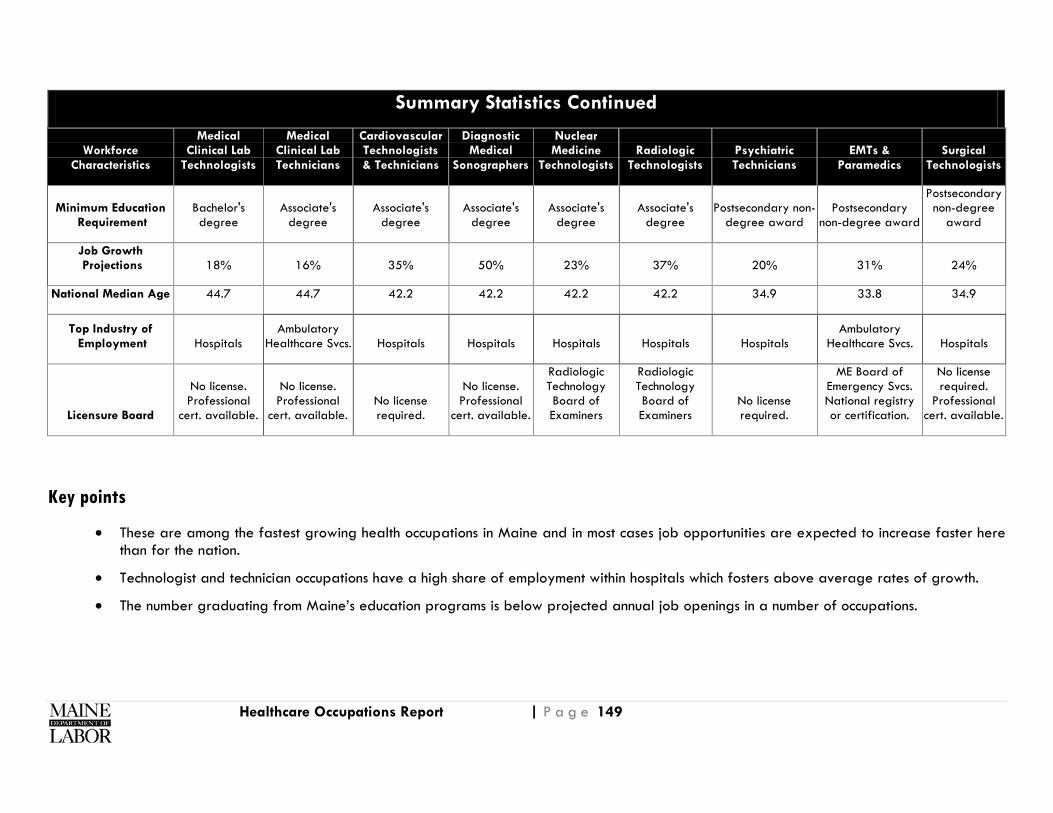
Healthcare Occupations Report | P a g e 149
Workforce Characteristics
Medical Clinical Lab
Technologists
Medical Clinical Lab Technicians
Cardiovascular Technologists & Technicians
Diagnostic Medical
Sonographers
Nuclear Medicine
Technologists Radiologic
Technologists Psychiatric Technicians
EMTs & Paramedics
Surgical Technologists
Minimum Education Requirement
Bachelor's degree
Associate's degree
Associate's degree
Associate's degree
Associate's degree
Associate's degree
Postsecondary non-degree award
Postsecondary non-degree award
Postsecondary non-degree
award
Job Growth Projections 18% 16% 35% 50% 23% 37% 20% 31% 24%
National Median Age 44.7 44.7 42.2 42.2 42.2 42.2 34.9 33.8 34.9
Top Industry of Employment Hospitals
Ambulatory Healthcare Svcs. Hospitals Hospitals Hospitals Hospitals Hospitals
Ambulatory Healthcare Svcs. Hospitals
Licensure Board
No license. Professional
cert. available.
No license. Professional
cert. available. No license required.
No license. Professional
cert. available.
Radiologic Technology Board of Examiners
Radiologic Technology Board of Examiners
No license required.
ME Board of Emergency Svcs. National registry or certification.
No license required.
Professional cert. available.
Key points
• These are among the fastest growing health occupations in Maine and in most cases job opportunities are expected to increase faster here than for the nation.
• Technologist and technician occupations have a high share of employment within hospitals which fosters above average rates of growth.
• The number graduating from Maine’s education programs is below projected annual job openings in a number of occupations.
Summary Statistics Continued

150 | P a g e
29-2011 Medical and Clinical Laboratory Technologists
Occupation description
Perform complex medical laboratory tests for diagnosis, treatment, and prevention of disease. May train or supervise staff.
Illustrative examples: Blood Bank Laboratory Technologist, Cytogenetic Technologist, Immunohematologist
Education requirements
Medical laboratory technologists (also known as medical lab scientists) typically need a bachelor’s degree. Some states require technologists to be licensed. Currently, Maine does not require licensure to work as a Medical laboratory Scientist/Medical Technologist; the national standard is to be certified by the American Society for Clinical Pathology Board of Certification (ASCP BOC).
Universities and hospitals offer medical technology programs. An entry-level job for technologists usually requires a bachelor's degree in medical technology or life sciences.
A bachelor’s degree in medical laboratory technology includes courses in chemistry, biology, microbiology, mathematics, and statistics, as well as courses on clinical laboratory skills, management, and education. This degree is sometimes known as a medical laboratory scientist program.
The courses may be offered through a hospital-based program that students attend during their senior year of college. College graduates who major in other sciences and meet a program’s prerequisites, such as having completed required courses in biology and chemistry, may also apply to a medical laboratory science program.
Although certification is not required to enter the occupation in all cases, employers typically prefer to hire certified technologists. Medical laboratory technologists can obtain a generalist certification as medical laboratory scientist or a technologist certification in a category such as, molecular biology, blood bank, microbiology, hematology and chemistry. Most credentials require that scientists/technologists complete an accredited program to qualify to sit for a nationally recognized ASCP BOC examination. Since 2004 continuing education is required to maintain certification.
Employment & Wages
In 2012 there were an estimated 570 medical lab scientists employed in Maine earning a median annual wage of $54,000. This wage was slightly below the national median but well above the average wage for all jobs in Maine. Clinical lab technologists are predominantly employed within hospital settings.
2012 Employment & Wage Statistics
Average Employment
Median Annual Salary
Maine 570 $54,540 Industries with Highest Share of Employment (% total) Hospitals 82% $54,310 Ambulatory Health Care Services 12% $54,600 Source: 2012 Occupational Employment Statistics, CWRI

Healthcare Occupations Report | P a g e 151
In 2012 there were 16 percent fewer medical/clinical lab technologists in Maine per 1,000 residents than the nation.
Distribution of employment
Distribution of Employment
Number Employed
Pct. (%) Total Employment
Pct. (%) of Total Maine Population
Number Employed per 1,000 population
Androscoggin County n/a n/a 8% Aroostook County n/a n/a 5% Cumberland County 150 26% 21% 0.53 Franklin County n/a n/a 2% Hancock County n/a n/a 4% Kennebec County n/a n/a 9% Knox County n/a n/a 3% Lincoln County n/a n/a 3% Oxford County n/a n/a 4% Penobscot County 80 14% 12% 0.52 Piscataquis County n/a n/a 1% Sagadahoc County n/a n/a 3% Somerset County n/a n/a 4% Waldo County n/a n/a 3% Washington County n/a n/a 2% York County n/a n/a 15% Maine 570 40% 100% 0.43 Source: CWRI analysis of OES & Census data
Some data is suppressed according to BLS confidentiality and data quality requirements. Suppressed data is shown as “n/a” for not available.
0.43
0.51
Maine U.S.
Medical Clinical LabTechnologists per 1,000 Population, 2012

152 | P a g e
Schools offering training and number completing
The University of Maine is the only institution in Maine granting a bachelor’s degree in clinical lab sciences. Students in the program spend their senior year at Eastern Maine Medical Center (EMMC) in Bangor or can apply to the Scott and White Healthcare facility in Temple, Texas, where University of Maine also has an affiliation. The senior year combines lecture and laboratory experience. After completing the program, students are eligible to take the certifying examination administered by the ASCP.
Completer data for the University of Maine program is displayed below. Readers should note that students graduate from EMMC or the Scott and White Healthcare program in June but degrees are not conferred from University of Maine until August. Since the academic year is defined as July 1 to June 30, those graduating in June are counted as program completers in the following academic year, when the data is reported by the university.
The following table displays program completer data available from IPEDS as reported by the Universi-ty of Maine. For comparison purposes, graduate data from EMMC is also provided. Note that the number of completers reported by the university are pushed ahead one year due to the timing of when degrees are conferred (August).
6 6 6
6
9
1
2007 2008 2009 2010 2011 2012
Medical Clinical Lab Technologist Program Completers

Healthcare Occupations Report | P a g e 153
Education Programs & Annual Graduates
School CIP Code
CIP Title
Completer Title 2007 2008 2009 2010 2011 2012
University of Maine 511005
Clinical Laboratory Science/Medical Technology/ Technologist
Bachelor's Degree 6 6 6 6 9 1
Total (IPEDS)
6 6 6 6 9 1
Scott and White Healthcare facility June graduates, Temple, TX
1
EMMC June graduates
6 6 6 8 1 7
Source: IPEDS, EMMC, CWRI University of Maine confers the degrees. Students spend their senior year at EMMC or Scott and White.
Outlook
Nationally, employment of medical laboratory technologists is expected to grow by 11 percent between 2010 and 2020. In Maine, employment is expected to grow 18 percent.
An increase in the aging population will lead to a greater need to diagnose medical conditions, such as cancer or type 2 diabetes, through laboratory procedures. Medical laboratory technologists will be needed to use and maintain the equipment needed for diagnosis and treatment.
230 job opportunities are expected in Maine from 2010 to 2020, or 23 per year. Approximately half of these job openings are expected to result from new growth and half from replacement needs.
Average annual program completers from the University of Maine program are below projected demand. While new graduates should find these conditions favorable for finding employment, employers may experience difficulties filling positions, creating upward pressure on wage rates. Barring an economic downturn and an associated decline in job opportunities, closing the gap in these areas will require strategies for increasing program capacity, retaining existing workers for longer, increasing in-migration, or other means for enhancing supply.

154 | P a g e
Employment of Medical and Clinical Lab Technologists in Maine 2010 and Projected 2020
Average Employment Change in Employment (2010-2020) Projected Annual
Openings Resulting from New Growth
2010 2020 Net Percent 641 754 113 18% 11
Source: CWRI 2010-2020 Employment Projections
11 12
23
Growth Replacement Total
Projected Annual Job Openings, Medical and Clinical Lab Technologists

Healthcare Occupations Report | P a g e 155
29-2012 Medical and Clinical Laboratory Technicians
Occupation description
Perform routine medical laboratory tests for the diagnosis, treatment, and prevention of disease. May work under the supervision of a medical technologist.
Illustrative examples: Histology Technician, Pathology Technician, Serology Technician
Education requirements
Prospective medical laboratory technicians must complete an associate’s degree program that includes science and clinical laboratory science courses. The Armed Forces and vocational or technical schools may also offer certificate programs for medical laboratory technicians. The technician coursework addresses the theoretical and practical aspects of each of the major laboratory disciplines, but the courses are not as in-depth as those that technologists take.
Employment & Wages
2012 Employment & Wage Statistics
Average Employment Median Annual Salary
Maine 730 $42,320 Industries with Highest Share of Employment (% total) Ambulatory Health Care Services 48% $45,170 Hospitals 48% $41,110 Source: 2012 Occupational Employment Statistics, CWRI
0.55 0.50
Maine U.S.
Medical Clinical Lab Technicians per 1,000 Population

156 | P a g e
Schools offering training and number completing
The University of Maine at Augusta (UMA) and Presque Isle (UMPI) offer an Associate’s Degree program in Medical Lab Technology. The program offering is a collaborative effort between the schools and hospitals that serve as clinical affiliates. Graduates are qualified to sit for the following national exams: American Society for Clinical Pathology Board of Certification and the American Medical Technologist Exam (AMT).
Following two years of fulltime work in all areas of a clinical laboratory, one can apply to a B.S. program so that they may upgrade their certification to Medical Laboratory Scientist (MLS).
The Central Maine Community College (CMCC) program was terminated.
Although this is a joint program, each campus reports completer data to IPEDS under a different Classification of Instruction (CIP). UMA reports the program as “Clinical/Medical Lab Assistant” while UMPI reports it as “Clinical/Medical Lab Technicians.”
Education Programs & Annual Graduates
School CIP Code CIP Title
Completer Title 2007 2008 2009 2010 2011
University of Maine at Augusta
510802
Clinical/Medical Laboratory Assistant
Associate's Degree
7
7
16
11
13 University of Maine at Presque Isle
511004
Clinical/Medical Laboratory Technician
Associate's Degree
3
1
7
6
Central Maine Community College
511004
Clinical/Medical Laboratory Technician
Associate's Degree
5
10
1
Total 15 17 18 18 19 Source: IPEDS, CWRI
15 17 18 18
19
2007 2008 2009 2010 2011
Medical Clinical Lab Technician Program Completers

Healthcare Occupations Report | P a g e 157
Outlook
Nationally, employment of medical laboratory technicians is expected to grow by 15 percent between 2010 and 2020. In Maine, this occupation is expected to grow 16 percent.
An increase in the aging population will lead to a greater need to diagnose medical conditions, such as cancer or type 2 diabetes, through laboratory procedures. Medical laboratory technicians will be needed to use and maintain the equipment needed for diagnosis and treatment.
260 job opportunities are expected in Maine from 2010 to 2020, or 26 per year. Slightly more than half of these job openings are expected to result from currently practicing workers that are expected to retire and the remainder from new growth.
Employment of Medical and Clinical Lab Technicians in Maine 2010 and Projected 2020
Average Employment Change in Employment (2010-2020)
Projected Annual Openings Resulting from New Growth
2010 2020 Net Percent
717 834 117 16% 12 Source: CWRI 2010-2020 Employment Projections
12 14
26
Growth Replacement Total
Projected Annual Job Openings, Medical and Clinical Lab Technicians

158 | P a g e
29-2031 Cardiovascular Technologists & Technicians
Occupation description
Conduct tests on pulmonary or cardiovascular systems of patients for diagnostic purposes. May conduct or assist in electrocardiograms, cardiac catheterizations, pulmonary functions, lung capacity, and similar tests. Includes vascular technologists.
Illustrative examples: Cardiac Catheterization Technologist, Echo cardiographer, EKG Technician
Education requirements
There are several ways to become a cardiovascular technologist or technician or vascular technologist. Although some technologists and technicians are trained on the job, the most common path is formal education that leads to an associate’s degree. Many employers also require professional certification. Cardiovascular technologists & technicians are not licensed in Maine.
Employment & Wages
2012 Employment & Wage Statistics Average Employment Median Annual Salary Maine 240 $56,370 Industries with Highest Share of Employment (% total) Hospitals 88% $55,260 Source: 2012 Occupational Employment Statistics, CWRI
Schools offering training and number completing
SMCC offers an associate’s degree program.
0.18 0.16
Maine U.S.
Cardiovascular Technologists & Technicians per 1,000 Population, 2012

Healthcare Occupations Report | P a g e 159
Education Programs & Annual Graduates
School CIP Code CIP Title
Completer Title 2007 2008 2009 2010 2011
Southern Maine Community College
510901
Cardiovascular Technology/Technologist
Associate's Degree
9
7
10
7
7
Source: IPEDS, CWRI
Outlook
Nationally, employment of cardiovascular technologists and technicians and vascular technologists is expected to grow by 29 percent from 2010 to 2020, much faster than the average for all occupations. In Maine, employment growth of cardiovascular technologists and technicians is expected to increase 35 percent, well above the 6 percent growth expected for all occupations.
As imaging technology evolves, medical facilities will use it to replace more invasive, costly procedures. Technological advances and less expensive equipment now allow more procedures to be done outside of hospitals. Third-party payers encourage the use of these noninvasive measures over invasive ones.
Although hospitals remain the primary employer of cardiovascular technologists and technicians and vascular technologists, employment is expected to grow more rapidly in physicians' offices and in medical and diagnostic laboratories. Employment in these healthcare settings is expected to increase because of a shift toward outpatient care whenever possible.
As the large baby-boom population ages and people remain active later in life, the need to diagnose medical conditions—such as blood clots and tumors—with imaging technology will likely increase. Cardiovascular technologists and technicians and vascular technologists will continue to be needed to use and maintain the equipment needed for diagnosis and treatment.
9
7
10
7 7
2007 2008 2009 2010 2011
Cardiovascular Technologists and Technicians Program Completers

160 | P a g e
Job prospects should be best for those who have multiple professional credentials and are trained to do a wide range of procedures. Technologists or technicians who are willing to move or to work irregular hours also should have better opportunities.
Employment of Cardiovascular Technologists & Technicians in Maine 2010 and Projected 2020
Average Employment Change in Employment (2010 - 2020)
Projected Annual Openings Resulting from New Growth
2010 2020 Net Percent
255 343 88 35% 9 Source: CWRI 2010-2020 Employment Projections
9
4
13
Growth Replacement Total
Projected Annual Job Openings, Cardiovascular Technologists & Technicians

Healthcare Occupations Report | P a g e 161
29-2032 Diagnostic Medical Sonographers
Occupation description
Produce ultrasonic recordings of internal organs for use by physicians.
Illustrative examples: Registered Diagnostic Medical Sonographer, Ultrasound Technologist
Education requirements
Diagnostic medical sonographers need formal education, such as an associate’s degree or a postsecondary certificate. Many employers also require professional certification.
Colleges and universities offer both Associate’s and Bachelor’s degree programs in sonography. One-year certificate programs also are available, although these are usually useful only to those who are already employed in related healthcare jobs, such as nursing. Employers prefer a degree or certificate from an accredited institute or hospital program. The accredited programs usually follow a specific course of study and include clinical training. These programs also include courses in medical terminology and interpreting sonographic images. Most programs are divided into the specialized fields that correspond to the relevant certification exams, such as abdominal sonography or breast sonography.
Some sonographers graduate with a degree in radiologic technology or nursing and then receive on-the-job training by their employer. High school students who are interested in diagnostic medical sonography should take courses in anatomy, physiology, and mathematics.
Most employers prefer to hire sonographers who have professional certification. A sonographer can get certification by graduating from an accredited program and passing an exam. Most exams relate to the specialty that the sonographer is most interested in—for example, an exam to become certified in abdominal sonography. A few states require diagnostic medical sonographers to be licensed. Typically, professional certification is required for licensure; other requirements vary by state. Sonographers must take continuing education to keep their certification current. No license is required in Maine.
Employment & Wages
2012 Employment & Wage Statistics
Average Employment Median Annual Salary
Maine 240 $69,680 Industries with Highest Share of Employment (% total) Hospitals 88% $68,870 Source: 2012 Occupational Employment Statistics, CWRI

162 | P a g e
Schools offering training and number completing
Kennebec Valley Community College (KVCC) has an advanced certificate program in sonography. This is a 16 month program with a majority of the student experience centered on clinical training.
Education Programs & Annual Graduates
School CIP Code CIP Title Completer Title 2007 2008 2009 2010 2011
Kennebec Valley Community College
510910
Diagnostic Medical Sonography/ Sonographer and Ultrasound Technician
Post-Sec. Awards/Cert./ Diplomas; 1-2 yrs.
9
6
8
Source: IPEDS, CWRI
Outlook
Nationally, employment of diagnostic medical sonographers is expected to grow by 44 percent from 2010 to 2020, much faster than the average for all occupations. In Maine, diagnostic medical sonography has the fastest projected growth rate among Maine’s health occupations. Employment is expected to increase 50 percent.
0.18 0.18
Maine U.S.
Diagnostic Medical Sonographers per 1,000 Population, 2012
9
6
8
2009 2010 2011
Diagnostic Medical Sonography Program Completers

Healthcare Occupations Report | P a g e 163
As ultrasound imaging technology evolves, it will be used by medical facilities as a substitute for procedures that are costly, invasive, or expose patients to radiation. The use of sonography will continue to increase as patients, when given the option, choose to avoid exposure to radiation or undergo invasive procedures. Although hospitals remain the main employer of diagnostic medical sonographers, employment is expected to grow more rapidly in physicians' offices and in medical and diagnostic laboratories. Employment in these healthcare settings is expected to increase because of the shift toward outpatient care whenever possible. Outpatient care is encouraged by third-party payers as a cost-saving measure and is made possible by technological advances, such as less expensive ultrasound equipment, which allow for more procedures to be done outside of hospitals.
As the large baby-boom population ages and remains active later in life, the need to diagnose medical conditions, such as blood clots and tumors, with imaging technology should increase. Diagnostic medical sonographers will be needed to use and maintain the imaging equipment.
Sonographers who are certified in more than one specialty are expected to have better job opportunities.
Seventeen job opportunities are expected each year; 13 resulting from new growth and four from replacement needs.
Employment of Diagnostic Medical Sonographers in Maine, 2010 and Projected 2020
Average Employment Change in Employment (2010-2020)
Projected Annual Openings Resulting from New Growth
2010 2020 Net Percent
262 392 130 50% 13
Source: CWRI 2010-2020 Employment Projections
13
4
17
Growth Replacement Total
Projected Annual Job Openings, Diagnostic Medical Sonographers

164 | P a g e
29-2033 Nuclear Medicine Technologists
Occupation description
Prepare, administer, and measure radioactive isotopes in therapeutic, diagnostic, and tracer studies using a variety of radioisotope equipment. Prepare stock solutions of radioactive materials and calculate doses to be administered by radiologists. Subject patients to radiation. Execute blood volume, red cell survival, and fat absorption studies following standard laboratory techniques.
Illustrative examples: Certified Nuclear Medicine Technologist, Nuclear Cardiology Technologist, Radioisotope Technologist
Education requirements
Nuclear medicine technologists typically need an associate’s degree in nuclear medicine technology. Formal education programs in nuclear medicine technology or a related healthcare field lead to a certificate, an associate’s degree, or a bachelor’s degree. Technologists must be licensed in some states; requirements vary by state. In Maine, the Radiologic Technology Board of Examiners governs the licensure of Nuclear Medicine Technologists. Applicants for licensure must have high school education or its equivalent and must successfully complete a nuclear medicine technology program accredited by the Joint Review Committee in Nuclear Medicine Technology (JRCNMT) or a program approved by the Nuclear Medicine Technology Certification Board (NMTCB) or the American Registry of Radiologic Technologists (ARRT) and achieved a passing score of 75 percent on the NMTCB exam or the ARRT exam in nuclear medicine. Applicants must also be certified by NMTCB and by ARRT in nuclear medicine.
In Maine, the Radiologic Technology Board of Examiners may also issue a special permit to practice as a nuclear medicine technologist to a Maine-licensed radiographer whose license is current and in good standing. Such a license may be granted if the availability of a licensed nuclear medicine technologist is limited in the locality and people are being denied adequate medical care as a result.
Employment & Wages
2012 Employment & Wage Statistics
Average Employment Median Annual Salary
Maine 120 $71,110 Industries with Highest Share of Employment (% total) Hospitals 83% $69,830 Source: 2012 Occupational Employment Statistics, CWRI

Healthcare Occupations Report | P a g e 165
Schools offering training and number completing
Central Maine Medical Center (CMMC) offers an 18 month program in Nuclear Medicine Technology including Computed Tomography (CT).
Education Programs & Annual Graduates
School CIP Code CIP Title Completer Title 2007 2008 2009 2010 2011
Central Maine Medical Center College of Nursing and Health Professions
510905 Nuclear Medical Technology/ Technologist
Post-Sec. Awards/Cert./ Diplomas; 1-2 yrs.
2
Source: IPEDS, CWRI
Outlook
Nationally, employment of nuclear medicine technologists is expected to grow by 19 percent from 2010 to 2020, about as fast as the average for all occupations. In Maine, employment is expected to increase 23 percent. Because this is a small occupation, the number of job opportunities will be limited, however. Approximately 50 job opportunities are expected from 2010 to 2020, or five per year.
Nuclear medicine technologists work mostly with adult patients, although procedures may be performed on children. A larger aging population should lead to the need to diagnose and treat medical conditions that require imaging, such as heart disease. Nuclear medicine technologists will be needed to administer radioactive drugs and maintain the imaging equipment required for diagnosis.
Overall employment growth is expected to be driven by rapidly growing industries, including physicians' offices and diagnostic laboratories, which employed about 31 percent of nuclear medicine technologists in 2010.
Nuclear medicine technologists can improve their job prospects by getting a specialty certification. A technologist can earn a certification in positron emission tomography (PET), nuclear cardiology (NCT), magnetic resonance imaging (MRI), or computed tomography (CT). The Nuclear Medicine Technology
0.09
0.07
Maine U.S.
Nuclear Medicine Technologists per 1,000 Population

166 | P a g e
Certification Board (NMTCB) offers NCT and PET certification exams. The American Registry of Radiologic Technologists (ARRT) offers the CT and MRI certification exams.
Employment of Nuclear Medicine Technologists in Maine 2010 and Projected 2020
Average Employment Change in Employment (2010-2020)
Projected Annual Openings Resulting from New Growth
2010 2020 Net Percent 124 153 29 23% 3
Source: CWRI 2010-2020 Employment Projections
3 2
5
Growth Replacement Total
Projected Annual Job Openings, Nuclear Medicine Technologists

Healthcare Occupations Report | P a g e 167
29-2034 Radiologic Technologists
Occupation description
Take x rays and CAT scans or administer nonradioactive materials into patient's blood stream for diagnostic purposes. Includes technologists who specialize in other scanning modalities. Excludes “Diagnostic Medical Sonographers”(29-2032) and “Magnetic Resonance Imaging Technologists” (29-2035).
Illustrative examples: Computed Tomography (CT) Scanner Operator, X-Ray Technician
Education requirements
An associate’s degree is the most common educational path for radiologic technologists. Technologists must be licensed or certified in most states; requirements vary by state. The Radiologic Technology Board of Examiners governs licensing in Maine.
Employment & Wages
2012 Employment & Wage Statistics
Average Employment Median Annual Salary
Maine 940 $54,590 Industries with Highest Share of Employment (% total) Hospitals 83% $54,940 Ambulatory Health Care Services 15% $53,390 Source: 2012 Occupational Employment Statistics, CWRI
Schools offering training and number completing
According to the Joint Review Committee on Education in Radiologic Technology (JCERT) there are four associate’s degree granting programs in Maine with accreditation in radiography: Central Maine
0.71 0.62
Maine U.S.
Radiologic Technologists & Technicians per 1,000 Population

168 | P a g e
Medical Center College of Nursing and Radiography, SMCC, KVCC and EMCC. Although EMCC reported their program with the CIP code 510907, which is more representative of radiation therapy, the college website describes this as a medical radiography program. As noted earlier in this report, the way programs of instruction are reported to IPEDS sometimes results in the misclassification of data.
72 70 72 75
96
2007 2008 2009 2010 2011
Radiologic Technologists & Technicians Program Completers

Healthcare Occupations Report | P a g e 169
Education Programs & Annual Graduates
School CIP Code
CIP Title
Completer Title 2007 2008 2009 2010 2011
Central Maine Medical Center College of Nursing and Health Professions
510911
Radiologic Technology/ Science –Radiographer
Associate's Degree 21
Kennebec Valley Community College 510911
Radiologic Technology/ Science –Radiographer
Associate's Degree 21 20 18 19 19
Southern Maine Community College 510911
Radiologic Technolo-gy/Science – Radiographer
Associate's Degree 19 16 17 11 35
Eastern Maine Community College 510907
Medical Radiologic Technology/ Science – Radiation Therapist
Associate's Degree 12 16 18 11 19
Saint Joseph's College of Maine 510911
Radiologic Technology/ Science – Radiographer
Bachelor's Degree
2
Kennebec Valley Community College 510911
Radiologic Technology/ Science –Radiographer
Post-Sec. Awards/Cert./ Diplomas; < 1 yr. 10
Kennebec Valle Community College 510911
Radiologic Technology/ Science –Radiographer
Post-Sec. Awards/Cert./ Diplomas; 1-2 yrs. 11
Central Maine Medical Center School of Radiologic Technology
510911
Radiologic Technology/ Science –Radiographer
Post-Sec. Awards/Cert./ Diplomas; 2-4yrs.
11 11 13 13
Mercy Hospital School of Radiologic Technology
510911
Radiologic Technology/ Science –Radiographer
Post-Sec. Awards/Cert./ Diplomas; 2-4yrs.
9 7 6
Total 72 70 72 75 96 Source: IPEDS, CWRI
Outlook
Nationally, employment of radiologic technologists is expected to grow by 28 percent between 2010 and 2020, faster than the average for all occupations. In Maine, employment is expected to increase 37 percent.
An aging population will have more medical conditions, such as breaks and fractures caused by osteoporosis, which require imaging to diagnose and treat. Radiologic technologists will be needed to maintain and use the diagnostic equipment.
Although hospitals will remain the main employer of radiologic technologists, a number of new jobs will be in physicians' offices and in imaging centers. Employment in these healthcare settings is expected to increase because of the shift toward outpatient care whenever possible. Outpatient care is encouraged by third-party payers as a cost-saving measure and is made possible by technological

170 | P a g e
advances, such as less expensive equipment, which allow for more procedures to be done outside of hospitals.
Radiologic technologists with multiple certifications will have the best job prospects. Nearly 60 job opportunities are expected annually. Most of the job openings will be from new growth in demand.
Employment of Radiologic Technologists & Technicians in Maine 2010 and Projected 2020
Average Employment Change in Employment (2010 - 2020)
Projected Annual Openings Resulting from
New Growth 2010 2020 Net Percent
1,072 1,467 395 37% 40 Source: CWRI 2010-2020 Employment Projections
40
17
57
Growth Replacement Total
Projected Annual Job Openings, Radiologic Technologists & Technicians

Healthcare Occupations Report | P a g e 171
29-2041 Emergency Medical Technicians and Paramedics
Occupation description
Assess injuries, administer emergency medical care, and extricate trapped individuals. Transport injured or sick persons to medical facilities.
Illustrative examples: EMT, Flight Paramedic
Education requirements
All emergency medical technicians (EMTs) and paramedics must complete a formal training program. All states require EMTs and paramedics to be licensed; requirements vary by state. Licensing in Maine is governed by the Maine Board of Emergency Medical Services.
Employment & Wages
In 2012 there were 1,870 EMTs employed in ambulance services, public administration and hospitals. There is, however, some variability involved in the reporting of EMTs which could result in the under reporting of employment in this occupation. Some respondents in public administration break out firefighters and EMT separately and others do not. The uncertainty lies in the Standard Occupation Classification (SOC) definition of firefighter, which in part states “Duties may include fire prevention, emergency medical service, hazardous material response, search and rescue, and disaster assistance.” Also, many communities rely heavily upon volunteers to staff their emergency medical services. Volunteers are actually paid by their respective cities/towns, sometimes hourly and sometimes by call. If an EMT worked during the survey reference week and is covered under Maine unemployment insurance tax law, MDOL asks that they be reported in responses to surveys.
2012 Employment & Wage Statistics
Average Employment
Median Annual Salary
Maine 1,870 $30,580 Industries with Highest Share of Employment (% total) Ambulatory Health Svcs. 42% $30,520 Public Administration 34% $33,140 Hospitals 23% $27,830 Source: 2012 Occupational Employment Statistics, CWRI

172 | P a g e
Distribution of employment
Distribution of Employment
Number Employed
Pct. (%) Total Employment
Pct. (%) of Total Maine Population
Number Employed per 1,000 Population
Androscoggin County 220 12% 8% 2.04 Aroostook County 100 5% 5% 1.41 Cumberland County 300 16% 21% 1.06 Franklin County n/a n/a 2% Hancock County 160 9% 4% 2.60 Kennebec County 140 7% 9% 1.15 Knox County n/a n/a 3% Lincoln County n/a n/a 3% Oxford County 130 7% 4% 2.26 Penobscot County 170 9% 12% 1.10 Piscataquis County n/a n/a 1% Sagadahoc County n/a n/a 3% Somerset County 130 7% 4% 2.50 Waldo County n/a n/a 3% Washington County n/a n/a 2% York County 140 7% 15% 0.70 Maine 1,870 80% 100% 1.41 Source: CWRI analysis of OES & Census data
Some data is suppressed according to BLS confidentiality and data quality requirements. Suppressed data is shown as “n/a” for not available.
1.41
0.74
Maine U.S.
EMTs & Paramedics per 1,000 Population, 2012

Healthcare Occupations Report | P a g e 173
Schools offering training and number completing
A variety of credentials are available from different schools, from one year certificate to associate degree programs. Some courses are less than a year long.
44 39
56
75 72
2007 2008 2009 2010 2011
Emergency Medical Technology/Paramedic Program Completers

174 | P a g e
Education Programs & Annual Graduates
School CIP Code CIP Title Completer Title
2007
2008
2009
2010
2011
Kennebec Valley Community College
510904
Emergency Medical Technolo-gy/Technician (EMT Paramedic)
Post-Sec. Awards/Cert./ Diplomas; < 1 yr.
26
32
30
Eastern Maine Community College
510904
Emergency Medical Technolo-gy/Technician (EMT Paramedic)
Post-Sec. Awards/Cert./ Diplomas; 1-2 yrs.
1
1
Kennebec Valley Community College
510904
Emergency Medical Technolo-gy/Technician (EMT Paramedic)
Post-Sec. Awards/Cert./ Diplomas; 1-2 yrs.
23
25
14
15
14
Northern Maine Community College
510904
Emergency Medical Technolo-gy/Technician (EMT Paramedic)
Post-Sec. Awards/Cert./ Diplomas; 1-2 yrs.
1
4
6
3
Kennebec Valley Community College
510904
Emergency Medical Technolo-gy/Technician (EMT Paramedic)
Associate's Degree
4
1
3
3
3
Northern Maine Community College
510904
Emergency Medical Technolo-gy/Technician (EMT Paramedic)
Associate's Degree
1
2
1
5
Eastern Maine Community College
510904
Emergency Medical Technolo-gy/Technician (EMT Paramedic)
Associate's Degree
1
2
5
Southern Maine Com-munity College
510904
Emergency Medical Technolo-gy/Technician (EMT Paramedic)
Associate's Degree
15
11
7
16
11
Total 44 39 56 75 72 Source: IPEDS, CWRI
Outlook
Nationally, employment of emergency medical technicians (EMTs) and paramedics is expected to grow by 33 percent from 2010 to 2020, much faster than the average for all occupations. In Maine, growth in this occupation is expected to be 31 percent, above the 6 percent growth expected for all occupations.

Healthcare Occupations Report | P a g e 175
Emergencies such as car crashes, natural disasters, and violence will continue to create demand for EMTs and paramedics. There will also continue to be demand for part-time, volunteer EMTs and paramedics in rural areas and smaller metropolitan areas.
Growth in the middle-aged and elderly population will lead to an increase in the number of age-related health emergencies, such as heart attacks or strokes. This, in turn, will lead to an increase in the demand for EMTs and paramedic services. An increase in specialized medical facilities will require more EMTs and paramedics to transfer patients with specific conditions to these facilities for treatment.
In recent years, companies that build ambulances have started to update and redesign their interiors to keep EMTs, paramedics, and patients safer during transport. These companies are hiring EMTs and paramedics as consultants to learn their ideas about such updates and designs.
Close to 100 job openings per year are expected in Maine, 59 from new growth and 38 from replacement needs.
Employment of EMTs & Paramedics in Maine, 2010 and Projected 2020
Average Employment Change in Employment (2010-2020)
Projected Annual Openings Resulting from New Growth 2010 2020 Net Percent
1,902 2,489 587 31% 59
Source: CWRI 2010-2020 Employment Projections
59
38
97
Growth Replacement Total
Projected Annual Job Openings, EMTs & Paramedics
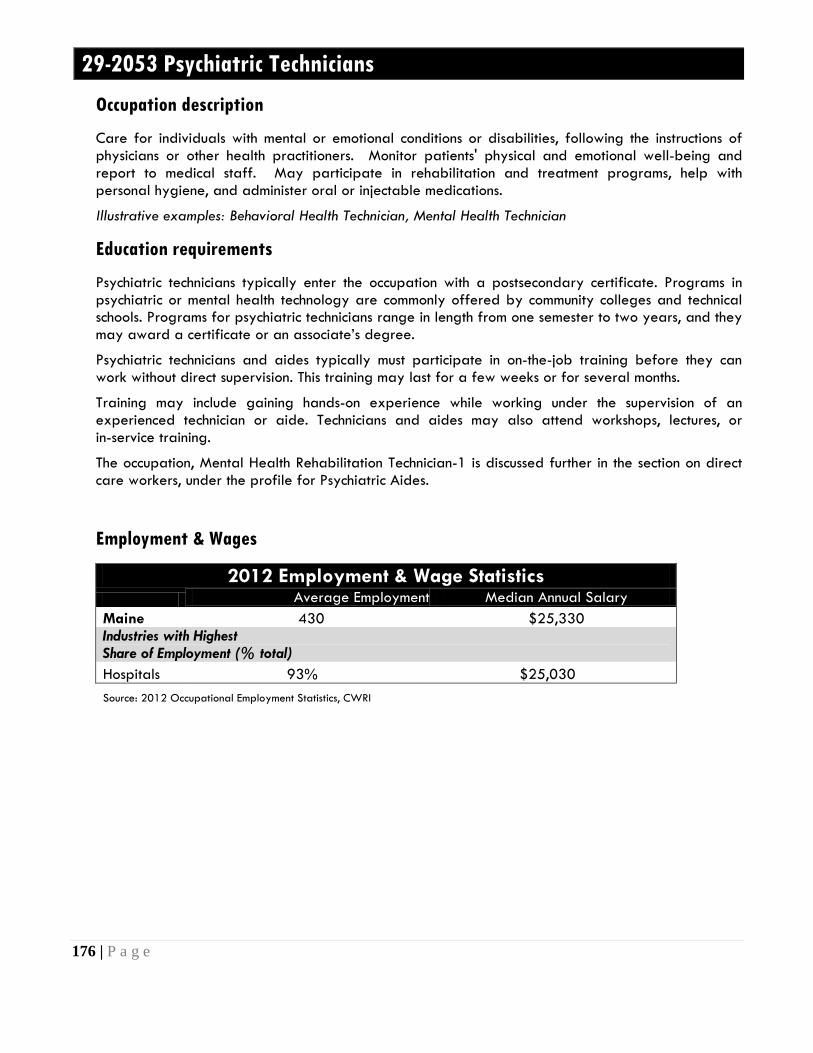
176 | P a g e
29-2053 Psychiatric Technicians
Occupation description
Care for individuals with mental or emotional conditions or disabilities, following the instructions of physicians or other health practitioners. Monitor patients' physical and emotional well-being and report to medical staff. May participate in rehabilitation and treatment programs, help with personal hygiene, and administer oral or injectable medications.
Illustrative examples: Behavioral Health Technician, Mental Health Technician
Education requirements
Psychiatric technicians typically enter the occupation with a postsecondary certificate. Programs in psychiatric or mental health technology are commonly offered by community colleges and technical schools. Programs for psychiatric technicians range in length from one semester to two years, and they may award a certificate or an associate’s degree.
Psychiatric technicians and aides typically must participate in on-the-job training before they can work without direct supervision. This training may last for a few weeks or for several months.
Training may include gaining hands-on experience while working under the supervision of an experienced technician or aide. Technicians and aides may also attend workshops, lectures, or in-service training.
The occupation, Mental Health Rehabilitation Technician-1 is discussed further in the section on direct care workers, under the profile for Psychiatric Aides.
Employment & Wages
2012 Employment & Wage Statistics Average Employment Median Annual Salary Maine 430 $25,330 Industries with Highest Share of Employment (% total) Hospitals 93% $25,030 Source: 2012 Occupational Employment Statistics, CWRI

Healthcare Occupations Report | P a g e 177
Schools offering training and number completing
A postsecondary certificate is typically required. KVCC offers an Associate in Applied Science degree in Mental Health, which, according to the school’s website, “will prepare students for entry-level and above positions in areas of substance abuse, mental health rehabilitation, developmental disability services, and gerontology. Students who complete the five MHT100-level courses listed in the program can apply to the Muskie School Center for Learning for the Provisional MHRT-Community Certification. Students who then complete the remaining five MHT200-level courses listed in the program can apply to the Muskie School Center for Learning for the Full MHRT-Community Certification.”
Education Programs & Annual Graduates
School CIP Code
CIP Title Completer Title 2007 2008 2009 2010 2011
Kennebec Valley Community College
511599
Mental and Social Health Services and Allied Professions, Other
Associate's Degree 1 6 6 17 18
Kennebec Valley Community College
511599
Mental and Social Health Services and Allied Professions, Other
Post-Sec. Awards/Cert./ Diplomas; 1-2 yrs.
1
Southern Maine Community College
511599
Mental and Social Health Services and Allied Professions, Other
Post-Sec. Awards/Cert./ Diplomas; < 1 yr.
3
Source: IPEDS, CWRI
0.32
0.22
Maine U.S.
Psychiatric Technicians per 1,000 Population

178 | P a g e
Outlook
Nationally, employment of psychiatric technicians is expected to increase 15 percent from 2010 to 2020, about as fast as the average for all occupations. In Maine, employment is expected to increase 20 percent.
As the nation’s population ages and people live longer, there is likely to be an increase in the number of people with cognitive mental diseases, such as Alzheimer’s disease. Demand for psychiatric technicians and aides in residential facilities are expected to rise as a result.
More psychiatric technicians and aides will also be needed in residential treatment facilities for people with developmental disabilities, mental illness, and substance abuse problems. There is a long-term trend toward treating psychiatric patients outside of hospitals, because it is more cost-effective and allows patients greater independence. Also, an increasing number of mentally disabled adults who were cared for by their parents will need help as their parents become too old to provide that care.
In addition, an aging prison population has increased the need for psychiatric technicians and aides working in correctional facilities.
Nineteen job opportunities are expected each year, 10 from new growth in demand and 9 from replacement needs.
Employment of Psychiatric Technicians in Maine, 2010 and Projected 2020
Average Employment Change in Employment (2010-2020)
Projected Annual Openings Resulting from New Growth
2010 2020 Net Percent
523 625 102 20% 10
Source: CWRI 2010-2020 Employment Projections
10 9
19
Growth Replacement Total
Projected Annual Job Openings, Psychiatric Technicians

Healthcare Occupations Report | P a g e 179
29-2055 Surgical Technologists
Occupation description
Assist in operations, under the supervision of surgeons, registered nurses, or other surgical personnel. May help set up operating room, prepare and transport patients for surgery, adjust lights and equipment, pass instruments and other supplies to surgeons and surgeon's assistants, hold retractors, cut sutures, and help count sponges, needles, supplies, and instruments.
Illustrative examples: Certified Surgical Technologist, Operating Room (OR) Tech, Surgical Scrub Technologist
Education requirements
Surgical technologists typically need a postsecondary certificate or associate’s degree. Certification also can help a surgical technologist find a position. A small number of states regulate surgical technologists. No license is required in Maine.
In 2010, accredited training programs were recognized by the Commission on Accreditation of Allied Health Education Programs (CAAHEP).
Employment & Wages
2012 Employment & Wage Statistics
Average Employment
Median Annual Salary
Maine 590 $39,950 Industries with Highest Share of Employment (% total) Hospitals 69% $40,050 Ambulatory Health Services n/a $39,010 Source: 2012 Occupational Employment Statistics, CWRI
0.44
0.31
Maine U.S.
Surgical Technologists per 1,000 Population

180 | P a g e
Schools offering training and number completing
Programs are available at Eastern Maine Community College (EMCC), SMCC and The Maine Medical Center School of Surgical Technology. The Maine Medical Center program does not participate in the federal student loan program and is therefore not required to report completer data to the National Center of Education Statistics. This program is accredited and has graduated approximately 30 students per year in their 12 month surgical technology program.
Education Programs & Annual Graduates
School CIP Code CIP Title
Completer Title 2007 2008 2009 2010 2011
Eastern Maine Community College
510909
Surgical Technology/ Technologist
Associate's Degree
3
11
9
11
13
Southern Maine Community College
510909
Surgical Technology/ Technologist
Associate's Degree
1
1
4
5
3
Maine Medical Center School of Surgical Technology
Data is not reported.
Total 4 12 13 16 16
Source: IPEDS, CWRI
Outlook
Nationally, employment of surgical technologists is expected to increase 19 percent from 2010 to 2020. In Maine, surgical technologist employment is expected to increase 24 percent.
Advances in medical technology have made surgery safer, and more operations are being done to treat a variety of illnesses and injuries. The aging of the large number of baby boomers also is expected to increase the need for surgical technologists because older people usually require more operations, including joint replacements and heart-related procedures. Hospitals will continue to be the primary employer of surgical technologists, reducing costs by employing technologists, instead of higher paid registered nurses in operating rooms.
Job prospects should be best for surgical technologists who have completed an accredited education program and who maintain their professional certification. In total, 24 job openings per year are expected, with most of those resulting from growth in demand.

Healthcare Occupations Report | P a g e 181
Employment of Surgical Technologists in Maine, 2010 and Projected 2020
Average Employment Change in Employment (2010-2020) Projected Annual Openings
Resulting from New Growth
2010 2020 Net Percent
558 693 135 24% 14
Source: CWRI 2010-2020 Employment Projections
14 10
24
Growth Replacement Total
Projected Annual Job Openings, Surgical Technologists

182 | P a g e
Direct Care Workers Summary Statistics
Workforce Characteristics
Home Health Aides
Personal Care Aides
Psychiatric Aides
Nursing Assistants Orderlies
Employment (2012) 3,670 7,030 2,050 9,240 140 Employment per 1,000 population 2.8 5.30 1.50 7.0 0.11
versus U.S. Average Above avg. Above avg. Above avg. Below avg. Average annual starting wage (Maine)
$19,310 $17,370 $19,920 $20,080 $18,970
Median annual wage (Maine) $22,290 $21,050 $23,890 $23,550 $25,280
U.S. median annual wage $20,820 $19,910 $24,580 $24,420 $23,990
Median wage for all occupations in Maine
$32,590 $32,590 $32,590 $32,590 $32,590
Minimum Education Requirement
Less than high school***
Less than high school***
High school diploma or
equivalent***
Postsecondary certificate or
award
At least a high school diploma
Job Growth Projections 24% 22% 7% 10.4%* 10.4%*
National Median Age** 40.6 40.6 40.6 40.6 40.6
Top Industry of Employment
Nursing and residential care
facilities Social Assistance
Nursing and residential care
facilities
Nursing and residential care
facilities Hospitals
Licensing Board No license required.
No license required.
No license required.
No license required. Must be on state registry.
No license required.
* Nursing aides, orderlies and attendants **Nursing, psychiatric, and home health aides ***Training courses are required by the State of Maine; please see the occupational profile for more detail.
Key points
• Direct care represents a large and rapidly growing segment of the workforce.
• Job prospects for home health and personal care aides are particularly bright. These large and rapidly growing occupations are expected to add many jobs.
• Distribution of employment is far from uniform, particularly for personal and home care aides. Cumberland and Kennebec Counties have nearly twice the aides per population compared to the state average. Overall, 93 percent of this workforce is employed in 8 counties representing 76 percent of the Maine population, leaving a disproportionately low share of aides (7 percent) for the remaining 8 counties.
• The combination of strong demand coupled with low pay and high emotional and physical demands in these occupations may lead to shortages of workers. Nearly half the workforce

Healthcare Occupations Report | P a g e 183
has levels of educational attainment beyond the minimum required, which may contribute to turnover.
About Direct Care Workers Direct care covers a range of occupations that deal with providing important support services to people who need care. Direct Support Professionals, Personal Support Specialists, Home Health Aides, Certified Nursing Assistants (CNAs) and Personal Care Attendants are some of the industry titles used under direct care. For a more complete list of titles used in Maine, please see the Maine Direct Service Worker website, http://www.maine.gov/dhhs/mainedirectserviceworker/index.shtml
Many of the titles used for direct service workers in the field don’t match Standard Occupation Classification System (SOC) definitions, which tend to lag what happens in the industry. When this occurs, MDOL determines which SOC title is most appropriate for those workers. Direct support professional and personal support specialist are examples. These titles are used in the field but they don’t align within the scope of the Healthcare Support Occupations (31-0000) of the SOC. When an employer responds to an MDOL employment survey and reports that it employs direct support/personal support workers, how they are coded by MDOL analysts depends on the employment setting and work being performed.
Direct support/personal support workers are usually coded as 31-1011 Home Health Aides, 31-1013 Psychiatric Aides, or as 39-9021 Personal Care Aides (in the Personal Care and Service Occupations 39-0000). When the worker is employed in a group home setting, they are often coded as 31-1011 Home Health Aides due to the residential nature of the employment setting and responsibilities extending beyond that of supporting daily living activities. The 39-9021 Personal Care Aides classification is generally used when the care provider travels to the client residence to perform the service, then leaves to visit another client. The level of care focuses on daily living activities rather than healthcare and dispensing medications. Recent guidance in occupational coding allows use of the 39-9021 Personal Care Aide in a group home setting if the worker does not engage in healthcare support activities or is supervised by healthcare professionals. In the event the worker is dealing with mental disabilities (usually severe), they may be coded as a 31-1013 Psychiatric Aide. The actual classification is determined by where the person works and specifically what they do rather than their job title. Workers in the 31-0000 series are considered healthcare support and they usually are supervised by a nurse or similar healthcare professional.
Home health Aides are typically employed at nursing homes and personal care aides within different social services settings.
31-1011 Home Health Aides
Occupation description
Provide routine individualized healthcare such as changing bandages and dressing wounds, and applying topical medications to the elderly, convalescents, or persons with disabilities at the patient’s home or in a care facility. Monitor or report changes in health status. May also provide personal care such as bathing, dressing, and grooming of patient.
Illustrative examples: Home Health Attendant, Home Hospice Aide
The OOH notes the following about home health aides: Home health aides, unlike personal care aides, typically work for certified home health or hospice agencies that receive government funding and therefore must comply with regulations. They work under the direct supervision of a medical professional, usually a nurse. These aides keep records of services performed and of the client's

184 | P a g e
condition and progress. They report changes in the client's condition to the supervisor or case manager. Aides also work with therapists and other medical staff.20
According to the Maine DHHS, a home health aide:
•Works with people living at home who need assistance with Activities of Daily Living (ADLs)
•Can work in a client’s home
•Provides assistance with “Activities of Daily Living” (ADLs) including assistance with bathing, skin and hair care; getting in and out of bed; preparing meals; and using the bathroom. An HHA also helps with the client’s care and treatment
•Is supervised by a registered professional nurse21
Education requirements
There are no formal education requirements for home health aides, but most have a high school diploma. Most home health aides are trained on the job by nurses, other aides, or supervisors. Those working in certified home health or hospice agencies must get formal training and pass a standardized test.
Aides may be trained in housekeeping tasks, such as cooking for clients who have special dietary needs. They learn basic safety techniques, including how to respond in an emergency.
A competency evaluation may be required to ensure that the aide can perform some required tasks. Clients have their own preferences and aides may need time to become comfortable working with them.
In some states, the only requirement for employment is on-the-job training, which employers generally provide. Other states require formal training, which is available from community colleges, vocational schools, elder care programs, and home health care agencies. In addition, states may conduct background checks on prospective aides. Requirements to work as a home health aide in Maine are listed below.
Without additional training, advancement in this occupation is limited.
In Maine, to become a Home Health Aide the candidate must:
•Have completed 9th grade (although a high school diploma or GED is preferred)
•Successfully complete the 180-hour CNA Training Program
•Be listed on the Maine Registry of Certified Nursing Assistants
•Receive home health aide orientation provided by the home health agency you work for
•Receive at least 12 hours of in-service training annually
To learn more:
•CNA Training ( http://www.maine.gov/education/it/directory/hoes/cna.htm )
•The Maine Registry of Certified Nursing Assistants (CNA Registry) http://www.maine.gov/dhhs/dlrs/cna/home.html
20 http://www.bls.gov/ooh/healthcare/home-health-aides.htm#tab-2
21 This information is from the Maine Direct Service Worker webpage (http://www.maine.gov/dhhs/mainedirectserviceworker/HHA.html)

Healthcare Occupations Report | P a g e 185
Certification
Home health aides who work for agencies that receive reimbursement from Medicare or Medicaid must get a minimum level of training and pass a competency evaluation or receive state certification. Training includes learning about personal hygiene, reading and recording vital signs, infection control, and basic nutrition. Aides may take a competency exam to become certified without taking any training. These are the minimum requirements by law; additional requirements for certification vary by state.
Aides can be certified by the National Association for Home Care & Hospice (NAHC). Although certification is not always required, employers prefer to hire certified aides. Certification requires 75 hours of training, observation and documentation of 17 skills demonstrating competency, and passing a written exam.
Employment & Wages
In 2012 there were close to 3,700 employed as home health aides, with a median annual wage of $22,000. Median wages in this state were 7 percent above the national median. Home health aides are mostly employed at nursing and residential care facilities.
2012 Employment & Wage Statistics
Average Employment
Median Annual Salary
Maine 3,670 $22,290 Industries with Highest Share of Employment (% total) Nursing and Residential Care Facilities 70% $22,040 Ambulatory Health Care Services 15% $24,750 Social Assistance 11% $21,800 Source: 2012 Occupational Employment Statistics, CWRI
The number of home health aides in Maine is comparable to that of the nation on a per-1,000-resident basis.
2.8 2.7
Maine USA
Home Health Aides per 1,000 Population

186 | P a g e
Distribution of employment
Distribution of Employment
Number Employed
Pct. (%) Total Employment
Pct. (%) of Total Maine
Population
Number Employed per 1,000 Population
Androscoggin County 520 14% 8% 4.8 Aroostook County 360 10% 5% 5.1 Cumberland County 610 17% 21% 2.1 Franklin County n/a n/a 2% Hancock County 170 5% 4% 3.1 Kennebec County 360 10% 9% 3.0 Knox n/a n/a 3% Lincoln County n/a n/a 3% Oxford County 180 5% 4% 3.1 Penobscot County 120 3% 12% 0.8 Piscataquis County n/a n/a 1% Sagadahoc County n/a n/a 3% Somerset County n/a n/a 4% Waldo County n/a n/a 3% Washington County n/a n/a 2% York County 390 11% 15% 2.0 Maine 3,670 74% 100% 2.8 Source: CWRI analysis of OES & Census data
Some county employment data is suppressed according to BLS confidentiality and data quality requirements.
Demographic, economic and social characteristics of the workforce
Note: ACS data combines nursing, psychiatric and home health aides together.
Educational Attainment
Nursing, Psychiatric and Home Health Aides
Number % Not high school graduate 575 5% High school graduate (including equivalency) 6,220 51% Some college or associate degree 4,615 38% Bachelor's degree 635 5% Graduate or professional degree 190 2% Total 12,235 100% 2006-2010 ACS, CWRI
Schools offering training and number completing
In Maine, home health aides are required to successfully complete the 180-hour CNA Training Program and be listed on the Maine Registry of Certified Nursing Assistants. The Maine Medical Center (MMC) offers CNA training and typically graduates 65 persons each year. MMC completer data is not picked up by the National Center for Education Statistics (NCES) and IPEDS, as the center does not participate in federal student aid programs. York County Community College also offers a

Healthcare Occupations Report | P a g e 187
non-credit CNA course. CNA training is also available at a variety of adult education and technical schools throughout the state. The curriculum consists of a minimum of 180 program training hours.
Training resources for Maine’s direct services occupations may be found with the following link:
http://www.maine.gov/dhhs/mainedirectserviceworker/LinkPages/TrainingResources.html
Outlook
Nationally, employment of home health aides is expected to grow by 69 percent from 2010 to 2020, much faster than the 14 percent increase expected for all occupations. In Maine, home health aide employment is expected to grow 24 percent, above the 6 percent increase expected for all occupations.
As the baby-boom population ages and the elderly population grows, the demand for home health aides to provide assistance and companionship will continue to increase. Older clients often have health problems and need some help with daily activities.
Elderly and disabled clients increasingly rely on home care as a less expensive alternative to nursing homes or hospitals. Clients who need help with everyday tasks and household chores, rather than medical care, can reduce their medical expenses by returning to their homes.
Another reason for home care is that most clients prefer to be cared for in their homes, where they are most comfortable. Studies have found that home treatment is often more effective than care in a nursing home or hospital.
Job prospects for home health aides are excellent. This occupation is large and expected to grow very quickly, thus adding many jobs. In addition, the relatively low pay and high emotional demands cause many workers to leave these occupations, and they will have to be replaced. 170 job openings per year are expected, 110 from growth and 60 from replacement needs.
The dynamics of strong demand coupled with the low pay and often high emotional demands of this occupation may lead to shortages of workers. In particular, the supply of workers willing and available to perform these services may diminish during periods of stronger economic growth as the competition for labor from other sectors of the economy increases.
Employment of Home Health Aides in Maine, 2010 and Projected 2020
Average Employment Change in Employment (2010-2020)
Projected Annual Openings
Resulting from New Growth
2010 2020 Net Percent
4,662 5,760 1,098 24% 110
Source: CWRI 2010-2020 Employment Projections

188 | P a g e
110
60
170
Growth Replacement Total
Projected Annual Job Openings, Home Health Aides

Healthcare Occupations Report | P a g e 189
39-9021 Personal and Home Care Aides
Occupation description
Assist the elderly, convalescents, or persons with disabilities with daily living activities at the person's home or in a care facility. Duties performed at a place of residence may include keeping house (making beds, doing laundry, washing dishes) and preparing meals. May provide assistance at non-residential care facilities. May advise families, the elderly, convalescents, and persons with disabilities regarding such things as nutrition, cleanliness, and household activities.
Illustrative examples: Blind Escort, Elderly Companion, Geriatric Personal Care Aide
Personal care aides do not provide any type of medical service. This is why this occupation is coded in the SOC major group, Personal Care and Service Occupations (39-0000) as opposed to Healthcare Support (31-0000).
Education requirements
According to BLS, a high school diploma or equivalent is not generally required, but most aides have one before entering the occupation. They are usually trained by nurses, other aides or supervisors.
Aides may be trained in housekeeping tasks, such as cooking for clients who have special dietary needs. They learn basic safety techniques, including how to respond in an emergency.
A competency evaluation may be required to ensure that the aide can perform some required tasks. Clients have their own preferences and aides may need time to become comfortable working with them.
In some states, the only requirement for employment is on-the-job training, which employers generally provide. Other states require formal training, which is available from community colleges, vocational schools, elder care programs, and home health care agencies. Education requirements for different types of direct service workers in Maine are detailed below. In addition, states may conduct background checks on prospective aides. Without additional training, advancement in this occupation is limited.
Education requirements for different types of direct care specialists in Maine are as follows:
For Personal Support Specialists (PSS) a 50 hour training program approved by the Office of Licensing and Regulatory Services is required. An overview of PSS training is available through DHHS (https://gateway.maine.gov/dhhs-apps/assisted/pss_overview.asp).
For Direct Support Specialists 45 hours of College of Direct Support training and have a high school diploma or GED are required.
Consumer Directed Personal Assistants go through on the job training.
Employment & Wages
In 2012 there were 7,000 employed as personal care aides, with a median wage of $21,000, which was 6 percent above the national median. Personal care aides are employed mostly in different social assistance settings and to a lesser extent nursing and residential care facilities.

190 | P a g e
2012 Employment & Wage Statistics
Average Employment
Median Annual Salary
Maine 7,030 $21,050 Industries with Highest Share of Employment (% total) Social Assistance 71% $20,820 Nursing and Residential Care Facilities 21% $21,680 Ambulatory Health Care Services 7% $21,360 Source: 2012 Occupational Employment Statistics, CWRI
The number of personal care aides employed in Maine per thousand residents was significantly above the U.S. average.
Distribution of employment
Employment of personal care aides per thousand residents in Cumberland and Kennebec Counties is nearly twice the state average. Overall, 93 percent of this workforce is employed in 8 counties representing 76 percent of the Maine population, leaving a disproportionately low share of aides (7 percent) for the remaining 8 counties.
5.3
3.1
Maine USA
Personal Care Aides per 1,000 Population, 2012

Healthcare Occupations Report | P a g e 191
Distribution of Employment
Number Employed Pct. (%) total employment
Pct. (%) of total Maine Population
Number Employed per 1,000 Population
Androscoggin County 510 7% 8% 4.7 Aroostook County 350 5% 5% 4.9 Cumberland County 2640 38% 21% 9.3 Franklin County n/a n/a 2% Hancock County n/a n/a 4% Kennebec County 1120 16% 9% 9.2 Knox County 160 2% 3% 4.0 Lincoln County 270 4% 3% 7.9 Oxford County n/a n/a 4% Penobscot County 920 13% 12% 6.0 Piscataquis County n/a n/a 1% Sagadahoc County n/a n/a 3% Somerset County n/a n/a 4% Waldo County n/a n/a 3% Washington County n/a n/a 2% York County 570 8% 15% 2.9 Maine 7,030 93% 100% 5.3 Source: CWRI analysis of OES & Census data
Some data is suppressed according to BLS confidentiality and data quality requirements. Suppressed data is shown as “n/a” for not available.
Demographic, economic and social characteristics of the workforce
Educational Attainment
Personal Care Aides
Number % Not high school graduate 205 4% High school graduate (including equivalency) 2,480 48% Some college or associate degree 1,885 36% Bachelor's degree 550 11% Graduate or professional degree 80 2% Total 5,200 100% 2006-2010 ACS, CWRI
Schools offering training and number completing
Training resources for Direct and Personal Support Specialists and other direct services workers in Maine may be found with the following link:
http://www.maine.gov/dhhs/mainedirectserviceworker/LinkPages/TrainingResources.html

192 | P a g e
Outlook
Nationally, employment of personal care aides is expected to grow by 70 percent from 2010 to 2020, much faster than the average for all occupations. In Maine, growth of personal care aides is expected to increase 22 percent.
As the baby-boom population ages and the elderly population grows, the demand for personal care aides to provide assistance and companionship will continue to increase. Older clients often have health problems and need some help with daily activities.
Elderly and disabled clients increasingly rely on home care as a less expensive alternative to nursing homes or hospitals. Clients who need help with everyday tasks and household chores, rather than medical care, can reduce their medical expenses by returning to their homes.
Another reason for home care is that most clients prefer to be cared for in their homes, where they are most comfortable. Studies have found that home treatment is often more effective than care in a nursing home or hospital.
Job prospects for personal care aides are excellent. This occupation is large and expected to grow very quickly, thus adding many jobs. In addition, the relatively low pay and high emotional demands cause many workers to leave these occupations, and they will have to be replaced. Across industries, close to 200 job opportunities per year are expected, with most of these resulting from new growth in demand.
The dynamics of strong demand coupled with the low pay and often high emotional demands of this occupation may lead to shortages of workers. In particular, the supply of workers willing and available to perform these services may diminish during periods of stronger economic growth as competition for labor from other sectors of the economy increases.
Employment of Personal Care Aides in Maine 2010 and Projected 2020
Average Employment Change in Employment (2010-2020)
Projected Annual Openings Resulting from New Growth 2010 2020 Net Percent
6,578 8,033 1,455 22% 146
Source: CWRI 2010-2020 Employment Projections
146
52
198
Growth Replacement Total
Projected Annual Job Openings, Personal Care Aides

Healthcare Occupations Report | P a g e 193
31-1013 Psychiatric Aides
Occupation description
Assist mentally impaired or emotionally disturbed patients, working under direction of nursing and medical staff. May assist with daily living activities, lead patients in educational and recreational activities, or accompany patients to and from examinations and treatments. May restrain violent patients. Includes psychiatric orderlies.
Illustrative examples: Mental Health Orderlies, Psychiatric Nursing Aide, Psychiatric Technician Assistant
NOTE: Psychiatric technicians (SOC: 29-2053) are reviewed with Technologists and Technicians.
Education requirements
According to the SOC, psychiatric aides typically need a high school diploma or equivalent. Postsecondary courses in psychology or mental health technology may be helpful.
According to the Maine Department of Health and Human Services (DHHS), the minimum qualifications for a Mental Health Rehabilitation Technician -1 (MHRT) are as follows:
• 35 hour Mental health support specialist training
• Approved behavioral intervention program
• 40-hour Certified Residential Medication Aide (CRMA) training
• CPR and first-aid training
For more information on Maine’s requirements for MHRT-1, please see http://muskie.usm.maine.edu/cfl/MHRTIOverview.html
Employment & Wages
In 2012 there were 2,000 psychiatric aides employed in Maine, with a median annual wage of nearly $24,000. Psychiatric aides are mostly employed at nursing and residential care facilities.
2012 Employment & Wage Statistics
Average Employment
Median Annual Salary
Maine 2,050 $23,890 Industries with Highest Share of Employment (% total) Nursing and Residential Care Facilities 96% $23,750 Source: 2012 Occupational Employment Statistics, CWRI

194 | P a g e
Distribution of employment
Distribution of Employment
Number Employed
Pct. (%) Total Employment
Pct. (%) of Total Maine Population
Number Employed per 1,000 Population
Androscoggin County n/a n/a 8% Aroostook County 180 9% 5% 2.5 Cumberland County 1030 50% 21% 3.6 Franklin County n/a n/a 2% Hancock County n/a n/a 4% Kennebec County n/a n/a 9% Knox County n/a n/a 3% Lincoln County n/a n/a 3% Oxford County n/a n/a 4% Penobscot County 320 16% 12% 2.1 Piscataquis County n/a n/a 1% Sagadahoc County n/a n/a 3% Somerset County n/a n/a 4% Waldo County n/a n/a 3% Washington County n/a n/a 2% York County n/a n/a 15% Maine 2,050 75% 100% 1.5 Source: CWRI analysis of OES & Census data
Some data is suppressed according to BLS confidentiality and data quality requirements. Suppressed data is shown as “n/a” for not available.
Demographic, economic and social characteristics of the workforce
Note: ACS combines data for psychiatric aides with nursing and home health aides. Please refer to the profile on home health aides for details on educational attainment.
1.5
0.2
Maine USA
Psychiatric Aides per 1,000 Population

Healthcare Occupations Report | P a g e 195
Schools offering training and number completing
No degree programs are offered or required. Short term on-the-job training may be offered. Training options for the MHRT-1 may be found at the following website, http://www.maine.gov/dhhs/mainedirectserviceworker/LinkPages/TrainingResources.html
Outlook
In Maine, employment of psychiatric aides is expected to increase 7 percent from 2010 to 2020, in line with the average growth rate for all occupations. 37 job opportunities per year are expected, 13 from new growth in demand and 24 from replacement needs.
Employment of Psychiatric Aides in Maine, 2010 and Projected 2020
Average Employment Change in Employment (2010-2020)
Projected Annual Openings Resulting from
New Growth 2010 2020 Net Percent
1,850 1,980 130 7% 13
Source: CWRI 2010-2020 Employment Projections
13
24
37
Growth Replacement Total
Projected Annual Job Openings, Psychiatric Aides

196 | P a g e
31-1014 Nursing Assistants
Occupation description
Provide basic patient care under direction of nursing staff. Perform duties such as feed, bathe, dress, groom, or move patients, or change linens. May transfer or transport patients. Includes nursing care attendants, nursing aides, and nursing attendants. Excludes “Home Health Aides” (31-1011), “Orderlies” (31-1015), “Personal Care Aides” (39-9021), and “Psychiatric Aides” (31-1013).
Illustrative examples: Certified Nursing Aide, Certified Nursing Assistant (CNA), Nursing Care Attendant
Education requirements
Nursing aides and attendants must earn a postsecondary certificate or award, in which they learn the basic principles of nursing and complete supervised clinical work. These programs are found in community colleges, vocational and technical schools, and in hospitals and nursing homes. Some high schools offer nursing aide programs. In Maine, Certified Nursing Assistants must successfully complete a 180 hour CNA training course. A CNA-Medications must complete CNA training plus a Standardized Medications Course.
When they finish their state-required education, nursing aides and attendants take a competency exam. Passing this exam allows them to use state-specific titles. In some states, a nursing aide or attendant is called a Certified Nursing Assistant, but titles vary from state to state.
Nursing aides and attendants who have passed the exam are placed on a state registry. In many states, nursing aides and attendants must be on the state registry to work in a nursing home. For more information on the Maine Registry of Certified Nursing Assistants (CNA Registry), please visit Maine’s Division of Licensing and Regulatory Services at http://www.maine.gov/dhhs/dlrs/cna/home.html
Employment & Wages
In 2012 there were more than 9,000 nursing assistants employed in Maine, with a median annual wage of $23,500. Nursing assistants are mostly employed at nursing and residential care facilities and to a lesser extent, hospitals.
2012 Employment & Wage Statistics
Average Employment Median Annual Salary
Maine 9,240 $23,550 Industries with Highest Share of Employment (% total) Nursing and Residential Care Facilities 65% $22,800 Hospitals 20% $25,180 Public Administration 9% $26,590 Source: 2012 Occupational Employment Statistics, CWRI
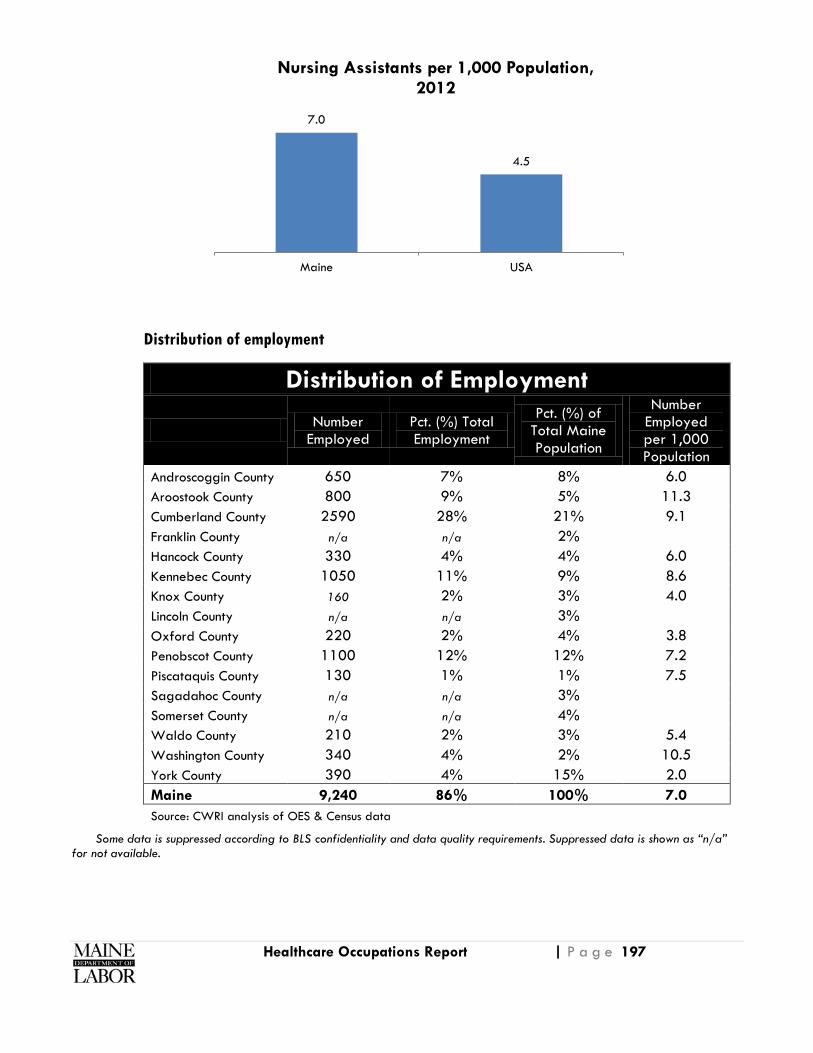
Healthcare Occupations Report | P a g e 197
Distribution of employment
Distribution of Employment
Number Employed
Pct. (%) Total Employment
Pct. (%) of Total Maine Population
Number Employed per 1,000 Population
Androscoggin County 650 7% 8% 6.0 Aroostook County 800 9% 5% 11.3 Cumberland County 2590 28% 21% 9.1 Franklin County n/a n/a 2% Hancock County 330 4% 4% 6.0 Kennebec County 1050 11% 9% 8.6 Knox County 160 2% 3% 4.0 Lincoln County n/a n/a 3% Oxford County 220 2% 4% 3.8 Penobscot County 1100 12% 12% 7.2 Piscataquis County 130 1% 1% 7.5 Sagadahoc County n/a n/a 3% Somerset County n/a n/a 4% Waldo County 210 2% 3% 5.4 Washington County 340 4% 2% 10.5 York County 390 4% 15% 2.0 Maine 9,240 86% 100% 7.0 Source: CWRI analysis of OES & Census data
Some data is suppressed according to BLS confidentiality and data quality requirements. Suppressed data is shown as “n/a” for not available.
7.0
4.5
Maine USA
Nursing Assistants per 1,000 Population, 2012

198 | P a g e
Demographic, economic and social characteristics of the workforce
Note: ACS combines data for this occupation with home health aides. Please refer to the home health aide profile for details on nursing assistant educational attainment.
Schools offering training and number completing
The Intercoast Career Institute offers a certificate program in nursing assistance/patient care. Maine Medical Center (MMC) also offers CNA training and typically graduates 65 persons each year. MMC completer data is not picked up by the National Center for Education Statistics (NCES) and IPEDS, as the center does not participate in federal student aid programs. York County Community College also offers a non-credit CNA course. CNA training is also available at a variety of adult education and technical schools throughout the state. The curriculum consists of a minimum of 180 program training hours. Training resources for nurse assistants and CNAs may be found at the following DHHS website: http://www.maine.gov/dhhs/mainedirectserviceworker/LinkPages/TrainingResources.html
Education Programs & Annual Graduates School CIP Code CIP Title Completer Title 2007 2008 2009 2010 2011
Intercoast Career Institute 511614
Nurse/Nursing Assistant/Aide and Patient Care Assistant
Post-Sec. Awards/Cert./ Diplomas; 1-2 yrs. 46 88 87
Maine Medical Center not reported by IPEDS 65 graduates per year
York County Community College
non-credit bearing certificate; data not reported to IPEDS
Source: IPEDS, MMC, YCCC, CWRI
Outlook
Projections data for nursing assistants are not yet broken out individually. The following discussion and data are for nursing aides, orderlies and attendants, combined.
111
153 152
2009 2010 2011
Nursing Assistant/Attendant Program Completers

Healthcare Occupations Report | P a g e 199
Nationally, employment of nursing aides, orderlies, and attendants is expected to grow by 20 percent from 2010 to 2020, faster than the average for all occupations. In Maine, employment is expected to grow 10 percent.
Because of the growing elderly population, many nursing aides, orderlies, and attendants will be needed in long-term care facilities, such as nursing homes. Growth in the demand for healthcare services should lead to increased opportunities for nursing aides, orderlies, and attendants in other industries as well, such as hospitals and clinics.
Demand for nursing aides, orderlies, and attendants may be constrained, however, by the fact that many nursing homes rely on government funding, which tends to increase slower than the cost of patient care.
Job prospects for those with formal training should be excellent, particularly in long-term care facilities. Because of the emotional and physical demands of this occupation, many nursing aides, orderlies, and attendants choose to leave the profession to get more training or another job. This creates opportunities for jobseekers who want to become nursing aides.
In Maine, 230 job openings per year are anticipated, with more than 100 resulting from new growth in demand and the remainder from replacement job openings.
Employment of Nursing Aides, Orderlies & Attendants in Maine 2010 and Projected 2020
Average Employment Change in Employment (2010-2020)
Projected Annual Openings Resulting from
New Growth 2010 2020 Net Percent
9,904 10,935 1,031 10% 103
Source: CWRI 2010-2020 Employment Projections
103 128
231
Growth Replacement Total
Projected Annual Job Openings, Nursing Aides, Orderlies & Attendants

200 | P a g e
31-1015 Orderlies
Occupation description
Transport patients to areas such as operating rooms or x-ray rooms using wheelchairs, stretchers, or moveable beds. May maintain stocks of supplies or clean and transport equipment. Psychiatric orderlies are included in “Psychiatric Aides” (31-1013). Excludes “Nursing Assistants” (31-1014).
Illustrative examples: Hospital Orderly, Medical Orderly, Surgical Orderly
Education requirements
Orderlies typically have at least a high school diploma. Orderlies who are not involved in patient care may be trained on the job.
Employment & Wages
2012 Employment & Wage Statistics
Average Employment
Median Annual Salary
Maine 140 $25,280 Industries with Highest Share of Employment (% total) Hospitals 93% $25,730 Source: 2012 Occupational Employment Statistics, CWRI
Schools offering training and number completing
No degree programs offered or required. Orderlies may receive short term on-the-job training.
Outlook
Projections data for orderlies are not broken out individually—they are included in ‘nursing aides, orderlies and attendants.’ For more information, see outlook for nursing attendants.
0.11
0.17
Maine USA
Orderlies per 1,000 Population, 2012

Healthcare Occupations Report | P a g e 201
Mental Health Professionals Summary Statistics
Workforce Characteristics
Clinical, Counseling and School
Psychologists
Child, Family & School Social
Workers
Healthcare Social
Workers
Mental Health &
Substance Abuse Social
Workers
Mental Health
Counselors
Substance Abuse and Behavior Disorder
Counselors
Employment (2012) 360 1,780 660 1,410 540 480
Employment per 1,000 population 0.27 1.34 0.50 1.06 0.41 0.36
versus U.S. Below avg. Above avg. Above avg. Above avg. Above avg. Above avg.
Average starting wage (Maine) $37,460 $31,500 $36,890 $31,990 $29,770 $31,030
Median annual wage (Maine) $58,770 $42,110 $45,630 $43,390 $43,340 $42,550
U.S. median annual wage $67,650 $41,530 $49,830 $39,980 $40,080 $38,520
Median wage for all occupations in Maine
$32,590 $32,590 $32,590 $32,590 $32,590 $32,590
Minimum Education Requirement
Doctoral or professional
degree
Bachelor's degree
Master's degree
Bachelor's degree
Master's degree
High School diploma or equivalent
Job Growth Projections 13% 0% 19% 8% 10% 4%
National Median Age* 47 42 42 42 43.9 43.9
Top Industry of Employment
Ambulatory Health Svcs.
Social Assistance,
Public Admin.
Hospitals, Social
Assistance
Ambulatory Health Svcs.,
Social Assistance
Ambulatory Health Svcs.
Ambulatory Health Svcs.
Licensing Board Board of
Examiners of Psychologist
State Board of Social
Worker Li-censure
State Board of Social
Worker Li-censure
State Board of Social
Worker Li-censure
State Board of Alcohol and Drug Counselors
State Board of Alcohol and Drug Counselors
*The median age for all social workers combined is 42. The median age for psychologists includes psychologists of all types.
The following profiles cover 6 occupations that provide mental health services. These are psychologist, social worker and counseling occupations that require (with one exception) at least a baccalaureate degree.

202 | P a g e
Key points
• Maine has 22 percent fewer clinical, counseling and school psychologists per thousand residents than the nation, and nearly 70 percent are over 50 years old. The number graduating from Maine programs with the doctoral credentials necessary to practice in the field is well below projected openings.
• Employment of healthcare social workers is expected to increase 19 percent in Maine, the fastest among the social worker and counseling occupations evaluated.
• Maine has more social workers and counselors per population compared to the nation, although the difference for healthcare social workers and mental health counselors is narrow. Distribution of employment in many of these occupations is concentrated around the large hospital centers. 70 and 69 percent of the healthcare and mental health and substance abuse social workers are employed in Cumberland, Penobscot and Androscoggin Counties.
19-3031 Clinical, Counseling and School Psychologists
Occupation description
Diagnose and treat mental disorders; learning disabilities; and cognitive, behavioral, and emotional problems, using individual, child, family, and group therapies. May design and implement behavior modification programs.
Illustrative examples: Child Psychologist, Geropsychologist, School Psychologist, Vocational Psychologist
Education requirements
Most clinical, counseling, and research psychologists need a doctoral degree. Psychologists can complete a Ph.D. in psychology or a Doctor of Psychology (Psy.D.) degree.
School psychologists need a master’s, specialist (Ed. S. degree, which requires a minimum of 60 graduate semester hours), or doctoral degree in school psychology. Because their work addresses education and mental health components of students’ development, school psychologists’ training includes coursework in both education and psychology.
Employment & Wages
In 2012 there were an estimated 360 clinical, counseling and school psychologists employed in Maine earning a median annual wage of $59,000, which was 13 percent below the national median of $67,650. Psychologists working in hospitals had wages 50 percent above the statewide average for the field. These employment figures are taken from OES and do not include the self-employed. According to employment projections data, which includes the self-employed, there were 522 clinical, school and counseling psychologists in 2010. As noted earlier in this report, creating employment estimates for occupations with high proportions of self-employment involve more subjectivity. Please see the discussion under ‘Data sets and limitations’ for more detail. Readers with access to different data sets may have more recent and different statistics.

Healthcare Occupations Report | P a g e 203
2012 Employment & Wage Statistics
Average Employment
Median Annual Salary
Maine 360 $58,770 Industries with Highest Share of Employment (% total) Ambulatory Health Care Services 42% $55,030 Educational Services 31% $58,700 Hospitals 11% $89,420 Social Assistance 8% $31,350 Source: 2012 Occupational Employment Statistics, CWRI
The number of psychologists practicing in Maine per thousand residents was 22 percent below the national average. Figures in the chart below include the self-employed.
Distribution of employment
CWRI has limited data on psychologist employment by county. With OES data we are able to account for 92 percent of the 360 employed practitioners in the state (some data is suppressed per BLS data quality requirements). This data does not include the self-employed.
0.39
0.50
Maine U.S.
Clinical, Counseling and School Psychologists per 1,000 Population
(including self-employed)

204 | P a g e
Distribution of Employment
Number Employed
Pct. (%) Total Employment
Pct. (%) of Total Maine Population
Number Employed per 1,000 Population
Androscoggin County 30 8% 8% 0.3 Aroostook County n/a n/a 5% Cumberland County 120 33% 21% 0.4 Franklin County n/a n/a 2% Hancock County 20 6% 4% 0.4 Kennebec County 40 11% 9% 0.3 Knox n/a n/a 3% Lincoln County n/a n/a 3% Oxford County 30 8% 4% 0.5 Penobscot County 30 8% 12% 0.2 Piscataquis County n/a n/a 1% Sagadahoc County n/a n/a 3% Somerset County n/a n/a 4% Waldo County n/a n/a 3% Washington County n/a n/a 2% York County 60 17% 15% 0.3 Maine 360 92% 100% 0.27 Source: CWRI analysis of OES & Census data Figures do not include the self-employed
Some data is suppressed according to BLS confidentiality and data quality requirements. Suppressed data is shown as “n/a” for not available.
Demographic, economic and social characteristics of the workforce
Note: The American Community Survey provides data for psychologists (SOC: 19-3030) which includes clinical, counseling and school psychologists as well as industrial psychologists. The following survey data includes all specializations of psychologist practitioners.
Demographic profile Maine’s psychologist workforce was 42 percent male and 58 percent female.
Demographic Characteristics of the Psychologist Population
Maine Total 1,055 Percent 100% Male 42% Female 58% Source: CWRI analysis of ACS 2006-2010 5 year file

Healthcare Occupations Report | P a g e 205
Age distribution 68 and 28 percent of Maine’s psychologists were above the age of 50 and 60, respectively. Nationally, 53 and 23 percent of the workforce were above these age levels.
Age Distribution, Psychologists (all types, including industrial and clinical, social and school)
Maine % MOE U.S. % MOE 16 to 39 years 120 12% 62 49,725 28% 1,418 40 to 44 years 105 11% 66 15,155 9% 841 45 to 49 years 95 10% 62 17,360 10% 769 50 to 54 years 200 20% 89 22,910 13% 956 55 to 59 years 185 19% 76 29,545 17% 1,062 60 to 69 years 265 27% 96 33,450 19% 1,095 70 years and over 15 2% 18 7,220 4% 505 Total 985 100% 175,365 100% Source: EEO Tabulation 2006-2010 ACS file, CWRI MOE = Margin of error
Schools offering training and number completing
The University of Maine and University of Southern Maine offer doctoral level programs in psychology. From 2009 to 2011, there were nine graduates per year from these programs, combined.
2 2
10
7
10
2007 2008 2009 2010 2011
Psychology Program Completers: Doctoral degrees

206 | P a g e
Education Programs & Annual Graduates
School CIP Code CIP Title
Completer Title 2007 2008 2009 2010 2011
Master's degrees
University of Maine 420101 Psychology, General
Master's Degree 3 5 5 4 3
Husson University 420601 Counseling Psychology
Master's Degree
1 2 4 2
Husson University 429999 Psychology, Other
Master's Degree
5 5
University of Southern Maine 421701
School Psychology
Master's Degree 6 7 8 9 2
University of Southern Maine 422806
Educational Psychology
Master's Degree
7 5 5
subtotal
9 13 22 27 17 Doctoral degrees
University of Maine 420101 Psychology, General
Doctor's Degrees 2 2 10 4 3
University of Southern Maine 422805
School Psychology
Doctor's Degrees
3 7
subtotal 2 2 10 7 10 Total 32 31 20 Source: IPEDS, CWRI
Outlook
Nationally, overall employment of clinical, counseling, and school psychologists is expected to grow 22 percent, faster than the average for all occupations. Greater demand for psychological services in schools, hospitals, mental health centers, and social services agencies should drive employment growth. In Maine, employment is expected to increase 13 percent, twice the rate expected for all occupations, but below the national rate largely due to lower population growth forecasts for this state (see the introduction of this report for more detail). Also, the overall growth forecast for Maine belies much stronger projected growth in self-employment of psychologists, which is expected to expand 24 percent.
Demand for clinical and counseling psychologists will increase as people continue to turn to psychologists to help solve or manage their problems. More psychologists will be needed to help people deal with issues such as depression and other mental disorders, marriage and family problems, job stress, and addiction. Psychologists also will be needed to provide services to an aging population, helping people deal with the mental and physical changes that happen as they grow older. Through both research and practice, psychologists are also helping other special groups, such as veterans suffering from war trauma, other trauma survivors, and individuals with autism.
Demand for psychologists in the health care industry is also expected to increase, because their work on teams with doctors, social workers, and other healthcare professionals provides patients with comprehensive, interdisciplinary treatments. In addition to treating mental and behavioral health issues, psychologists work on teams to develop or administer prevention or wellness programs.
As the overall number of students grows, more school psychologists will be needed to work with students, particularly those with special needs, learning disabilities, and behavioral issues. Schools also rely on school psychologists to assess and counsel students. Additionally, school psychologists will be needed to study how both in-school and out-of-school factors affect learning, which teachers and administrators can use to improve education.

Healthcare Occupations Report | P a g e 207
Job prospects should be best for those who have a doctoral degree in an applied specialty and those with a specialist or doctoral degree in school psychology. Because admission to psychology graduate programs is so selective, job opportunities for doctoral graduates are expected to be fair.
Candidates with a master’s degree will face competition for positions, and many master’s degree holders will find jobs in a related field outside of psychology.
In Maine, the majority of job opportunities will result from replacement needs. The national median age for this occupation is 47 and it is expected that over the coming decade, approximately half of all practicing in the field will retire or otherwise transition out of the occupation. If Maine’s psychologists retire at the same rate as that of the national workforce, 16 new psychologists per year will be required. Since Maine’s psychologist workforce is older than that of the nation (ACS data), it is possible that even higher numbers of practitioners retire, increasing the replacement need. In addition, practitioners will be required to fill anticipated openings resulting from new growth in demand. The number of graduates with doctoral degrees in psychology from Maine’s schools is below projected annual demand, highlighting the need for strategies to enhance supply.
Employment of Clinical, Counseling and School Psychologists in Maine, 2010 and Projected 2020
Average Employment Change in Employment (2010-2020) Projected Annual Openings
Resulting from New Growth 2010 2020 Net Percent
522 591 69 13% 7
Source: CWRI 2010-2020 Employment Projections
7
16
23
Growth Replacement Total
Projected Annual Job Openings, Clinical, Counseling and School Psychologists

208 | P a g e
Social Workers There are two main types of social workers: direct-service and clinical. The former helps people solve everyday problems and the latter diagnoses and treats mental, emotional and behavioral disorders.
Direct-service positions typically require a bachelor’s degree in social work or a related field, although in some circumstances a master’s degree is required. While a bachelor’s degree is sufficient for entry-level positions, an advanced degree is often the standard in education and healthcare settings. Clinical social workers must have a master’s degree in social work (MSW).
All states have licensure or certification requirements. According to the BLS, “Becoming a licensed clinical social worker usually requires a master’s degree in social work and 2 years or 3,000 hours of supervised clinical experience after graduation. After completing their supervised experience, clinical social workers must pass an exam to be licensed.”22 In Maine, licensure is governed by the State Board of Social Work-er Licensure. The following license types are available:
Licensed Social Worker (LSW), Conditional
This is an entry level social worker license requiring a bachelor’s degree that is “sufficiently related to social work or social welfare.” Those with a conditional license are working towards another level of licensure. A LSW conditional must obtain four hours per month of supervision.
Licensed Social Worker
An LSW must have a Bachelor of Social Work (BSW) degree. LSWs have a range of functions including gathering and assessing data, performing advocacy functions, formulating plans for clients, and supervising other LSWs and professionals. Those that have been licensed for two years or more are able to provide the consultation required by the LSW Conditional licenses to those licensees.
Licensed Master Social Worker (LMSW)
An LMSW requires a master or doctoral degree in social work or social welfare. According to the Board of Licensure, an LMSW “may perform all of the functions of the LSW License, engage in administration, research, consultation, social planning and teaching related to the functions of social work; engage in non-clinical private practice; and provide consultation required by the LSW and LSW Conditional Licenses.”23
Licensed Master Social Worker, Conditional Clinical
A master or doctoral degree in social work or social welfare is required. This license is for Master Social Workers who are engaged in clinical practice who have not yet completed the consultation hours required for the Licensed Clinical Social Worker.
Licensed Clinical Social Worker (LCSW)
22 Bureau of Labor Statistics, U.S. Department of Labor, Occupational Outlook Handbook, 2012-13 Edition, Social Workers, on the Internet at http://www.bls.gov/ooh/community-and-social-service/social-workers.htm (visited November 18, 2013).
23 Office of Professional and Occupational Regulation, Maine Department of Professional & Financial Regulation, State Board of Social Worker Licensure, on the Internet at http://www.maine.gov/pfr/professionallicensing/professions/social_workers/lm.htm

Healthcare Occupations Report | P a g e 209
According to the board of licensure, an LCSW may engage in the practice of clinical social work. A master or doctoral degree in social work or social welfare is required.24
Social workers typically have an area of focus, such as a specific population group or work place setting. There are child and family social workers, school social workers, healthcare social workers and those specializing in mental health and substance abuse. These types of social workers are profiled below. Note that the SOC combines child and family social workers with school social workers.
21-1021 Child, Family and School Social Workers
Occupation description
Provide social services and assistance to improve the social and psychological functioning of children and their families and to maximize the family well-being and the academic functioning of children. May assist parents, arrange adoptions, and find foster homes for abandoned or abused children. In schools, they address such problems as teenage pregnancy, misbehavior, and truancy. May also advise teachers.
Illustrative examples: Certified Children, Youth, and Family Social Worker; Child Abuse Worker; Foster Care Worker
Education requirements
Bachelor’s degree in a related field or in social work. Licensure is governed by the State Board of Social Worker Licensure.
Employment & Wages
2012 Employment & Wage Statistics
Average Employment
Median Annual Salary
Maine 1,780 $42,110 Industries with Highest Share of Employment (% total) Social Assistance 30% $34,340 Public Administration 29% $44,960 Educational Services 22% $51,800 Nursing and Residential Care Facilities 10% $43,000 Source: 2012 Occupational Employment Statistics, CWRI
24 Excerpts from the Office of Professional and Occupational Regulation, Maine Department of Professional & Financial Regu-lation, State Board of Social Worker Licensure, on the Internet at http://www.maine.gov/pfr/professionallicensing/professions/social_workers/license_types.htm

210 | P a g e
Distribution of employment
Distribution of Employment
Number Employed
Pct. (%) Total Employment
Pct. (%) of Total Maine Population
Number Employed per 1,000 Population
Androscoggin County 280 16% 8% 2.6 Aroostook County 130 7% 5% 1.8 Cumberland County 490 28% 21% 1.7 Franklin County n/a n/a 2% Hancock County n/a n/a 4% Kennebec County 330 19% 9% 2.7 Knox County n/a n/a 3% Lincoln County n/a n/a 3% Oxford County 30 2% 4% 0.5 Penobscot County 200 11% 12% 1.3 Piscataquis County n/a n/a 1% Sagadahoc County 20 1% 3% 0.6 Somerset County 110 6% 4% 2.1 Waldo County n/a n/a 3% Washington County 70 4% 2% 2.2 York County 40 2% 15% 0.2 Maine 1,780 96% 100% 1.3 Source: CWRI analysis of OES & Census data
Some data is suppressed according to BLS confidentiality and data quality requirements. Suppressed data is shown as “n/a” for not available.
1.34
0.87
Maine U.S.
Child, Family and School Social Workers per 1,000 Population, 2012

Healthcare Occupations Report | P a g e 211
Schools offering training and number completing
3 schools offered bachelor degrees in social work: The University of Maine, University of Southern Maine (USM) and University of Maine at Presque Isle. USM, University of Maine and UNE offered master’s programs. Bachelor’s degrees represent approximately 40 percent of total credentials awarded each year.
Education Programs & Annual Graduates
School CIP Code
CIP Title
Completer Title 2007 2008 2009 2010 2011
Bachelor degrees
University of Maine at Presque Isle 440701 Social Work
Bachelor's Degree 13 9 17 10 13
University of Southern Maine 440701 Social Work
Bachelor's Degree 47 46 32 37 51
University of Maine 440701 Social Work Bachelor's Degree 33 29 25 18 29
subtotal
93 84 74 65 93 Master's degrees
University of Southern Maine 440701 Social Work
Master's Degree 27 31 20 25 34
University of Maine 440701 Social Work Master's Degree 50 53 31 34 58
University of New England 440701 Social Work
Master's Degree 68 54 44 66 48
subtotal
145 138 95 125 140 Doctoral degrees
University of Maine 440701 Social Work Doctor's Degrees 1 0 0 0 0
Total 239 222 169 190 233 Source: IPEDS, CWRI
93
84 74
65
93
2007 2008 2009 2010 2011
Credentials awarded in social work

212 | P a g e
Outlook
Nationally, employment of child, family, and school social workers is expected to grow by 20 percent from 2010 to 2020, faster than the average for all occupations. In Maine, growth in this occupation is expected to be flat, below that of the nation in part due to lower projected population growth rates. Despite limited growth in new demand, a number of job opportunities will be available due to existing workers retiring or transitioning out of the occupation.
Nationally, demand for child and family social workers should continue to grow because they will be needed to investigate child abuse cases and to place children in foster care and with adoptive families. However, growth in this occupation may be limited by budget constraints at all levels of government. In schools, more social workers will be needed to respond to rising student enrollments. The availability of federal, state, and local funding will be a major factor in determining the actual employment growth in schools.
Employment of Child, Family & School Social Workers in Maine 2010 and Projected 2020
Average Employment Change in Employment (2010-2020)
Projected Annual Openings Resulting from New Growth
2010 2020 Net Percent
1,606 1,607 1 0% 0
Source: CWRI 2010-2020 Employment Projections
0
38 38
Growth Replacement Total
Projected Annual Job Openings, Child, Family and School Social Workers
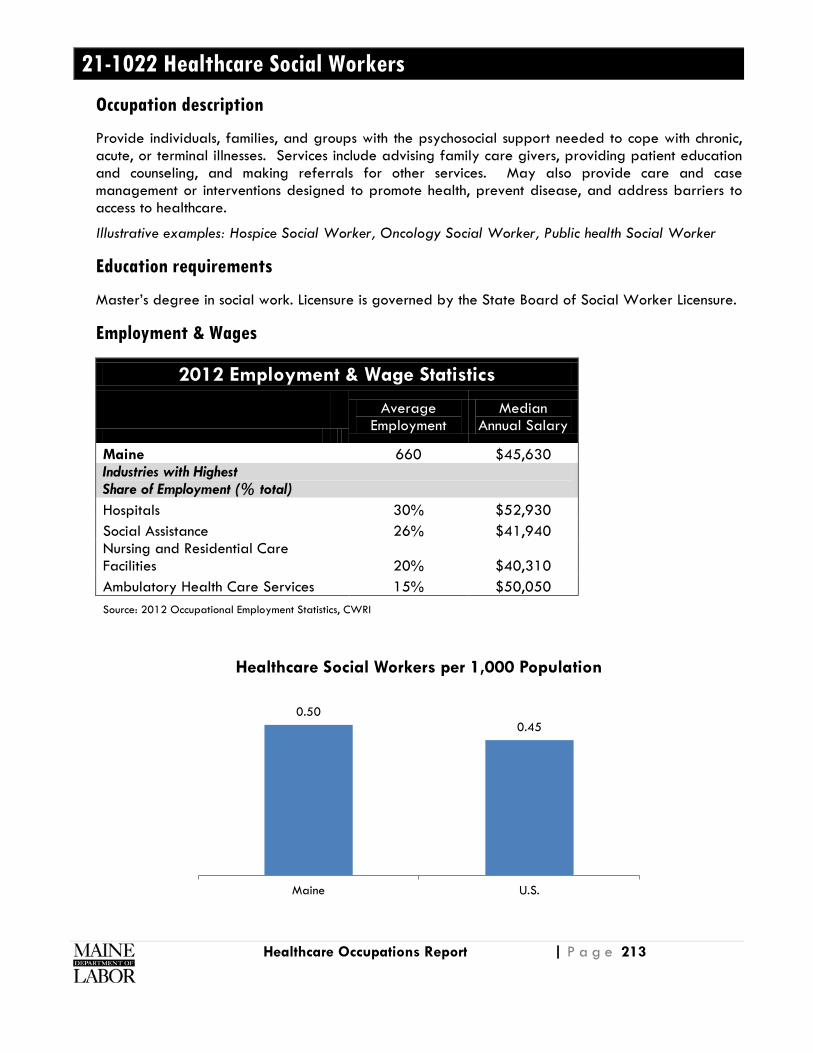
Healthcare Occupations Report | P a g e 213
21-1022 Healthcare Social Workers
Occupation description
Provide individuals, families, and groups with the psychosocial support needed to cope with chronic, acute, or terminal illnesses. Services include advising family care givers, providing patient education and counseling, and making referrals for other services. May also provide care and case management or interventions designed to promote health, prevent disease, and address barriers to access to healthcare.
Illustrative examples: Hospice Social Worker, Oncology Social Worker, Public health Social Worker
Education requirements
Master’s degree in social work. Licensure is governed by the State Board of Social Worker Licensure.
Employment & Wages
2012 Employment & Wage Statistics
Average Employment
Median Annual Salary
Maine 660 $45,630 Industries with Highest Share of Employment (% total) Hospitals 30% $52,930 Social Assistance 26% $41,940 Nursing and Residential Care Facilities 20% $40,310 Ambulatory Health Care Services 15% $50,050 Source: 2012 Occupational Employment Statistics, CWRI
0.50 0.45
Maine U.S.
Healthcare Social Workers per 1,000 Population

214 | P a g e
Distribution of employment
Distribution of Employment
Number Employed
Pct. (%) Total Employment
Pct. (%) of Total Maine Population
Number Employed per 1,000 Population
Androscoggin County 70 11% 8% 0.65 Aroostook County 30 5% 5% 0.42 Cumberland County 220 33% 21% 0.77 Franklin County 20 3% 2% 0.65 Hancock County n/a n/a 4% Kennebec County 70 11% 9% 0.57 Knox County n/a n/a 3% Lincoln County n/a n/a 3% Oxford County n/a n/a 4% Penobscot County 170 26% 12% 1.11 Piscataquis County n/a n/a 1% Sagadahoc County n/a n/a 3% Somerset County 30 5% 4% 0.58 Waldo County n/a n/a 3% Washington County n/a n/a 2% York County 30 5% 15% 0.15 Maine 660 97% 100% 0.50 Source: CWRI analysis of OES & Census data
Some data is suppressed according to BLS confidentiality and data quality requirements. Suppressed data is shown as “n/a” for not available.
Schools offering training and number completing
The University of Maine, University of Southern Maine and University of New England offer master’s level programs in social work. In 2011, 140 graduated with from these programs.
145
138
95
125 140
2007 2008 2009 2010 2011
Credentials awarded in social work: master's degrees

Healthcare Occupations Report | P a g e 215
Education Programs & Annual Graduates School CIP Code CIP Title Completer Title 2007 2008 2009 2010 2011 Master's degrees University of Southern Maine 440701
Social Work Master's Degree 27 31 20 25 34
University of Maine 440701
Social Work Master's Degree 50 53 31 34 58
University of New England 440701
Social Work Master's Degree 68 54 44 66 48
subtotal
145 138 95 125 140 Doctoral degrees University of Maine 440701
Social Work Doctor's Degrees 1 0 0 0 0
Total 146 138 95 125 140 Source: IPEDS, CWRI
Outlook
Nationally, employment of healthcare social workers is expected to grow by 34 percent, much faster than the average for all occupations. As the population ages the incidence of chronic disease and illnesses per population rises, demand for healthcare social workers will rise.
In Maine, employment is expected to increase 19 percent, above the 6 percent growth expected for all occupations statewide.
Nearly 30 job opportunities per year are projected, with most of these resulting from replacement needs.
Employment of Healthcare Social Workers in Maine 2010 and Projected 2020
Average Employment Change in Employment (2010-2020)
Projected Annual Openings Resulting from New Growth
2010 2020 Net Percent
665 788 123 18% 12
Source: CWRI 2010-2020 Employment Projections

216 | P a g e
12
16
28
Growth Replacement Total
Projected Annual Job Openings, Healthcare Social Workers

Healthcare Occupations Report | P a g e 217
21-1023 Mental Health and Substance Abuse Social Workers
Occupation description
Assess and treat individuals with mental, emotional, or substance abuse problems, including abuse of alcohol, tobacco, and/or other drugs. Activities may include individual and group therapy, crisis intervention, case management, client advocacy, prevention, and education.
Illustrative examples: Community Mental Health Social Worker, Drug Abuse Social Worker, Psychiatric Social Worker
Education requirements
Bachelor’s degree in a related field or in social work. Licensure is governed by the State Board of Social Worker Licensure.
Employment & Wages
2012 Employment & Wage Statistics
Average Employment
Median Annual Salary
Maine 1,410 $43,390 Industries with Highest Share of Employment (% total) Ambulatory Health Care Services 26% $44,510 Social Assistance 23% $42,010 Nursing and Residential Care Facilities 16% $39,570 Hospitals 15% $44,280 Source: 2012 Occupational Employment Statistics, CWRI
1.06
0.35
Maine U.S.
Mental Health and Substance Abuse Social Workers per 1,000 Population

218 | P a g e
Distribution of employment
Distribution of Employment
Number Employed
Pct. (%) Total Employment
Pct. (%) of Total Maine Population
Number Employed per 1,000 Population
Androscoggin County 180 13% 8% 1.67 Aroostook County 60 4% 5% 0.85 Cumberland County 480 34% 21% 1.69 Franklin County n/a n/a 2% Hancock County n/a n/a 4% Kennebec County 210 15% 9% 1.72 Knox County n/a n/a 3% Lincoln County n/a n/a 3% Oxford County n/a n/a 4% Penobscot County 310 22% 12% 2.02 Piscataquis County n/a n/a 1% Sagadahoc County n/a n/a 3% Somerset County n/a n/a 4% Waldo County n/a n/a 3% Washington County n/a n/a 2% York County 70 5% 15% 0.35 Maine 1,410 93% 100% 1.06 Source: CWRI analysis of OES & Census data
Some data is suppressed according to BLS confidentiality and data quality requirements. Suppressed data is shown as “n/a” for not available.
Schools offering training and number completing
The University of Maine, University of Maine at Presque Isle and University of Southern Maine offered bachelor degree programs in social work. In 2011, 93 students graduated from these programs. Although not required for entry into the occupation, graduate level programs are also available in Maine.

Healthcare Occupations Report | P a g e 219
Education Programs & Annual Graduates School CIP Code CIP Title Completer Title 2007 2008 2009 2010 2011
Bachelor degrees University of Maine at Presque Isle 440701 Social Work Bachelor's Degree 13 9 17 10 13 University of Southern Maine 440701 Social Work Bachelor's Degree 47 46 32 37 51 University of Maine 440701 Social Work Bachelor's Degree 33 29 25 18 29 subtotal
93 84 74 65 93
Master's degrees University of Southern Maine 440701 Social Work Master's Degree 27 31 20 25 34 University of Maine 440701 Social Work Master's Degree 50 53 31 34 58
University of New England 440701 Social Work Master's Degree 68 54 44 66 48 subtotal
145 138 95 125 140
Doctoral degrees University of Maine 440701 Social Work Doctor's Degrees 1 0 0 0 0 Total 239 222 169 190 233
Source: IPEDS, CWRI
Outlook
Nationally, employment of mental health and substance abuse social workers is expected to grow by 31 percent, much faster than the average for all occupations. In Maine, 8 percent growth is expected over the same period, slightly above the 6 percent growth expected for all occupations.
Growth is expected as more people seek treatment for mental illness and addiction. In addition, drug offenders are increasingly being sent to treatment programs rather than to jail. As a result, use of substance abuse treatment programs is expected to grow, increasing demand for mental health and substance abuse social workers.
Approximately 50 job opportunities are expected annually in Maine, with the majority of these resulting from the need to replace existing practitioners that will retire or transition out of the occupation.
93
84 74
65
93
2007 2008 2009 2010 2011
Credentials awarded in social work: bachelor's degrees

220 | P a g e
Employment of Mental Health and Substance Abuse Social Workers in Maine, 2010 and Projected 2020
Average Employment Change in Employment (2010 - 2020)
Projected Annual Openings Resulting from New Growth
2010 2020 Net Percent
1,607 1,737 130 8% 13
Source: CWRI 2010-2020 Employment Projections
13
38
51
Growth Replacement Total
Projected Annual Job Openings, Mental Health & Substance Abuse Social Workers

Healthcare Occupations Report | P a g e 221
21-1014 Mental Health Counselors
Occupation description
Counsel with emphasis on prevention. Work with individuals and groups to promote optimum mental and emotional health. May help individuals deal with issues associated with addictions and substance abuse; family, parenting, and marital problems; stress management; self-esteem; and aging. Excludes “Social Workers" (21-1021 through 21-1029), "Psychiatrists" (29-1066), and "Psychologists" (19-3031 through 19-3039).
Illustrative examples: Licensed Clinical Mental Health Counselor (LCMHC), Licensed Mental Health Counselor (LMHC)
Education requirements
A master’s degree in social work is the minimum education requirement. Licensure is required and governed by the State Board of Alcohol and Drug Counselors. Licensure requires a master’s degree and 2,000 to 4,000 hours of supervised clinical experience. In addition, counselors must pass a state-recognized exam and complete annual continuing education classes.25
In Maine, two types of counseling licenses are available: Licensed Clinical Professional Counselor (LCPC) and Licensed Professional Counselor (LPC). The LCPC is a clinical license which gives one the ability to diagnose and treat mental health disorders. The LPC is a non-clinical license, but and LPC is still permitted to engage in private practice.
According to the State Board of Alcohol and Drug Counselors, there are three ways to meet the educational requirements for the LCPC license, including the successful completion of a master’s program in mental health counseling and a doctoral degree in clinical or counseling psychology.26
Employment & Wages
2012 Employment & Wage Statistics
Average Employment
Median Annual Salary
Maine 540 $43,340 Industries with Highest Share of Employment (% total) Ambulatory Health Care Services 46% $43,210 Social Assistance 22% $45,550 Nursing and Residential Care Facilities 17% $31,140 Hospitals 11% $44,020 Source: 2012 Occupational Employment Statistics, CWRI
25 Bureau of Labor Statistics, U.S. Department of Labor, Occupational Outlook Handbook, 2012-13 Edition, Mental Health Counselors and Marriage and Family Therapists, on the Internet at http://www.bls.gov/ooh/community-and-social-service/mental-health-counselors-and-marriage-and-family-therapists.htm (visited December 19, 2013).
26 More information on counseling licenses is available at http://www.maine.gov/pfr/professionallicensing/professions/counselors/license_types.htm

222 | P a g e
Distribution of employment
Distribution of Employment
Number Employed
Pct. (%) Total Employment
Pct. (%) of Total Maine Population
Number Employed per 1,000 Population
Androscoggin County n/a n/a 8% Aroostook County n/a n/a 5% Cumberland County 200 37% 21% 0.7 Franklin County n/a n/a 2% Hancock County n/a n/a 4% Kennebec County 60 11% 9% 0.5 Knox n/a n/a 3% Lincoln County n/a n/a 3% Oxford County n/a n/a 4% Penobscot County 80 15% 12% 0.5 Piscataquis County n/a n/a 1% Sagadahoc County n/a n/a 3% Somerset County n/a n/a 4% Waldo County 20 4% 3% 0.5 Washington County n/a n/a 2% York County n/a n/a 15% Maine 540 67% 100% 0.41 Source: CWRI analysis of OES & Census data
Some data is suppressed according to BLS confidentiality and data quality requirements. Suppressed data is shown as “n/a” for not available.
0.41 0.37
Maine U.S.
Mental Health Counselors per 1,000 Population, 2012

Healthcare Occupations Report | P a g e 223
Schools offering training and number completing
The University of Maine, University of Southern Maine and University of New England offer master’s level programs in social work. In 2011, 140 graduated from these programs.
Education Programs & Annual Graduates School CIP Code CIP Title Completer Title 2007 2008 2009 2010 2011 Master's degrees University of Southern Maine 440701 Social Work Master's Degree 27 31 20 25 34 University of Maine 440701 Social Work Master's Degree 50 53 31 34 58 University of New England 440701 Social Work Master's Degree 68 54 44 66 48 subtotal
145 138 95 125 140
Doctoral degrees University of Maine 440701 Social Work Doctor's Degrees 1 0 0 0 0 Total 146 138 95 125 140 Source: IPEDS, CWRI
Outlook
In Maine, employment of mental health counselors is expected to grow 10 percent from 2010 to 2020. However, the majority of job opportunities are expected to arise from replacement openings.
Employment of Mental Health Counselors in Maine 2010 and Projected 2020
Average Employment Change in Employment (2010-2020)
Projected Annual Openings Resulting from New Growth
2010 2020 Net Percent
598 656 58 10% 6
Source: CWRI 2010-2020 Employment Projections
145 138
95 125
140
2007 2008 2009 2010 2011
Credentials awarded in social work: master's degrees
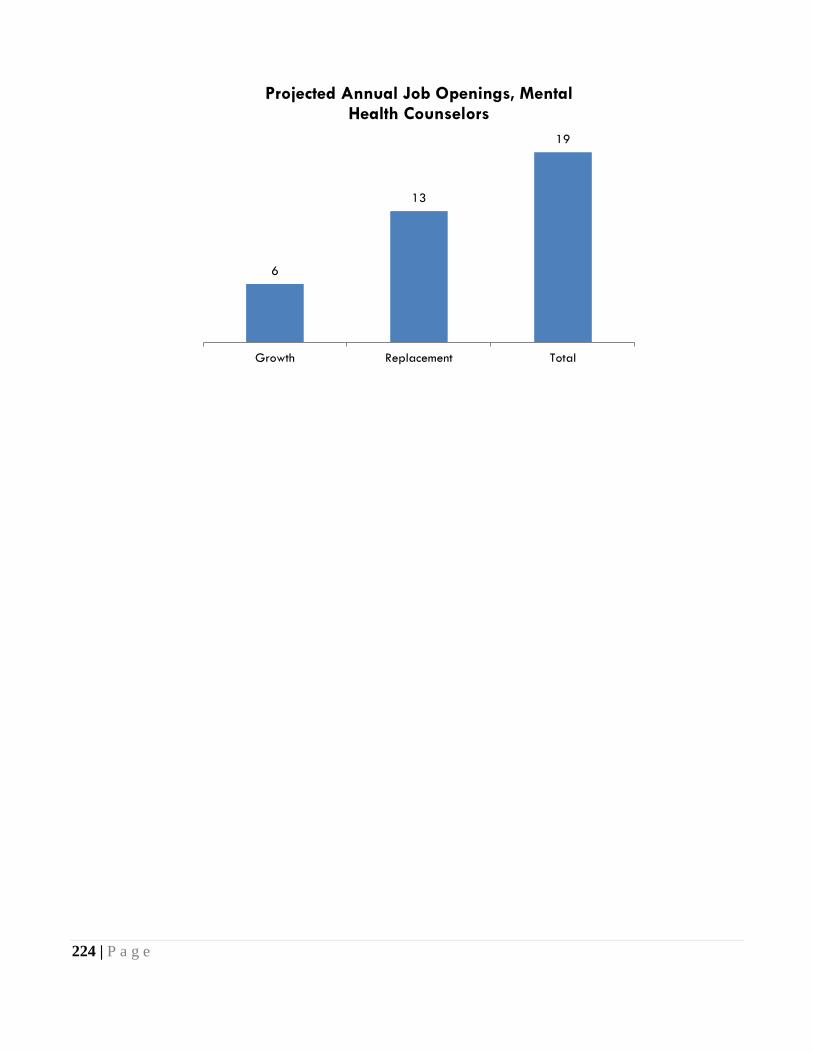
224 | P a g e
6
13
19
Growth Replacement Total
Projected Annual Job Openings, Mental Health Counselors

Healthcare Occupations Report | P a g e 225
21-1011 Substance Abuse and Behavioral Disorder Counselors
Occupation description
Counsel and advise individuals with alcohol, tobacco, drug, or other problems, such as gambling and eating disorders. May counsel individuals, families, or groups or engage in prevention programs. Excludes “Social Workers" (21-1021 through 21-1029), "Psychologists" (19-3031 through 19-3039), and "Mental Health Counselors" (21-1014) providing these services.
Illustrative examples: Addiction Counselor, Alcohol and Drug Counselor, Chemical Dependency Counselor
Education requirements
Educational requirements range from a high school diploma to a master’s degree, depending on the setting, type of work and level of responsibility. While graduation from a high school or its equivalent is the minimum requirement, workers with more education are able to provide more services to their clients, such as private one-on-one counseling sessions, and they require less supervision than those with less education.
Licensing is governed by the State Board of Alcohol and Drug Counselors. Barring the exemptions noted in subsection 6206 of Title 32, chapter 81, all substance abuse and behavioral disorder counselors must be licensed.
Employment & Wages
2012 Employment & Wage Statistics
Average Employment
Median Annual Salary
Maine 480 $42,550 Industries with Highest Share of Employment (% total) Ambulatory Health Care Services 67% $40,180 Hospitals 15% $49,860 Educational Services 4% $44,140 Social Assistance 4% $44,640 Source: 2012 Occupational Employment Statistics, CWRI

226 | P a g e
Distribution of employment
Distribution of Employment
Number Employed
Pct. (%) Total Employment
Pct. (%) of Total Maine Population
Number Employed per
1,000 Population
Androscoggin County n/a n/a 8% Aroostook County n/a n/a 5% Cumberland County 50 10% 21% 0.2 Franklin County n/a n/a 2% Hancock County 30 6% 4% 0.5 Kennebec County 80 17% 9% 0.7 Knox County n/a n/a 3% Lincoln County n/a n/a 3% Oxford County n/a n/a 4% Penobscot County n/a n/a 12% Piscataquis County n/a n/a 1% Sagadahoc County n/a n/a 3% Somerset County n/a n/a 4% Waldo County n/a n/a 3% Washington County n/a n/a 2% York County 20 4% 15% 0.1 Maine 480 38% 100% 0.36 Source: CWRI analysis of OES & Census data
Some data is suppressed according to BLS confidentiality and data quality requirements. Suppressed data is shown as “n/a” for not available.
Schools offering training and number completing
Graduation from a high school or its equivalent is the minimum education requirement.
0.36
0.26
Maine U.S.
Substance Abuse and Behavioral Disorder Counselors per 1,000 Population

Healthcare Occupations Report | P a g e 227
Outlook
Nationally, employment of substance abuse and behavioral disorder counselors is expected to grow by 27 percent from 2010 to 2020, faster than the average for all occupations. Growth is expected as more people seek treatment for their addictions or other behaviors and drug offenders are increasingly sentenced to treatment rather than jail time.
In recent years, the criminal justice system has recognized that people committing crimes related to drugs are less likely to offend again if they get treatment for addiction. As a result, sentences for drug offenders often include treatment programs. This practice is expected to increase the use of substance abuse treatment programs and the demand for addiction counselors.
Also, over the projections period, more people are expected to seek treatment for problems with addiction or other problems. As the population grows, the number of individuals entering therapy is expected to increase as well. This is expected to cause a continued demand for counselors in mental health centers, halfway houses, and detox centers.
In Maine, employment of substance abuse and behavioral disorder counselors is expected to grow by four percent from 2010 to 2020. Most of the employment opportunities are expected to arise from the need to replace currently practicing workers that exit the field.
Employment of Substance Abuse and Behavioral Counselors in Maine, 2010 and Projected 2020
Average Employment Change in Employment (2010-2020)
Projected Annual Openings Resulting from New Growth
2010 2020 Net Percent
397 414 17 4% 2
Source: CWRI 2010-2020 Employment Projections
2
8 10
Growth Replacement Total
Projected Annual Job Openings, Substance Abuse and Behavioral Disorder
Counselors

228 | P a g e
Other Healthcare Occupations Summary Statistics
Workforce Characteristics
Athletic Trainers
Massage Therapists
Health Diagnosing and Treating
Practitioners, AO
Medical Records and Health
Info Technicians
Employment (2012) 130 430 70 1,120
Employment per 1,000 population 0.10 0.32 0.05 0.84
versus U.S. Above avg. Above avg. Below avg. Above avg. Average starting wage (Maine) $34,890 $25,610 $46,330 $24,930
Median annual wage (Maine) $44,160 $36,760 $67,870 $32,180
U.S. median annual wage $42,090 $35,970 $85,470 $34,160
Median wage for all occupations in Maine $32,590 $32,590 $32,590 $32,590
Minimum Education Requirement
Bachelor's Degree
Postsecondary non-degree award Master's degree Postsecondary
non-degree award
Job Growth Projections 19% 10% 16% 17%
National Median Age n/a 40.4 n/a 45.7 Top Industry of Employment Educational Svcs. Personal and
Laundry Services Hospitals Hospitals
Licensing Board
Athletic Trainers Program, Office of Professional and Occupational Regulation
Massage Therapy Program, Office of Professional and Occupational Regulation
Board of Complementary Health Care Providers*
No license required; Professional certification available
*For acupuncturists and naturopathic physicians
29-9091 Athletic Trainers
Occupation description
Evaluate and advise individuals to assist recovery from or avoid athletic-related injuries or illnesses, or maintain peak physical fitness. May provide first aid or emergency care.
Illustrative example: Certified Athletic Trainer

Healthcare Occupations Report | P a g e 229
Education requirements
Athletic trainers need at least a bachelor’s degree, although both bachelor’s and master’s degrees are common. In most states, athletic trainers need a license or certification; requirements vary by state. In Maine, athletic trainers must have passed the National Athletic Trainers' Association Board of Certification examination or be currently certified by the National Athletic Trainers' Association. Athletic trainers renew their license annually.
For most jobs, athletic trainers need a bachelor's degree in athletic training from an accredited college or university; however, master’s degrees are also common. The Commission on Accreditation of Athletic Training Education (CAATE) accredits most programs. All programs have both classroom and clinical components. Courses include science and health-related courses, such as anatomy, physiology, nutrition, and biomechanics.
Athletic trainers may need a higher degree to be eligible for some positions, especially trainers in colleges and universities, or to increase their advancement opportunities.
High school students interested in athletic trainer programs should take courses in anatomy, physiology, and physics.
Employment & Wages
2012 Employment & Wage Statistics
Average Employment
Median Annual Salary
Maine 130 $44,160 Industries with Highest Share of Employment (% total) Educational Services 54% $43,960 Ambulatory Health Care Services n/a $44,900 Hospitals 8% n/a Source: 2012 Occupational Employment Statistics, CWRI
Schools offering training and number completing
According to IPEDS, three schools offer bachelor degree programs in athletic training: The University of Southern Maine, The University of Maine at Presque Isle and The University of New England. The University of Maine at Orono also lists an undergraduate program in athletic training on the
0.10
0.07
Maine U.S.
Athletic Trainers per 1,000 Population

230 | P a g e
university website but we could not find data on this in IPEDS, and the university did not respond to our request for information on the program.
Education Programs & Annual Graduates
School CIP Code
CIP Title
Completer Title 2007 2008 2009 2010 2011
University of Southern Maine 510913
Athletic Training/ Trainer
Bachelor's Degree 4 3 12 11 17
University of Maine at Presque Isle 510913
Athletic Training/ Trainer
Bachelor's Degree 8 5 4 11 9
University of New England 510913
Athletic Training/ Trainer
Bachelor's Degree 7 19 15 16 6
Total 19 27 31 38 32 Source: IPEDS, CWRI
Outlook
Nationally, employment of athletic trainers is expected to grow by 30 percent from 2010 to 2020, much faster than the average for all occupations. In Maine, 19 percent growth is expected, which is well above the 6 percent growth expected for all occupations statewide. However, because this is a small occupation, the fast growth will result in only about 25 new jobs over the 10-year period. In addition, another 40 job opportunities are expected due to replacement openings. In total, 6 job opportunities are expected per year.
As people become more aware of sports-related injuries at a young age, demand for athletic trainers is expected to increase, most significantly in schools and youth leagues. New research reveals that the effects of concussions are particularly severe and long lasting in child athletes. Although concussions are dangerous to athletes at any age, children’s brains are still developing and are at risk for permanent complications, such as fatal brain swelling and learning disabilities. Parents and coaches are becoming educated about these greater risks through community health efforts. Because athletic trainers are usually on site with athletes and are often the first line of defense when injuries occur, the demand for trainers should continue to increase.
19
27
31
38
32
2007 2008 2009 2010 2011
Athletic Trainer Program Completers

Healthcare Occupations Report | P a g e 231
Additionally, advances in injury prevention and detection and more sophisticated treatments are projected to increase the demand for athletic trainers. Growth in an increasingly active middle-aged and elderly population will likely lead to an increased incidence of athletic-related injuries, such as sprains. Sports programs at all ages and for all experience levels will continue to create demand for athletic trainers.
Insurance and workers’ compensation costs have become a concern for many employers and insurance companies, especially in areas where employees are often injured on the job. For example, military bases hire athletic trainers to help train military personnel in how to properly lift items or to create training programs aimed at keeping injury rates down. More insurance companies are recognizing athletic trainers as healthcare providers and are reimbursing the cost of an athletic trainer’s services.
For Maine, six job opportunities are expected each year, two from new growth and four from replacement needs.
Employment of Athletic Trainers in Maine 2010 and Projected 2020
Average Employment Change in Employment (2010-2020)
Projected Annual Openings Resulting from New Growth 2010 2020 Net Percent
124 147 23 19% 2 Source: CWRI 2010-2020 Employment Projections
2
4
6
Growth Replacement Total
Projected Annual Job Openings, Athletic Trainers

232 | P a g e
31-9011 Massage Therapists
Occupation description
Perform therapeutic massages of soft tissues and joints. May assist in the assessment of range of motion and muscle strength, or propose client therapy plans.
Illustrative examples: Deep Tissue Massage Therapist, Licensed massage Therapist, Swedish Masseuse
Education requirements
Massage therapists typically complete a postsecondary education program that can require 500 hours or more of study and experience, although standards and requirements vary greatly by state and locality. Most states regulate massage therapy and require massage therapists to have a license or certificate. In Maine, the minimum requirements for licensure are the successful completion of the examination sponsored by the National Certification Board for Therapeutic Massage and Bodywork or the Federation of State Massage Therapy Boards or their successor or other organizations approved by the Department of Professional and Financial Regulation; or completion of a course of training consisting of 500 or more hours of supervised classroom and clinical instruction. Applicants must be 18 or older and possess a high school diploma or its equivalent.
According the Department of Professional Regulation, applicants intending to meet the academic requirements for licensure by passing a national examination may choose, at their own risk, to use distance learning options in preparation for the NCBTMB or the MBLEx.
Employment & Wages
2012 Employment & Wage Statistics
Average Employment Median Annual
Salary Maine 430 $36,760 Industries with Highest Share of Employment (% total) Personal and Laundry Services 47% $34,240 Ambulatory Health Care Services 40% $36,980 Accommodation 12% $60,610 Source: 2012 Occupational Employment Statistics, CWRI

Healthcare Occupations Report | P a g e 233
Schools offering training and number completing
The Department of Professional and Financial Regulation provides a list of approved massage therapy programs. The list is reviewed and amended periodically. Current approved programs are listed below.
• Acadia School of Massage, www.acadiaschoolofmassage.com
• Downeast School of Massage, www.downeastschoolofmassage.net
• Kennebec Valley Community College Massage Therapy Program, www.kvcc.me.edu
• New Hampshire Institute for Therapeutic Arts, www.nhita.com
• Seacoast Career Schools Massage Therapy Certificate Program, www.seacoastcareerschools.edu
• Spa Tech Institute Therapeutic Massage Program & Spa Tech Institute Holistic Massage Program, www.spatech.edu
• Therapeutic Bodywork Learning Center, www.mainemassageschool.com
Completer data available from IPEDS does not include all the programs listed above (see the table below). As noted earlier in this report, only schools that participate in federal student loan programs are required to submit completer data to IPEDS.
0.32
0.23
Maine U.S.
Massage Therapists per 1,000 Population, 2012
133
154 144
116
153
2007 2008 2009 2010 2011
Massage Therapist Program Completers

234 | P a g e
Education Programs & Annual Graduates School CIP Code CIP Title Completer Title 2007 2008 2009 2010 2011 Spa Tech Institute – Westbrook
513501
Massage Therapy/ Therapeutic Massage
Post-Sec. Awards/ Cert./Diplomas; < 1 yr.
58
74
81
59
88 Pierre's School of Cosmetology
513501
Massage Therapy/ Therapeutic Massage
Post-Sec. Awards/ Cert./Diplomas; < 1 yr.
27
27
Empire Beauty School-Maine
513501
Massage Therapy/ Therapeutic Massage
Post-Sec. Awards/ Cert./Diplomas; < 1 yr.
7
Intercoast Career Institute
513501
Massage Therapy/ Therapeutic Massage
Post-Sec. Awards/ Cert./Diplomas; 1-2 yrs.
4
12
Kennebec Valley Community College
513501
Massage Therapy/ Therapeutic Massage
Post-Sec. Awards/ Cert./Diplomas; 1-2 yrs.
5
11
3
5 Seacoast Career Schools – Sanford Campus
513501
Massage Therapy/ Therapeutic Massage
Post-Sec. Awards/ Cert./Diplomas; 1-2 yrs.
44
36
45
54
60
Total 133 154 144 116 153 Source: IPEDS, CWRI
Outlook
Nationally, employment of massage therapists is expected to grow by 20 percent from 2010 to 2020, faster than the average for all occupations. Continued growth in the demand for massage services will lead to new openings for massage therapists. In Maine, employment is projected to increase 10 percent.
The number of spas, which employ a large number of therapists, has increased in recent years. The number of massage clinic franchises has also been increasing, many of which offer more affordable massages than those at spas and resorts, making them available to a wider range of customers.
In addition, as an increasing number of states adopt licensing requirements and standards for therapists, the practice of massage is likely to be respected and accepted by more people as a way to treat pain and to improve overall wellness.
Massage also offers specific benefits to particular groups of people, whose continued demand for massage services will lead to overall growth for the occupation. For example, as workplaces try to distinguish themselves as employee-friendly, providing professional in-office, seated massages for employees is becoming a popular on-the-job benefit.
Older people in nursing homes or assisted-living facilities also are finding benefits from massage, such as increased energy levels and reduced health problems. Demand for massage therapy should grow among older age groups because they increasingly are enjoying longer, more active lives.
Job Prospects
In states that regulate massage therapy, opportunities should be available to those who complete formal training programs and pass a professionally recognized exam. However, new massage

Healthcare Occupations Report | P a g e 235
therapists should expect to work only part time in spas, hotels, hospitals, physical therapy centers, and other businesses until they can build their own client base.
Because referrals are a very important source of work for massage therapists, networking will increase the number of job opportunities. Joining a professional association also can help build strong contacts and further increase the likelihood of steady work.
In total, 31 job openings are projected each year for Maine, 12 from new growth and 19 from replacement needs.
Employment of Massage Therapists in Maine 2010 and Projected 2020
Average Employment Change in Employment (2010-2020)
Projected Annual Openings Resulting from New Growth
2010 2020 Net Percent
1,176 1,297 121 10% 12
Source: CWRI 2010-2020 Employment Projections
12
19
31
Growth Replacement Total
Projected Annual Job Openings, Massage Therapists

236 | P a g e
29-1199 Health Diagnosing and Treating Practitioners, All Other
Occupation description
All health diagnosing and treating practitioners not listed separately.
Illustrative examples: Acupuncturist, Hypnotherapist, Naturopathic Physician.
Education requirements
A master’s degree is the minimum education requirement listed by BLS.
In Maine, the licensure of acupuncturists and naturopathic doctors is governed by the Board of Complementary Health Care Providers. To be licensed as an acupuncturist one must have a baccalaureate degree, a license to practice as a registered nurse or successful completion of the training program and any competency examination required by the Board of Licensure in Medicine to be qualified as a physician's assistant; a minimum of 1,000 hours of classroom instruction in acupuncture and related subjects at an approved institution; a minimum of 300 hours of clinical experience in the field of acupuncture; and certification by the National Commission for the Certification of Acupuncturists and Oriental Medicine, or passage of a written examination approved by the board.
The requirements to be licensed as a naturopathic doctor include possession of a degree from an approved naturopathic medical college and successful completion of a competency-based examination covering the appropriate naturopathic subjects, including basic and clinical sciences. In order to practice naturopathic acupuncture, a naturopathic doctor must obtain a naturopathic acupuncture specialty certification which requires successful completion of an acupuncture program approved by the board that includes 1,000 hours of classroom training and 300 hours of supervised clinical training. In addition, the naturopathic doctor must pass an examination administered by the National Commission for the Certification of Acupuncturists and Oriental Medicine.
Employment & Wages
There were an estimated 70 health diagnosing and treating practitioners, all other employed in Maine in 2012. The median annual wage for these occupations across all employment settings was $68,000; those employed in ambulatory clinics had median wages of $165,000. These figures do not include the self-employed. According to employment projections data, which include the self-employed (but is slightly older data), there were an estimated 134 practicing in Maine in 2010. Please see the discussion at the beginning of this report for more information on the limitations of the data.
2012 Employment & Wage Statistics
Average
Employment Median Annual
Salary Maine 70 $67,870 Industries with Highest Share of Employment (% total) Ambulatory Health Care Services n/a $164,810 Hospitals 43% $59,950 Source: 2012 Occupational Employment Statistics, CWRI

Healthcare Occupations Report | P a g e 237
Schools offering training and number completing
There are no schools offering naturopathic medical education in Maine, nor are there approved programs or schools for acupuncture.
Outlook
The total number of health diagnosing and treating practitioners, all other, practicing in Maine is expected to increase 16 percent from 2010 to 2020; the number employed and self-employed are projected to increase six and 34 percent, respectively. In total, five job openings per year are anticipated; two from new growth and three from replacement needs.
Employment of Health Diagnosing and Treating Practitioners, all other in Maine, 2010 and Projected 2020
Average Employment Change in Employment (2010-2020)
Projected Annual Openings Resulting from New Growth 2010 2020 Net Percent
134 156 22 16% 2 Source: CWRI 2010-2020 Employment Projections
0.05
0.10
Maine U.S.
Health diagnosing and treating practitioners, all other per 1,000 Population
2
3
5
Growth Replacement Total
Projected Annual Job Openings, Diagnosing and Treating Practitioners, all
other

238 | P a g e
29-2071 Medical Records and Health Information Technicians
Occupation description
Compile, process, and maintain medical records of hospital and clinic patients in a manner consistent with medical, administrative, ethical, legal, and regulatory requirements of the health care system. Process, maintain, compile, and report patient information for health requirements and standards in a manner consistent with the healthcare industry’s numerical coding system. Excludes “File Clerks” (43-4071).
Illustrative examples: Cancer Registrar, Health Information Coder, Health Information Systems Technician, Medical Records Specialist
Education requirements
Medical records and health information technicians typically need a postsecondary certificate to enter the occupation, although they may have an associate’s degree. Many employers also require professional certification.
Postsecondary certificate and associate’s degree programs in health information technology typically include courses in medical terminology, anatomy and physiology, health data requirements and standards, classification and coding systems, healthcare reimbursement methods, healthcare statistics, and computer systems. Applicants to health information technology programs increase their chances of admission by taking high school courses in health, computer science, math, and biology.
Most employers prefer to hire medical records and health information technicians who have professional certification. A medical records and health information technician can get certification from several organizations. Some organizations base certification on passing an exam. Others require graduation from an accredited program. Once certified, technicians typically must renew their certification regularly and take continuing education courses. Certifications include Registered Health Information Technician (RHIT) and Certified Tumor Registrar (CTR), among others. Many coding certifications require coding experience in a work setting. Some states require cancer registrars to have certification; requirements vary by state.
Licensing is not required in Maine.
Employment & Wages
2012 Employment & Wage Statistics
Average
Employment Median Annual
Salary Maine 1,120 $32,180 Industries with Highest Share of Employment (% total) Hospitals 65% $33,380 Ambulatory Health Care Services 20% $28,840 Source: 2012 Occupational Employment Statistics, CWRI

Healthcare Occupations Report | P a g e 239
Schools offering training and number completing
Kennebec Valley Community College and Beal College report completer information to IPEDS under the classification of instruction, “Health Information/Medical Records Technology.” Both institutions had graduates in their associate degree programs 2011. There were no program completers in the certificate programs at these schools in 2011.
0.84
0.58
Maine U.S.
Medical Records and Health Information Technicians per 1,000 Population
23
15
19
8
0
10
13 11 9
20
2007 2008 2009 2010 2011
Medical Records Health Information Technician Program Completers
Certificates Associate's degrees

240 | P a g e
Education Programs & Annual Graduates
School CIP Code CIP Title Completer Title 2007 2008 2009 2010 2011
Kennebec Valley Community College
510707
Health Information/ Medical Records Technology/Technician
Post-Sec. Awards/Cert./ Diplomas; 1-2 yrs.
5
1
2
2
Beal College
510707
Health Information/ Medical Records Technology/Technician
Post-Sec. Awards/Cert./ Diplomas; 1-2 yrs.
18
14
17
6
sub total 23 15 19 8 0 Kennebec Valley Community College
510707
Health Information/ Medical Records Technology/Technician
Associate's Degree
10
13
11
9
13
Beal College
510707
Health Information/ Medical Records Technology/Technician
Associate's Degree
7
sub total 10 13 11 9 20 Total 33 28 30 17 20
Source: IPEDS, CWRI
Outlook
Nationally, employment of medical records and health information technicians is expected to increase by 21 percent from 2010 to 2020, faster than the average for all occupations. In Maine, employment is expected to increase 17 percent, above the 6 percent growth expected for all occupations statewide but below the national rate. As noted in the introduction of this report, slower population growth for Maine is a contributing factor to lower occupational employment growth.
The demand for health services is expected to increase as the population ages. An aging population will need more medical tests, treatments, and procedures. This will also mean more claims for reimbursement from private and public insurance. Additional records, coupled with widespread use of electronic health records (EHR) by all types of healthcare providers, should lead to an increased need for technicians to organize and manage the associated information in all areas of the healthcare industry. Population aging and the increased need for medical records will drive demand for technicians, and implementation of EHR will change the scope of how work is done.
Cancer registrars are expected to continue to be in high demand. As the population ages, there will likely be more types of special purpose registries because many more types of illnesses are detected and treated later in life.
The Job prospects will be best for those with a certification in health information. As EHR systems continue to become more common, technicians with computer skills will be needed to use them. In Maine, 41 job openings per year are expected, 19 from new growth and 22 from replacement needs.

Healthcare Occupations Report | P a g e 241
Employment of Medical Records and Health Information Technicians in Maine, 2010 and Projected 2020
Average Employment Change in Employment (2010-2020)
Projected Annual Openings Resulting from New Growth
2010 2020 Net Percent
1,085 1,273 188 17% 19
Source: CWRI 2010-2020 Employment Projections
19 22
41
Growth Replacement Total
Projected Annual Job Openings, Medical Records and Health Information Technicians

242 | P a g e
Appendix I Health Sector Employment
Ownership NAICS Description NAICS Code
Average Employment 2010 2011 2012
All Ownerships Health Care and Social Assistance 62 104,357 104,881 105,839 All Ownerships Ambulatory health care services 621 26,222 25,928 26,858 All Ownerships Offices of physicians 6211 9,893 9,340 9,510 All Ownerships Offices of physicians, except mental health 621111 9,767 9,212 9,383 All Ownerships Offices of mental health physicians 621112 127 128 128 All Ownerships Offices of dentists 6212 3,541 3,563 3,646 All Ownerships Offices of dentists 621210 3,541 3,563 3,646 All Ownerships Offices of other health practitioners 6213 3,722 3,793 4,194 All Ownerships Offices of chiropractors 621310 665 653 632 All Ownerships Offices of optometrists 621320 748 761 791 All Ownerships Offices of mental health practitioners 621330 422 417 507 All Ownerships Offices of specialty therapists 621340 1,461 1,513 1,793 All Ownerships Offices of podiatrists 621391 139 147 152 All Ownerships Offices of miscellaneous health practitioners 621399 287 302 319 All Ownerships Outpatient care centers 6214 2,297 2,369 2,480 All Ownerships Family planning centers 621410 98 99 98 All Ownerships Outpatient mental health centers 621420 1,791 1,821 1,942 All Ownerships HMO medical centers 621491 0 0 0 All Ownerships Kidney dialysis centers 621492 * * 218 All Ownerships Freestanding emergency medical centers 621493 67 74 72 All Ownerships All other outpatient care centers 621498 131 166 150 All Ownerships Medical and diagnostic laboratories 6215 1,089 1,116 1,102 All Ownerships Medical laboratories 621511 884 921 914 All Ownerships Diagnostic imaging centers 621512 205 195 188 All Ownerships Home health care services 6216 3,613 3,716 3,998 All Ownerships Home health care services 621610 3,613 3,716 3,998 All Ownerships Other ambulatory health care services 6219 2,067 2,030 1,928 All Ownerships Ambulance services 621910 1,493 1,521 1,541 All Ownerships Blood and organ banks 621991 220 197 207 All Ownerships Miscellaneous ambulatory health care services 621999 354 313 180 All Ownerships Hospitals 622 34,551 35,143 35,186 All Ownerships General medical and surgical hospitals 6221 32,317 32,980 33,122 All Ownerships General medical and surgical hospitals 622110 32,317 32,980 33,122 All Ownerships Psychiatric and substance abuse hospitals 6222 1,604 1,506 1,406 All Ownerships Psychiatric and substance abuse hospitals 622210 1,604 1,506 1,406 All Ownerships Other hospitals 6223 630 658 658 All Ownerships Other hospitals 622310 630 658 658 All Ownerships Nursing and residential care facilities 623 24,833 24,865 24,760 All Ownerships Nursing care facilities, skilled nursing 6231 12,361 12,110 12,047 All Ownerships Nursing care facilities, skilled nursing 623110 12,361 12,110 12,047 All Ownerships Residential mental health facilities 6232 5,751 5,770 5,725 All Ownerships Residential developmental disability homes 623210 4,023 4,026 4,061 All Ownerships Residential mental and substance abuse care 623220 1,728 1,744 1,664 All Ownerships Continuing care, assisted living facilities 6233 5,741 5,931 5,987 All Ownerships Continuing care retirement communities 623311 939 1,183 1,230 All Ownerships Assisted living facilities for the elderly 623312 4,802 4,748 4,757 All Ownerships Other residential care facilities 6239 981 1,055 1,001 All Ownerships Other residential care facilities 623990 981 1,055 1,001 All Ownerships Social assistance 624 18,750 18,946 19,036 All Ownerships Individual and family services 6241 12,631 13,055 13,219 All Ownerships Child and youth services 624110 2,186 2,265 2,424 All Ownerships Services for the elderly and disabled 624120 7,532 7,914 8,086 All Ownerships Other individual and family services 624190 2,913 2,876 2,709 All Ownerships Emergency and other relief services 6242 624 641 582 All Ownerships Community food services 624210 91 104 98 All Ownerships Temporary shelters 624221 394 428 409 All Ownerships Other community housing services 624229 27 * All Ownerships Emergency and other relief services 624230 113 101 68 All Ownerships Vocational rehabilitation services 6243 1,728 1,458 1,450 All Ownerships Vocational rehabilitation services 624310 1,728 1,458 1,450 All Ownerships Child day care services 6244 3,768 3,791 3,785 All Ownerships Child day care services 624410 3,768 3,791 3,785 Source: Quarterly Census of Employment and Wages (QCEW)