2014 full year results - stockproinfostockproinfo.com/cp/2014/gb00b02j6398_2014_20150305_us_c... ·...
TRANSCRIPT

2014 Full Year Results
5th March 2015
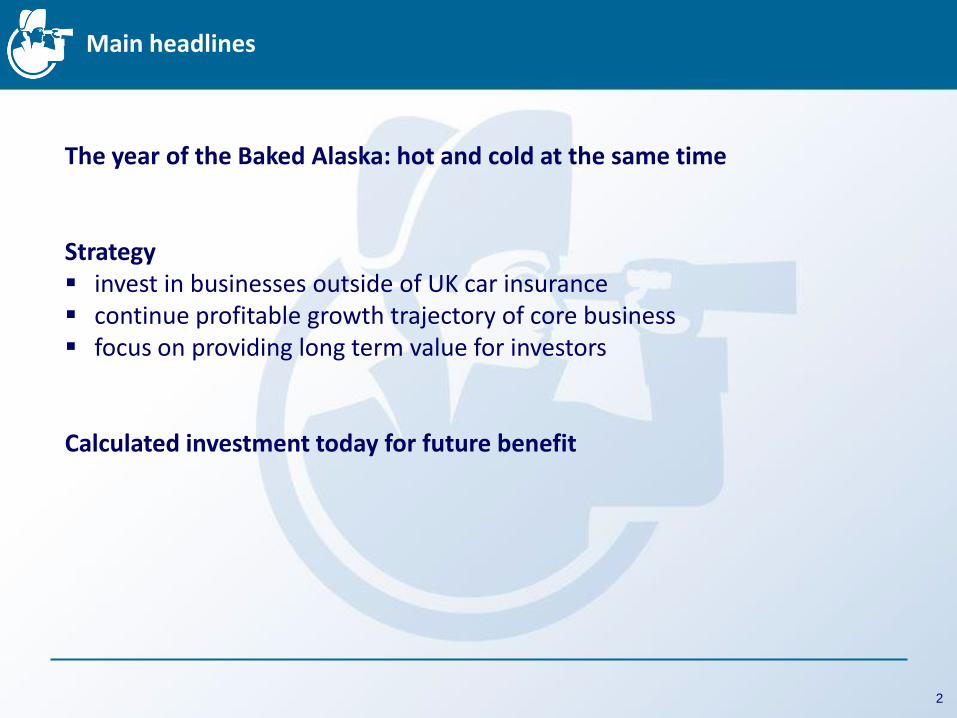
Main headlines
The year of the Baked Alaska: hot and cold at the same time Strategy invest in businesses outside of UK car insurance continue profitable growth trajectory of core business focus on providing long term value for investors Calculated investment today for future benefit
2
Agenda
Group Overview Henry Engelhardt, CEO Geraint Jones, CFO
UK Update David Stevens, COO Stuart Morgan, Head of Service
International Milena Mondini, ConTe CEO Elena Betes, Rastreator CEO
Wrap Up Henry Engelhardt, CEO
Q&A All
3

2014 at a glance
Group profit before tax1 down 4% at £357 million (2013: £371 million)
Return on equity of 52% (2013: 58%)
Group turnover down 3% at £1.97 billion (2013: £2.03 billion)
Group customers up 10% to 4.0 million (2013: 3.7 million)
Earnings per share down 2% at 103.0 pence (2013: 104.6 pence)
Final dividend of 49.0 pence per share; bringing the total dividend to 98.4 pence per share down 1% (2013: 99.5 pence)
Note: (1) Group profit before tax represents Group’s share after excluding minority interests.
4
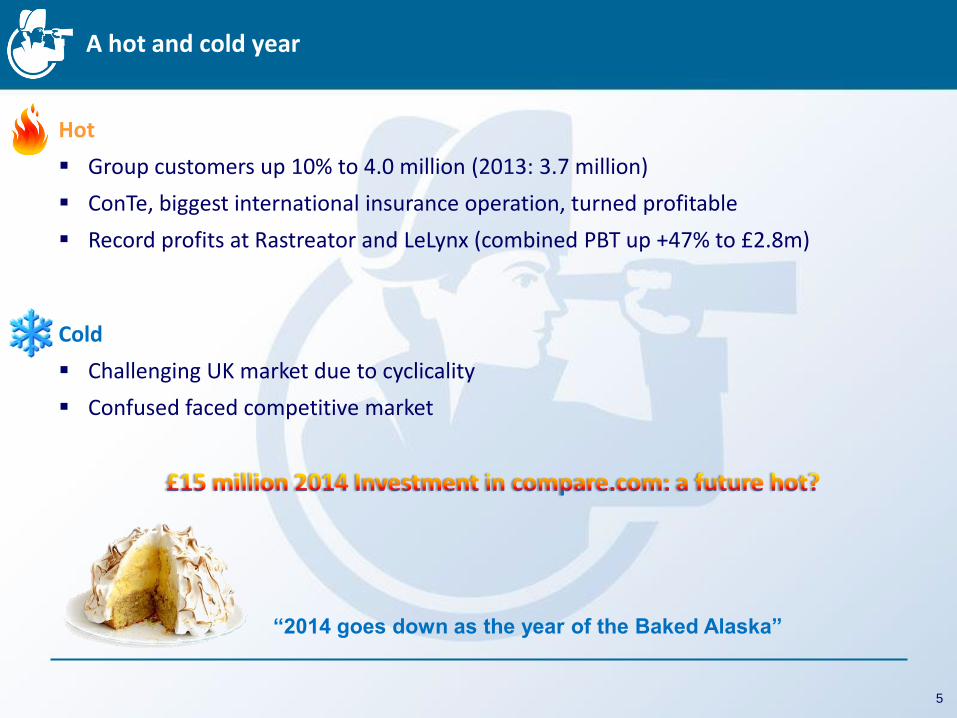
Hot
Group customers up 10% to 4.0 million (2013: 3.7 million)
ConTe, biggest international insurance operation, turned profitable
Record profits at Rastreator and LeLynx (combined PBT up +47% to £2.8m)
Cold
Challenging UK market due to cyclicality
Confused faced competitive market
A hot and cold year
“2014 goes down as the year of the Baked Alaska”
5
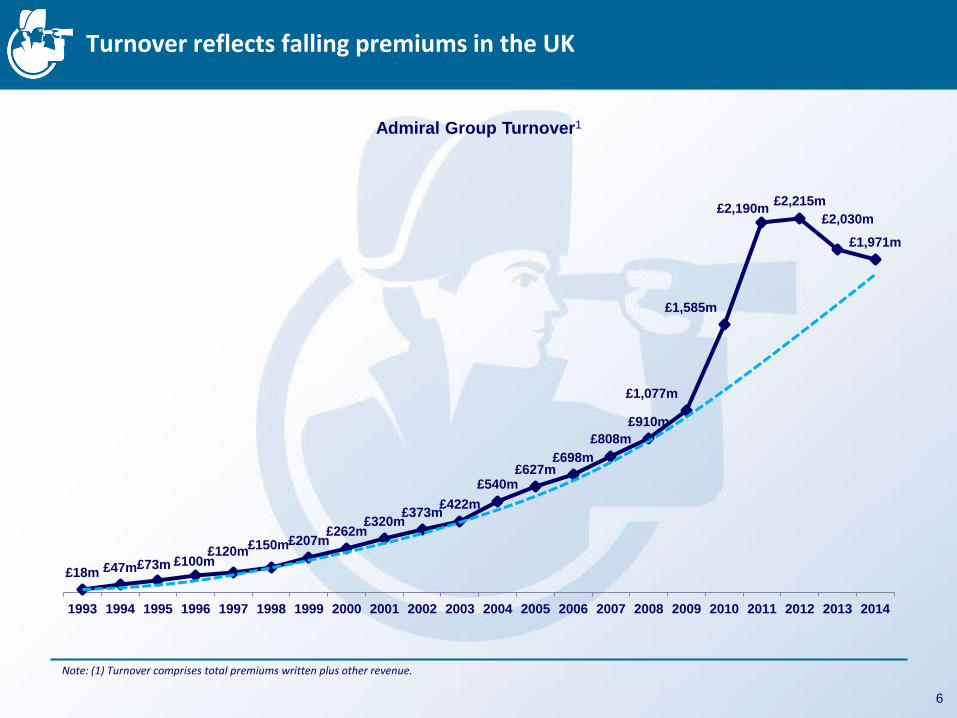
£18m £47m £73m £100m £120m
£150m £207m £262m
£320m £373m
£422m
£540m £627m
£698m
£808m
£910m
£1,077m
£1,585m
£2,190m £2,215m
£2,030m
£1,971m
1993 1994 1995 1996 1997 1998 1999 2000 2001 2002 2003 2004 2005 2006 2007 2008 2009 2010 2011 2012 2013 2014
Turnover reflects falling premiums in the UK
Admiral Group Turnover1
Note: (1) Turnover comprises total premiums written plus other revenue.
6

95%
5%
2010
UK (Insurance and Confused.com) International (Insurance and Price Comparison)
Increasing contribution from International businesses
Group Turnover
£1,585m
£1,971m
7
88%
12%
2014

Growing success of International Price Comparison
Group Price Comparison Turnover Group Price Comparison Quotes
8
95%
5%
2010
Confused.com International PC
75%
25%
2014
£76m
£108m
89%
11%
2010
Confused.com International PC
64%
36%
2014
18m
16m
104%
106% 111%
4%
6% 1%
-3% -6% -5% -5% -6% -7%
2010 2013 2014
UK Car Insurance Price Comparison
International Car Insurance Other Group Items
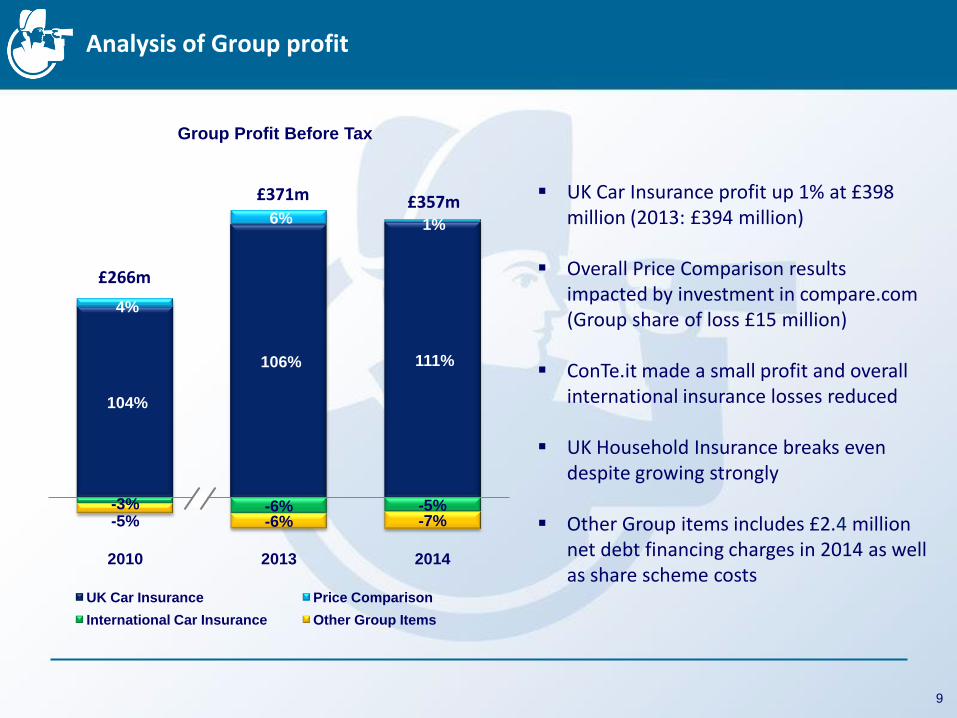
Analysis of Group profit
£357m £371m
£266m
Group Profit Before Tax
UK Car Insurance profit up 1% at £398 million (2013: £394 million)
Overall Price Comparison results impacted by investment in compare.com (Group share of loss £15 million)
ConTe.it made a small profit and overall international insurance losses reduced
UK Household Insurance breaks even despite growing strongly
Other Group items includes £2.4 million net debt financing charges in 2014 as well as share scheme costs
9

£1.7bn
£1.6bn £1.6bn
£1.5bn
Turnover Total Premiums Written
2013 2014
UK Car Insurance response to market conditions
UK Car Insurance Customers UK Car Insurance
Turnover and Total Premiums Written
1.9m
2.5m
3.0m 3.0m 3.0m 3.2m
2009 2010 2011 2012 2013 2014
Stable vehicle count
10
Reduced total premiums reflective of lower average premiums due to rate reductions (mainly throughout 2013)
4% customer growth in 2014 largely due to improved retention

UK Car Insurance combined ratio remains stable in 2014
Expense, Loss and Combined Ratios
(Motor Only)
Reported loss ratio stable as higher reserve releases offset higher current year loss ratio
Expense ratio increases due to lower average premiums
Other revenue per vehicle flat at £67 in 2014 (net of internal costs: £58 in 2014 and £57 in 2013)
Source: UK market data extracted from PRA returns as at 31st December 2013. Market excludes Admiral. Loss ratio: pure accident year. Note: (1) Admiral expense ratio is on a written basis.
11
1
27%
15.0% 16.3%
72% 68.0% 68.6%
99%
83.0% 84.9%
UK Market (2013)
Admiral (2013) Admiral (2014) UK Market (2013)
Admiral (2013) Admiral (2014) UK Market (2013)
Admiral (2013) Admiral (2014)
Expense Ratio Reported Loss Ratio Combined Ratio

UK Car Insurance: reserve releases
Higher releases due to positive claims experience in respect of earlier accident years in 2013 and 2014 resulting in improved projected ultimate loss ratios (especially for 2010 to 2013 underwriting years)
If claims develop as expected, there is likely to be scope for further material reserve releases going forward
Admiral UK Reserve Releases as a % of Earned Premium
16%
9% 9%
2%
4%
13%
18%
2004-2009 average
2010-2014 average
2010 2011 2012 2013 2014
12

£78m
£188m
£206m
2010 2013 2014
195k
515k
593k
2010 2013 2014
Growth for International Car Insurance...
International Car Insurance
Turnover
International Car Insurance
Vehicles Under Cover
13
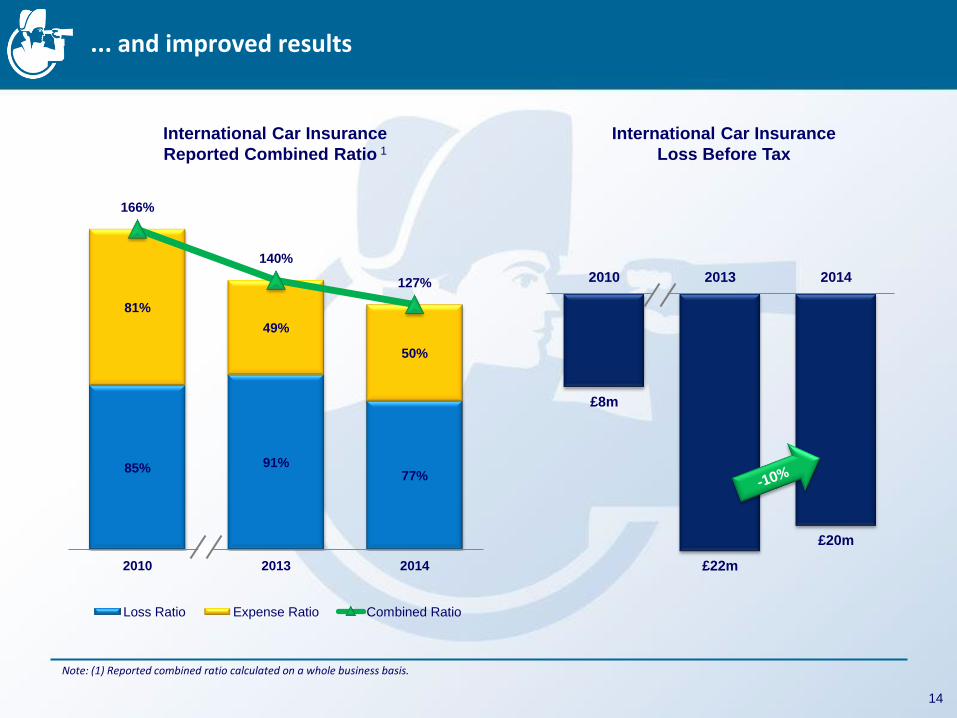
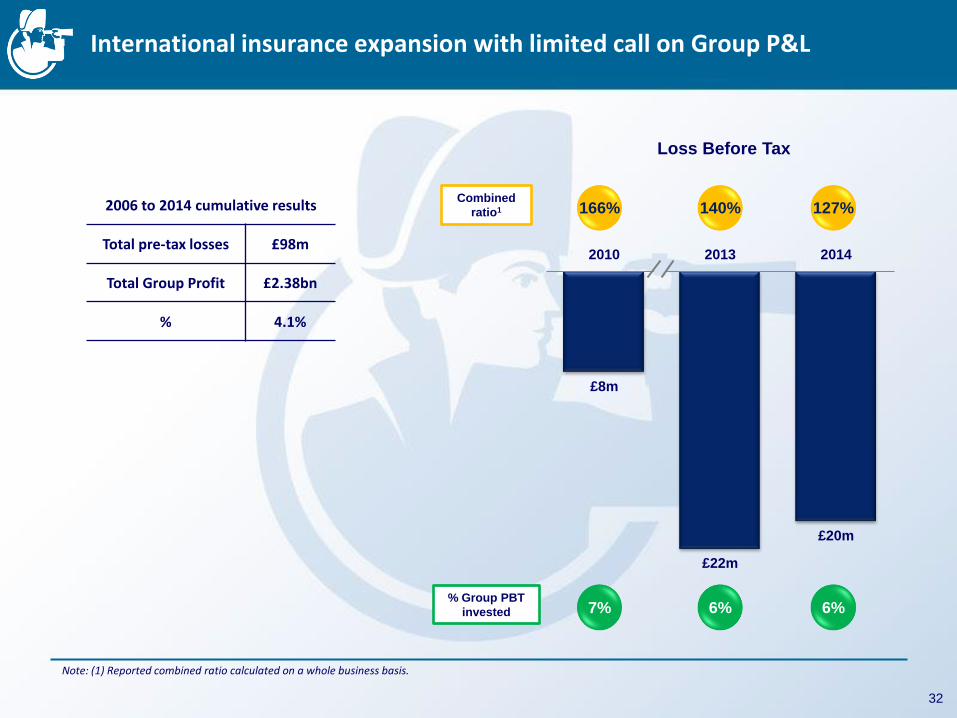
85% 91% 77%
81%
49%
50%
166%
140%
127%
2010 2013 2014
Loss Ratio Expense Ratio Combined Ratio
£8m
£22m
£20m
2010 2013 2014
... and improved results
International Car Insurance
Loss Before Tax
International Car Insurance
Reported Combined Ratio 1
Note: (1) Reported combined ratio calculated on a whole business basis.
14

1.6m
5.1m
6.2m
2010 2013 2014
-£2.8m
£1.9m
£2.8m
2010 2013 2014
The Internet remains an irresistible force
Rastreator and LeLynx result
Rastreator and LeLynx Quotes Generated
15

£505m
£289m
£120m
£200m
Capital Total regulatory Capital requirement
31 Dec 2014
IGD Capital requirement
Capital position is strong in run-up to Solvency II
Group capital requirements in 2015 set by UK ICAS requirements
Surplus after deducting final dividend is c. £300 million
Expect to hold significant surplus throughout 2015 as we make a prudent transition into Solvency II
1
Note: (1) Capital is tangible equity plus lower Tier 2 debt capital.
16
£705m
IGD coverage pre-final dividend 588%
IGD coverage post-final dividend 474%
Bond strengthens and diversifies capital base in current and future solvency regimes
Uncertainty remains over level of Solvency II capital requirement
Leverage ratio (IFRS basis) post-final dividend 28%

32.6p
72.3p
35.5p
EPS DPS
FY 2010
Proposed Final Dividend of 49.0p per share
Earnings and Dividend Per Share
Dividend Dates
Ex-dividend date: Record date:
Payment date:
7 May 2015 8 May 2015 29 May 2015
Payout ratio
17
48.9p
50.6p
EPS DPS
FY 2013
49.4p
49.0p
EPS DPS
FY 2014
94%
95% 95%
Final DPS Interim DPS EPS
104.6p
103.0p
Agenda
Group Overview Henry Engelhardt, CEO Geraint Jones, CFO
UK Update David Stevens, COO Stuart Morgan, Head of Service
International Milena Mondini, ConTe CEO Elena Betes, Rastreator CEO
Wrap Up Henry Engelhardt, CEO
Q&A All
18

0
10,000
20,000
30,000
40,000
50,000
60,000
70,000
80,000
90,000
100,000
No. of Claim Notifications
The return of claim inflation: higher frequency
Small Bodily Injury claims frequency has a structural tendency to increase
(Market Data)
LASP
O in
tro
du
ctio
n A
pri
l 20
13
Po
rtal
ext
ensi
on
Ju
ly 2
01
3
May 2012
Dec 2014
Source: Road Traffic Accident portal management data.
19
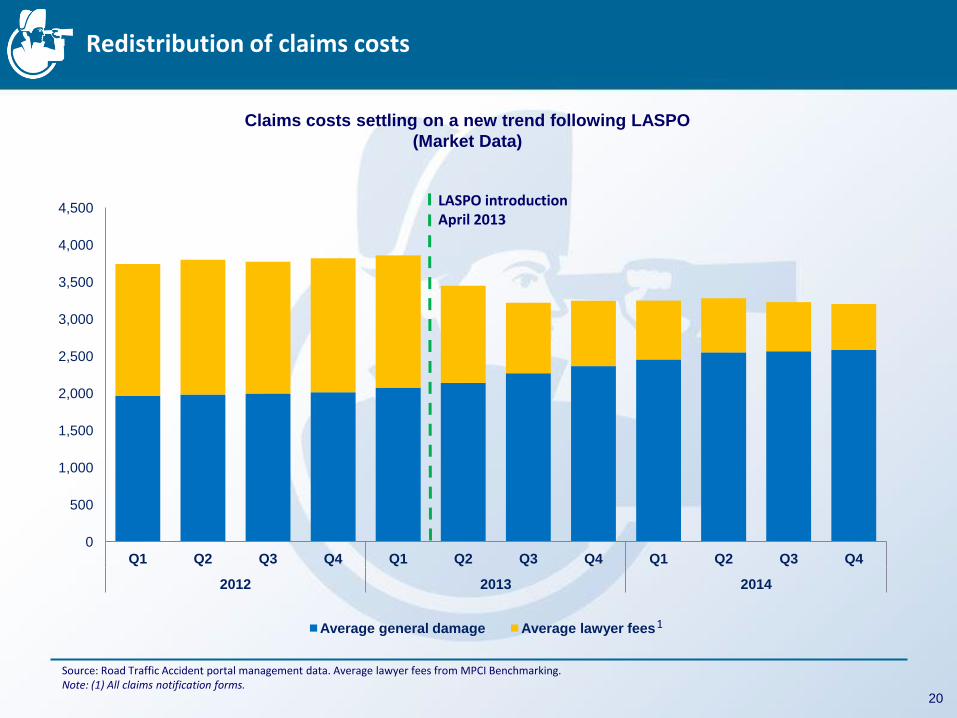
Redistribution of claims costs
Claims costs settling on a new trend following LASPO
(Market Data)
LASPO introduction April 2013
Source: Road Traffic Accident portal management data. Average lawyer fees from MPCI Benchmarking. Note: (1) All claims notification forms.
20
0
500
1,000
1,500
2,000
2,500
3,000
3,500
4,000
4,500
Q1 Q2 Q3 Q4 Q1 Q2 Q3 Q4 Q1 Q2 Q3 Q4
2012 2013 2014
Average general damage Average lawyer fees 1
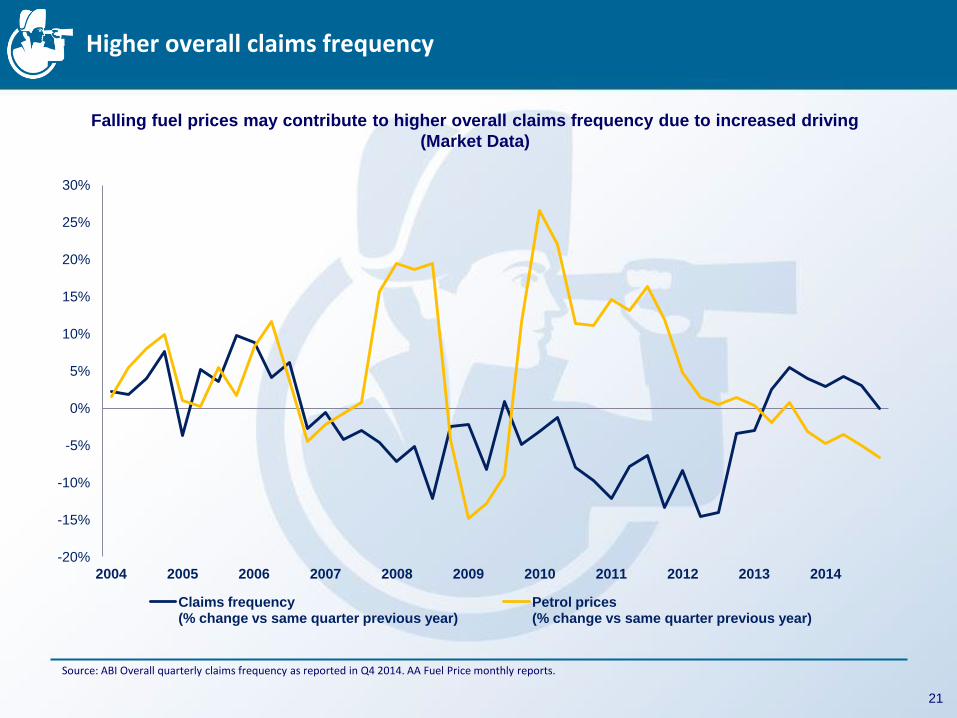
Higher overall claims frequency
Falling fuel prices may contribute to higher overall claims frequency due to increased driving
(Market Data)
Source: ABI Overall quarterly claims frequency as reported in Q4 2014. AA Fuel Price monthly reports.
21
-20%
-15%
-10%
-5%
0%
5%
10%
15%
20%
25%
30%
2004 2005 2006 2007 2008 2009 2010 2011 2012 2013 2014
Claims frequency (% change vs same quarter previous year)
Petrol prices (% change vs same quarter previous year)
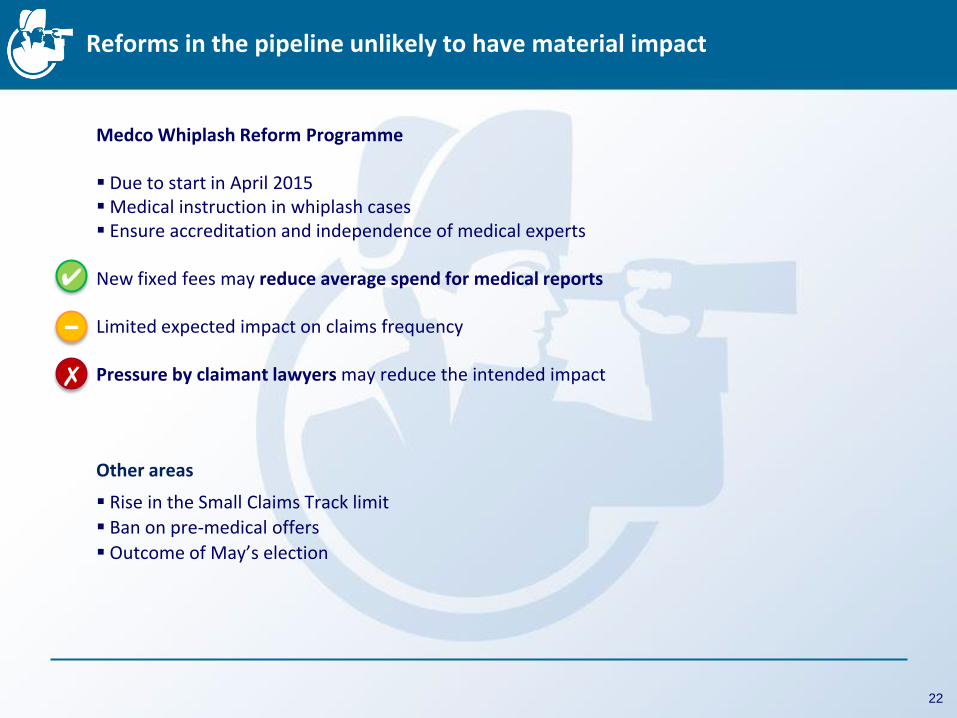
Reforms in the pipeline unlikely to have material impact
Medco Whiplash Reform Programme
Due to start in April 2015 Medical instruction in whiplash cases Ensure accreditation and independence of medical experts New fixed fees may reduce average spend for medical reports Limited expected impact on claims frequency Pressure by claimant lawyers may reduce the intended impact
Other areas
Rise in the Small Claims Track limit
Ban on pre-medical offers
Outcome of May’s election
✔
✗
−
22
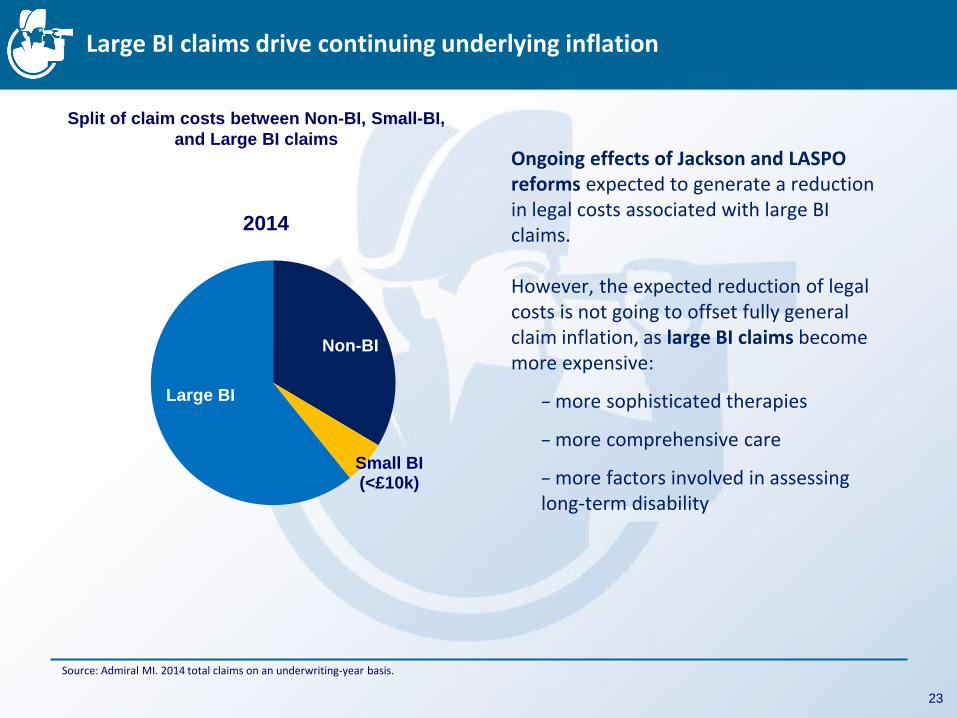
Large BI claims drive continuing underlying inflation
Split of claim costs between Non-BI, Small-BI,
and Large BI claims
Non-BI
Small BI (<£10k)
Large BI
2014
Ongoing effects of Jackson and LASPO reforms expected to generate a reduction in legal costs associated with large BI claims.
However, the expected reduction of legal costs is not going to offset fully general claim inflation, as large BI claims become more expensive:
− more sophisticated therapies
− more comprehensive care
− more factors involved in assessing long-term disability
Source: Admiral MI. 2014 total claims on an underwriting-year basis.
23
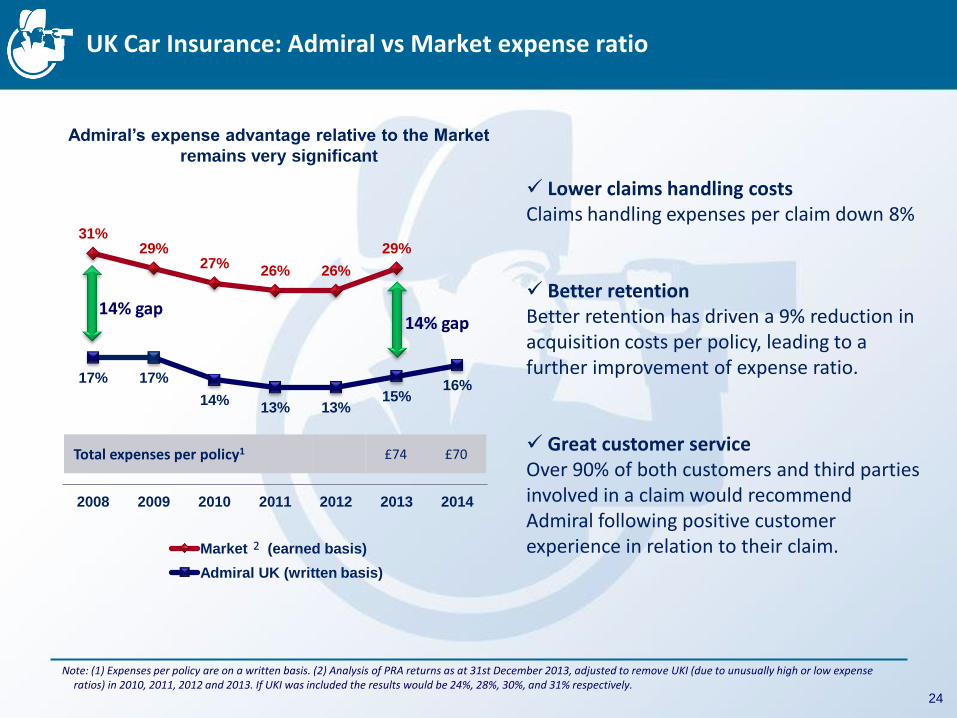
31% 29%
27% 26% 26%
29%
17% 17%
14% 13% 13%
15% 16%
2008 2009 2010 2011 2012 2013 2014
Market (earned basis)
Admiral UK (written basis)
UK Car Insurance: Admiral vs Market expense ratio
Admiral’s expense advantage relative to the Market
remains very significant
14% gap 14% gap
Lower claims handling costs Claims handling expenses per claim down 8%
Better retention Better retention has driven a 9% reduction in acquisition costs per policy, leading to a further improvement of expense ratio. Great customer service Over 90% of both customers and third parties involved in a claim would recommend Admiral following positive customer experience in relation to their claim.
Total expenses per policy1 £74 £70
Note: (1) Expenses per policy are on a written basis. (2) Analysis of PRA returns as at 31st December 2013, adjusted to remove UKI (due to unusually high or low expense ratios) in 2010, 2011, 2012 and 2013. If UKI was included the results would be 24%, 28%, 30%, and 31% respectively.
2
24

UK Car insurance market cycle may be turning
Source: ABI Motor Insurance Premium Tracker as published on 2nd Feb 2015 (quarterly data, year-on-year change).
25
-7.7%
-8.9% -9.4%
-8.6%
-6.5%
-5.3%
-2.5%
0.5%
-7.7%
-8.9%
-12.0%
-10.8%
-13.7% -13.7% -14.2%
-10.3%
Q1 Q2 Q3 Q4 Q1 Q2 Q3 Q4
2013 2014
y-o-y (% change) Cumulative (% change from Q1 2012)
ABI Motor Insurance Premium Tracker
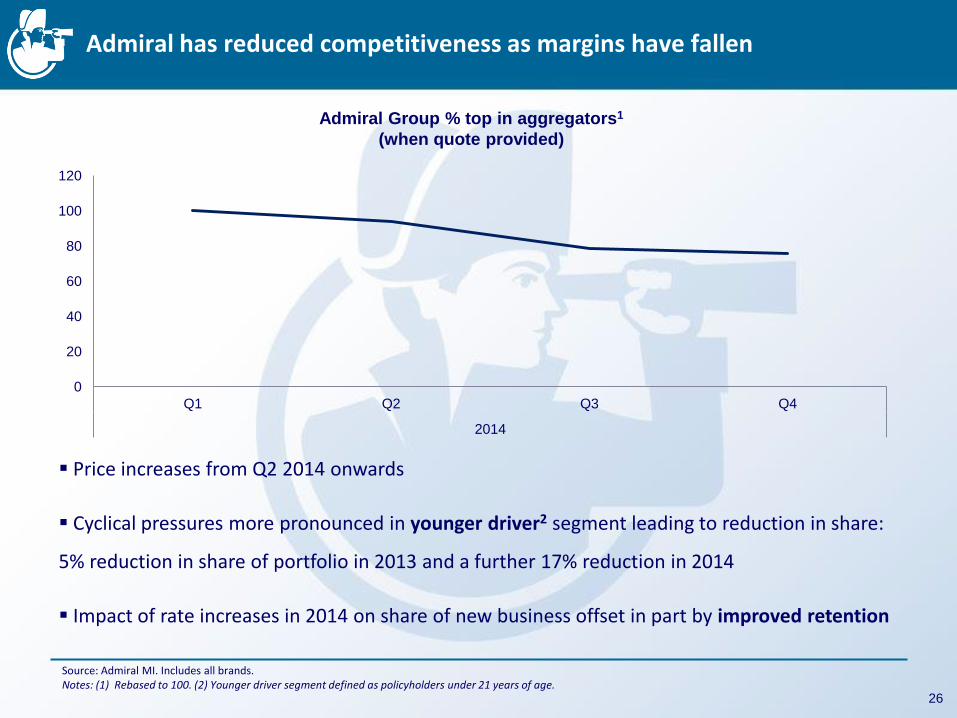
Admiral has reduced competitiveness as margins have fallen
Price increases from Q2 2014 onwards
Cyclical pressures more pronounced in younger driver2 segment leading to reduction in share:
5% reduction in share of portfolio in 2013 and a further 17% reduction in 2014
Impact of rate increases in 2014 on share of new business offset in part by improved retention
Source: Admiral MI. Includes all brands. Notes: (1) Rebased to 100. (2) Younger driver segment defined as policyholders under 21 years of age.
26
Admiral Group % top in aggregators1
(when quote provided)
0
20
40
60
80
100
120
Q1 Q2 Q3 Q4
2014
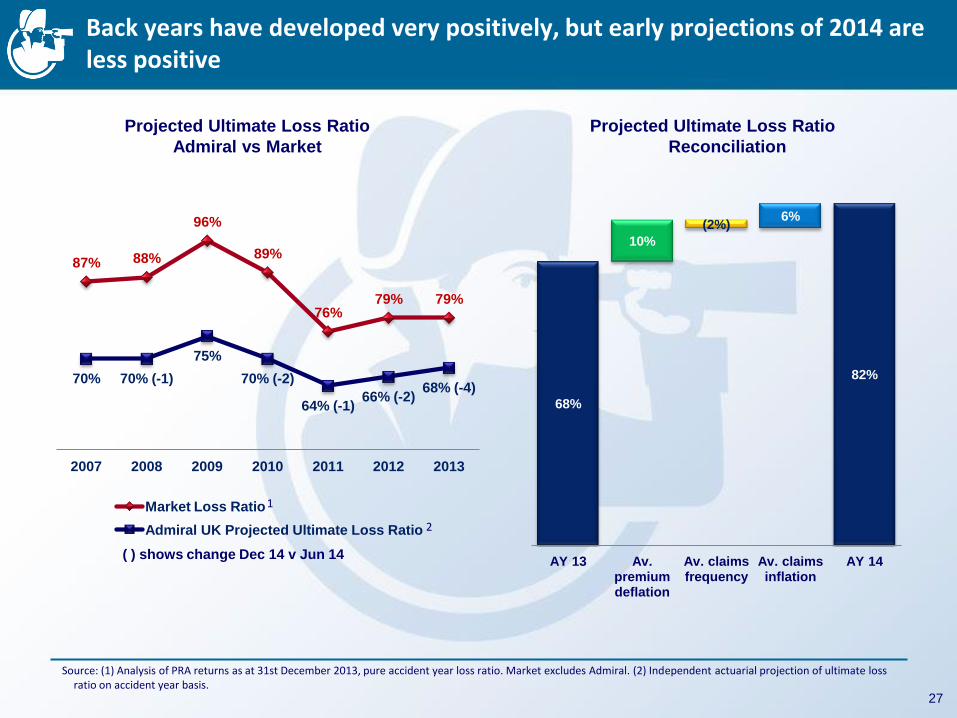
Back years have developed very positively, but early projections of 2014 are less positive
Projected Ultimate Loss Ratio
Reconciliation
Projected Ultimate Loss Ratio
Admiral vs Market
Source: (1) Analysis of PRA returns as at 31st December 2013, pure accident year loss ratio. Market excludes Admiral. (2) Independent actuarial projection of ultimate loss ratio on accident year basis.
27
68%
82%
10%
(2%) 6%
AY 13 Av. premium deflation
Av. claims frequency
Av. claims inflation
AY 14
87% 88%
96%
89%
76% 79% 79%
70% 70% (-1)
75%
70% (-2)
64% (-1) 66% (-2)
68% (-4)
2007 2008 2009 2010 2011 2012 2013
Market Loss Ratio
Admiral UK Projected Ultimate Loss Ratio
( ) shows change Dec 14 v Jun 14
1 2
UK Business outlook
Further price increases expected for 2015 due to:
- pressure from claims inflation leading to
- a turn in the cycle
Continued material reserve releases if claims develop as expected
28
Agenda
Group Overview Henry Engelhardt, CEO Geraint Jones, CFO
UK Update David Stevens, COO Stuart Morgan, Head of Service
International Milena Mondini, ConTe CEO Elena Betes, Rastreator CEO
Wrap Up Henry Engelhardt, CEO
Q&A All
29

195k
515k
593k
2010 2013 2014
£71m
£168m £185m
2010 2013 2014
£78m
£188m £206m
2010 2013 2014
Turnover
International Car Insurance businesses
Vehicles Under Cover
Launched: Oct 2009 Geographical presence: • Virginia • Texas • Illinois • Maryland
Launched: Oct 2006 Launched: Mar 2013
Launched: May 2008
30
Total Premiums Written
Launched: Dec 2010
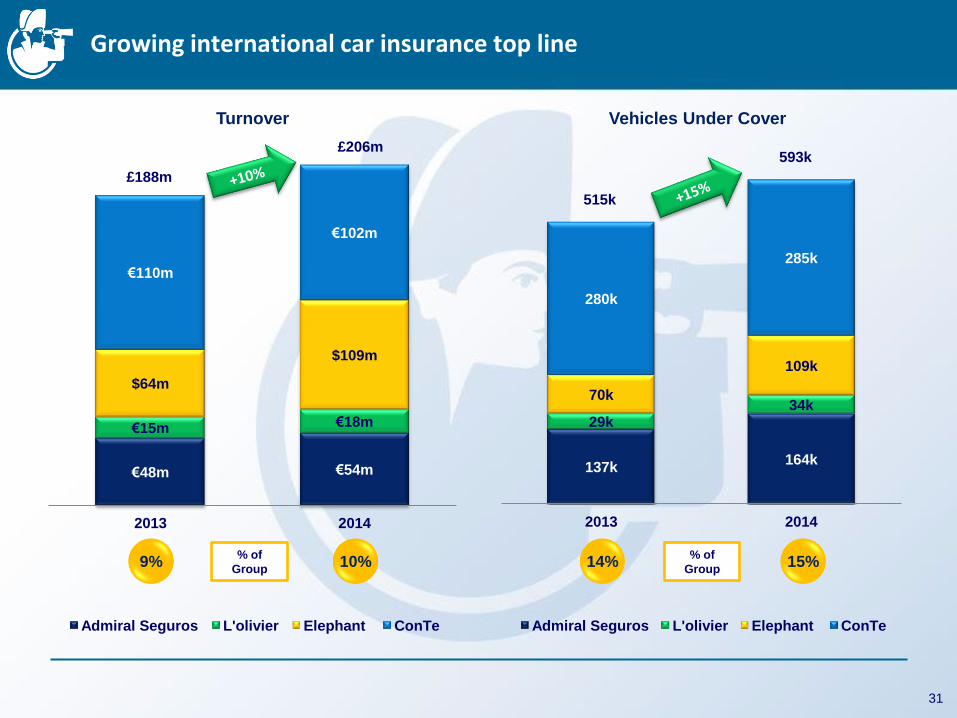
137k 164k
29k 34k
70k
109k
280k
285k
2013 2014
Admiral Seguros L'olivier Elephant ConTe
€48m €54m
€15m €18m
$64m
$109m
€110m
€102m
2013 2014
Admiral Seguros L'olivier Elephant ConTe
Vehicles Under Cover Turnover
Growing international car insurance top line
£188m
£206m
515k
593k
31
9% 10% % of
Group 14% 15%
% of
Group
£8m
£22m
£20m
2010 2013 2014
International insurance expansion with limited call on Group P&L
Loss Before Tax
Note: (1) Reported combined ratio calculated on a whole business basis.
32
166% 140% Combined
ratio1 127% 2006 to 2014 cumulative results
Total pre-tax losses £98m
Total Group Profit £2.38bn
% 4.1%
7% 6% % Group PBT
invested 6%

Spain: growing success in a challenging market
Market Update
Admiral Seguros
performance
Future outlook
Growth has been sustained by the
continued success of Qualitas Auto.
Invested in product innovation (telematics
and motorbike insurance) to further
support future growth.
Focused on leading the business
towards break-even in 20151.
Profitable market in a shrinking economy.
Insurance price increases expected due to
change in Baremo, recovery of fuel
consumption and a 20% increase in car
sales.
Note: (1) On underwriting year basis.
33
€48m
€54m
2013 2014
Turnover
137k
164k
2013 2014
Vehicles Under Cover
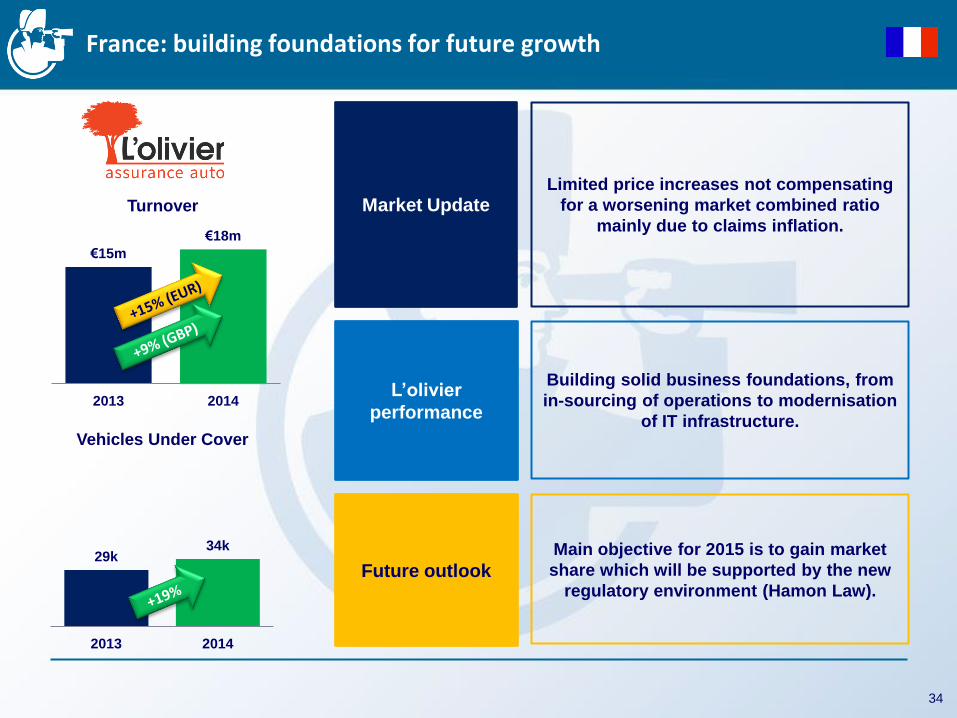
France: building foundations for future growth
L’olivier
performance
Future outlook
Building solid business foundations, from
in-sourcing of operations to modernisation
of IT infrastructure.
Main objective for 2015 is to gain market
share which will be supported by the new
regulatory environment (Hamon Law).
Limited price increases not compensating
for a worsening market combined ratio
mainly due to claims inflation.
Market Update
34
€15m
€18m
2013 2014
Turnover
29k 34k
2013 2014
Vehicles Under Cover

USA: substantial top line growth
Elephant
performance
Future outlook
Customer base grew substantially,
also thanks to a strengthening renewal
book.
A number of significant infrastructure
improvements were made.
Plenty of opportunity to grow within
existing states and new ones.
Leveraging price comparison operations
for further growth.
Biggest car insurance market in the world,
slowly evolving towards more direct
distribution.
Nascent online price comparison market.
Market Update
35
$64m
$109m
2013 2014
Turnover
70k
109k
2013 2014
Vehicles Under Cover
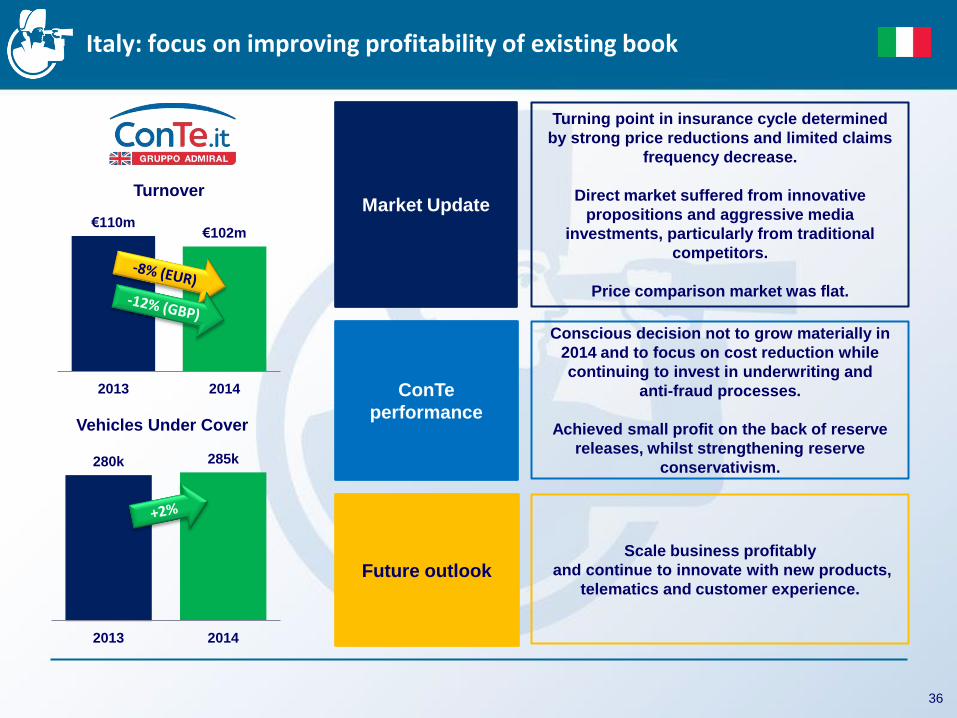
Italy: focus on improving profitability of existing book
ConTe
performance
Future outlook
Conscious decision not to grow materially in
2014 and to focus on cost reduction while
continuing to invest in underwriting and
anti-fraud processes.
Achieved small profit on the back of reserve
releases, whilst strengthening reserve
conservativism.
Scale business profitably
and continue to innovate with new products,
telematics and customer experience.
Turning point in insurance cycle determined
by strong price reductions and limited claims
frequency decrease.
Direct market suffered from innovative
propositions and aggressive media
investments, particularly from traditional
competitors.
Price comparison market was flat.
Market Update
36
€110m €102m
2013 2014
Turnover
280k 285k
2013 2014
Vehicles Under Cover

108% 106%
103%
90% 88%
ConTe has reported its first profit
Launch
2008 2014 2009 2010 2011 2012 2013
Growth
Consolidation
Further growth
Transferring Admiral’s UK competitive advantage internationally:
Low cost structure
Focus on pricing
Efficiency in claims handling
Direct to consumer distribution channels
Reserving approach:
ConTe made a small profit after reserve releases
Maturing back year results improved
Disciplined approach to reserving, likely to continue in line with UK approach
37
Italian Market
Combined Ratio
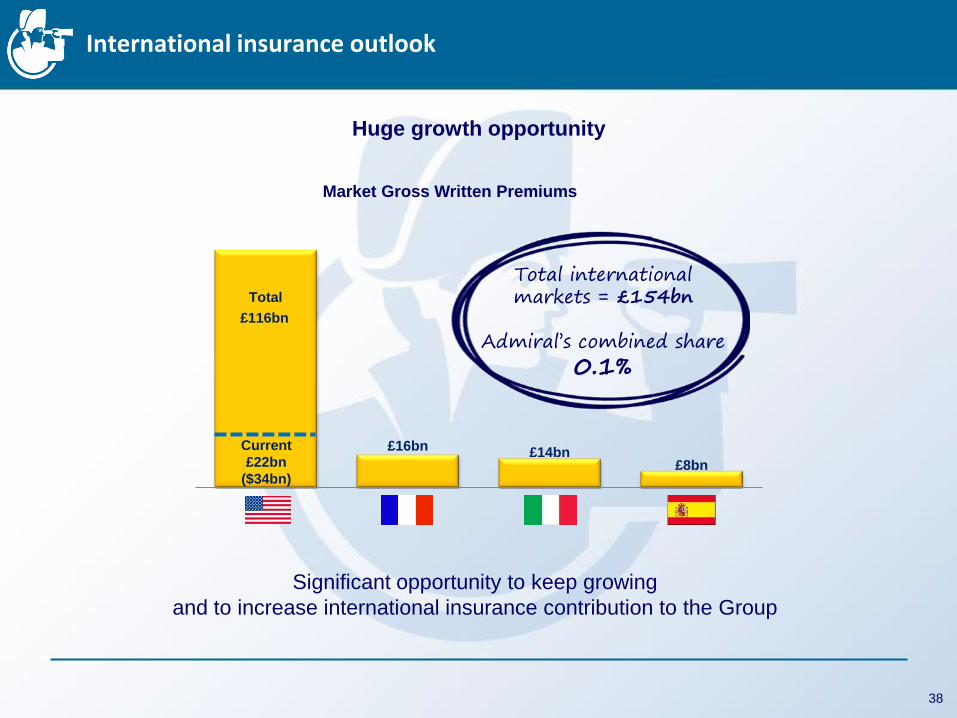
£116bn
£16bn £14bn £8bn
USA France Italy Spain
Market Gross Written Premiums
International insurance outlook
Huge growth opportunity
Significant opportunity to keep growing
and to increase international insurance contribution to the Group
38
Total international markets = £154bn
Admiral’s combined share
0.1%
Current
£22bn
($34bn)
Total

£72m £88m £81m
£4m
£25m £27m
2010 2013 2014
Confused.com International PCs
£17m £22m
£16m
(£3m)
£2m
£3m
(£3m)
(£15m)
2010 2013 2014
Confused.com Rastreator + LeLynx compare.com
Price Comparison businesses
Combined Turnover
39
Launched: Mar 2009
Launched: Mar 2013
Launched: Mar 2002
Launched: Jan 2010
Combined PBT

Confused.com: continuing to innovate in a competitive environment
Limited aggregator market growth (0-2%) caused by
falling premiums (-4%2 vs 2013).
Market remains fiercely competitive.
The Market
Continue to invest in brand with
new Brian toy campaign:
Results driven by change in SEO rankings and
inflation of advertising costs (both on line and off
line).
The Business
40
£88m £81m
2013 2014
Confused.com
Turnover PBT
£22m
£16m
2013 2014
Brian awareness3
Motor price comparison sales
y-o-y % change (market data1)
Source: (1) Admiral MI, (2) ABI Motor Insurance Premium Tracker as published on 2nd Feb 2015, (3) Brand survey conducted by Morar consulting.
3%
5%
0%
-3%
Q1 14 Q2 14 Q3 14 Q4 14
72% 82%
May-13 Jan-14 Oct-14
The Brand

€2.3m
€3.5m
2013 2014
5.1m
6.2m
2013 2014
European expansion: growing success of Rastreator and LeLynx
Launched: Mar 2009 Break-even: 2011
Launched: Jan 2010 Break-even: 2013
Combined PBT Combined Quotes Generated
41
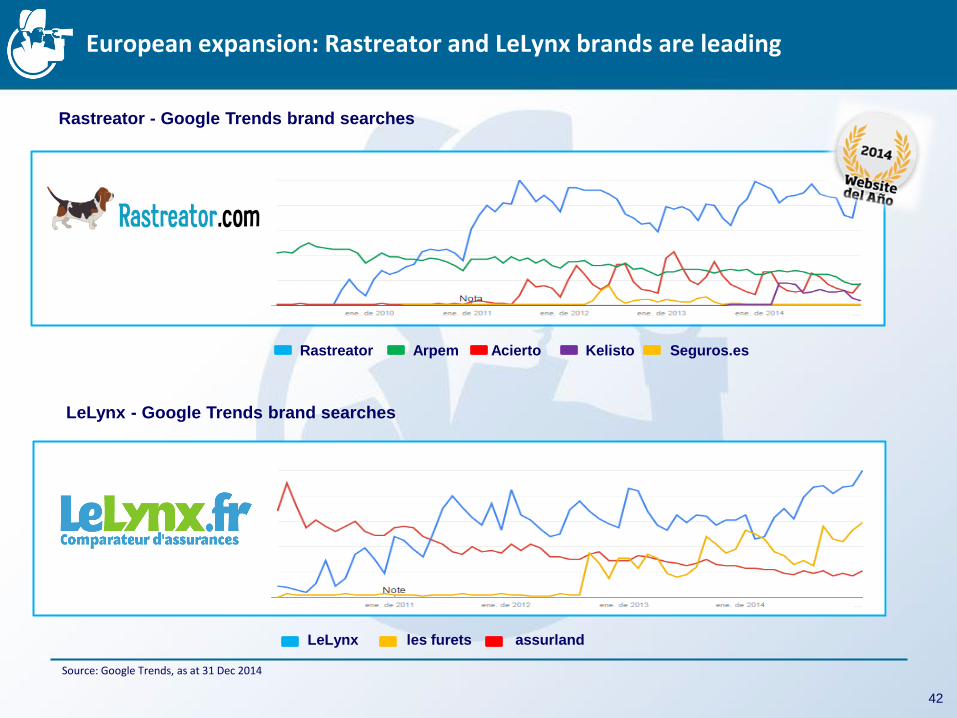
European expansion: Rastreator and LeLynx brands are leading
Rastreator Arpem Acierto Kelisto Seguros.es
LeLynx les furets assurland
Rastreator - Google Trends brand searches
LeLynx - Google Trends brand searches
42
Source: Google Trends, as at 31 Dec 2014

Insurance price comparison is unique in terms of data gathering.
Understanding and using data will drive developments including helping
partners to improve and will shape the future strategy.
Both brands have a high awareness1 in their markets:
Rastreator 91% and LeLynx 75%.
Target is to be the preferred brand in each market.
Working on long term proposition from a customer perspective.
European expansion: strategic pillars
43
Preferred Brand
Current usage frequency is lower than in the UK.
Offering a broader range of products will deliver a better return and facilitate
brand recognition.
Strong brands will allow expansion into other businesses.
Product
development
Data
Source: (1) Assisted brand awareness, Spain: IMC Dec 2014 and France: TNS January 2015

USA expansion: compare.com
Price comparison growing but still largely nascent. The Market
The Brand
Considerable improvement in key metrics.
Quote volumes grew and cost per sale improved.
Acquisition cost now less than half what it was a year ago.
Attracting standard and preferred customers.
The Business
40 insurers signed, 27 insurers on the panel including recognised brands
and 8 of the top 20 players.
Rates returned per customer increased by average 12% m-o-m over the year.
The Panel
Continued investment: Group share of 2015 loss anticipated to be £20m-
£30m.
Carrier and consumer adoption looks promising.
2015 outlook
44

International Price Comparison outlook
45
... more opportunities for future growth

Agenda
Group Overview Henry Engelhardt, CEO Geraint Jones, CFO
UK Update David Stevens, COO Stuart Morgan, Head of Service
International Milena Mondini, ConTe CEO Elena Betes, Rastreator CEO
Wrap Up Henry Engelhardt, CEO
Q&A All
46
Summary
Group overview Investing in many different markets, all with great potential, all with different
competitive landscapes and timetable to success
UK market update UK Car Insurance profits in the future are likely to be more cyclically influenced
than before International insurance operations ConTe made its first profit. Expectations for Admiral Seguros to break-even in 2015 Price Comparison operations Market leading, profitable and growing brands in Spain and France, a competitive
UK market and opportunities in the US Future outlook Longer term there will be greater balance as reliance on the UK car insurance
portfolio reduces Further international growth opportunities
47

A great place to work!
5
8
23
50
3
9
48
5
4
3
39

2014 at a glance
Group profit before tax down 4% at £357 million (2013: £371 million)
Return on equity of 52% (2013: 58%)
Group turnover down 3% at £1.97 billion (2013: £2.03 billion)
Group customers up 10% to 4.0 million (2013: 3.7 million)
Earnings per share down 2% at 103.0 pence (2013: 104.6 pence)
Final dividend of 49.0 pence per share; bringing the total dividend to 98.4 pence per share down 1% (2013: 99.5 pence)
49
“2014 goes down as the year of the Baked Alaska”

Agenda
Group Overview Henry Engelhardt, CEO Geraint Jones, CFO
UK Update David Stevens, COO Stuart Morgan, Head of Service
International Milena Mondini, ConTe CEO Elena Betes, Rastreator CEO
Wrap Up Henry Engelhardt, CEO
Q&A All
50

Appendix

Admiral Group Key Performance Indicators
KPI 2005 2006 2007 2008 2009 2010 2011 2012 2013 2014 Group Financial
Turnover £m 627 698 808 910 1,077 1,585 2,190 2,215 2,030 1,971
Customers m 1.1 1.3 1.5 1.7 2.1 2.7 3.4 3.6 3.7 4.0
Group share of pre-tax profit £m 119.5 147.3 182.1 202.5 215.8 265.5 299.1 344.6 370.7 356.5
Earnings per share 32.7p 39.8p 48.6p 54.9p 59.0p 72.3p 81.9p 95.1p 104.6p 103.0p
Dividend per share 24.6p 36.1p 43.8p 52.5p 57.5p 68.1p 75.6p 90.6p 99.5p 98.4p
UK Car Insurance
Vehicles covered (000) 1,105 1,240 1,382 1,587 1,862 2,459 2,966 3,019 3,021 3,154
Total premiums £m 534 566 617 690 805 1,238 1,729 1,749 1,553 1,453
Reported combined ratio 84.9% 87.2% 83.4% 81.0% 84.9% 83.5% 91.9% 90.0% 83.0% 83.0%
Other revenue per vehicle £ 77 84 84 79 67 67
UK car insurance PBT
profit £m 110.0 121.1 142.2 179.9 206.9 275.8 313.6 372.8 393.9 398.0
International Car Insurance Vehicles covered 2,200 46,900 73,700 121,000 195,000 306,000 436,000 515,300 592,600
Total premiums £m 0.6 14.2 26.0 43.0 71.0 112.5 148.5 168.3 185.4
Adjusted1 combined ratio - 232% 198% 204% 173% 164% 177% 140% 127%
International car insurance result £m (0.1) (0.7) (4.1) (9.5) (8.0) (9.5) (24.5) (22.1) (19.9)
Price Comparison
Total revenue £m 12.0 38.5 69.2 66.1 80.6 75.7 90.4 103.5 112.7 107.5
Group share of operating profit £m 6.9 23.1 36.7 25.6 24.9 11.7 10.5 17.6 21.1 3.6
Operating margin
Confused.com only 58% 60% 53% 39% 32% 24% 21% 22% 25% 20%
52
Notes: (1) Combined ratio is calculated on Admiral’s net share of premiums and excludes Other Revenue. It excludes the impact of reinsurer caps. Including the impact of reinsurer caps the reported combined ratio would be 2014: 145%; 2013: 152%.
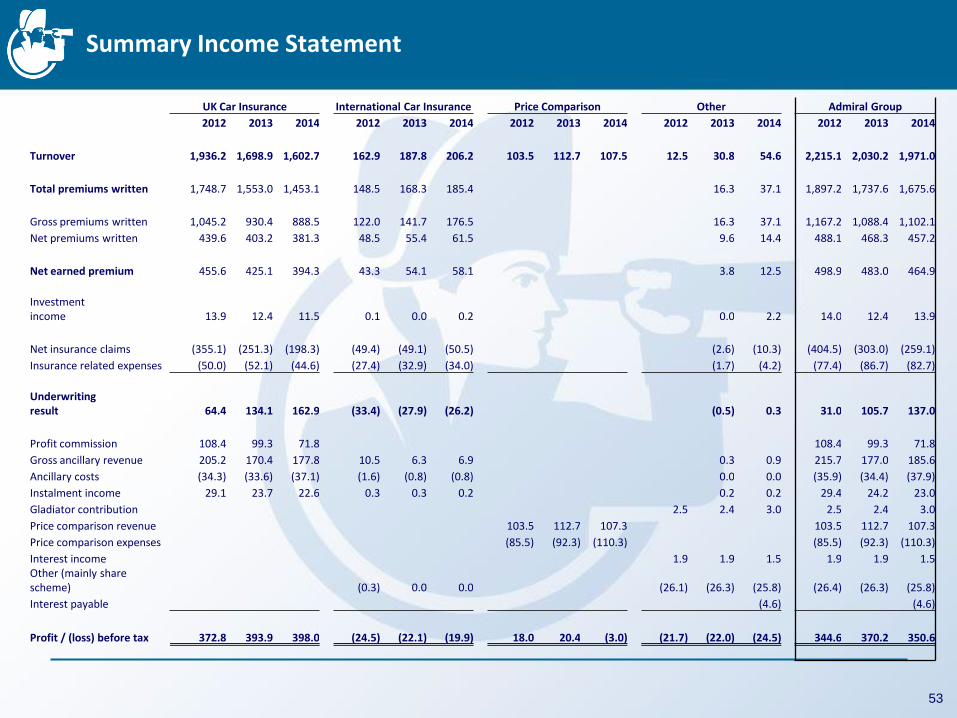
Summary Income Statement
UK Car Insurance International Car Insurance Price Comparison Other Admiral Group
2012 2013 2014 2012 2013 2014 2012 2013 2014 2012 2013 2014 2012 2013 2014
Turnover 1,936.2 1,698.9 1,602.7 162.9 187.8 206.2 103.5 112.7 107.5 12.5 30.8 54.6 2,215.1 2,030.2 1,971.0
Total premiums written 1,748.7 1,553.0 1,453.1 148.5 168.3 185.4 16.3 37.1 1,897.2 1,737.6 1,675.6
Gross premiums written 1,045.2 930.4 888.5 122.0 141.7 176.5 16.3 37.1 1,167.2 1,088.4 1,102.1
Net premiums written 439.6 403.2 381.3 48.5 55.4 61.5 9.6 14.4 488.1 468.3 457.2
Net earned premium 455.6 425.1 394.3 43.3 54.1 58.1 3.8 12.5 498.9 483.0 464.9
Investment income 13.9 12.4 11.5 0.1 0.0 0.2 0.0 2.2 14.0 12.4 13.9
Net insurance claims (355.1) (251.3) (198.3) (49.4) (49.1) (50.5) (2.6) (10.3) (404.5) (303.0) (259.1)
Insurance related expenses (50.0) (52.1) (44.6) (27.4) (32.9) (34.0) (1.7) (4.2) (77.4) (86.7) (82.7)
Underwriting result 64.4 134.1 162.9 (33.4) (27.9) (26.2) (0.5) 0.3 31.0 105.7 137.0
Profit commission 108.4 99.3 71.8 108.4 99.3 71.8
Gross ancillary revenue 205.2 170.4 177.8 10.5 6.3 6.9 0.3 0.9 215.7 177.0 185.6
Ancillary costs (34.3) (33.6) (37.1) (1.6) (0.8) (0.8) 0.0 0.0 (35.9) (34.4) (37.9)
Instalment income 29.1 23.7 22.6 0.3 0.3 0.2 0.2 0.2 29.4 24.2 23.0
Gladiator contribution 2.5 2.4 3.0 2.5 2.4 3.0
Price comparison revenue 103.5 112.7 107.3 103.5 112.7 107.3
Price comparison expenses (85.5) (92.3) (110.3) (85.5) (92.3) (110.3)
Interest income 1.9 1.9 1.5 1.9 1.9 1.5 Other (mainly share scheme) (0.3) 0.0 0.0 (26.1) (26.3) (25.8) (26.4) (26.3) (25.8)
Interest payable (4.6) (4.6)
Profit / (loss) before tax 372.8 393.9 398.0 (24.5) (22.1) (19.9) 18.0 20.4 (3.0) (21.7) (22.0) (24.5) 344.6 370.2 350.6
53

Balance Sheet
December 2012 December 2013 December 2014 £m £m £m
ASSETS
Property, plant and equipment 16.5 12.4 32.3 Intangible assets 92.5 92.8 107.2 Reinsurance contracts 803.0 821.2 829.8 Financial assets 2,005.1 2,265.0 2,547.4
Deferred income tax 15.2 17.0 22.9
Trade and other receivables 55.3 77.5 82.0 Cash and cash equivalents 216.6 187.9 255.9
Total assets 3,204.2 3,473.8 3,877.5
EQUITY Share capital 0.3 0.3 0.3 Share premium 13.1 13.1 13.1 Other reserves 0.7 (0.2) 13.2 Retained earnings 443.0 502.6 540.6 Total equity attributable to equity holders of the parent 457.1 515.8 567.2 Non-controlling interests 3.6 8.3 13.7
Total equity 460.7 524.1 580.9
LIABILITIES
Insurance contracts 1,696.9 1,901.3 2,097.4 Subordinated liabilities - - 203.8 Trade and other payables 1,006.5 1,013.7 965.8 Corporation tax liabilities 40.1 34.7 29.6
Total liabilities 2,743.5 2,949.7 3,296.6
Total liabilities and equity 3,204.2 3,473.8 3,877.5
54

Group Profit Before Tax reconciliation
Admiral has four operations with shared ownership: Rastreator (Admiral share of ownership 75.0%); compare.com (67.8%); Admiral Law and BDE Law (90.0%)
Profit or losses in period accruing to minority parties reduce or increase the results respectively
Investment in compare.com has resulted in a more significant adjustment
compare.com is 32.2% owned by third parties. Total loss was £22.1 million, therefore £7.1 million is added back to Group Profit Before Tax
Reconciliation from Statutory to Adjusted Profit Before Tax
55
£351m £357m
£7m (£1m)
Profit before tax (statutory)
comparenow.com Other minority interests
Profit before tax (adjusted)

30% 31% 29%
27% 26% 26%
29%
17% 17% 17%
14% 13% 13% 15%
2007 2008 2009 2010 2011 2012 2013
Market Expense Ratio (earned) Admiral UK Expense Ratio (written)
UK Car Insurance: Admiral vs Market Ultimate Loss Ratio, Expense Ratio and Combined Ratio
Projected Ultimate Loss Ratio: Admiral vs Market
Ultimate Combined Ratio: Admiral vs Market
Expense Ratio: Admiral vs Market
56
( ) shows change Dec 13 v Dec 12
( ) shows change Dec 14 v Jun 14
2
Notes: (1) Analysis of PRA returns as at 31st December 2013. Market excludes Admiral. Loss ratio: pure accident year. (2) Independent actuarial projection of ultimate loss ratio on accident year basis.
1
87% (-1%) 88% (-1%)
96% (-1%)
89% (-1%)
76% (-2%)
79% (-2%) 79%
70% 70% (-1)
75%
70% (-2)
64% (-1) 66% (-2)
68% (-4)
2007 2008 2009 2010 2011 2012 2013
Market Loss Ratio Admiral UK Projected Ultimate Loss Ratio 1
117% 119% 125% 116%
102% 105% 108%
87% 87% 92%
84% 77% 79%
83%
2007 2008 2009 2010 2011 2012 2013
Market Combined Ratio Admiral UK Combined Ratio

UK Car Insurance: Ultimate Loss Ratio development by accident year
57
73%
72%
71%
73% 72%
70%
71%
76%
77%
74%
71%
77%
76%
69%
71% 71%
76%
73%
66%
71% 71%
70%
75%
70%
64%
66%
68%
AY 2008 AY 2009 AY 2010 AY 2011 AY 2012 AY 2013
FY 08 FY 09 FY 10 FY 11 FY 12 FY 13 FY 14

UK Car Insurance: Booked Loss Ratio development by underwriting year
Note: underwriting year basis, therefore direct comparison to ultimate loss ratios on accident year basis is inappropriate.
UK Car Insurance Booked Loss Ratio (%)
Development by Financial Year (colour-coded)
Split by Underwriting Year (x axis)
The impact of a 1% improvement can also increase as the combined ratio drops and Admiral receives a higher share of the available profit.
The impact includes the change in net insurance claims along with the associated profit commission movements that result from changes in loss ratios. The figures are stated net of tax at the current rate.
The impact is not linear due to the nature of the profit commission arrangements eg the impact of a 5% move cannot be calculated by multiplying the 1% impact by five.
Underwriting year 2011 2012 2013
Booked loss ratio 67% 73% 82%
PAT Impact of 1% improvement
£12m £12m £3m
Sensitivity of Booked Loss Ratio
58
78% 77%
82%
75% 76%
84%
70%
72%
78%
85%
67% 67%
73%
82%
2010 2011 2012 2013
2010 2011 2012 2013 2014

Consistent high Return on Equity
Note: ROE calculated as post-tax result divided by average equity.
Admiral Group Return on Equity
Admiral has consistently achieved a high ROE
Efficient use of capital
- extensive use of co- and reinsurance
- recent extensions to contracts
52% 52% 56% 57%
54% 59% 59% 60% 58%
52%
2005 2006 2007 2008 2009 2010 2011 2012 2013 2014
59

UK Car Insurance: underwriting arrangements
New Re, Swiss Re, Hannover Re and Mapfre Re agreements all extend to at least the end of 2016
Agreement with Munich Re runs to at least the end of 2018
Admiral typically commutes reinsurance deals after two to three years of an underwriting year’s development
Little or no impact on profit or timing of profit recognition from commutation
Minimal impact on solvency requirements
Post commutation – loss ratio movements result in claims cost movements, not profit commission
Reinsurance arrangements pre-commutations Post-commutations (at 31 Dec 2014)
25% 25% 25% 25% 25%
40% 40% 40% 40% 40%
13.25% 13.25% 13.25% 12.25% 12.25%
7.5% 7.5% 9.0% 9.0% 9.0%
8.75% 8.75% 8.75% 8.75% 8.75% 3.0% 3.0% 4.0% 5.0% 5.0% 2.5% 2.5%
2012 2013 2014 2015 2016
Admiral Munich Re New Re Swiss Re
Hannover Re Mapfre Re XL Re
60
55.0% 60.0% 60%
25% 25%
45% 40% 40%
40% 40%
13.25% 13.25%
7.5% 9%
8.75% 8.75% 3% 4% 2.5%
2010 2011 2012 2013 2014
Admiral Munich Re New Re Swiss Re
Hannover Re Mapfre Re XL Re

Admiral’s inaugural bond issue was a success
Coupon Rate
5.5%
Investment Return from investment of
bond proceeds
2.8%
• Opportune time to strengthen and diversify capital resources.
• Make a prudent transition into Solvency II in 2016, with the attendant capital requirements and buffers.
• Sets Admiral up well for the growth expected from all businesses in the coming years.
• Bond market conditions were favourable.
Bond: £200 million
Estimated post-tax annual cost: £4.3 million
✔
✔
✔
✔
61

Admiral’s investment strategy is low risk
Funds continue to be held in money market funds, short dated debt securities, term deposits or cash
Key focus is capital preservation, with additional priorities being low volatility of investment return and high levels of liquidity
Admiral’s Investment Approach
FY 13: £2,085m FY 14: £2,452m
Investments Breakdown Investment and Interest Income
AAA 20%
AA 25%
A 50%
BBB and below
4%
62
£9.5m
£13.7m
£15.9m
£14.3m £15.4m
2010 2011 2012 2013 2014
Money market funds 67% Short-
dated debt
securities 10%
Cash deposits
14%
Cash 9% Money
market funds 25%
Fixed income
and short-dated debt securities
34%
Cash deposits
11%
CASH+ 12%
Cash 11%
Gilts 8%
AAA 12%
AA 34%
A 50%
BBB and below
5%

The return of claim inflation: higher general damages
MOJ Portal cases proceeding to Stage 3 (litigation) have more than doubled since 2013 (Market Data)
Av. payout increase from Stage 1*2
15 working days
Stage 1 Stage 2 Stage 3
50 working days
15 days + court hearing
MOJ Portal Timeline:
+23% +36%
Source: MOJ Research.
63
98% 96% 96% 95% 96% 95% 94% 94%
1% 2% 2% 2% 1% 2% 2% 2%
1% 2% 2% 3% 3% 3% 4% 4%
Q1 Q2 Q3 Q4 Q1 Q2 Q3 Q4
2013 2014
Exit at Stage 1 Exit at Stage 2 Exit at Stage 3
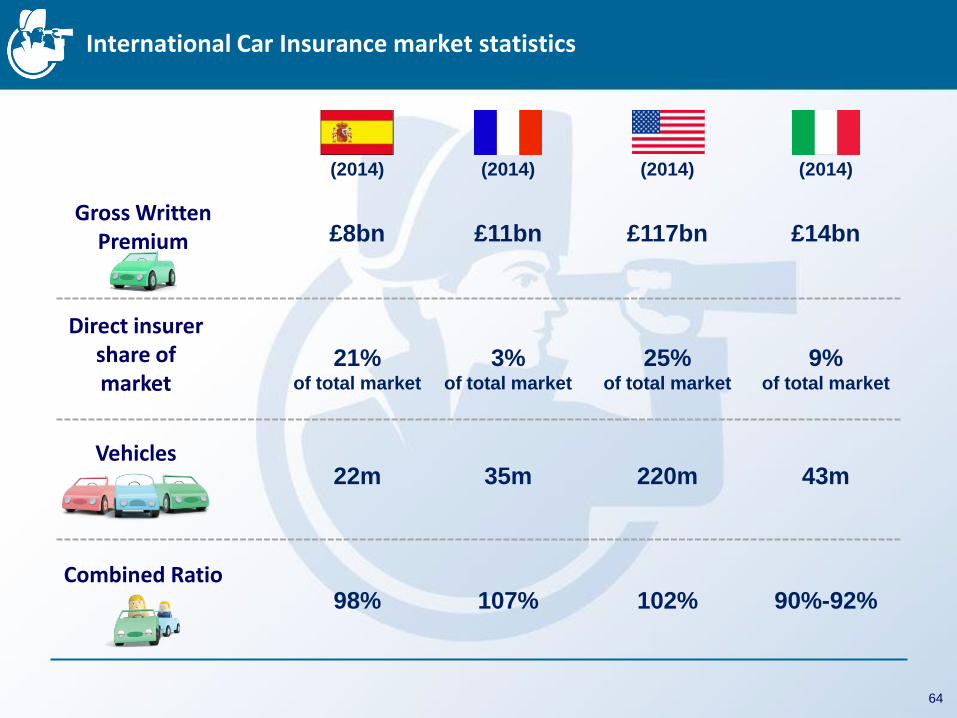
International Car Insurance market statistics
64
(2014)
£8bn
(2014)
£11bn
(2014)
£117bn
(2014)
£14bn
21% of total market
3% of total market
25% of total market
9% of total market
22m
35m
220m
43m
98%
107%
102%
90%-92%
Gross Written Premium
Direct insurer share of market
Vehicles
Combined Ratio

Key definitions
Term Definition
Accident Year The year in which an accident takes place. It is also referred to as the earned basis or the calendar year basis.
Claims incurred are allocated to the calendar year in which the accident took place.
Underwriting Year The year in which the policy was incepted. It is also referred to as the written basis. Claims incurred are allocated to the calendar year in which the policy was written.
Written / Earned Basis A policy can be written in one calendar year but earned over a subsequent calendar year.
Loss Ratio The ratio can be calculated on an accident year or underwriting year basis.
Expressed as a percentage, of (i) claims incurred divided by (ii) net premiums.
Ultimate Loss Ratio The ratio can be calculated on an accident year or underwriting year basis.
It is the projected ratio for a particular accident or underwriting year. It is an estimate (calculated using actuarial analysis) of where the loss ratio ends when all claims are settled.
Reported / Booked / First-Picked Loss Ratio
The ratio can be reported on an accident year or underwriting year basis. This is the ratio reported in the financial statements for a particular accident or underwriting year.
It is used to calculate underwriting profit and profit commissions.
Expense Ratio The ratio can be calculated on an earned or written basis.
Expressed as a percentage, of (i) net operating expenses, either divided by (ii) written or earned premiums, net of reinsurance.
Combined Ratio The sum of the loss ratio and expense ratio.
Co-insurance An arrangement in which two or more insurance companies agree to underwrite insurance business on a specified portfolio in specified proportions.
Each co-insurer is directly liable to the policyholder for their proportional share.
Reinsurance An arrangement in which a reinsurance company agrees to indemnify another insurance company, against all or a portion of the insurance risks
underwritten by the ceding company under one or more policies. Reinsurance does not legally discharge the primary insurer from its liability with respect to its obligations to the insured.
XOL Reinsurance An arrangement in which a reinsurance company agrees to indemnify another insurance company for claims above a certain level. For example if XOL
reinsurance level is in excess of £5m, for any individual claim that is in excess of £5m the reinsurance company covers all the costs above £5m.
Total / Gross / Net Premiums Written
Total = total premiums written including coinsurance Gross = total premiums written including reinsurance but excluding coinsurance
Net = total premiums written excluding reinsurance and coinsurance
65

Admiral’s Brands
66
Disclaimer Notice
The information contained in this document has not been independently verified and no representation or warranty, express or implied, is made as to, and no reliance should be placed on, the fairness, accuracy, completeness or correctness of the information or opinions contained herein. None of the company, advisers or representatives shall have any liability whatsoever (in negligence or otherwise) for any loss howsoever arising from any use of this document or its contents or otherwise arising in connection with this document. Unless otherwise stated, all financial information contained herein is stated in accordance with generally accepted accounting principles in the UK at the date hereof.
The forward-looking information contained herein has been prepared on the basis of a number of assumptions which may prove to be incorrect, and accordingly, actual results may vary.
This document is being distributed only to, and is directed at (a) persons who have professional experience in matters relating to investments, being investment professionals as defined in article 19(5) of the Financial Services And Markets Act 2000 (Financial Promotion) Order 2005, as amended (the "Order") or (b) high net worth entities falling within article 49(2)(a) to (d) of the Order, and other persons to whom it may be lawfully be communicated under the Order (all such persons together being referred to as "Relevant Persons"). Any person who is not a Relevant Person should not act or rely on this document or any of its contents. Any investment or investment activity to which this document relates is available only to Relevant Persons and will be engaged in only with Relevant Persons.
The financial information set out in the presentation does not constitute the Company's statutory accounts in accordance with section 423 Companies Act 2006 for the year ended 31 December 2014. The statutory accounts for the year ended 31 December 2014 will be finalised on the basis of the financial information presented by the directors in this preliminary announcement and will be delivered to the Registrar of Companies following the Company’s Annual General Meeting.
67